DEVELOPMENT AND VALIDATION OF HPLC METHOD FOR SIMULTANEOUS DETERMINATION OF HALOPERIDOL AND REDUCED HALOPERIDOL IN PLASMA: APPLICATION IN PHARMACOKINETIC STUDY by THEEPA ASUALINGAM Thesis submitted in fulfillment of the requirement for the Degree of Master of Science April 2007

Welcome message from author
This document is posted to help you gain knowledge. Please leave a comment to let me know what you think about it! Share it to your friends and learn new things together.
Transcript
DEVELOPMENT AND VALIDATION OF HPLC METHOD FOR SIMULTANEOUS
DETERMINATION OF HALOPERIDOL AND REDUCED HALOPERIDOL
IN PLASMA: APPLICATION IN PHARMACOKINETIC STUDY
by
THEEPA ASUALINGAM
Thesis submitted in fulfillment of the requirement for the Degree of
Master of Science
April 2007

ii
To my beloved Sidha Yogi Siva Sangkara baba, parents, husband, son,
parents-in-law and sisters.

iii
ACKNOWLEDGEMENTS
First and foremost, I wish to express my utmost gratitude and heartfelt
appreciation to my dedicated principal supervisor, Professor Sharif Mahsufi Mansor for
his guidance, invaluable advice and encouragement throughout my graduate program. I
am most grateful for all the scientific knowledge I have gained from him and all the
fruitful discussions we have had. I would like to thank my co-supervisor, Dr. Surash
Ramanathan for always being so enthusiastic about the projects I have been involved
in and for his endless support throughout my studies.
I am also taking this opportunity in thanking Professor Yuen Kah Hay for
providing his support and lab facility and Dr. Ng Bee Hong for her expert technical
assistance during animal study. Thanks also to the Janssen foundation for providing
reduced haloperidol. I am grateful to the Institute of Graduate Studies, USM for
providing the financial assistance through the Graduate Assistance Scheme during my
candidature.
I would specially like to thank Mr. A.K.M. Mahbubuzzaman for being
with me throughout and sharing my joys and disappointments. Not forgetting also my
dear friends Kanabathy, Shubatra Pillay, Lai Choon Shen, G. Venkatesh, Chitra and
Venessa Daniel. I would also like to acknowledge my gratitude to all the staff and lab
assistants of CDR, especially to Mr R. Arunachalam and Mr. M.Asokan.
My deepest gratitude goes to my parents for their continuous
encouragement, support and interest throughout my studies. Very special thanks to my
husband, Mr. N. Ragu for his patience, constant encouragement, unconditional love as
well as financial and moral support during my research.
iv
TABLE OF CONTENTS
Page
TITLE i
DEDICATION ii
ACKNOWLEDGEMENTS iii
TABLE OF CONTENTS iv
LIST OF TABLES x
LIST OF FIGURES xii
LIST OF SYMBOLS AND ABBREVIATIONS xiv
ABSTRAK xvii
ABSTRACT xix
CHAPTER 1- INTRODUCTION
1.1 Psychosis 1
1.1.1 Anxiety 1
1.1.2 Mania or bipolar disorder 1
1.1.3 Depression 2
1.1.4 Schizophrenia 2
1.2 Antipsychotic drug 3
1.2.1 Typical antipsychotic drug 3
1.2.2 Atypical antipsychotic drug 3
1.3 Haloperidol 4
1.3.1 Assay of HP and RH in biological fluids 7
1.3.2 Pharmacology of HP 9
1.3.3 Pharmacokinetic of HP and RH 16 1.3.4 Drug interactions 23
1.4 Bioanalytical method development 27
v
1.4.1 Introduction to HPLC 27
1.4.2 Column 27
1.4.3 Mobile phase 28
1.4.4 Sample preparation 30
1.5 Bioanalytical method validation 31
1.5.1 System suitability test 31
1.5.1.1 Capacity factor 32
1.5.1.2 Resolution 32
1.5.1.3 Tailing factor 32
1.5.2 Selectivity 32
1.5.3 Recovery 33
1.5.4 Linearity 33
1.5.5 Quality control 34
1.5.6 Precision 35
1.5.7 Accuracy 35
1.5.8 Limit of detection 35
1.5.9 Lower limit of quantitation 36
1.5.10 Stability 36
1.5.10.1 General acceptable criteria for Stability studies 37
1.5.10.2 Stock solution stability study 37
1.5.10.2 On bench stability study 37
1.5.10.3 Freeze thaw stability study 37
1.5.10.4 Processed samples stability study 38
1.5.10.5 Long-term stability study 38
1.6 General principle of pharmacokinetics 39
1.6.1 Drug absorption 39
1.6.2 Drug distribution 41
vi
1.6.3 Drug elimination 43
1.6.4 Drug metabolism 43
1.6.5 Drug excretion 45
1.7 Pharmacokinetic parameters 47
1.7.1 Elimination half-life 48
1.7.2 Clearance 48
1.7.3 Area under the curve 50
1.7.4 Apparent volume of distribution 50
1.7.5 Mean residence time 51
1.7.6 Peak plasma concentration 52
1.7.7 Time to peak concentration 52
1.8 The aim of the thesis 52
CHAPTER 2 - CHEMICALS, INSTRUMENTS AND STANDARDS
2.1 Chemicals 54 2.2 Instruments 54 2.3 Standard solutions 55
2.4 Preparation of extraction solvents and buffer 56
2.5 Standards and purity 57
2.4 Silanisation of glassware 57
CHAPTER 3 - METHODOLOGY
3.1 Analytical method development 61
3.1.1 UV spectrum 61
3.1.2 Column selection 61
3.1.3 Development of mobile phase 61
3.1.4 Detector linearity 62
3.1.5 Internal standard 62
vii
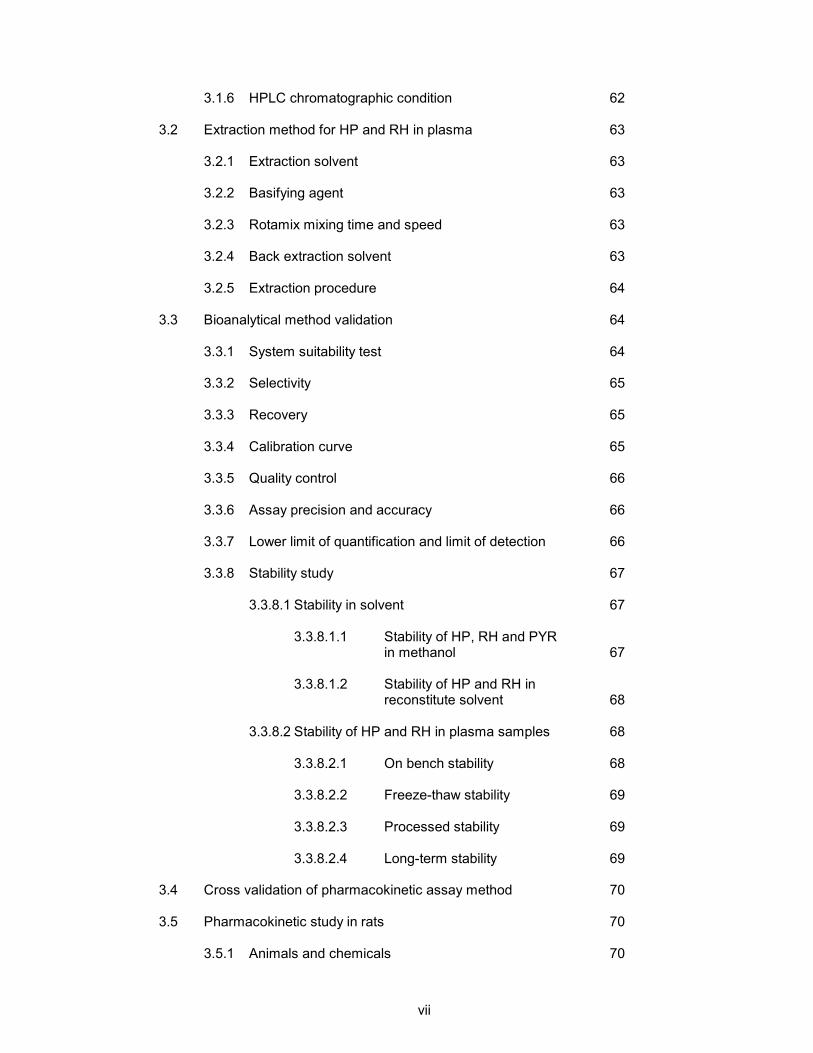
3.1.6 HPLC chromatographic condition 62
3.2 Extraction method for HP and RH in plasma 63
3.2.1 Extraction solvent 63
3.2.2 Basifying agent 63
3.2.3 Rotamix mixing time and speed 63
3.2.4 Back extraction solvent 63
3.2.5 Extraction procedure 64
3.3 Bioanalytical method validation 64
3.3.1 System suitability test 64
3.3.2 Selectivity 65
3.3.3 Recovery 65
3.3.4 Calibration curve 65
3.3.5 Quality control 66
3.3.6 Assay precision and accuracy 66
3.3.7 Lower limit of quantification and limit of detection 66
3.3.8 Stability study 67
3.3.8.1 Stability in solvent 67
3.3.8.1.1 Stability of HP, RH and PYR in methanol 67
3.3.8.1.2 Stability of HP and RH in
reconstitute solvent 68
3.3.8.2 Stability of HP and RH in plasma samples 68
3.3.8.2.1 On bench stability 68
3.3.8.2.2 Freeze-thaw stability 69
3.3.8.2.3 Processed stability 69
3.3.8.2.4 Long-term stability 69
3.4 Cross validation of pharmacokinetic assay method 70
3.5 Pharmacokinetic study in rats 70
3.5.1 Animals and chemicals 70
viii
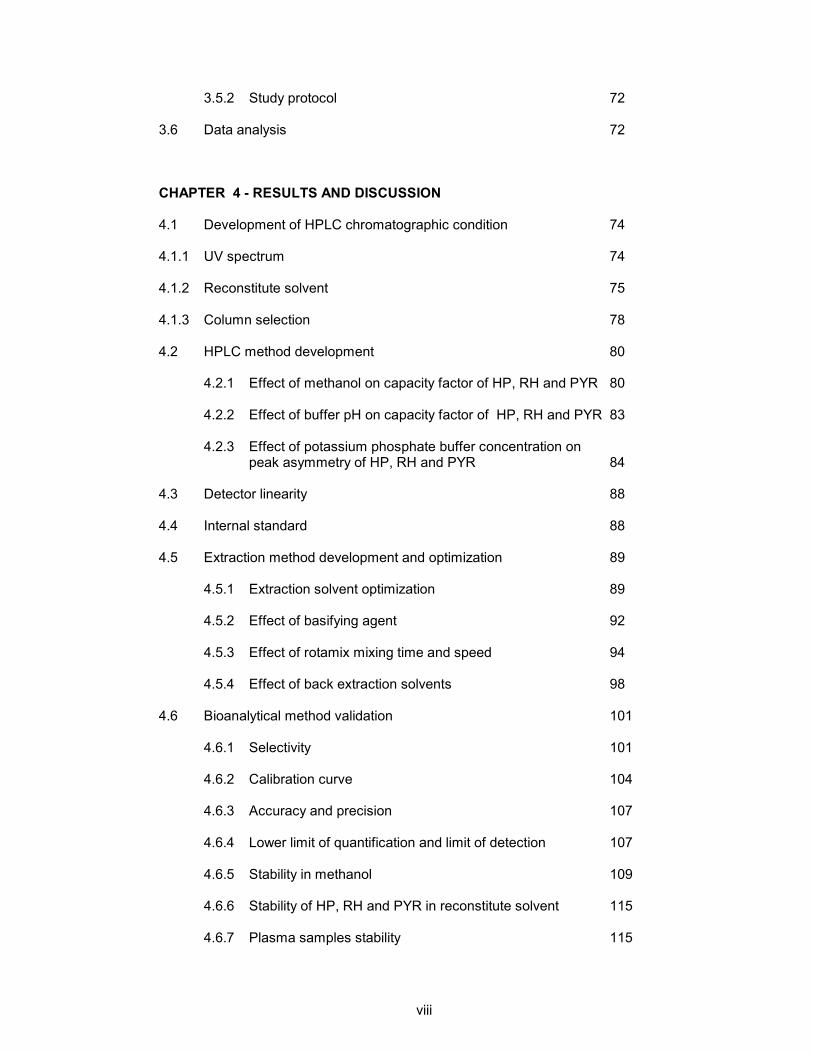
3.5.2 Study protocol 72
3.6 Data analysis 72
CHAPTER 4 - RESULTS AND DISCUSSION
4.1 Development of HPLC chromatographic condition 74
4.1.1 UV spectrum 74
4.1.2 Reconstitute solvent 75
4.1.3 Column selection 78
4.2 HPLC method development 80
4.2.1 Effect of methanol on capacity factor of HP, RH and PYR 80
4.2.2 Effect of buffer pH on capacity factor of HP, RH and PYR 83
4.2.3 Effect of potassium phosphate buffer concentration on peak asymmetry of HP, RH and PYR 84
4.3 Detector linearity 88 4.4 Internal standard 88
4.5 Extraction method development and optimization 89
4.5.1 Extraction solvent optimization 89
4.5.2 Effect of basifying agent 92
4.5.3 Effect of rotamix mixing time and speed 94
4.5.4 Effect of back extraction solvents 98
4.6 Bioanalytical method validation 101
4.6.1 Selectivity 101
4.6.2 Calibration curve 104
4.6.3 Accuracy and precision 107
4.6.4 Lower limit of quantification and limit of detection 107
4.6.5 Stability in methanol 109
4.6.6 Stability of HP, RH and PYR in reconstitute solvent 115
4.6.7 Plasma samples stability 115
ix
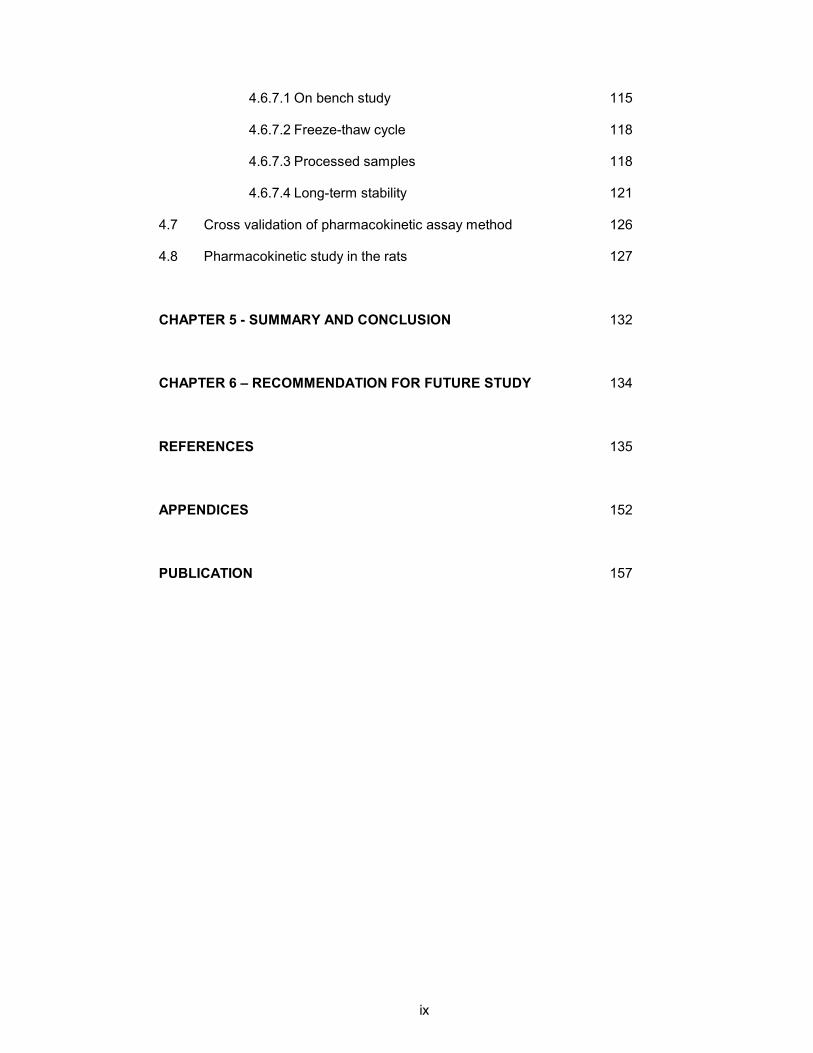
4.6.7.1 On bench study 115
4.6.7.2 Freeze-thaw cycle 118
4.6.7.3 Processed samples 118
4.6.7.4 Long-term stability 121
4.7 Cross validation of pharmacokinetic assay method 126
4.8 Pharmacokinetic study in the rats 127
CHAPTER 5 - SUMMARY AND CONCLUSION 132
CHAPTER 6 – RECOMMENDATION FOR FUTURE STUDY 134
REFERENCES 135
APPENDICES 152
PUBLICATION 157
x
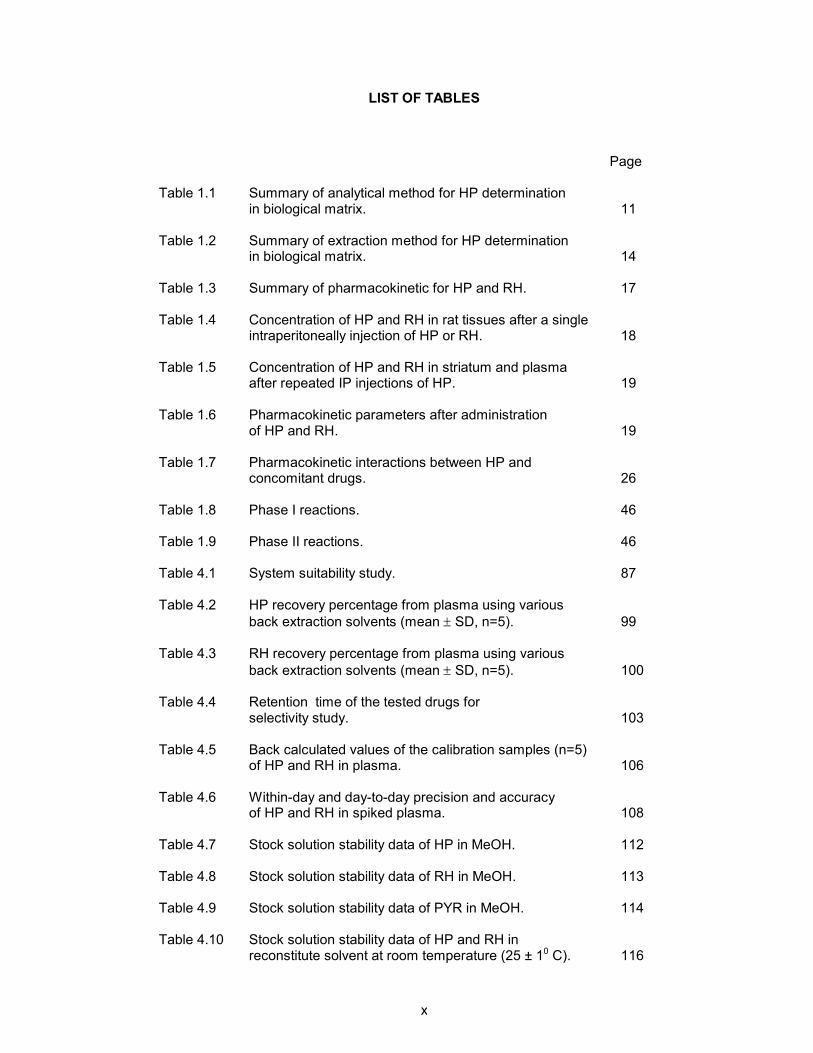
LIST OF TABLES
Page
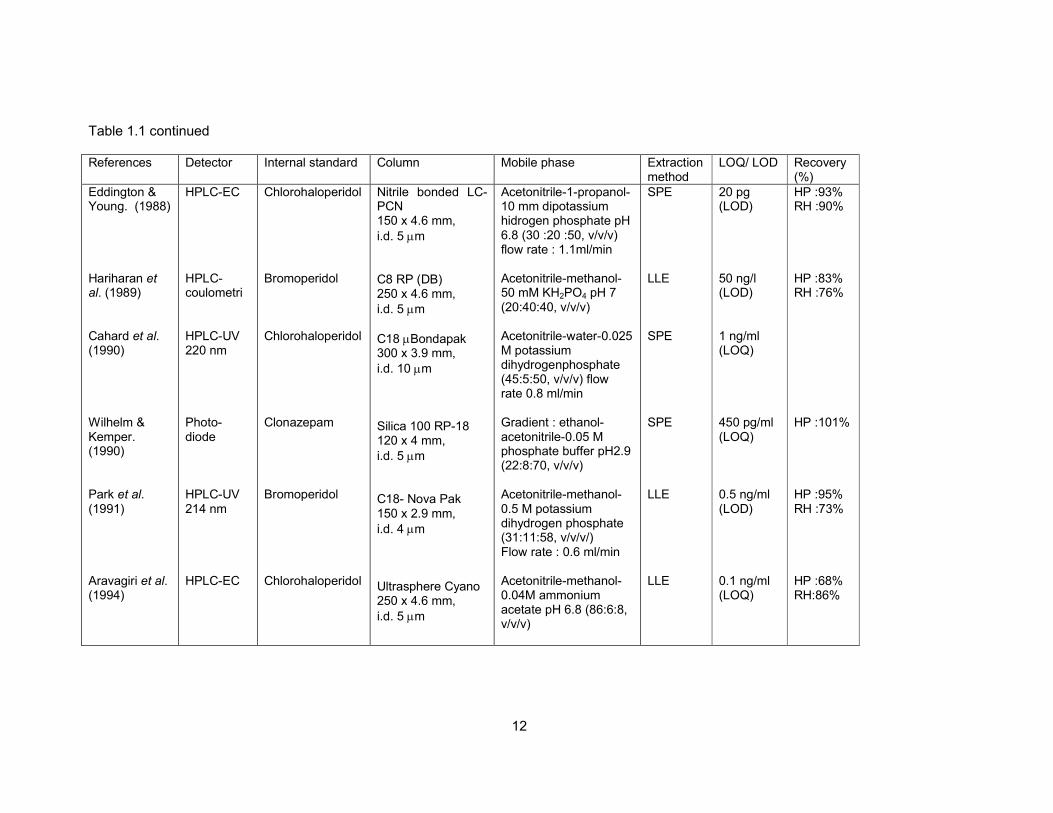
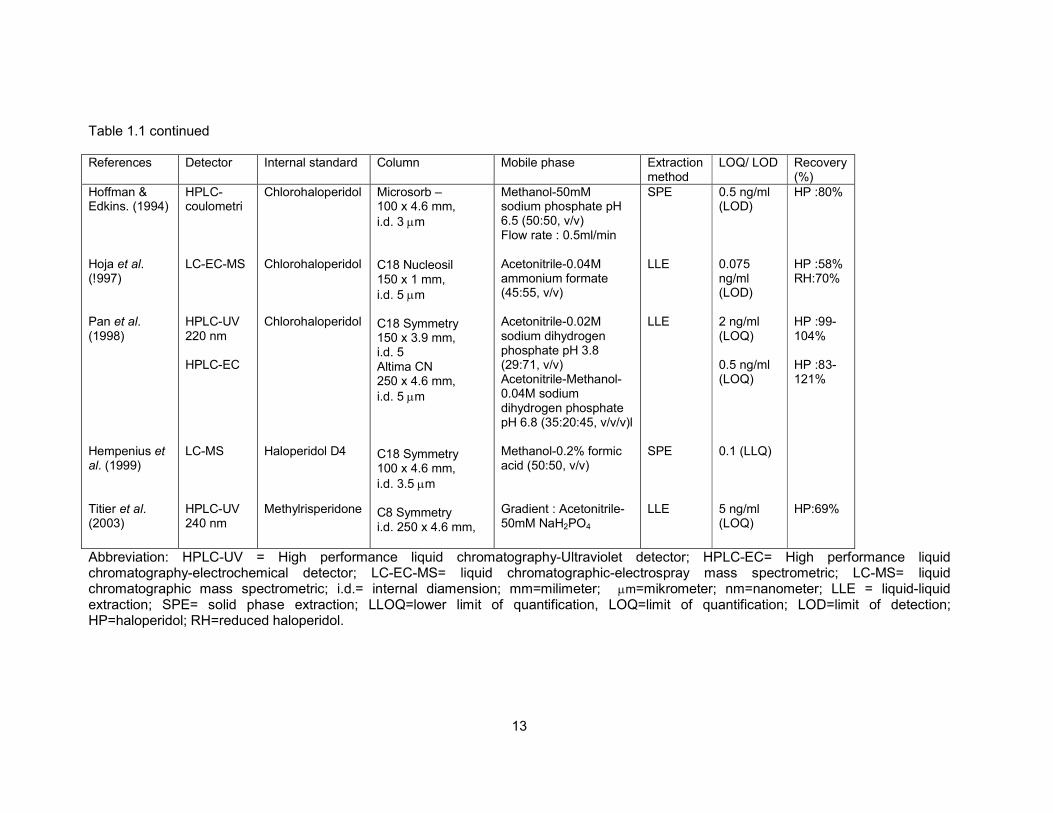
Table 1.1 Summary of analytical method for HP determination in biological matrix. 11
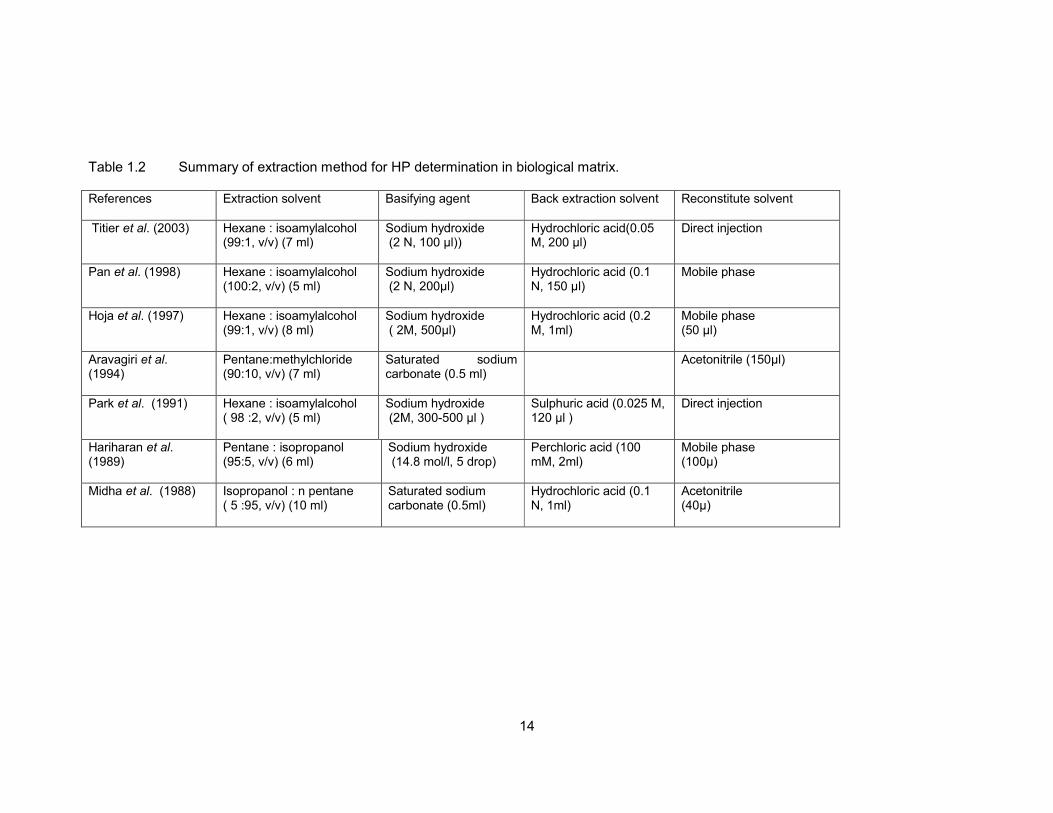
Table 1.2 Summary of extraction method for HP determination in biological matrix. 14
Table 1.3 Summary of pharmacokinetic for HP and RH. 17
Table 1.4 Concentration of HP and RH in rat tissues after a single intraperitoneally injection of HP or RH. 18
Table 1.5 Concentration of HP and RH in striatum and plasma
after repeated IP injections of HP. 19 Table 1.6 Pharmacokinetic parameters after administration
of HP and RH. 19 Table 1.7 Pharmacokinetic interactions between HP and
concomitant drugs. 26
Table 1.8 Phase I reactions. 46
Table 1.9 Phase II reactions. 46
Table 4.1 System suitability study. 87 Table 4.2 HP recovery percentage from plasma using various
back extraction solvents (mean ± SD, n=5). 99 Table 4.3 RH recovery percentage from plasma using various
back extraction solvents (mean ± SD, n=5). 100 Table 4.4 Retention time of the tested drugs for
selectivity study. 103
Table 4.5 Back calculated values of the calibration samples (n=5) of HP and RH in plasma. 106
Table 4.6 Within-day and day-to-day precision and accuracy
of HP and RH in spiked plasma. 108 Table 4.7 Stock solution stability data of HP in MeOH. 112 Table 4.8 Stock solution stability data of RH in MeOH. 113 Table 4.9 Stock solution stability data of PYR in MeOH. 114 Table 4.10 Stock solution stability data of HP and RH in
reconstitute solvent at room temperature (25 ± 10 C). 116
xi
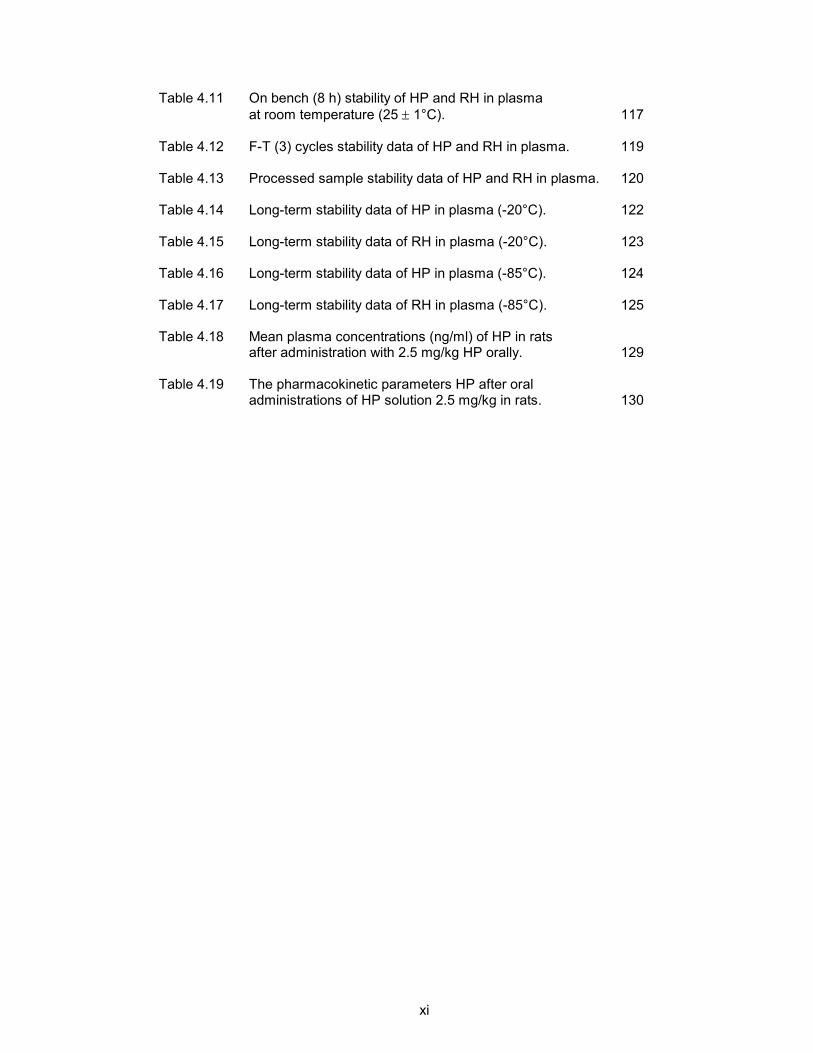
Table 4.11 On bench (8 h) stability of HP and RH in plasma
at room temperature (25 ± 1°C). 117 Table 4.12 F-T (3) cycles stability data of HP and RH in plasma. 119
Table 4.13 Processed sample stability data of HP and RH in plasma. 120
Table 4.14 Long-term stability data of HP in plasma (-20°C). 122
Table 4.15 Long-term stability data of RH in plasma (-20°C). 123
Table 4.16 Long-term stability data of HP in plasma (-85°C). 124
Table 4.17 Long-term stability data of RH in plasma (-85°C). 125
Table 4.18 Mean plasma concentrations (ng/ml) of HP in rats after administration with 2.5 mg/kg HP orally. 129
Table 4.19 The pharmacokinetic parameters HP after oral
administrations of HP solution 2.5 mg/kg in rats. 130
xii
LIST OF FIGURES
Page
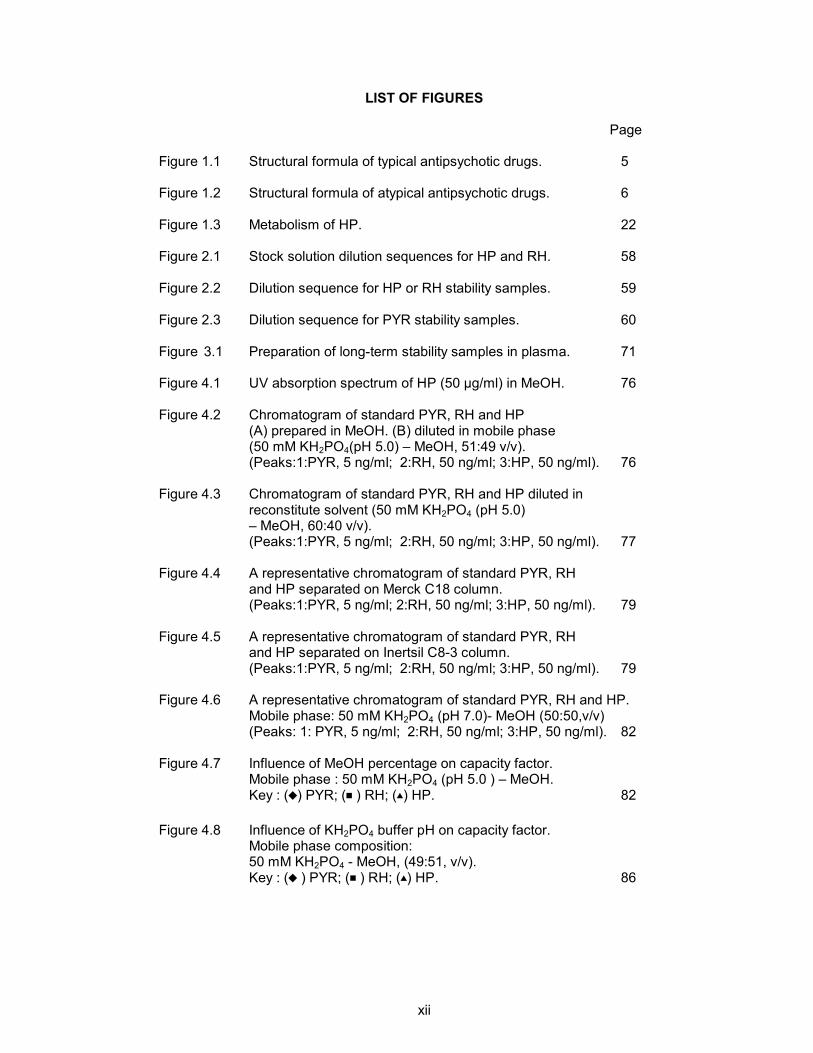
Figure 1.1 Structural formula of typical antipsychotic drugs. 5
Figure 1.2 Structural formula of atypical antipsychotic drugs. 6
Figure 1.3 Metabolism of HP. 22
Figure 2.1 Stock solution dilution sequences for HP and RH. 58
Figure 2.2 Dilution sequence for HP or RH stability samples. 59
Figure 2.3 Dilution sequence for PYR stability samples. 60
Figure 3.1 Preparation of long-term stability samples in plasma. 71
Figure 4.1 UV absorption spectrum of HP (50 µg/ml) in MeOH. 76
Figure 4.2 Chromatogram of standard PYR, RH and HP (A) prepared in MeOH. (B) diluted in mobile phase (50 mM KH2PO4(pH 5.0) – MeOH, 51:49 v/v). (Peaks:1:PYR, 5 ng/ml; 2:RH, 50 ng/ml; 3:HP, 50 ng/ml). 76
Figure 4.3 Chromatogram of standard PYR, RH and HP diluted in reconstitute solvent (50 mM KH2PO4 (pH 5.0) – MeOH, 60:40 v/v). (Peaks:1:PYR, 5 ng/ml; 2:RH, 50 ng/ml; 3:HP, 50 ng/ml). 77
Figure 4.4 A representative chromatogram of standard PYR, RH and HP separated on Merck C18 column. (Peaks:1:PYR, 5 ng/ml; 2:RH, 50 ng/ml; 3:HP, 50 ng/ml). 79
Figure 4.5 A representative chromatogram of standard PYR, RH
and HP separated on Inertsil C8-3 column. (Peaks:1:PYR, 5 ng/ml; 2:RH, 50 ng/ml; 3:HP, 50 ng/ml). 79
Figure 4.6 A representative chromatogram of standard PYR, RH and HP.
Mobile phase: 50 mM KH2PO4 (pH 7.0)- MeOH (50:50,v/v) (Peaks: 1: PYR, 5 ng/ml; 2:RH, 50 ng/ml; 3:HP, 50 ng/ml). 82
Figure 4.7 Influence of MeOH percentage on capacity factor. Mobile phase : 50 mM KH2PO4 (pH 5.0 ) – MeOH.
Key : (ï) PYR; (] ) RH; (X) HP. 82
Figure 4.8 Influence of KH2PO4 buffer pH on capacity factor. Mobile phase composition:
50 mM KH2PO4 - MeOH, (49:51, v/v). Key : (ï ) PYR; (] ) RH; (X) HP. 86
xiii
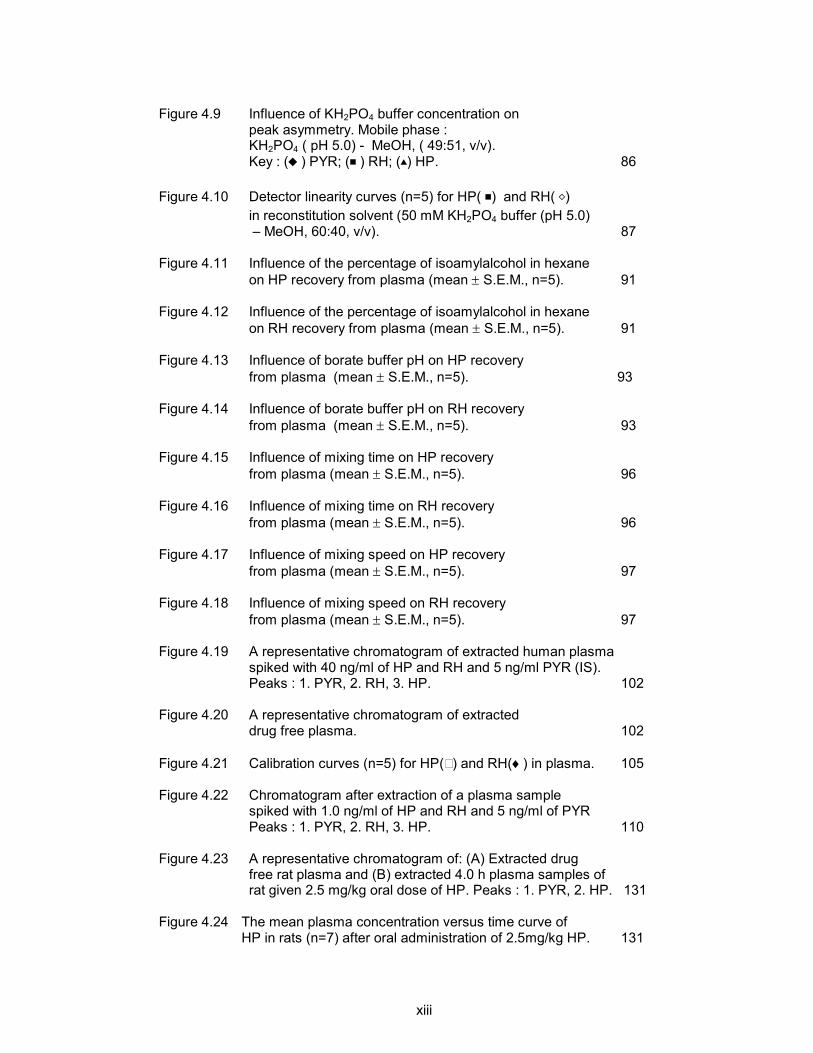
Figure 4.9 Influence of KH2PO4 buffer concentration on
peak asymmetry. Mobile phase : KH2PO4 ( pH 5.0) - MeOH, ( 49:51, v/v). Key : (ï ) PYR; (] ) RH; (X) HP. 86
Figure 4.10 Detector linearity curves (n=5) for HP( ]) and RH( H)
in reconstitution solvent (50 mM KH2PO4 buffer (pH 5.0) – MeOH, 60:40, v/v). 87
Figure 4.11 Influence of the percentage of isoamylalcohol in hexane
on HP recovery from plasma (mean ± S.E.M., n=5). 91
Figure 4.12 Influence of the percentage of isoamylalcohol in hexane
on RH recovery from plasma (mean ± S.E.M., n=5). 91 Figure 4.13 Influence of borate buffer pH on HP recovery
from plasma (mean ± S.E.M., n=5). 93
Figure 4.14 Influence of borate buffer pH on RH recovery
from plasma (mean ± S.E.M., n=5). 93 Figure 4.15 Influence of mixing time on HP recovery
from plasma (mean ± S.E.M., n=5). 96
Figure 4.16 Influence of mixing time on RH recovery
from plasma (mean ± S.E.M., n=5). 96
Figure 4.17 Influence of mixing speed on HP recovery
from plasma (mean ± S.E.M., n=5). 97 Figure 4.18 Influence of mixing speed on RH recovery
from plasma (mean ± S.E.M., n=5). 97 Figure 4.19 A representative chromatogram of extracted human plasma
spiked with 40 ng/ml of HP and RH and 5 ng/ml PYR (IS). Peaks : 1. PYR, 2. RH, 3. HP. 102
Figure 4.20 A representative chromatogram of extracted drug free plasma. 102
Figure 4.21 Calibration curves (n=5) for HP() and RH(♦) in plasma. 105 Figure 4.22 Chromatogram after extraction of a plasma sample
spiked with 1.0 ng/ml of HP and RH and 5 ng/ml of PYR Peaks : 1. PYR, 2. RH, 3. HP. 110
Figure 4.23 A representative chromatogram of: (A) Extracted drug free rat plasma and (B) extracted 4.0 h plasma samples of rat given 2.5 mg/kg oral dose of HP. Peaks : 1. PYR, 2. HP. 131
Figure 4.24 The mean plasma concentration versus time curve of
HP in rats (n=7) after oral administration of 2.5mg/kg HP. 131
xiv
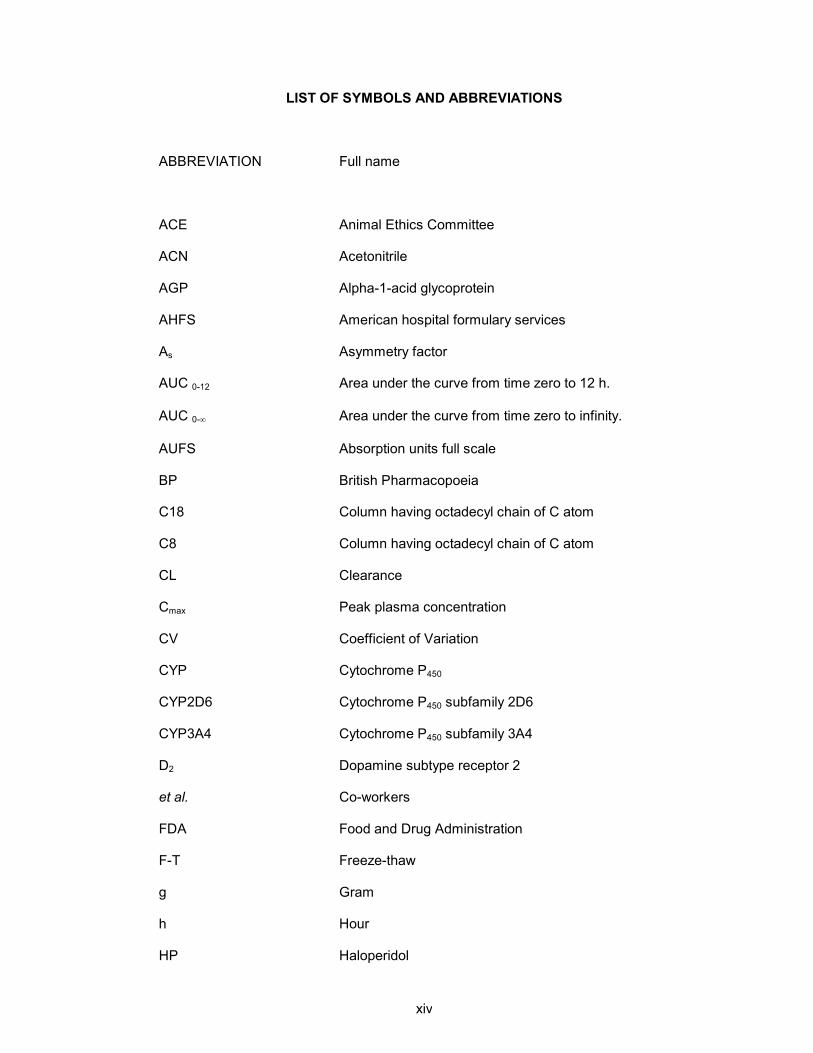
LIST OF SYMBOLS AND ABBREVIATIONS
ABBREVIATION Full name
ACE Animal Ethics Committee
ACN Acetonitrile
AGP Alpha-1-acid glycoprotein
AHFS American hospital formulary services
As Asymmetry factor
AUC 0-12 Area under the curve from time zero to 12 h.
AUC 0-∞ Area under the curve from time zero to infinity.
AUFS Absorption units full scale
BP British Pharmacopoeia
C18 Column having octadecyl chain of C atom
C8 Column having octadecyl chain of C atom
CL Clearance
Cmax Peak plasma concentration
CV Coefficient of Variation
CYP Cytochrome P450
CYP2D6 Cytochrome P450 subfamily 2D6
CYP3A4 Cytochrome P450 subfamily 3A4
D2 Dopamine subtype receptor 2
et al. Co-workers
FDA Food and Drug Administration
F-T Freeze-thaw
g Gram
h Hour
HP Haloperidol

xv
HPLC High Performance Liquid Chromatography
HPLC-EC High Performance Liquid Chromatography coupled with electrochemical detector
HPLC-UV High Performance Liquid Chromatography coupled with
ultraviolet detector ICH International Conference on Harmonization IS Internal standard
k’ Capacity factor
K+ Potassium ion
KH2PO4 Potassium dihydrogen phosphate
l Liter
LLOQ Lower limit of quantification
LLE Liquid-liquid extraction
LOD Limit of detection
M Molar
MeOH Methanol
ml Milliliter
mm millimeter
mM millimolar
MRT Mean residence time
N Normality
n Number of replicate
Na+ Natrium ion
NaOH Sodium hydroxide
ng Nanogram
nm nanometer
ODS Octadecylsilane
pH negative logarithm of H+ concentration
pKa Ionisation constant
xvi
PYR Pyrimethamine
r Correlation coefficient
RH Reduced haloperidol
RP Reverse phase
RP-HPLC Reversed-phase high performance liquid
chromatography
rpm revolution per minute
Rs Resolution
SD Standard deviation
Sec Second
S.E.M. Standard error of the mean
SPE Solid phase extraction
t1/2 Elimination half-life
Tmax Time to reach peak plasma conentration
USP United State Pharmacopoeia
UV Ultraviolet
v/v Volume by volume
v/w Weight by volume
Vd Volume of distribution
% Percent
± Plus/minus
α1 Adenergic receptor subtype 1
µl Microliter
µm Micrometer
< Less than
> Greater than
xvii
PERKEMBANGAN DAN PENGESAHAN KAEDAH KCPT BAGI PENENTUAN
HALOPERIDOL DAN HALOPERIDOL TERTURUN SECARA SERENTAK DI DALAM
PLASMA : APLIKASI DALAM KAJIAN FARMAKOKINETIK
Abstrak
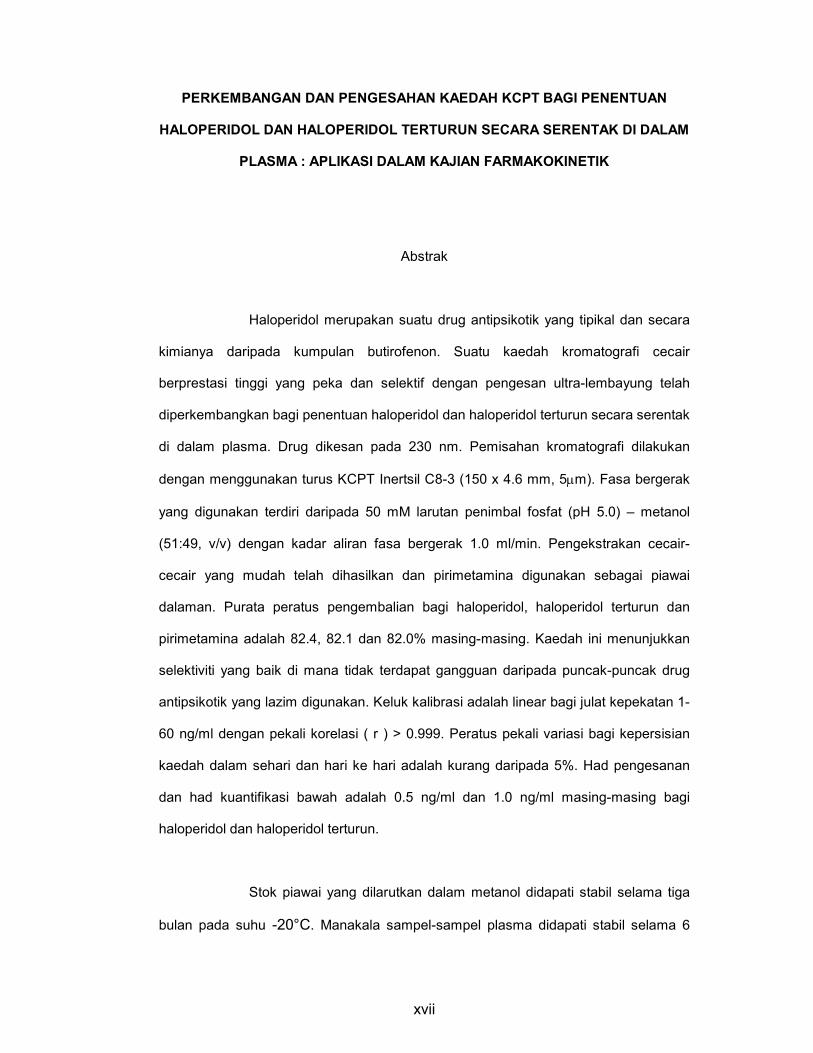
Haloperidol merupakan suatu drug antipsikotik yang tipikal dan secara
kimianya daripada kumpulan butirofenon. Suatu kaedah kromatografi cecair
berprestasi tinggi yang peka dan selektif dengan pengesan ultra-lembayung telah
diperkembangkan bagi penentuan haloperidol dan haloperidol terturun secara serentak
di dalam plasma. Drug dikesan pada 230 nm. Pemisahan kromatografi dilakukan
dengan menggunakan turus KCPT Inertsil C8-3 (150 x 4.6 mm, 5µm). Fasa bergerak
yang digunakan terdiri daripada 50 mM larutan penimbal fosfat (pH 5.0) – metanol
(51:49, v/v) dengan kadar aliran fasa bergerak 1.0 ml/min. Pengekstrakan cecair-
cecair yang mudah telah dihasilkan dan pirimetamina digunakan sebagai piawai
dalaman. Purata peratus pengembalian bagi haloperidol, haloperidol terturun dan
pirimetamina adalah 82.4, 82.1 dan 82.0% masing-masing. Kaedah ini menunjukkan
selektiviti yang baik di mana tidak terdapat gangguan daripada puncak-puncak drug
antipsikotik yang lazim digunakan. Keluk kalibrasi adalah linear bagi julat kepekatan 1-
60 ng/ml dengan pekali korelasi ( r ) > 0.999. Peratus pekali variasi bagi kepersisian
kaedah dalam sehari dan hari ke hari adalah kurang daripada 5%. Had pengesanan
dan had kuantifikasi bawah adalah 0.5 ng/ml dan 1.0 ng/ml masing-masing bagi
haloperidol dan haloperidol terturun.
Stok piawai yang dilarutkan dalam metanol didapati stabil selama tiga
bulan pada suhu -20°C. Manakala sampel-sampel plasma didapati stabil selama 6
xviii
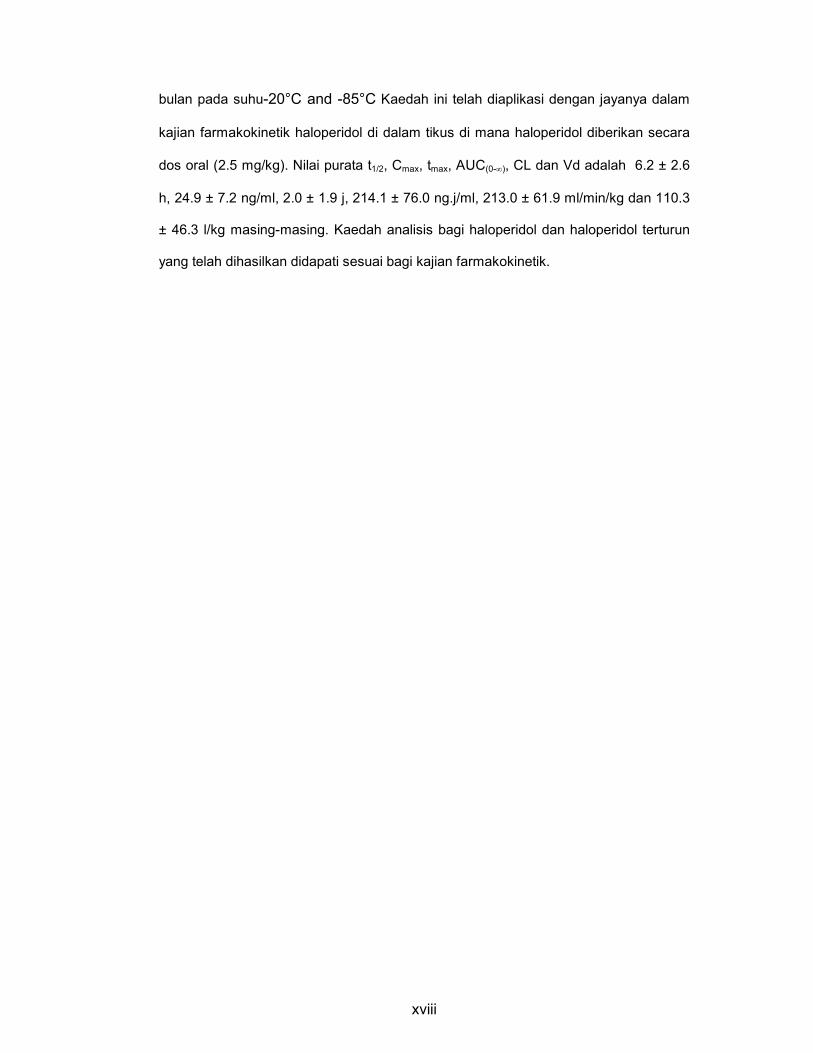
bulan pada suhu-20°C and -85°C Kaedah ini telah diaplikasi dengan jayanya dalam
kajian farmakokinetik haloperidol di dalam tikus di mana haloperidol diberikan secara
dos oral (2.5 mg/kg). Nilai purata t1/2, Cmax, tmax, AUC(0-∞), CL dan Vd adalah 6.2 ± 2.6
h, 24.9 ± 7.2 ng/ml, 2.0 ± 1.9 j, 214.1 ± 76.0 ng.j/ml, 213.0 ± 61.9 ml/min/kg dan 110.3
± 46.3 l/kg masing-masing. Kaedah analisis bagi haloperidol dan haloperidol terturun
yang telah dihasilkan didapati sesuai bagi kajian farmakokinetik.

xix
DEVELOPMENT AND VALIDATION OF HPLC METHOD FOR SIMULTANEOUS
DETERMINATION OF HALOPERIDOL AND REDUCED HALOPERIDOL IN
PLASMA: APPLICATION IN PHARMACOKINETIC STUDY
Abstract
Haloperidol is a typical antipsychotic drug that chemically belongs to
butyrophenone group. A sensitive and selective reversed-phase HPLC method with
ultraviolet detection was developed for the simultaneous determination of haloperidol
and reduced haloperidol in plasma. Drugs were detected at 230 nm. The
chromatographic separation was performed on an Inertsil C8-3 (150 x 4.6mm, 5 µm)
HPLC column. Mobile phase composed of 50 mM phosphate buffer pH 5.0 and
methanol (51:49, v/v) and eluted at 1.0 ml/min. A simple liquid-liquid extraction was
carried-out using pyrimethamine as an internal standard. The mean extraction recovery
for haloperidol, reduced haloperidol and pyrimethamine were 82.4, 82.1 and 82.0%
respectively. The method showed good selectivity with respect to commonly
administered psychotropic drugs. Calibration curve was linear over the concentration
range 1 - 60 ng/ml with the correlation coefficient (r) > 0.999. The within-day and day-to
-day assay precision was less than 5%. Limit of detection and lower limit of
quantification were 0.5 ng/ml and 1 ng/ml respectively for haloperidol and reduced
haloperidol.
Stock standard of haloperidol and reduced haloperidol in methanol were
stable up to three months at -20°C. Plasma samples spiked with haloperidol and
reduced haloperidol was stable up to 6 months at -20°C and -85°C. The method was
successfully applied to pharmacokinetic study of haloperidol in rats following oral dose
of haloperidol (2.5 mg/kg). The mean t1/2, Cmax, tmax, AUC (0-∞), CL and Vd were 6.2 ± 2.6
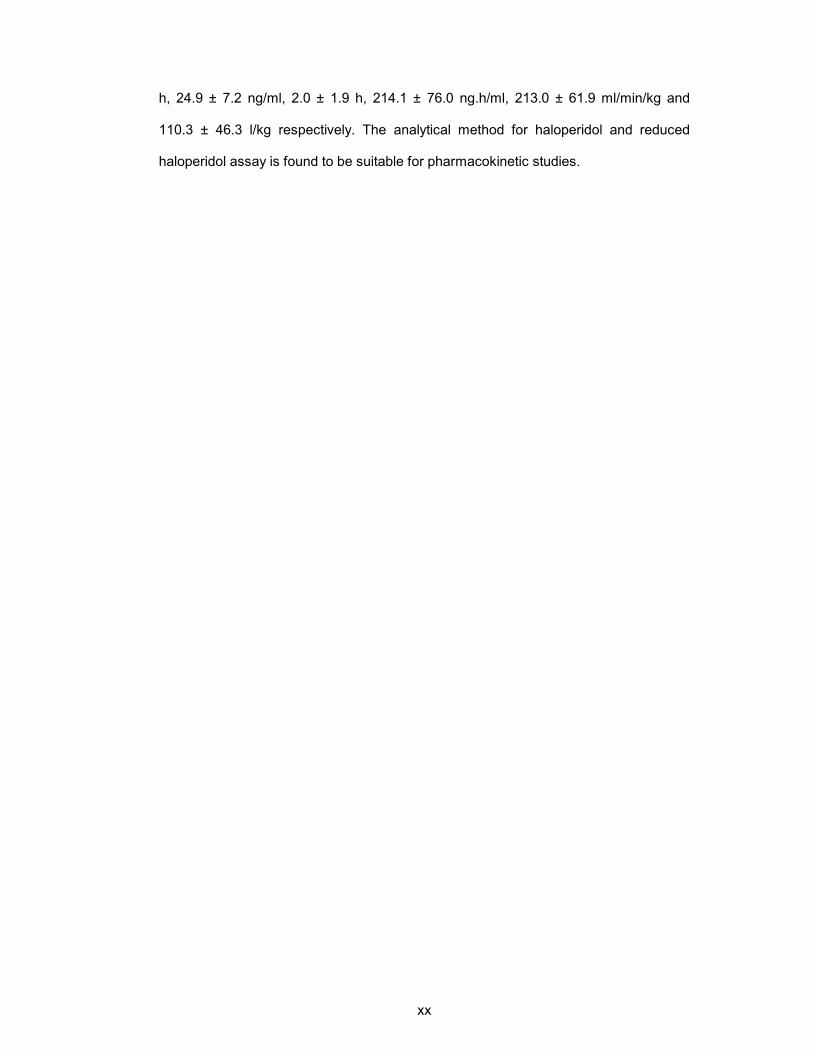
xx
h, 24.9 ± 7.2 ng/ml, 2.0 ± 1.9 h, 214.1 ± 76.0 ng.h/ml, 213.0 ± 61.9 ml/min/kg and
110.3 ± 46.3 l/kg respectively. The analytical method for haloperidol and reduced
haloperidol assay is found to be suitable for pharmacokinetic studies.
1
CHAPTER 1 INTRODUCTION
1.1 PSYCHOSIS
Psychosis is a mental disorder which involves striking disturbances of
thought, perception, affect, and behaviour (Pantelis et al., 2003). The expression of
psychotic symptoms varies over time and across patients, however the cumulative
effects of the illness are always severe and usually long lasting (Sadock & Sadock,
2000). There are various types of psychotic disorders such as anxiety, bipolar disorder
(manic disorder), depression and schizophrenia (Grilly, 1994). These disorder a briefly
discussed in the following sections.
1.1.1 ANXIETY
Anxiety is a normal response to psychological stress induced by either
physical or perceived threat. However, a malfunctioning anxiety response could lead to
anxiety disorders. Anxiety disorders are further divided into five types; such as panic
disorder, social phobia, obsessive compulsive disorder, generalised anxiety disorder
and posttraumatic stress disorder (Leveleki et al., 2006; Ballenger, 1999). Patients
suffering from anxiety disorder are usually treated either by medication or
psychotherapy (Ballenger, 1999).
1.1.2 MANIA OR BIPOLAR DISORDER
Mania or bipolar disorder is a brain disorder that causes unusual shifts
in a person’s mood, energy and ability to function. During a manic episode, the mood
disturbances are severe enough to cause significant impairment in occupational
functioning or in otherwise normal social activities (Schapiro, 2005). Bipolar disorder is
further classified into two groups namely Bipolar I and Bipolar II. Bipolar I is
characterised by one or more manic or mixed episodes. Bipolar II is characterised by

2
recurrent episodes of major depression and hypomania. Bipolar disorder affects
approximately three to five percent of the world’s population, and affects both sexes
equally in all age group (Shastry, 2005).
1.1.3 DEPRESSION
Depression is defined as a feeling of intense sadness. Depressed
individuals tend to be obsessed with personal failings, are apathetic and socially
withdrawn (Malatynska & Knapp, 2005). Depression disorder can be transmitted in the
form of negative emotions from living or non-living beings to susceptible host.
Therefore, depression is also known as communicable disorder (Kalra, 2004).
Symptoms of depression disorder can last periods of time, sometimes several to years
(Gard, 2001).
1.1.4 SCHIZOPHRENIA
Schizophrenia is a complex cognitive disorder comprising of a variety of
alterations in attention, working memory, language, response monitoring and inhibition
(Freedman, 2003). Schizophrenia is treated as a debilitating disorder of the central
nervous system. Its symptoms are divided into two classes namely positive symptoms
and negative symptoms. Positive symptoms include hallucinations, delusions,
conceptual disorganization, where negative symptoms include social withdrawal,
blunted affect, and poverty of speech (Sawa & Snyder, 2002; Donaldson et al., 1983).
This disorder reduces the ability of the individual to interact with the social.
Schizophrenia affects about 1% of the world's population (Buchanan & Carpenter,
2000). All these types of mental disorders mentioned above are treated with
antipsychotic drug that will be described in the following section.
3
1.2 ANTIPSYCHOTIC DRUG
The term antipsychotic is applied to a group of drugs used to treat
psychosis. These classes of drugs were originally called 'neuroleptics' (from the Latin
root which mean to grasp the neuron) (Nicholas, 2004). Antipsychotic drugs are
generally divided in two types; that is typical antipsychotic drug and atypical
antipsychotic drug.
1.2.1 TYPICAL ANTIPSYCHOTIC DRUG
Typical antipsychotics are also known as major tranquilizers because of
their tranquilising and sedating effects when taken in large doses. Typical antipsychotic
drugs are effective primarily against positive symptoms of schizophrenia. Such drugs
include haloperidol (HP), chlorpromazine, perphenazine, thioridazine and
trifluoperazine are examples of typical antipsychotic drug (Fig. 1.1). Chlorpromazine
was the first typical antipsychotic drug used in 1952 to treat schizophrenic patients
(Edliner et al., 2005). Antipsychotic properties of typical antipsychotics are achieved
through the antagonistic effect on dopamine receptors.
The typical antipsychotic drugs used to treat schizophrenia are highly
effective. In particular, HP, the most widely used typical antipsychotic is very efficient in
treating the positive symptoms of schizophrenia. The most predominant among these
symptoms are dystonia, parkinsonian-like syndrome, and tardive dyskinesia
(Andreassen et al., 1996).
1.2.2 ATYPICAL ANTIPSYCHOTIC DRUG
Atypical antipsychotic drugs are used to treat schizophrenic patients
and results less extrapyramidal side effects. Compared to the older ‘typical’
antipsychotic, the atypical antipsychotic drugs are equally effective against the positive
symptoms and the negative symptoms of schizophrenia. Atypical antipsychotic drugs
4
block both dopamine and serotonin (5-hyroxytryptamine) receptors. These combined
effects on both dopamine and serotonin (5-hyroxytryptamine) receptors explain the
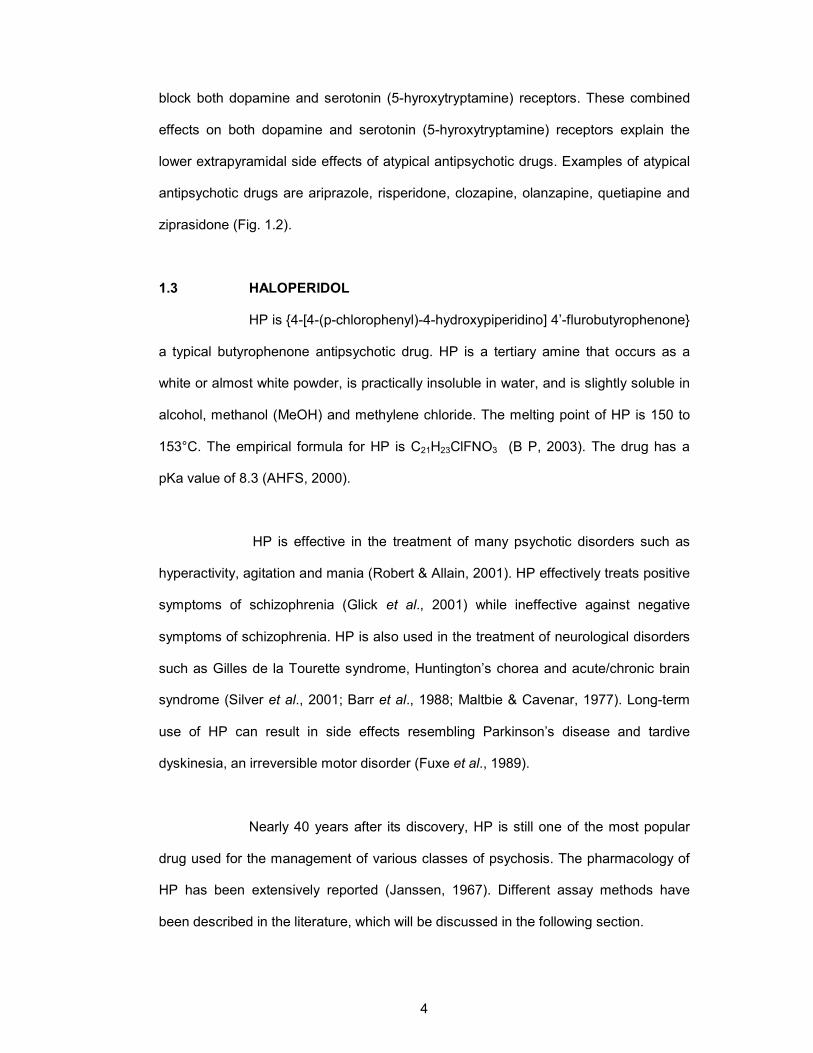
lower extrapyramidal side effects of atypical antipsychotic drugs. Examples of atypical
antipsychotic drugs are ariprazole, risperidone, clozapine, olanzapine, quetiapine and
ziprasidone (Fig. 1.2).
1.3 HALOPERIDOL
HP is {4-[4-(p-chlorophenyl)-4-hydroxypiperidino] 4’-flurobutyrophenone}
a typical butyrophenone antipsychotic drug. HP is a tertiary amine that occurs as a
white or almost white powder, is practically insoluble in water, and is slightly soluble in
alcohol, methanol (MeOH) and methylene chloride. The melting point of HP is 150 to
153°C. The empirical formula for HP is C21H23ClFNO3 (B P, 2003). The drug has a
pKa value of 8.3 (AHFS, 2000).
HP is effective in the treatment of many psychotic disorders such as
hyperactivity, agitation and mania (Robert & Allain, 2001). HP effectively treats positive
symptoms of schizophrenia (Glick et al., 2001) while ineffective against negative
symptoms of schizophrenia. HP is also used in the treatment of neurological disorders
such as Gilles de la Tourette syndrome, Huntington’s chorea and acute/chronic brain
syndrome (Silver et al., 2001; Barr et al., 1988; Maltbie & Cavenar, 1977). Long-term
use of HP can result in side effects resembling Parkinson’s disease and tardive
dyskinesia, an irreversible motor disorder (Fuxe et al., 1989).
Nearly 40 years after its discovery, HP is still one of the most popular
drug used for the management of various classes of psychosis. The pharmacology of
HP has been extensively reported (Janssen, 1967). Different assay methods have
been described in the literature, which will be discussed in the following section.

5
C CH2 CH2 CH2 N
OH
Cl
F
O
a. Haloperidol
S
N
(CH2)3
N
N
CF
CH3
S
N
(CH2)3
N
N
Cl
(CH2)2
OH
b. Trifluoperazine c. Perphenazine
S
N
(CH2)2
N CH3
SCH3
S
N
(CH2)3
N
H3C CH3
Cl
d. Thioridazine e. Chlorpromazine
Figure 1.1 Structural formula of typical antipsychotic drugs.
6
N
NH
N
N
CH3
Cl
N
NH
S
N
N
CH3
CH3
a. Clozapine b. Olanzapine
N N
N
S
H
H
(CH2)2OCH2CH2OH
N
N
O
CH3
N
NO
F
c. Quetiapine d. Risperidone
Figure 1.2 Structural formula of atypical antipsychotic drugs.
7
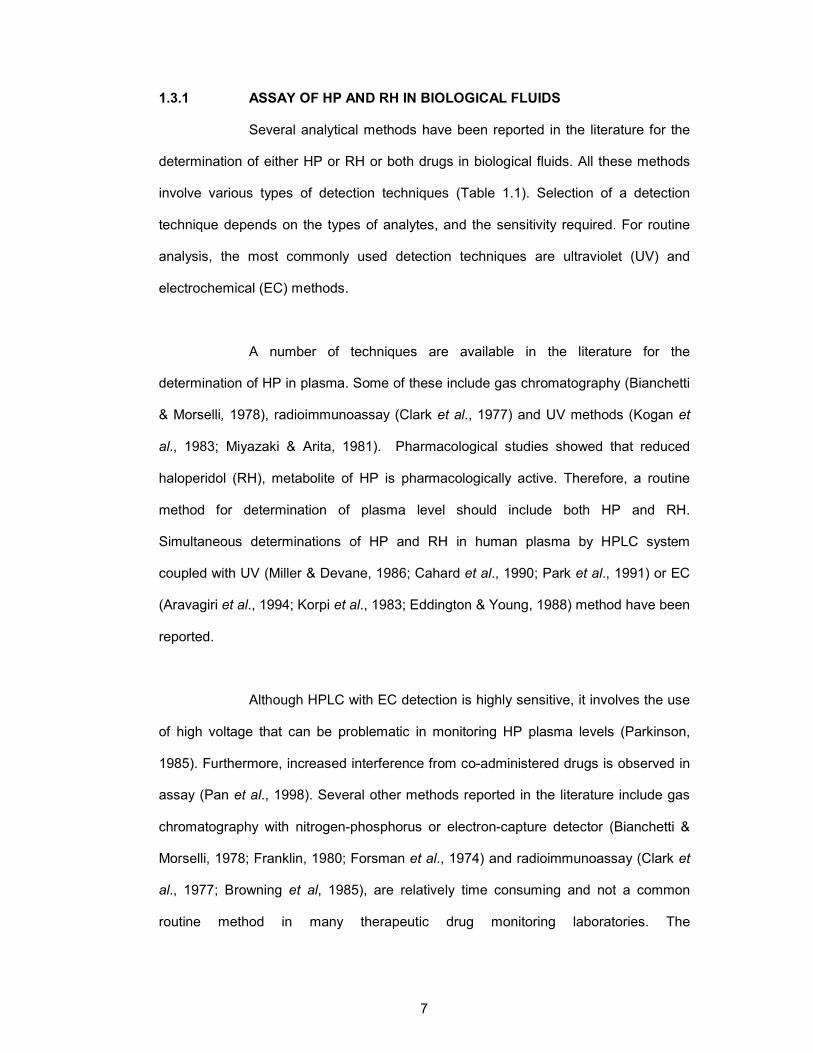
1.3.1 ASSAY OF HP AND RH IN BIOLOGICAL FLUIDS
Several analytical methods have been reported in the literature for the
determination of either HP or RH or both drugs in biological fluids. All these methods
involve various types of detection techniques (Table 1.1). Selection of a detection
technique depends on the types of analytes, and the sensitivity required. For routine
analysis, the most commonly used detection techniques are ultraviolet (UV) and
electrochemical (EC) methods.
A number of techniques are available in the literature for the
determination of HP in plasma. Some of these include gas chromatography (Bianchetti
& Morselli, 1978), radioimmunoassay (Clark et al., 1977) and UV methods (Kogan et
al., 1983; Miyazaki & Arita, 1981). Pharmacological studies showed that reduced
haloperidol (RH), metabolite of HP is pharmacologically active. Therefore, a routine
method for determination of plasma level should include both HP and RH.
Simultaneous determinations of HP and RH in human plasma by HPLC system
coupled with UV (Miller & Devane, 1986; Cahard et al., 1990; Park et al., 1991) or EC
(Aravagiri et al., 1994; Korpi et al., 1983; Eddington & Young, 1988) method have been
reported.
Although HPLC with EC detection is highly sensitive, it involves the use
of high voltage that can be problematic in monitoring HP plasma levels (Parkinson,
1985). Furthermore, increased interference from co-administered drugs is observed in
assay (Pan et al., 1998). Several other methods reported in the literature include gas
chromatography with nitrogen-phosphorus or electron-capture detector (Bianchetti &
Morselli, 1978; Franklin, 1980; Forsman et al., 1974) and radioimmunoassay (Clark et
al., 1977; Browning et al, 1985), are relatively time consuming and not a common
routine method in many therapeutic drug monitoring laboratories. The
8
radioimmunoassay method is very cumbersome and lack specificity and sensitivity and
with it, RH is determined by an indirect method.
Recently, liquid chromatography in combination with mass
spectrometric detection (Hempenius et al., 1999; Hoja et al., 1997) has been reported
for the analysis of HP. Sophisticated detector such as mass spectrometry coupled with
liquid chromatography or gas chromatography is admittedly highly sensitive. However,
it is very expensive and requires great expertise in order to operate. With such
considerations in mind, a method based on UV detection is still the most practical for
routine applications and therefore is the method of choice in this thesis.
For analysis of drugs and its metabolites in plasma, sample preparation
is very important. HP and RH were extracted from biological fluids either by liquid-liquid
extraction (LLE) or solid phase extraction (SPE) (Table 1.2). However, LLE is the most
popular and convenient method for routine analysis of HP and RH determinations
(Korpi et al., 1983; Miller & Devane, 1986; Hariharan et al., 1989; Park et al., 1991).
Only a few groups used the SPE method (Hempenius et al., 1999; Hoffman & Edkinds,
1994; Cahard et al., 1990). LLE extraction involves single, double or multiple step of
extraction. Extraction efficiency partly depends on the types of extraction solvents,
sample preparation pH, back extraction solvents and physiochemical properties.
Different types of extraction solvents are used to extract drug from plasma. In most
case mixtures of organic non-polar and polar solvents are employed. For HP and RH
determinations commonly used non-polar solvents are pentane, hexane and heptane
and polar solvents are isoamyl alcohol and isopropanol (Table 1.2). However, from the
reported recovery data presented in Table 1.2 it is difficult to conclude which
combination of extraction solvents were the best, since extraction performance depend
on several factors.

9
To keep drugs in a neutral state, basifying agents are generally added
to plasma. Sodium hydroxide (Hariharan et al., 1989; Miller & Devane, 1986; Jatlow et
al., 1982) and sodium carbonate (Aravagiri et al., 1994; Midha et al., 1988) at different
concentrations were used as basifying agents for HP determination in plasma.
Different types of solvents are used to back extract the drug from
organic phase into aqueous phase. For HP and RH determination hydrochloric acid
(Midha et al., 1988; Miller & Devane, 1986; Hoja et al., 1997), perchloric acid
(Hariharan et al., 1989) and sulfuric acid (McBurney & George, 1984; Park et al., 1991)
were used as back extraction solvents. However, organic acid (perchloric acid and
acetic acid) are the preferred back extraction solvent as compared to inorganic acid
(hydrochloric acid and sulphuric acid). A much cleaner blank chromatogram was
obtained using perchloric acid rather than hydrochloric acid or sulphuric acid
(Hariharan et al., 1989).
1.3.2 PHARMACOLOGY OF HP
A pharmacological action of drug is dependent upon its chemical
structure, any change in chemical structure may change the drug action. The exact
drug action also depends on its binding affinity to the receptor types. Drugs combine
with these receptors to produce their pharmacological effect (Gard, 2001).
Pharmacological activity of HP is related to its affinity for the dopamine
receptors. (Beuger et al., 1996; Creese et al., 1976; Seeman & Lee, 1975; Seeman et
al., 1974). Dopamine receptors are classified into five subtypes such as D1, D2, D3, D4
and D5 (Dearry et al., 1990; Grandy et al., 1991; Monsma et al., 1990; Sokoloff et al.,
1990; Sunahara et al., 1991; Vantol et al., 1991). These receptors are further divided
into two subfamilies such as the D1-like receptors (D1 and D5) and the D2-like receptors
(D2, D3 and D4)(Tarazi, 2001). The binding of HP to the postsynaptic D2-like receptors
10
is believed to mediate the therapeutic effects (Creese et al., 1976; Seeman & Lee,
1975; Seeman et al., 1974). In addition to the specific functions of several subtypes,
dopamine receptors also have distinct functions based on their location at the neuron,
i.e. pre-synaptically or post-synaptically (Nagy et al., 1978). Post-synaptic dopamine
receptors are necessary for signal initiations or transmission, whereas pre-synaptic
dopamine receptors, located on the cell bodies and axon terminals, function as
autoreceptors through which the release of dopamine can be regulated.
HP, which is a dopamine antagonist, mimics the dopamine in binding to
the dopamine receptor. There appears to be a very narrow range between the effective
therapeutic dose for the management of acute psychotic disorder and that, which
causes extrapyramidal side effects (AHFS, 2000). Therefore, the determination of
antipsychotic drugs plasma concentration in psychiatric patient is important, especially
in case of the HP, due to large variability between individuals. When HP is metabolised
in the liver it produces the metabolite RH. This reduced metabolite, RH is then oxidised
back to HP. Therefore, the influence of HP and RH on clinical responses requires the
monitoring of plasma levels for better patient management during HP therapy.
11
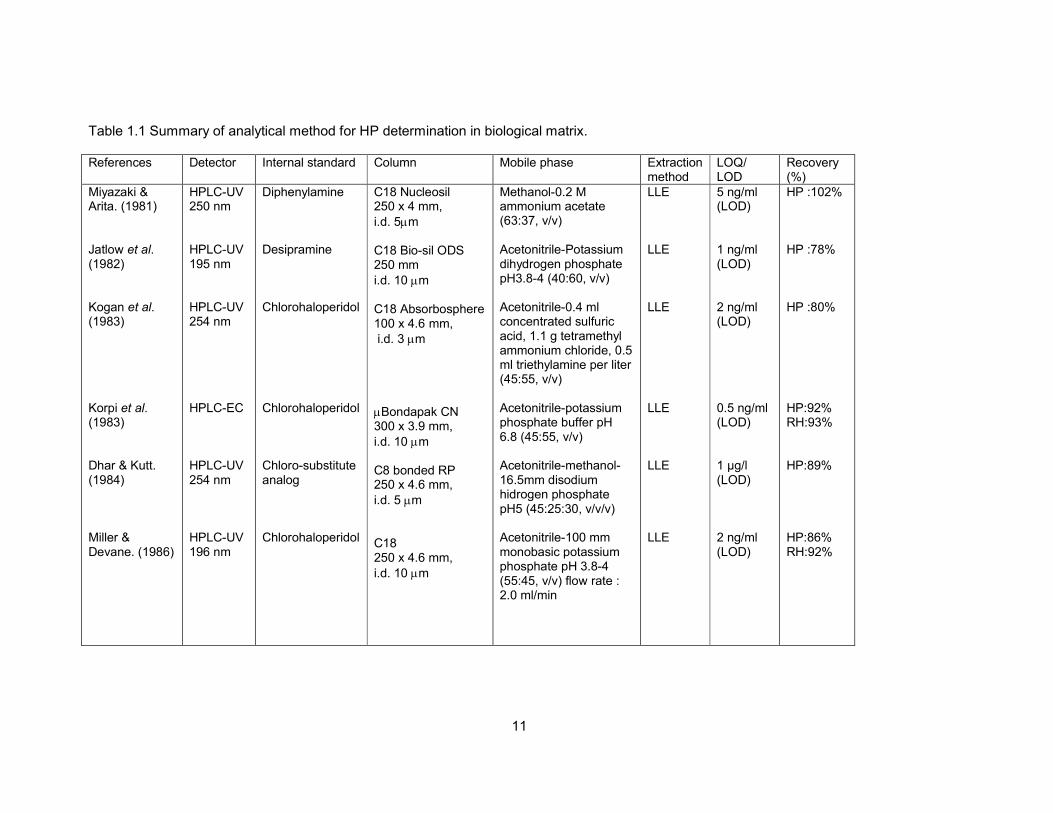
Table 1.1 Summary of analytical method for HP determination in biological matrix.
References Detector Internal standard Column Mobile phase Extraction method
LOQ/ LOD
Recovery (%)
Miyazaki & Arita. (1981) Jatlow et al. (1982) Kogan et al. (1983) Korpi et al. (1983) Dhar & Kutt. (1984) Miller & Devane. (1986)
HPLC-UV 250 nm HPLC-UV 195 nm HPLC-UV 254 nm HPLC-EC HPLC-UV 254 nm HPLC-UV 196 nm
Diphenylamine Desipramine Chlorohaloperidol Chlorohaloperidol Chloro-substitute analog Chlorohaloperidol
C18 Nucleosil 250 x 4 mm,
i.d. 5µm C18 Bio-sil ODS 250 mm
i.d. 10 µm C18 Absorbosphere 100 x 4.6 mm, i.d. 3 µm
µBondapak CN 300 x 3.9 mm,
i.d. 10 µm C8 bonded RP 250 x 4.6 mm,
i.d. 5 µm C18 250 x 4.6 mm,
i.d. 10 µm
Methanol-0.2 M ammonium acetate (63:37, v/v) Acetonitrile-Potassium dihydrogen phosphate pH3.8-4 (40:60, v/v) Acetonitrile-0.4 ml concentrated sulfuric acid, 1.1 g tetramethyl ammonium chloride, 0.5 ml triethylamine per liter (45:55, v/v) Acetonitrile-potassium phosphate buffer pH 6.8 (45:55, v/v) Acetonitrile-methanol-16.5mm disodium hidrogen phosphate pH5 (45:25:30, v/v/v) Acetonitrile-100 mm monobasic potassium phosphate pH 3.8-4 (55:45, v/v) flow rate : 2.0 ml/min
LLE LLE LLE LLE LLE LLE
5 ng/ml (LOD) 1 ng/ml (LOD) 2 ng/ml (LOD) 0.5 ng/ml (LOD) 1 µg/l (LOD) 2 ng/ml (LOD)
HP :102% HP :78% HP :80% HP:92% RH:93% HP:89% HP:86% RH:92%
12
Table 1.1 continued
References Detector Internal standard Column Mobile phase Extraction method
LOQ/ LOD Recovery (%)
Eddington & Young. (1988) Hariharan et al. (1989) Cahard et al. (1990) Wilhelm & Kemper. (1990) Park et al. (1991) Aravagiri et al. (1994)
HPLC-EC HPLC-coulometri HPLC-UV 220 nm Photo-diode HPLC-UV 214 nm HPLC-EC
Chlorohaloperidol Bromoperidol Chlorohaloperidol Clonazepam Bromoperidol Chlorohaloperidol
Nitrile bonded LC-PCN 150 x 4.6 mm,
i.d. 5 µm C8 RP (DB) 250 x 4.6 mm,
i.d. 5 µm
C18 µBondapak 300 x 3.9 mm,
i.d. 10 µm Silica 100 RP-18 120 x 4 mm,
i.d. 5 µm C18- Nova Pak 150 x 2.9 mm,
i.d. 4 µm Ultrasphere Cyano 250 x 4.6 mm,
i.d. 5 µm
Acetonitrile-1-propanol-10 mm dipotassium hidrogen phosphate pH 6.8 (30 :20 :50, v/v/v) flow rate : 1.1ml/min Acetonitrile-methanol-50 mM KH2PO4 pH 7 (20:40:40, v/v/v) Acetonitrile-water-0.025 M potassium dihydrogenphosphate (45:5:50, v/v/v) flow rate 0.8 ml/min Gradient : ethanol-acetonitrile-0.05 M phosphate buffer pH2.9 (22:8:70, v/v/v) Acetonitrile-methanol-0.5 M potassium dihydrogen phosphate (31:11:58, v/v/v/) Flow rate : 0.6 ml/min Acetonitrile-methanol-0.04M ammonium acetate pH 6.8 (86:6:8, v/v/v)
SPE LLE SPE SPE LLE LLE
20 pg (LOD) 50 ng/l (LOD) 1 ng/ml (LOQ) 450 pg/ml (LOQ) 0.5 ng/ml (LOD) 0.1 ng/ml (LOQ)
HP :93% RH :90% HP :83% RH :76% HP :101% HP :95% RH :73% HP :68% RH:86%
13
Table 1.1 continued
References Detector Internal standard Column Mobile phase Extraction method
LOQ/ LOD Recovery (%)
Hoffman & Edkins. (1994) Hoja et al. (!997) Pan et al. (1998) Hempenius et al. (1999) Titier et al. (2003)
HPLC-coulometri LC-EC-MS HPLC-UV 220 nm HPLC-EC LC-MS HPLC-UV 240 nm
Chlorohaloperidol Chlorohaloperidol Chlorohaloperidol Haloperidol D4 Methylrisperidone
Microsorb – 100 x 4.6 mm,
i.d. 3 µm C18 Nucleosil 150 x 1 mm,
i.d. 5 µm C18 Symmetry 150 x 3.9 mm, i.d. 5 Altima CN 250 x 4.6 mm,
i.d. 5 µm C18 Symmetry 100 x 4.6 mm,
i.d. 3.5 µm C8 Symmetry i.d. 250 x 4.6 mm,
Methanol-50mM sodium phosphate pH 6.5 (50:50, v/v) Flow rate : 0.5ml/min Acetonitrile-0.04M ammonium formate (45:55, v/v) Acetonitrile-0.02M sodium dihydrogen phosphate pH 3.8 (29:71, v/v) Acetonitrile-Methanol-0.04M sodium dihydrogen phosphate pH 6.8 (35:20:45, v/v/v)l Methanol-0.2% formic acid (50:50, v/v) Gradient : Acetonitrile-50mM NaH2PO4
SPE LLE LLE SPE LLE
0.5 ng/ml (LOD) 0.075 ng/ml (LOD) 2 ng/ml (LOQ) 0.5 ng/ml (LOQ) 0.1 (LLQ) 5 ng/ml (LOQ)
HP :80% HP :58% RH:70% HP :99-104% HP :83-121% HP:69%
Abbreviation: HPLC-UV = High performance liquid chromatography-Ultraviolet detector; HPLC-EC= High performance liquid chromatography-electrochemical detector; LC-EC-MS= liquid chromatographic-electrospray mass spectrometric; LC-MS= liquid chromatographic mass spectrometric; i.d.= internal diamension; mm=milimeter; µm=mikrometer; nm=nanometer; LLE = liquid-liquid extraction; SPE= solid phase extraction; LLOQ=lower limit of quantification, LOQ=limit of quantification; LOD=limit of detection; HP=haloperidol; RH=reduced haloperidol.
14
Table 1.2 Summary of extraction method for HP determination in biological matrix. References Extraction solvent Basifying agent Back extraction solvent Reconstitute solvent
Titier et al. (2003) Hexane : isoamylalcohol (99:1, v/v) (7 ml)
Sodium hydroxide (2 N, 100 µl))
Hydrochloric acid(0.05 M, 200 µl)
Direct injection
Pan et al. (1998) Hexane : isoamylalcohol (100:2, v/v) (5 ml)
Sodium hydroxide (2 N, 200µl)
Hydrochloric acid (0.1 N, 150 µl)
Mobile phase
Hoja et al. (1997) Hexane : isoamylalcohol (99:1, v/v) (8 ml)
Sodium hydroxide ( 2M, 500µl)
Hydrochloric acid (0.2 M, 1ml)
Mobile phase (50 µl)
Aravagiri et al. (1994)
Pentane:methylchloride (90:10, v/v) (7 ml)
Saturated sodium carbonate (0.5 ml)
Acetonitrile (150µl)
Park et al. (1991) Hexane : isoamylalcohol ( 98 :2, v/v) (5 ml)
Sodium hydroxide (2M, 300-500 µl )
Sulphuric acid (0.025 M, 120 µl )
Direct injection
Hariharan et al. (1989)
Pentane : isopropanol (95:5, v/v) (6 ml)
Sodium hydroxide (14.8 mol/l, 5 drop)
Perchloric acid (100 mM, 2ml)
Mobile phase (100µ)
Midha et al. (1988) Isopropanol : n pentane ( 5 :95, v/v) (10 ml)
Saturated sodium carbonate (0.5ml)
Hydrochloric acid (0.1 N, 1ml)
Acetonitrile (40µ)

15
Table 1.2 continued
References Extraction solvent Basifying agent Back extraction solvent Reconstitute solvent
Miller & Devane. (1986)
Hexane : isoamylalcohol (98 :2, v/v) (6 ml)
Sodium hydroxide (5 M, 100 µl )
Hydrochloric acid (0.1 M, 100µl)
Direct inject
McBurney & George. (1984)
Heptane : isoamylalcohol (98.5 :1.5, v/v)
Sodium hydroxide (2 M, 1 ml)
Sulphuric acid (0.005 M, 2ml)
Methanol
Dhar & Kutt. (1984) Heptane : isoamylalcohol (15% in 1L) (5 ml)
Sodium hydroxide (1 mol/l, 0.5 ml)
Sulphuric acid (5 mM, 0.6ml)
Direct injection
Jatlow et al. (1983) Hexane : isoamylalcohol ( 98 :2, v/v) (10 ml)
Sodium hydroxide (2 M, 0.2 ml)
Hydrochloric acid (0.1 M, 150µl)
Direct injection
Miyazaki & Arita. (1981)
Diethylether (4 ml) Sodium hydroxide (1 N, 1 ml)
Hydrochloric acid (0.1 N, 3.5ml)
Direct injection
Bianchetti & Morselli. (1978)
Diethyleter (5 ml) Sodium hydroxide (2 N, 200 µl )
Hydrochloric acid (0.2 N, 2.5ml)
Hempenius et al. (1999)
Solid phase extraction
Hoffman & Edkinds. (1994)
Solid phase extraction
Cahard et al. (1990) Solid phase extraction
Abbreviation: ml= mililiter; µl=microliter; M=molarity; N=normality; l=liter; mol/l=mol per liter; v/v=volume by volume; mM=milimolar
16
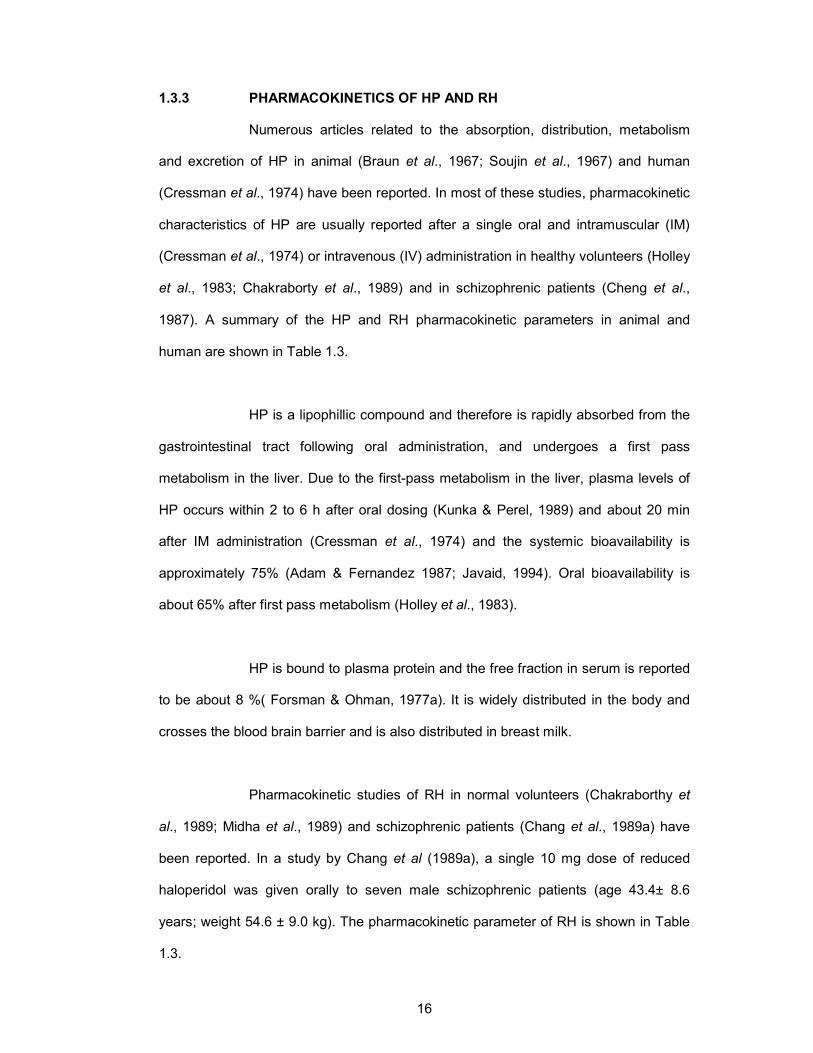
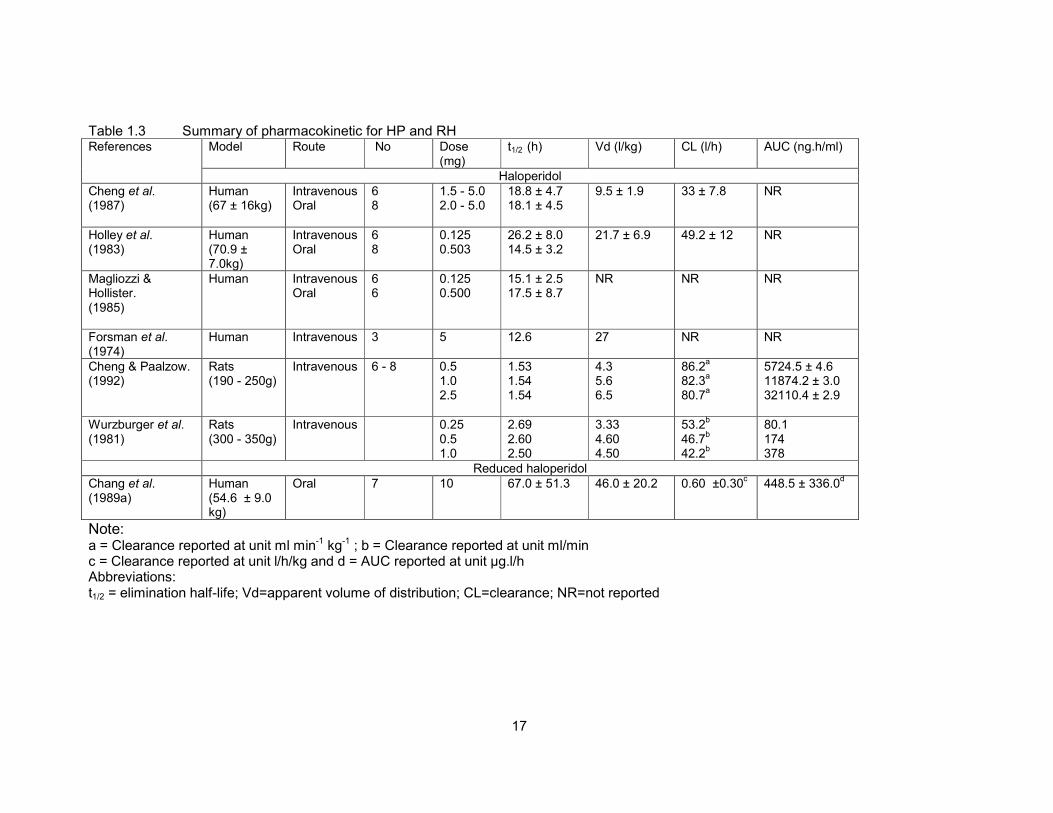
1.3.3 PHARMACOKINETICS OF HP AND RH
Numerous articles related to the absorption, distribution, metabolism
and excretion of HP in animal (Braun et al., 1967; Soujin et al., 1967) and human
(Cressman et al., 1974) have been reported. In most of these studies, pharmacokinetic
characteristics of HP are usually reported after a single oral and intramuscular (IM)
(Cressman et al., 1974) or intravenous (IV) administration in healthy volunteers (Holley
et al., 1983; Chakraborty et al., 1989) and in schizophrenic patients (Cheng et al.,
1987). A summary of the HP and RH pharmacokinetic parameters in animal and
human are shown in Table 1.3.
HP is a lipophillic compound and therefore is rapidly absorbed from the
gastrointestinal tract following oral administration, and undergoes a first pass
metabolism in the liver. Due to the first-pass metabolism in the liver, plasma levels of
HP occurs within 2 to 6 h after oral dosing (Kunka & Perel, 1989) and about 20 min
after IM administration (Cressman et al., 1974) and the systemic bioavailability is
approximately 75% (Adam & Fernandez 1987; Javaid, 1994). Oral bioavailability is
about 65% after first pass metabolism (Holley et al., 1983).
HP is bound to plasma protein and the free fraction in serum is reported
to be about 8 %( Forsman & Ohman, 1977a). It is widely distributed in the body and
crosses the blood brain barrier and is also distributed in breast milk.
Pharmacokinetic studies of RH in normal volunteers (Chakraborthy et
al., 1989; Midha et al., 1989) and schizophrenic patients (Chang et al., 1989a) have
been reported. In a study by Chang et al (1989a), a single 10 mg dose of reduced
haloperidol was given orally to seven male schizophrenic patients (age 43.4± 8.6
years; weight 54.6 ± 9.0 kg). The pharmacokinetic parameter of RH is shown in Table
1.3.
17
Table 1.3 Summary of pharmacokinetic for HP and RH Model Route No Dose
(mg) t1/2 (h) Vd (l/kg) CL (l/h)
AUC (ng.h/ml) References
Haloperidol
Cheng et al. (1987)
Human (67 ± 16kg)
Intravenous Oral
6 8
1.5 - 5.0 2.0 - 5.0
18.8 ± 4.7 18.1 ± 4.5
9.5 ± 1.9
33 ± 7.8 NR
Holley et al. (1983)
Human (70.9 ± 7.0kg)
Intravenous Oral
6 8
0.125 0.503
26.2 ± 8.0 14.5 ± 3.2
21.7 ± 6.9
49.2 ± 12 NR
Magliozzi & Hollister. (1985)
Human Intravenous Oral
6 6
0.125 0.500
15.1 ± 2.5 17.5 ± 8.7
NR NR NR
Forsman et al. (1974)
Human Intravenous 3 5 12.6 27 NR NR
Cheng & Paalzow. (1992)
Rats (190 - 250g)
Intravenous 6 - 8 0.5 1.0 2.5
1.53 1.54 1.54
4.3 5.6 6.5
86.2a
82.3a
80.7a
5724.5 ± 4.6 11874.2 ± 3.0 32110.4 ± 2.9
Wurzburger et al. (1981)
Rats (300 - 350g)
Intravenous 0.25 0.5 1.0
2.69 2.60 2.50
3.33 4.60 4.50
53.2b
46.7b
42.2b
80.1 174 378
Reduced haloperidol
Chang et al. (1989a)
Human (54.6 ± 9.0 kg)
Oral 7 10 67.0 ± 51.3 46.0 ± 20.2 0.60 ±0.30c 448.5 ± 336.0
d
Note: a = Clearance reported at unit ml min-1 kg-1 ; b = Clearance reported at unit ml/min c = Clearance reported at unit l/h/kg and d = AUC reported at unit µg.l/h Abbreviations: t1/2 = elimination half-life; Vd=apparent volume of distribution; CL=clearance; NR=not reported
18
Table 1.4 Concentration of HP and RH in rat tissues after a single intraperitoneally injection of HP or RH ( 1mg/kg body weight) ( Korpi & Wyatt, 1984).
Tissue/time after injection HP treatment ______ RH treatment ____________ HP RH HP RH ________________________________________________________________________________________________________________ Plasma 10 min 0.2 ± 0.1 n.d. 0.0 ± 0.0 0.1 ± 0.1 30 min 0.1 ± 0.0 n.d. 0.0 ± 0.0 0.1 ± 0.0 120 min 0.1 ± 0.0 n.d. 0.0 ± 0.0 0.0 ± 0.0 Liver 10 min 24.0 ± 7.8 0.4 ± 0.2 6.8 ± 0.5 1.8 ± 0.1 30 min 6.2 ± 0.2 0.1 ± 0.0 3.1 ± 0.1 0.8 ± 0.1 120 min 2.9 ± 0.2 0.0 ± 0.0 2.1 ± 0.1 0.3 ± 0.0 Corpus striatum 10 min 3.4 ± 1.3 n.d. 0.2 ± 0.0 1.6 ± 1.3 30 min 3.2 ± 0.5 n.d. 0.5 ± 0.1 2.3 ± 0.9 120 min 1.2 ± 0.2 n.d. 0.6 ± 0.1 0.6 ± 0.2
Drug concentrations are given as mean ± S.E.M. (n=4) in µmol/l for plasma and in µmol/kg wet weight for liver and corpus striatum. n.d.= not detected.
19
Table 1.5 Concentration of HP and RH in striatum and plasma after repeated IP injections of HP(Chang et al., 1988).
Dose Drug concentration_____________________________________________________________________________________ (mg/kg) Striatum (ng/g) _________________________ Plasma (ng/ml)___________________________________ HP RH HP RH
0.1 138 ± 5 168 ± 10 1.8 ± 0.2 5.0 ± 0.4 0.5 220 ± 11 433 ± 16 4.4 ± 0.4 28.8 ± 2.0 2 436 ± 17 2158 ± 155 11.1 ± 0.6 149.6 ± 6.0
All values are mean ± S.E.M. of six to eight animals Table 1.6 Pharmacokinetic parameters after administration of HP and RH.
References Subject No Drug Dose pharmacokinetic parameters_________________________ AUC (ng.h/ml) CL (l/kg) t1/2 (h)
Chakraborty Healthy volunteers 15 HP (given HP 5 mg) 70.7 ± 33.4 NR 53.9 ± 24.5 et al., 1989 77.6 ± 10kg RH (given HP 5 mg) 62.0 ± 103.1 NR 69.2 ± 23.9 HP (given RH 5 mg) a NR a RH (given RH 5 mg) 54.5 ± 20.9 NR 73.2 ± 29.4
Jann et al., Schizophrenic 6 HP (given HP 10 mg) 200.5 ± 99.2b 1.1 ± 0.3c 21.5 ± 9.1 1990 43 - 66 kg RH (given HP 10 mg) 85.0 ± 72.2b 6.2 ± 8.8c 34.0 ± 22.5 HP (given RH 10 mg) 48.2 ± 66.4b 11.5 ± 10.9c 36.7 ± 48.0 RH (given RH 10 mg) 432.5 ± 336.3b 0.7 ± 0.6c 71.9 ± 61.2
Note: a= could not be calculated in 14 out of 15 volunteers because HP not determined given RH dose. b= AUC reported at unit mcg.h/l. CL = Clearance reported as unit l/h/kg. Abbreviation : AUC = Area under the curve; HP = Haloperidol; RH = Reduced haloperidol; kg=kilogram; mg=miligram.

20
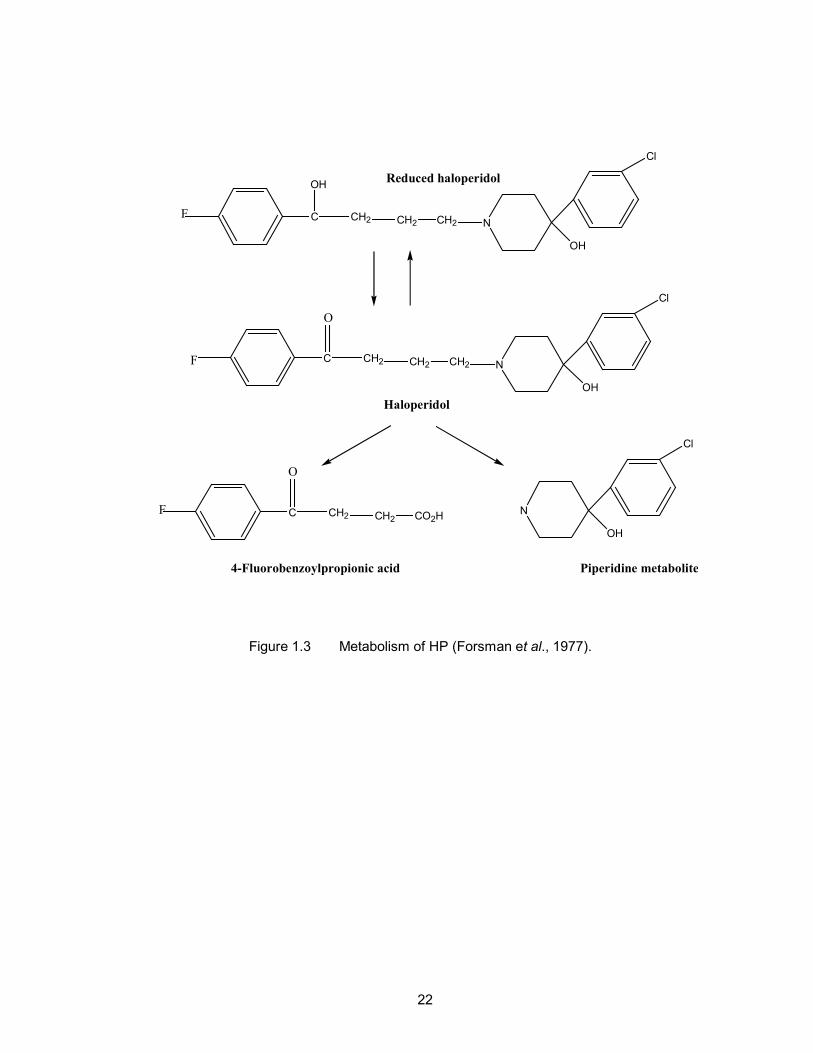
The liver is the major site of HP metabolism (Korpi et al., 1985). The
metabolism of the HP in humans involves the initial cleavage of the molecule at the C-
N bond of the central chain to form an inactive piperidine and 4-fluorobenzoylpropionic
acid metabolites (Forsman et al., 1977) (Figure 1.3) and the formation of a conjugate
with glucuronic acid at the hydroxy group (Oida et al., 1989). HP is also metabolised
through reduction at the benzylic ketone group to form an alcohol metabolite, known as
reduced haloperidol (RH) (Forsman & Larsson, 1978).
HP is excreted slowly in the urine and faeces. About 30% of a given
dose is excreted in urine and about 20% of a given dose in faeces via biliary
elimination (Beresford & Ward, 1987). Only 1% of a given dose is excreted as
unchanged drug in the urine (Forsman et al., 1977). There is also evidence of
enterohepatic recycling (Chakraborty et al., 1989).
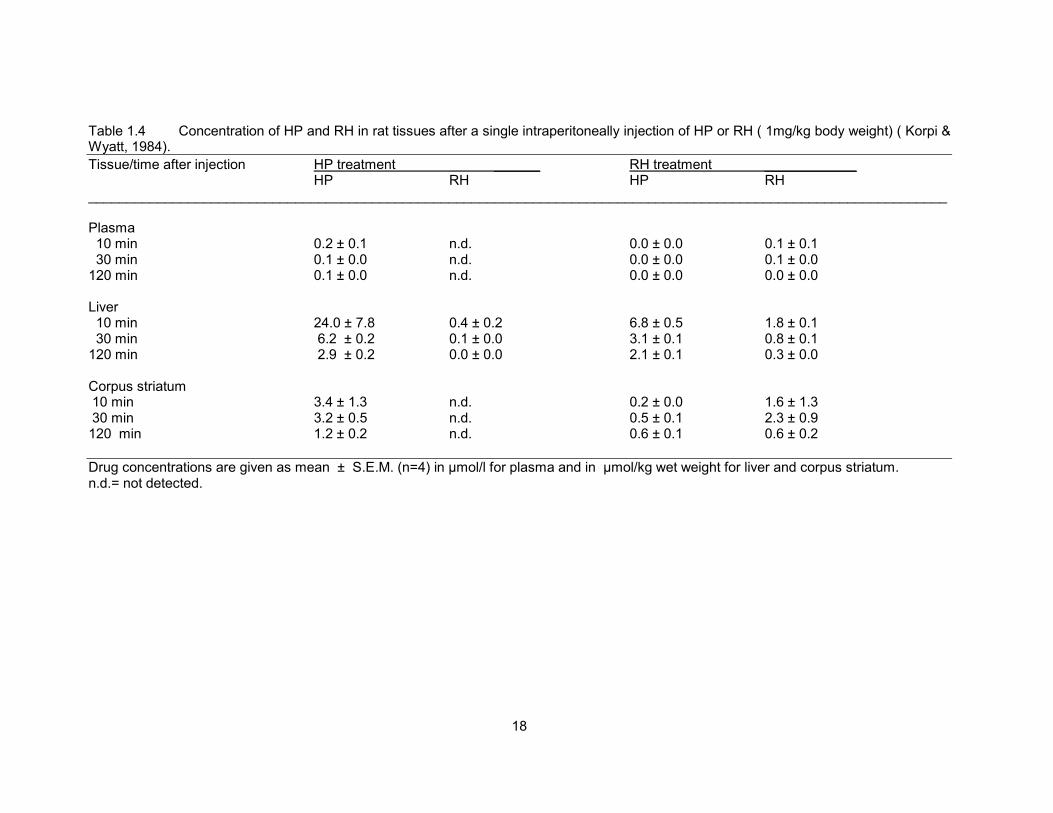
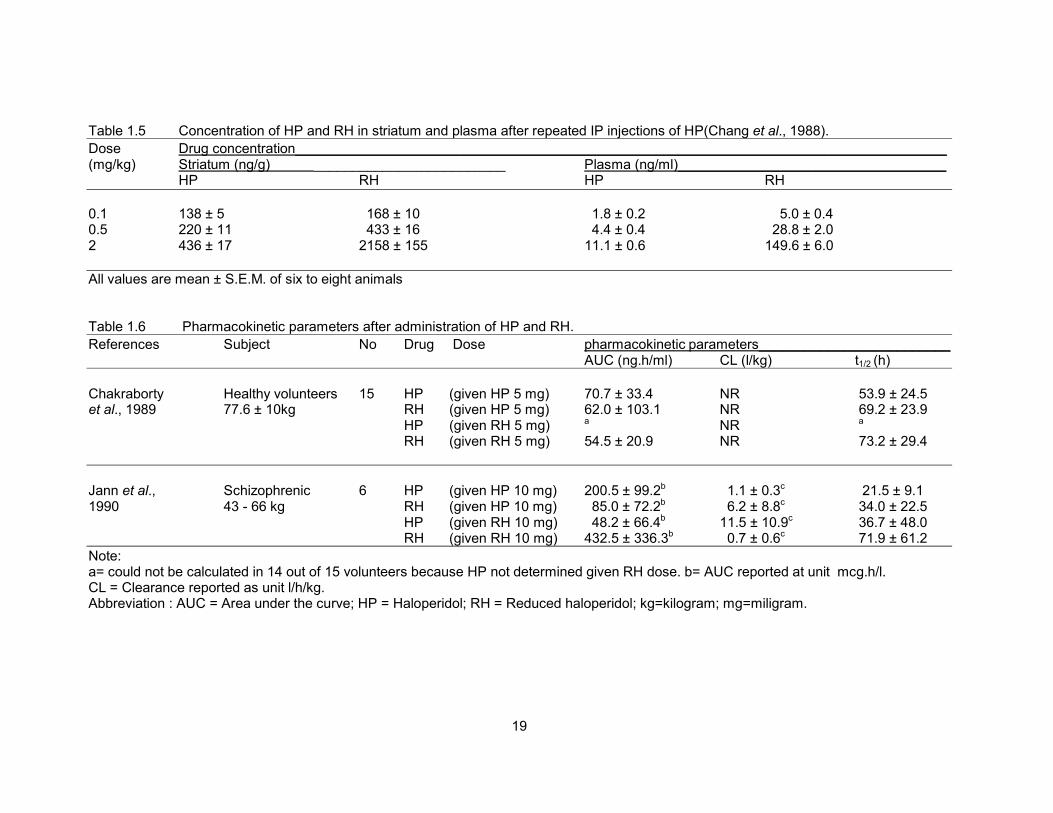
The interconversion between HP and RH are species specific. RH is
oxidised back to HP in rats (Table 1.4) (Korpi & Wyatt 1984; Korpi et al., 1985a), while
in guinea pigs reversible metabolism of HP and RH (reduction and oxidation of both
compounds) were found (Table 1.5) (Korpi et al., 1985, 1985a; Chang et al., 1988,
1991). The presence of RH in the plasma patients treated with HP was first reported by
Forsman & Larsson (1978). However, the back conversion from RH to HP in human
was not elucidated until 1987. Back conversion of HP to RH in humans was detected in
plasma from healthy volunteer subjects. Healthy volunteer subjects were
administration of a single oral 5 mg dose of RH (Midha et al., 1987). Two years later,
these authors reported the interconversion between HP and RH in 14 of 15 normal
volunteers who received a single 5 mg dose of HP and RH separately (Chakraborty et
al., 1989; Midha et al., 1989). Further, Chang et al. (1989a) also reported the reversible
metabolism of HP and RH in schizophrenic patients (Table 1.6). The enzyme
21
responsible to produce RH from HP is characteristic of a ketone reductase that is
present in human and guinea pig hepatic cytosol (Inaba & Kovac, 1989). The reductase
activity was dependent on nicotinamide-adenine-dinucleotide-phosphate as a cofactor
for both humans and guinea pigs.
Several metabolic pathways involved in the metabolism of HP and RH
are mediated by cytochrome P450 isoenzymes (CYP) (Usuki et al., 1998). CYP3A4
plays an important role and is responsible for the N-dealkylation of HP and RH (Pan et
al., 1997; Pan et al., 1998a; Fang et al., 1997), the back oxidation of HP to RH (Pan et
al., 1998a, Kudo & Odomi, 1998; Avent & Gillam, 1998; Fang et al., 1997) and the
formation of pyridinum metabolite (Avent & Gillam, 1998; Fang et al., 1997; Eyles et al.,
1996). There are however, in the literature, several suggestions based on in vivo and in
vitro studies, that CYP2D6 (Inaba et al., 1985; Tyndale et al., 1991) could also be
involved, but the metabolic pathways are not known.
22
C
OH
CH2 CH2 CH2 N
OH
Cl
F
C CH2 CH2 CH2 N
OH
Cl
F
O
C CH2 CH2 CO2HF
O
N
OH
Cl
4-Fluorobenzoylpropionic acid Piperidine metabolite
Haloperidol
Reduced haloperidol
Figure 1.3 Metabolism of HP (Forsman et al., 1977).
23
1.3.4 DRUG INTERACTIONS
A drug interaction usually refers to the modifications of the expected
drug response due to exposure of the patients to other foods or drugs administered
concomitantly. Drug interaction may include drug-drug interaction or drug-food
interaction (Shargel & Yu, 1999). Food-drug interactions can produce negative effects
in the safety and efficacy of drug therapy and in the nutritional status of the patients
(Miguel et al., 2005). Many nutrients substantially interfere with the absorption or
metabolism of drugs in the body (Anderson, 1998; Kirk, 1995). For examples, grapes
fruit juice increase the plasma level of many drugs such as lovastatin and simvastatin
due to naringin that inhibit their metabolism (Kantola et al., 1998). Fluoroquinolones
binds with iron or calcium enriched foods and antacids if administered simultaneously.
The resulting compounds excreted with little or no systemic absorption. Significant
interaction of P-glycoproteins with cyclosporine and reduce the absorption of
levofloxacin has been reported (Wallace et al., 2003).
Many drug-drug interactions are metabolism based and related to
cytochrome P450 (CYP) enzymes. The CYP enzyme system is a very large group of
enzymes encoded by the P450 superfamily. CYPs are membrane bound proteins with
an approximate molecular weight of 50 kD and contain a heme moiety (Gunaratna,
2000). Because of the diversity of the cytochrome family a nomenclature system based
on sequence identity is developed. This nomenclature is comprised of family and sub-
family systems. Family includes CYPs and is designated by a number after CYP. Sub-
family is the CYPs within the family and is designated by a letter following the number.
For example, CYP2D6 is a cytochrome P450 enzyme. It belongs to family 2 and sub-
family D. The last number 6 refers to the sequence of discovery. There are about 30
human cytochrome P450 enzymes. Only 6 of them such as CYP1A2, CYP2C9,
CYP2C19, CYP2D6, CYP2E1 and CYP3A4 are mainly involved in drug metabolism.
24
Among these CYP3A4 is the most abundant and most clinically important isoenzymes
in humans (Gunaratna, 2000).
The enzymes involved in the metabolism of drug are altered by food and
the co-administered drug. Enzyme induction is a drug or chemical-stimulated increase
in enzyme activity usually due to an increase in the amount of enzyme present.
Enzyme inhibition is substrate competition or due to direct inhibition of the drug
metabolising enzymes, mainly CYP enzymes (Shargel & Yu, 1999). The CYP enzyme
is important to the pharmacokinetics of psychotropic drugs. The result of inhibition is a
higher plasma level of drug that can cause adverse effect. The result of induction is a
lower plasma level of drug that can affect the therapeutic efficacy (Sharif, 2003).
Concomitantly administered drugs may affect the pharmacokinetics of
HP by influencing its metabolic clearance and its ability to bind to plasma proteins, and
by causing alterations in hepatic blood flow. HP appears to be a moderately extracted
drug. On a theoretical basis, alterations in protein binding of drugs with a low extraction
ratio would have no influence on the pharmacokinetics of unbound drug at steady state.
On the other hand, alterations of plasma protein binding of high extraction drugs would
be predicted to cause a change in the clearance of unbound drug (Wilkinson & Shand,
1975; Nies et al., 1976; Blaschke, 1977).
Table 1.7 shows pharmacokinetic interactions between HP and other
drugs. Anticonvulsant drugs such as carbamazepine, phenytoin and phenobarbitone
are classified as enzyme inducers. Clinically significant decrease in plasma
concentration of HP was reported when coadministered with carbamazepine (Jann et
al., 1985; Kidron, et al., 1985; Arana et al., 1986). Another similar study showed
decreased plasma concentration of HP when co-administered with phenytoin and
phenobarbitat (Linnoila et al., 1980). There have been several reports on
Related Documents