Citation: Klanjšek, P.; Pajnkihar, M.; Marˇ cun Varda, N.; Moˇ cnik, M.; Golob Janˇ ciˇ c, S.; Povalej Bržan, P. Development and Validation of a New Screening Tool with Non-Invasive Indicators for Assessment of Malnutrition Risk in Hospitalised Children. Children 2022, 9, 731. https://doi.org/10.3390/ children9050731 Academic Editors: Tzuan A. Chen and Jayna Markand Dave Received: 15 April 2022 Accepted: 12 May 2022 Published: 17 May 2022 Publisher’s Note: MDPI stays neutral with regard to jurisdictional claims in published maps and institutional affil- iations. Copyright: © 2022 by the authors. Licensee MDPI, Basel, Switzerland. This article is an open access article distributed under the terms and conditions of the Creative Commons Attribution (CC BY) license (https:// creativecommons.org/licenses/by/ 4.0/). children Article Development and Validation of a New Screening Tool with Non-Invasive Indicators for Assessment of Malnutrition Risk in Hospitalised Children Petra Klanjšek 1, *, Majda Pajnkihar 1 , Nataša Marˇ cun Varda 2,3 , Mirjam Moˇ cnik 2 , Sonja Golob Janˇ ciˇ c 2 and Petra Povalej Bržan 3,4 1 Faculty of Health Sciences, University of Maribor, Žitna ulica 15, 2000 Maribor, Slovenia; [email protected] 2 Department of Paediatrics, University Medical Centre Maribor, Ljubljanska ulica 5, 2000 Maribor, Slovenia; [email protected] (N.M.V.); [email protected] (M.M.); [email protected] (S.G.J.) 3 Faculty of Medicine, University of Maribor, Taborska ulica 8, 2000 Maribor, Slovenia; [email protected] 4 Faculty of Electrical Engineering and Computer Science, University of Maribor, Koroška cesta 46, 2000 Maribor, Slovenia * Correspondence: [email protected] Abstract: There is no evidence of the most effective nutritional screening tool for hospitalized children. The present study aimed to develop a quick, simple, and valid screening tool for identifying malnutrition risk of hospital admission with non-invasive indicators. A cross-sectional study was conducted. Children‘s nutritional baseline using a questionnaire, subjective malnutritional risk, and Subjective Global Nutritional Assessment were assessed on admission. Concurrent validity was assessed using American Society for Parenteral and Enteral Nutrition (ASPEN)and Academy of Nutrition and Dietetics assessment and Subjective Global Nutritional Assessment tool. A new screening tool Simple Pediatric Nutritional risk Screening tool (SPENS) was developed, and sensitivity, specificity and reliability were evaluated. A total of 180 children aged from 1 month to 18 years were included (142 in the development phase and 38 in the validation phase). SPENS consist of four variables and shows almost perfect agreement with subjective malnutritional risk assessment (κ = 0.837) with high sensitivity and specificity (93.3% and 91.3% respectively). Compared with Subjective Global Nutritional Assessment and ASPEN and Academy of Nutrition and Dietetics assessment, SPENS had sensitivity 92.9% and 86.7%, a specificity of 87.5% and 87.0%, and an overall agreement of 0.78 and 0.728, respectively. Due to the fast, simple, easy, and practical to use, screening the SPENS can be performed by nurses, physicians, and dieticians. Keywords: nutritional risk; pediatrics; undernutrition; validation; computer-based tool 1. Introduction Nutritional status affects all aspects of a child’s health, including growth and de- velopment, physical activity, and response to serious illness [1]. In hospitalised children with different clinical conditions, adequate nutritional status plays a key role in normal growth processes, responses to concomitant diseases, quality of life, care costs, and sur- vival [2,3]. Malnutrition during the period of illness can interrupt treatment, worsen the child’s existing health condition, and prolong hospitalisation. In addition to failure to thrive [4], malnutrition can have lasting consequences for children, including changes in anthropometric parameters or new emerging diseases [5]. Malnutrition is often unrecognised and untreated in hospitalised children [6]. In previous studies, prevalence rate varies greatly, from 5.1% to 55.6% [7]. The development of malnutrition in hospitalised children is most often influenced by the underlying disease or its worsening [8,9], and further by the presence of chronic Children 2022, 9, 731. https://doi.org/10.3390/children9050731 https://www.mdpi.com/journal/children

Welcome message from author
This document is posted to help you gain knowledge. Please leave a comment to let me know what you think about it! Share it to your friends and learn new things together.
Transcript

Citation: Klanjšek, P.; Pajnkihar, M.;
Marcun Varda, N.; Mocnik, M.; Golob
Jancic, S.; Povalej Bržan, P.
Development and Validation of a
New Screening Tool with
Non-Invasive Indicators for
Assessment of Malnutrition Risk in
Hospitalised Children. Children 2022,
9, 731. https://doi.org/10.3390/
children9050731
Academic Editors: Tzuan A. Chen
and Jayna Markand Dave
Received: 15 April 2022
Accepted: 12 May 2022
Published: 17 May 2022
Publisher’s Note: MDPI stays neutral
with regard to jurisdictional claims in
published maps and institutional affil-
iations.
Copyright: © 2022 by the authors.
Licensee MDPI, Basel, Switzerland.
This article is an open access article
distributed under the terms and
conditions of the Creative Commons
Attribution (CC BY) license (https://
creativecommons.org/licenses/by/
4.0/).
children
Article
Development and Validation of a New Screening Tool withNon-Invasive Indicators for Assessment of Malnutrition Riskin Hospitalised ChildrenPetra Klanjšek 1,*, Majda Pajnkihar 1, Nataša Marcun Varda 2,3 , Mirjam Mocnik 2, Sonja Golob Jancic 2
and Petra Povalej Bržan 3,4
1 Faculty of Health Sciences, University of Maribor, Žitna ulica 15, 2000 Maribor, Slovenia;[email protected]
2 Department of Paediatrics, University Medical Centre Maribor, Ljubljanska ulica 5, 2000 Maribor, Slovenia;[email protected] (N.M.V.); [email protected] (M.M.);[email protected] (S.G.J.)
3 Faculty of Medicine, University of Maribor, Taborska ulica 8, 2000 Maribor, Slovenia; [email protected] Faculty of Electrical Engineering and Computer Science, University of Maribor, Koroška cesta 46,
2000 Maribor, Slovenia* Correspondence: [email protected]
Abstract: There is no evidence of the most effective nutritional screening tool for hospitalizedchildren. The present study aimed to develop a quick, simple, and valid screening tool for identifyingmalnutrition risk of hospital admission with non-invasive indicators. A cross-sectional study wasconducted. Children‘s nutritional baseline using a questionnaire, subjective malnutritional risk,and Subjective Global Nutritional Assessment were assessed on admission. Concurrent validitywas assessed using American Society for Parenteral and Enteral Nutrition (ASPEN)and Academyof Nutrition and Dietetics assessment and Subjective Global Nutritional Assessment tool. A newscreening tool Simple Pediatric Nutritional risk Screening tool (SPENS) was developed, and sensitivity,specificity and reliability were evaluated. A total of 180 children aged from 1 month to 18 yearswere included (142 in the development phase and 38 in the validation phase). SPENS consist offour variables and shows almost perfect agreement with subjective malnutritional risk assessment(κ = 0.837) with high sensitivity and specificity (93.3% and 91.3% respectively). Compared withSubjective Global Nutritional Assessment and ASPEN and Academy of Nutrition and Dieteticsassessment, SPENS had sensitivity 92.9% and 86.7%, a specificity of 87.5% and 87.0%, and an overallagreement of 0.78 and 0.728, respectively. Due to the fast, simple, easy, and practical to use, screeningthe SPENS can be performed by nurses, physicians, and dieticians.
Keywords: nutritional risk; pediatrics; undernutrition; validation; computer-based tool
1. Introduction
Nutritional status affects all aspects of a child’s health, including growth and de-velopment, physical activity, and response to serious illness [1]. In hospitalised childrenwith different clinical conditions, adequate nutritional status plays a key role in normalgrowth processes, responses to concomitant diseases, quality of life, care costs, and sur-vival [2,3]. Malnutrition during the period of illness can interrupt treatment, worsen thechild’s existing health condition, and prolong hospitalisation. In addition to failure tothrive [4], malnutrition can have lasting consequences for children, including changes inanthropometric parameters or new emerging diseases [5].
Malnutrition is often unrecognised and untreated in hospitalised children [6]. Inprevious studies, prevalence rate varies greatly, from 5.1% to 55.6% [7].
The development of malnutrition in hospitalised children is most often influencedby the underlying disease or its worsening [8,9], and further by the presence of chronic
Children 2022, 9, 731. https://doi.org/10.3390/children9050731 https://www.mdpi.com/journal/children
Children 2022, 9, 731 2 of 16
diseases [10,11]. The latter can be accompanied by the presence of eating disorders [12]and reduced food intake before or during hospitalisation [13]. The most common gastroin-testinal factors of malnutrition include nausea and vomiting, constipation, diarrhoea [8,10]and infections [14]. Surgery, aggressive therapies (e.g., oncology treatment) [15,16] andneuromotor disabilities [17] are also negatively related to nutritional status. The mostimportant clinical indicators of children with disease-associated malnutrition ranked onthe basis of the opinions and practices of an international cohort of health professionals areongoing weight loss, increased losses, increased requirements, low dietary intake and ahigh-risk condition [18].
Early and timely nutritional screening helps to improve nutritional care, acceleratetreatment and recovery, reduce complications, and reduce economic costs in the health sys-tem [19] as with other diseases where early diagnosis and timely initiation of treatment areof the utmost importance [20]; therefore, European Society for Paediatric Gastroenterology,Hepatology and Nutrition (ESPHAGAN) and American Society for Parenteral and EnteralNutrition (AESPEN) are recommending nutritional screening for hospitalised children withpaediatric nutritional screening tools (NSTs) which are simple, useful, and cost-effective.Several NSTs for children admitted to the hospital have been developed and validated [7,21].In the last decade, most of the studies consider Paediatric Yorkhill Malnutrition Score(PYMS), Screening Tool for the Assessment of Malnutrition in Paediatrics (STAMP) andScreening Tool for Risk on Nutritional status and Growth (STRONGkids) [22–24]. Dueto the individual needs of the different study populations, researchers are continuouslydeveloping new NSTs [21]; however, no agreement has been reached on the “gold standard”for the assessment of malnutrition risk [25]. The last point is also one of the reasons thatthe implementation of routine nutritional risk screening upon hospitalisation has not yetbeen established in most clinical settings. Among 588 paediatric gastroenterologists andpaediatric dietitians from six countries (Australia, Israel, Spain, Turkey, Netherlands, andUK) included in a recent study [18] only 23% reported routine use of NSTs at the hospital(most frequently in Belgium, Netherlands, and UK: 40–50%). The most common approachwas assessment of weight changes (85%), followed by the use of growth charts (77–80%).
Low awareness, lack of guidelines or local policy and lack of resources were recognisedas the most important barriers to the routine evaluation of disease-associated malnutritionin clinical practice [18].
The development of NSTs modified for each hospital and child diagnosis individuallyand with excellent reliability, regardless of the person performing the nutrition screening,is suggested [26]. Systematic screening with NSTs is not routinely performed in Slovenianhospitals. A specific NST for identification of the risks of malnutrition in Slovenian childrenhas not yet been developed.
The proposed study focuses on the development and validation of a reliable NSTSimple Pediatric Nutritional Risk Screening tool (SPENS) for hospitalised children of allages (1 month to 18 years), regardless of the child’s disease and the purpose of hospital-isation. The aim of the study is to develop a useful and time-efficient NST that will beused for screening in clinical pediatric practise by nurses, physicians, and dieticians. Animplementation of a newly developed SPENS will be the first step towards a systematicroutine for nutritional treatment of children in the Slovenian clinical environment; thiswill enable the identification of hospitalised children with risk of malnutrition, which willfurther receive appropriate nutritional assessment and timely nutritional interventions.
2. Materials and Methods2.1. Design
This study employed a cross-sectional design using a questionnaire, full nutritionalassessment, and assessment with Paediatric Subjective Global Nutritional Assessment(SGNA) [27–29] tool between 25 May and 16 October 2021. A two-phase exploratorysequential mixed method design was used and made it possible to achieve more compre-
Children 2022, 9, 731 3 of 16
hensive and richer results than either method independently would have achieved [30].Qualitative data were the basis for conducting a quantitative data analysis.
2.2. Setting and Samples
The setting for this study was one tertiary paediatric clinic in Slovenia. The clinic is thesecond-largest clinic in Slovenia. As advised [7,31], consecutive sampling was used in thequantitative part of the study. The participants were parents with children from 1 month to18 years old, who have been admitted to the hospital between May and October 2021 withan expected hospital stay (LOS) of at least 24 hours, regardless of the cause of admission orthe child’s medical condition. For the recruitment of children, we followed the eligibilitycriteria (see Supplementary Material S1).
To determine the sample size, we considered the prevalence calculated by the SLOFITstudy, where 4.7% to 9.5% of children in the general Slovenian population were malnour-ished [32]. Based on a 10% prevalence, a sample size of 138 hospitalised children wascalculated.
2.3. Participants
The sample included 142 parents with children for NST development hospitalised from25 May 2020 to 21 July 2020 and 38 parents with children hospitalised from 1 September 2020to 16 October 2020 in the SPENS validation. A total of 180 paediatric and surgery patientsaged 1 month to 18 years choose to participate (32.72%).
2.4. Measures
The final version of the questionnaire was based on a systematic review [7] and anextensive review of articles related to the causes and consequences of malnutrition inhospitalised children. The questionnaire contained 94 questions from 15 content sets (seeSupplementary Material S2). Questions used in the form included 277 variables due toseveral multiple-choice questions. Measurements of anthropometric parameters wererecorded numerically.
A post-admission subjective malnutritional risk assessment by a physician included:nutritional history; physical examination (assessment of muscle and subcutaneous fat,detection of swelling and/or ascites); laboratory blood tests; and anthropometric measure-ments according to ASPEN and Academy of Nutrition and Dietetics recommendations [33].Techniques of inspection, palpation, percussion and/or auscultation were used [34]. Eachindividual child was then distributed into one of the five categories according to the risk ofmalnutrition: high; moderate; low; normal weight; overweight; and obesity.
The SGNA assessment tool was also chosen for identifying malnutrition by a physician.SGNA assessment combines detailed questionnaire about subjective nutrition-focusedmedical history and complete objective physical examination with an overall ranking whichis divided into three categories: well nourished; moderate; and severe malnutrition [29].
2.5. Procedure
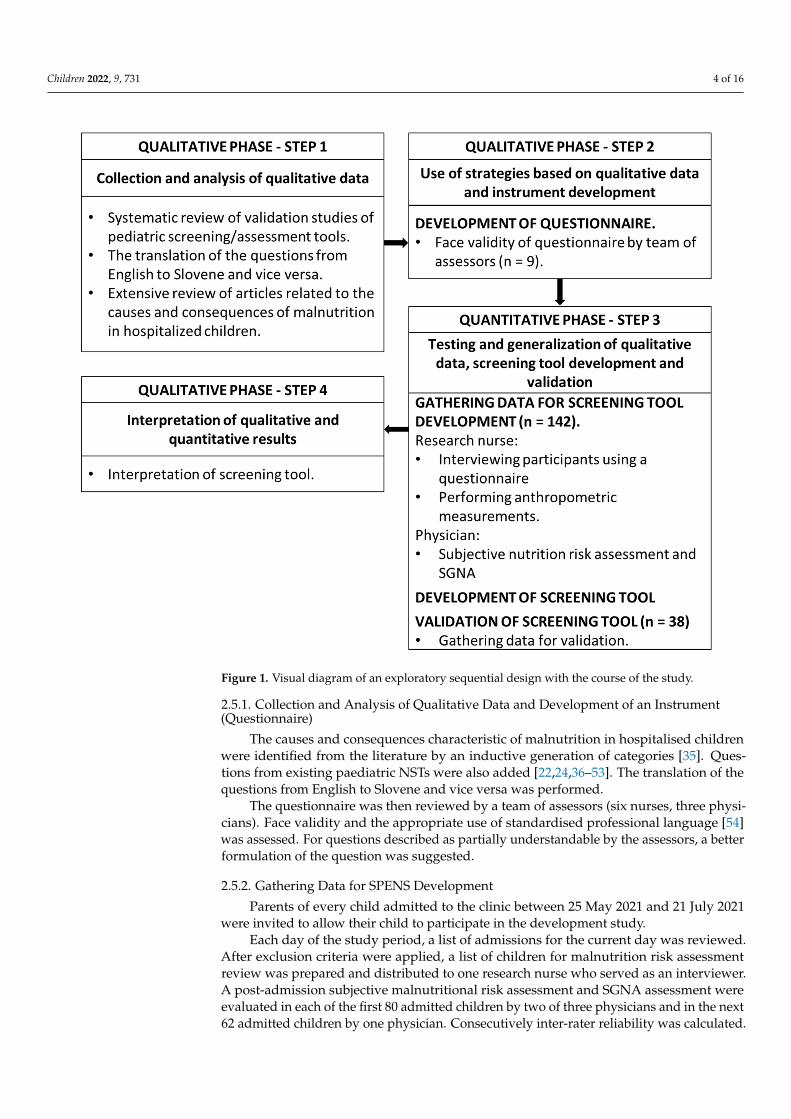
This study was executed in a two-phase mixed-method design, namely an exploratorysequential design [30]. Research began with the collection and analysis of qualitative dataand the production of a questionnaire, followed by a quantitative phase (development andvalidation of the screening tool) where the initial findings were validated and generalised(Figure 1). The gathering of data and development of a SPENS was conducted from 25 Mayto 21 July 2020. The SPENS was developed in August 2020. The validation of the tool wasperformed between the 1 September and 16 October 2020.
Children 2022, 9, 731 4 of 16
Children 2022, 9, x FOR PEER REVIEW 4 of 16
was conducted from 25 May to 21 July 2020. The SPENS was developed in August 2020. The validation of the tool was performed between the 1 September and 16 October 2020.
Figure 1. Visual diagram of an exploratory sequential design with the course of the study.
2.5.1. Collection and Analysis of Qualitative Data and Development of an Instrument (Questionnaire)
The causes and consequences characteristic of malnutrition in hospitalised children were identified from the literature by an inductive generation of categories [35]. Questions from existing paediatric NSTs were also added [22,24,36–53]. The translation of the ques-tions from English to Slovene and vice versa was performed.
The questionnaire was then reviewed by a team of assessors (six nurses, three physi-cians). Face validity and the appropriate use of standardised professional language [54] was assessed. For questions described as partially understandable by the assessors, a bet-ter formulation of the question was suggested.
2.5.2. Gathering Data for SPENS Development Parents of every child admitted to the clinic between 25 May 2021 and 21 July 2021
were invited to allow their child to participate in the development study. Each day of the study period, a list of admissions for the current day was reviewed.
After exclusion criteria were applied, a list of children for malnutrition risk assessment review was prepared and distributed to one research nurse who served as an interviewer. A post-admission subjective malnutritional risk assessment and SGNA assessment were evaluated in each of the first 80 admitted children by two of three physicians and in the next 62 admitted children by one physician. Consecutively inter-rater reliability was cal-culated. The Kappa value varied between 0.73 (0.39, 1) and 1 (1, 1) which indicated sub-stantial to almost perfect agreement.
Figure 1. Visual diagram of an exploratory sequential design with the course of the study.
2.5.1. Collection and Analysis of Qualitative Data and Development of an Instrument(Questionnaire)
The causes and consequences characteristic of malnutrition in hospitalised childrenwere identified from the literature by an inductive generation of categories [35]. Ques-tions from existing paediatric NSTs were also added [22,24,36–53]. The translation of thequestions from English to Slovene and vice versa was performed.
The questionnaire was then reviewed by a team of assessors (six nurses, three physi-cians). Face validity and the appropriate use of standardised professional language [54]was assessed. For questions described as partially understandable by the assessors, a betterformulation of the question was suggested.
2.5.2. Gathering Data for SPENS Development
Parents of every child admitted to the clinic between 25 May 2021 and 21 July 2021were invited to allow their child to participate in the development study.
Each day of the study period, a list of admissions for the current day was reviewed.After exclusion criteria were applied, a list of children for malnutrition risk assessmentreview was prepared and distributed to one research nurse who served as an interviewer.A post-admission subjective malnutritional risk assessment and SGNA assessment wereevaluated in each of the first 80 admitted children by two of three physicians and in the next62 admitted children by one physician. Consecutively inter-rater reliability was calculated.
Children 2022, 9, 731 5 of 16
The Kappa value varied between 0.73 (0.39, 1) and 1 (1, 1) which indicated substantial toalmost perfect agreement.
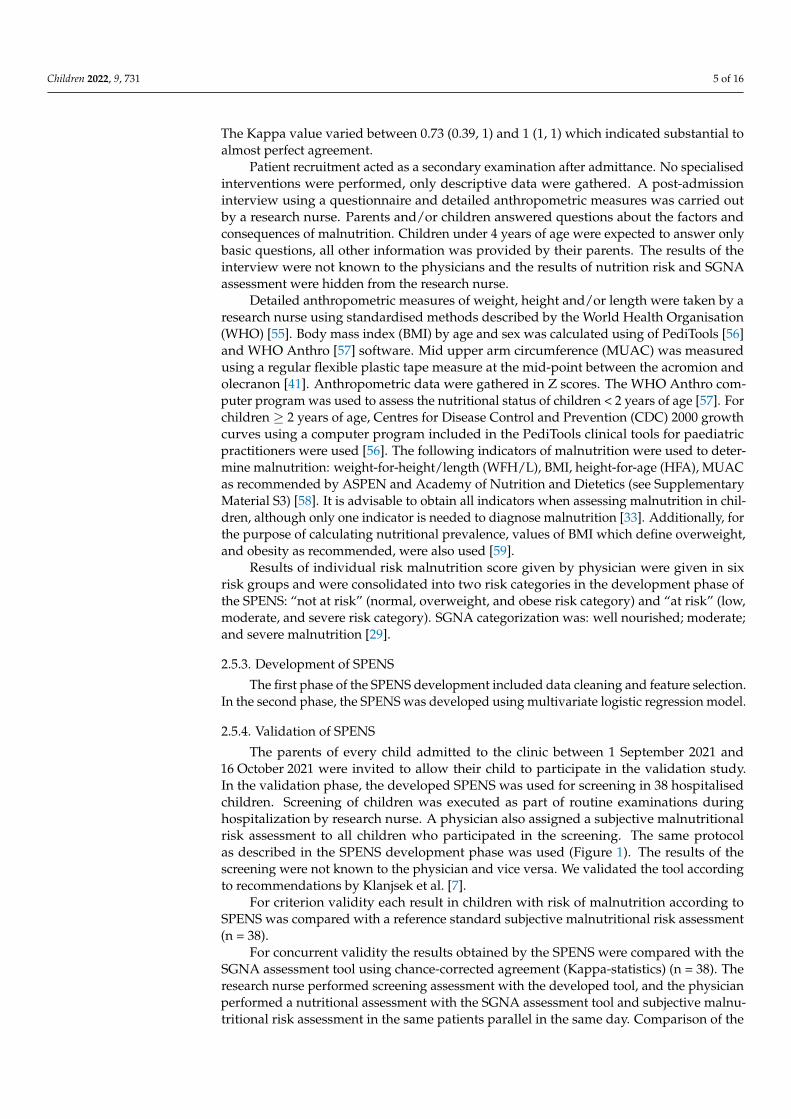
Patient recruitment acted as a secondary examination after admittance. No specialisedinterventions were performed, only descriptive data were gathered. A post-admissioninterview using a questionnaire and detailed anthropometric measures was carried outby a research nurse. Parents and/or children answered questions about the factors andconsequences of malnutrition. Children under 4 years of age were expected to answer onlybasic questions, all other information was provided by their parents. The results of theinterview were not known to the physicians and the results of nutrition risk and SGNAassessment were hidden from the research nurse.
Detailed anthropometric measures of weight, height and/or length were taken by aresearch nurse using standardised methods described by the World Health Organisation(WHO) [55]. Body mass index (BMI) by age and sex was calculated using of PediTools [56]and WHO Anthro [57] software. Mid upper arm circumference (MUAC) was measuredusing a regular flexible plastic tape measure at the mid-point between the acromion andolecranon [41]. Anthropometric data were gathered in Z scores. The WHO Anthro com-puter program was used to assess the nutritional status of children < 2 years of age [57]. Forchildren ≥ 2 years of age, Centres for Disease Control and Prevention (CDC) 2000 growthcurves using a computer program included in the PediTools clinical tools for paediatricpractitioners were used [56]. The following indicators of malnutrition were used to deter-mine malnutrition: weight-for-height/length (WFH/L), BMI, height-for-age (HFA), MUACas recommended by ASPEN and Academy of Nutrition and Dietetics (see SupplementaryMaterial S3) [58]. It is advisable to obtain all indicators when assessing malnutrition in chil-dren, although only one indicator is needed to diagnose malnutrition [33]. Additionally, forthe purpose of calculating nutritional prevalence, values of BMI which define overweight,and obesity as recommended, were also used [59].
Results of individual risk malnutrition score given by physician were given in sixrisk groups and were consolidated into two risk categories in the development phase ofthe SPENS: “not at risk” (normal, overweight, and obese risk category) and “at risk” (low,moderate, and severe risk category). SGNA categorization was: well nourished; moderate;and severe malnutrition [29].
2.5.3. Development of SPENS
The first phase of the SPENS development included data cleaning and feature selection.In the second phase, the SPENS was developed using multivariate logistic regression model.
2.5.4. Validation of SPENS
The parents of every child admitted to the clinic between 1 September 2021 and16 October 2021 were invited to allow their child to participate in the validation study.In the validation phase, the developed SPENS was used for screening in 38 hospitalisedchildren. Screening of children was executed as part of routine examinations duringhospitalization by research nurse. A physician also assigned a subjective malnutritionalrisk assessment to all children who participated in the screening. The same protocolas described in the SPENS development phase was used (Figure 1). The results of thescreening were not known to the physician and vice versa. We validated the tool accordingto recommendations by Klanjsek et al. [7].
For criterion validity each result in children with risk of malnutrition according toSPENS was compared with a reference standard subjective malnutritional risk assessment(n = 38).
For concurrent validity the results obtained by the SPENS were compared with theSGNA assessment tool using chance-corrected agreement (Kappa-statistics) (n = 38). Theresearch nurse performed screening assessment with the developed tool, and the physicianperformed a nutritional assessment with the SGNA assessment tool and subjective malnu-tritional risk assessment in the same patients parallel in the same day. Comparison of the

Children 2022, 9, 731 6 of 16
two tools (SPENS and SGNA assessment tool) was made with the subjective malnutritionalrisk assessment.
2.6. Data Analysis
Statistical analyses were performed using SPSS software version 28.0 [60] and theR programming language in the RStudio programming environment [61]. Descriptivestatistics were used for the presentation of demographic data. Numerical variables werepresented with a median (95% CI). Frequencies and percentages were used to describecategorical variables.
The feature selection process in the development phase included two steps. Relation-ship between risk factors and subjective malnutritional risk assessment was validated byPearson Chi Square test. Furthermore, the importance of the variables was assessed usingthe Random Forest (RF) model Importance function, which is based on calculating theMean Decrease Accuracy of the model [62]. Variables whose Mean Decrease Accuracymetric had a value more than 2 were included in the development of the tool. A manualstepwise multivariate logistic regression (LR) method was used to obtain the model.
The screening tool was validated using the area under the ROC curve (AUC), sensitiv-ity (Se), specificity (Sp), negative (NPV) and positive (PPV) predictive value.
The agreement between the SPENS and subjective malnutritional risk assessmentwas determined by Kappa (κ) value. κ values were rated with the proposed classificationsystem by Landish and Koch [63]. Se and Sp values were rated as suggested by Bokhorst-devan der Schueren et al. [64] and Klanjsek et al. [7]. The level of statistical significance wasset at p < 0.05.
2.7. Ethical Considerations
Ethical approval was obtained from the Commission of the Republic of Slovenia forMedical Ethics (approval number 0120-329/2016-3 KME 40/07/1). Site-specific approvalwas obtained for the involved hospital. All participants were recruited after receivingwritten information and a verbal explanation of the study and obtaining written consentfrom parents.
3. Results3.1. Characteristic of Children in Development and Validation Phase
Between 25 May to 21 July 2021 and 1 September to 16 October 2021, 550 paediatricand surgery children were admitted to the hospital; 180 children (32.7%) were successfullyincluded in the study; 86 (47.8%) were male and 94 (52.2%) females. Median chronologicalage of our group (n = 180) was 120.62 (108, 142) months, with minimum 1 month andmaximum 216 months. The median age of children in SPENS development study was123 (93, 138) months and in SPENS validation study was 143 (113, 169) months. Childrencame from a variety of six medical wards. A total of 142 children were included in the devel-opment phase and 38 in the validation phase. Sample characterization of the developmentand validation phase is shown in Supplementary Materials S4.
3.2. Prevalence of Malnutrition of Children in Development and Validation Phase
Prevalence in most of the malnutrition classifications has not varied considerablybetween the cohorts of children recruited for the development and validation phase (seeSupplementary Materials S4). Prevalence of malnutrition was 40% in the whole sample(40.1% in the development and 39.4% in the validation phase) according to the ASPEN andAcademy of Nutrition and Dietetics and 38.4% on the whole sample (38% in developmentand 39.5% in evaluation phase) according to the subjective malnutritional risk assessment.
3.3. Development Phase
Structured questionnaire (n = 277 variables) responses were compared with the classifi-cation of nutritional status by a subjective malnutritional risk assessment using chi-squared
Children 2022, 9, 731 7 of 16
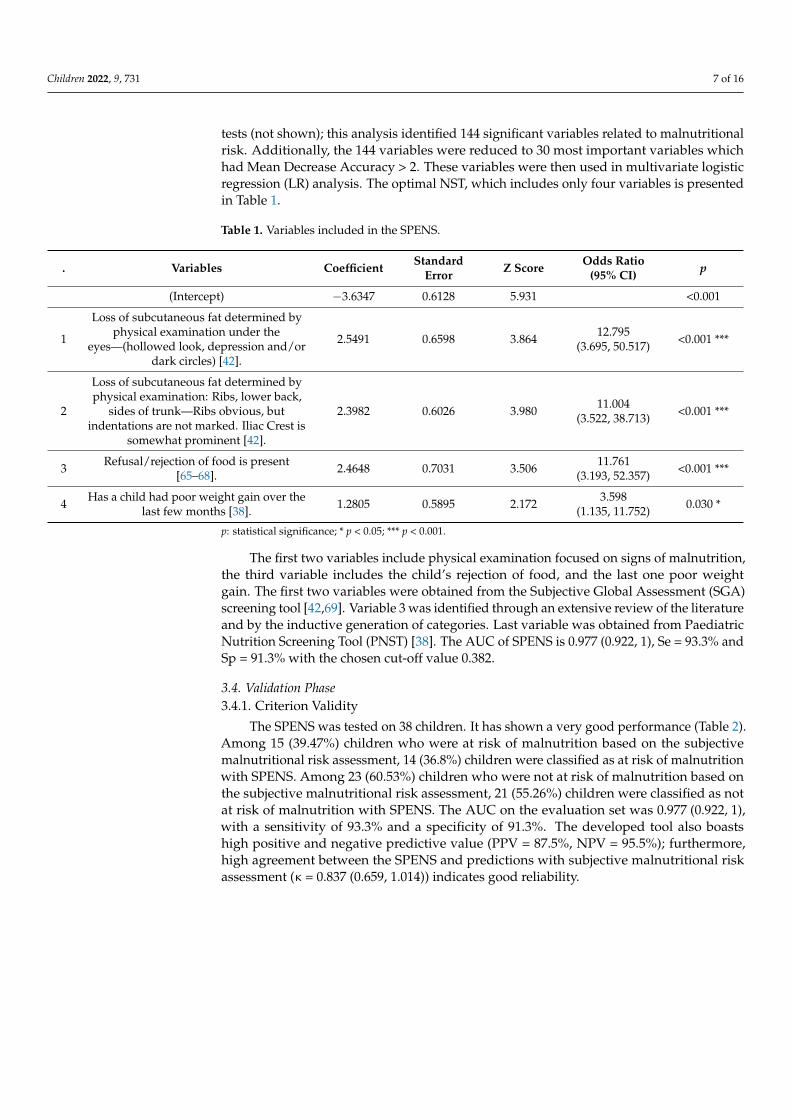
tests (not shown); this analysis identified 144 significant variables related to malnutritionalrisk. Additionally, the 144 variables were reduced to 30 most important variables whichhad Mean Decrease Accuracy > 2. These variables were then used in multivariate logisticregression (LR) analysis. The optimal NST, which includes only four variables is presentedin Table 1.
Table 1. Variables included in the SPENS.
. Variables Coefficient StandardError Z Score Odds Ratio
(95% CI) p
(Intercept) −3.6347 0.6128 5.931 <0.001
1
Loss of subcutaneous fat determined byphysical examination under the
eyes—(hollowed look, depression and/ordark circles) [42].
2.5491 0.6598 3.864 12.795(3.695, 50.517) <0.001 ***
2
Loss of subcutaneous fat determined byphysical examination: Ribs, lower back,
sides of trunk—Ribs obvious, butindentations are not marked. Iliac Crest is
somewhat prominent [42].
2.3982 0.6026 3.980 11.004(3.522, 38.713) <0.001 ***
3 Refusal/rejection of food is present[65–68]. 2.4648 0.7031 3.506 11.761
(3.193, 52.357) <0.001 ***
4 Has a child had poor weight gain over thelast few months [38]. 1.2805 0.5895 2.172 3.598
(1.135, 11.752) 0.030 *
p: statistical significance; * p < 0.05; *** p < 0.001.
The first two variables include physical examination focused on signs of malnutrition,the third variable includes the child’s rejection of food, and the last one poor weightgain. The first two variables were obtained from the Subjective Global Assessment (SGA)screening tool [42,69]. Variable 3 was identified through an extensive review of the literatureand by the inductive generation of categories. Last variable was obtained from PaediatricNutrition Screening Tool (PNST) [38]. The AUC of SPENS is 0.977 (0.922, 1), Se = 93.3% andSp = 91.3% with the chosen cut-off value 0.382.
3.4. Validation Phase3.4.1. Criterion Validity
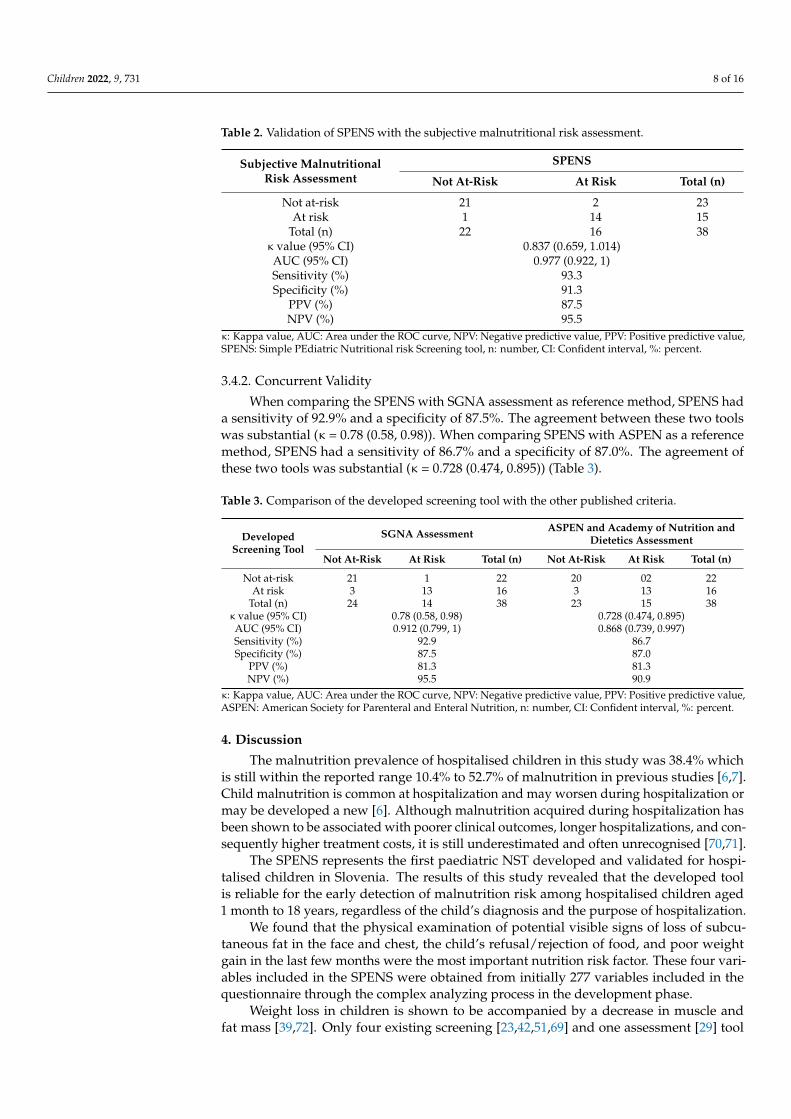
The SPENS was tested on 38 children. It has shown a very good performance (Table 2).Among 15 (39.47%) children who were at risk of malnutrition based on the subjectivemalnutritional risk assessment, 14 (36.8%) children were classified as at risk of malnutritionwith SPENS. Among 23 (60.53%) children who were not at risk of malnutrition based onthe subjective malnutritional risk assessment, 21 (55.26%) children were classified as notat risk of malnutrition with SPENS. The AUC on the evaluation set was 0.977 (0.922, 1),with a sensitivity of 93.3% and a specificity of 91.3%. The developed tool also boastshigh positive and negative predictive value (PPV = 87.5%, NPV = 95.5%); furthermore,high agreement between the SPENS and predictions with subjective malnutritional riskassessment (κ = 0.837 (0.659, 1.014)) indicates good reliability.
Children 2022, 9, 731 8 of 16
Table 2. Validation of SPENS with the subjective malnutritional risk assessment.
Subjective MalnutritionalRisk Assessment
SPENS
Not At-Risk At Risk Total (n)
Not at-risk 21 2 23At risk 1 14 15
Total (n) 22 16 38κ value (95% CI) 0.837 (0.659, 1.014)AUC (95% CI) 0.977 (0.922, 1)Sensitivity (%) 93.3Specificity (%) 91.3
PPV (%) 87.5NPV (%) 95.5
κ: Kappa value, AUC: Area under the ROC curve, NPV: Negative predictive value, PPV: Positive predictive value,SPENS: Simple PEdiatric Nutritional risk Screening tool, n: number, CI: Confident interval, %: percent.
3.4.2. Concurrent Validity
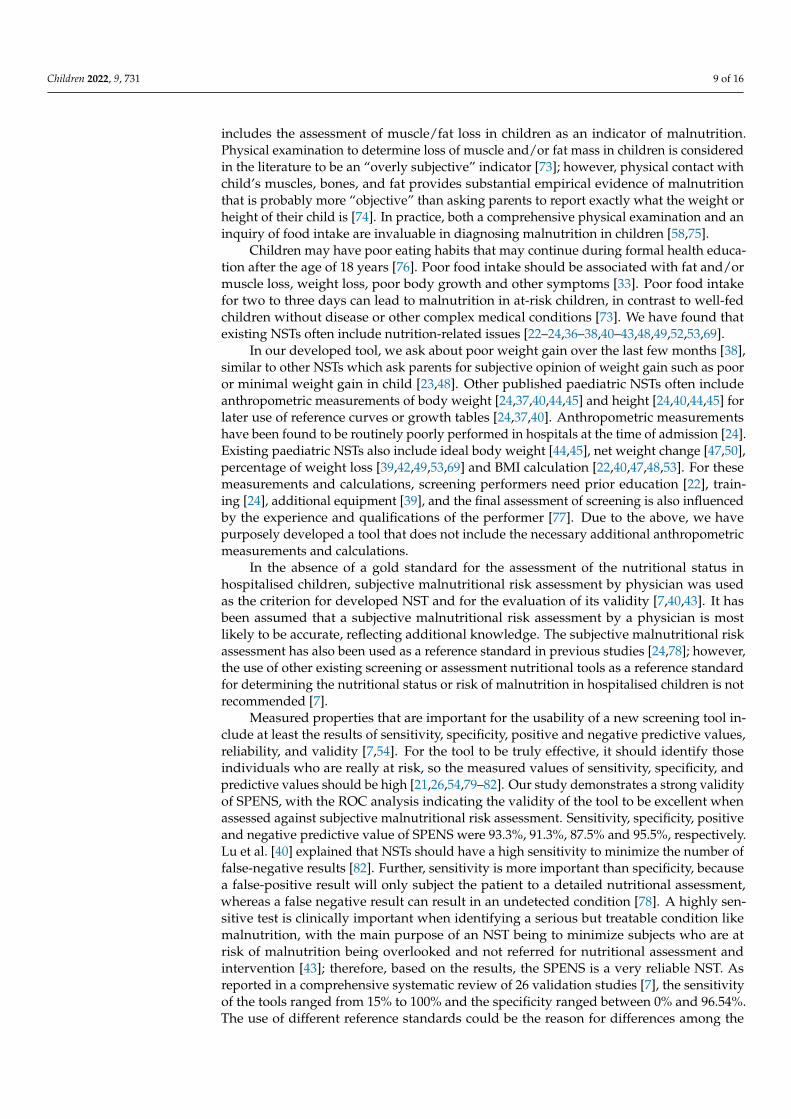
When comparing the SPENS with SGNA assessment as reference method, SPENS hada sensitivity of 92.9% and a specificity of 87.5%. The agreement between these two toolswas substantial (κ = 0.78 (0.58, 0.98)). When comparing SPENS with ASPEN as a referencemethod, SPENS had a sensitivity of 86.7% and a specificity of 87.0%. The agreement ofthese two tools was substantial (κ = 0.728 (0.474, 0.895)) (Table 3).
Table 3. Comparison of the developed screening tool with the other published criteria.
DevelopedScreening Tool
SGNA Assessment ASPEN and Academy of Nutrition andDietetics Assessment
Not At-Risk At Risk Total (n) Not At-Risk At Risk Total (n)
Not at-risk 21 1 22 20 02 22At risk 3 13 16 3 13 16
Total (n) 24 14 38 23 15 38κ value (95% CI) 0.78 (0.58, 0.98) 0.728 (0.474, 0.895)AUC (95% CI) 0.912 (0.799, 1) 0.868 (0.739, 0.997)Sensitivity (%) 92.9 86.7Specificity (%) 87.5 87.0
PPV (%) 81.3 81.3NPV (%) 95.5 90.9
κ: Kappa value, AUC: Area under the ROC curve, NPV: Negative predictive value, PPV: Positive predictive value,ASPEN: American Society for Parenteral and Enteral Nutrition, n: number, CI: Confident interval, %: percent.
4. Discussion
The malnutrition prevalence of hospitalised children in this study was 38.4% whichis still within the reported range 10.4% to 52.7% of malnutrition in previous studies [6,7].Child malnutrition is common at hospitalization and may worsen during hospitalization ormay be developed a new [6]. Although malnutrition acquired during hospitalization hasbeen shown to be associated with poorer clinical outcomes, longer hospitalizations, and con-sequently higher treatment costs, it is still underestimated and often unrecognised [70,71].
The SPENS represents the first paediatric NST developed and validated for hospi-talised children in Slovenia. The results of this study revealed that the developed toolis reliable for the early detection of malnutrition risk among hospitalised children aged1 month to 18 years, regardless of the child’s diagnosis and the purpose of hospitalization.
We found that the physical examination of potential visible signs of loss of subcu-taneous fat in the face and chest, the child’s refusal/rejection of food, and poor weightgain in the last few months were the most important nutrition risk factor. These four vari-ables included in the SPENS were obtained from initially 277 variables included in thequestionnaire through the complex analyzing process in the development phase.
Weight loss in children is shown to be accompanied by a decrease in muscle andfat mass [39,72]. Only four existing screening [23,42,51,69] and one assessment [29] tool
Children 2022, 9, 731 9 of 16
includes the assessment of muscle/fat loss in children as an indicator of malnutrition.Physical examination to determine loss of muscle and/or fat mass in children is consideredin the literature to be an “overly subjective” indicator [73]; however, physical contact withchild’s muscles, bones, and fat provides substantial empirical evidence of malnutritionthat is probably more “objective” than asking parents to report exactly what the weight orheight of their child is [74]. In practice, both a comprehensive physical examination and aninquiry of food intake are invaluable in diagnosing malnutrition in children [58,75].
Children may have poor eating habits that may continue during formal health educa-tion after the age of 18 years [76]. Poor food intake should be associated with fat and/ormuscle loss, weight loss, poor body growth and other symptoms [33]. Poor food intakefor two to three days can lead to malnutrition in at-risk children, in contrast to well-fedchildren without disease or other complex medical conditions [73]. We have found thatexisting NSTs often include nutrition-related issues [22–24,36–38,40–43,48,49,52,53,69].
In our developed tool, we ask about poor weight gain over the last few months [38],similar to other NSTs which ask parents for subjective opinion of weight gain such as pooror minimal weight gain in child [23,48]. Other published paediatric NSTs often includeanthropometric measurements of body weight [24,37,40,44,45] and height [24,40,44,45] forlater use of reference curves or growth tables [24,37,40]. Anthropometric measurementshave been found to be routinely poorly performed in hospitals at the time of admission [24].Existing paediatric NSTs also include ideal body weight [44,45], net weight change [47,50],percentage of weight loss [39,42,49,53,69] and BMI calculation [22,40,47,48,53]. For thesemeasurements and calculations, screening performers need prior education [22], train-ing [24], additional equipment [39], and the final assessment of screening is also influencedby the experience and qualifications of the performer [77]. Due to the above, we havepurposely developed a tool that does not include the necessary additional anthropometricmeasurements and calculations.
In the absence of a gold standard for the assessment of the nutritional status inhospitalised children, subjective malnutritional risk assessment by physician was usedas the criterion for developed NST and for the evaluation of its validity [7,40,43]. It hasbeen assumed that a subjective malnutritional risk assessment by a physician is mostlikely to be accurate, reflecting additional knowledge. The subjective malnutritional riskassessment has also been used as a reference standard in previous studies [24,78]; however,the use of other existing screening or assessment nutritional tools as a reference standardfor determining the nutritional status or risk of malnutrition in hospitalised children is notrecommended [7].
Measured properties that are important for the usability of a new screening tool in-clude at least the results of sensitivity, specificity, positive and negative predictive values,reliability, and validity [7,54]. For the tool to be truly effective, it should identify thoseindividuals who are really at risk, so the measured values of sensitivity, specificity, andpredictive values should be high [21,26,54,79–82]. Our study demonstrates a strong validityof SPENS, with the ROC analysis indicating the validity of the tool to be excellent whenassessed against subjective malnutritional risk assessment. Sensitivity, specificity, positiveand negative predictive value of SPENS were 93.3%, 91.3%, 87.5% and 95.5%, respectively.Lu et al. [40] explained that NSTs should have a high sensitivity to minimize the number offalse-negative results [82]. Further, sensitivity is more important than specificity, becausea false-positive result will only subject the patient to a detailed nutritional assessment,whereas a false negative result can result in an undetected condition [78]. A highly sen-sitive test is clinically important when identifying a serious but treatable condition likemalnutrition, with the main purpose of an NST being to minimize subjects who are atrisk of malnutrition being overlooked and not referred for nutritional assessment andintervention [43]; therefore, based on the results, the SPENS is a very reliable NST. Asreported in a comprehensive systematic review of 26 validation studies [7], the sensitivityof the tools ranged from 15% to 100% and the specificity ranged between 0% and 96.54%.The use of different reference standards could be the reason for differences among the

Children 2022, 9, 731 10 of 16
studies [7,21,26,40,79,81]. Due to the heterogeneity of reference standards, and differentlimit values, it is almost impossible to compare different NSTs with each other and concludewhich is the best [7]; moreover, comparing the relative advantages of different NSTs ismisleading, as different tools have been designed for different diagnostic and/or prognosticpurposes [83].
Completion of SGNA is lengthy and time-consuming. SGNA is classified as a nutri-tional assessment aid form and not as an NST, it detects children with already developedmalnutrition more than children at risk of malnutrition [81]; nevertheless, many NSTs havebeen validated with SGNA. In the study of White et al. [38] the sensitivity and specificityfor the PNST compared with the paediatric SGNA were fair [7], scoring 77.8% and 82.1%, re-spectively. The sensitivity and specificity for the SGNA compared with the WHO and CDC2000 criteria were fair (BMI: Se = 96.5%, Sp = 72.5%; WFA: Se = 85.7%, Sp = 69.7%) or poor(HFA: Se = 46.2%, Sp = 66.5%) [7,38]. SGNA were relatively poor at detecting patients whowere stunted or overweight, with a sensitivity and specificity < 67%. Gerasimidis et al. [84]compared STAMP, PYMS, and SGNA to a full dietetic assessment. They found that SGNApoorly identified malnourished children (Se = 15%, Sp = 100%). The agreement between theSGNA and the PYMS were slight (κ = 0.12; 95% CI −0.11, −0.34) and agreement betweenthe SGNA and dietetic assessment were fair (κ = 0.24; 95% CI 0.10, 0.50) [84]. In otherstudies, SGNA has also been used as a reference standard for the nutritional status ofhospitalised children [38,43], which is not recommended [7]. The sensitivity and specificityof the SPENS when compared to SGNA was good (Se = 92.9%, Sp = 87.5%).
Sequential sampling should be used to avoid bias and to make the screening toolsuitable for all clinical features and age groups of children [7]. Therefore, we also usedsequential sampling in this study. The number of children involved in research for thedevelopment and/or validating of NSTs is like other studies [24,41,43,48,49,53].
In some cases, screening performers report that NSTs are time-consuming [40,85], im-practical for use in all hospitalised children, and would increase daily workload [86]. Moreoften, it is reported that NSTs are fast [24,37,38,43,50,53] and simple [24,38,43,48,50,52,53].The results of the screening with developed SPENS are obtained by a quick physical ex-amination of the child and two simple questions that each parent and/or the child knowshow to answer; it does not include anthropometric measurements, the use of tables, othernecessary calculations, and invasive interventions like the PNST [38] and Nutrition screen-ing tool for childhood cancer (SCAN) [43]. Due to the above, the implementation of ourtool should not represent time complications even in the continuous work of health careproviders. Compared with Pediatric Nutritional Screening Score (PNSS), STAMP, St An-drews Healthcare Nutrition Screening Instrument (SANSI), Patient-Generated SubjectiveGlobal Assessment of nutritional status (PG-SGA), Clinical Assessment of Nutritional Sta-tus and the Score (CANSCORE) and SGNA, which are time-consuming [40,81,85], SPENSwas efficient, fast (approx. 1–2 min), simple, easy, and practical to use. Screening withPNSS, SANSI and PG-SGA tools took 10 min to complete [40,46,53], while STAMP wascompleted in 10 to 15 min [79]. PNSS and STAMP require the interpretation of growthcharts, SANSI and PG-SGA require prior weight knowledge and BMI and/or weightloss/change calculations and CANSCORE is a scoring system based on nine ‘superficial’readily detectable signs of malnutrition [51].
An important part of the limitations in the development of tools is the level of readingcomprehension, ambiguity, jargon, positive and negative text, and words that each per-former can interpret in their own way [54]. In the SPENS, the first two questions contain aconcrete descriptive explanation of what child’s body part should look like for the screeningperformer to confirm the answer as positive.
Similarly to the Pediatric Digital Scaled MAlnutrition Risk screening Tool (PeDiS-MART) [37], SPENS can be integrated into an existing computer program at the clinic,which employees already used to manage the treatment and care interventions of hospi-talised children; this would allow for a quick calculation, ease of use and time savings forthe final screening result.

Children 2022, 9, 731 11 of 16
Due to the simplicity of the SPENS, we believe that the screening performer does notneed prior education or training like in the case of the NST PYMS [22,84], STAMP [24],PeDiSMART [37] or SANSI [53]. To overcome the usual barrier to performing screening ina clinical setting, it is important that the introduction of NSTs into the clinical setting doesnot require special training on its use and interpretation, and that its completion does nottake much time [43].
According to ASPEN’s four principles, NSTs should include at least the first three [87].The SPENS does include the first three principles, but not the fourth principle relatedto “Disease severity”. The latter is also not included in CANSCORE [51], SANSI [53],PNST [38], Paediatric Nutrition Rescreening Tool (PNRT) [41], Infant Early NutritionWarning Score (iNEWS) [52] and two NSTs designed for children with cystic fibrosis [47,48].
We suggest that the nutritional screening with the SPENS is performed directly atadmission or in the first 24 hours after the child is admitted and is repeated weeklyduring the child’s hospitalization. Other authors of NSTs similarly define the time ofscreening [22,23,37,38,40,43,49,50,53]. Continuous nutritional screening of the child duringhospitalization helps to identify those whose nutritional status is deteriorating [33].
First, the main limitation of this exploratory study is the relatively small sample.During the SARS-CoV-2 pandemic, the number of hospitalizations was lower, researchers’access to the clinic was reduced due to measures, and some parents refused to participatedue to fear of COVID-19 infection.
Second, the inter-rater reliability of the tool in yielding the same patients by differentassessors was not assessed. And the intra-rater reliability of the tool in the same patientsby the same assessor on two occasions (within 24 h period) also was not assessed. Dueto SARS-CoV-2 pandemic, restricted measures at the clinic and staffs work overload alsoproduced some limitations. Further studies will focus on the inter and intra-rater reliability,validity, and effectiveness of SPENS in larger number of hospitalised children.
Last, our study was a single-centre case study. A multicentre prospective cohort studywould allow the cross-validation of the developed tool in a more diverse demographic.
According to the recommendations [7], the published NSTs are not completely valid,reliable, useful, and acceptable for patients and screening providers. Further research isneeded to confirm the applicability of each existing screening tool in the clinical setting [7,81]while further research, refinement and development of the tools are needed.
5. Conclusions
The results of our study justify the introduction of screening to determine the risk ofmalnutrition in hospitalised children in regular clinical practice. The SPENSs validationresults are very high, which means that only a few more steps of modification (integrationinto the clinic’s computer program) would be needed to get the tool ready for routine usein the clinical setting. SPENS is simple, fast, easy, and practical to use; it can be performedby nurses, physicians, and dieticians without special training, and does not require anyanthropometric measurements and is not specific for any disease and age of a child. SPENSalso includes the first three ASPEN’s principles.
Children 2022, 9, 731 12 of 16
Supplementary Materials: The following supporting information can be downloaded at: https://www.mdpi.com/article/10.3390/children9050731/s1, Supplementary Material S1: Inclusion andexclusion criteria; Supplementary Material S2: Questionnaire’s content sets; Supplementary MaterialS3: Indicators of malnutritional status using anthropometric measures; Supplementary Material S4:Characterization of the study sample.
Author Contributions: Conceptualization, P.K., M.P., N.M.V. and P.P.B.; methodology, P.K., M.P.,N.M.V. and P.P.B.; software, P.K. and P.P.B.; validation, P.K. and P.P.B.; formal analysis, P.K and P.P.B.;investigation, P.K., N.M.V., M.M. and S.G.J.; resources, P.K., N.M.V., M.M. and S.G.J.; data curation,P.K. and P.P.B.; writing—original draft preparation P.K. and P.P.B.; writing—review and editing, P.K.,M.P., N.M.V., M.M., S.G.J. and P.P.B.; visualization, P.K. and P.P.B.; supervision, M.P., N.M.V. andP.P.B.; project administration, P.K., M.P., N.M.V. and P.P.B. All authors have read and agreed to thepublished version of the manuscript.
Funding: This research received no external funding.
Institutional Review Board Statement: The study was carried out in a qualified institution and wasconducted in accordance with the provisions of the Declaration of Helsinki, the Oviedo Convention,and the principles of the Slovenian Code of Medical Deontology. Ethical approval was obtained fromthe Commission of the republic of Slovenia for Medical ethics (approval number 0120-329/2016-3KME 40/07/1, date of approval 7 September 2016). Site-specific approval was obtained for theinvolved hospital.
Informed Consent Statement: Informed consent was obtained from all subjects involved in thestudy. Written informed consent has been obtained from the patient(s) to publish this paper.
Data Availability Statement: The data supporting this study’s findings are available from thecorresponding author upon reasonable request.
Acknowledgments: The authors would like to thank all the participant children and their parents,and the health staff and to the management of the paediatric clinic for their cooperation in this study.
Conflicts of Interest: The authors declare no conflict of interest.
Abbreviations
ASPEN American Society for Parenteral and Enteral NutritionESPHAGAN European Society for Paediatric Gastroenterology, Hepatology and NutritionWHO World Health OrganizationCDC Centres for Disease Control and PreventionBMI Body Mass IndexMUAC Mid Upper Arm CircumferenceWFH/L Weight-for-height/lengthHFA Height-for-ageAUC Area under the ROC curveSe SensitivitySp SpecificityNPV Negative predictive valuePPV Positive predictive valueSGNA Subjective Global Nutritional AssessmentSGA Subjective Global AssessmentPNST Paediatric Nutrition Screening ToolSTAMP Screening Tool for the Assessment of Malnutrition in PaediatricsPYMS Paediatric Yorkhill Malnutrition ScoreSCAN Nutrition Screening tool for childhood CancerPNSS Pediatric Nutritional Screening ScoreSANSI St Andrews Healthcare Nutrition Screening InstrumentPG-SGA Patient-Generated Subjective Global Assessment of nutritional statusCANSCORE Clinical Assessment of Nutritional Status and the ScorePeDiSMART Pediatric Digital Scaled MAlnutrition Risk screening ToolPNRT Paediatric Nutrition Rescreening Tool
Children 2022, 9, 731 13 of 16
iNEWS Infant Early Nutrition Warning ScoreSPENS Simple PEdiatric Nutritional risk Screening tool
References1. Walson, J.L.; Berkley, J.A. The impact of malnutrition on childhood infections. Curr. Opin. Infect. Dis. 2018, 31, 231–236. [CrossRef]
[PubMed]2. Murphy, A.J.; Hill, R.J.; Buntain, H.; White, M.; Brookes, D.; Davies, P.S.W. Nutritional status of children with clinical conditions.
Clin. Nutr. 2017, 36, 788–792. [CrossRef]3. Nass, S.S.; Nass, N.S.; Iliyasu, Z.; Suleiman, B.; Yahaya, S.; Habibu, B.; Sani, A.; Suleiman, M.; Gachi, A.S. Determinants of Mortality
Among Severely Malnourished Children in Northern Nigeria. Health Serv Res Manag. Epidemiol 2021, 8, 23333928211064089.[CrossRef] [PubMed]
4. Nützenadel, W. Failure to thrive in childhood. Dtsch. Arztebl. Int. 2011, 108, 642–649. [CrossRef]5. Hulst, J.M.; van Goudoever, J.B.; Zimmermann, L.J.; Hop, W.C.; Albers, M.J.; Tibboel, D.; Joosten, K.F.M. The effect of cumulative
energy and protein deficiency on anthropometric parameters in a pediatric ICU population. Clin. Nutr. 2004, 23, 1381–1389.[CrossRef] [PubMed]
6. McCarthy, A.; Delvin, E.; Marcil, V.; Belanger, V.; Marchand, V.; Boctor, D.; Rashid, M.; Noble, A.; Davidson, B.; Grolea, V.; et al.Prevalence of Malnutrition in Pediatric Hospitals in Developed and In-Transition Countries: The Impact of Hospital Practices.Nutrients 2019, 11, 236. [CrossRef] [PubMed]
7. Klanjsek, P.; Pajnkihar, M.; Marcun Varda, N.; Povalej Brzan, P. Screening and assessment tools for early detection of malnutritionin hospitalised children: A systematic review of validation studies. BMJ Open 2019, 9, e025444. [CrossRef]
8. Hecht, C.; Weber, M.; Grote, V.; Daskalou, E.; Dell’Era, L.; Flynn, D.; Gerasimidis, K.; Gottrand, F.; Hartman, C.; Hulst, J.; et al.Disease associated malnutrition correlates with length of hospital stay in children. Clin. Nutr. 2015, 34, 53–59. [CrossRef]
9. Jacquot, A.; Valla, F.V.; Mura, T.; Tume, L.N.M.; Bertet, H.; Ford-Chessel, C.; Milesi, C.; Cambonie, G.; de Luca, A.;Gaillard-Le Roux, B. NUTRI-REAPED study: Nutritional assessment of French critically ill children and nutrition practice surveyin French-speaking pediatric intensive care units. Ann. Intensive Care 2019, 9, 15. [CrossRef]
10. Diamanti, A.; Cereda, E.; Capriati, T.; Giorgio, D.; Brusco, C.; Liguori, A.; Raponi, M. Prevalence and outcome of malnutrition inpediatric patients with chronic diseases: Focus on the settings of care. Clin. Nutr. 2018, 38, 1877–1882. [CrossRef]
11. Meyer, R.; Wright, K.; Vieira, M.C.; Chong, K.W.; Chatchatee, P.; Vlieg-Boerstra, B.J.; Groetch, M.; Dominguez-Ortega, G.;Heath, S.; Lang, A.; et al. International survey on growth indices and impacting factors in children with food allergies. J. Hum.Nutr Diet. 2019, 32, 175–184. [CrossRef]
12. Chang, Y.C.; Thew, M.; Hettich, K.; Nugent, M.; Simpson, P.; Jay, M.S. Adolescent Inpatients With Eating Disorders: ComparisonBetween Acute and Chronic Malnutrition States on a Refeeding Protocol. Glob. Pediatr. Health 2019, 6, 2333794x19839780.[CrossRef] [PubMed]
13. Leroue, M.K.; Good, R.J.; Skillman, H.E.; Czaja, A.S. Enteral Nutrition Practices in Critically Ill Children Requiring NoninvasivePositive Pressure Ventilation. Pediatr. Crit. Care Med. 2017, 18, 1093–1098. [CrossRef] [PubMed]
14. Erdemir, G.; Ozkan, T.B.; Ozgur, T.; Altay, D.; Cavun, S.; Goral, G. Helicobacter pylori Infection in Children: Nutritional Statusand Associations with Serum Leptin, Ghrelin, and IGF-1 Levels. Helicobacter 2016, 21, 317–324. [CrossRef] [PubMed]
15. Ross, F.; Latham, G.; Joffe, D.; Richards, M.; Geiduschek, J.; Eisses, M.; Thompson, D.; Radman, M. Preoperative malnutrition isassociated with increased mortality and adverse outcomes after paediatric cardiac surgery. Cardiol. Young 2017, 27, 1716–1725.[CrossRef]
16. Koc, N.; Gunduz, M.; Tavil, B.; Azik, M.F.; Coskun, Z.; Yardimci, H.; Uckan, D.; Tunc, B. Beneficial Effect of the NutritionalSupport in Children Who Underwent Hematopoietic Stem Cell Transplant. Exp. Clin. Transplant. 2017, 15, 458–462. [CrossRef]
17. Sangermano, M.; D’Aniello, R.; Massa, G.; Albano, R.; Pisano, P.; Budetta, M.; Scuccimarra, G.; Papa, E.; Coppola, G.; Vajro, P.Nutritional problems in children with neuromotor disabilities: An Italian case series. Ital. J. Pediatr. 2014, 40, 61. [CrossRef]
18. Huysentruyt, K.; Hulst, J.; Bian, F.; Shamir, R.; White, M.; Galera-Martinez, R.; Morais-Lopez, A.; Kansu, A.; Gerasimidis, K.Opinions and practices of healthcare professionals on assessment of disease associated malnutrition in children: Results from aninternational survey. Clin. Nutr. 2019, 38, 708–714. [CrossRef]
19. Reber, E.; Gomes, F.; Vasiloglou, M.F.; Schuetz, P.; Stanga, Z. Nutritional Risk Screening and Assessment. J. Clin. Med. 2019,8, 1065. [CrossRef]
20. Marcun Varda, N.; Mocnik, M. Polyarteritis nodosa in a 6-year-old girl–a case report and overview of current managementtechniques of the disease in paediatric patients. AMB 2019, 12, 55–60.
21. Hulst, J.M.; Huysentruyt, K.; Joosten, K.F. Pediatric screening tools for malnutrition: An update. Curr. Opin. Clin. Nutr. Metab.Care 2020, 23, 203–209. [CrossRef] [PubMed]
22. Gerasimidis, K.; Macleod, I.; Maclean, A.; Buchanan, E.; McGrogan, P.; Swinbank, I.; McAuley, M.; Wright, C.M.; Flynn, D.M.Performance of the novel Paediatric Yorkhill Malnutrition Score (PYMS) in hospital practice. Clin. Nutr. 2011, 30, 430–435.[CrossRef]
23. Hulst, J.M.; Zwart, H.; Hop, W.C.; Joosten, K.F. Dutch national survey to test the STRONG kids nutritional risk screening tool inhospitalized children. Clin. Nutr. 2010, 29, 106–111. [CrossRef]

Children 2022, 9, 731 14 of 16
24. McCarthy, H.; Dixon, M.; Crabtree, I.; Eaton-Evans, M.J.; McNulty, H. The development and evaluation of the Screening Toolfor the Assessment of Malnutrition in Paediatrics (STAMP©) for use by healthcare staff. J. Hum. Nutr. Diet. 2012, 25, 311–318.[CrossRef] [PubMed]
25. Rub, G.M.; Marderfeld, L.; Shamir, R. Nutritional Screening Tools for Malnutrition in Pediatrics. In Handbook of Famine, Starvation,and Nutrient Deprivation; Preedy, V., Patel, V., Eds.; Springer: Berlin/Heidelberg, Germany, 2019; pp. 665–681.
26. Lee, Y.J. Nutritional Screening Tools among Hospitalized Children: From Past and to Present. Pediatr. Gastroenterol. Hepatol. Nutr.2018, 21, 79–85. [CrossRef] [PubMed]
27. Canadian Malnutrition Task Force. Subjective Global Nutrition Assessment Form (SGNA). Available online: https://nutritioncareincanada.ca/sites/default/uploads/files/Pediatrics/Subjective_Global_Nutrition_Assessment_Form(SGNA).pdf (accessed on 16 May 2022).
28. Secker, D.J.; Jeejeebhoy, K.N. Subjective global nutritional assessment for children. Am. J. Clin. Nutr. 2007, 85, 1083–1089.[CrossRef] [PubMed]
29. Secker, D.J.; Jeejeebhoy, K.N. How to perform Subjective Global Nutritional assessment in children. J. Acad. Nutr. Diet. 2012, 112,424–431.e6. [CrossRef]
30. Creswell, J.; Plano Clark, V. Designing and Conducting Mixed Methods Research, 3rd ed.; Knight, V., Ed.; SAGE publication: LosAngeles, CA, USA, 2017.
31. Polit, D.F.; Beck, C.T. Nursing Research: Generating and Assessing Evidence for Nursing Practice, 11th ed.; Wolters Kluwer, LippincottWilliams & Wilkins: Philadelphia, PA, USA, 2020; pp. 798–802.
32. Starc, G.; Strel, J.; Kovac, M.; Leskošek, B.; Jurak, G. SLOfit 2015-Analiza Telesnega in Gibalnega Razvoja Otrok in Mladine SlovenskihOsnovnih in Srednjih šol v šolskem Letu 2014/2015; Univerza v Ljubljani Fakulteta za šport: Ljubljana, Slovenija, 2015; pp. 66–70.
33. Bouma, S. Diagnosing Pediatric Malnutrition Paradigm Shifts of Etiology-Related Definitions and Appraisal of the Indicators.Nutr. Clin. Pract. 2017, 32, 52–67. [CrossRef]
34. Green Corkins, K.G. Nutrition-focused physical examination in pediatric patients. Nutr. Clin. Pract. 2015, 30, 203–209. [CrossRef]35. Hsieh, H.F.; Shannon, S.E. Three approaches to qualitative content analysis. Qual. Health Res. 2005, 15, 1277–1288. [CrossRef]36. Sermet-Gaudelus, I.; Poisson-Salomon, A.S.; Colomb, V.; Brusset, M.C.; Mosser, F.; Berrier, F.; Ricour, C. Simple pediatric
nutritional risk score to identify children at risk of malnutrition. Am. J. Clin. Nutr. 2000, 72, 64–70. [CrossRef] [PubMed]37. Karagiozoglou-Lampoudi, T.; Daskalou, E.; Lampoudis, D.; Apostolou, A.; Agakidis, C. Computer-based malnutrition risk
calculation may enhance the ability to identify pediatric patients at malnutrition-related risk for unfavorable outcome. JPEN J.Parenter. Enteral Nutr. 2015, 39, 418–425. [CrossRef] [PubMed]
38. White, M.; Lawson, K.; Ramsey, R.; Dennis, N.; Hutchinson, Z.; Soh, X.Y.; Matsuyama, M.; Doolan, A.; Todd, A.; Elliott, A. ASimple Nutrition Screening Tool for Pediatric Inpatients. JPEN J. Parenter. Enteral. Nutr. 2016, 40, 392–398. [CrossRef]
39. Wong Vega, M.; Beer, S.; Juarez, M.; Srivaths, P.R. Malnutrition Risk in Hospitalized Children: A Descriptive Study of Malnutrition-Related Characteristics and Development of a Pilot Pediatric Risk-Assessment Tool. Nutr. Clin. Pract. 2018, 34, 406–413. [CrossRef]
40. Lu, L.; Mao, X.; Sheng, J.; Huang, J.; Wang, Y.; Tang, Q.; Cai, W. Development and validation of a pediatric nutritional screeningscore (PNSS) for hospitalized children. Asia Pac. J. Clin. Nutr. 2018, 27, 65–71. [CrossRef]
41. White, M.S.; Ziemann, M.; Doolan, A.; Song, S.Q.; Bernard, A. A simple nutrition screening tool to identify nutritional deteriorationin long stay paediatric inpatients: The paediatric nutrition rescreening tool (PNRT). Clin. Nutr. ESPEN 2019, 34, 55–60. [CrossRef][PubMed]
42. Baker, J.P.; Detsky, A.S.; Wesson, D.E.; Wolman, S.L.; Stewart, S.; Whitewell, J.; Langer, B.; Jeejeebhoy, K.N. Nutritional assessment:A comparison of clinical judgment and objective measurements. N. Engl. J. Med. 1982, 306, 969–972. [CrossRef]
43. Murphy, A.J.; White, M.; Viani, K.; Mosby, T.T. Evaluation of the nutrition screening tool for childhood cancer (SCAN). Clin. Nutr.2016, 35, 219–224. [CrossRef]
44. Ladas, E.J.; Sacks, N.; Meacham, L.; Henry, D.; Enriquez, L.; Lowry, G.; Hawkes, R.; Dadd, G.; Rogers, P. A multidisciplinaryreview of nutrition considerations in the pediatric oncology population: A perspective from children’s oncology group. Nutr.Clin. Pract. 2005, 20, 377–393. [CrossRef]
45. Ringwald-Smith, K.; Cartwright, C.; Mosby, T.T. Chapter 11: Medical nutrition therapy in pediatric oncology. In The ClinicalGuide to Oncology Nutrition; Elliott, L., Molseed, L.L., McCallum, P.D., Eds.; American Dietetic Associati: Chicago, Ill, USA, 2006;pp. 110–124.
46. Vázquez de la Torre, M.J.; Stein, K.; Vásquez Garibay, E.M.; Kumazawa Ichikawa, M.R.; Troyo Sanromán, R.; Salcedo Flores, A.G.;Zubieta, F.A.S. Patient-Generated Subjective Global Assessment of nutritional status in pediatric patients with recent cancerdiagnosis. Nutr. Hosp. 2017, 34, 1050–1058. [CrossRef]
47. McDonald, C.M. Validation of a nutrition risk screening tool for children and adolescents with cystic fibrosis ages 2–20 years. J.Pediatr. Gastroenterol. Nutr. 2008, 46, 438–446. [CrossRef]
48. Souza Dos Santos Simon, M.I.; Forte, G.C.; da Silva Pereira, J.; da Fonseca Andrade Procianoy, E.; Drehmer, M. Validation of aNutrition Screening Tool for Pediatric Patients with Cystic Fibrosis. J. Acad. Nutr. Diet. 2016, 116, 813–818. [CrossRef] [PubMed]
49. Mezoff, A.; Gamm, L.; Konek, S.; Beal, K.G.; Hitch, D. Validation of a nutritional screen in children with respiratory syncytialvirus admitted to an intensive care complex. Pediatrics 1996, 97, 543–546. [PubMed]
50. Johnson, M.J.; Pearson, F.; Emm, A.; Moyses, H.E.; Leaf, A.A. Developing a new screening tool for nutritional risk in neonatalintensive care. Acta. Paediatr. 2015, 104, e90–e93. [CrossRef] [PubMed]

Children 2022, 9, 731 15 of 16
51. Metcoff, J. Clinical Assessment of Nutritional Status at Birth: Fetal Malnutrition and SGA Are Not Synonymous. Pediatr. Clin. N.Am. 1994, 41, 875–891. [CrossRef]
52. Gerasimidis, K.; Milani, S.; Tester, A.; Purcell, O.; Woodley, C.; Tsiountsioura, M.; Koulieri, A.; Zerva, O.; Loizou, K.; Rafeey, M.A multicentre development and evaluation of a dietetic referral score for nutritional risk in sick infants. Clin. Nutr. 2019, 38,1636–1642. [CrossRef]
53. Rowell, A.; Long, C.; Chance, L.; Dolley, O. Identification of nutritional risk by nursing staff in secure psychiatric settings:Reliability and validity of St Andrew’s Nutrition Screening Instrument. J. Psychiatr. Ment. Health Nurs. 2012, 19, 722–728.[CrossRef]
54. Streiner, D.L.; Norman, G.R.; Cairney, J. Devising the items. In Health Measurement Scales: A Practical Guide to Their Developmentand Use, 5th ed.; Oxford University Press: New York, NY, USA, 2015; pp. 19–37.
55. World Health Organization and the United Nations Children’s Fund (UNICEF). Recommendations for Data Collection, Analysis andReporting on Anthropometric Indicators in Children under 5 Years Old; World Health Organization and the United Nations Children’sFund (UNICEF): Geneva, Switzerland, 2019; pp. 35–51.
56. Chou, J. PediTools Electronic Growth Chart Calculators: Applications in Clinical Care, Research, and Quality Improvement. J.Med. Internet Res. 2020, 22, e16204. Available online: https://peditools.org (accessed on 2 April 2022). [CrossRef]
57. World Health Organization. Child Growth Standards: WHO Anthro Survey Analyser and other Tools 2016. Available online:http://www.who.int/childgrowth/software/en/ (accessed on 2 April 2022).
58. Becker, P.J.; Carney, L.N.; Corkins, M.R.; Monczka, J.; Smith, E.; Smith, S.E.; Spear, B.A.; White, J.V.; Academy of Nutrition andDietetics. Consensus statement of the Academy of Nutrition and Dietetics/American Society for Parenteral and Enteral Nutrition:Indicators recommended for the identification and documentation of pediatric malnutrition (undernutrition). J. Acad. Nutr. Diet.2014, 114, 1988–2000. [CrossRef]
59. Cole, T.J.; Bellizzi, M.C.M.; Flegal, K.M.; Dietz, W.H. Establishing a standard definition for child overweight and obesityworldwide: International survey. BMJ 2000, 320, 1240–1243. [CrossRef]
60. IBM. IBM SPSS Statistics. Available online: https://www.ibm.com/products/spss-statistics (accessed on 22 March 2022).61. RStudio: Integrated Development for R. Available online: https://www.rstudio.com/ (accessed on 21 March 2022).62. Genuer, R.; Poggi, J.-M.; Tuleau-Malot, C. VSURF: An R package for variable selection using random forests. R J. 2015, 7, 19–33.
[CrossRef]63. Landis, J.R.; Koch, G.G. The measurement of observer agreement for categorical data. Biometrics 1977, 33, 159–174. [CrossRef]64. van Bokhorst-de van der Schueren, M.A.; Guaitoli, P.R.; Jansma, E.P.; de Vet, H.C. Nutrition screening tools: Does one size fit all?
A systematic review of screening tools for the hospital setting. Clin. Nutr. 2014, 33, 39–58. [CrossRef] [PubMed]65. Mathisen, B.; Worrall, L.; Masel, J.; Wall, C.; Shepherd, R.W. Feeding problems in infants with gastro-oesophageal reflux disease:
A controlled study. J. Paediatr. Child. Health 1999, 35, 163–169. [CrossRef] [PubMed]66. Klanjsek, P.; Pajnkihar, M. Causes of inadequate intake of nutrients during the treatment of children with chemotherapy. Eur. J.
Oncol. Nurs. 2016, 23, 24–33. [CrossRef] [PubMed]67. Benfer, K.A.; Weir, K.A.; Ware, R.S.; Davies, P.S.W.; Arvedson, J.; Boyd, R.N.; Bell, K.L. Parent-reported indicators for detecting
feeding and swallowing difficulties and undernutrition in preschool-aged children with cerebral palsy. Dev. Med. Child. Neurol.2017, 59, 1181–1187. [CrossRef]
68. Dahl, M.; Thommessen, M.; Rasmussen, M.; Selberg, T. Feeding and nutritional characteristics in children with moderate orsevere cerebral palsy. Acta Paediatr. 1996, 85, 697–701. [CrossRef]
69. Canadian Malnutrition Task Force. Subjective Global Assessment Form. Available online: https://nutritioncareincanada.ca/sites/default/uploads/files/SGA%20Tool%20EN%20BKWT_2017.pdf (accessed on 11 January 2022).
70. Freijer, K.; van Puffelen, E.; Joosten, K.F.; Hulst, J.M.; Koopmanschap, M.A. The costs of disease related malnutrition in hospitalizedchildren. Clin. Nutr. ESPEN 2018, 23, 228–233. [CrossRef]
71. Gambra-Arzoz, M.; Alonso-Cadenas, J.A.; Jiménez-Legido, M.; López-Giménez, M.R.; Martín-Rivada, Á.; de Los Ángeles Martínez-Ibeas, M.;Cañedo-Villarroya, E.; Pedrón-Giner, C. Nutrition Risk in Hospitalized Pediatric Patients: Higher Complication Rate and HigherCosts Related to Malnutrition. Nutr. Clin. Pract. 2020, 35, 157–163. [CrossRef]
72. Dipasquale, V.; Cucinotta, U.; Romano, C. Acute Malnutrition in Children: Pathophysiology, Clinical Effects and Treatment.Nutrients 2020, 12, 2413. [CrossRef]
73. American Society for Parenteral and Enteral Nutrition. Pediatric Malnutrition: Frequently Asked Questions. Available online:https://www.nutritioncare.org/Guidelines_and_Clinical_Resources/Toolkits/Malnutrition_Toolkit/Related_Publications/ (ac-cessed on 11 February 2022).
74. Akerman, A.; Williams, M.E.; Meunier, J. Perception versus reality: An exploration of children’s measured body mass in relationto caregivers’ estimates. J. Health Psychol. 2007, 12, 871–882. [CrossRef]
75. Academy Quality Management Committee. Academy of Nutrition and Dietetics: Revised 2017 Scope of Practice for the Nutritionand Dietetics Technician, Registered. J. Acad. Nutr. Diet. 2018, 118, 327–342. [CrossRef] [PubMed]
76. Žnidaric, M.; Zavodnik, I.; Šrajer, L.L. Lifestyle of medical students. AMB 2020, 13, 41–49.77. Mahdavi, A.M.; Ostadrahimi, A.; Safaiyan, A. Subjective global assessment of nutritional status in children. Matern. Child. Nutr.
2010, 6, 374–381. [CrossRef] [PubMed]
Children 2022, 9, 731 16 of 16
78. Rub, G.; Marderfeld, L.; Poraz, I.; Hartman, C.; Amsel, S.; Rosenbaum, I.; Pergamentzev-Karpol, S.; Monsonego-Ornan, E.;Shamir, R. Validation of a Nutritional Screening Tool for Ambulatory Use in Pediatrics. J. Pediatr. Gastroenterol. Nutr. 2016, 62,771–775. [CrossRef] [PubMed]
79. Joosten, K.F.; Hulst, J.M. Nutritional screening tools for hospitalized children: Methodological considerations. Clin. Nutr. 2014,33, 1–5. [CrossRef]
80. Rinninella, E.; Ruggiero, A.; Maurizi, P.; Triarico, S.; Cintoni, M.; Mele, M.C. Clinical tools to assess nutritional risk andmalnutrition in hospitalized children and adolescents. Eur. Rev. Med. Pharmacol. Sci. 2017, 21, 2690–2701.
81. Moeeni, V.; Day, A.S. Nutritional Risk Screening Tools in Hospitalised Children. Int. J. Child. Health Nutr. 2012, 1, 39–43.82. Teixeira, A.F.; Viana, K.D.A.L. Nutritional screening in hospitalized pediatric patients: A systematic review. J. Pediatr. (Rio J.) 2016,
92, 343–352. [CrossRef]83. Elia, M.; Stratton, R.J. Considerations for screening tool selection and role of predictive and concurrent validity. Curr. Opin. Clin.
Nutr. Metab. Care 2011, 14, 425–433. [CrossRef]84. Gerasimidis, K.; Keane, O.; Macleod, I.; Flynn, D.M.; Wright, C.M. A four-stage evaluation of the Paediatric Yorkhill Malnutrition
Score in a tertiary paediatric hospital and a district general hospital. Br. J. Nutr. 2010, 104, 751–756. [CrossRef] [PubMed]85. Soundarya, M.; Basavaprabhu, A.; Raghuveera, K.; Baliga, B.; Shivanagaraja, B. Comparative Assessment of Fetal Malnutrition by
Anthropometry and CAN Score. Iran. J. Pediatr. 2012, 22, 70–76. [PubMed]86. Gerasimidis, K.; Macleod, I.; Finlayson, L.; McGuckin, C.; Wright, C.; Flynn, D.; McGrogan, P.; Maclean, A.; Love, E.; Swinbank, I.; et al.
Introduction of Paediatric Yorkhill Malnutrition Score–challenges and impact on nursing practice. J. Clin. Nurs. 2012, 21,3583–3586. [CrossRef] [PubMed]
87. Kondrup, J.; Allison, S.P.; Elia, M.; Vellas, B.; Plauth, M. ESPEN guidelines for nutrition screening 2002. Clin. Nutr. 2003, 22,415–421. [CrossRef]
Related Documents