Original Study Development and Validation of a Multidimensional Prognostic Index for Mortality Based on a Standardized Multidimensional Assessment Schedule (MPI-SVaMA) in Community-Dwelling Older Subjects Alberto Pilotto MD a, *, Pietro Gallina MD b , Andrea Fontana MSc c , Daniele Sancarlo MD d , Salvatore Bazzano PsyD a , Massimiliano Copetti MSc c , Stefania Maggi MD e , Giulia Paroni BiolD d , Francesco Marcato MSc b , Fabio Pellegrini MSc c, f , Daniele Donato MD b , Luigi Ferrucci MD, PhD g a Geriatrics Unit, Azienda ULSS 16 Padova, S. Antonio Hospital, Padova, Italy b Health Services Directorate, Azienda ULSS 16 Padova, Padova, Italy c Unit of Biostatistics, IRCCS Casa Sollievo della Sofferenza, San Giovanni Rotondo (FG), Italy d Gerontology & Geriatrics Research Laboratory, IRCCS Casa Sollievo della Sofferenza, San Giovanni Rotondo (FG), Italy e National Research Council, Aging Section, Padova, Italy f Laboratory of Clinical Epidemiology of Diabetes and Chronic Diseases, Consorzio Mario Negri Sud, Santa Maria Imbaro, Chieti, Italy g National Institute on Aging, Baltimore, MD Keywords: Comprehensive geriatric assessment prognosis mortality elderly abstract Objectives: To develop and validate a Multidimensional Prognostic Index (MPI) for mortality based on in- formation collected by the Multidimensional Assessment Schedule (SVaMA), the recommended standard tool for multidimensional assessment of community-dwelling older subjects in seven Italian regions. Design: Prospective cohort study. Participants: Community-dwelling subjects older than 65 years who underwent an SVaMA evaluation from 2004 to 2010 in Padova Health District, Veneto, Italy. Measurements: The MPI-SVaMA was calculated as a weighted (weights were derived from multivariate Cox regressions) linear combination of the following nine domains: age, sex, main diagnosis, and six scores, ie, the Short Portable Mental Status Questionnaire, the Barthel index (contains two domains: activities of daily living and mobility), the Exton-Smith scale, the Nursing Care Needs, and the Social Network Support by a structured interview. Subjects were followed for a median of 2 years; those who had not died were followed for at least 1 year. The MPI-SVaMA score ranged from 0 to 1 and 3 grades of severity of the MPI-SVaMA were calculated on the basis of estimated cutoffs. Discriminatory power and calibration were further assessed. Results: A total of 12,020 subjects (mean age 81.84 7.97 years) were included. Two random cohorts were selected: (1) a development cohort, ie, 7876 subjects (mean age 81.79 8.05, %females: 63.1) and (2) a validation cohort, ie, 4144 subjects (mean age: 81.95 7.83, %females: 63.7). The discriminatory power for mortality of MPI-SVaMA was 0.828 (95% CI 0.817e0.838) and 0.832 (95% CI 0.818e0.845) at 1 month and 0.791 (95% CI 0.784e0.798) and 0.792 (95% CI 0.783e0.802) at 1 year in development and validation cohorts, respectively. MPI-SVaMA results were well calibrated showing lower than 10% differences between predicted and observed mortality, both in development and validation cohorts. Conclusions: The MPI-SVaMA is an accurate and well-calibrated prognostic tool for mortality in community-dwelling older subjects, and can be used in clinical decision making. Copyright Ó 2013 - American Medical Directors Association, Inc. Mortality prediction in community-dwelling older subjects is useful for clinicians and researchers to identify the appropriate management of subjects (ie, to decide whether to administer a potentially harmful intervention to patients with limited life expectancy or establish eligibility to home-care programs and institutionalization). A recent study underlined the usefulness of predictive tools for mortality in clinical practice, 1 specifically in older adults. 2 Among several tools This work was supported by the Ministero della Salute, Italy, IRCCS Research Program 2009e2011, Line 2: “Malattie complesse” and by the Intramural Research Program of the National Institute of Aging, Baltimore, MD. The funders had no role in study design, data collection and analysis, decision to publish, or preparation of the manuscript. * Address correspondence to Alberto Pilotto, MD, Geriatrics Unit, Azienda ULSS 16 Padova, S. Antonio Hospital, Via Jacopo Facciolati, 71 Padova I-35127, Italy. E-mail address: [email protected] (A. Pilotto). JAMDA journal homepage: www.jamda.com 1525-8610/$ - see front matter Copyright Ó 2013 - American Medical Directors Association, Inc. http://dx.doi.org/10.1016/j.jamda.2013.01.005 JAMDA 14 (2013) 287e292

Welcome message from author
This document is posted to help you gain knowledge. Please leave a comment to let me know what you think about it! Share it to your friends and learn new things together.
Transcript
JAMDA 14 (2013) 287e292
JAMDA
journal homepage: www.jamda.com
Original Study
Development and Validation of a Multidimensional Prognostic Index for MortalityBased on a Standardized Multidimensional Assessment Schedule (MPI-SVaMA)in Community-Dwelling Older Subjects
Alberto Pilotto MD a,*, Pietro Gallina MDb, Andrea Fontana MSc c, Daniele Sancarlo MDd,Salvatore Bazzano PsyD a, Massimiliano Copetti MSc c, Stefania Maggi MD e, Giulia Paroni BiolD d,Francesco Marcato MSc b, Fabio Pellegrini MSc c,f, Daniele Donato MDb, Luigi Ferrucci MD, PhD g
aGeriatrics Unit, Azienda ULSS 16 Padova, S. Antonio Hospital, Padova, ItalybHealth Services Directorate, Azienda ULSS 16 Padova, Padova, ItalycUnit of Biostatistics, IRCCS Casa Sollievo della Sofferenza, San Giovanni Rotondo (FG), ItalydGerontology & Geriatrics Research Laboratory, IRCCS Casa Sollievo della Sofferenza, San Giovanni Rotondo (FG), ItalyeNational Research Council, Aging Section, Padova, Italyf Laboratory of Clinical Epidemiology of Diabetes and Chronic Diseases, Consorzio Mario Negri Sud, Santa Maria Imbaro, Chieti, ItalygNational Institute on Aging, Baltimore, MD
Keywords:Comprehensive geriatric assessmentprognosismortalityelderly
This work was supported by the Ministero dellaProgram 2009e2011, Line 2: “Malattie complesse” anProgram of the National Institute of Aging, Baltimore,in study design, data collection and analysis, decisionthe manuscript.* Address correspondence to Alberto Pilotto, MD, Ge
Padova, S. Antonio Hospital, Via Jacopo Facciolati, 71E-mail address: [email protected] (A
1525-8610/$ - see front matter Copyright � 2013 - Ahttp://dx.doi.org/10.1016/j.jamda.2013.01.005
a b s t r a c t
Objectives: To develop and validate a Multidimensional Prognostic Index (MPI) for mortality based on in-formation collected by the Multidimensional Assessment Schedule (SVaMA), the recommended standardtool for multidimensional assessment of community-dwelling older subjects in seven Italian regions.Design: Prospective cohort study.Participants: Community-dwelling subjects older than 65 years who underwent an SVaMA evaluationfrom 2004 to 2010 in Padova Health District, Veneto, Italy.Measurements: The MPI-SVaMA was calculated as a weighted (weights were derived from multivariateCox regressions) linear combination of the following nine domains: age, sex, main diagnosis, and sixscores, ie, the Short Portable Mental Status Questionnaire, the Barthel index (contains two domains:activities of daily living and mobility), the Exton-Smith scale, the Nursing Care Needs, and the SocialNetwork Support by a structured interview. Subjects were followed for a median of 2 years; those whohad not died were followed for at least 1 year. The MPI-SVaMA score ranged from 0 to 1 and 3 grades ofseverity of the MPI-SVaMA were calculated on the basis of estimated cutoffs. Discriminatory power andcalibration were further assessed.Results: A total of 12,020 subjects (mean age 81.84 � 7.97 years) were included. Two random cohortswere selected: (1) a development cohort, ie, 7876 subjects (mean age 81.79 � 8.05, %females: 63.1) and(2) a validation cohort, ie, 4144 subjects (mean age: 81.95 � 7.83, %females: 63.7).The discriminatory power for mortality of MPI-SVaMA was 0.828 (95% CI 0.817e0.838) and 0.832 (95% CI0.818e0.845) at 1 month and 0.791 (95% CI 0.784e0.798) and 0.792 (95% CI 0.783e0.802) at 1 year indevelopment and validation cohorts, respectively. MPI-SVaMA results were well calibrated showing lowerthan10%differences betweenpredicted andobservedmortality, both indevelopment andvalidation cohorts.Conclusions: The MPI-SVaMA is an accurate and well-calibrated prognostic tool for mortality incommunity-dwelling older subjects, and can be used in clinical decision making.
Copyright � 2013 - American Medical Directors Association, Inc.
Salute, Italy, IRCCS Researchd by the Intramural ResearchMD. The funders had no roleto publish, or preparation of
riatrics Unit, Azienda ULSS 16Padova I-35127, Italy.. Pilotto).
merican Medical Directors Associa
Mortality prediction in community-dwelling older subjects is usefulfor clinicians and researchers to identify the appropriate managementof subjects (ie, to decide whether to administer a potentially harmfulintervention to patients with limited life expectancy or establisheligibility to home-care programs and institutionalization). A recentstudy underlined the usefulness of predictive tools for mortality inclinical practice,1 specifically in older adults.2 Among several tools
tion, Inc.
A. Pilotto et al. / JAMDA 14 (2013) 287e292288
validated in different settings and populations to predict mortality, theMultidimensional Prognostic Index (MPI), developed and validated intwo independent cohorts of older patients hospitalized for acutedisease or relapse of a chronic disease,3 was well calibrated, anddemonstrated good discrimination,1,2 with the accuracy maintainedwhen the index was tested over 1 month or 1 year of follow-up.4
Interestingly, the MPI was based on multidimensional information,collected from a standardized Comprehensive Geriatric Assessment(CGA), that is, functional, cognitive, nutritional, comorbidity, medica-tion, and social network data, usually available at admission to an acuteward in most older patients, suggesting that the multidimensionalapproach is effective for evaluating prognosis in older patients.Different settings (ie, hospital, nursing home, and the community),however, may require different and specific predictive tools. With thisin mind, we developed and validated an MPI-SVaMA (StandardizedMultidimensional Assessment Schedule [Scheda per la ValutazioneMultidimensionale delle persone adulte e Anziane]) predictive ofmortality at 1-month and 1-year follow-up using information from theSVaMA, the standard assessment tool to establish access to theNational Health System resources in the Veneto Region of Italy.
Material and Methods
Study Population
The present was a cohort prospective study conducted according tothe Declaration of Helsinki, the guidelines for Good Clinical Practice, andthe Strengthening the Reporting of Observational Studies in Epidemi-ology (STROBE) guidelines (available at www.strobe-statement.org/).
All consecutive subjects aged 65 years and older who requireda public health care intervention or support by the Public Local HealthCare System (ie, institutionalization or home-care services), and thatfor this reason were evaluated at their home from the January 1, 2004,to December 31, 2010, by the multidisciplinary team of the LocalHealth Care System (Azienda ULSS 16 Padova, Italy), were screened forinclusion in the study. Inclusion criteria were (1) age 65 years or older;(2) ability to provide an informed consent or availability of a proxy forinformed consent; and (3) a complete SVaMA. Because the PublicHealth Care System in Italy is addressed to all residents without limitsas regards age, sex, race, religion, and income, the cohort may beconsidered as representative of community-dwelling older subjectswho need health care assistance, mainly for having access to home-care services or institutionalization. All patients were followed fora median period of 2 years; patients who had not died were followedfor at least 1 year. Vital status at a least 1 year from the evaluation wasassessed by consulting the Registry Offices of the cities in which thepatients were residents at the time of the evaluation. Dates of deathwere identified from death certificates.
Two cohorts of random older patients living at home were iden-tified. The first cohort (the development cohort) was identifiedby randomly selecting about 66% of the total sample data and wasused for developing the MPI-SVaMA; the second cohort (the valida-tion cohort) was identified by using the remaining total sample dataand was used to validate the prognostic accuracy of MPI-SVaMA. Twodistinct MPI-SVaMAs were defined as predictors of mortality at1 month and 1 year of follow-up, respectively.
The SVaMA
The SVaMA is the officially recommended assessment scheduleused by the health personnel of the National Health Care System toperform a multidimensional assessment in community-dwellingolder persons or nursing home residents introduced by the VenetoRegional Health System since 2000 to establish accessibility to some
health care resources. When a resident citizen requires support bythe Public Local Health System (ie, home-care services or in-stitutionalization), a specific commission has the task to performa multidimensional assessment of the subject to develop a project ofcare tailored to the needs of the individual. The commission consistsof a multidisciplinary team that includes a physician of the publicHealth Care District, a general practitioner (GP), a nurse, a socialworker, and a geriatrician as a consultant specialist that through theSVaMA may collect information on health, functional, social,and economic domains. Reliability, accuracy, and calibration of theSVaMA have been previously tested and validated.5 At present, theSVaMA is the officially recommended multidimensional assess-ment instrument used in most regions in Italy (ie, Veneto, Trentino,Puglia, Molise, Sicilia, Campania, Basilicata, and Valle D’Aosta),comprising a total population area of about 21,700,000 inhabitants.The SVaMA instrument is available online at http://www.regione.veneto.it/NR/rdonlyres/2A86F528-22A4-4603-86D6-D22F79858006/0/DeliberazionedellaGiuntaRegionalen1133del6maggio2008.pdf(Italian version) and at http://www.operapadrepio.it/it/content/view/2152/1082/ (English version).
The MPI Based on the SVaMA
To develop the MPI-SVaMA, the following nine domains,including 55 items, were considered: (1) age, (2) sex, (3) maindiagnosis, (4) nursing care needs (VIP), evaluated according toa validated numeric scale including 11 items that estimated thenursing care needs of the older subject based on the presence of (a)insulin-dependent diabetes mellitus; (b) heart failure in 3e4 NewYork Heart Association class that needs frequent monitoring of pulse,blood pressure, heart rate, and liquid balance; (c) liver failure withascites; (d) tracheostomy; (e) oxygen therapy for more than 3 hoursper day; (f) feeding gastrostomy and/or nasogastric tube; (g) centralvenous catheter; (h) bladder catheter; (i) ureterostomy; (j) ne-phrostomy; (k) pressure sores at the limbs or other sites that needmedications; (5) cognitive status (VCOG), evaluated by the ShortPortable Mental Status Questionnaire (SPMSQ), a 10-item question-naire that assesses orientation, memory, attention, calculation, andlanguage6; (6) pressure sores risk (VPIA), evaluated by the Exton-Smith Scale, a 5-item questionnaire that determines physical andmental condition, activity, mobility, and incontinence7; (7) activitiesof daily living (VADL) and (8) mobility (VMOB) evaluated by theBarthel Index, which defines the level of dependence/independencein seven daily care activities, including feeding, bathing, grooming,dressing, bowel and bladder continence and toilet use, as well as thecapacities for moving from bed to wheelchair and back, walking onlevel surface, and going up and down stairs8,9; and (9) social support(VSOC), evaluated by a numeric scale of 16 items that explores thepresence of a support network for preparing meals, cleaning house,washing clothes, buying something, feeding, taking a bath, personalhygiene, dressing, going to the toilet, taking medications, trans-ferring, walking, money management, psycho-affective support, andsupervision during the day and the night.
To calculate the MPI-SVaMA indices, a weighted sum of eachindividual domain (Di) was computed (raw formula). Weights (Si)were estimated from 2 distinct multivariate Cox proportional hazardmodels, one for 1-month and one for 1-year mortality prediction,respectively (Table 1).
Each weighted sum [R ¼P(Si $ Di)] was then normalized intoa range that varies from 0 (lowest risk) to 1 (highest risk), subtractingthe observed raw minimum value and then dividing such differenceby the observed range (minimum to maximum span). Specifically, for1-month MPI-SVaMA, the raw formula can be normalized by sub-tracting the minimum value of 0.276 and dividing the obtained
Table 1Estimated Domain Weights Used to Compute the MPI-SVaMA Indices for 1-Monthand 1-Year Mortality Prediction
Domains Category Weights forMPI-SVaMAat 1 Month
Weights forMPI-SVaMAat 1 Year
Age, y 0.00331 0.01351Sex Female (reference) 0 0
Male 0.31464 0.3413Main diagnosis Dementia (reference) 0 0
Cancer 2.22093 1.99569Hip fracture �0.65872 �0.54763Stroke 0.20318 0.0099Cardiovascular disease 0.38855 0.30945Respiratory disease 0.39394 0.2596Neurological disorder �0.14409 �0.10899Immobilizationsyndrome
0.43482 0.21911
Other 0.69991 0.34769Nursing care need VIP 0.02741 0.02771Cognitive status VCOG (SPMSQ) 0.01772 0.00799Pressure sore risk VPIA (Exton-Smith
Scale)0.02104 0.02858
Activities of dailyliving
VADL (Barthel-Index) 0.01098 0.00662
Mobility VMOB (Barthel-Index) 0.02617 0.01645Social support VSOC 0.0007367 0.0000994
MPI-SVaMA, Multidimensional Prognostic Index based on the Standardized Multi-dimensional Assessment Schedule (Scheda per la Valutazione Multidimensionaledelle persone adulte e Anziane); VADL, activities of daily living; VCOG, cognitivefunctions; VIP, nursing care needs; VMOB, mobility; VPIA, pressure sores risk; VSOC,social support network.
A. Pilotto et al. / JAMDA 14 (2013) 287e292 289
difference by 6.564
ie;
ðR� 0:276Þ6:564
!. Similarly, for 1-year MPI-
SVaMA, the raw formula can be normalized by subtracting theminimum value of 0.673 and dividing the obtained difference by
5.476
ie;
ðR� 0:673Þ5:476
!.
The RECursive Partition and AMalgamation (RECPAM) algorithm10
was used to identify subgroups of patients at different risks formortality, aspreviously reported.11Ateachpartitioningstep, themethodchooses the best binary split (cutoff) to maximize the difference in theoutcome of interest. The following cutoffs were estimated for thenormalizedMPI-SVaMA for 1-monthmortality prediction: 0e0.41 (lowrisk), 0.42e0.53 (moderate risk), 0.54e1 (severe risk), whereas for thenormalizedMPI-SVaMA for 1-yearmortality prediction the cutoffswere0e0.33 (low risk), 0.34e0.47 (moderate risk), 0.48e1 (severe risk). Tocalculate the MPI-SVaMA at 1 month and at 1 year, software forWindows may be downloaded (available for free) at the followingaddress: http://www.operapadrepio.it/impi/svamasetup.exe.
Statistical Analysis
Patients’ baseline characteristics were reported as means � SD orfrequencies and percentages for continuous and categorical variables,respectively. Baseline comparisons between men and women wereassessed using Mann-Whitney or Pearson chi-square statistics forcontinuous and categorical variables, respectively. Mortality inci-dence rates (IR) for 100 person-months and 100 person-years over 1month and 1 year of follow-up were also reported. Poisson regressionmodels were assessed to test differences in IR between men andwomen and to assess a linear trend in IR between MPI-SVaMA grades.Hazard ratios (HRs) and 95% confidence intervals (95% CIs) estimatedfrom univariate proportional hazards regression models, and for eachdefined risk category, were also shown. A forward variable selectionanalysis was performed for both 1-month and 1-year mortality toassess which domains should be used to build the prediction model.
The discriminatory power of the MPI-SVaMA indices for 1-month and1-year mortality prediction was assessed by estimating the SurvivalC-index,12 along with their 95% CIs. The model’s calibration (ie, theagreement between observed outcomes and predictions) was as-sessed by estimating the difference between the mean predictedprobability and the observed probability, derived using the Kaplan-Maier method, for each quintile of predicted probabilities. Ten ormore percentage points’ difference between predicted and observedprobabilities evidenced poor calibration, whereas a difference of lessthan 10 percentage points evidenced good calibration.2
All statistical analyses were performed using SAS version 9.1 (SASInstitute, Cary, NC). For RECPAM analysis, an SAS macro routinewritten by one of the authors (F.P.) was used.
Results
Study Population
A total of 12,020 subjects 65 years or older (mean age 81.84 � 7.97years) were included in the study; 7605 (63.3%) were women and4415 (36.7%) were men. The overall study population was dividedinto 2 cohorts through a computerized randomization: (1) theDevelopment Cohort included 7876 subjects (mean age 81.79 � 8.05years), 4967 women (63.1%) and 2909 (36.9%) men and (2) theValidation Cohort included 4144 subjects (mean age 81.95 � 7.83years), 2638 women (63.7%) and 1506 (36.3%) men (Table 2).
In both cohorts, the most prevalent main diagnoses were dementia(31.06% and 30.48% in the development and validation cohort, respec-tively), cancer (22.91% and 23.55% in the development and validationcohort, respectively), immobilization syndrome (10.88% and 11.66% inthe development and validation cohort, respectively), cardiovasculardisease (7.53% and 7.89% in the development and validation cohort,respectively), neurologic disorders (6.98% and 6.90% in the develop-ment and validation cohort, respectively), and stroke (5.33% and 5.12%in the development and validation cohort, respectively). In bothcohorts, the distribution of main diagnoses was significantly differentbetween men and women (P < .0001). Women showed significantlyhigher cognitive (VCOG, P < .0001) and social (VSOC P < .0001)impairment than men, whereas men demonstrated higher nursing careneeds (VIP P < .0001) than women. No relevant differences betweenmen and women were observed in the ADL (VADL), the Barthelmobility score (VMOB), and the risk of pressure sores (VPIA) (Table 2).
Mortality Rates and MPI-SVaMAThe overall mortality incidence rates were 17.7% and 18.3% for 100
person-months (development and validation cohort, respectively)over 1 month and 70.9% and 72.3% for 100 person-years (develop-ment and validation cohort respectively) over 1 year of follow-up. Inboth development and validation cohorts, mortality incidence rateswere significantly higher in men thanwomen after 1 month (26.4% vs13.0%, P < .0001 and 28.6% vs 12.8%, P < .0001) and after 1 year offollow-up (109% vs 53.9%, P < .0001 and 115.8% vs 53.8%, P < .0001).
In both cohorts, men showed a significantly higher MPI-SVaMAmean value than women both at 1-month (P < .0001) and at 1-year(P < .0001) follow-up.
As expected, a significant linear trend between MPI-SVaMA ingrades and mortality incidence rates for 100 person-months wasobserved at 1 month both in the development cohort (incidencerates: 2.0% vs 12.4% vs 54.4% in low, moderate, and severe MPI-SVaMA grades, respectively, P for trend < .0001) and in the valida-tion cohort (incidence rates: 2.1% vs 12.8% vs 54.4% for low, moderate,and severe grades, respectively, P for trend < .0001).
Similarly, a significant linear trend between MPI-SVaMA in gradesand mortality incidence rates for 100 person-years was observed at
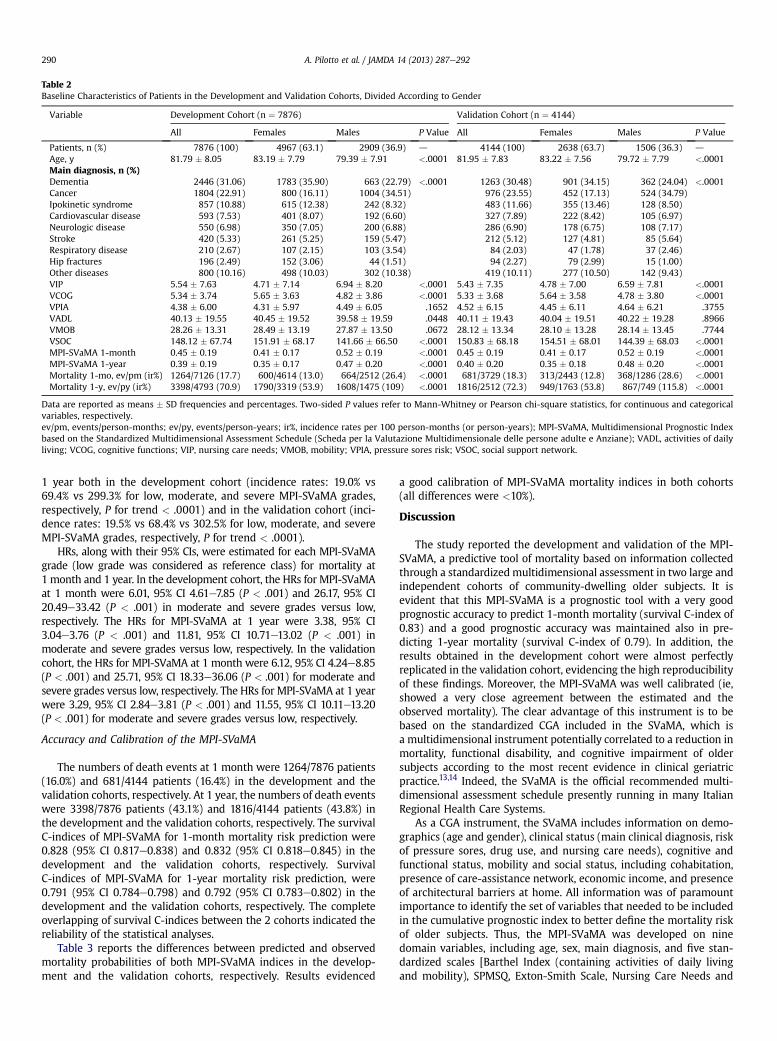
Table 2Baseline Characteristics of Patients in the Development and Validation Cohorts, Divided According to Gender
Variable Development Cohort (n ¼ 7876) Validation Cohort (n ¼ 4144)
All Females Males P Value All Females Males P Value
Patients, n (%) 7876 (100) 4967 (63.1) 2909 (36.9) d 4144 (100) 2638 (63.7) 1506 (36.3) d
Age, y 81.79 � 8.05 83.19 � 7.79 79.39 � 7.91 <.0001 81.95 � 7.83 83.22 � 7.56 79.72 � 7.79 <.0001Main diagnosis, n (%)Dementia 2446 (31.06) 1783 (35.90) 663 (22.79) <.0001 1263 (30.48) 901 (34.15) 362 (24.04) <.0001Cancer 1804 (22.91) 800 (16.11) 1004 (34.51) 976 (23.55) 452 (17.13) 524 (34.79)Ipokinetic syndrome 857 (10.88) 615 (12.38) 242 (8.32) 483 (11.66) 355 (13.46) 128 (8.50)Cardiovascular disease 593 (7.53) 401 (8.07) 192 (6.60) 327 (7.89) 222 (8.42) 105 (6.97)Neurologic disease 550 (6.98) 350 (7.05) 200 (6.88) 286 (6.90) 178 (6.75) 108 (7.17)Stroke 420 (5.33) 261 (5.25) 159 (5.47) 212 (5.12) 127 (4.81) 85 (5.64)Respiratory disease 210 (2.67) 107 (2.15) 103 (3.54) 84 (2.03) 47 (1.78) 37 (2.46)Hip fractures 196 (2.49) 152 (3.06) 44 (1.51) 94 (2.27) 79 (2.99) 15 (1.00)Other diseases 800 (10.16) 498 (10.03) 302 (10.38) 419 (10.11) 277 (10.50) 142 (9.43)VIP 5.54 � 7.63 4.71 � 7.14 6.94 � 8.20 <.0001 5.43 � 7.35 4.78 � 7.00 6.59 � 7.81 <.0001VCOG 5.34 � 3.74 5.65 � 3.63 4.82 � 3.86 <.0001 5.33 � 3.68 5.64 � 3.58 4.78 � 3.80 <.0001VPIA 4.38 � 6.00 4.31 � 5.97 4.49 � 6.05 .1652 4.52 � 6.15 4.45 � 6.11 4.64 � 6.21 .3755VADL 40.13 � 19.55 40.45 � 19.52 39.58 � 19.59 .0448 40.11 � 19.43 40.04 � 19.51 40.22 � 19.28 .8966VMOB 28.26 � 13.31 28.49 � 13.19 27.87 � 13.50 .0672 28.12 � 13.34 28.10 � 13.28 28.14 � 13.45 .7744VSOC 148.12 � 67.74 151.91 � 68.17 141.66 � 66.50 <.0001 150.83 � 68.18 154.51 � 68.01 144.39 � 68.03 <.0001MPI-SVaMA 1-month 0.45 � 0.19 0.41 � 0.17 0.52 � 0.19 <.0001 0.45 � 0.19 0.41 � 0.17 0.52 � 0.19 <.0001MPI-SVaMA 1-year 0.39 � 0.19 0.35 � 0.17 0.47 � 0.20 <.0001 0.40 � 0.20 0.35 � 0.18 0.48 � 0.20 <.0001Mortality 1-mo, ev/pm (ir%) 1264/7126 (17.7) 600/4614 (13.0) 664/2512 (26.4) <.0001 681/3729 (18.3) 313/2443 (12.8) 368/1286 (28.6) <.0001Mortality 1-y, ev/py (ir%) 3398/4793 (70.9) 1790/3319 (53.9) 1608/1475 (109) <.0001 1816/2512 (72.3) 949/1763 (53.8) 867/749 (115.8) <.0001
Data are reported as means � SD frequencies and percentages. Two-sided P values refer to Mann-Whitney or Pearson chi-square statistics, for continuous and categoricalvariables, respectively.ev/pm, events/person-months; ev/py, events/person-years; ir%, incidence rates per 100 person-months (or person-years); MPI-SVaMA, Multidimensional Prognostic Indexbased on the Standardized Multidimensional Assessment Schedule (Scheda per la Valutazione Multidimensionale delle persone adulte e Anziane); VADL, activities of dailyliving; VCOG, cognitive functions; VIP, nursing care needs; VMOB, mobility; VPIA, pressure sores risk; VSOC, social support network.
A. Pilotto et al. / JAMDA 14 (2013) 287e292290
1 year both in the development cohort (incidence rates: 19.0% vs69.4% vs 299.3% for low, moderate, and severe MPI-SVaMA grades,respectively, P for trend < .0001) and in the validation cohort (inci-dence rates: 19.5% vs 68.4% vs 302.5% for low, moderate, and severeMPI-SVaMA grades, respectively, P for trend < .0001).
HRs, along with their 95% CIs, were estimated for each MPI-SVaMAgrade (low grade was considered as reference class) for mortality at1 month and 1 year. In the development cohort, the HRs for MPI-SVaMAat 1 month were 6.01, 95% CI 4.61e7.85 (P < .001) and 26.17, 95% CI20.49e33.42 (P < .001) in moderate and severe grades versus low,respectively. The HRs for MPI-SVaMA at 1 year were 3.38, 95% CI3.04e3.76 (P < .001) and 11.81, 95% CI 10.71e13.02 (P < .001) inmoderate and severe grades versus low, respectively. In the validationcohort, the HRs for MPI-SVaMA at 1 month were 6.12, 95% CI 4.24e8.85(P < .001) and 25.71, 95% CI 18.33e36.06 (P < .001) for moderate andsevere grades versus low, respectively. The HRs for MPI-SVaMA at 1 yearwere 3.29, 95% CI 2.84e3.81 (P < .001) and 11.55, 95% CI 10.11e13.20(P < .001) for moderate and severe grades versus low, respectively.
Accuracy and Calibration of the MPI-SVaMA
The numbers of death events at 1 month were 1264/7876 patients(16.0%) and 681/4144 patients (16.4%) in the development and thevalidation cohorts, respectively. At 1 year, the numbers of death eventswere 3398/7876 patients (43.1%) and 1816/4144 patients (43.8%) inthe development and the validation cohorts, respectively. The survivalC-indices of MPI-SVaMA for 1-month mortality risk prediction were0.828 (95% CI 0.817e0.838) and 0.832 (95% CI 0.818e0.845) in thedevelopment and the validation cohorts, respectively. SurvivalC-indices of MPI-SVaMA for 1-year mortality risk prediction, were0.791 (95% CI 0.784e0.798) and 0.792 (95% CI 0.783e0.802) in thedevelopment and the validation cohorts, respectively. The completeoverlapping of survival C-indices between the 2 cohorts indicated thereliability of the statistical analyses.
Table 3 reports the differences between predicted and observedmortality probabilities of both MPI-SVaMA indices in the develop-ment and the validation cohorts, respectively. Results evidenced
a good calibration of MPI-SVaMA mortality indices in both cohorts(all differences were <10%).
Discussion
The study reported the development and validation of the MPI-SVaMA, a predictive tool of mortality based on information collectedthrough a standardized multidimensional assessment in two large andindependent cohorts of community-dwelling older subjects. It isevident that this MPI-SVaMA is a prognostic tool with a very goodprognostic accuracy to predict 1-month mortality (survival C-index of0.83) and a good prognostic accuracy was maintained also in pre-dicting 1-year mortality (survival C-index of 0.79). In addition, theresults obtained in the development cohort were almost perfectlyreplicated in the validation cohort, evidencing the high reproducibilityof these findings. Moreover, the MPI-SVaMA was well calibrated (ie,showed a very close agreement between the estimated and theobserved mortality). The clear advantage of this instrument is to bebased on the standardized CGA included in the SVaMA, which isa multidimensional instrument potentially correlated to a reduction inmortality, functional disability, and cognitive impairment of oldersubjects according to the most recent evidence in clinical geriatricpractice.13,14 Indeed, the SVaMA is the official recommended multi-dimensional assessment schedule presently running in many ItalianRegional Health Care Systems.
As a CGA instrument, the SVaMA includes information on demo-graphics (age and gender), clinical status (main clinical diagnosis, riskof pressure sores, drug use, and nursing care needs), cognitive andfunctional status, mobility and social status, including cohabitation,presence of care-assistance network, economic income, and presenceof architectural barriers at home. All information was of paramountimportance to identify the set of variables that needed to be includedin the cumulative prognostic index to better define the mortality riskof older subjects. Thus, the MPI-SVaMA was developed on ninedomain variables, including age, sex, main diagnosis, and five stan-dardized scales [Barthel Index (containing activities of daily livingand mobility), SPMSQ, Exton-Smith Scale, Nursing Care Needs and
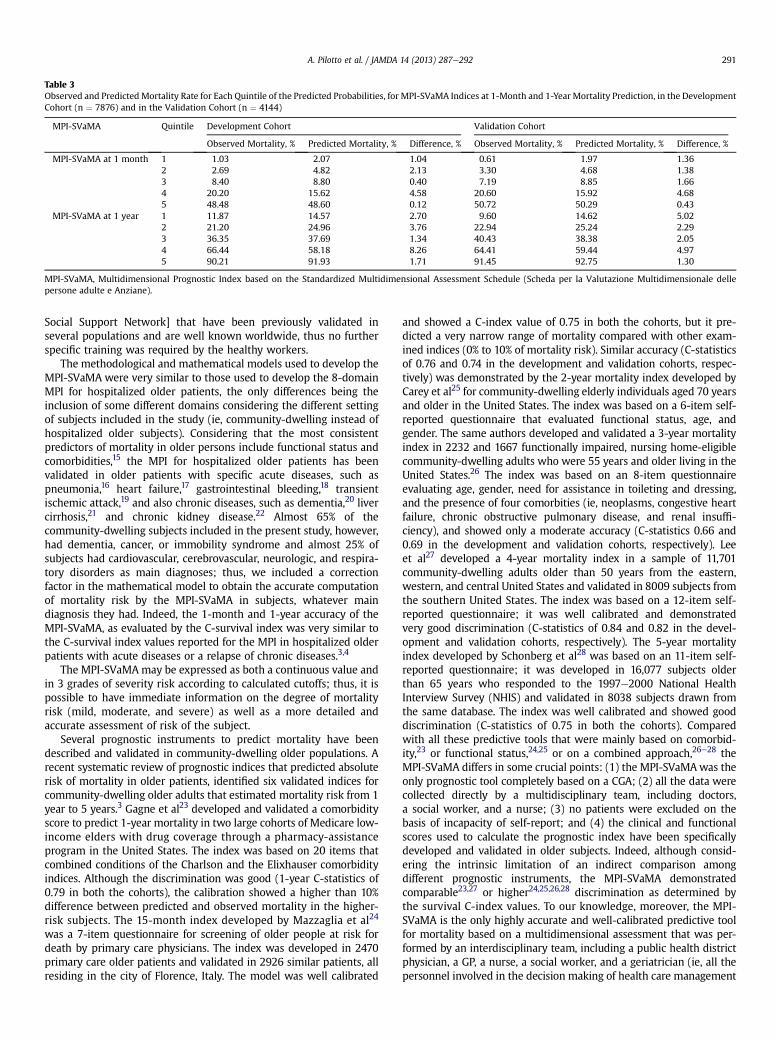
Table 3Observed and Predicted Mortality Rate for Each Quintile of the Predicted Probabilities, for MPI-SVaMA Indices at 1-Month and 1-Year Mortality Prediction, in the DevelopmentCohort (n ¼ 7876) and in the Validation Cohort (n ¼ 4144)
MPI-SVaMA Quintile Development Cohort Validation Cohort
Observed Mortality, % Predicted Mortality, % Difference, % Observed Mortality, % Predicted Mortality, % Difference, %
MPI-SVaMA at 1 month 1 1.03 2.07 1.04 0.61 1.97 1.362 2.69 4.82 2.13 3.30 4.68 1.383 8.40 8.80 0.40 7.19 8.85 1.664 20.20 15.62 4.58 20.60 15.92 4.685 48.48 48.60 0.12 50.72 50.29 0.43
MPI-SVaMA at 1 year 1 11.87 14.57 2.70 9.60 14.62 5.022 21.20 24.96 3.76 22.94 25.24 2.293 36.35 37.69 1.34 40.43 38.38 2.054 66.44 58.18 8.26 64.41 59.44 4.975 90.21 91.93 1.71 91.45 92.75 1.30
MPI-SVaMA, Multidimensional Prognostic Index based on the Standardized Multidimensional Assessment Schedule (Scheda per la Valutazione Multidimensionale dellepersone adulte e Anziane).
A. Pilotto et al. / JAMDA 14 (2013) 287e292 291
Social Support Network] that have been previously validated inseveral populations and are well known worldwide, thus no furtherspecific training was required by the healthy workers.
The methodological and mathematical models used to develop theMPI-SVaMA were very similar to those used to develop the 8-domainMPI for hospitalized older patients, the only differences being theinclusion of some different domains considering the different settingof subjects included in the study (ie, community-dwelling instead ofhospitalized older subjects). Considering that the most consistentpredictors of mortality in older persons include functional status andcomorbidities,15 the MPI for hospitalized older patients has beenvalidated in older patients with specific acute diseases, such aspneumonia,16 heart failure,17 gastrointestinal bleeding,18 transientischemic attack,19 and also chronic diseases, such as dementia,20 livercirrhosis,21 and chronic kidney disease.22 Almost 65% of thecommunity-dwelling subjects included in the present study, however,had dementia, cancer, or immobility syndrome and almost 25% ofsubjects had cardiovascular, cerebrovascular, neurologic, and respira-tory disorders as main diagnoses; thus, we included a correctionfactor in the mathematical model to obtain the accurate computationof mortality risk by the MPI-SVaMA in subjects, whatever maindiagnosis they had. Indeed, the 1-month and 1-year accuracy of theMPI-SVaMA, as evaluated by the C-survival index was very similar tothe C-survival index values reported for the MPI in hospitalized olderpatients with acute diseases or a relapse of chronic diseases.3,4
The MPI-SVaMA may be expressed as both a continuous value andin 3 grades of severity risk according to calculated cutoffs; thus, it ispossible to have immediate information on the degree of mortalityrisk (mild, moderate, and severe) as well as a more detailed andaccurate assessment of risk of the subject.
Several prognostic instruments to predict mortality have beendescribed and validated in community-dwelling older populations. Arecent systematic review of prognostic indices that predicted absoluterisk of mortality in older patients, identified six validated indices forcommunity-dwelling older adults that estimated mortality risk from 1year to 5 years.3 Gagne et al23 developed and validated a comorbidityscore to predict 1-year mortality in two large cohorts of Medicare low-income elders with drug coverage through a pharmacy-assistanceprogram in the United States. The index was based on 20 items thatcombined conditions of the Charlson and the Elixhauser comorbidityindices. Although the discrimination was good (1-year C-statistics of0.79 in both the cohorts), the calibration showed a higher than 10%difference between predicted and observed mortality in the higher-risk subjects. The 15-month index developed by Mazzaglia et al24
was a 7-item questionnaire for screening of older people at risk fordeath by primary care physicians. The index was developed in 2470primary care older patients and validated in 2926 similar patients, allresiding in the city of Florence, Italy. The model was well calibrated
and showed a C-index value of 0.75 in both the cohorts, but it pre-dicted a very narrow range of mortality compared with other exam-ined indices (0% to 10% of mortality risk). Similar accuracy (C-statisticsof 0.76 and 0.74 in the development and validation cohorts, respec-tively) was demonstrated by the 2-year mortality index developed byCarey et al25 for community-dwelling elderly individuals aged 70 yearsand older in the United States. The index was based on a 6-item self-reported questionnaire that evaluated functional status, age, andgender. The same authors developed and validated a 3-year mortalityindex in 2232 and 1667 functionally impaired, nursing home-eligiblecommunity-dwelling adults who were 55 years and older living in theUnited States.26 The index was based on an 8-item questionnaireevaluating age, gender, need for assistance in toileting and dressing,and the presence of four comorbities (ie, neoplasms, congestive heartfailure, chronic obstructive pulmonary disease, and renal insuffi-ciency), and showed only a moderate accuracy (C-statistics 0.66 and0.69 in the development and validation cohorts, respectively). Leeet al27 developed a 4-year mortality index in a sample of 11,701community-dwelling adults older than 50 years from the eastern,western, and central United States and validated in 8009 subjects fromthe southern United States. The index was based on a 12-item self-reported questionnaire; it was well calibrated and demonstratedvery good discrimination (C-statistics of 0.84 and 0.82 in the devel-opment and validation cohorts, respectively). The 5-year mortalityindex developed by Schonberg et al28 was based on an 11-item self-reported questionnaire; it was developed in 16,077 subjects olderthan 65 years who responded to the 1997e2000 National HealthInterview Survey (NHIS) and validated in 8038 subjects drawn fromthe same database. The index was well calibrated and showed gooddiscrimination (C-statistics of 0.75 in both the cohorts). Comparedwith all these predictive tools that were mainly based on comorbid-ity,23 or functional status,24,25 or on a combined approach,26e28 theMPI-SVaMA differs in some crucial points: (1) the MPI-SVaMAwas theonly prognostic tool completely based on a CGA; (2) all the data werecollected directly by a multidisciplinary team, including doctors,a social worker, and a nurse; (3) no patients were excluded on thebasis of incapacity of self-report; and (4) the clinical and functionalscores used to calculate the prognostic index have been specificallydeveloped and validated in older subjects. Indeed, although consid-ering the intrinsic limitation of an indirect comparison amongdifferent prognostic instruments, the MPI-SVaMA demonstratedcomparable23,27 or higher24,25,26,28 discrimination as determined bythe survival C-index values. To our knowledge, moreover, the MPI-SVaMA is the only highly accurate and well-calibrated predictive toolfor mortality based on a multidimensional assessment that was per-formed by an interdisciplinary team, including a public health districtphysician, a GP, a nurse, a social worker, and a geriatrician (ie, all thepersonnel involved in the decision making of health care management
A. Pilotto et al. / JAMDA 14 (2013) 287e292292
and strictly integrated to the National Health Service Network). Veryrecently, it has been reported that a comprehensive multidimensionalapproach may be very effective in identifying and evaluating frail oldersubjects, according to a multidimensional operational definition offrailty in clinical practice,29,30 as multisystemic changes occur in olderindividuals that determine an increased risk for adverse healthoutcomes, including death. Indeed, the MPI demonstrated a significanthigher predictive power for short- and long-term all-cause mortalitythan other frailty instruments in hospitalized older patients.31 Veryinterestingly, the MPI-SVaMA was an accurate predictive tool also foranother adverse health outcome traditionally linked to frailty, such asinstitutionalization (data not shown). Taken together, all these findingssupport the concept that considering multidimensional aggregateinformation may be very important for predicting mortality in olderpatients with the most common conditions leading to death,32 andthat it may be useful for the identification of more adequatemanagement of patients during the last period of life.33 A limitation ofthe study is that we included older subjects who attended the SVaMAevaluation so as to be eligible for health care assistance programs (ie,home services or institutionalization), so a generalization to otherpopulations or settings of the present findings needs to be validated.
Conclusion
We developed and validated an accurate and well-calibratedinstrument to predict mortality in community-dwelling oldersubjects. To determine, however, whether use of the MPI-SVaMA isbetter than usual care to facilitate clinical decision making, furtherimpact studies are needed.
References
1. Siontis GCM, Tzoulaki I, Ioannidis JPA. Predicting death. An empirical evalua-tion of predictive tools for mortality. Arch Intern Med 2011;171:1721e1726.
2. Yourman LC, Lee SJ, Schonberg MA, et al. Prognostic indices for older adults.A systematic review. JAMA 2012;307:182e192.
3. Pilotto A, Ferrucci L, Franceschi M, et al. Development and validation ofa multidimensional prognostic index for one-year mortality from compre-hensive geriatric assessment in hospitalized older patients. Rejuvenation Res2008;11:151e161.
4. Sancarlo D, D’Onofrio G, Franceschi M, et al. Validation of a modified Multidi-mensional Prognotic Index (m-MPI) including the Mini Nutritional AssessmentShort-form (MNA-SF) for the prediction of one-year mortality in hospitalizedelderly patients. J Nutr Health Aging 2011;15:169e173.
5. Gallina P, Saugo M, Antoniazzi M, et al. Validazione della Scheda per la Valu-tazione Multidimensionale dell’Anziano (SVaMA). Tendenze nuove 2006;3:229e263.
6. Pfeiffer E. A short portable mental status questionnaire for the assessment oforganic brain deficit in elderly patients. J Am Geriatr Soc 1975;23:433e441.
7. Bliss MR, McLaren R, Exton-Smith AN. Mattresses for preventing pressure sores ingeriatric patients.MonBullMinistHealth Public Health LabServ 1966;25:238e268.
8. Mahoney FI, Barthel D. Functional evaluation: the Barthel index. Md State MedJ 1965;14:56e61.
9. Shah S, Vanclay F, Cooper B. Improving the sensitivity of the Barthel Index forstroke rehabilitation. J Clin Epidemiol 1989;42:703e709.
10. Ciampi A. Generalized regression tree. Computational Statistics and DataAnalysis 1991;12:57e78.
11. Addante F, Sancarlo D, Copetti M, et al. Effect of obesity, serum lipoproteins,and apolipoprotein E genotypes on mortality in hospitalized elderly patients.Rejuvenation Res 2011;14:111e118.
12. Pencina MJ, D’Agostino RB. Overall C as a measure of discrimination in survivalanalysis: model specific population value and confidence interval estimation.Statistics in Medicine 2004;23:2109e2123.
13. Ellis G, Whitehead MA, O’Neill D, et al. Comprehensive Geriatric Assessmentfor older adults admitted to hospital. Cochrane Database Syst Rev 2011;(7):CD006211.
14. Stuck AE. Comprehensive geriatric assessment for older adults. BMJ 2011;343:d6799.
15. Gill TM. The central role of prognosis in clinical decision making. JAMA 2012;307:199e200.
16. Pilotto A, Addante F, Ferrucci L, et al. The Multidimensional Prognostic Index(MPI) predicts short and long-term mortality in older patients withcommunity-acquired pneumonia. J Gerontol A Biol Sci Med Sci 2009;64A:880e887.
17. Pilotto A, Addante F, Franceschi M, et al. A Multidimensional PrognosticIndex (MPI) based on a comprehensive geriatric assessment predicts short-term mortality in older patients with heart failure. Circ Heart Fail 2010;3:14e20.
18. Pilotto A, Ferrucci L, Scarcelli C, et al. Usefulness of the comprehensive geriatricassessment in older patient with upper gastrointestinal bleeding: A two yearfollow-up study. Dig Dis 2007;25:124e128.
19. Sancarlo D, Pilotto A, Panza F, et al. A Multidimensional Prognostic Index (MPI)based on a comprehensive geriatric assessment predicts short- and long-termall-cause mortality in older hospitalized patients with transient ischemicattack. J Neurol 2012;259:670e678.
20. Pilotto A, Sancarlo D, Panza F, et al. The Multidimensional Prognostic Index(MPI), based on a comprehensive geriatric assessment predicts short- andlong-term mortality in hospitalized older patients with dementia. J AlzheimersDis 2009;18:191e199.
21. Pilotto A, Addante F, D’Onofrio G, et al. The Comprehensive Geriatric Assess-ment and the multidimensional approach. A new look at the older patient withgastroenterological disorders. Best Pract Res Clin Gastroenterol 2009;23:829e837.
22. Pilotto A, Sancarlo D, Aucella F, et al. Addition of the Multidimensional Prog-nostic Index to the estimated Glomerular Filtration Rate improve prediction oflong-term all-cause mortality in older patients with Chronic Kidney Disease.Rejuvenation Res 2012;15:82e88.
23. Gagne JJ, Glynn RJ, Avorn J, et al. A combined comorbidity score predictedmortality in elderly patients better than existing scores. J Clin Epidemiol 2011;64:749e759.
24. Mazzaglia G, Roti L, Corsini G, et al. Screening of older community-dwellingpeople at risk for death and hospitalization: The Assistenza Socio-Sanitaria inItalia project. J Am Geriatr Soc 2007;55:1955e1960.
25. Carey EC, Walter LC, Lindquist K, Covinsky KE. Development and validation ofa functional morbidity index to predict mortality in community-dwellingelders. J Gen Intern Med 2004;19:1027e1033.
26. Carey EC, Covinsky KE, Lui LY, et al. Prediction of mortality in community-livingfrail elderly people with long-term care needs. J Am Geriatr Soc 2008;56:68e75.
27. Lee SJ, Lindquist K, Segal MR, Covinsky KE. Development and validation ofa prognostic index for 4-year mortality in older adults. JAMA 2006;295:801e808.
28. Schonberg MA, Davis RB, McCarthy EP, Marcantonio ER. Index to predict 5-yearmortality of community-dwelling adults aged 65 and older using data from theNational Health Interview Survey. J Gen Intern Med 2009;24:1115e1122.
29. Sourial N, Wolfson C, Bergman H, et al. A correspondence analysis revealedfrailty deficits aggregate and are multidimensional. J Clin Epidemiol 2010;63:647e654.
30. Gobbens RJJ, van Assen MAL, Luijkx KG, Wijnen-Sponselee MT. Determinants offrailty. J Am Med Dir Assoc 2010;11:356e364.
31. Pilotto A, Rengo F, Marchionni N, et al. Comparing the prognostic accuracy forall-cause mortality of frailty instruments: A multicentre 1-year follow-up inhospitalized older patients. PLoS One 2012;7:e29090.
32. Pilotto A, Panza F, Ferrucci L. A Multidimensional Prognostic Index in commonconditions leading to death in older patients. Arch Intern Med 2012;172:594e595.
33. Gill TM, Gahbauer EA, Han L, Allore HG. Trajectories of disability in the last yearof life. N Engl J Med 2010;362:1173e1180.
Related Documents