This article was downloaded by: [Anglia Ruskin University] On: 06 May 2014, At: 02:27 Publisher: Taylor & Francis Informa Ltd Registered in England and Wales Registered Number: 1072954 Registered office: Mortimer House, 37-41 Mortimer Street, London W1T 3JH, UK Computer Methods in Biomechanics and Biomedical Engineering Publication details, including instructions for authors and subscription information: http://www.tandfonline.com/loi/gcmb20 Development and validation of a computational model of the knee joint for the evaluation of surgical treatments for osteoarthritis R. Mootanah ab , C.W. Imhauser c , F. Reisse a , D. Carpanen a , R.W. Walker a , M.F. Koff d , M.W. Lenhoff b , S.R. Rozbruch e , A.T. Fragomen e , Z. Dewan b , Y.M. Kirane e , K. Cheah fa , J.K. Dowell fga & H.J. Hillstrom ba a Medical Engineering Research Group, Faculty of Science and Technology, Anglia Ruskin University, Chelmsford, Essex, UK b Leon Root Motion Analysis Laboratory, Department of Rehabilitation, Hospital for Special Surgery, New York, USA c Department of Biomechanics, Hospital for Special Surgery, New York, USA d Department of Radiology and Imaging – MRI, Hospital for Special Surgery, New York, USA e Limb Lengthening and Complex Reconstruction Services, Hospital for Special Surgery, New York, USA f Department of Orthopaedics, Ramsay Springfield Hospital, Chelmsford, Essex, UK g Department of Orthopaedics, Mid-Essex Hospital Services Trust, Broomfield Hospital, Chelmsford, Essex, UK Published online: 01 May 2014. To cite this article: R. Mootanah, C.W. Imhauser, F. Reisse, D. Carpanen, R.W. Walker, M.F. Koff, M.W. Lenhoff, S.R. Rozbruch, A.T. Fragomen, Z. Dewan, Y.M. Kirane, K. Cheah, J.K. Dowell & H.J. Hillstrom (2014): Development and validation of a computational model of the knee joint for the evaluation of surgical treatments for osteoarthritis, Computer Methods in Biomechanics and Biomedical Engineering, DOI: 10.1080/10255842.2014.899588 To link to this article: http://dx.doi.org/10.1080/10255842.2014.899588 PLEASE SCROLL DOWN FOR ARTICLE Taylor & Francis makes every effort to ensure the accuracy of all the information (the “Content”) contained in the publications on our platform. However, Taylor & Francis, our agents, and our licensors make no representations or warranties whatsoever as to the accuracy, completeness, or suitability for any purpose of the Content. Any opinions and views expressed in this publication are the opinions and views of the authors, and are not the views of or endorsed by Taylor & Francis. The accuracy of the Content should not be relied upon and should be independently verified with primary sources of information. Taylor and Francis shall not be liable for any losses, actions, claims, proceedings, demands, costs, expenses, damages, and other liabilities whatsoever or howsoever caused arising directly or indirectly in connection with, in relation to or arising out of the use of the Content. This article may be used for research, teaching, and private study purposes. Any substantial or systematic reproduction, redistribution, reselling, loan, sub-licensing, systematic supply, or distribution in any

Welcome message from author
This document is posted to help you gain knowledge. Please leave a comment to let me know what you think about it! Share it to your friends and learn new things together.
Transcript
This article was downloaded by: [Anglia Ruskin University]On: 06 May 2014, At: 02:27Publisher: Taylor & FrancisInforma Ltd Registered in England and Wales Registered Number: 1072954 Registered office: Mortimer House,37-41 Mortimer Street, London W1T 3JH, UK
Computer Methods in Biomechanics and BiomedicalEngineeringPublication details, including instructions for authors and subscription information:http://www.tandfonline.com/loi/gcmb20
Development and validation of a computationalmodel of the knee joint for the evaluation of surgicaltreatments for osteoarthritisR. Mootanahab, C.W. Imhauserc, F. Reissea, D. Carpanena, R.W. Walkera, M.F. Koffd, M.W.Lenhoffb, S.R. Rozbruche, A.T. Fragomene, Z. Dewanb, Y.M. Kiranee, K. Cheahfa, J.K.Dowellfga & H.J. Hillstromba
a Medical Engineering Research Group, Faculty of Science and Technology, Anglia RuskinUniversity, Chelmsford, Essex, UKb Leon Root Motion Analysis Laboratory, Department of Rehabilitation, Hospital for SpecialSurgery, New York, USAc Department of Biomechanics, Hospital for Special Surgery, New York, USAd Department of Radiology and Imaging – MRI, Hospital for Special Surgery, New York, USAe Limb Lengthening and Complex Reconstruction Services, Hospital for Special Surgery, NewYork, USAf Department of Orthopaedics, Ramsay Springfield Hospital, Chelmsford, Essex, UKg Department of Orthopaedics, Mid-Essex Hospital Services Trust, Broomfield Hospital,Chelmsford, Essex, UKPublished online: 01 May 2014.
To cite this article: R. Mootanah, C.W. Imhauser, F. Reisse, D. Carpanen, R.W. Walker, M.F. Koff, M.W. Lenhoff, S.R.Rozbruch, A.T. Fragomen, Z. Dewan, Y.M. Kirane, K. Cheah, J.K. Dowell & H.J. Hillstrom (2014): Development and validationof a computational model of the knee joint for the evaluation of surgical treatments for osteoarthritis, Computer Methods inBiomechanics and Biomedical Engineering, DOI: 10.1080/10255842.2014.899588
To link to this article: http://dx.doi.org/10.1080/10255842.2014.899588
PLEASE SCROLL DOWN FOR ARTICLE
Taylor & Francis makes every effort to ensure the accuracy of all the information (the “Content”) containedin the publications on our platform. However, Taylor & Francis, our agents, and our licensors make norepresentations or warranties whatsoever as to the accuracy, completeness, or suitability for any purpose of theContent. Any opinions and views expressed in this publication are the opinions and views of the authors, andare not the views of or endorsed by Taylor & Francis. The accuracy of the Content should not be relied upon andshould be independently verified with primary sources of information. Taylor and Francis shall not be liable forany losses, actions, claims, proceedings, demands, costs, expenses, damages, and other liabilities whatsoeveror howsoever caused arising directly or indirectly in connection with, in relation to or arising out of the use ofthe Content.
This article may be used for research, teaching, and private study purposes. Any substantial or systematicreproduction, redistribution, reselling, loan, sub-licensing, systematic supply, or distribution in any
form to anyone is expressly forbidden. Terms & Conditions of access and use can be found at http://www.tandfonline.com/page/terms-and-conditions
Dow
nloa
ded
by [
Ang
lia R
uski
n U
nive
rsity
] at
02:
27 0
6 M
ay 2
014
Development and validation of a computational model of the knee joint for the evaluation ofsurgical treatments for osteoarthritis
R. Mootanaha,b*, C.W. Imhauserc, F. Reissea, D. Carpanena, R.W. Walkera, M.F. Koffd, M.W. Lenhoffb, S.R. Rozbruche,
A.T. Fragomene, Z. Dewanb, Y.M. Kiranee, K. Cheaha,f, J.K. Dowella,f,g and H.J. Hillstroma,b
aMedical Engineering Research Group, Faculty of Science and Technology, Anglia Ruskin University, Chelmsford, Essex, UK;bLeon Root Motion Analysis Laboratory, Department of Rehabilitation, Hospital for Special Surgery, New York, USA; cDepartment ofBiomechanics, Hospital for Special Surgery, New York, USA; dDepartment of Radiology and Imaging – MRI, Hospital for SpecialSurgery, New York, USA; eLimb Lengthening and Complex Reconstruction Services, Hospital for Special Surgery, New York, USA;
fDepartment of Orthopaedics, Ramsay Springfield Hospital, Chelmsford, Essex, UK; gDepartment of Orthopaedics, Mid-Essex HospitalServices Trust, Broomfield Hospital, Chelmsford, Essex, UK
(Received 14 October 2013; accepted 26 February 2014)
A three-dimensional (3D) knee joint computational model was developed and validated to predict knee joint contact forcesand pressures for different degrees of malalignment. A 3D computational knee model was created from high-resolutionradiological images to emulate passive sagittal rotation (full-extension to 658-flexion) and weight acceptance. A cadavericknee mounted on a six-degree-of-freedom robot was subjected to matching boundary and loading conditions. A ligament-tuning process minimised kinematic differences between the robotically loaded cadaver specimen and the finite element(FE) model. The model was validated by measured intra-articular force and pressure measurements. Percent full scale errorbetween FE-predicted and in vitro-measured values in the medial and lateral compartments were 6.67% and 5.94%,respectively, for normalised peak pressure values, and 7.56% and 4.48%, respectively, for normalised force values. The kneemodel can accurately predict normalised intra-articular pressure and forces for different loading conditions and could befurther developed for subject-specific surgical planning.
Keywords: subject-specific finite element knee model; knee joint contact mechanics; osteoarthritis; model validation;in vitro cadaveric test; lower limb malalignment
Introduction
Osteoarthritis (OA) is a degenerative disease that often
leads to significant pain, loss of joint function and is the
leading cause of physical disability in the elderly (Cooper
et al. 2013). The World Health Organization reported that
OA accounted for 1%of total deaths in 2002worldwide and
was projected to be the tenth leading cause of disability
adjusted life years (2.5%) in high-income countries by 2015
(Mathers and Loncar 2006). About 14% of men and 23% of
women over 45 years of age in the USA and Europe show
radiographic signs of knee OA (Valkenburg 1980). The
total annual cost of OA to the UK economy is estimated at
£12 billion (1% of the annual gross national product) and
$185.5 billion to the USA (Mathers and Loncar 2006).
Joint malalignment is a strong predictor of the
development andprogressionofOA(Peterssonand Jacobsson
2002). Absent a cure, current therapeutic approaches cannot
arrest or reverse disease progression for OA. As little as 58 ofvarus malalignment increases the compressive forces in the
medial compartment from 70% to 90% of the total knee joint
load (Tetsworth and Paley 1994). A slight malalignment may
initiate a vicious cycle where the increased compartment
pressures produce more laxity and joint deformity, thereby
increasing malalignment perpetuating the process (Coventry
1965, 2001). A prospective study by Sharma et al. (2001)
suggested that kneeOAcanprogress in as little as 18months if
treated in a palliative manner (Sharma et al. 2001).
Excessive joint pressure is considered the common
pathway that damages tissues within the diarthrodial joint.
The effect of different treatment strategies on the
magnitude of knee joint contact loading and compartmental
distribution is not well understood. Furthermore, planning
surgical procedures to relieve damaged tissues from
excessive loading is limited.
High tibial osteotomy (HTO) is a surgical
technique used to correct lower limb malalignment in mild
tomoderate knee OA patients (Coventry 1965). The clinical
standard of care is for surgeons to use a two-dimensional
(2D) frontal plane radiograph to plan alignment correction,
based on reducing the deviation from the knee centre to the
q 2014 Taylor & Francis
*Corresponding author. Email: [email protected] research published in this paper won the Materialise Mimics Innovation Award in Category 3: Orthopaedic Applications. This prize forinnovative research was awarded to Dr Rajshree Mootanah of Anglia Ruskin University, UK, and Dr Howard Hillstrom of the Hospital forSpecial Surgery, USA, who were among 85 international applicants considered for the award. See http://biomedical.materialise.com/MIA
Computer Methods in Biomechanics and Biomedical Engineering, 2014
http://dx.doi.org/10.1080/10255842.2014.899588
Dow
nloa
ded
by [
Ang
lia R
uski
n U
nive
rsity
] at
02:
27 0
6 M
ay 2
014
mechanical axis (a line connecting the centres of the hip
to the ankle). This procedure has met with inconsistent
results and differing 10-year survivorships (Rinonapoli et al.
1998; Virolainen and Aro 2004; Dowd et al. 2006).
However, given that the HTO does not violate the joint,
it may be considered a conservative procedure for treating
knee OA.
Computer modelling (Specogna et al. 2007; Bhatnagar
and Jenkyn 2010), cadaveric and gait (Johnson et al. 1980;
Andriacchi et al. 2000; Hurwitz et al. 2002) studies have
contributed some basic understanding (Andriacchi et al.
2000; Chao 2003; Zhim et al. 2005; Agneskirchner et al.
2006) of the procedure but nomethod currently exists to plan
malalignment correction to minimise excessive knee joint
pressure (Dorsey et al. 2006;Esenkaya et al. 2007;Bhatnagar
and Jenkyn 2010). The 2Dmodel implemented in theOASIS
software by Chao et al., although capable of estimating
contact forces, cannot predict contact stress (Chao and Sim
1995; Chao 2003). Furthermore, Chao’s model is con-
strained to the frontal plane and is limited in its capability to
evaluate loading response at different sagittal knee flexion
angles to simulate peak loading during the gait cycle.
The specific aims of this study were to develop and
validate a three-dimensional (3D) computational knee
joint model. Model validation was carried out by
comparing the predicted knee joint contact mechanics
with those obtained from in vitro experiments, using the
same cadaveric knee from which the model was built and
identical loading conditions.
We hypothesise that tibio-femoral contact mechanics
(normalised peak pressure, force and compartmental force
distribution) of the cadaver specimen and corresponding
finite element (FE) model predictions will agree within
10% for the same boundary conditions.
Methods
A subject-specific FE model of a cadaveric knee joint was
created and compared with in vitro testing that emulated the
end of weight acceptance during the stance phase of gait,
when the knee is subjected to high loads. This model is an
implicit quasi-staticmodel.Loading levelswere changedvery
slowly in the cadaver testing. Discrete loads were applied to
the FE model (axial force and bending moments) and the
resulting joint contact forces and stress were computed.
Model specimen
The left lower extremity of an anonymous 50-year-old male
was obtained from a tissue bank, screened negative for
blood-borne pathogens, truncated to 15 cm above and below
the knee joint, secured in a sealed plastic bag and taken to the
Hospital for Special Surgery (HSS) Radiology Department
for magnetic resonance imaging (MRI).
3D imaging protocol of the knee
MRI data of the knee joint were generated with different
contrast mechanisms. Scanning was carried out on a clinical
3.0 T system (GE Healthcare, Waukesha, WI, USA), using
an eight-channel transit-receive phased array knee coil
(Invivo, Orlando, FL, USA). Two scanning sequences (3D
T1-weighted frequency selective fat-suppressed spoiled
gradient recalled echo (SPGR)and3DCUBE)were acquired
to generate a volumetric data-set for segmentation of
cartilage, bone, meniscus, and ligament structures to
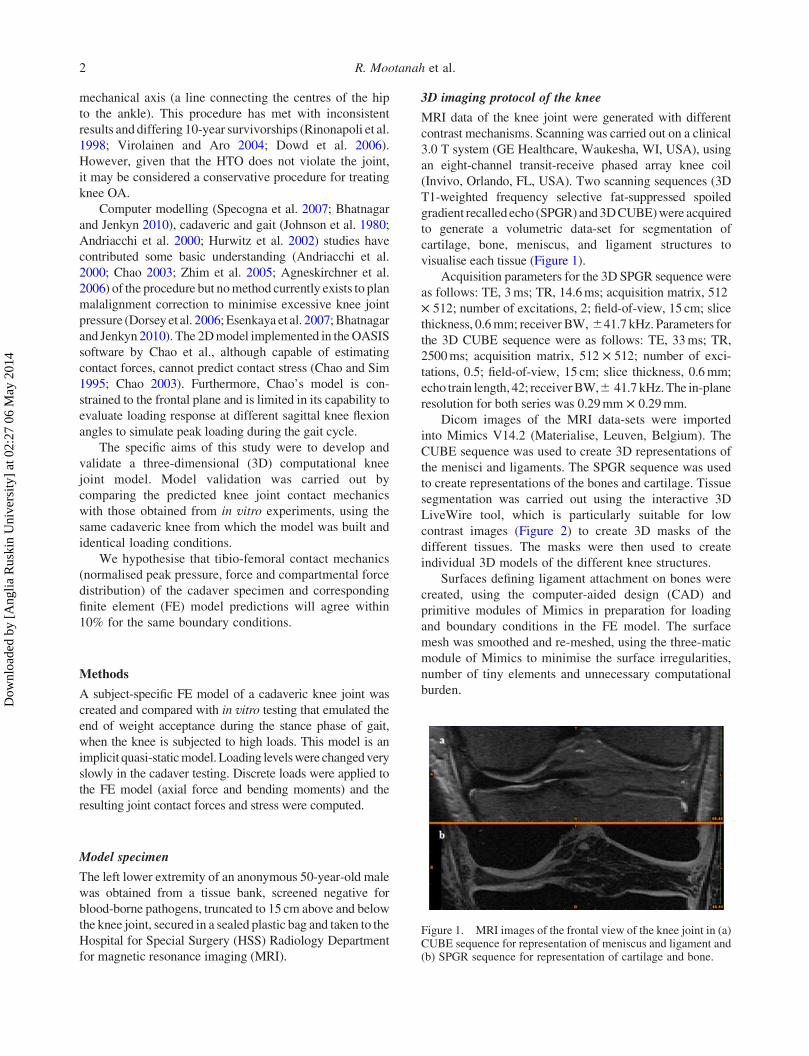
visualise each tissue (Figure 1).
Acquisition parameters for the 3D SPGR sequence were
as follows: TE, 3ms; TR, 14.6ms; acquisition matrix, 512
£ 512; number of excitations, 2; field-of-view, 15 cm; slice
thickness, 0.6mm; receiver BW, ^41.7 kHz. Parameters for
the 3D CUBE sequence were as follows: TE, 33ms; TR,
2500ms; acquisition matrix, 512 £ 512; number of exci-
tations, 0.5; field-of-view, 15 cm; slice thickness, 0.6mm;
echo train length, 42; receiverBW,^ 41.7 kHz.The in-plane
resolution for both series was 0.29mm £ 0.29mm.
Dicom images of the MRI data-sets were imported
into Mimics V14.2 (Materialise, Leuven, Belgium). The
CUBE sequence was used to create 3D representations of
the menisci and ligaments. The SPGR sequence was used
to create representations of the bones and cartilage. Tissue
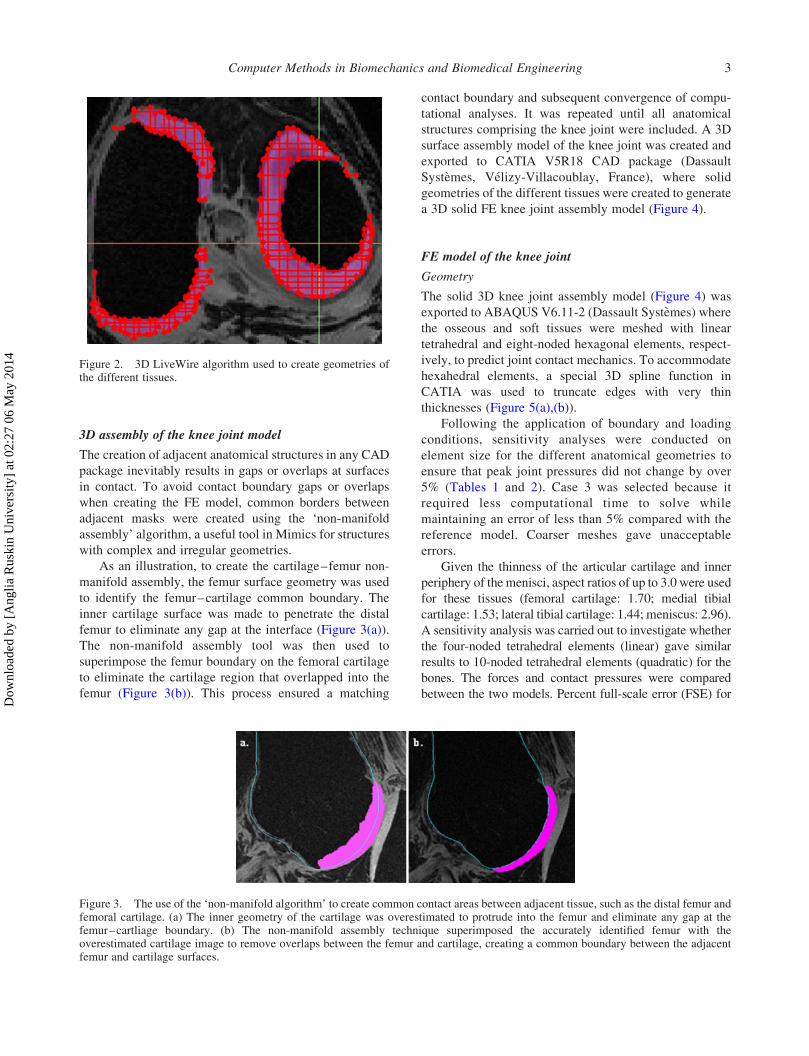
segmentation was carried out using the interactive 3D
LiveWire tool, which is particularly suitable for low
contrast images (Figure 2) to create 3D masks of the
different tissues. The masks were then used to create
individual 3D models of the different knee structures.
Surfaces defining ligament attachment on bones were
created, using the computer-aided design (CAD) and
primitive modules of Mimics in preparation for loading
and boundary conditions in the FE model. The surface
mesh was smoothed and re-meshed, using the three-matic
module of Mimics to minimise the surface irregularities,
number of tiny elements and unnecessary computational
burden.
Figure 1. MRI images of the frontal view of the knee joint in (a)CUBE sequence for representation of meniscus and ligament and(b) SPGR sequence for representation of cartilage and bone.
R. Mootanah et al.2
Dow
nloa
ded
by [
Ang
lia R
uski
n U
nive
rsity
] at
02:
27 0
6 M
ay 2
014
3D assembly of the knee joint model
The creation of adjacent anatomical structures in any CAD
package inevitably results in gaps or overlaps at surfaces
in contact. To avoid contact boundary gaps or overlaps
when creating the FE model, common borders between
adjacent masks were created using the ‘non-manifold
assembly’ algorithm, a useful tool in Mimics for structures
with complex and irregular geometries.
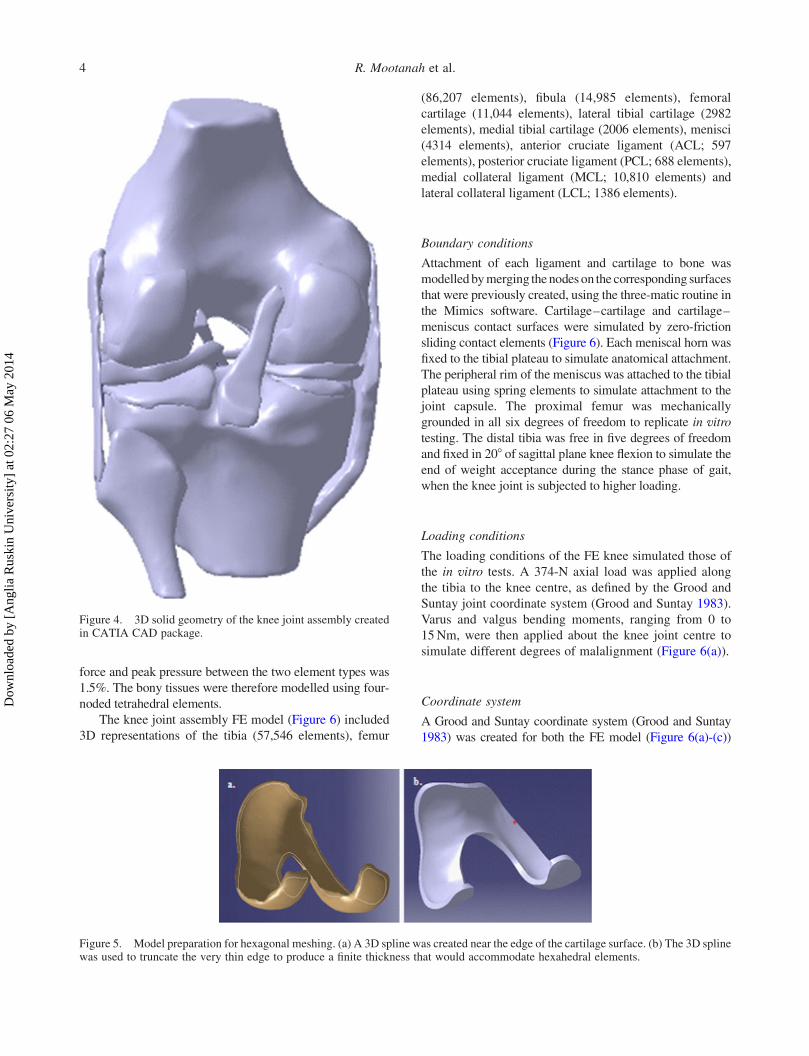
As an illustration, to create the cartilage–femur non-
manifold assembly, the femur surface geometry was used
to identify the femur–cartilage common boundary. The
inner cartilage surface was made to penetrate the distal
femur to eliminate any gap at the interface (Figure 3(a)).
The non-manifold assembly tool was then used to
superimpose the femur boundary on the femoral cartilage
to eliminate the cartilage region that overlapped into the
femur (Figure 3(b)). This process ensured a matching
contact boundary and subsequent convergence of compu-
tational analyses. It was repeated until all anatomical
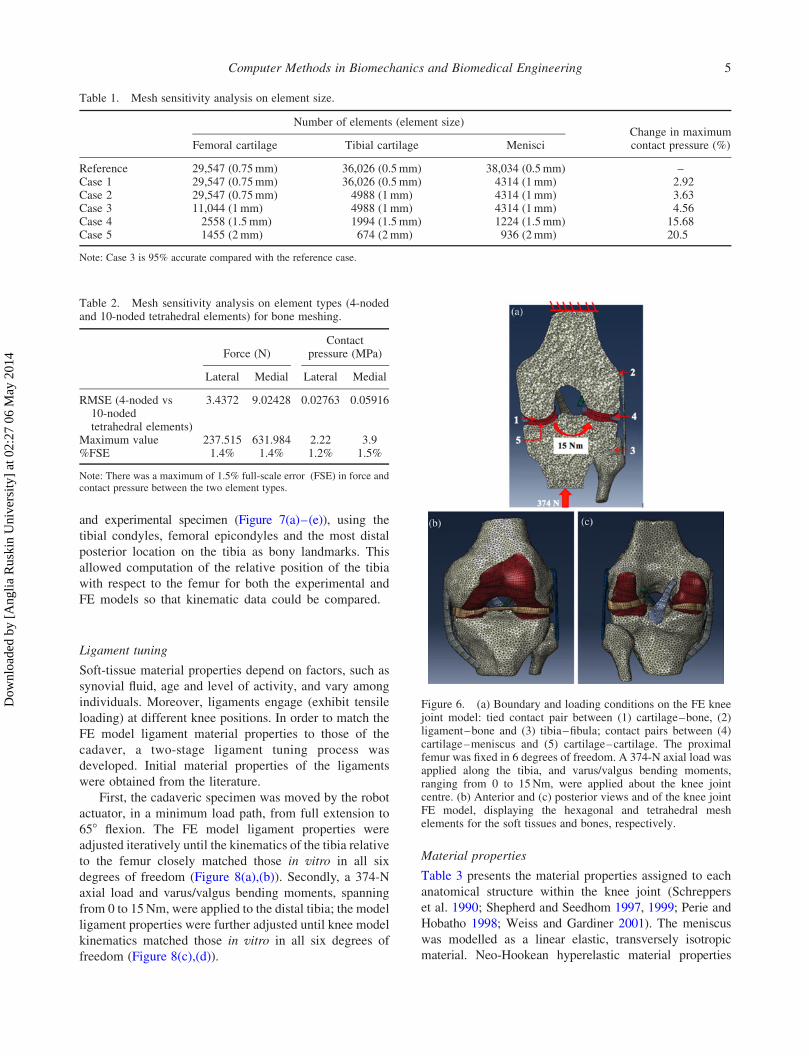
structures comprising the knee joint were included. A 3D
surface assembly model of the knee joint was created and
exported to CATIA V5R18 CAD package (Dassault
Systemes, Velizy-Villacoublay, France), where solid
geometries of the different tissues were created to generate
a 3D solid FE knee joint assembly model (Figure 4).
FE model of the knee joint
Geometry
The solid 3D knee joint assembly model (Figure 4) was
exported to ABAQUS V6.11-2 (Dassault Systemes) where
the osseous and soft tissues were meshed with linear
tetrahedral and eight-noded hexagonal elements, respect-
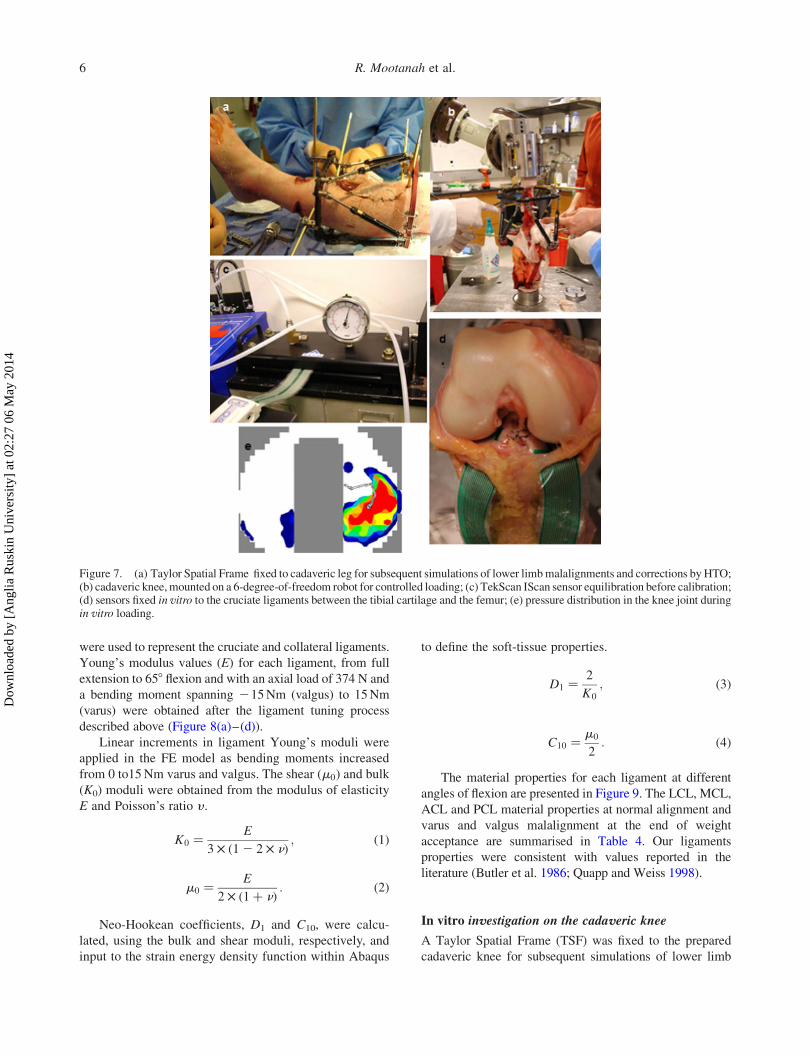
ively, to predict joint contact mechanics. To accommodate
hexahedral elements, a special 3D spline function in
CATIA was used to truncate edges with very thin
thicknesses (Figure 5(a),(b)).
Following the application of boundary and loading
conditions, sensitivity analyses were conducted on
element size for the different anatomical geometries to
ensure that peak joint pressures did not change by over
5% (Tables 1 and 2). Case 3 was selected because it
required less computational time to solve while
maintaining an error of less than 5% compared with the
reference model. Coarser meshes gave unacceptable
errors.
Given the thinness of the articular cartilage and inner
periphery of the menisci, aspect ratios of up to 3.0 were used
for these tissues (femoral cartilage: 1.70; medial tibial
cartilage: 1.53; lateral tibial cartilage: 1.44; meniscus: 2.96).
A sensitivity analysis was carried out to investigate whether
the four-noded tetrahedral elements (linear) gave similar
results to 10-noded tetrahedral elements (quadratic) for the
bones. The forces and contact pressures were compared
between the two models. Percent full-scale error (FSE) for
Figure 3. The use of the ‘non-manifold algorithm’ to create common contact areas between adjacent tissue, such as the distal femur andfemoral cartilage. (a) The inner geometry of the cartilage was overestimated to protrude into the femur and eliminate any gap at thefemur–cartliage boundary. (b) The non-manifold assembly technique superimposed the accurately identified femur with theoverestimated cartilage image to remove overlaps between the femur and cartilage, creating a common boundary between the adjacentfemur and cartilage surfaces.
Figure 2. 3D LiveWire algorithm used to create geometries ofthe different tissues.
Computer Methods in Biomechanics and Biomedical Engineering 3
Dow
nloa
ded
by [
Ang
lia R
uski
n U
nive
rsity
] at
02:
27 0
6 M
ay 2
014
force and peak pressure between the two element types was
1.5%. The bony tissues were therefore modelled using four-
noded tetrahedral elements.
The knee joint assembly FE model (Figure 6) included
3D representations of the tibia (57,546 elements), femur
(86,207 elements), fibula (14,985 elements), femoral
cartilage (11,044 elements), lateral tibial cartilage (2982
elements), medial tibial cartilage (2006 elements), menisci
(4314 elements), anterior cruciate ligament (ACL; 597
elements), posterior cruciate ligament (PCL; 688 elements),
medial collateral ligament (MCL; 10,810 elements) and
lateral collateral ligament (LCL; 1386 elements).
Boundary conditions
Attachment of each ligament and cartilage to bone was
modelledbymerging thenodeson the corresponding surfaces
that were previously created, using the three-matic routine in
the Mimics software. Cartilage–cartilage and cartilage–
meniscus contact surfaces were simulated by zero-friction
sliding contact elements (Figure 6). Each meniscal horn was
fixed to the tibial plateau to simulate anatomical attachment.
The peripheral rim of the meniscus was attached to the tibial
plateau using spring elements to simulate attachment to the
joint capsule. The proximal femur was mechanically
grounded in all six degrees of freedom to replicate in vitro
testing. The distal tibia was free in five degrees of freedom
and fixed in 208 of sagittal plane knee flexion to simulate the
end of weight acceptance during the stance phase of gait,
when the knee joint is subjected to higher loading.
Loading conditions
The loading conditions of the FE knee simulated those of
the in vitro tests. A 374-N axial load was applied along
the tibia to the knee centre, as defined by the Grood and
Suntay joint coordinate system (Grood and Suntay 1983).
Varus and valgus bending moments, ranging from 0 to
15Nm, were then applied about the knee joint centre to
simulate different degrees of malalignment (Figure 6(a)).
Coordinate system
A Grood and Suntay coordinate system (Grood and Suntay
1983) was created for both the FE model (Figure 6(a)-(c))
Figure 5. Model preparation for hexagonal meshing. (a) A 3D spline was created near the edge of the cartilage surface. (b) The 3D splinewas used to truncate the very thin edge to produce a finite thickness that would accommodate hexahedral elements.
Figure 4. 3D solid geometry of the knee joint assembly createdin CATIA CAD package.
R. Mootanah et al.4
Dow
nloa
ded
by [
Ang
lia R
uski
n U
nive
rsity
] at
02:
27 0
6 M
ay 2
014
and experimental specimen (Figure 7(a)–(e)), using the
tibial condyles, femoral epicondyles and the most distal
posterior location on the tibia as bony landmarks. This
allowed computation of the relative position of the tibia
with respect to the femur for both the experimental and
FE models so that kinematic data could be compared.
Ligament tuning
Soft-tissue material properties depend on factors, such as
synovial fluid, age and level of activity, and vary among
individuals. Moreover, ligaments engage (exhibit tensile
loading) at different knee positions. In order to match the
FE model ligament material properties to those of the
cadaver, a two-stage ligament tuning process was
developed. Initial material properties of the ligaments
were obtained from the literature.
First, the cadaveric specimen was moved by the robot
actuator, in a minimum load path, from full extension to
658 flexion. The FE model ligament properties were
adjusted iteratively until the kinematics of the tibia relative
to the femur closely matched those in vitro in all six
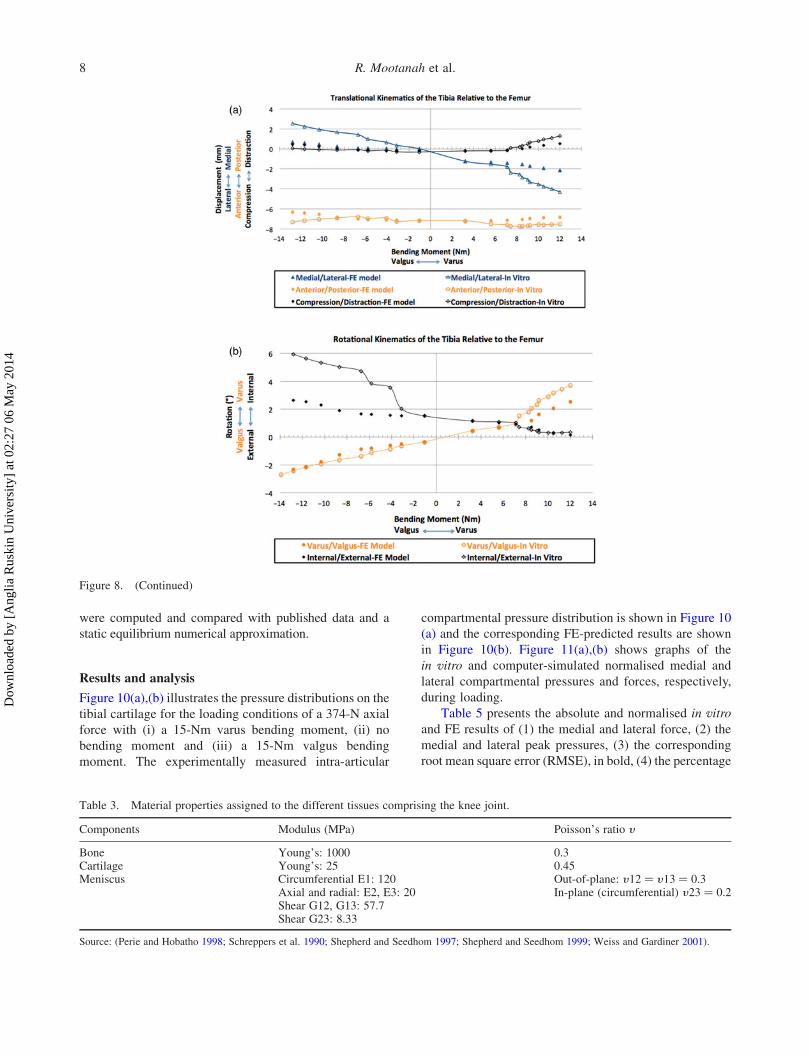
degrees of freedom (Figure 8(a),(b)). Secondly, a 374-N
axial load and varus/valgus bending moments, spanning
from 0 to 15Nm, were applied to the distal tibia; the model
ligament properties were further adjusted until knee model
kinematics matched those in vitro in all six degrees of
freedom (Figure 8(c),(d)).
Material properties
Table 3 presents the material properties assigned to each
anatomical structure within the knee joint (Schreppers
et al. 1990; Shepherd and Seedhom 1997, 1999; Perie and
Hobatho 1998; Weiss and Gardiner 2001). The meniscus
was modelled as a linear elastic, transversely isotropic
material. Neo-Hookean hyperelastic material properties
Table 1. Mesh sensitivity analysis on element size.
Number of elements (element size)Change in maximumcontact pressure (%)Femoral cartilage Tibial cartilage Menisci
Reference 29,547 (0.75mm) 36,026 (0.5mm) 38,034 (0.5mm) –Case 1 29,547 (0.75mm) 36,026 (0.5mm) 4314 (1mm) 2.92Case 2 29,547 (0.75mm) 4988 (1mm) 4314 (1mm) 3.63Case 3 11,044 (1mm) 4988 (1mm) 4314 (1mm) 4.56Case 4 2558 (1.5mm) 1994 (1.5mm) 1224 (1.5mm) 15.68Case 5 1455 (2mm) 674 (2mm) 936 (2mm) 20.5
Note: Case 3 is 95% accurate compared with the reference case.
Figure 6. (a) Boundary and loading conditions on the FE kneejoint model: tied contact pair between (1) cartilage–bone, (2)ligament–bone and (3) tibia–fibula; contact pairs between (4)cartilage–meniscus and (5) cartilage–cartilage. The proximalfemur was fixed in 6 degrees of freedom. A 374-N axial load wasapplied along the tibia, and varus/valgus bending moments,ranging from 0 to 15Nm, were applied about the knee jointcentre. (b) Anterior and (c) posterior views and of the knee jointFE model, displaying the hexagonal and tetrahedral meshelements for the soft tissues and bones, respectively.
Table 2. Mesh sensitivity analysis on element types (4-nodedand 10-noded tetrahedral elements) for bone meshing.
Force (N)Contact
pressure (MPa)
Lateral Medial Lateral Medial
RMSE (4-noded vs10-nodedtetrahedral elements)
3.4372 9.02428 0.02763 0.05916
Maximum value 237.515 631.984 2.22 3.9%FSE 1.4% 1.4% 1.2% 1.5%
Note: There was a maximum of 1.5% full-scale error (FSE) in force andcontact pressure between the two element types.
Computer Methods in Biomechanics and Biomedical Engineering 5
Dow
nloa
ded
by [
Ang
lia R
uski
n U
nive
rsity
] at
02:
27 0
6 M
ay 2
014
were used to represent the cruciate and collateral ligaments.
Young’s modulus values (E) for each ligament, from full
extension to 658 flexion and with an axial load of 374 N and
a bending moment spanning 215Nm (valgus) to 15Nm
(varus) were obtained after the ligament tuning process
described above (Figure 8(a)–(d)).
Linear increments in ligament Young’s moduli were
applied in the FE model as bending moments increased
from 0 to15Nm varus and valgus. The shear (m0) and bulk
(K0) moduli were obtained from the modulus of elasticity
E and Poisson’s ratio y .
K0 ¼ E
3 £ ð12 2 £ nÞ ; ð1Þ
m0 ¼ E
2 £ ð1þ nÞ : ð2Þ
Neo-Hookean coefficients, D1 and C10, were calcu-
lated, using the bulk and shear moduli, respectively, and
input to the strain energy density function within Abaqus
to define the soft-tissue properties.
D1 ¼ 2
K0
; ð3Þ
C10 ¼ m0
2: ð4Þ
The material properties for each ligament at different
angles of flexion are presented in Figure 9. The LCL, MCL,
ACL and PCL material properties at normal alignment and
varus and valgus malalignment at the end of weight
acceptance are summarised in Table 4. Our ligaments
properties were consistent with values reported in the
literature (Butler et al. 1986; Quapp and Weiss 1998).
In vitro investigation on the cadaveric knee
A Taylor Spatial Frame (TSF) was fixed to the prepared
cadaveric knee for subsequent simulations of lower limb
Figure 7. (a) Taylor Spatial Frame fixed to cadaveric leg for subsequent simulations of lower limbmalalignments and corrections byHTO;(b) cadaveric knee,mounted on a 6-degree-of-freedom robot for controlled loading; (c) TekScan IScan sensor equilibration before calibration;(d) sensors fixed in vitro to the cruciate ligaments between the tibial cartilage and the femur; (e) pressure distribution in the knee joint duringin vitro loading.
R. Mootanah et al.6
Dow
nloa
ded
by [
Ang
lia R
uski
n U
nive
rsity
] at
02:
27 0
6 M
ay 2
014
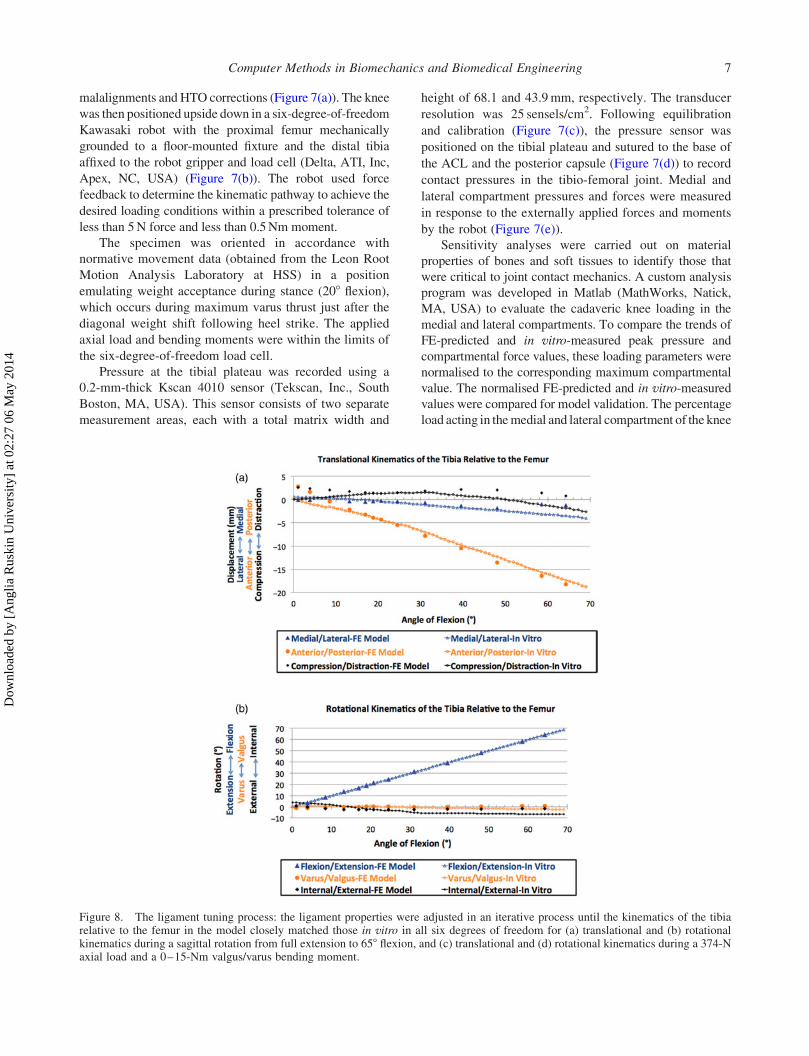
malalignments and HTO corrections (Figure 7(a)). The knee
was then positioned upside down in a six-degree-of-freedom
Kawasaki robot with the proximal femur mechanically
grounded to a floor-mounted fixture and the distal tibia
affixed to the robot gripper and load cell (Delta, ATI, Inc,
Apex, NC, USA) (Figure 7(b)). The robot used force
feedback to determine the kinematic pathway to achieve the
desired loading conditions within a prescribed tolerance of
less than 5N force and less than 0.5Nm moment.
The specimen was oriented in accordance with
normative movement data (obtained from the Leon Root
Motion Analysis Laboratory at HSS) in a position
emulating weight acceptance during stance (208 flexion),which occurs during maximum varus thrust just after the
diagonal weight shift following heel strike. The applied
axial load and bending moments were within the limits of
the six-degree-of-freedom load cell.
Pressure at the tibial plateau was recorded using a
0.2-mm-thick Kscan 4010 sensor (Tekscan, Inc., South
Boston, MA, USA). This sensor consists of two separate
measurement areas, each with a total matrix width and
height of 68.1 and 43.9mm, respectively. The transducer
resolution was 25 sensels/cm2. Following equilibration
and calibration (Figure 7(c)), the pressure sensor was
positioned on the tibial plateau and sutured to the base of
the ACL and the posterior capsule (Figure 7(d)) to record
contact pressures in the tibio-femoral joint. Medial and
lateral compartment pressures and forces were measured
in response to the externally applied forces and moments
by the robot (Figure 7(e)).
Sensitivity analyses were carried out on material
properties of bones and soft tissues to identify those that
were critical to joint contact mechanics. A custom analysis
program was developed in Matlab (MathWorks, Natick,
MA, USA) to evaluate the cadaveric knee loading in the
medial and lateral compartments. To compare the trends of
FE-predicted and in vitro-measured peak pressure and
compartmental force values, these loading parameters were
normalised to the corresponding maximum compartmental
value. The normalised FE-predicted and in vitro-measured
values were compared for model validation. The percentage
load acting in themedial and lateral compartment of the knee
Figure 8. The ligament tuning process: the ligament properties were adjusted in an iterative process until the kinematics of the tibiarelative to the femur in the model closely matched those in vitro in all six degrees of freedom for (a) translational and (b) rotationalkinematics during a sagittal rotation from full extension to 658 flexion, and (c) translational and (d) rotational kinematics during a 374-Naxial load and a 0–15-Nm valgus/varus bending moment.
Computer Methods in Biomechanics and Biomedical Engineering 7
Dow
nloa
ded
by [
Ang
lia R
uski
n U
nive
rsity
] at
02:
27 0
6 M
ay 2
014
were computed and compared with published data and a
static equilibrium numerical approximation.
Results and analysis
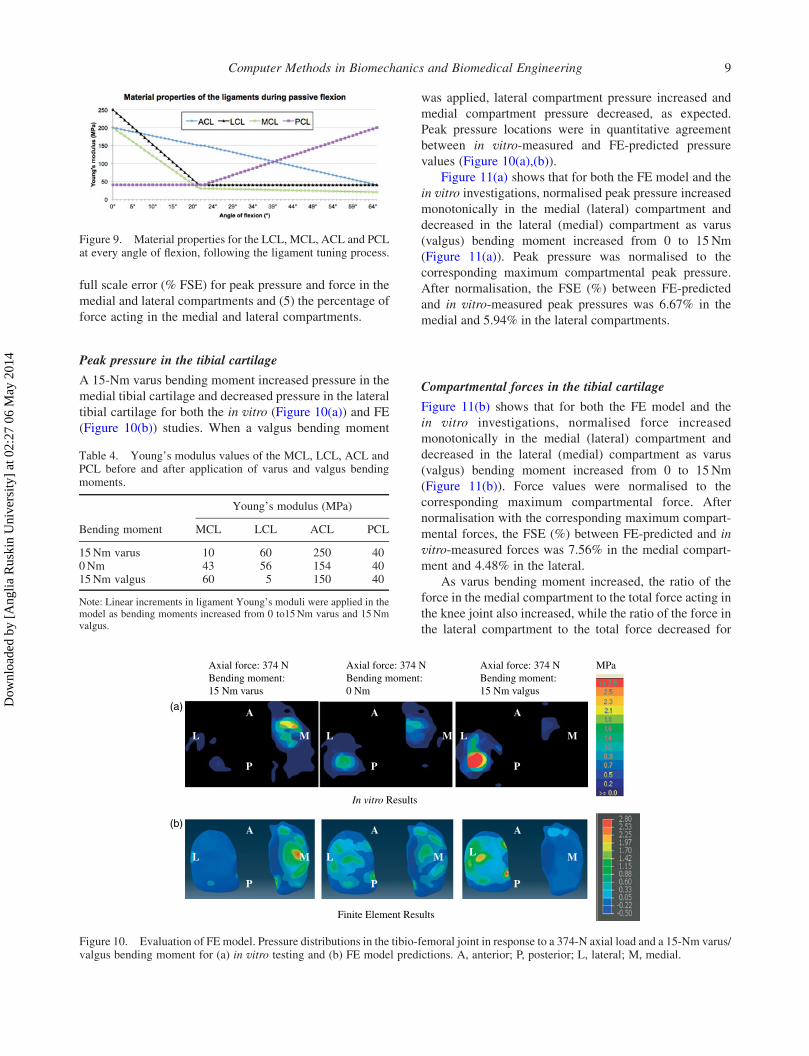
Figure 10(a),(b) illustrates the pressure distributions on the
tibial cartilage for the loading conditions of a 374-N axial
force with (i) a 15-Nm varus bending moment, (ii) no
bending moment and (iii) a 15-Nm valgus bending
moment. The experimentally measured intra-articular
compartmental pressure distribution is shown in Figure 10
(a) and the corresponding FE-predicted results are shown
in Figure 10(b). Figure 11(a),(b) shows graphs of the
in vitro and computer-simulated normalised medial and
lateral compartmental pressures and forces, respectively,
during loading.
Table 5 presents the absolute and normalised in vitro
and FE results of (1) the medial and lateral force, (2) the
medial and lateral peak pressures, (3) the corresponding
root mean square error (RMSE), in bold, (4) the percentage
Table 3. Material properties assigned to the different tissues comprising the knee joint.
Components Modulus (MPa) Poisson’s ratio y
Bone Young’s: 1000 0.3Cartilage Young’s: 25 0.45Meniscus Circumferential E1: 120
Axial and radial: E2, E3: 20Shear G12, G13: 57.7Shear G23: 8.33
Out-of-plane: y12 ¼ y13 ¼ 0.3In-plane (circumferential) y23 ¼ 0.2
Source: (Perie and Hobatho 1998; Schreppers et al. 1990; Shepherd and Seedhom 1997; Shepherd and Seedhom 1999; Weiss and Gardiner 2001).
Figure 8. (Continued)
R. Mootanah et al.8
Dow
nloa
ded
by [
Ang
lia R
uski
n U
nive
rsity
] at
02:
27 0
6 M
ay 2
014
full scale error (% FSE) for peak pressure and force in the
medial and lateral compartments and (5) the percentage of
force acting in the medial and lateral compartments.
Peak pressure in the tibial cartilage
A 15-Nm varus bending moment increased pressure in the
medial tibial cartilage and decreased pressure in the lateral
tibial cartilage for both the in vitro (Figure 10(a)) and FE
(Figure 10(b)) studies. When a valgus bending moment
was applied, lateral compartment pressure increased and
medial compartment pressure decreased, as expected.
Peak pressure locations were in quantitative agreement
between in vitro-measured and FE-predicted pressure
values (Figure 10(a),(b)).
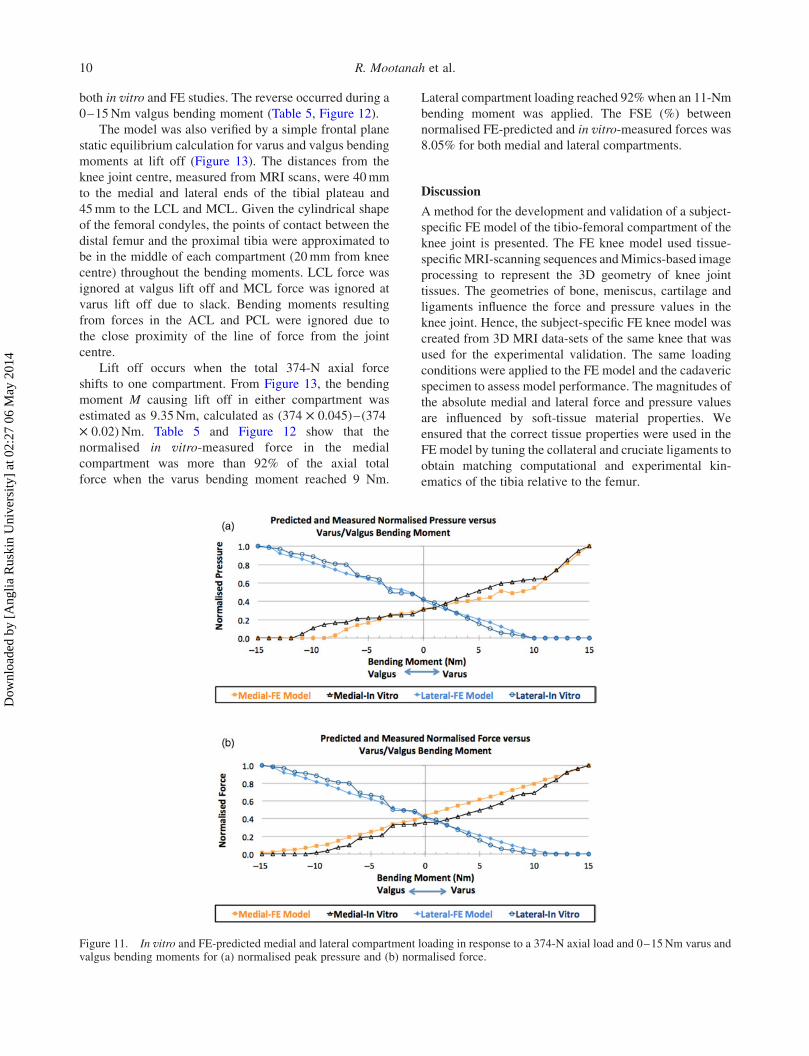
Figure 11(a) shows that for both the FE model and the
in vitro investigations, normalised peak pressure increased
monotonically in the medial (lateral) compartment and
decreased in the lateral (medial) compartment as varus
(valgus) bending moment increased from 0 to 15Nm
(Figure 11(a)). Peak pressure was normalised to the
corresponding maximum compartmental peak pressure.
After normalisation, the FSE (%) between FE-predicted
and in vitro-measured peak pressures was 6.67% in the
medial and 5.94% in the lateral compartments.
Compartmental forces in the tibial cartilage
Figure 11(b) shows that for both the FE model and the
in vitro investigations, normalised force increased
monotonically in the medial (lateral) compartment and
decreased in the lateral (medial) compartment as varus
(valgus) bending moment increased from 0 to 15Nm
(Figure 11(b)). Force values were normalised to the
corresponding maximum compartmental force. After
normalisation with the corresponding maximum compart-
mental forces, the FSE (%) between FE-predicted and in
vitro-measured forces was 7.56% in the medial compart-
ment and 4.48% in the lateral.
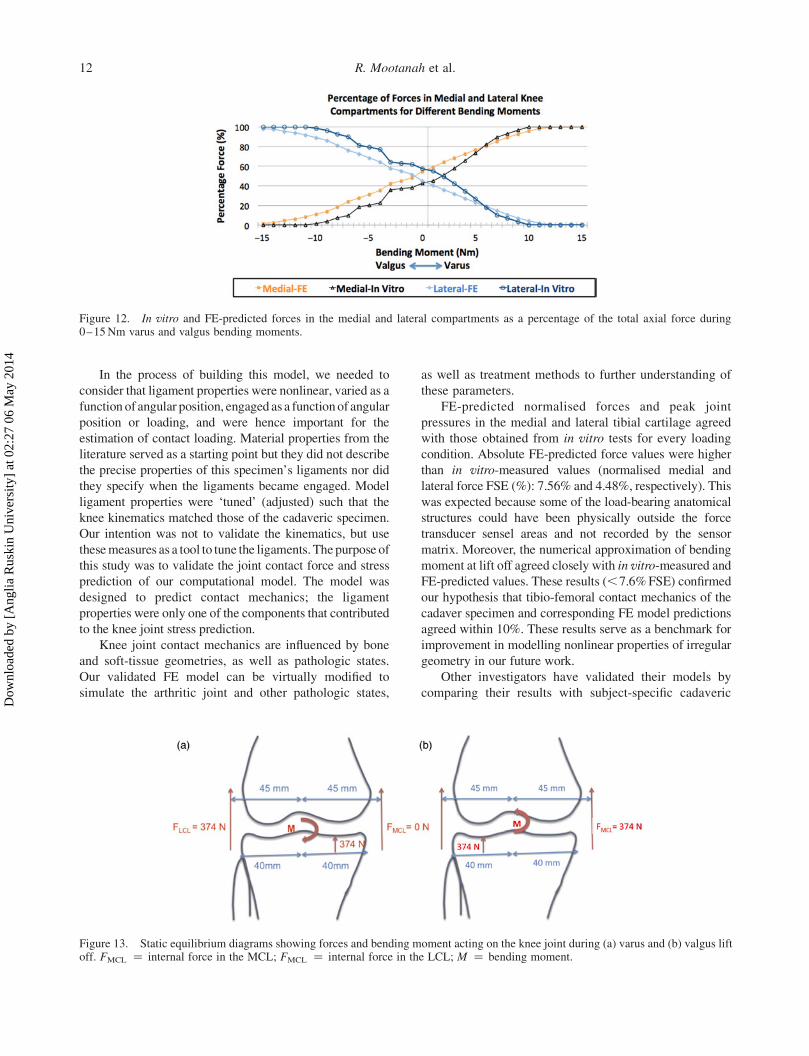
As varus bending moment increased, the ratio of the
force in the medial compartment to the total force acting in
the knee joint also increased, while the ratio of the force in
the lateral compartment to the total force decreased for
Table 4. Young’s modulus values of the MCL, LCL, ACL andPCL before and after application of varus and valgus bendingmoments.
Young’s modulus (MPa)
Bending moment MCL LCL ACL PCL
15Nm varus 10 60 250 400Nm 43 56 154 4015Nm valgus 60 5 150 40
Note: Linear increments in ligament Young’s moduli were applied in themodel as bending moments increased from 0 to15Nm varus and 15Nmvalgus.
Figure 9. Material properties for the LCL, MCL, ACL and PCLat every angle of flexion, following the ligament tuning process.
Axial force: 374 NBending moment: 15 Nm varus
Axial force: 374 NBending moment: 0 Nm
Axial force: 374 NBending moment: 15 Nm valgus
A A A
PP P
MM M LL L
A A A
PP P
MM M LL L
In vitro Results
Finite Element Results
MPa
(a)
(b)
Figure 10. Evaluation of FE model. Pressure distributions in the tibio-femoral joint in response to a 374-N axial load and a 15-Nm varus/valgus bending moment for (a) in vitro testing and (b) FE model predictions. A, anterior; P, posterior; L, lateral; M, medial.
Computer Methods in Biomechanics and Biomedical Engineering 9
Dow
nloa
ded
by [
Ang
lia R
uski
n U
nive
rsity
] at
02:
27 0
6 M
ay 2
014
both in vitro and FE studies. The reverse occurred during a
0–15Nm valgus bending moment (Table 5, Figure 12).
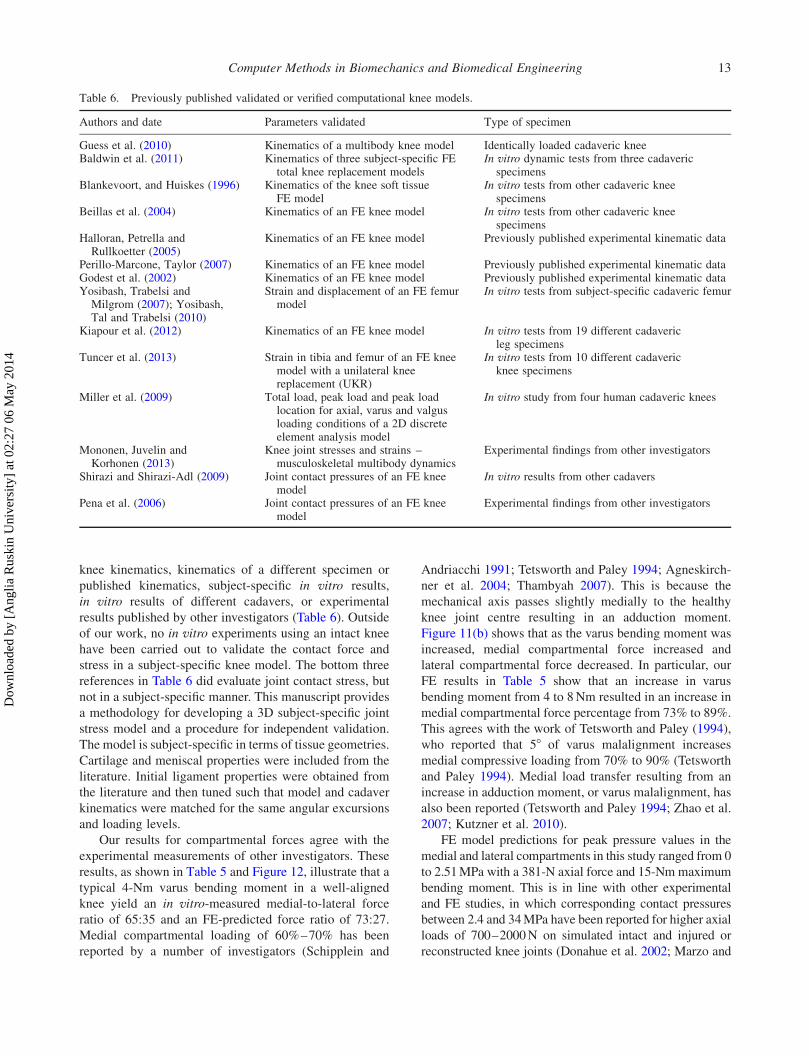
The model was also verified by a simple frontal plane
static equilibrium calculation for varus and valgus bending
moments at lift off (Figure 13). The distances from the
knee joint centre, measured from MRI scans, were 40mm
to the medial and lateral ends of the tibial plateau and
45mm to the LCL and MCL. Given the cylindrical shape
of the femoral condyles, the points of contact between the
distal femur and the proximal tibia were approximated to
be in the middle of each compartment (20mm from knee
centre) throughout the bending moments. LCL force was
ignored at valgus lift off and MCL force was ignored at
varus lift off due to slack. Bending moments resulting
from forces in the ACL and PCL were ignored due to
the close proximity of the line of force from the joint
centre.
Lift off occurs when the total 374-N axial force
shifts to one compartment. From Figure 13, the bending
moment M causing lift off in either compartment was
estimated as 9.35Nm, calculated as (374 £ 0.045)–(374
£ 0.02) Nm. Table 5 and Figure 12 show that the
normalised in vitro-measured force in the medial
compartment was more than 92% of the axial total
force when the varus bending moment reached 9 Nm.
Lateral compartment loading reached 92%when an 11-Nm
bending moment was applied. The FSE (%) between
normalised FE-predicted and in vitro-measured forces was
8.05% for both medial and lateral compartments.
Discussion
A method for the development and validation of a subject-
specific FE model of the tibio-femoral compartment of the
knee joint is presented. The FE knee model used tissue-
specificMRI-scanning sequences andMimics-based image
processing to represent the 3D geometry of knee joint
tissues. The geometries of bone, meniscus, cartilage and
ligaments influence the force and pressure values in the
knee joint. Hence, the subject-specific FE knee model was
created from 3D MRI data-sets of the same knee that was
used for the experimental validation. The same loading
conditions were applied to the FE model and the cadaveric
specimen to assess model performance. The magnitudes of
the absolute medial and lateral force and pressure values
are influenced by soft-tissue material properties. We
ensured that the correct tissue properties were used in the
FE model by tuning the collateral and cruciate ligaments to
obtain matching computational and experimental kin-
ematics of the tibia relative to the femur.
Figure 11. In vitro and FE-predicted medial and lateral compartment loading in response to a 374-N axial load and 0–15Nm varus andvalgus bending moments for (a) normalised peak pressure and (b) normalised force.
R. Mootanah et al.10
Dow
nloa
ded
by [
Ang
lia R
uski
n U
nive
rsity
] at
02:
27 0
6 M
ay 2
014
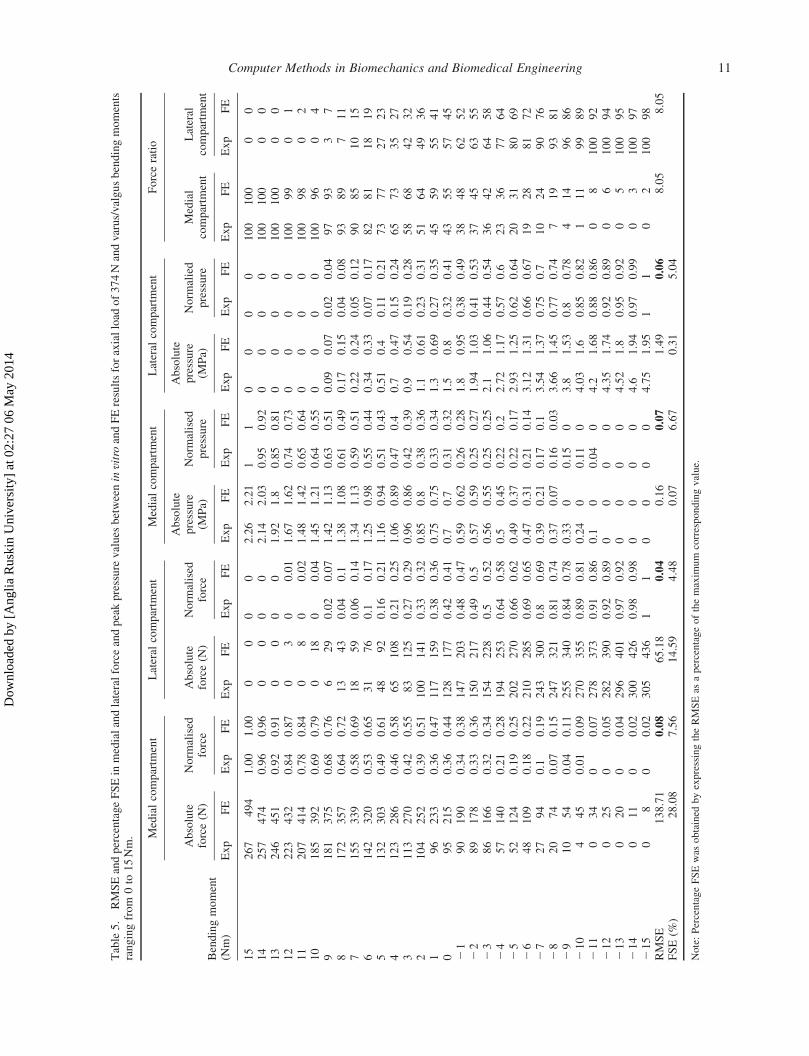
Table5.
RMSEandpercentageFSEin
medialandlateralforceandpeakpressure
values
betweeninvitro
andFEresultsforaxialload
of374Nandvarus/valgusbendingmoments
rangingfrom
0to
15Nm. Medialcompartm
ent
Lateral
compartm
ent
Medialcompartm
ent
Lateral
compartm
ent
Forceratio
Bendingmoment
(Nm)
Absolute
force(N
)Norm
alised
force
Absolute
force(N
)Norm
alised
force
Absolute
pressure
(MPa)
Norm
alised
pressure
Absolute
pressure
(MPa)
Norm
alied
pressure
Medial
compartm
ent
Lateral
compartm
ent
Exp
FE
Exp
FE
Exp
FE
Exp
FE
Exp
FE
Exp
FE
Exp
FE
Exp
FE
Exp
FE
Exp
FE
15
267
494
1.00
1.00
00
00
2.26
2.21
11
00
00
100
100
00
14
257
474
0.96
0.96
00
00
2.14
2.03
0.95
0.92
00
00
100
100
00
13
246
451
0.92
0.91
00
00
1.92
1.8
0.85
0.81
00
00
100
100
00
12
223
432
0.84
0.87
03
00.01
1.67
1.62
0.74
0.73
00
00
100
99
01
11
207
414
0.78
0.84
08
00.02
1.48
1.42
0.65
0.64
00
00
100
98
02
10
185
392
0.69
0.79
018
00.04
1.45
1.21
0.64
0.55
00
00
100
96
04
9181
375
0.68
0.76
629
0.02
0.07
1.42
1.13
0.63
0.51
0.09
0.07
0.02
0.04
97
93
37
8172
357
0.64
0.72
13
43
0.04
0.1
1.38
1.08
0.61
0.49
0.17
0.15
0.04
0.08
93
89
711
7155
339
0.58
0.69
18
59
0.06
0.14
1.34
1.13
0.59
0.51
0.22
0.24
0.05
0.12
90
85
10
15
6142
320
0.53
0.65
31
76
0.1
0.17
1.25
0.98
0.55
0.44
0.34
0.33
0.07
0.17
82
81
18
19
5132
303
0.49
0.61
48
92
0.16
0.21
1.16
0.94
0.51
0.43
0.51
0.4
0.11
0.21
73
77
27
23
4123
286
0.46
0.58
65
108
0.21
0.25
1.06
0.89
0.47
0.4
0.7
0.47
0.15
0.24
65
73
35
27
3113
270
0.42
0.55
83
125
0.27
0.29
0.96
0.86
0.42
0.39
0.9
0.54
0.19
0.28
58
68
42
32
2104
252
0.39
0.51
100
141
0.33
0.32
0.85
0.8
0.38
0.36
1.1
0.61
0.23
0.31
51
64
49
36
196
233
0.36
0.47
117
159
0.38
0.36
0.75
0.75
0.33
0.34
1.3
0.69
0.27
0.35
45
59
55
41
095
215
0.36
0.44
128
177
0.42
0.41
0.7
0.7
0.31
0.32
1.5
0.8
0.32
0.41
43
55
57
45
21
90
190
0.34
0.38
147
203
0.48
0.47
0.59
0.62
0.26
0.28
1.8
0.95
0.38
0.49
38
48
62
52
22
89
178
0.33
0.36
150
217
0.49
0.5
0.57
0.59
0.25
0.27
1.94
1.03
0.41
0.53
37
45
63
55
23
86
166
0.32
0.34
154
228
0.5
0.52
0.56
0.55
0.25
0.25
2.1
1.06
0.44
0.54
36
42
64
58
24
57
140
0.21
0.28
194
253
0.64
0.58
0.5
0.45
0.22
0.2
2.72
1.17
0.57
0.6
23
36
77
64
25
52
124
0.19
0.25
202
270
0.66
0.62
0.49
0.37
0.22
0.17
2.93
1.25
0.62
0.64
20
31
80
69
26
48
109
0.18
0.22
210
285
0.69
0.65
0.47
0.31
0.21
0.14
3.12
1.31
0.66
0.67
19
28
81
72
27
27
94
0.1
0.19
243
300
0.8
0.69
0.39
0.21
0.17
0.1
3.54
1.37
0.75
0.7
10
24
90
76
28
20
74
0.07
0.15
247
321
0.81
0.74
0.37
0.07
0.16
0.03
3.66
1.45
0.77
0.74
719
93
81
29
10
54
0.04
0.11
255
340
0.84
0.78
0.33
00.15
03.8
1.53
0.8
0.78
414
96
86
210
445
0.01
0.09
270
355
0.89
0.81
0.24
00.11
04.03
1.6
0.85
0.82
111
99
89
211
034
00.07
278
373
0.91
0.86
0.1
00.04
04.2
1.68
0.88
0.86
08
100
92
212
025
00.05
282
390
0.92
0.89
00
00
4.35
1.74
0.92
0.89
06
100
94
213
020
00.04
296
401
0.97
0.92
00
00
4.52
1.8
0.95
0.92
05
100
95
214
011
00.02
300
426
0.98
0.98
00
00
4.6
1.94
0.97
0.99
03
100
97
215
08
00.02
305
436
11
00
00
4.75
1.95
11
02
100
98
RMSE
138.71
0.08
65.18
0.04
0.16
0.07
1.49
0.06
8.05
8.05
FSE(%
)28.08
7.56
14.59
4.48
0.07
6.67
0.31
5.04
Note:PercentageFSEwas
obtained
byexpressingtheRMSEas
apercentageofthemaxim
um
correspondingvalue.
Computer Methods in Biomechanics and Biomedical Engineering 11
Dow
nloa
ded
by [
Ang
lia R
uski
n U
nive
rsity
] at
02:
27 0
6 M
ay 2
014
In the process of building this model, we needed to
consider that ligament properties were nonlinear, varied as a
function of angular position, engaged as a functionof angular
position or loading, and were hence important for the
estimation of contact loading. Material properties from the
literature served as a starting point but they did not describe
the precise properties of this specimen’s ligaments nor did
they specify when the ligaments became engaged. Model
ligament properties were ‘tuned’ (adjusted) such that the
knee kinematics matched those of the cadaveric specimen.
Our intention was not to validate the kinematics, but use
thesemeasures as a tool to tune the ligaments. The purpose of
this study was to validate the joint contact force and stress
prediction of our computational model. The model was
designed to predict contact mechanics; the ligament
properties were only one of the components that contributed
to the knee joint stress prediction.
Knee joint contact mechanics are influenced by bone
and soft-tissue geometries, as well as pathologic states.
Our validated FE model can be virtually modified to
simulate the arthritic joint and other pathologic states,
as well as treatment methods to further understanding of
these parameters.
FE-predicted normalised forces and peak joint
pressures in the medial and lateral tibial cartilage agreed
with those obtained from in vitro tests for every loading
condition. Absolute FE-predicted force values were higher
than in vitro-measured values (normalised medial and
lateral force FSE (%): 7.56% and 4.48%, respectively). This
was expected because some of the load-bearing anatomical
structures could have been physically outside the force
transducer sensel areas and not recorded by the sensor
matrix. Moreover, the numerical approximation of bending
moment at lift off agreed closely with in vitro-measured and
FE-predicted values. These results (,7.6%FSE) confirmed
our hypothesis that tibio-femoral contact mechanics of the
cadaver specimen and corresponding FE model predictions
agreed within 10%. These results serve as a benchmark for
improvement in modelling nonlinear properties of irregular
geometry in our future work.
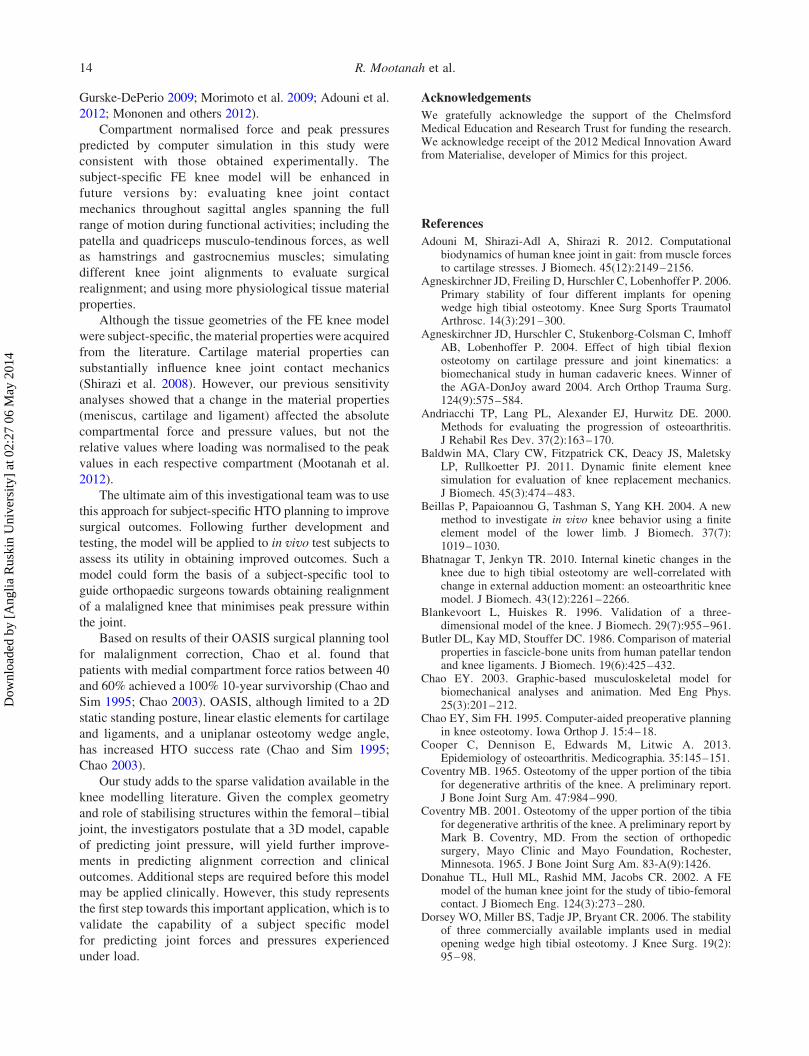
Other investigators have validated their models by
comparing their results with subject-specific cadaveric
Figure 13. Static equilibrium diagrams showing forces and bending moment acting on the knee joint during (a) varus and (b) valgus liftoff. FMCL ¼ internal force in the MCL; FMCL ¼ internal force in the LCL; M ¼ bending moment.
Figure 12. In vitro and FE-predicted forces in the medial and lateral compartments as a percentage of the total axial force during0–15Nm varus and valgus bending moments.
R. Mootanah et al.12
Dow
nloa
ded
by [
Ang
lia R
uski
n U
nive
rsity
] at
02:
27 0
6 M
ay 2
014
knee kinematics, kinematics of a different specimen or
published kinematics, subject-specific in vitro results,
in vitro results of different cadavers, or experimental
results published by other investigators (Table 6). Outside
of our work, no in vitro experiments using an intact knee
have been carried out to validate the contact force and
stress in a subject-specific knee model. The bottom three
references in Table 6 did evaluate joint contact stress, but
not in a subject-specific manner. This manuscript provides
a methodology for developing a 3D subject-specific joint
stress model and a procedure for independent validation.
The model is subject-specific in terms of tissue geometries.
Cartilage and meniscal properties were included from the
literature. Initial ligament properties were obtained from
the literature and then tuned such that model and cadaver
kinematics were matched for the same angular excursions
and loading levels.
Our results for compartmental forces agree with the
experimental measurements of other investigators. These
results, as shown in Table 5 and Figure 12, illustrate that a
typical 4-Nm varus bending moment in a well-aligned
knee yield an in vitro-measured medial-to-lateral force
ratio of 65:35 and an FE-predicted force ratio of 73:27.
Medial compartmental loading of 60%–70% has been
reported by a number of investigators (Schipplein and
Andriacchi 1991; Tetsworth and Paley 1994; Agneskirch-
ner et al. 2004; Thambyah 2007). This is because the
mechanical axis passes slightly medially to the healthy
knee joint centre resulting in an adduction moment.
Figure 11(b) shows that as the varus bending moment was
increased, medial compartmental force increased and
lateral compartmental force decreased. In particular, our
FE results in Table 5 show that an increase in varus
bending moment from 4 to 8Nm resulted in an increase in
medial compartmental force percentage from 73% to 89%.
This agrees with the work of Tetsworth and Paley (1994),
who reported that 58 of varus malalignment increases
medial compressive loading from 70% to 90% (Tetsworth
and Paley 1994). Medial load transfer resulting from an
increase in adduction moment, or varus malalignment, has
also been reported (Tetsworth and Paley 1994; Zhao et al.
2007; Kutzner et al. 2010).
FE model predictions for peak pressure values in the
medial and lateral compartments in this study ranged from 0
to 2.51MPa with a 381-N axial force and 15-Nmmaximum
bending moment. This is in line with other experimental
and FE studies, in which corresponding contact pressures
between 2.4 and 34MPa have been reported for higher axial
loads of 700–2000N on simulated intact and injured or
reconstructed knee joints (Donahue et al. 2002; Marzo and
Table 6. Previously published validated or verified computational knee models.
Authors and date Parameters validated Type of specimen
Guess et al. (2010) Kinematics of a multibody knee model Identically loaded cadaveric kneeBaldwin et al. (2011) Kinematics of three subject-specific FE
total knee replacement modelsIn vitro dynamic tests from three cadaveric
specimensBlankevoort, and Huiskes (1996) Kinematics of the knee soft tissue
FE modelIn vitro tests from other cadaveric knee
specimensBeillas et al. (2004) Kinematics of an FE knee model In vitro tests from other cadaveric knee
specimensHalloran, Petrella andRullkoetter (2005)
Kinematics of an FE knee model Previously published experimental kinematic data
Perillo-Marcone, Taylor (2007) Kinematics of an FE knee model Previously published experimental kinematic dataGodest et al. (2002) Kinematics of an FE knee model Previously published experimental kinematic dataYosibash, Trabelsi andMilgrom (2007); Yosibash,Tal and Trabelsi (2010)
Strain and displacement of an FE femurmodel
In vitro tests from subject-specific cadaveric femur
Kiapour et al. (2012) Kinematics of an FE knee model In vitro tests from 19 different cadavericleg specimens
Tuncer et al. (2013) Strain in tibia and femur of an FE kneemodel with a unilateral kneereplacement (UKR)
In vitro tests from 10 different cadavericknee specimens
Miller et al. (2009) Total load, peak load and peak loadlocation for axial, varus and valgusloading conditions of a 2D discreteelement analysis model
In vitro study from four human cadaveric knees
Mononen, Juvelin andKorhonen (2013)
Knee joint stresses and strains –musculoskeletal multibody dynamics
Experimental findings from other investigators
Shirazi and Shirazi-Adl (2009) Joint contact pressures of an FE kneemodel
In vitro results from other cadavers
Pena et al. (2006) Joint contact pressures of an FE kneemodel
Experimental findings from other investigators
Computer Methods in Biomechanics and Biomedical Engineering 13
Dow
nloa
ded
by [
Ang
lia R
uski
n U
nive
rsity
] at
02:
27 0
6 M
ay 2
014
Gurske-DePerio 2009; Morimoto et al. 2009; Adouni et al.
2012; Mononen and others 2012).
Compartment normalised force and peak pressures
predicted by computer simulation in this study were
consistent with those obtained experimentally. The
subject-specific FE knee model will be enhanced in
future versions by: evaluating knee joint contact
mechanics throughout sagittal angles spanning the full
range of motion during functional activities; including the
patella and quadriceps musculo-tendinous forces, as well
as hamstrings and gastrocnemius muscles; simulating
different knee joint alignments to evaluate surgical
realignment; and using more physiological tissue material
properties.
Although the tissue geometries of the FE knee model
were subject-specific, thematerial properties were acquired
from the literature. Cartilage material properties can
substantially influence knee joint contact mechanics
(Shirazi et al. 2008). However, our previous sensitivity
analyses showed that a change in the material properties
(meniscus, cartilage and ligament) affected the absolute
compartmental force and pressure values, but not the
relative values where loading was normalised to the peak
values in each respective compartment (Mootanah et al.
2012).
The ultimate aim of this investigational team was to use
this approach for subject-specific HTO planning to improve
surgical outcomes. Following further development and
testing, the model will be applied to in vivo test subjects to
assess its utility in obtaining improved outcomes. Such a
model could form the basis of a subject-specific tool to
guide orthopaedic surgeons towards obtaining realignment
of a malaligned knee that minimises peak pressure within
the joint.
Based on results of their OASIS surgical planning tool
for malalignment correction, Chao et al. found that
patients with medial compartment force ratios between 40
and 60% achieved a 100% 10-year survivorship (Chao and
Sim 1995; Chao 2003). OASIS, although limited to a 2D
static standing posture, linear elastic elements for cartilage
and ligaments, and a uniplanar osteotomy wedge angle,
has increased HTO success rate (Chao and Sim 1995;
Chao 2003).
Our study adds to the sparse validation available in the
knee modelling literature. Given the complex geometry
and role of stabilising structures within the femoral–tibial
joint, the investigators postulate that a 3D model, capable
of predicting joint pressure, will yield further improve-
ments in predicting alignment correction and clinical
outcomes. Additional steps are required before this model
may be applied clinically. However, this study represents
the first step towards this important application, which is to
validate the capability of a subject specific model
for predicting joint forces and pressures experienced
under load.
Acknowledgements
We gratefully acknowledge the support of the ChelmsfordMedical Education and Research Trust for funding the research.We acknowledge receipt of the 2012 Medical Innovation Awardfrom Materialise, developer of Mimics for this project.
References
Adouni M, Shirazi-Adl A, Shirazi R. 2012. Computationalbiodynamics of human knee joint in gait: from muscle forcesto cartilage stresses. J Biomech. 45(12):2149–2156.
Agneskirchner JD, Freiling D, Hurschler C, Lobenhoffer P. 2006.Primary stability of four different implants for openingwedge high tibial osteotomy. Knee Surg Sports TraumatolArthrosc. 14(3):291–300.
Agneskirchner JD, Hurschler C, Stukenborg-Colsman C, ImhoffAB, Lobenhoffer P. 2004. Effect of high tibial flexionosteotomy on cartilage pressure and joint kinematics: abiomechanical study in human cadaveric knees. Winner ofthe AGA-DonJoy award 2004. Arch Orthop Trauma Surg.124(9):575–584.
Andriacchi TP, Lang PL, Alexander EJ, Hurwitz DE. 2000.Methods for evaluating the progression of osteoarthritis.J Rehabil Res Dev. 37(2):163–170.
Baldwin MA, Clary CW, Fitzpatrick CK, Deacy JS, MaletskyLP, Rullkoetter PJ. 2011. Dynamic finite element kneesimulation for evaluation of knee replacement mechanics.J Biomech. 45(3):474–483.
Beillas P, Papaioannou G, Tashman S, Yang KH. 2004. A newmethod to investigate in vivo knee behavior using a finiteelement model of the lower limb. J Biomech. 37(7):1019–1030.
Bhatnagar T, Jenkyn TR. 2010. Internal kinetic changes in theknee due to high tibial osteotomy are well-correlated withchange in external adduction moment: an osteoarthritic kneemodel. J Biomech. 43(12):2261–2266.
Blankevoort L, Huiskes R. 1996. Validation of a three-dimensional model of the knee. J Biomech. 29(7):955–961.
Butler DL, Kay MD, Stouffer DC. 1986. Comparison of materialproperties in fascicle-bone units from human patellar tendonand knee ligaments. J Biomech. 19(6):425–432.
Chao EY. 2003. Graphic-based musculoskeletal model forbiomechanical analyses and animation. Med Eng Phys.25(3):201–212.
Chao EY, Sim FH. 1995. Computer-aided preoperative planningin knee osteotomy. Iowa Orthop J. 15:4–18.
Cooper C, Dennison E, Edwards M, Litwic A. 2013.Epidemiology of osteoarthritis. Medicographia. 35:145–151.
Coventry MB. 1965. Osteotomy of the upper portion of the tibiafor degenerative arthritis of the knee. A preliminary report.J Bone Joint Surg Am. 47:984–990.
Coventry MB. 2001. Osteotomy of the upper portion of the tibiafor degenerative arthritis of the knee. A preliminary report byMark B. Coventry, MD. From the section of orthopedicsurgery, Mayo Clinic and Mayo Foundation, Rochester,Minnesota. 1965. J Bone Joint Surg Am. 83-A(9):1426.
Donahue TL, Hull ML, Rashid MM, Jacobs CR. 2002. A FEmodel of the human knee joint for the study of tibio-femoralcontact. J Biomech Eng. 124(3):273–280.
Dorsey WO, Miller BS, Tadje JP, Bryant CR. 2006. The stabilityof three commercially available implants used in medialopening wedge high tibial osteotomy. J Knee Surg. 19(2):95–98.
R. Mootanah et al.14
Dow
nloa
ded
by [
Ang
lia R
uski
n U
nive
rsity
] at
02:
27 0
6 M
ay 2
014
DowdGS, Somayaji HS, UthukuriM. 2006. High tibial osteotomyfor medial compartment osteoarthritis. Knee. 13(2):87–92.
Esenkaya I, Misirlioglu M, Kelestemur MH, Elmali N,Fadillioglu E. 2007. Biomechanical evaluation of differentfixation plates in medial opening upper tibial osteotomy.Knee. 14(1):46–50.
Godest A, Beaugonin M, Haug E, Taylor M, Gregson P. 2002.Simulation of a knee joint replacement during a gait cycleusing explicit finite element analysis. J Biomech. 35(2):267–275.
Grood ES, Suntay WJ. 1983. A joint coordinate system for theclinical description of three-dimensional motions: appli-cation to the knee. J Biomech Eng. 105(2):136–144.
Guess TM, Thiagarajan G, Kia M, Mishra M. 2010. A subjectspecific multibody model of the knee with menisci. Med EngPhys. 32(5):505–515.
Halloran JP, Petrella AJ, Rullkoetter PJ. 2005. Explicit finiteelement modeling of total knee replacement mechanics.J Biomech. 38(2):323–331.
Hurwitz DE, Ryals AB, Case JP, Block JA, Andriacchi TP. 2002.The knee adduction moment during gait in subjects with kneeosteoarthritis is more closely correlated with static alignmentthan radiographic disease severity, toe out angle and pain.J Orthop Res. 20(1):101–107.
Johnson F, Leitl S, Waugh W. 1980. The distribution of loadacross the knee. A comparison of static and dynamicmeasurements. J Bone Joint Surg Br. 62(3):346–349.
Kiapour A, Kiapour AM, Kaul V, Quatman CE, Ditto RC, LevineJW, Worderman S, Hewett TE, Demetropoulos CK, GoelVK. 2012. Finite element model of the knee for investigationof high rate injury mechanism: development and validation.Proceedings of ORS 2012 Annual Meeting 36; Paper No.0101.
Kutzner I, Heinlein B, Graichen F, Bender A, Rohlmann A,Halder A, Beier A, Bergmann G. 2010. Loading of the kneejoint during activities of daily living measured in vivo in fivesubjects. J Biomech. 43(11):2164–2173.
Marzo JM, Gurske-DePerio J. 2009. Effects of medial meniscusposterior horn avulsion and repair on tibiofemoral contactarea and peak contact pressure with clinical implications. AmJ Sports Med. 37(1):124–129.
Mathers CD, Loncar D. 2006. Projections of global mortality andburden of disease from 2002 to 2030. PLoSMed. 3(11):e442.
Miller EJ, Riemer RF, Haut Donahue TL, Kaufman KR. 2009.Experimental validation of a tibiofemoral model foranalyzing joint force distribution. J Biomech. 42(9):1355–1359.
Mononen ME, Mikkola MT, Julkunen P, Ojala R, Nieminen MT,Jurvelin JS, Korhonen RK. 2012. Effect of superficialcollagen patterns and fibrillation of femoral articularcartilage on knee joint mechanics – a 3D finite elementanalysis. J Biomech. 45(3):579–587.
Mononen ME, Jurvelin JS, Korhonen RK. 2013. Implementationof a gait cycle loading into healthy and meniscectomisedknee joint models with fibril-reinforced articular cartilage.Comput Methods Biomech Biomed Engin. 1-12 [Epubahead-of-print].
Mootanah R, Reisse F, Carpanen D, Walker R, Hillstrom HJ.2012. The effects of the material properties of bones andsoft tissues on knee joint contact stress. 10th internationalsymposium on Biomechanics and Biomedical Engineering;Berlin, April, 10–14; ARUP, Solihull.
Morimoto Y, Ferretti M, Ekdahl M, Smolinski P, Fu FH. 2009.Tibiofemoral joint contact area and pressure after single- and
double-bundle anterior cruciate ligament reconstruction.Arthroscopy. 25(1):62–69.
Pena E, Calvo B, Martinez M, Doblare M. 2006. A three-dimensional finite element analysis of the combined behaviorof ligaments and menisci in the healthy human knee joint.J Biomech. 39(9):1686–1701.
Perie D, Hobatho MC. 1998. In vivo determination of contactareas and pressure of the femorotibial joint using non-linearFE analysis. Clin Biomech (Bristol, Avon). 13(6):394–402.
Perillo-Marcone A, Taylor M. 2007. Effect of varus/valgusmalalignment on bone strains in the proximal tibia after TKR:an explicit finite element study. J Biomech Eng. 129(1):1–11.
Petersson IF, Jacobsson LT. 2002. Osteoarthritis of the peripheraljoints. Best Pract Res Clin Rheumatol. 16(5):741–760.
Quapp KM, Weiss JA. 1998. Material characterization ofhuman medial collateral ligament. J Biomech Eng. 120(6):757–763.
Rinonapoli E, Mancini GB, Corvaglia A, Musiello S. 1998.Tibial osteotomy for varus gonarthrosis. A 10–21-yearfollowup study. Clin Orthop Relat Res. (353):185–193.
Schipplein OD, Andriacchi TP. 1991. Interaction between activeand passive knee stabilizers during level walking. J OrthopRes. 9(1):113–119.
Schreppers GJ, Sauren AA, Huson A. 1990. A numerical modelof the load transmission in the tibio-femoral contact area.Proc Inst Mech Eng H. 204(1):53–59.
Sharma L, Song J, Felson DT, Cahue S, Shamiyeh E, Dunlop DD.2001. The role of knee alignment in disease progressionand functional decline in knee osteoarthritis. JAMA. 286(2):188–195.
Shepherd DE, Seedhom BB. 1997. A technique for measuring thecompressive modulus of articular cartilage under physio-logical loading rates with preliminary results. Proc Inst MechEng H. 211(2):155–165.
Shepherd DE, Seedhom BB. 1999. Thickness of human articularcartilage in joints of the lower limb. Ann Rheum Dis. 58(1):27–34.
Shirazi R, Shirazi-Adl A, Hurtig M. 2008. Role of cartilagecollagen fibrils networks in knee joint biomechanics undercompression. J Biomech. 41(16):3340–3348.
Shirazi R, Shirazi-Adl A. 2009. Computational biomechanics ofarticular cartilage of human knee joint: effect of osteochon-dral defects. J Biomech. 42(15):2458–2465.
Specogna AV, Birmingham TB, Hunt MA, Jones IC, Jenkyn TR,Fowler PJ, Giffin JR. 2007. Radiographic measures of kneealignment in patients with varus gonarthrosis: effect ofweightbearing status and associations with dynamic jointload. Am J Sports Med. 35(1):65–70.
Tetsworth K, Paley D. 1994. Malalignment and degenerativearthropathy. Orthop Clin North Am. 25(3):367–377.
Thambyah A. 2007. Contact stresses in both compartmentsof the tibiofemoral joint are similar even when larger forcesare applied to the medial compartment. Knee. 14(4):336–338.
Tuncer M, Cobb JP, Hansen UN, Amis AA. 2013. Validation ofmultiple subject-specific finite element models of unicom-partmental knee replacement. Med Eng Phys. 35(10):1457–1464.
Valkenburg H. 1980. Clinical versus radiological osteoarthritis inthe general population. In: Peyron J, editor. Epidemiology ofosteoarthritis. Paris: Ciba-Geigy; p. 53.
Virolainen P, Aro HT. 2004. High tibial osteotomy for thetreatment of osteoarthritis of the knee: a review of the
Computer Methods in Biomechanics and Biomedical Engineering 15
Dow
nloa
ded
by [
Ang
lia R
uski
n U
nive
rsity
] at
02:
27 0
6 M
ay 2
014
literature and a meta-analysis of follow-up studies. ArchOrthop Trauma Surg. 124(4):258–261.
Weiss JA, Gardiner JC. 2001. Computational modeling ofligament mechanics. Crit Rev Biomed Eng. 29(3):303–371.
Yosibash Z, Trabelsi N, Milgrom C. 2007. Reliable simulationsof the human proximal femur by high-order finite elementanalysis validated by experimental observations. J Biomech.40(16):3688–3699.
Yosibash Z, Tal D, Trabelsi N. 2010. Predicting the yield of theproximal femur using high-order finite-element analysis with
inhomogeneous orthotropic material properties. Philos T RoySoc A. 368(1920):2707.
Zhao D, Banks SA, Mitchell KH, D’Lima DD, Colwell CW, Jr,Fregly BJ. 2007. Correlation between the knee adductiontorque and medial contact force for a variety of gait patterns.J Orthop Res. 25(6):789–797.
Zhim F, Laflamme GY, Viens H, Saidane K, Yahia L. 2005.Biomechanical stability of high tibial opening wedgeosteotomy: internal fixation versus external fixation. ClinBiomech (Bristol, Avon). 20(8):871–876.
R. Mootanah et al.16
Dow
nloa
ded
by [
Ang
lia R
uski
n U
nive
rsity
] at
02:
27 0
6 M
ay 2
014
Related Documents


