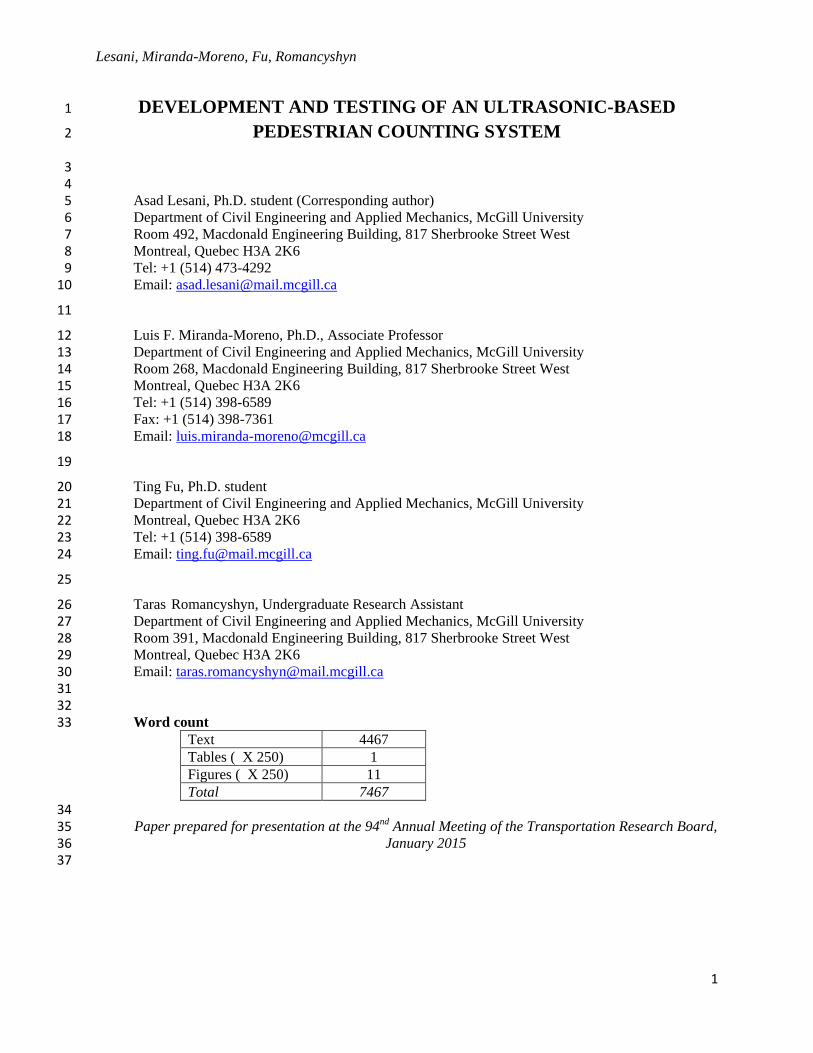
Lesani, Miranda-Moreno, Fu, Romancyshyn 1 DEVELOPMENT AND TESTING OF AN ULTRASONIC-BASED 1 PEDESTRIAN COUNTING SYSTEM 2 3 4 Asad Lesani, Ph.D. student (Corresponding author) 5 Department of Civil Engineering and Applied Mechanics, McGill University 6 Room 492, Macdonald Engineering Building, 817 Sherbrooke Street West 7 Montreal, Quebec H3A 2K6 8 Tel: +1 (514) 473-4292 9 Email: [email protected] 10 11 Luis F. Miranda-Moreno, Ph.D., Associate Professor 12 Department of Civil Engineering and Applied Mechanics, McGill University 13 Room 268, Macdonald Engineering Building, 817 Sherbrooke Street West 14 Montreal, Quebec H3A 2K6 15 Tel: +1 (514) 398-6589 16 Fax: +1 (514) 398-7361 17 Email: [email protected] 18 19 Ting Fu, Ph.D. student 20 Department of Civil Engineering and Applied Mechanics, McGill University 21 Montreal, Quebec H3A 2K6 22 Tel: +1 (514) 398-6589 23 Email: [email protected] 24 25 Taras Romancyshyn, Undergraduate Research Assistant 26 Department of Civil Engineering and Applied Mechanics, McGill University 27 Room 391, Macdonald Engineering Building, 817 Sherbrooke Street West 28 Montreal, Quebec H3A 2K6 29 Email: [email protected] 30 31 32 Word count 33 Text 4467 Tables ( X 250) 1 Figures ( X 250) 11 Total 7467 34 Paper prepared for presentation at the 94 nd Annual Meeting of the Transportation Research Board, 35 January 2015 36 37

Welcome message from author
This document is posted to help you gain knowledge. Please leave a comment to let me know what you think about it! Share it to your friends and learn new things together.
Transcript
Lesani, Miranda-Moreno, Fu, Romancyshyn
1
DEVELOPMENT AND TESTING OF AN ULTRASONIC-BASED 1
PEDESTRIAN COUNTING SYSTEM 2
3 4
Asad Lesani, Ph.D. student (Corresponding author) 5 Department of Civil Engineering and Applied Mechanics, McGill University 6 Room 492, Macdonald Engineering Building, 817 Sherbrooke Street West 7 Montreal, Quebec H3A 2K6 8 Tel: +1 (514) 473-4292 9 Email: [email protected] 10
11
Luis F. Miranda-Moreno, Ph.D., Associate Professor 12 Department of Civil Engineering and Applied Mechanics, McGill University 13 Room 268, Macdonald Engineering Building, 817 Sherbrooke Street West 14 Montreal, Quebec H3A 2K6 15 Tel: +1 (514) 398-6589 16 Fax: +1 (514) 398-7361 17 Email: [email protected] 18
19
Ting Fu, Ph.D. student 20 Department of Civil Engineering and Applied Mechanics, McGill University 21 Montreal, Quebec H3A 2K6 22 Tel: +1 (514) 398-6589 23 Email: [email protected] 24
25
Taras Romancyshyn, Undergraduate Research Assistant 26 Department of Civil Engineering and Applied Mechanics, McGill University 27
Room 391, Macdonald Engineering Building, 817 Sherbrooke Street West 28 Montreal, Quebec H3A 2K6 29
Email: [email protected] 30 31 32
Word count 33 Text 4467
Tables ( X 250) 1
Figures ( X 250) 11
Total 7467
34 Paper prepared for presentation at the 94nd Annual Meeting of the Transportation Research Board, 35
January 2015 36 37
Lesani, Miranda-Moreno, Fu, Romancyshyn
2
ABSTRACT 1
This paper introduces the components, hardware and software, of a pedestrian counting 2
system based on ultrasonic sensor technology. The proposed counting system is designed to 3
collect data in different facilities such as sidewalks, trails, and building corridors. To evaluate the 4
performance (accuracy) of the proposed system, manual video-based counting was obtained in 5
different traffic conditions. In addition, the ultrasonic system was compared with an existing 6
infrared-based sensor currently available in the market. The results show that the counting error 7
of the ultrasonic sensor was typically between 0 to 15% for different traffic conditions. 8
Correction error functions were also fitted which can help to improve counting accuracy. The 9
comparative analysis between the ultrasonic and infrared systems indicates that the system 10
performs better in situations with high pedestrian volumes. In particular, the sensor performance 11
was tested on sidewalk placed in an open space because this situation presents a challenge for 12
most infrared-based counting systems. The results show that the system is accurate in these 13
conditions. The proposed system seems to have the potential for counting pedestrian in different 14
facility types (including crosswalks), weather conditions and for counting cyclists in bicycle 15
facilities. 16
Key words: Ultrasonic Sensor, Automated Pedestrian Counts, High Volumes, Alternative 17
Technologies 18
19
1. INTRODUCTION 20 Non-motorized transportation is an area of growing interest in research. New 21
considerations in the planning, designing and operation of pedestrian facilities have increased the 22
need for pedestrian traffic (activity) data and consequently technologies and methods for 23
automatically collecting such data. Pedestrian data is necessary for several different reasons 24
such as for evaluating the effectiveness of the design and construction of new facilities, for 25
defining extrapolation (expansion) factors to estimate average annual daily volumes as well as 26
for monitoring walking pattern over a long-term and evaluating the impact of policies, etc. 27
28
Traditional pedestrian count data collection methods used by cities and municipalities rely 29
heavily on manual counting procedures conducted by individuals in the field. That is, they 30
require that individuals manually count the number of pedestrians using a facility, either directly 31
at the site or from video recordings of the area. Obviously, these methods require a great deal of 32
time and resources. In addition, the temporal coverage is very limited because only a few hours 33
of counts are typically obtained in one day (e.g., 4 to 8 hours of counts). As one can imagine, 34
short-term manual counts can be very sensitive to temporal (time of the day, day of the week and 35
season) and weather conditions. To standardize short-term counts taken in different periods of 36
time and weather conditions, adjustments factors have been developed based on long-term 37
counts. Because of this and other data considerations, data collection over long periods of time is 38
becoming a more and more common practice in many cities around the world. Accordingly, 39
automatic data collection for gathering pedestrian counts is becoming increasingly common. It is 40
therefore not surprising to understand the increase in effort and amount of resources currently 41
being invested in the development of large-scale automated pedestrian (and bicycle) counting 42
programs in North America. Today, several cities are either improving or launching such 43
programs, with budgets that range in the hundreds of thousands of dollars per year. These cities 44
Lesani, Miranda-Moreno, Fu, Romancyshyn
3
and metropolitan areas include Vancouver, Ottawa, San Francisco, Portland, San Diego, and 1
many others. 2
For automatic data collection, several technologies have been developed over the past 3
decade; some of them are available for commercialization, including passive infrared counters, 4
radar, depth (3D) counters, laser-based counters, and computer vision based counters. The 5
advantages and drawbacks of these technologies have been documented in the literature review. 6
For instance, infrared sensors have some advantages such as relative ease to build and operate, 7
very low power consumption, real time implementation, acceptable accuracy and independency 8
to wet and foggy weather which make them very flexible and easy to install for long periods of 9
time. However, some of the limitations of this technology include an occlusion problem when 10
installed in environments with high pedestrian volumes or pedestrians walking in groups, low 11
performance under extreme temperatures, etc. (Greene-Roesel et al., 2008). Also, one of the 12
challenging issues with this type of sensor is that it works best when there is an obstruction such 13
as a wall on one side of sidewalk. In this paper this infrared sensor is tested in a location without 14
the presence of wall. Some sensors of this type are already available in the market and are 15
offered by several companies such as Eco-Counters. 16
On the other hand, while advances in computer vision allow for the collection of pedestrian 17
flows in open spaces including sidewalks and intersections, no current video technology can 18
collect data for long periods of time in an automatic fashion. In addition, video sensors in low-19
light conditions and inclement weather may perform poorly. Despite the current developments in 20
the research, there still exists a need to develop low-cost and flexible data collection systems that 21
are able to provide pedestrian volumes in semi real-time and integrate automatic data into a 22
platform for analysis or data fusion. 23
The main objective of this research was to develop a data collection system that 24
automatically detects and counts pedestrians based on the emission of ultrasonic waves. This 25
paper reports the system elements and algorithm used for pedestrian detection and counting. As 26
part of this research, the performance of the sensor was evaluated and compared to one of the 27
most popular commercially available types of sensor – infra-red sensors. The limitations and 28
advantages of the system are discussed along with plans for future work. 29
30
2. LITERATURE REVIEW 31 Several technologies are available in the market and used in practice for automatic 32
pedestrian data collection in indoor and outdoor environments. Typically, collection devices are 33
used to detect and count the number of pedestrians passing through doors, indoor corridors in 34
terminals or buildings, park trails, sidewalks, cycle tracks, intersection crosswalks, mid-block 35
crossings, etc. An important gamma of technologies exists such as passive infrared sensors, laser 36
scanning, pressure pads, thermal sensors, and video camera sensors. These advantages, which 37
include the need to allocate much less time and resources to the data collection effort, as well as 38
a significant reduction in the incidence of errors, are discussed by Ismail et al. (2009). 39
In order to benefit from the advantages offered by automated data collection, transportation 40
agencies must install one or several different commercially available pedestrian counters. These 41
counters, along with other methods currently in development, are presented and discussed in 42
work by Markowitz et al., 2009 and Raghuram et al., 2002. The most popular types of automated 43
pedestrian detection devices and techniques include passive and active infrared technology, 44
piezoelectric pads, laser scanners, as well as video-image processing. A more expensive, but 45
very accurate alternative is the use of thermal imaging cameras (Leykin and Hammound, 2006). 46
Lesani, Miranda-Moreno, Fu, Romancyshyn
4
From the available counting technologies, infrared sensors appear to be the most popular 1
type of sensor for counting in outdoor environments. Passive infrared counting technologies 2
identify and count pedestrians based on a temperature differential. Among the advantages of 3
infrared sensors available in the market, one can mention that they are easy to install on existing 4
adjacent infrastructure on sidewalks and open spaces. Additionally, they have a low-energy 5
consumption rate that allows them to function for several years without requiring to be 6
recharged. Infrared detectors are ideal for pedestrian counting on streets with low to moderate 7
traffic volumes. However, several limitations can also be associated to this technology. As is the 8
case with most current technologies, occlusion problems generated from high pedestrian volumes 9
and group occurrences can lead to counting errors. In particular, the performance of this 10
technology can deteriorate in environments with very high pedestrian volumes per hour (e.g., 11
greater than 500 pedestrians per hour). Cases of under-counting and over-counting have also 12
been observed and attributed to certain temperature anomalies and weather conditions (rain). 13
Ideally, the device must be facing a fixed object such as a wall or fence opposite the sidewalk on 14
which it is mounted. This restricts their use at intersections, midblock crosswalks, open spaces, 15
etc. (Greene-Roese et al., 2008) 16
Some recent studies have investigated the performance (accuracy and precision) of infrared 17
sensors in different environments and sidewalks. Studies have reported a systematic under-18
counting error ranging between 0 and -25% depending on the traffic volumes and weather 19
conditions (Greene-Roese et al., 2008). 20
Alternative technologies such as radio waves, laser pulses, thermal sensor, etc. are less 21
popular in practice than infrared counters. Radio waves sensors work based on the Doppler 22
effect. These sensors work based on the variation of the wave frequency of the received and sent 23
signal. The variation of the frequency has a linear relationship with the speed of the object. 24
A laser pulse system works based on scanning the detection area of the sensor and 25
producing a three dimensional image of the object. Based on the video processing algorithm, the 26
speeds and volumes can be calculated. Both radio waves and laser pulses are used to determine 27
the characteristics of objects in the detection area. Among the limitations of laser scanners, one 28
can mention the high computational requirements and high acquisition costs. 29
Thermal sensors can be mounted above entryways to count people entering and exiting key 30
locations. In a recent study (Ozbay et al., 2010) tested a thermal sensor on trails and compared 31
the results with that of an infrared sensor. The authors reported mean percentage errors ranging 32
from -15% to 1% for the thermal sensor, which was considerably lower than the errors ranging 33
between -28% and 0% for the infrared sensor. With the important progress on image processing 34
algorithms and computing technologies being made, the use of computer vision has attracted 35
attention in the field of active transportation and has been proposed for counting pedestrians and 36
other road users. The main benefit of using computer vision is that they can obtain counts, speeds 37
and trajectories of mode types. The drawbacks of video-based systems are their high installation 38
and maintenance costs and the fact that they can only be used if an optimal camera placement is 39
feasible. Existing video-based techniques perform poorly at night or in adverse weather. It 40
should also be noted that video-based systems in transportation are still overwhelmingly reliant 41
on post-processing rather than real-time processing of video data. This makes large-scale data 42
collection more costly and cumbersome, as videos must be regularly collected from installed 43
cameras. 44
Regarding research done on using devices emitting ultrasonic waves to detect and count 45
pedestrians in urban environments, very little has been done to this day. While ultrasonic sensors 46
Lesani, Miranda-Moreno, Fu, Romancyshyn
5
have been used in different areas in the field of intelligent transportation systems (Leibe et al., 1
2005) (Krammer et al., 2006), they seem to have been skipped over when it comes to automated 2
pedestrian detection and counting. This research is an effort towards the development of low-cost 3
counting systems that provide higher levels of accuracy in critical conditions such as high 4
volumes and open spaces.. 5
6
3. SYSTEM COMPONENTS 7 In this section, the structure of the designed ultrasonic-based system is described. Its design 8
involves two aspects: hardware design and software design. Hardware design includes 9
integrating all necessary elements to have a real-time automated pedestrian counting system. The 10
methodology of how pedestrian counts can be obtained from the raw output of the ultrasonic 11
sensor is described in the software design section. 12
13
3.1 Hardware Design 14 The hardware of the designed system consists of three different parts: a sensory system, a 15
microprocessor (which is the core of the system) and a robust data logger system. All of the three 16
different parts are explained in this subsection. 17
18
Sensory System 19
An ultrasonic sensor is used to measure the distance between the sensor and passing 20
objects. The ultrasonic sensor works based on the concept of the ultrasound wave speed in the 21
air. The sensor transmits an ultrasound wave in the air for a predefined time (around 5 micro 22
seconds) and the listens to the echo of the wave. Based on the transmitting and receiving time 23
difference and knowing the speed of sound wave in the air, the distance from objects can be 24
measured. 25
The ultrasonic sensor has some advantages in comparison with other technologies in the 26
market designed to measure distance. In particular, the transmitter and receiver of the ultrasonic 27
sensor can be mounted on the same board. Also, because the ultrasound wave is independent of 28
weather condition and environment light, the accuracy of the measurement should be reliable 29
regardless of the weather conditions even in hot and sunny summer days; the condition that 30
affects the performance of the infrared-based sensors the most. 31
32
Microprocessor 33
The microprocessor is the most important part of the system hardware. The microprocessor 34
can be programmed in some programing languages. In this project, an AVR based micro 35
controller is used to implement the pedestrian counting methodology and interface all other parts 36
of the system. Additionally, the pedestrian counting method can be relatively easy implemented 37
with this type of micro controller. 38
39
Data Logger 40
The data logger consists of the following parts: 41
i) Real Time Clock Module, to keep the data time stamped 42
ii) GSM modem, to keep the system working in real-time and send data to the server every 15 43
minutes 44
iii) SD card, to save all the data on SD card in case the GSM modem internet connection is lost 45
Lesani, Miranda-Moreno, Fu, Romancyshyn
6
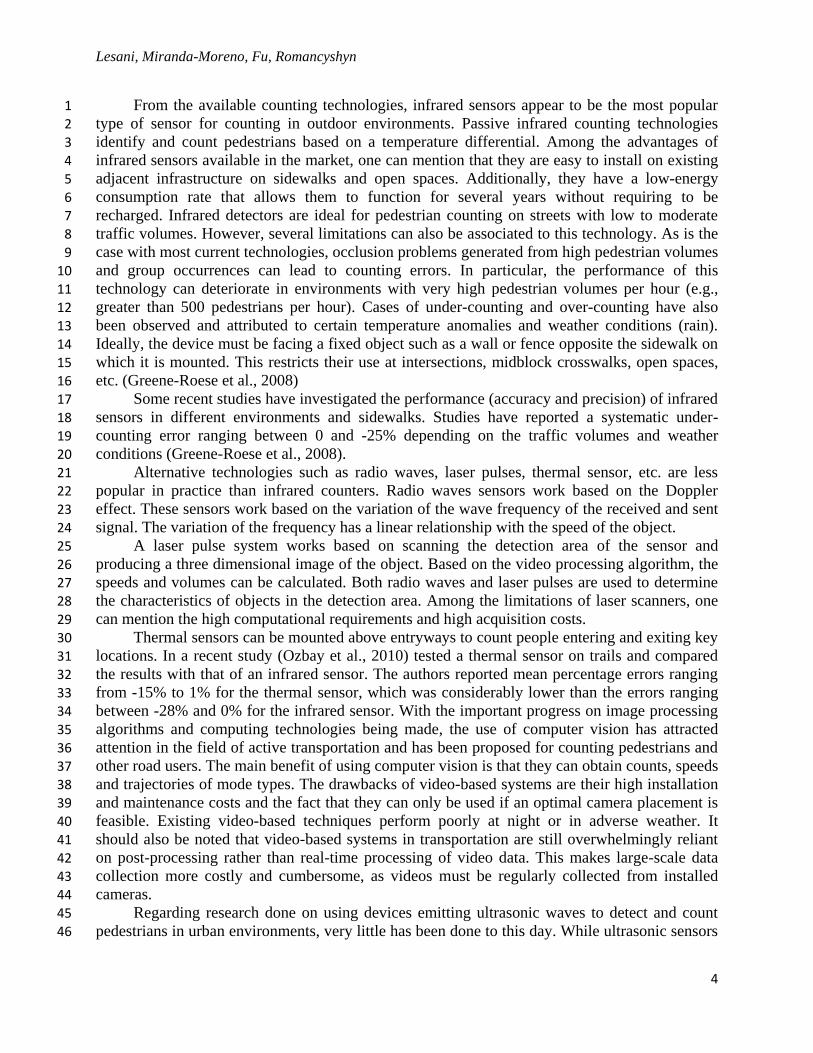
It is worth mentioning that once the system components are built, they are integrated in a 1
solid water-proof enclosure. Figure 1.a provides a picture of the system hardware. Moreover, 2
Figure 1.b shows the sensor with the enclosure installed at one of the testing sites. 3
4
(a) System hardware
(b) Installed sensors: infrared and ultrasonic
Figure 1. System hardware and installation 5
6
7
3.2 Software Design 8 The methodology and necessary steps to implement an automated pedestrian counting are 9
described in this section. 10
11
Step 1 - Distance Measurement 12
In this step, the micro controller actuates the ultrasonic sensor to send the ultrasound wave 13
to the environment for a duration of 5 micro seconds. After this time, the processor listens for the 14
echo of the ultrasound wave and based on the time difference between transmitting and receiving 15
the ultrasound wave and its speed, the distance between the sensor and a passing object is 16
measured. 17
18
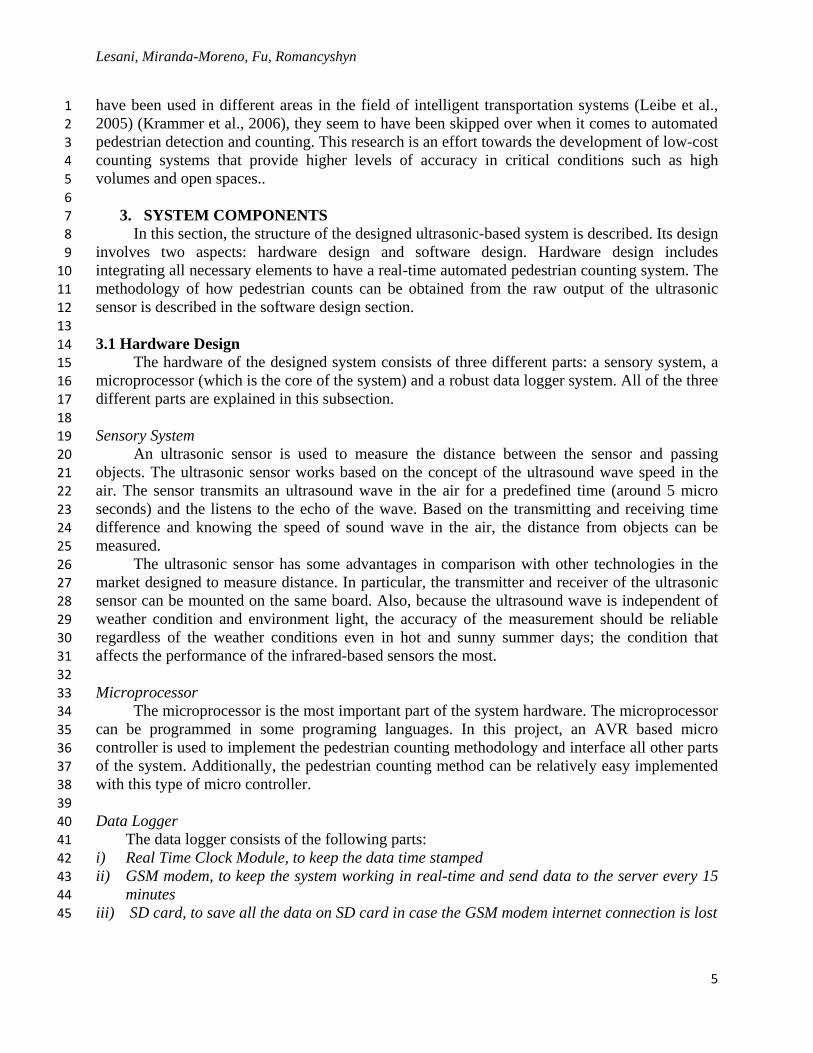
Step 2 - Noise Reduction Measurement 19
In some cases the ultrasonic sensor cannot get the ultrasound wave echo of the object in the 20
meantime. Therefore, the distance to the object is measured as the maximum range of the sensor 21
(e.g., 3. meters for this sensor, it can be changed by the user such as to cover a limited area like 22
at crosswalks). To solve this issue, an algorithm is required to eliminate this noise from the 23
output of the system. The one used in this system is based on the moving average concept. At 24
first, a window of samples is defined that should be used to calculate the average for them. This 25
window size should be defined considering the sample rate, average speed of a pedestrian and 26
average width of the pedestrian passing coverage area (from trial and error the 5 last samples 27
were considered). Since the miscalculation of the distance is always the maximum range of the 28
sensor, a minimum value of the samples in that window is used instead of the average. Figure 2 29
shows an example of noisy data and the output from the noise reduction technique. 30
31
Lesani, Miranda-Moreno, Fu, Romancyshyn
7
1 Figure 2. Noisy distance measurement and filtered data 2
3
Step 3 - Object Detection 4
In this step each distance measurement is classified based on the distance thresholds. When 5
the processor gets a new measurement it checks the distance value with the value of the last 6
sample. If the difference is more than predefined threshold (e.g., 35 cm) then a new class of 7
distance is started. The mentioned threshold was considered based on the average body width of 8
the people. If a smaller value is obtained, things like bags, or even a moving hand of a person can 9
be considered as a new group. On the other hand, if it is considered to be bigger, two people 10
passing in parallel with the small distance cannot be detected as two separate groups. 11
When a new distance group is started then the mean value of all distance samples in last 12
group is calculated. Also, the number of the distance measurement samples in each class is 13
counted for future processing. 14
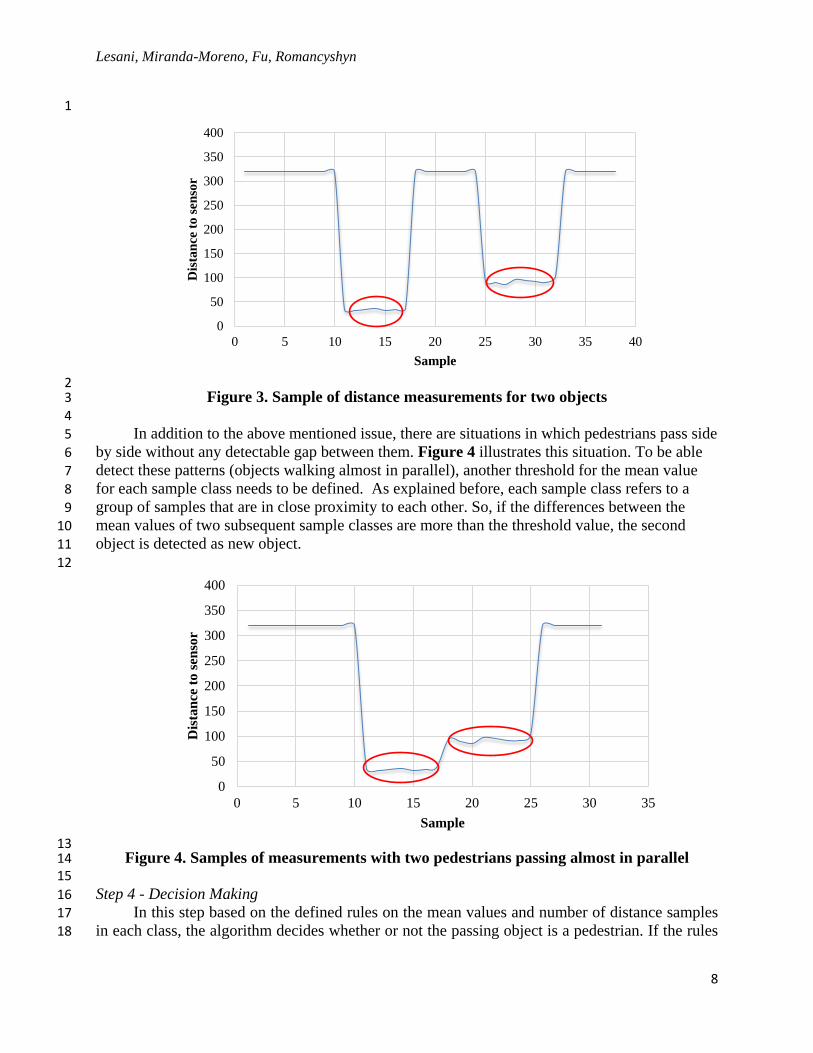
Figure 3 shows an example of the distance measurements for a few seconds when two 15
pedestrians passed the sensor sight line. As depicted in Figure 3, the object detection process in 16
cases when objects (pedestrians) pass one by one is straightforward. But in some cases objects 17
such as pedestrians walking their bikes or pedestrian hands and bags can be considered as a new 18
class. The average value of the distance samples in this type of class will be very close to the 19
average of the previous or next class but, the number of samples will be much smaller than the 20
sample class belonging to the pedestrian body. So, some thresholds can be defined on the 21
average value and the number of the samples in each class of measurement to eliminate over-22
counting. 23
Lesani, Miranda-Moreno, Fu, Romancyshyn
8
1
2 Figure 3. Sample of distance measurements for two objects 3
4
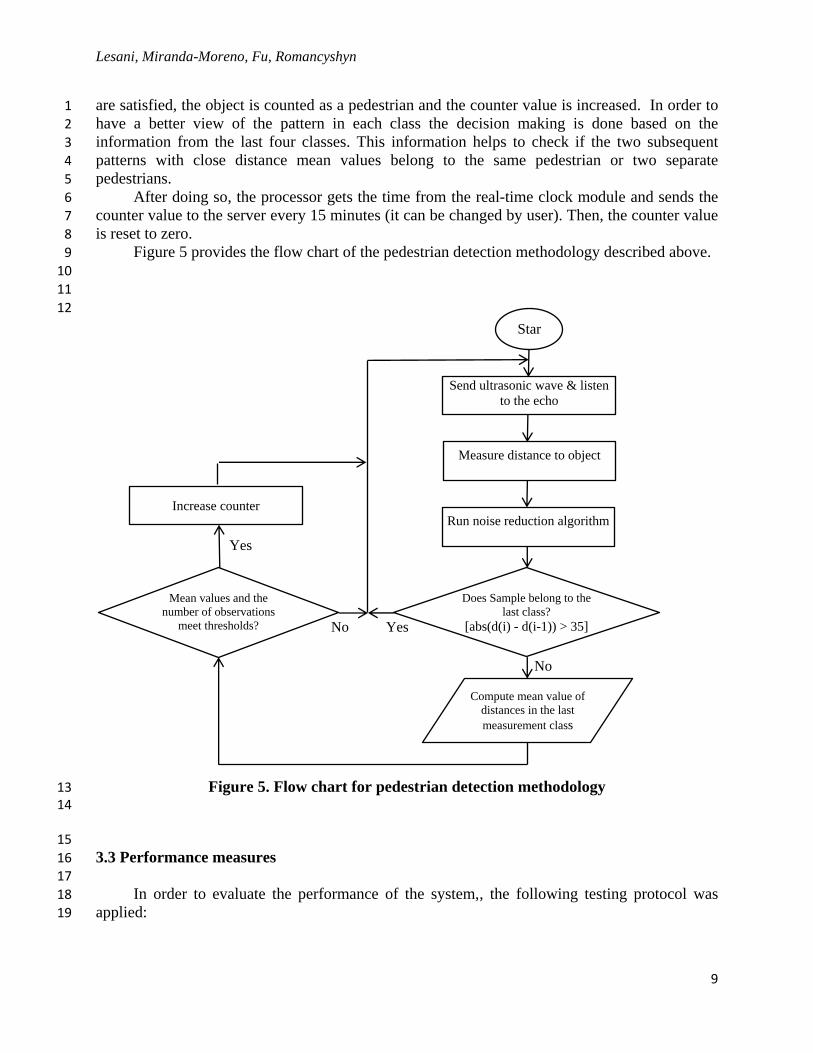
In addition to the above mentioned issue, there are situations in which pedestrians pass side 5
by side without any detectable gap between them. Figure 4 illustrates this situation. To be able 6
detect these patterns (objects walking almost in parallel), another threshold for the mean value 7
for each sample class needs to be defined. As explained before, each sample class refers to a 8
group of samples that are in close proximity to each other. So, if the differences between the 9
mean values of two subsequent sample classes are more than the threshold value, the second 10
object is detected as new object. 11
12
13 Figure 4. Samples of measurements with two pedestrians passing almost in parallel 14
15
Step 4 - Decision Making 16
In this step based on the defined rules on the mean values and number of distance samples 17
in each class, the algorithm decides whether or not the passing object is a pedestrian. If the rules 18
0
50
100
150
200
250
300
350
400
0 5 10 15 20 25 30 35 40
Dis
tan
ce t
o s
enso
r
Sample
0
50
100
150
200
250
300
350
400
0 5 10 15 20 25 30 35
Dis
tan
ce t
o s
enso
r
Sample
Lesani, Miranda-Moreno, Fu, Romancyshyn
9
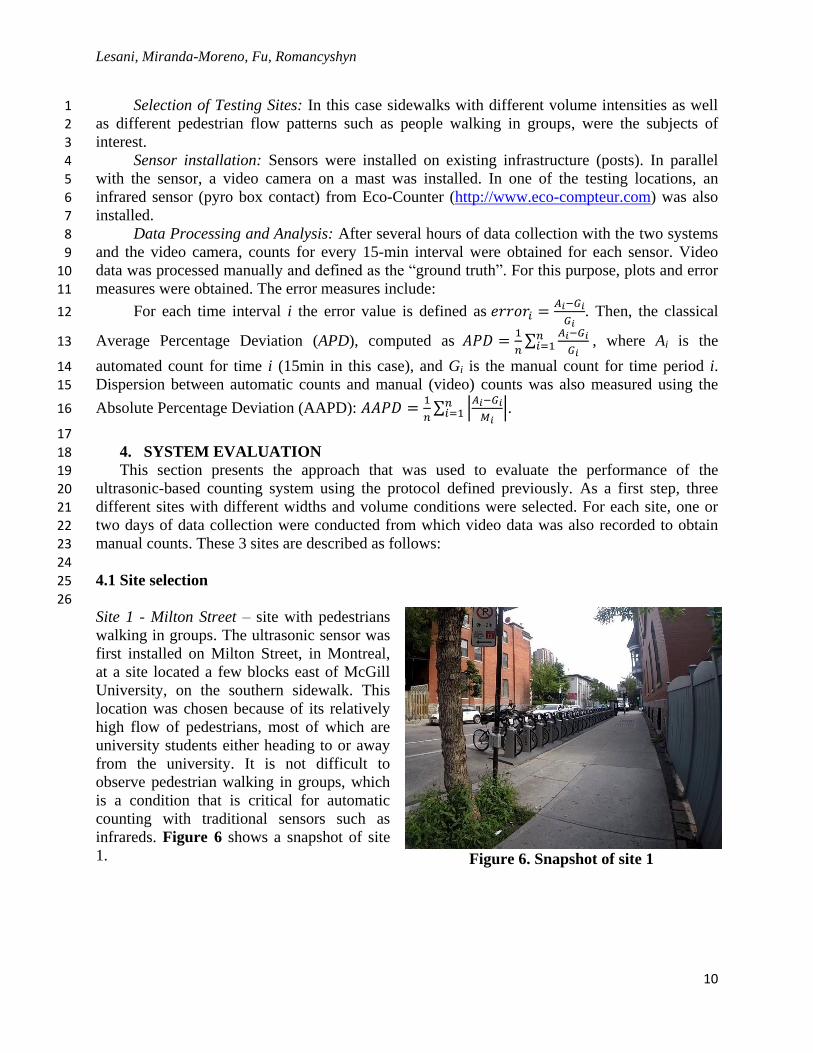
are satisfied, the object is counted as a pedestrian and the counter value is increased. In order to 1
have a better view of the pattern in each class the decision making is done based on the 2
information from the last four classes. This information helps to check if the two subsequent 3
patterns with close distance mean values belong to the same pedestrian or two separate 4
pedestrians. 5
After doing so, the processor gets the time from the real-time clock module and sends the 6
counter value to the server every 15 minutes (it can be changed by user). Then, the counter value 7
is reset to zero. 8
Figure 5 provides the flow chart of the pedestrian detection methodology described above. 9
10
11
12
Figure 5. Flow chart for pedestrian detection methodology 13 14
15
3.3 Performance measures 16 17
In order to evaluate the performance of the system,, the following testing protocol was 18
applied: 19
Star
t
Send ultrasonic wave & listen
to the echo
Does Sample belong to the
last class?
[abs(d(i) - d(i-1)) > 35]
Measure distance to object
Run noise reduction algorithm Increase counter
Compute mean value of
distances in the last
measurement class
Mean values and the
number of observations
meet thresholds?
No
Yes No
Yes
Lesani, Miranda-Moreno, Fu, Romancyshyn
10
Selection of Testing Sites: In this case sidewalks with different volume intensities as well 1
as different pedestrian flow patterns such as people walking in groups, were the subjects of 2
interest. 3
Sensor installation: Sensors were installed on existing infrastructure (posts). In parallel 4
with the sensor, a video camera on a mast was installed. In one of the testing locations, an 5
infrared sensor (pyro box contact) from Eco-Counter (http://www.eco-compteur.com) was also 6
installed. 7
Data Processing and Analysis: After several hours of data collection with the two systems 8
and the video camera, counts for every 15-min interval were obtained for each sensor. Video 9
data was processed manually and defined as the “ground truth”. For this purpose, plots and error 10
measures were obtained. The error measures include: 11
For each time interval i the error value is defined as
. Then, the classical 12
Average Percentage Deviation (APD), computed as
∑
, where Ai is the 13
automated count for time i (15min in this case), and Gi is the manual count for time period i. 14
Dispersion between automatic counts and manual (video) counts was also measured using the 15
Absolute Percentage Deviation (AAPD):
∑ |
|
. 16
17
4. SYSTEM EVALUATION 18 This section presents the approach that was used to evaluate the performance of the 19
ultrasonic-based counting system using the protocol defined previously. As a first step, three 20
different sites with different widths and volume conditions were selected. For each site, one or 21
two days of data collection were conducted from which video data was also recorded to obtain 22
manual counts. These 3 sites are described as follows: 23
24
4.1 Site selection 25
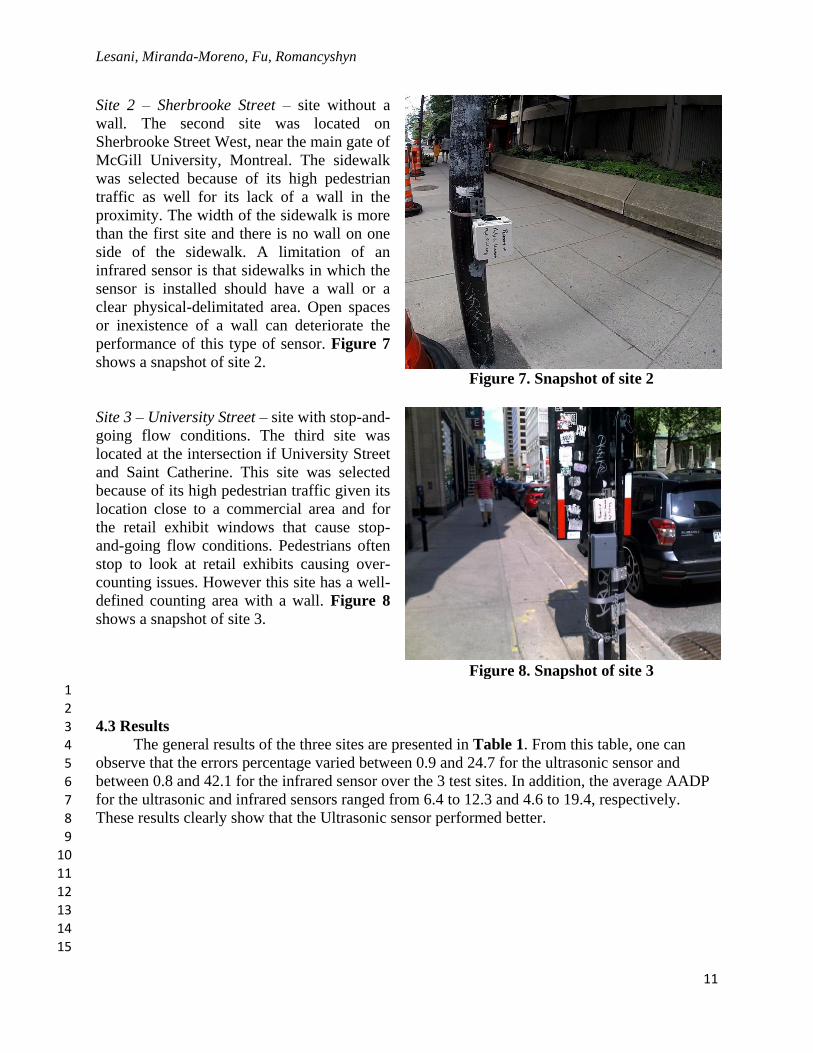
26 Site 1 - Milton Street – site with pedestrians
walking in groups. The ultrasonic sensor was
first installed on Milton Street, in Montreal,
at a site located a few blocks east of McGill
University, on the southern sidewalk. This
location was chosen because of its relatively
high flow of pedestrians, most of which are
university students either heading to or away
from the university. It is not difficult to
observe pedestrian walking in groups, which
is a condition that is critical for automatic
counting with traditional sensors such as
infrareds. Figure 6 shows a snapshot of site
1.
Figure 6. Snapshot of site 1
Lesani, Miranda-Moreno, Fu, Romancyshyn
11
Site 2 – Sherbrooke Street – site without a
wall. The second site was located on
Sherbrooke Street West, near the main gate of
McGill University, Montreal. The sidewalk
was selected because of its high pedestrian
traffic as well for its lack of a wall in the
proximity. The width of the sidewalk is more
than the first site and there is no wall on one
side of the sidewalk. A limitation of an
infrared sensor is that sidewalks in which the
sensor is installed should have a wall or a
clear physical-delimitated area. Open spaces
or inexistence of a wall can deteriorate the
performance of this type of sensor. Figure 7
shows a snapshot of site 2.
Figure 7. Snapshot of site 2
Site 3 – University Street – site with stop-and-
going flow conditions. The third site was
located at the intersection if University Street
and Saint Catherine. This site was selected
because of its high pedestrian traffic given its
location close to a commercial area and for
the retail exhibit windows that cause stop-
and-going flow conditions. Pedestrians often
stop to look at retail exhibits causing over-
counting issues. However this site has a well-
defined counting area with a wall. Figure 8
shows a snapshot of site 3.
Figure 8. Snapshot of site 3
1
2
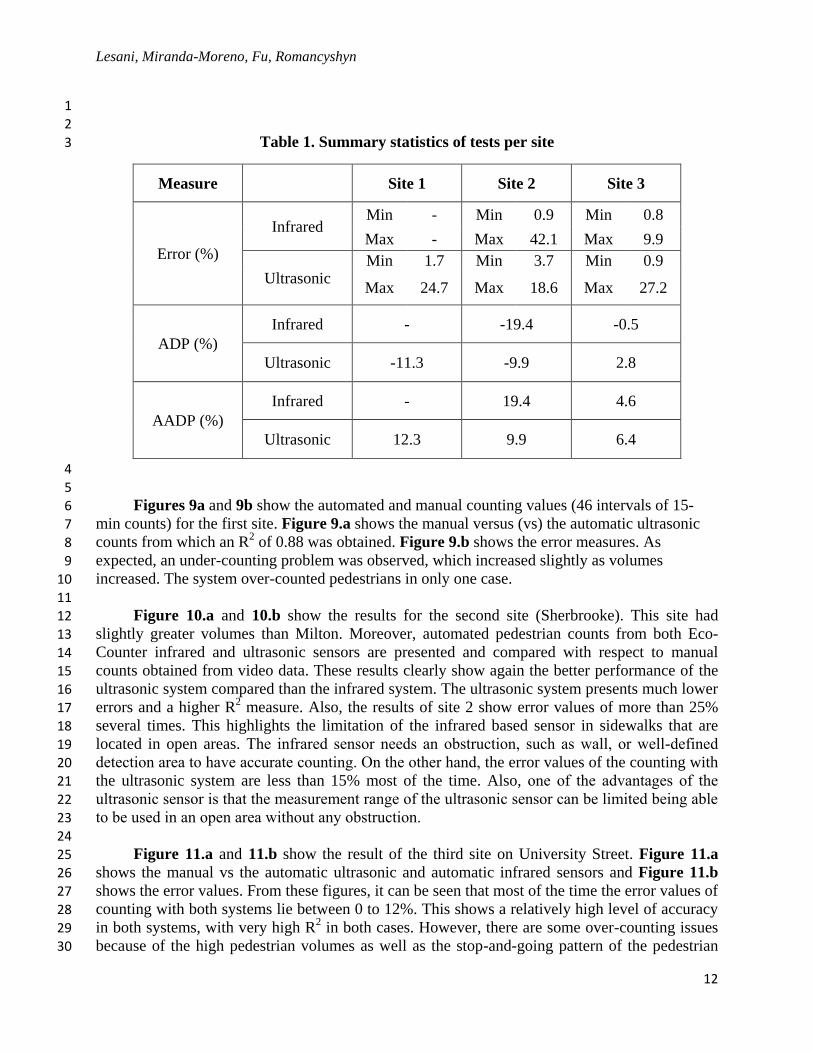
4.3 Results 3 The general results of the three sites are presented in Table 1. From this table, one can 4
observe that the errors percentage varied between 0.9 and 24.7 for the ultrasonic sensor and 5
between 0.8 and 42.1 for the infrared sensor over the 3 test sites. In addition, the average AADP 6
for the ultrasonic and infrared sensors ranged from 6.4 to 12.3 and 4.6 to 19.4, respectively. 7
These results clearly show that the Ultrasonic sensor performed better. 8
9
10
11
12
13
14
15
Lesani, Miranda-Moreno, Fu, Romancyshyn
12
1
2
Table 1. Summary statistics of tests per site 3
Measure Site 1 Site 2 Site 3
Error (%)
Infrared Min - Min 0.9 Min 0.8
Max - Max 42.1 Max 9.9
Ultrasonic Min 1.7 Min 3.7 Min 0.9
Max 24.7 Max 18.6 Max 27.2
ADP (%)
Infrared - -19.4 -0.5
Ultrasonic -11.3 -9.9 2.8
AADP (%)
Infrared - 19.4 4.6
Ultrasonic 12.3 9.9 6.4
4
5
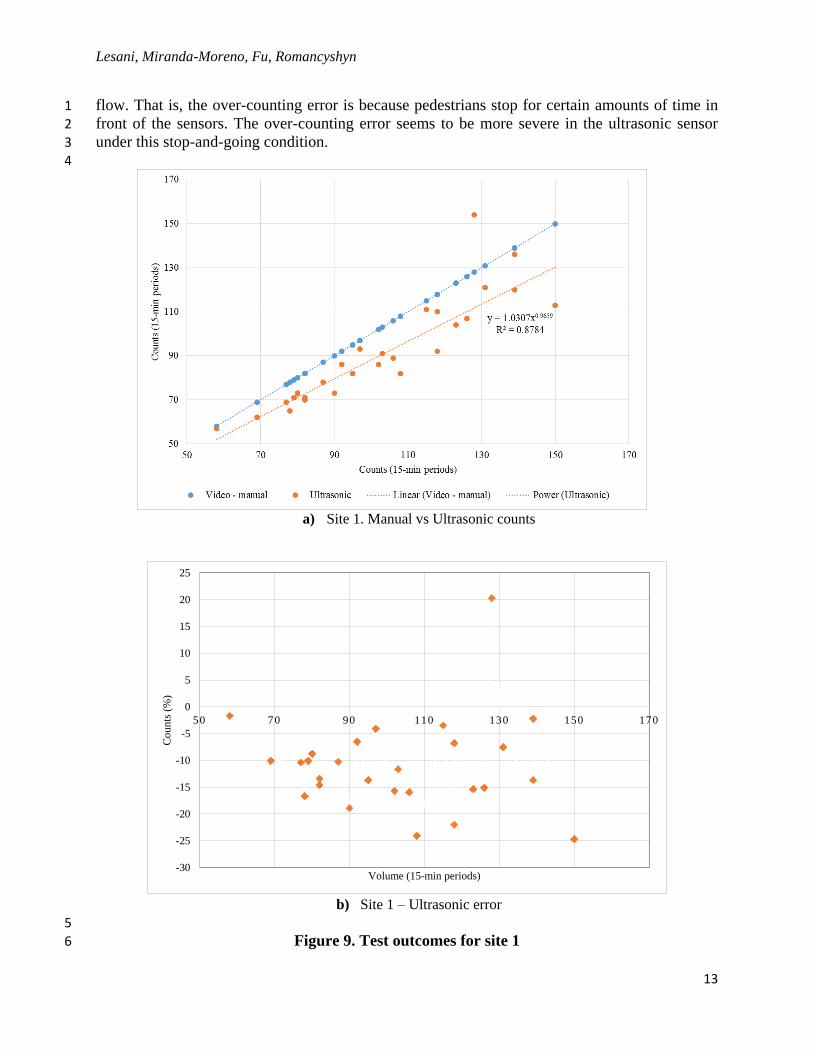
Figures 9a and 9b show the automated and manual counting values (46 intervals of 15-6
min counts) for the first site. Figure 9.a shows the manual versus (vs) the automatic ultrasonic 7
counts from which an R2 of 0.88 was obtained. Figure 9.b shows the error measures. As 8
expected, an under-counting problem was observed, which increased slightly as volumes 9
increased. The system over-counted pedestrians in only one case. 10
11
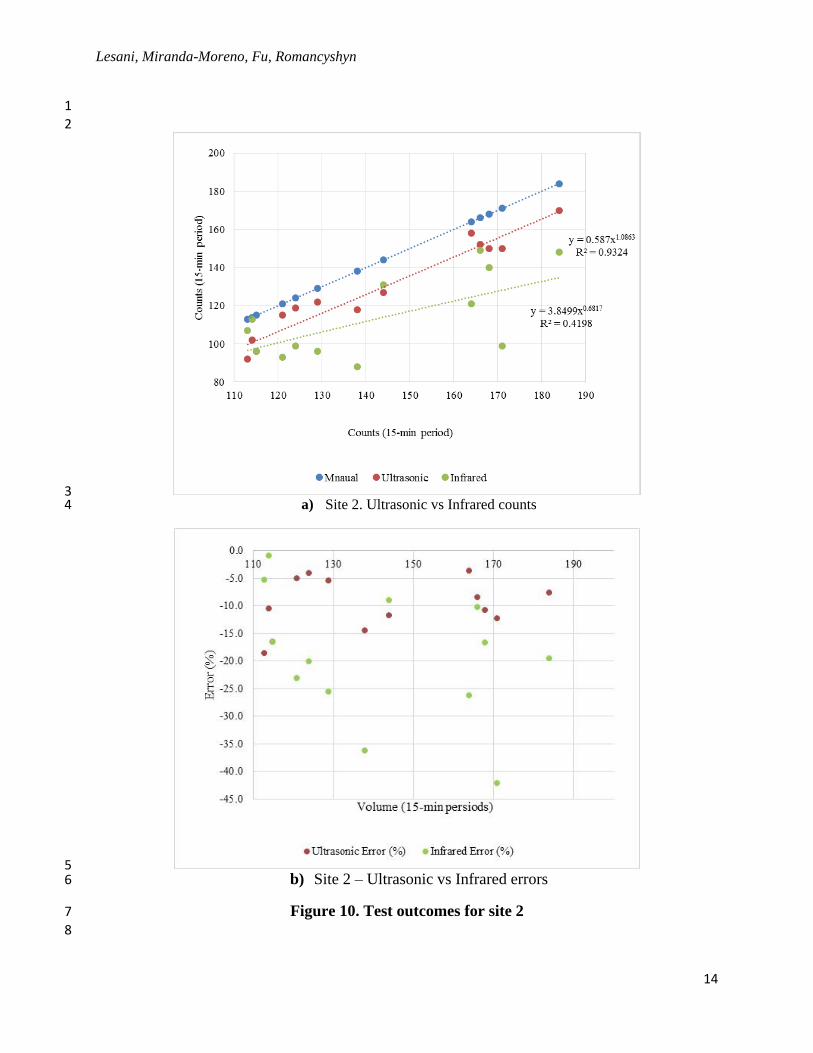
Figure 10.a and 10.b show the results for the second site (Sherbrooke). This site had 12
slightly greater volumes than Milton. Moreover, automated pedestrian counts from both Eco-13
Counter infrared and ultrasonic sensors are presented and compared with respect to manual 14
counts obtained from video data. These results clearly show again the better performance of the 15
ultrasonic system compared than the infrared system. The ultrasonic system presents much lower 16
errors and a higher R2 measure. Also, the results of site 2 show error values of more than 25% 17
several times. This highlights the limitation of the infrared based sensor in sidewalks that are 18
located in open areas. The infrared sensor needs an obstruction, such as wall, or well-defined 19
detection area to have accurate counting. On the other hand, the error values of the counting with 20
the ultrasonic system are less than 15% most of the time. Also, one of the advantages of the 21
ultrasonic sensor is that the measurement range of the ultrasonic sensor can be limited being able 22
to be used in an open area without any obstruction. 23
24
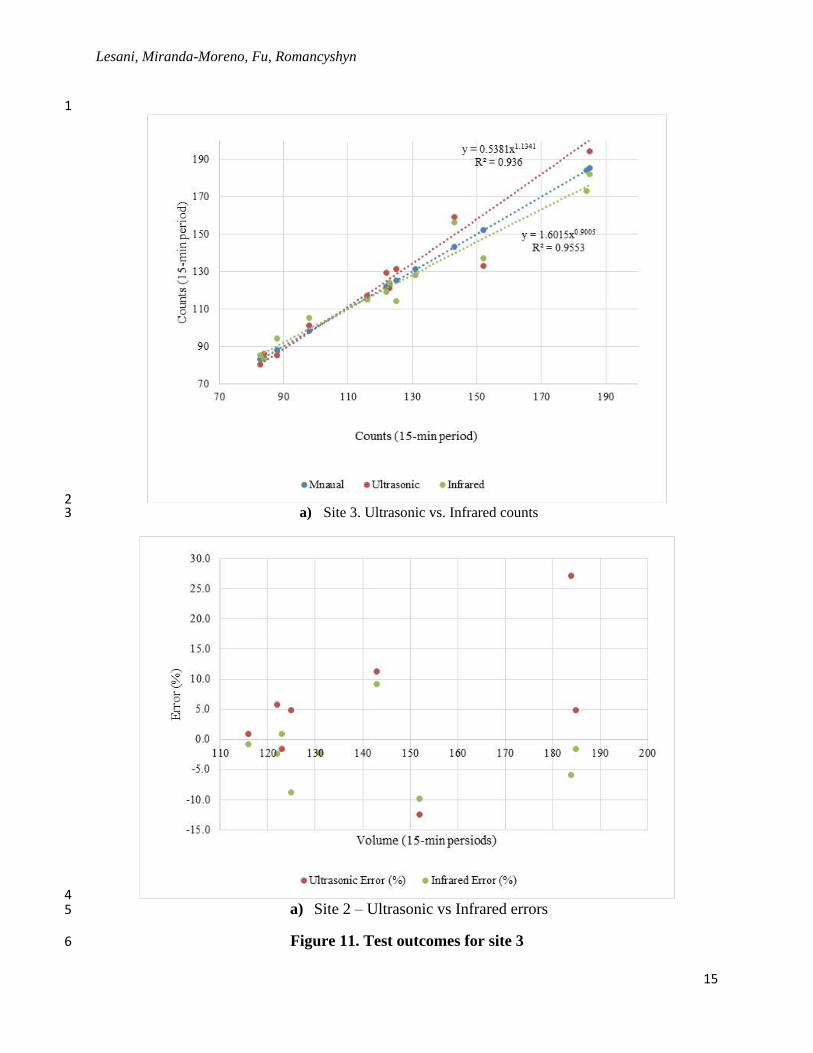
Figure 11.a and 11.b show the result of the third site on University Street. Figure 11.a 25
shows the manual vs the automatic ultrasonic and automatic infrared sensors and Figure 11.b 26
shows the error values. From these figures, it can be seen that most of the time the error values of 27
counting with both systems lie between 0 to 12%. This shows a relatively high level of accuracy 28
in both systems, with very high R2 in both cases. However, there are some over-counting issues 29
because of the high pedestrian volumes as well as the stop-and-going pattern of the pedestrian 30
Lesani, Miranda-Moreno, Fu, Romancyshyn
13
flow. That is, the over-counting error is because pedestrians stop for certain amounts of time in 1
front of the sensors. The over-counting error seems to be more severe in the ultrasonic sensor 2
under this stop-and-going condition. 3
4
a) Site 1. Manual vs Ultrasonic counts
b) Site 1 – Ultrasonic error
5
Figure 9. Test outcomes for site 1 6
-30
-25
-20
-15
-10
-5
0
5
10
15
20
25
50 70 90 110 130 150 170
Counts
(%)
Volume (15-min periods)
Lesani, Miranda-Moreno, Fu, Romancyshyn
14
1
2
3 a) Site 2. Ultrasonic vs Infrared counts 4
5 b) Site 2 – Ultrasonic vs Infrared errors 6
Figure 10. Test outcomes for site 2 7
8
Lesani, Miranda-Moreno, Fu, Romancyshyn
15
1
2 a) Site 3. Ultrasonic vs. Infrared counts 3
4 a) Site 2 – Ultrasonic vs Infrared errors 5
Figure 11. Test outcomes for site 3 6
Lesani, Miranda-Moreno, Fu, Romancyshyn
16
1
CONCLUSIONS AND FUTURE WORK 2 3
This paper introduces an original automated pedestrian counting system based on 4
ultrasonic technology. The system components, hardware and software, are described in this 5
document along with the testing protocol. Three different sites were selected to test the accuracy 6
of the counting system and its functionality in different challenging situations including high 7
volumes, large counting areas without a wall present and stop-and-going pedestrian flow 8
conditions. Video data was collected in order to obtain manual counts (defined as the “ground 9
truth”). Sites and counting periods were selected in order to observe a large variability in the 10
magnitude of counts. One of the sites had a wide sidewalk without a wall, in which traditional 11
counting technologies do not work properly. 12
13
The initial findings clearly show the potential of this counting system with a very good 14
performance on sidewalks with low to high volumes (from 200 to 800 pedestrians per hour). The 15
under-counting error, due mainly to occlusion, varies between 0 to -20% in 98% of the cases. 16
Based on the results, the error increases slightly with volumes, with a power or linear function, 17
which can be used to generate correction functions. These functions can be used to improve the 18
counting estimates (reduce error) in congested sidewalks. 19
20
The proposed system could help handling the limitations of infrared technology, such as 21
the requirement of an obstruction, such as a wall, or well-defined detection area. In open areas or 22
wide sidewalks without walls, the definition of the counting area is a challenge for infrared 23
sensors. In this condition, the accuracy of the infrared based sensor is deteriorated. In the 24
proposed ultrasonic system, there exists the option of changing the coverage area, so it can be 25
used at different locations including open spaces. Additionally, the ultrasonic technology is not 26
sensitive to temperature as opposed to an infrared based sensor which can be significantly 27
affected on hot-sunny days. 28
29
One of the main limitations of the ultrasonic sensor with respect to infrared sensor is the 30
higher energy consumption. Batteries in infrared sensors can work for several years, while in our 31
system the battery only works for a few days. In addition, there a number of interesting 32
improvements and developments that must be explored to further enhance our product. These 33
include: 34
• Modify the detection methodology to count the number of cyclists in bicycle facilities. 35
• Reduce the power consumption of the system to increase the lite time of the system 36
working on battery. 37
• Modify the system to count pedestrians based on the direction of travel (using two 38
sensors in parallel). 39
• Implementing a system with two ultrasonic sensors to increase the accuracy of distance 40
measurements and decrease measurement noises. 41
• Implement data fusion theory in order to create a system that works alongside other 42
sensors such as a combination of a Pyro-electric Infrared sensor and an ultrasonic sensor. 43
• Test the system under different weather conditions. 44
45
46
Lesani, Miranda-Moreno, Fu, Romancyshyn
17
1
2
REFERENCES 3 1. Greene-Roesel, Diogenes, Ragland and Lindau, “Effectiveness of a Commercially Available 4
Automated Pedestrian Counting Device in Urban Environments: Comparison with Manual 5 Counts”, Safe Transportation Research & Education Center, 2008 6
2. Ismail, Karim, Tarek Sayed, and Nicolas Saunier. "Automated collection of pedestrian data using 7 computer vision techniques." Transportation Research Board Annual Meeting Compendium of 8 Papers, Washington, DC. 2009. 9
3. Markowitz, Frank, Jeannette Montufar, and Maury Steindel. "Automated Pedestrian Detection: 10 State of the Art." ITE 2009 Annual Meeting and Exhibit. 2009. 11
4. Dharmaraju Raghuram, David A. Noyce, and Joshua D. Lehman. An evaluation of technologies 12 for automated detection and classification of pedestrians and bicycles. Diss. University of 13 Massachusetts at Amherst, 2002. 14
5. Leykin, Alex, and Riad Hammoud. "Robust multi-pedestrian tracking in thermal-visible 15 surveillance videos." Computer Vision and Pattern Recognition Workshop, 2006. CVPRW'06. 16 Conference on. IEEE, 2006 17
6. Greene-Roesel, Ryan, et al. "Effectiveness of a Commercially Available Automated Pedestrian 18 Counting Device in Urban Environments: Comparison with Manual Counts." (2008). 19
7. Ozbay, K., H. Yang, and B. Bartin, “Calibration of An Infrared-based Automatic Counting 20 System for Pedestrian Traffic Flow Data Collection”, Transportation Research Board 89th Annual 21 Meeting, 2010, 10-3574. 22
8. Leibe, Bastian, Edgar Seemann, and Bernt Schiele. "Pedestrian detection in crowded scenes." 23 Computer Vision and Pattern Recognition, 2005. CVPR 2005. IEEE Computer Society 24 Conference on. Vol. 1. IEEE, 2005. 25
9. Krammer, Peter, and Herbert Schweinzer. "Localization of object edges in arbitrary spatial 26 positions based on ultrasonic data." Sensors Journal, IEEE 6.1 (2006): 203-210. 27
Related Documents