August 2012 The Development and Testing of the Continuity Assessment Record and Evaluation (CARE) Item Set: Final Report on Reliability Testing Volume 2 of 3 Prepared for Judith Tobin, PT, MBA Centers for Medicare & Medicaid Services Office of Clinical Standards and Quality Mail Stop S3-02-01 7500 Security Boulevard Baltimore, MD 21244-1850 Prepared by Barbara Gage, PhD Laura Smith, PhD Jessica Ross, MPH Laurie Coots, MS Tracy Kline, PhD Kate Shamsuddin, BS Karen Reilly, ScD Judith Hazard Abbate, PhD Zachariah Gage-Croll, BA RTI International 3040 Cornwallis Road Research Triangle Park, NC 27709 Anne Deutsch, RN, PhD, CRRN Rehabilitation Institute of Chicago Trudy Mallinson, PhD, OTR/L, NZROT University of Southern California RTI Project Number 0209853.004.002.008

Welcome message from author
This document is posted to help you gain knowledge. Please leave a comment to let me know what you think about it! Share it to your friends and learn new things together.
Transcript
August 2012
The Development and Testing of the Continuity Assessment Record and Evaluation (CARE) Item Set:
Final Report on Reliability Testing
Volume 2 of 3 Prepared for
Judith Tobin, PT, MBA Centers for Medicare & Medicaid Services
Office of Clinical Standards and Quality Mail Stop S3-02-01
7500 Security Boulevard Baltimore, MD 21244-1850
Prepared by Barbara Gage, PhD
Laura Smith, PhD Jessica Ross, MPH
Laurie Coots, MS Tracy Kline, PhD
Kate Shamsuddin, BS Karen Reilly, ScD
Judith Hazard Abbate, PhD Zachariah Gage-Croll, BA
RTI International 3040 Cornwallis Road
Research Triangle Park, NC 27709
Anne Deutsch, RN, PhD, CRRN Rehabilitation Institute of Chicago
Trudy Mallinson, PhD, OTR/L, NZROT University of Southern California
RTI Project Number 0209853.004.002.008
_________________________________ RTI International is a trade name of Research Triangle Institute.
The Development and Testing of the Continuity Assessment Record and Evaluation (CARE) Item Set:
Final Report on Reliability Testing
Volume 2 of 3
Authors: Barbara Gage, PhD Laura Smith, PhD Jessica Ross, MPH Laurie Coots, MS Tracy Kline, PhD
Kate Shamsuddin, BS Anne Deutsch, RN, PhD, CRRN
Trudy Mallinson, PhD, OTR/L, NZROT Karen Reilly, ScD
Judith Hazard Abbate, PhD Zachariah Gage-Croll, BA
Project Director: Barbara Gage
Federal Project Officer: Judith Tobin
RTI International
CMS Contract No. HHSM-500-2005-00291
August 2012
This project was funded by the Centers for Medicare & Medicaid Services under contract no. HHSM-500-2005-00291. The statements contained in this report are solely those of the authors and do not necessarily reflect the views or policies of the Centers for Medicare & Medicaid Services. RTI assumes responsibility for the accuracy and completeness of the information contained in this report.
iii
Acknowledgments
RTI would like to acknowledge the contributions of several organizations and individuals, without whom this work would not have been possible:
IRR/Video Pilot Participants:
Baystate Visiting Nurse Association & Hospice
Heritage Hall East NSG & Rehab
Shaughnessy Kaplan Rehabilitation Hospital
RML Specialty Hospital
Spaulding Rehabilitation Hospital
Golden Living Center
Amedisys – Tender Loving Care
Odd Fellow and Rebekah Rehabilitation Center
Video “Patients”: Phillip, Deb, Octavia, Kate, Joe, Mr. Jones, Dorian, Ms. Smith, and John
Thank you to all the providers who contributed to the Inter-rater reliability and Video reliability data collection efforts.
Margaret Stineman, University of Pennsylvania
Carol Schwartz, Rehabilitation Institute of Chicago
Sarah Couch, Ann-Marie Kamuf, and Chris Murtaugh, Visiting Nurse Service of New York
iv
CONTENTS SUMMARY
This document represents Volume 2 of 3 of the final report, The Development and Testing of the Continuity Assessment Record and Evaluation (CARE) Item Set. This project was conducted by RTI International under contract with the Centers for Medicare & Medicaid Services. The report is divided into three volumes.
• Volume 1: Final Report on the Development of the CARE Item Set
◦ Executive Summary
◦ Section 1: Introduction
◦ Section 2: Study Purpose and Methods
◦ Section 3: CARE Item Justifications and Supporting Literature
◦ Section 4: Technical Expert Panels
◦ Section 5: CARE Item Set Pilot Tests
◦ Section 6: OMB Comments and Resulting Changes to CARE Item Set
◦ Section 7: The CARE Item Set: Potential Challenges and Future Enhancements
◦ References
◦ Appendices
• Volume 2: Final Report on Reliability Testing ◦ Executive Summary
◦ Section 8: Introduction
◦ Section 9: Inter-rater Reliability Testing of the CARE Item Set
◦ Section 10: Video Reliability Testing of the CARE Item Set
◦ Section 11: Functional Status Internal Consistency and Item Level Analysis
◦ References
◦ Appendices
• Volume 3: Final Report on CARE Item Set and Current Assessment Comparisons
◦ Executive Summary
◦ Section 12: Introduction
◦ Section 13: IRF-PAI–CARE Comparisons
◦ Section 14: MDS 2.0–CARE Comparisons
◦ Section 15: OASIS-B–CARE Comparisons
◦ Section 16: Conclusions
◦ References
v
CONTENTS
EXECUTIVE SUMMARY .............................................................................................................1 ES.1 CARE Item Development ..............................................................................................2 ES.2 Reliability Study ............................................................................................................3 ES.3 Traditional Inter-Rater Reliability Testing ....................................................................3 ES.4 Item Selection for Testing ..............................................................................................4 ES.5 Analytic Methods ...........................................................................................................5
ES.5.1 Results .............................................................................................................6 ES.6 Reliability Testing of Clinician Agreement across Settings ..........................................9 ES.7 Functional Status Internal Consistency and Item Level Analysis ...............................13
ES.7.1 Results ...........................................................................................................13 ES.8 Summary ......................................................................................................................14
SECTION 8 INTRODUCTION ....................................................................................................15
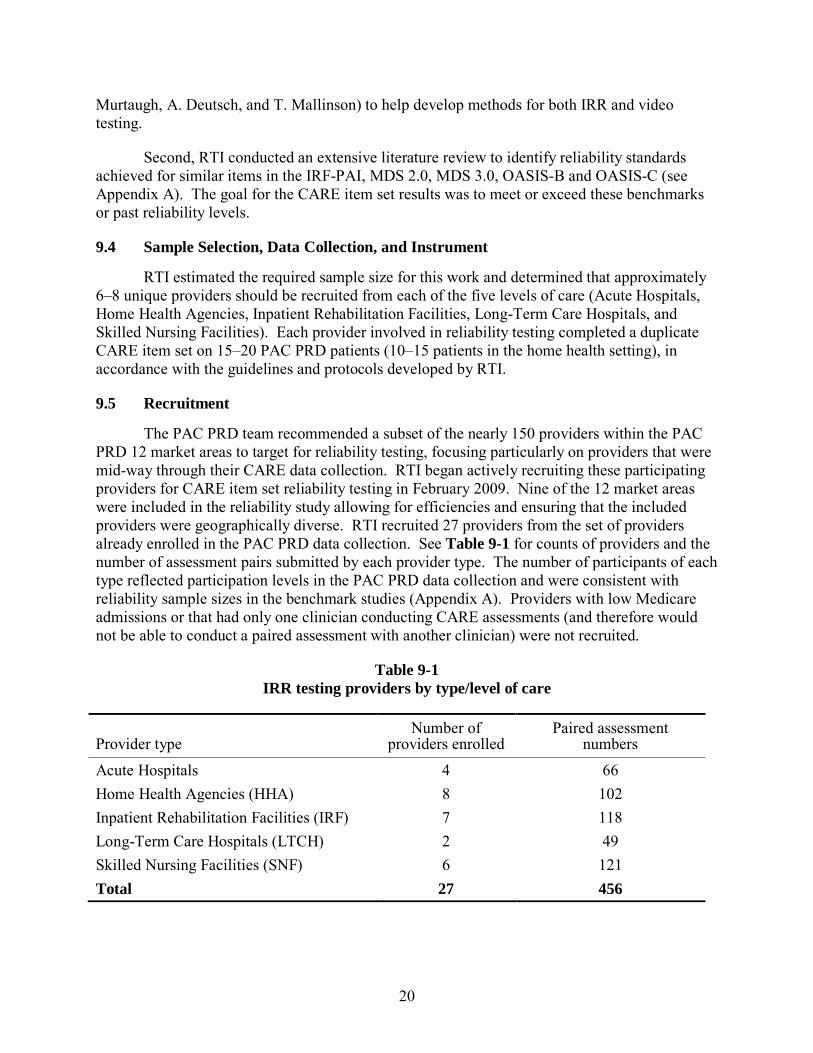
SECTION 9 INTER-RATER RELIABILITY TESTING OF THE CARE ITEM SET ...............19 9.1 Overview ......................................................................................................................19 9.2 Background ..................................................................................................................19 9.3 Methods........................................................................................................................19 9.4 Sample Selection, Data Collection, and Instrument ....................................................20 9.5 Recruitment ..................................................................................................................20 9.6 Item Selection for Testing ............................................................................................21 9.7 Analyses .......................................................................................................................22 9.8 Results ..........................................................................................................................22
I. Sample Demographics ........................................................................................22 II. Prior Functioning and History of Falls ...............................................................25 III. Skin Integrity ......................................................................................................26 IV. Cognitive Status, Mood, and Pain.......................................................................29 V. Impairments ........................................................................................................36 VI. Functional Status .................................................................................................42 VII. Overall Plan of Care............................................................................................50
9.9 Summary ......................................................................................................................52
SECTION 10 VIDEO RELIABILITY TESTING OF THE CARE ITEM SET ...........................53 10.1 Overview ......................................................................................................................53 10.2 Background ..................................................................................................................53 10.3 Methods........................................................................................................................53 10.4 Sample Selection, Data Collection, and Instrument ....................................................54 10.5 Recruitment ..................................................................................................................54 10.6 Item Selection for Testing ............................................................................................57 10.7 Analyses .......................................................................................................................57 10.8 Results ..........................................................................................................................57
I. Sample: Assessor Demographics ........................................................................57 II. Prior Functioning and History of Falls ...............................................................59 III. Skin Integrity ......................................................................................................60 IV. Cognitive Status, Mood, and Pain.......................................................................64
vi
V. Impairments ........................................................................................................70 VI. Functional Status .................................................................................................77
10.9 Summary ......................................................................................................................86
SECTION 11 FUNCTIONAL STATUS INTERNAL CONSISTENCY AND ITEM LEVEL ANALYSIS .............................................................................................................87 11.1 Overview and Methods ................................................................................................87
11.1.1 Overview ........................................................................................................87 11.1.2 CARE Items Analyzed ...................................................................................89 11.1.3 Analysis Methods for CARE Items ................................................................90
11.2 Results 1: Self Care Rasch Reanalysis.........................................................................91 11.3 Results 2: Functional Status Internal Consistency Reanalysis ....................................95
11.3.1 Specified Self Care and Mobility Items ........................................................95 11.4 Results 3: Functional Status 50% Random Sample Analysis ....................................100
11.4.1 Rasch Analysis of Self Care, Mobility, and Motor (Self Care and Mobility Combined) Items for the Split-Half Subsample ................................100
REFERENCES ............................................................................................................................107
Appendices
APPENDIX A RTI COMPARISON OF ITEMS RELIABILITY FOR CARE AND RELATED ITEMS .............................................................................................................109
APPENDIX B VIDEO RELIABILITY TESTING: VIDEO PATIENT PROFILES .................153
APPENDIX C CARE FUNCTION SCALE PRELIMINARY ANALYSIS ..............................155
vii
LIST OF TABLES
Table ES-1 IRR and video reliability testing providers by PAC PRD market area................ 3 Table ES-2 IRR testing providers by type/level of care ......................................................... 4 Table ES-3 Video reliability testing providers by type/level of care .................................... 10 Table 9-1 IRR testing providers by type/level of care ....................................................... 20 Table 9-2 IRR sample: Demographics ............................................................................... 23 Table 9-3 IRR sample: Prior service use and residence type ............................................. 24 Table 9-4a IRR testing: Prior functioning items and history of falls, IRR sample
(CARE Item Set Section 2) ................................................................................ 25 Table 9-4b IRR testing: Prior functioning items and history of falls, IRR sample, by
provider type (CARE Item Set Section 2) ......................................................... 26 Table 9-5a IRR testing: Skin integrity measures at PAC admission and acute
discharge, IRR sample (CARE Item Set Section 3) .......................................... 27 Table 9-5b IRR testing: Skin integrity measures at PAC admission and acute
discharge, IRR sample, by provider type ........................................................... 29 Table 9-6 IRR testing: Cognitive status, mood at PAC admission and acute
discharge, IRR sample (CARE Item Set Section 4) .......................................... 31 Table 9-7a IRR testing: Pain at PAC admission and acute discharge, IRR sample
(CARE Item Set Section 4) ................................................................................ 34 Table 9-7b IRR testing: Cognitive section, PAC admission and acute discharges, IRR
sample, by provider type (CARE Item Set Section 4) ....................................... 35 Table 9-8 IRR testing: Impairment in bladder and bowel management and
swallowing at PAC admission and acute discharge, IRR sample (CARE Item Set Section 5) ............................................................................................. 37
Table 9-9a IRR testing: Impairment measures: Hearing, vision, and communication at PAC admission and acute discharge, IRR sample (CARE Item Set Section 5) ........................................................................................................... 39
Table 9-9b IRR testing: Impairments at PAC admission and acute discharge, IRR sample, by provider type (CARE Item Set Section 5) ....................................... 40
Table 9-10a IRR testing: Core self care and mobility at PAC admission and acute discharge, IRR sample (CARE Item Set Section 6) .......................................... 43
Table 9-10b IRR testing: Core self care and mobility at PAC admission and acute discharge, IRR sample, by provider type (CARE Item Set Section 6) .............. 45
Table 9-11a IRR testing: Function—supplemental self care, mobility, and IADLs at PAC admission and acute discharge, IRR sample (CARE Item Set Section 6) ........................................................................................................... 47
Table 9-11b IRR testing: Function—supplemental self care, mobility, and IADLs at PAC admission and acute discharge, IRR sample, by provider type (CARE Item Set Section 6) ................................................................................ 49
Table 9-12a IRR testing: Overall plan of care/advance care directives at PAC admission and acute discharge, IRR sample (CARE Item Set Section 7) ......... 51
Table 9-12b IRR testing: Patient overall status at PAC admission and acute discharge, IRR sample, by provider type (CARE Item Set Section 7) ............................... 52
Table 10-1 Patient case study characteristics by video ........................................................ 55 Table 10-2 Video testing providers by type/level of care .................................................... 56
viii
Table 10-3 Clinicians completing video assessments, by discipline.................................... 58 Table 10-4 Clinicians completing video assessments by provider type ............................... 59 Table 10-5a Agreement with the mode: Prior functioning and history of falls ..................... 60 Table 10-5b Agreement with the clinical team: Prior functioning and history of falls .......... 61 Table 10-6a Agreement with the mode: Skin integrity .......................................................... 62 Table 10-6b Agreement with the clinical team: Skin integrity .............................................. 63 Table 10-7a Agreement with the mode: Cognitive status and mood ..................................... 66 Table 10-7b Agreement with the clinical team: Cognitive status and mood ......................... 67 Table 10-8a Agreement with the mode: Pain ......................................................................... 69 Table 10-8b Agreement with the clinical team: Pain ............................................................. 70 Table 10-9a Agreement with the mode: Bladder and bowel & swallowing .......................... 71 Table 10-9b Agreement with the clinical team: Bladder and bowel & swallowing .............. 72 Table 10-10a Agreement with the mode: Hearing, vision, and communication; weight-
bearing; grip strength; respiratory status; and endurance .................................. 74 Table 10-10b Agreement with the clinical team: Hearing, vision, and communication;
weight-bearing; grip strength; respiratory status; and endurance ...................... 75 Table 10-11a Agreement with the mode: Functional status: Core self care and mobility ....... 77 Table 10-11b Agreement with the clinical team: Functional status: Core self care and
mobility .............................................................................................................. 78 Table 10-12a Agreement with the mode: Functional status: Supplemental functional
ability and IADLs .............................................................................................. 81 Table 10-12b Agreement with the clinical team: Functional status: Supplemental
functional ability and IADLs ............................................................................. 82 Table 10-13 Mean difference in rating score between sample clinicians and expert
clinical team by clinician type ........................................................................... 85 Table 11-1 Summary of admission self care core, supplemental, and IADL items ............. 91 Table 11-2 Summary of discharge self care core, supplemental, and IADL items .............. 92 Table 11-3 Self care core, supplemental, and IADL key form showing rating scale
steps and item order at discharge ....................................................................... 93 Table 11-4 Self care core, supplemental, and IADL item statistics at discharge ................. 94 Table 11-5 CARE functional status overall reliability summary ......................................... 97 Table 11-6 CARE functional status reliability summary by provider type .......................... 97 Table 11-7 CARE functional status admission exploratory factor analysis ......................... 98 Table 11-8 CARE functional status discharge exploratory factor analysis ......................... 99 Table 11-9a Motor items key form showing rating scale steps, item order, and person
distribution ....................................................................................................... 101 Table 11-9b Motor items key form showing post-walking recoding ................................... 102 Table 11-10 Summary of admission and discharge motor core and supplemental items
(50% random sample) ...................................................................................... 103 Table 11-11 Summary of admission and discharge motor core items (50% random
sample) ............................................................................................................. 103 Table 11-12 Findings from Rasch principal components analysis....................................... 104 Table 11-13 Summary of admission and discharge IADL items (50% random sample) ..... 105 Table 11-14 IADL items key form showing rating scale steps, item order, and person
distribution ....................................................................................................... 106
ix
LIST OF FIGURES
Figure 11-1 Comparison of self care core, supplemental, and IADL item difficulties at admission and discharge ....................................................................................... 95
EXECUTIVE SUMMARY
The Centers for Medicare & Medicaid Services (CMS) has undertaken a major initiative to evaluate and realign the incentives for inpatient and post-acute services provided under the Medicare program. Currently, about a fourth of all beneficiaries are admitted to a general acute hospital each year; almost 35% of them are discharged to additional care in a long-term care hospital (LTCH), inpatient rehabilitation facility (IRF), skilled nursing facility (SNF), or home with additional services provided by a home health agency (HHA). Many use more than one service following hospital discharge (Gage et al., 2008). While these services constitute a continuum of care for the patient, the current measurement systems do not allow Medicare to examine the effects of these continuing services on the patient’s overall health and functional status.
The Medicare program currently mandates that IRFs, SNFs, and HHAs each submit assessment data on the beneficiary’s medical, functional, and cognitive status. This information is used in both the payment and quality monitoring efforts at CMS. Hospitals, both general acute and LTCHs, also submit data on medical conditions being treated as it is reported under the Medicare Severity Diagnosis-Related Group (MS-DRG) based case-mix system used to pay and monitor these providers. Despite the inclusion of these factors in the existing systems, four of the five systems were developed independently and use different items to measure each set of concepts. As a result, the Medicare program has not been able to measure changes in a patient’s health status as they progress across their episode of care. Further, this lack of standardized measurement makes it difficult to understand the extent to which patients and program costs differ across the settings.
The Deficit Reduction Act of 2005 (DRA) directed CMS to develop methods for consistently measuring Medicare beneficiaries’ health status across acute and post-acute care (PAC) settings. This contract addresses this issue by testing the use of a standardized set of items for measuring medical, functional, cognitive, and social support factors in the acute hospital, LTCH, IRF, SNF, and HHA. These items are based on the science behind the currently mandated assessment items in the Medicare payment systems, including those in the IRF-PAI, MDS, and OASIS instruments. Over the past few years, RTI has been working with the Office of Clinical Standards and Quality, as well as the five different research and clinical communities associated with acute and PAC services, including clinicians, case-mix measurement experts, accreditation bodies, such as The Joint Commission (JCAHO), Commission on the Accreditation of Rehabilitation Facilities (CARF), provider associations, and others, to identify or develop a select set of items that would be appropriate for measuring beneficiary severity of illness, regardless of site of care. Input was collected through numerous stakeholder meetings, including several Open Door Forums (ODFs) and Technical Expert Panels (TEPs).
The DRA also established a Post Acute Care Payment Reform Demonstration (PAC PRD) to use the standardized data and develop recommendations for refining current PAC payment methodologies. Data have been collected in the PAC PRD for the past two years. Over 40,000 assessments have been collected in 199 settings, including acute hospitals, LTCHs, IRFs, SNFs, and HHAs. An additional 455 assessments were collected to test inter-rater item
1
2
reliability of the standardized CARE items and an additional 550 assessments were collected in the video-based reliability approach.
ES.1 CARE Item Development
The DRA called for standardized assessment items to be used in the acute and PAC settings participating in the PAC PRD. To meet that mandate, CMS’ Office of Clinical Standards and Quality sponsored the development of the CARE item set. CARE items are standardized assessment items based on the science behind a subset of concepts in the current Medicare mandated assessment tools (MDS, OASIS, IRF-PAI) or those used in acute and LTCH hospitals. TEPs and stakeholder input were used to select the key domains needed to measure the complexity of Medicare beneficiaries treated in hospitals and PAC settings. TEP members were representatives from each of the five acute and PAC clinical and research communities, including provider associations (both institutional and professional), case-mix measurement experts, and accreditation bodies, such as JCAHO, CARF, and others who identified a select set of items that would be appropriate for measuring beneficiary severity of illness in the Medicare population, regardless of site of care.
Once the domains were determined, the TEPs addressed the second major issue- specification of the best items under each domain that could be applied across the range of health and impairment levels treated in these settings. While each of the current assessment tools measured similar concepts or subsets of concepts in each setting, each used different items to measure the concepts. The CARE items are the result of these discussions and represent standardized assessment items for each concept. Many of the items are the same as those in the MDS 3.0 and OASIS -C since these two instruments were going through reevaluation at the same time and this work was done in collaboration with that work. However, the CARE item set has many fewer items than the MDS or OASIS since the two setting-specific tools also have care planning items not necessary for cross-setting measurement of severity. The CARE also built on the science behind the IRF-PAI tool in identifying important concepts or domains for measuring severity in the populations needing physical rehabilitation services. Input from the field was used to refine measurement approaches that allowed identification of an impairment or level of independence but which improved measurement of function and pressure ulcers based on input from those respective communities. Last, the CARE item set also has a few additional items that reflect severity in the more medically complex populations treated in inpatient settings, such as acute, LTCH, and IRF. These items are based on concepts currently used in the acute and LTCH intake or assessment processes.
The final set of items was submitted for publication in the Federal Register and underwent two sets of public comment periods. The items were revised following a pilot test and the resulting changes were implemented in PAC PRD. Input also was collected throughout the process with various stakeholder meetings, including several ODFs and small group meetings with different associations and presentations with requests for input at major national association meetings.
While most of the CARE items measure concepts found on existing validated items currently used in the Medicare program, few have been used on patients in multiple settings or at different levels of care. This study tested the application of these standardized items across the
3
acute and PAC settings and their reliability when used by different types of clinicians in different settings with the range of Medicare populations.
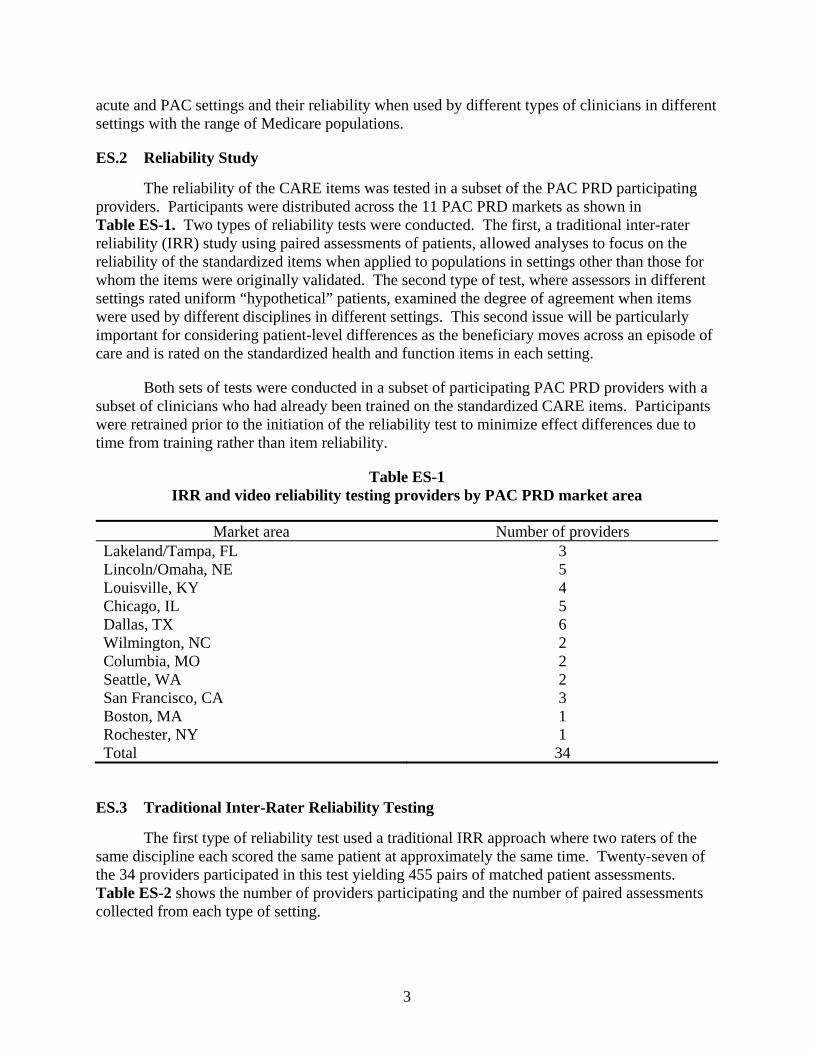
ES.2 Reliability Study
The reliability of the CARE items was tested in a subset of the PAC PRD participating providers. Participants were distributed across the 11 PAC PRD markets as shown in Table ES-1. Two types of reliability tests were conducted. The first, a traditional inter-rater reliability (IRR) study using paired assessments of patients, allowed analyses to focus on the reliability of the standardized items when applied to populations in settings other than those for whom the items were originally validated. The second type of test, where assessors in different settings rated uniform “hypothetical” patients, examined the degree of agreement when items were used by different disciplines in different settings. This second issue will be particularly important for considering patient-level differences as the beneficiary moves across an episode of care and is rated on the standardized health and function items in each setting.
Both sets of tests were conducted in a subset of participating PAC PRD providers with a subset of clinicians who had already been trained on the standardized CARE items. Participants were retrained prior to the initiation of the reliability test to minimize effect differences due to time from training rather than item reliability.
Table ES-1 IRR and video reliability testing providers by PAC PRD market area
Market area Number of providers Lakeland/Tampa, FL 3 Lincoln/Omaha, NE 5 Louisville, KY 4 Chicago, IL 5 Dallas, TX 6 Wilmington, NC 2 Columbia, MO 2 Seattle, WA 2 San Francisco, CA 3 Boston, MA 1 Rochester, NY 1 Total 34
ES.3 Traditional Inter-Rater Reliability Testing
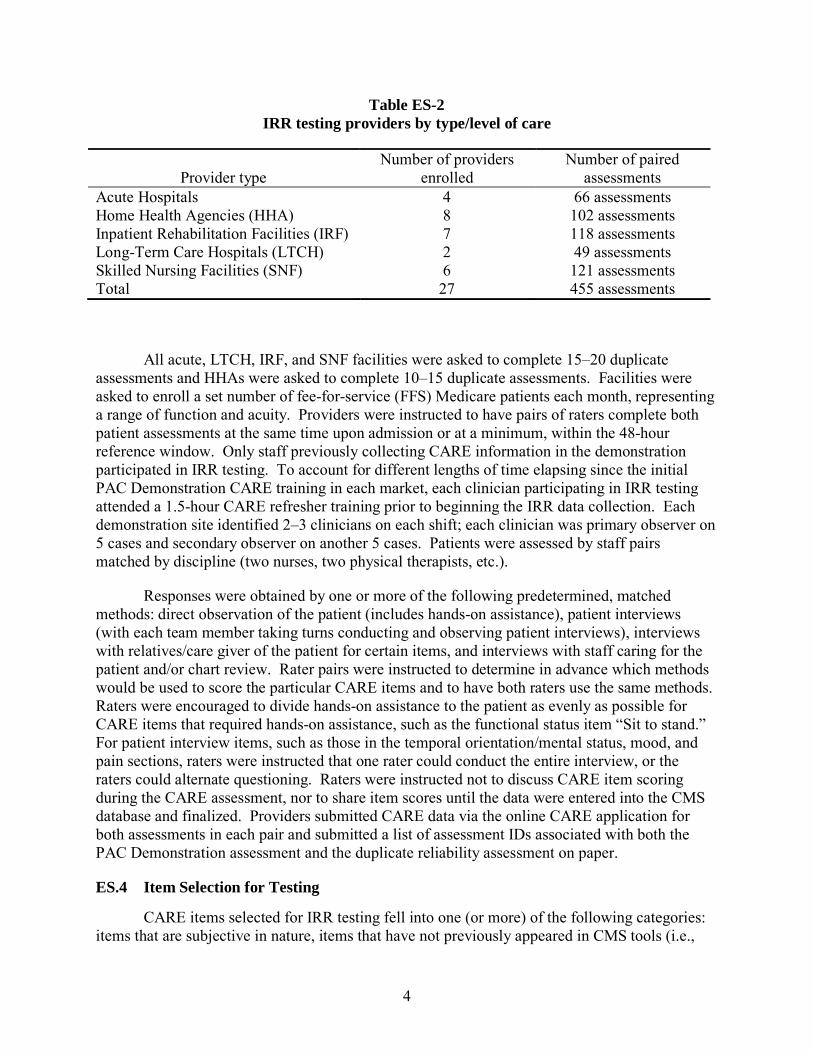
The first type of reliability test used a traditional IRR approach where two raters of the same discipline each scored the same patient at approximately the same time. Twenty-seven of the 34 providers participated in this test yielding 455 pairs of matched patient assessments. Table ES-2 shows the number of providers participating and the number of paired assessments collected from each type of setting.
4
Table ES-2 IRR testing providers by type/level of care
Provider type Number of providers
enrolled Number of paired
assessments Acute Hospitals 4 66 assessments Home Health Agencies (HHA) 8 102 assessments Inpatient Rehabilitation Facilities (IRF) 7 118 assessments Long-Term Care Hospitals (LTCH) 2 49 assessments Skilled Nursing Facilities (SNF) 6 121 assessments Total 27 455 assessments
All acute, LTCH, IRF, and SNF facilities were asked to complete 15–20 duplicate assessments and HHAs were asked to complete 10–15 duplicate assessments. Facilities were asked to enroll a set number of fee-for-service (FFS) Medicare patients each month, representing a range of function and acuity. Providers were instructed to have pairs of raters complete both patient assessments at the same time upon admission or at a minimum, within the 48-hour reference window. Only staff previously collecting CARE information in the demonstration participated in IRR testing. To account for different lengths of time elapsing since the initial PAC Demonstration CARE training in each market, each clinician participating in IRR testing attended a 1.5-hour CARE refresher training prior to beginning the IRR data collection. Each demonstration site identified 2–3 clinicians on each shift; each clinician was primary observer on 5 cases and secondary observer on another 5 cases. Patients were assessed by staff pairs matched by discipline (two nurses, two physical therapists, etc.).
Responses were obtained by one or more of the following predetermined, matched methods: direct observation of the patient (includes hands-on assistance), patient interviews (with each team member taking turns conducting and observing patient interviews), interviews with relatives/care giver of the patient for certain items, and interviews with staff caring for the patient and/or chart review. Rater pairs were instructed to determine in advance which methods would be used to score the particular CARE items and to have both raters use the same methods. Raters were encouraged to divide hands-on assistance to the patient as evenly as possible for CARE items that required hands-on assistance, such as the functional status item “Sit to stand.” For patient interview items, such as those in the temporal orientation/mental status, mood, and pain sections, raters were instructed that one rater could conduct the entire interview, or the raters could alternate questioning. Raters were instructed not to discuss CARE item scoring during the CARE assessment, nor to share item scores until the data were entered into the CMS database and finalized. Providers submitted CARE data via the online CARE application for both assessments in each pair and submitted a list of assessment IDs associated with both the PAC Demonstration assessment and the duplicate reliability assessment on paper.
ES.4 Item Selection for Testing
CARE items selected for IRR testing fell into one (or more) of the following categories: items that are subjective in nature, items that have not previously appeared in CMS tools (i.e.,
5
new CARE items), items that influence payments or are used in payment models currently, or items not previously tested in certain settings. Items excluded from the reliability tests included less subjective items such as ICD-9 codes and the use of major treatments (yes/no indicators based on medical charts and patient observation for resources such as ventilators, hemodialysis, central lines).
ES.5 Analytic Methods
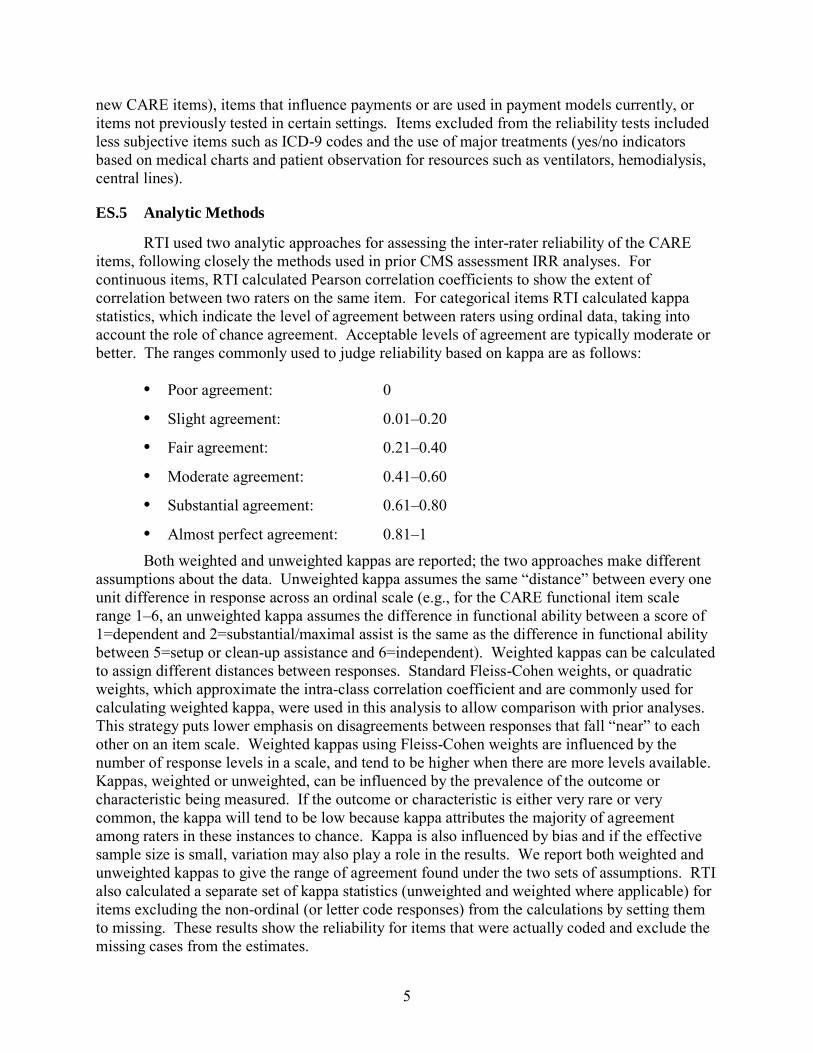
RTI used two analytic approaches for assessing the inter-rater reliability of the CARE items, following closely the methods used in prior CMS assessment IRR analyses. For continuous items, RTI calculated Pearson correlation coefficients to show the extent of correlation between two raters on the same item. For categorical items RTI calculated kappa statistics, which indicate the level of agreement between raters using ordinal data, taking into account the role of chance agreement. Acceptable levels of agreement are typically moderate or better. The ranges commonly used to judge reliability based on kappa are as follows:
• Poor agreement: 0
• Slight agreement: 0.01–0.20
• Fair agreement: 0.21–0.40
• Moderate agreement: 0.41–0.60
• Substantial agreement: 0.61–0.80
• Almost perfect agreement: 0.81–1
Both weighted and unweighted kappas are reported; the two approaches make different assumptions about the data. Unweighted kappa assumes the same “distance” between every one unit difference in response across an ordinal scale (e.g., for the CARE functional item scale range 1–6, an unweighted kappa assumes the difference in functional ability between a score of 1=dependent and 2=substantial/maximal assist is the same as the difference in functional ability between 5=setup or clean-up assistance and 6=independent). Weighted kappas can be calculated to assign different distances between responses. Standard Fleiss-Cohen weights, or quadratic weights, which approximate the intra-class correlation coefficient and are commonly used for calculating weighted kappa, were used in this analysis to allow comparison with prior analyses. This strategy puts lower emphasis on disagreements between responses that fall “near” to each other on an item scale. Weighted kappas using Fleiss-Cohen weights are influenced by the number of response levels in a scale, and tend to be higher when there are more levels available. Kappas, weighted or unweighted, can be influenced by the prevalence of the outcome or characteristic being measured. If the outcome or characteristic is either very rare or very common, the kappa will tend to be low because kappa attributes the majority of agreement among raters in these instances to chance. Kappa is also influenced by bias and if the effective sample size is small, variation may also play a role in the results. We report both weighted and unweighted kappas to give the range of agreement found under the two sets of assumptions. RTI also calculated a separate set of kappa statistics (unweighted and weighted where applicable) for items excluding the non-ordinal (or letter code responses) from the calculations by setting them to missing. These results show the reliability for items that were actually coded and exclude the missing cases from the estimates.

6
ES.5.1 Results
Overall, the results showed very good agreement on most items. Across all 146 items tested, only 17% had a rating lower than 0.60, including both the unweighted and weighted items and samples with and without letter codes included. Looking just at the weighted kappas for samples that exclude letter codes or unweighted kappas where appropriate, 13% (19 items) of the 146 items had a reliability of 0.70 or lower. Items with poorer agreement among any of the samples (less than 0.60) tended to be items with fewer responses (e.g., items where the response code was “Other” or tube feeding and comatose where few cases were included). However, a few items with reasonable sample sizes also appeared to be less reliable, such as certain components of the swallowing item (complaints of difficulty or pain when swallowing, holding food or liquid, and loss of liquid when swallowing). These lower reliability ratings were offset in the swallowing item by less discretionary components, such as NPO (0.97) and no impairments (0.84). Other poor scoring items included walking 150 feet, light shopping, and laundry.
Agreement was fairly high across providers on most items with some variation across the different domains. These are discussed in more detail below.
Prior Function Prior functioning had high rater agreement with codes on each item ranging from 0.75 to
0.86. “History of falls” also had very high agreement between raters (0.88). These kappas were fairly consistent across the five types of providers although IRFs tended to have lower agreement on this interview item (0.50 for weighted and 0.54 for unweighted self care). HHAs had the second lowest ratings (between 0.74 and 0.70) and each of the other providers had even higher rates of agreement on this interview/history item.
Skin Integrity All kappas for the evaluated pressure ulcer items indicate substantial or near perfect
consistency. The lowest weighted kappa was for the “Unstageable ulcer” (0.68); the rest of the pressure ulcer items ranged from 0.70 to 0.83. The major wound items also had substantial or almost perfect ratings ranging from 0.64 for agreement on “Delayed healing” to 0.93 for agreement on “Vascular ulcers.”
The turning surfaces item was less reliable with results ranging from 0.21 for “Other surfaces not intact” to 0.76 for “Back/buttocks not intact.” The two items with potential usefulness in this group are “Back/buttocks not intact” (0.76) and “Skin for all turning surfaces is intact,” which also had substantial agreement (0.66).
Looking across settings, agreement is almost perfect for the pressure ulcer item 3.G2, “Does this patient have one or more unhealed pressure ulcer(s) at stage 2 or higher or unstageable,” with kappas for HHAs, LTCHs, and SNFs each indicating almost perfect agreement (0.82–0.92). Kappas for acute hospitals demonstrate substantial agreement (0.73), while inter-rater reliability in IRFs indicated moderate agreement (0.58). For CARE item 3.G6a, “Skin for all turning surfaces is intact,” LTCHs exhibit almost perfect consensus between raters (0.87), while kappas for both acute care providers and HHAs indicate substantial agreement (0.64 and 0.72, respectively).
7
Cognitive Items The Brief Interview for Mental Status (BIMS) items had almost perfect agreement with
weighted kappas ranging from 0.71 to 0.91 and unweighted kappas ranging from 0.62 to 0.86. This held true across all providers in looking at the “Knows year” item, with the lowest scorers in SNFs (0.73) and the highest scores in IRFs (1.0). The kappas were highest for the “Temporal orientation” items (4.B3b) at 0.86 and above and “Recall of three words” (4.B3c) at 0.89 or above for the second recall item. The first memory item, “Repetition of 3 words,” was slightly lower with kappas of 0.71.
The CAMS had substantial agreement for inattention and disorganized thinking (0.70–0.73); however, altered level of consciousness and psychomotor retardation were lower at 0.58 and 0.48, respectively. Across providers on the “Inattention” item (4.D1), IRFs had the highest agreement at 0.82 for the weighted kappa and 0.74 for the unweighted kappa. The rest of the providers’ rates of agreement were all above 0.60.
Depression/Sadness Items The CARE included two depression items: the PHQ-2© and the PROMIS item. The
PROMIS item was based on the SF-36, which was developed for the general population, including the healthy population. The kappas suggest the PHQ-2© items were slightly more reliable across the acute and PAC populations than the “Feeling sad” item (more kappas above 80 although the lowest kappa on the “Feeling sad” item was 0.742), suggesting both are fairly reliable in these populations. For the PHQ-2 item 4.F2c, “Feeling down, depressed, or hopeless,” kappas with “Unable to answer” or “No response” excluded indicate almost perfect agreement, with values ranging from 0.81 to 0.89 for all provider types excepting acute hospitals, which did not have this item on their tool.
Pain Items The interview-based pain items (4.G1 through 4.G5) had substantial to almost perfect
kappas whether coded non-response items were included in calculations or not (weighted kappa range: 0.79–0.88). Looking across providers at the “Pain presence during the last 2 days?” (4.G2), kappas indicate almost perfect agreement (ranging from 0.88 to 0.94) in all care settings except for SNFs, whose kappa value indicates substantial agreement (0.72).
Observational assessment items had lower kappa values than the interview items, as expected, but were still substantial for “Non-verbal sounds,” “Vocal complaints of pain,” and “Facial expressions” (range 0.61–0.66). “Protective body movements or postures” (4.G6d) had a lower kappa at 0.42.
Impairment Items The bowel and bladder items show substantial consistency between raters, with kappas
ranging from 0.60 to 0.90, with most items over 0.70. Kappas appear to be a bit higher for bladder items, though bowel management kappas may have been impacted by lower prevalence of impairments in bowel management. The lowest weighted kappas for bladder incontinence were in the LTCHs (0.66).
8
“Swallowing signs and symptoms” had more variation in scores, with high agreement for “NPO: intake not by mouth” (5.B1e) at 0.97, but offset by “Complaints of difficulty or pain with swallowing,” which had the lowest score in this group at 0.46. “Holding food in mouth” and “Loss of liquids” had scores of 0.56 and 0.57, respectively. “Coughing or choking” and other signs and symptoms had substantial agreement and raters were almost perfect when evaluating if a patient had no signs or symptoms (0.84). Across providers, the lowest agreements on this item were in the HHAs and LTCHs, which had kappas of 0.64 and 0.67, respectively.
The hearing, vision, and communication comprehension items on the CARE item set include four items taken from the MDS 3.0. The goal of these items is to identify the level of impairment as mild or moderately impaired, severely impaired, or not impaired. The kappa statistics for these are all strong, with weighted kappas between 0.74 on sight to 0.80 on hearing.
Both the weight-bearing and grip strength items showed kappas above 0.71, although it varied by individual items. The weight-bearing items ranged from 0.71 for agreement on upper right extremity to 0.90 for agreement for lower left extremity. Grip strength ranged from 0.75 in the left hand to 0.85 in the right hand.
Respiratory status also had very high kappas, with weighted kappas ranging from 0.79 to 0.87 for items with and without oxygen, respectively.
Kappas for endurance items, both mobility and sitting items, showed substantial agreement, whether weighted or unweighted (0.69–0.76 or 0.62–0.71, respectively). For the “Sitting endurance” item (5.G1b), acute hospitals and SNFs had the highest kappas (0.78 and 0.75), respectively, followed by the HHAs (0.74). IRFs had the lowest agreement at 0.41 for the weighted kappas.
Functional Status The CARE item set includes a core set of six self care items and five functional mobility
items that are scored on all patients. Items represent a range of difficulty. Many of these are based on measure concepts found on the OASIS, MDS 3.0, and IRF-PAI.
Kappa statistics for all core items, self care and mobility, indicate substantial agreement among raters with weighted kappa at 0.78 or above. The unweighted kappas are slightly lower, ranging in the mid-60s, with the exception of the tubefeeding and oral hygiene items, which are lower (0.59 and 0.22, respectively). (Tubefeeding scores are low because of low prevalence of tube feeding in our sample population.) These values remain consistently high across providers with a few exceptions. The eating score is lower for HHAs (0.61), the oral hygiene is lower for LTCHs (0.55), and the chair transfers are lower in the LTCHs (0.52).
Mobility items also had high agreement scores ranging from 0.56 for “Walking 150 feet” (which had small numbers) to 0.90 for “transfers” in the weighted scores. Unweighted kappas are slightly lower ranging from 0.68 for “Toilet transfer” to 0.76 for “Sit to stand.” These relatively high levels of agreement were consistent across all five settings with kappas for “Lying to sitting on side of bed” ranging from 0.72 for LTCH cases to 0.87 for SNF cases. For “Sit to stand” items, agreement ranged above 0.81 (LTCHs were excluded for small numbers).
“Chair/bed transfers” were also consistently high across providers, with the lowest scores being 0.78 in the IRF to the highest of 0.93 in the SNFs.
Supplemental self care items also scored consistently high, with each weighted kappa being above 0.8 and the unweighted kappas consistently ranging between 0.63 (“Shower/bathe self” or “Wash upper body”) to 0.74 (“Picking up object”). Similarly, supplemental mobility items had kappas of 0.80 or above for weighted kappas and 0.64 (“1 step curb”) to 0.78 (“Walk 10 feet on uneven surface”). Again, there was slight variation across providers, but all weighted kappas ranged above 0.70 with the one exception of rolling left to right in LTCHs, which showed kappas of 0.52.
Instrumental activities of daily living all had weighted kappas of 0.7 or above except for light shopping and laundry (0.52 and 0.48, respectively). Notably, these items applied to many fewer cases due to medical complexity or the inability of staff to observe the patient’s performance in these settings. This was particularly true for medication management in the inpatient setting.
Overall Plan of Care and Health Status Overall plan of care items including the overall health status item were also examined.
The two plan of care items had reasonable kappas of 0.82 or 0.76, but the patient’s overall status had lower kappa scores (0.68 for weighted and 0.59 for unweighted). At the provider level, there was variation by type of provider. Acute hospitals, HHAs, and LTCHs had kappas of 0.67, 0.73, and 0.74, respectively, while the IRFs had kappas of 0.35 and SNFs of 0.57.
Summary of IRR Tests These results suggest that most of the standardized assessment items have strong
reliability within and across settings. Given that most of the CARE items are standardized versions of health status concepts already being measured in each setting, this finding is not surprising. A few items had lower reliability suggesting their use across settings without greater development may be limited. This includes the skin integrity item measuring the components of turning surfaces not intact, the observational pain item measuring pain based on protective body movement or postures, several components of the swallowing items, such as complaints of difficulty, holding food in cheeks, and loss of liquids when eating/drinking, and the three IADL items of light shopping, laundry, and public transportation.
All other items scored reasonable levels of reliability. Differences across settings were present, but each setting still had acceptable levels of reliability within setting, suggesting these items could be used to measure a patient’s progress in a standardized way across an episode of care.
ES.6 Reliability Testing of Clinician Agreement across Settings
A limitation of within-facility IRR is that agreement across settings is unknown. Therefore, we conducted video-based case studies to test agreement across sites, type of providers, and clinicians. Nine videos were developed to present a standardized set of information to clinicians in each of the five settings. Two analytic approaches were used for assessing the video reliability of the CARE items, adhering closely to the methods used by Fricke et al. (1993) to assess the reliability of the FIM® items using videos. First, for each
9
10
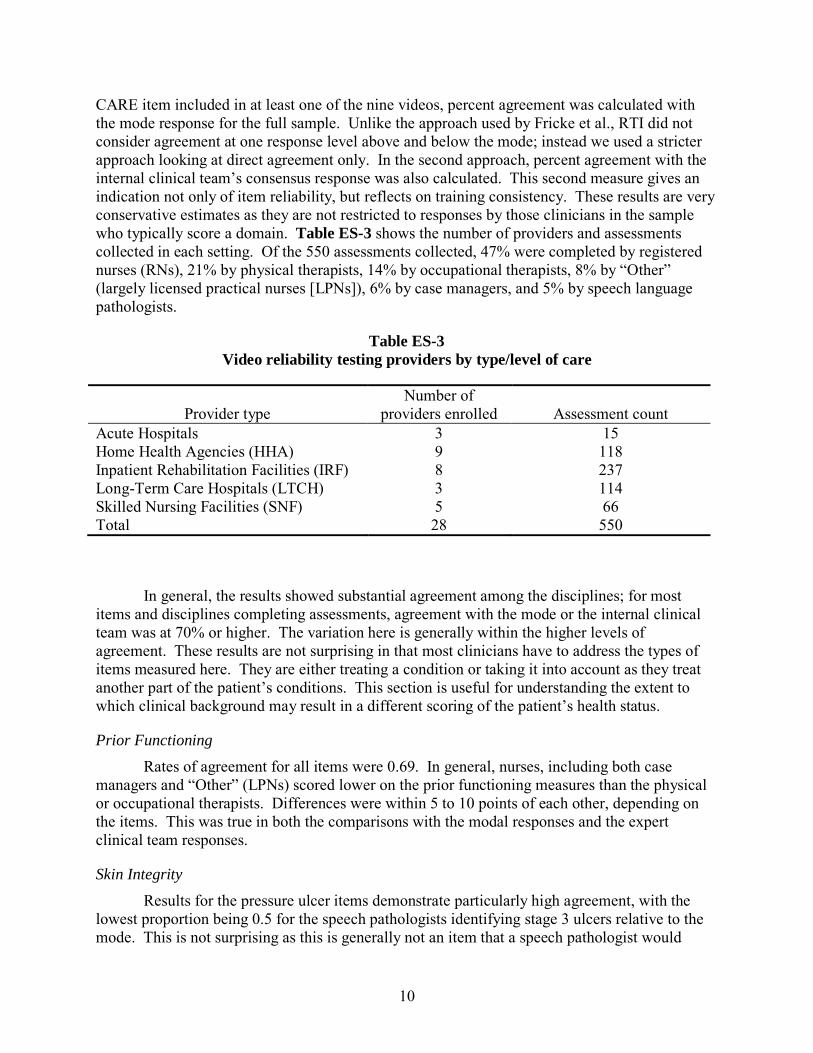
CARE item included in at least one of the nine videos, percent agreement was calculated with the mode response for the full sample. Unlike the approach used by Fricke et al., RTI did not consider agreement at one response level above and below the mode; instead we used a stricter approach looking at direct agreement only. In the second approach, percent agreement with the internal clinical team’s consensus response was also calculated. This second measure gives an indication not only of item reliability, but reflects on training consistency. These results are very conservative estimates as they are not restricted to responses by those clinicians in the sample who typically score a domain. Table ES-3 shows the number of providers and assessments collected in each setting. Of the 550 assessments collected, 47% were completed by registered nurses (RNs), 21% by physical therapists, 14% by occupational therapists, 8% by “Other” (largely licensed practical nurses [LPNs]), 6% by case managers, and 5% by speech language pathologists.
Table ES-3 Video reliability testing providers by type/level of care
Provider type Number of
providers enrolled Assessment count Acute Hospitals 3 15 Home Health Agencies (HHA) 9 118 Inpatient Rehabilitation Facilities (IRF) 8 237 Long-Term Care Hospitals (LTCH) 3 114 Skilled Nursing Facilities (SNF) 5 66 Total 28 550
In general, the results showed substantial agreement among the disciplines; for most items and disciplines completing assessments, agreement with the mode or the internal clinical team was at 70% or higher. The variation here is generally within the higher levels of agreement. These results are not surprising in that most clinicians have to address the types of items measured here. They are either treating a condition or taking it into account as they treat another part of the patient’s conditions. This section is useful for understanding the extent to which clinical background may result in a different scoring of the patient’s health status.
Prior Functioning Rates of agreement for all items were 0.69. In general, nurses, including both case
managers and “Other” (LPNs) scored lower on the prior functioning measures than the physical or occupational therapists. Differences were within 5 to 10 points of each other, depending on the items. This was true in both the comparisons with the modal responses and the expert clinical team responses.
Skin Integrity Results for the pressure ulcer items demonstrate particularly high agreement, with the
lowest proportion being 0.5 for the speech pathologists identifying stage 3 ulcers relative to the mode. This is not surprising as this is generally not an item that a speech pathologist would
11
ordinarily evaluate. Physical therapists had the highest agreement with the mode for identifying risk of pressure ulcer (0.94) or presence of a stage 2 or greater (0.98) followed by RNs with a modal agreement of 0.88 and 0.95, respectively.
Cognitive Status, Mood, and Pain Results for the cognitive status and mood items showed also very high levels of
agreement with the mode and clinical team, rarely falling below 90%. The minor exception to this trend was item IV.C, “Observation of cognitive status” (C1), which is used when the BIMS cannot be administered. For this item, levels of agreement showed a great deal of variability among disciplines, varying from 0% among speech therapists to 40% among PTs, 76% among RNs, and 100% for case managers. However, it is important to recall that because the standard method of assessing cognitive status on the CARE item set is the BIMS, the observation of cognitive status item was only used on one of the nine videos (Video 9). Among RNs, who were the largest group assessing this particular video (n = 37 or 51%), a substantial level of agreement was observed (76%).
Pain items also showed fairly high levels of agreement, although speech therapists had lower levels of agreement (0.70) for identifying pain while occupational therapists (0.92) and physical therapists (0.91) had the highest rates of agreement, followed by RNs (0.84).
Impairments The bowel and bladder items show substantial agreement with the sample mode and
clinical team response, with most items over 80% among all disciplines. In general, slightly lower levels of agreement were observed among clinicians who self-reported as “Other,” although agreement levels were still moderate to substantial even in this group of clinicians. The item for “Frequency of bladder incontinence” (A3a) had slightly lower levels of agreement compared to the other bladder and bowel items, with speech therapists having the lowest level of agreement (0.50); again these are items that not usually evaluated by this type of clinician.
“Swallowing signs and symptoms” also showed substantial agreement among raters (generally 80% or above), with the category of “Other” exhibiting slightly lower levels of agreement. Speech pathologists had the highest levels of agreement on the “Usual swallowing ability” item (0.92). Results were more mixed on the “Signs of swallowing disorder” item, which also had lower inter-rater reliability on several components.
Hearing, vision, and communication items all had fairly high rates of agreement across disciplines, with the “Other” category (LPNs, mostly) scoring the lowest levels of agreement followed by RNs for understanding content and ability to hear, but still the proportion agreeing were 0.81 and 0.88, respectively. Speech pathology tended to have the highest rates of agreement with the mode and internal clinical team on these items followed frequently by physical therapists or occupational therapists.
Respiratory status had variable rates of agreement depending on whether the patient used oxygen or not. “Presence of any respiratory impairment” had the highest rates of agreement for occupational therapists, RNs, and speech pathologists (0.93, 0.87, 0.94). Rating the level of exertion with oxygen when a patient becomes dyspneic, speech and occupational therapists had
12
the highest rates of agreement (0.73, 0.75) compared to the others with rates between 0.48 and 0.56. This item had eight potential responses, so it is not surprising that the rates of agreement are lower, given our strict counting of exact agreements only.
Endurance items, both sitting and mobility, had relatively high levels of agreement across the core screening item (88–100%), while the supplemental items showed more variation with speech pathologists having the lowest levels of agreement (0.75) and case managers and physical therapists having the highest rates of agreement.
Functional Status The core functional status items also showed high levels of agreement with the mode and
clinical team for all items, typically upwards of 70%. The notable exception to this trend exists among the clinicians self-reporting their discipline as “Other”; they consistently had the lowest levels of agreement among all core self care items, ranging from 0.50 to 0.72 percent agreement.
Supplemental self care items such as “Ability to wash, rinse, and dry the upper body” and “Bathe self in the shower or tub” and mobility items such as “Rolling from lying on the back to left and right side,” “Move from sitting on side of the bed to lying flat on the bed,” “Bend/stoop from a standing position to pick up a small object from the floor,” and “Ability to put on and take off socks and shoes or other footwear” suggest a fair amount of variability between disciplines. For the self care items, the occupational therapists, physical therapists, and RNs reported substantial levels of agreement with both the mode and clinical team that ranged from 65 to 94%. Case managers, speech therapists, and the “Other” category tended to show slightly lower levels of agreement on certain items (e.g., 50% for “Other” and 63% for speech therapists on “Shower/bathe,” and 50% for case managers on “Picking up an object.”
Similar trends were observed on supplemental function items C7a–h and the majority of the IADLs (items C8–C16). For items C7a–h, agreement with the mode and the clinical team response generally ranged from 70 to 100%, although case managers and the “Other” discipline category reported suboptimal agreement on some items.
For the IADL (items C8–C16), agreement with the mode was generally substantial (exceeding 75%), although there were several items with more moderate levels of agreement overall. These items were “Medical management—oral,” “Medication management—inhalant/mist,” “Wipe down surface,” and “Laundry” (C10, C11, C14, and C16). Among occupational therapists, physical therapists, and RNs, agreement for these items tended to fall in the more moderate range of 50 to 72%, with agreement among speech therapists, case managers, and the “Other” category often significantly lower.
These analyses are useful for examining the reliability of these items across settings, disciplines, and training experiences. These video-based assessments show that when presented with a standardized interview or observation, the clinicians were able to apply the item definitions consistently. While this approach differs from clinical practice where assessment and interview techniques may vary, it is consistent with the approach used in FIM®-credentialing examinations (Fricke et al., 1993). This is a difficult area to measure, but the results suggest that item reliability remains consistently high across disciplines with some variation as expected in specific items. These results are useful for considering cross-setting measurement constraints.
13
ES.7 Functional Status Internal Consistency and Item Level Analysis
Section 4 in this volume addresses measurement issues associated with functional status. Unlike medical conditions, such as pressure ulcers, functional status is difficult to directly observe in a consistent manner. As a result, functional status has been traditionally measured using a combination of several items to measure the concepts of self care or mobility. When multiple items are used, it is important they are tested to determine whether they are all working together to measure the same concept, that is, does each item contribute meaningfully to document the concept of self care or mobility.
The current PAC payment systems use a single motor function scale that primarily measures physical disabilities. For example the motor score in the FIM®-based IRF characterizes patient’s functioning on 13 physical activities, which was developed and verified by applying Rasch and classic analytic approaches (Stineman et al., 1996; Stineman et al., 1997). This parallel use of both classical psychometric analyses along with Rasch techniques is being used increasingly in scale construction and measurement today (Jette et al., 2008) and is reflected in our current work on the CARE item set.
Our approach is to maximize both discrimination and predictive power by dividing the single motor scale into two parts, mobility and self care, using the CARE instrument items. The two subscale approach is consistent with the current literature, which suggests that the use of two scales will improve differentiation among patients with different types of impairments. Mobility and self care scales have been used in prior work published by Haley and colleagues (Haley et al., 2002) and also has clinical plausibility. Although not currently included in the IRF classification, mobility and self care subscales have also been identified within the FIM® motor scale, which is a multi-layered scale. Specifically, these form finer dimensions which are nested within its broader motor score (Stineman et al., 1997). The decision to use one layer over another depends on the question being asked. If the intent is to approximate total disability in one large metric, then more aggregated scales are appropriate, but details about the disability are obscured. Different types of impairment have particular effects on body functions, resulting in distinct patterns of disability. Impairment specific dimensions reflect distinct functional areas of the body. Self care skills primarily depend on use of the arms and hands, while mobility depends mostly on general balance and use of the legs. Therefore, the functional ability for different conditions could be better captured by either the mobility or the self care subscale, which might not be adequately measured by the combined motor scale.
ES.7.1 Results
• The mobility and self care Rasch findings indicate that the operational definitions of the constructs maintain general stability from admission to discharge.
• Overall, the mobility and self care items are well targeted to the range of patient ability sampled within this acute-care population.
• Generally, the rating scale is working as intended for the self care and mobility items. However, there are exceptions in the mobility scale, “Walking 150 feet” (B5a1), “Walking 100 feet” (B5a2), and “Walking 50 feet” (B5a3). These items were recoded into a 5-point scale combining moderate and maximal assistance categories.
14
• The Rasch analysis of the self care scale shows that two items, “Medication mist” (C11) and “Medication oral” (C10), have similar levels of item difficulty and were found to be very highly correlated, and could potentially be merged into a single item.
• Overall the self care and mobility scales showed good reliability statistics, even after response scale recoding and selected item grouping. That is, the items still appear to “hang together” well in their individual theoretical constructs.
• Exploratory analyses indicate that a 3-factor solution works best for this data. The items fall into three constructs: self care, mobility, and IADL.
In summary, our results show that the items do work together to measure functional status. Second, these analyses tell us that the patient scores reported by clinicians tend to follow a predictable pattern. This tells us that clinicians are reporting scores in a consistent way, that is, patients with low functional abilities tend to have limitations in similar areas. For example, patients with moderate mobility limitations tend to have difficulties with sit to standing, toilet transfers, and stairs in a predictable way.
ES.8 Summary
The standardized CARE items are reliable items when used across settings and by different disciplines. The levels of agreement varied but most were above 0.70; a few appeared weaker across the board such as certain aspects of swallowing measurement, walking 150 feet, light shopping, and laundry. The key to obtaining reliable data in the field is to have strong standardized training programs consistent with current practice to collect accurate data especially on items that rely on clinician judgment. Levels of agreement varied minimally across disciplines, suggesting the definitions of the items were clear and could be used consistently with proper training. The Rasch analysis in Section 4 of this volume provided useful approaches for using the function items in a manner that together measure the concepts of self care, mobility, and instrumental activities of daily living.
SECTION 8 INTRODUCTION
The Centers for Medicare & Medicaid Services (CMS) has undertaken a major initiative to evaluate and realign the incentives for inpatient and post-acute services provided under the Medicare program. Currently, about a fourth of all beneficiaries are admitted to a general acute hospital each year; almost 35% of them are discharged to additional care in a long-term care hospital (LTCH), inpatient rehabilitation facility (IRF), skilled nursing facility (SNF), or home with additional services provided by a home health agency (HHA) (Gage et al., 2008). While these services constitute a continuum of care for the patient, the current measurement systems do not allow Medicare to examine the effects of these continuing services on the patient’s overall health and functional status.
The Medicare program currently mandates that IRFs, SNFs, and HHAs each submit assessment data on the beneficiary’s medical, functional, and cognitive status. This information is used in both the payment and quality monitoring efforts at CMS. Medical status is also measured to some extent in the MS-DRG based case-mix system used to pay and monitor admissions in the acute hospital settings, both the short-term and long-term care hospitals. Despite the inclusion of these factors in the existing systems, each system was developed independently and uses different items to measure each set of concepts. For example, only the PAC settings (IRF, SNF, and HHA) measure functional status and cognitive status independent of diagnosis codes. And each of the three PAC measurement systems (IRF-PAI, MDS, and OASIS, respectively) use different items to measure function and cognition. As a result, the Medicare program has not been able to measure changes in a patient’s health status as they progress across their episode of care. Further, this lack of standardized measurement makes it difficult to understand the extent to which patients differ clinically in their use of different PAC settings. Past research has suggested that, after controlling for differences in patient complexity, site of care decisions may be associated with the availability of different service options (Gage et al., 2008). These analyses are based on the standardized case-mix data available in claims. However, this limited information may mask actual differences in patients using each PAC provider and their outcomes associated with service use. Without standardized ways to measure the patients’ medical, functional, and cognitive status, CMS is unable to adequately examine whether the costs and utilization patterns reflect differences in patient case-mix complexity or other factors, not related to individual patient needs. Given the differences in program costs associated with each type of Medicare provider, and the potential impact on outcomes associated with different treatment approaches in the different types of providers, it is important to understand the extent to which differences in program costs and service utilization reflect patient needs, local practice patterns, or local supply options.
The Deficit Reduction Act of 2005 directed CMS to address this issue and develop methods for measuring Medicare beneficiaries’ health status in a consistent way that would allow CMS to examine whether Medicare’s various payment systems introduced inconsistent incentives for treating clinically-similar patients. This contract addresses this issue by testing the use of a standardized set of items for measuring medical, functional, cognitive, and social support factors in the acute hospital, LTCH, IRF, SNF, and HHA. These items are based on the science behind the currently mandated assessment items in the Medicare payment systems, including those in the mandated IRF-PAI, MDS, and OASIS instruments. Over the past few
15
years, RTI has been working with the Office of Clinical Standards and Quality, as well as the five different research and clinical communities associated with acute and PAC services, including case-mix measurement experts, accreditation bodies, such as JCAHO, CARF, provider associations, and others to identify a select set of items that would be appropriate for measuring beneficiary severity of illness, regardless of site of care.
Input was collected through various stakeholder meetings, including several Open Door Forums (ODFs) and Technical Expert Panels (TEPs). Two types of TEPs were conducted. The first set of clinical experts were invited to identify the types of items that were important for measuring case-mix differences that may explain patient complexity and the need for different types of services. The second set of discussions focused on measurement issues. They included experts from the acute hospital, LTCH, IRF, SNF, and HHA research communities. The results of these panels were submitted for publication in the Federal Register and underwent two sets of public comment periods. The results led to the development and pilot testing of the Continuity Assessment Record and Evaluation (CARE) tool. The items were revised following the pilot test and the resulting changes were implemented for use in the Post Acute Care Payment Reform Demonstration (PAC PRD).
Data have been collected in the PAC PRD for the past two years. Over 40,000 assessments have been collected in acute hospitals, LTCHs, IRFs, SNFs, and HHAs. An additional 455 assessments were collected as part of a test of item reliability.
Two types of reliability tests were conducted: a traditional inter-rater reliability test which examines how well the items measure the specific concepts when two clinicians are measuring the same patient at the same time; and second, an approach which allowed examination of how discipline and setting affected item scoring. This is important to understand as differences in setting-specific practices can have a systematic effect on patient scoring. For example, nursing staff in general acute hospitals may approach patient self care items differently than those in inpatient rehabilitation hospitals. CARE items were also compared with analogous items currently in the mandated assessment instruments to begin to understand coding differences between the two sets of items as they relate to interpretations between CARE and historical legacy items.
This report presents the results from the two reliability tests. The results are important for understanding how well the standardized items perform relative to those already used in the respective health communities to monitor the quality of care and adjust payment policies for differences in patient severity or case-mix characteristics.
The report is organized in three volumes:
• Volume 1 is a report on the development of the CARE item set. Section 1 provides an overview of the project, and Section 2 details the purpose and methods of the CARE item set development.
• Volume 1, Section 3, describes in detail the justification for including each of the CARE items in the assessment, including support from the literature.
16
17
• Volume 1, Section 4, presents the process of obtaining stakeholder input for the development of the CARE item set through Technical Expert Panel meetings.
• Volume 1, Section 5, gives an overview of the two pilot tests of the CARE item set that were conducted as part of the CARE item set development.
• Volume 1, Section 6, presents the process and CARE item set changes resulting from the Office of Management and Budget clearance review process.
• Volume 1, Section 7, describes potential opportunities and challenges for the CARE item set identified at the end of the initial item set development.
• Volume 2 is a report on the reliability testing of the CARE item set. Section 8 provides an overview of the issues and our approach for testing the reliability and validity of the standardized items developed to create consistent measurement approaches across inpatient and PAC services.
• Volume 2, Section 9, presents the methodology and results of the traditional inter-rater reliability tests on paired assessments in each of the five settings (acute, LTCH, IRF, SNF, HHA).
• Volume 2, Section 10, reports the results of the cross-disciplinary, cross-setting analysis of reliability using videos.
• Volume 2, Section 11, contains additional analyses of internal consistency, focusing specifically on development of the functional status subscales in the standardized items.
• Volume 3 is a comparison of the CARE item set and current assessment items. Section 12 introduces the analyses conducted to examine the comparability of the CARE item set to items on assessment tools (IRF-PAI, MDS 2.0, and OASIS-B) being used by Medicare certified providers at the time of data collection.
• Volume 3, Section 13, examines the comparability of the standardized CARE items to those currently in the IRF-PAI assessment tool. This section presents differences in the actual items and crosswalks the two sets of items conceptually to help the reader understand the differences and overlap in the standardized items relative to the current IRF-PAI items.
• Volume 3, Section 14, examines the concurrent validity of the CARE items relative to the MDS 2.0 items for each patient in the SNF sample. While the MDS 3.0 went into effect in 2010, the results are compared to the assessment data used at the time of data collection. Due to the close collaboration of the CARE development team with the MDS 3.0 development team, many of the CARE items are intentionally similar to those in the MDS 3.0.
• Volume 3, Section 15, reviews the CARE items relative to the OASIS-B items. Again, while OASIS-C has since gone into effect, OASIS-B was being used during the time of the reliability tests. Again, the CARE items were based on discussions with the OASIS-C developers to create consistency in item modifications.
18
• Although many of the CARE items are consistent with those being put forth in the MDS 3.0 and OASIS-C, the comparison analyses had to use data from the existing mandated assessments at the time of each test for each of the patients in the respective CARE samples. Hence, comparisons are made with MDS 2.0 and OASIS-B. In their entirety, these analyses will be used to further refine the current CARE item set, as outlined in Volume 3, Section 16, which considers conclusions and next steps.
19
SECTION 9 INTER-RATER RELIABILITY TESTING OF THE CARE ITEM SET
9.1 Overview
An assessment tool should be both valid and reliable. It is important that items measure the concepts they were designed to capture (validity), but also that they obtain consistent results when used by different raters (reliability).
The reliability testing for the CARE item set included two data collection efforts in addition to the PAC PRD data collection: 1) in-person inter-rater reliability testing (for measuring the level of agreement between clinicians within the same level of care) and 2) video reliability testing (for measuring the level of clinician agreement across levels of care).
This section will summarize the in-person inter-rater reliability (IRR) data collection effort and results from subsequent analyses. Additional assessment data were collected on a subset of the post-acute and acute care providers’ patients participating in the Post-Acute Care Payment Reform Demonstration (PAC PRD).
9.2 Background
RTI considered two approaches to examine the inter-rater reliability of CARE items: a gold standard methodology and a within-setting paired rater methodology. The use of “gold standard” data collectors is a common approach. Under this method, a small number of clinicians, usually nurses, are provided intensive training on the instrument and the inter-rater reliability of these raters is examined and retraining provided until they are quite consistent with each other. These “gold standard” raters are then sent to facilities where they observe and score patients and their ratings are compared to those of the facility nurses. The strength of this approach, comparison to a “gold standard” rater, is also its weakness. Because these “gold standard” raters undergo very expensive and extensive training to achieve their high level of rating consistency and accuracy, data collected by clinicians in the field, who generally have not had this level of training, will fall short of this level of accuracy. Yet it is these data from the field that will be the basis of both the demonstration sample that will develop the payment models, and the data that will subsequently be submitted to CMS for reimbursement. These data reflect the “practicably achievable” level of reliability, rather than an idealized standard.
RTI therefore used a traditional inter-rater reliability method that compares pairs of raters within each site. Under this method, two raters observe the same patient, or review the same chart, then independently assign ratings. The strength of this approach is that the ratings reflect standards and performance of clinicians in the field. The challenge of this approach is that it is costly in terms of staff time since two clinicians must be available to observe each patient for a given time period.
9.3 Methods
RTI convened a reliability working group including clinical experts in the development of existing CMS assessments and the CARE item set (D. Saliba, A. Jette, M. Stineman, C.
20
Murtaugh, A. Deutsch, and T. Mallinson) to help develop methods for both IRR and video testing.
Second, RTI conducted an extensive literature review to identify reliability standards achieved for similar items in the IRF-PAI, MDS 2.0, MDS 3.0, OASIS-B and OASIS-C (see Appendix A). The goal for the CARE item set results was to meet or exceed these benchmarks or past reliability levels.
9.4 Sample Selection, Data Collection, and Instrument
RTI estimated the required sample size for this work and determined that approximately 6–8 unique providers should be recruited from each of the five levels of care (Acute Hospitals, Home Health Agencies, Inpatient Rehabilitation Facilities, Long-Term Care Hospitals, and Skilled Nursing Facilities). Each provider involved in reliability testing completed a duplicate CARE item set on 15–20 PAC PRD patients (10–15 patients in the home health setting), in accordance with the guidelines and protocols developed by RTI.
9.5 Recruitment
The PAC PRD team recommended a subset of the nearly 150 providers within the PAC PRD 12 market areas to target for reliability testing, focusing particularly on providers that were mid-way through their CARE data collection. RTI began actively recruiting these participating providers for CARE item set reliability testing in February 2009. Nine of the 12 market areas were included in the reliability study allowing for efficiencies and ensuring that the included providers were geographically diverse. RTI recruited 27 providers from the set of providers already enrolled in the PAC PRD data collection. See Table 9-1 for counts of providers and the number of assessment pairs submitted by each provider type. The number of participants of each type reflected participation levels in the PAC PRD data collection and were consistent with reliability sample sizes in the benchmark studies (Appendix A). Providers with low Medicare admissions or that had only one clinician conducting CARE assessments (and therefore would not be able to conduct a paired assessment with another clinician) were not recruited.
Table 9-1 IRR testing providers by type/level of care
Provider type Number of
providers enrolled Paired assessment
numbers
Acute Hospitals 4 66 Home Health Agencies (HHA) 8 102 Inpatient Rehabilitation Facilities (IRF) 7 118 Long-Term Care Hospitals (LTCH) 2 49 Skilled Nursing Facilities (SNF) 6 121 Total 27 456
21
All Acute, LTCH, IRF, and SNF facilities were asked to complete 15–20 duplicate assessments and HHAs were asked to complete 10–15 duplicate assessments. Facilities were asked to enroll a set number of FFS Medicare patients each month, representing a range of function and acuity. Providers were instructed to have pairs of raters complete both patient assessments at the same time upon admission or at a minimum, within the 48 hour reference data window. Only staff previously collecting CARE information in the demonstration participated in inter-rater reliability testing. Each demonstration site identified 2–3 clinicians in each setting each clinician was primary observer on 5 cases and secondary observer on another 5 cases. Patients were assessed by staff pairs matched by discipline (two nurses, two physical therapists, etc.). To account for different lengths of time elapsed since the initial PAC Demonstration CARE training in each market, each clinician participating in IRR testing attended a 1.5 hour CARE refresher training prior to beginning the IRR data collection. Following CARE refresher training, RTI also reviewed the IRR data collection protocol with the demonstration project coordinators.
Responses to items in the CARE item set were obtained by one or more of the following predetermined, matched methods: direct observation of the patient (includes hands-on assistance), patient interviews (with each team member taking turns conducting and observing patient interviews), interviews with relatives/care giver of the patient for certain items, and interviews with staff caring for the patient and/or chart review. Rater pairs were instructed to determine in advance which methods would be used to score the particular CARE items and to have both raters use the same methods. Raters were encouraged to divide hands-on assistance to the patient as evenly as possible for CARE items that required hands-on assistance, such as the functional status item “Sit to Stand.” For patient interview items, such as those in the temporal orientation/mental status, mood, and pain sections, raters were instructed that one rater could conduct the entire interview, or the raters could alternate questioning. Raters were instructed not to discuss CARE item scoring during the CARE assessment, nor to share item scores until the data were entered into the CMS database and finalized. Providers submitted CARE data via the online CARE application for both assessments in each pair and submitted a list of assessment IDs associated with both the PAC Demo assessment and the duplicate Reliability assessment on paper.
RTI initially conducted a small pilot in the Boston market area to test and refine the protocol, refresher training, and checklists.
9.6 Item Selection for Testing
CARE items selected for IRR testing fell into one (or more) of the following categories: items that are subjective in nature, items that have not previously appeared in CMS tools (i.e., new CARE items), items that influence payments or are used in payment models currently, or items not previously tested in certain settings.
For the duplicate assessment, raters from Home Health Agencies, Skilled Nursing Facilities, Inpatient Rehabilitation Facilities, and Long-Term Care Hospitals completed a CARE Tool Admission Form on each patient enrolled in reliability testing. Raters from Acute Hospitals used an Acute Care Discharge Form.
22
9.7 Analyses
RTI used two analytic approaches for assessing the inter-rater reliability of the CARE items, following closely the methods used in prior CMS assessment IRR analyses. For continuous items, RTI calculated Pearson correlation coefficients to show the extent of agreement between two raters on the same item. For categorical items RTI calculated kappa statistics which indicate the level of agreement between raters using ordinal data, taking into account the role of chance agreement. The range commonly used to judge reliability based on kappa is as follows: 0 poor, 0.01–0.20 slight, 0.21–0.40 fair, 0.41–0.60 moderate, 0.61–0.80 substantial, and 0.81–1 almost perfect.
For categorical items with only two responses available, RTI calculated unweighted kappas. For items with more than two responses RTI calculated both weighted and unweighted kappas. Unweighted kappa assumes the same “distance” between every one unit difference in response across an ordinal scale (e.g., for the CARE functional item scale range 1–6 an unweighted kappa assumes the difference in functional ability between a score of 1=dependent and 2=substantial/maximal assist is the same as the difference in functional ability between 5=setup or clean-up assistance and 6=independent). RTI used Fleiss-Cohen weights, or quadratic weights, which approximate the intra-class correlation coefficient and are commonly used for calculating weighted kappa. This choice of weighting is consistent with prior analyses of assessment reliability where the method for developing weights was specified (see Hirdes et al., 2002, and Streiner and Norman, 1995). Note that Fleiss-Cohen weights put lower emphasis on disagreements between responses that fall “near” to each other on an item scale. It should also be noted that the value of kappa can be influenced by the prevalence of the outcome or characteristic being measured. If the outcome or characteristic is rare, the kappa will be low because kappa attributes the majority of agreement among raters to chance. Kappa is also influenced by bias, and if the effective sample size is small, variation may also play a role in the results. Hence, we report both weighted and unweighted kappas to give the range of agreement found under the two sets of assumptions.
Additionally, RTI calculated a separate set of kappa statistics (unweighted and weighted where applicable) for items where additional responses outside of an ordinal scale were available (letter codes) and were set to missing. For example, for Section 6, Functional Status items, of the CARE item set, providers could choose between five and six different letter codes designating that an item was “not attempted.” Because training did not emphasize distinctions between these letter code responses and these responses were not necessarily ordered, we are reporting a set of kappas for these items where the “not attempted” responses are recoded to missing.
9.8 Results
I. Sample Demographics
Table 9-2 shows basic characteristics of the IRR sample population. Not surprisingly the population is predominantly female and white. Table 9-3 shows information on prior service use and residence for patients in the IRR sample. Over half of the sample (65.5%) was admitted from a stay in a short stay acute hospital immediately preceding their CARE admission. An additional 14.7% were admitted directly from the community. Providers were also asked to
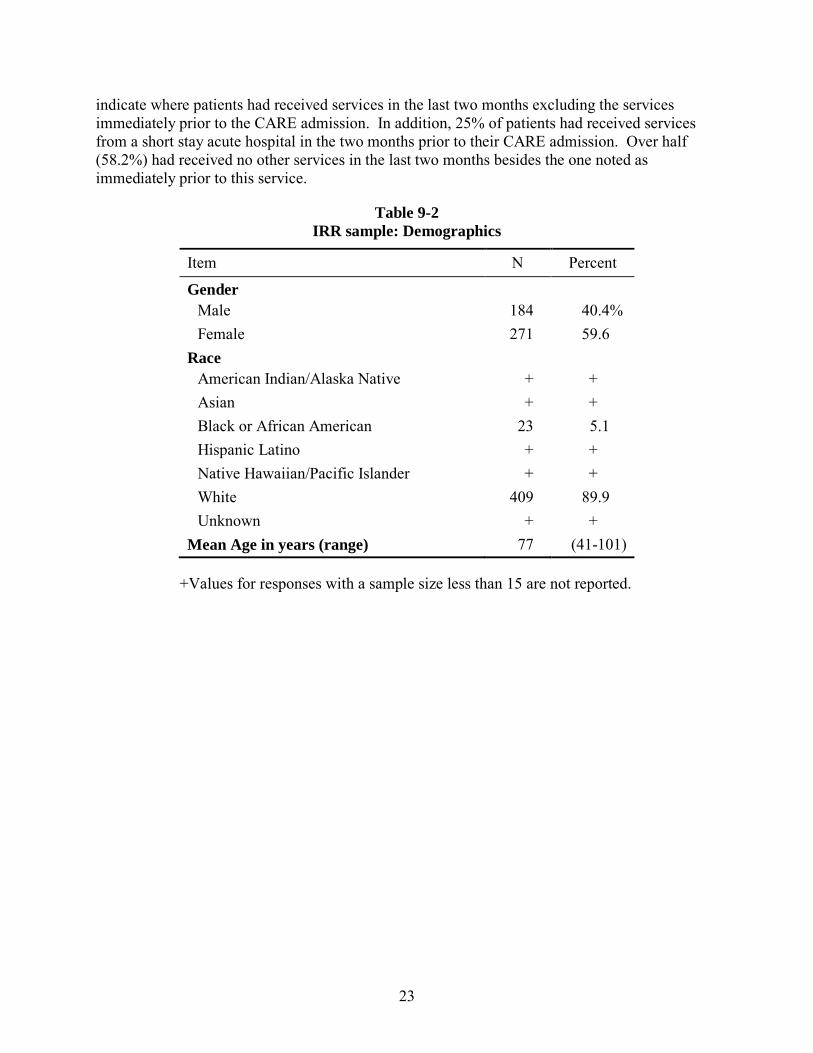
23
indicate where patients had received services in the last two months excluding the services immediately prior to the CARE admission. In addition, 25% of patients had received services from a short stay acute hospital in the two months prior to their CARE admission. Over half (58.2%) had received no other services in the last two months besides the one noted as immediately prior to this service.
Table 9-2 IRR sample: Demographics
Item N Percent
Gender Male 184 40.4% Female 271 59.6
Race American Indian/Alaska Native + + Asian + + Black or African American 23 5.1 Hispanic Latino + + Native Hawaiian/Pacific Islander + + White 409 89.9 Unknown + +
Mean Age in years (range) 77 (41-101)
+Values for responses with a sample size less than 15 are not reported.
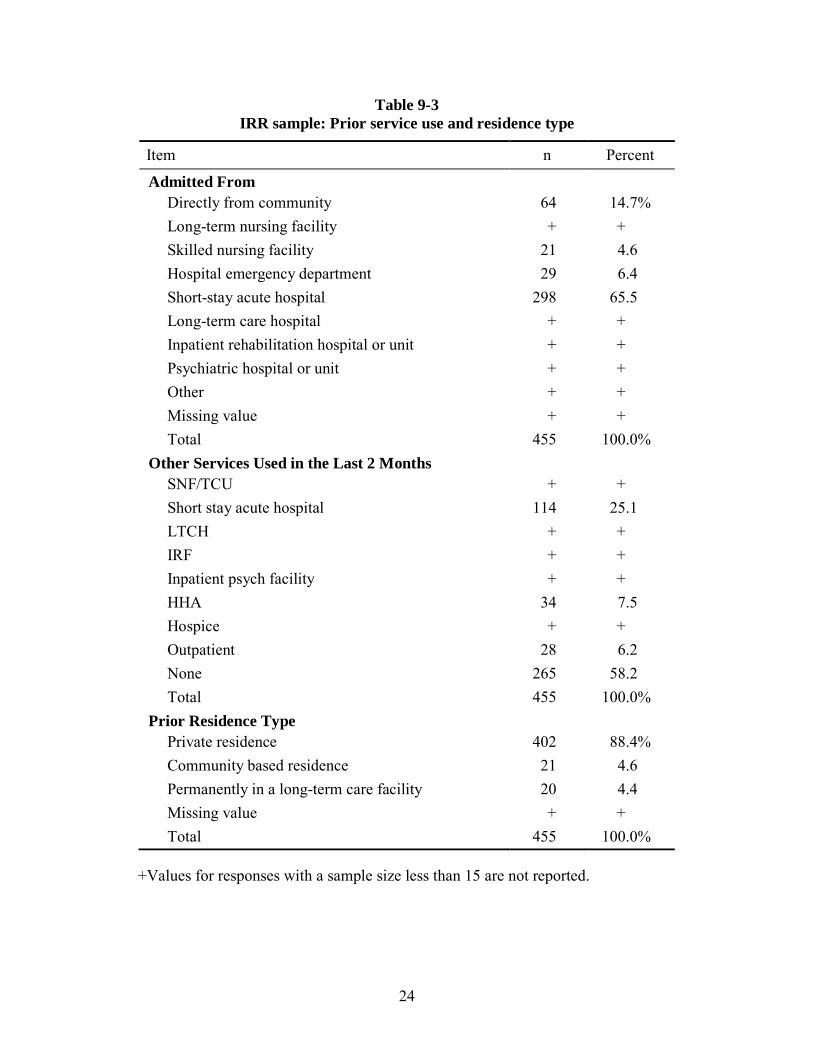
24
Table 9-3 IRR sample: Prior service use and residence type
Item n Percent
Admitted From Directly from community 64 14.7% Long-term nursing facility + + Skilled nursing facility 21 4.6 Hospital emergency department 29 6.4 Short-stay acute hospital 298 65.5 Long-term care hospital + + Inpatient rehabilitation hospital or unit + + Psychiatric hospital or unit + + Other + + Missing value + + Total 455 100.0%
Other Services Used in the Last 2 Months SNF/TCU + + Short stay acute hospital 114 25.1 LTCH + + IRF + + Inpatient psych facility + + HHA 34 7.5 Hospice + + Outpatient 28 6.2 None 265 58.2 Total 455 100.0%
Prior Residence Type Private residence 402 88.4% Community based residence 21 4.6 Permanently in a long-term care facility 20 4.4 Missing value + + Total 455 100.0%
+Values for responses with a sample size less than 15 are not reported.
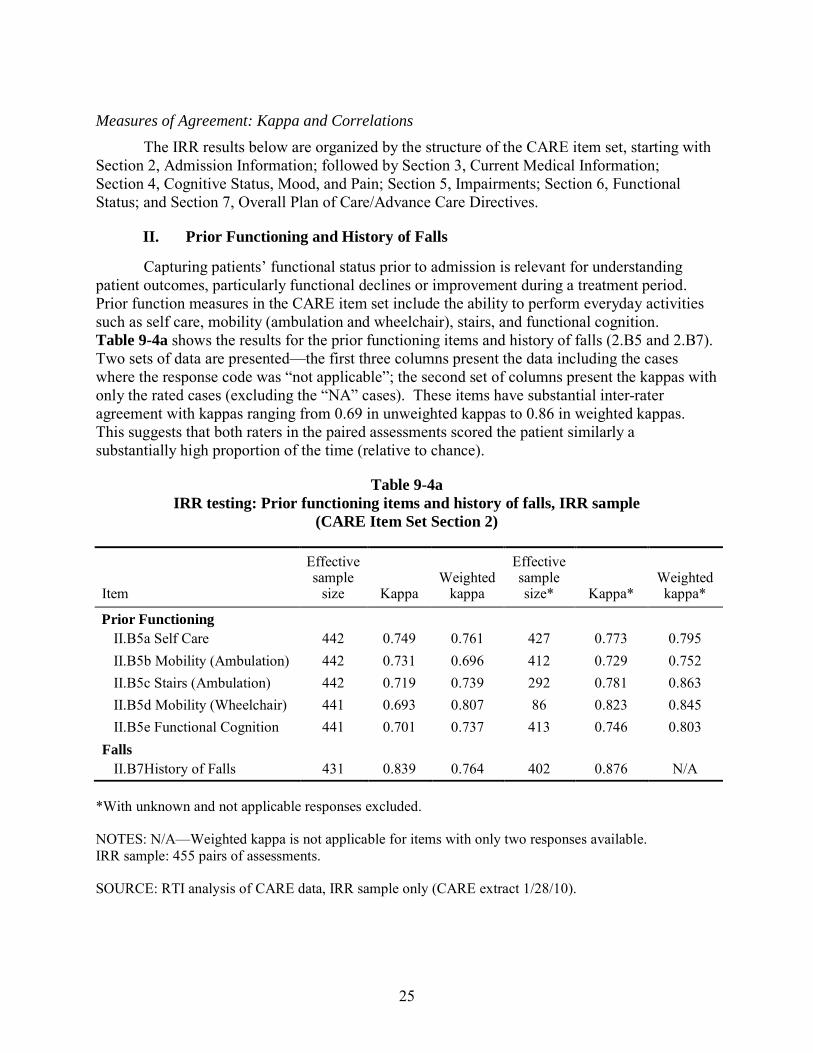
25
Measures of Agreement: Kappa and Correlations The IRR results below are organized by the structure of the CARE item set, starting with
Section 2, Admission Information; followed by Section 3, Current Medical Information; Section 4, Cognitive Status, Mood, and Pain; Section 5, Impairments; Section 6, Functional Status; and Section 7, Overall Plan of Care/Advance Care Directives.
II. Prior Functioning and History of Falls
Capturing patients’ functional status prior to admission is relevant for understanding patient outcomes, particularly functional declines or improvement during a treatment period. Prior function measures in the CARE item set include the ability to perform everyday activities such as self care, mobility (ambulation and wheelchair), stairs, and functional cognition. Table 9-4a shows the results for the prior functioning items and history of falls (2.B5 and 2.B7). Two sets of data are presented—the first three columns present the data including the cases where the response code was “not applicable”; the second set of columns present the kappas with only the rated cases (excluding the “NA” cases). These items have substantial inter-rater agreement with kappas ranging from 0.69 in unweighted kappas to 0.86 in weighted kappas. This suggests that both raters in the paired assessments scored the patient similarly a substantially high proportion of the time (relative to chance).
Table 9-4a IRR testing: Prior functioning items and history of falls, IRR sample
(CARE Item Set Section 2)
Item
Effective sample
size Kappa Weighted
kappa
Effective sample size* Kappa*
Weighted kappa*
Prior Functioning II.B5a Self Care 442 0.749 0.761 427 0.773 0.795 II.B5b Mobility (Ambulation) 442 0.731 0.696 412 0.729 0.752 II.B5c Stairs (Ambulation) 442 0.719 0.739 292 0.781 0.863 II.B5d Mobility (Wheelchair) 441 0.693 0.807 86 0.823 0.845 II.B5e Functional Cognition 441 0.701 0.737 413 0.746 0.803
Falls II.B7History of Falls 431 0.839 0.764 402 0.876 N/A
*With unknown and not applicable responses excluded.
NOTES: N/A—Weighted kappa is not applicable for items with only two responses available. IRR sample: 455 pairs of assessments.
SOURCE: RTI analysis of CARE data, IRR sample only (CARE extract 1/28/10).
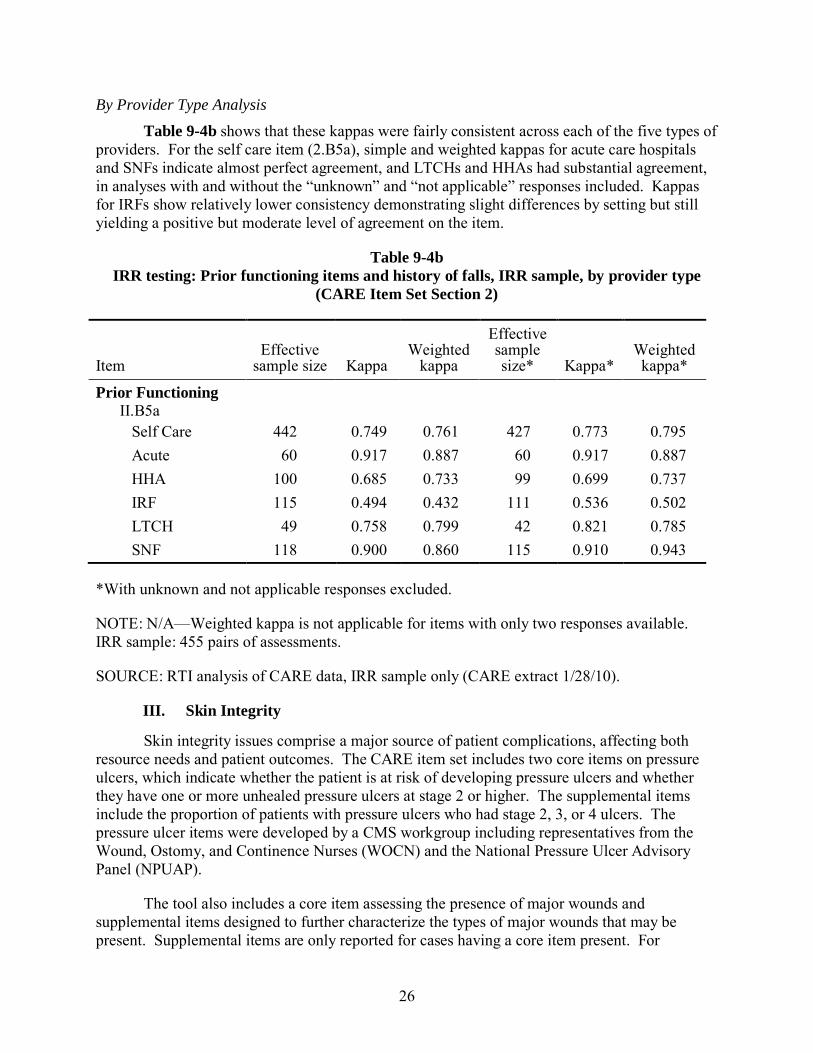
26
By Provider Type Analysis Table 9-4b shows that these kappas were fairly consistent across each of the five types of
providers. For the self care item (2.B5a), simple and weighted kappas for acute care hospitals and SNFs indicate almost perfect agreement, and LTCHs and HHAs had substantial agreement, in analyses with and without the “unknown” and “not applicable” responses included. Kappas for IRFs show relatively lower consistency demonstrating slight differences by setting but still yielding a positive but moderate level of agreement on the item.
Table 9-4b IRR testing: Prior functioning items and history of falls, IRR sample, by provider type
(CARE Item Set Section 2)
Item Effective
sample size Kappa Weighted
kappa
Effective sample size* Kappa*
Weighted kappa*
Prior Functioning II.B5a
Self Care 442 0.749 0.761 427 0.773 0.795 Acute 60 0.917 0.887 60 0.917 0.887 HHA 100 0.685 0.733 99 0.699 0.737 IRF 115 0.494 0.432 111 0.536 0.502 LTCH 49 0.758 0.799 42 0.821 0.785 SNF 118 0.900 0.860 115 0.910 0.943
*With unknown and not applicable responses excluded.
NOTE: N/A—Weighted kappa is not applicable for items with only two responses available. IRR sample: 455 pairs of assessments.
SOURCE: RTI analysis of CARE data, IRR sample only (CARE extract 1/28/10).
III. Skin Integrity
Skin integrity issues comprise a major source of patient complications, affecting both resource needs and patient outcomes. The CARE item set includes two core items on pressure ulcers, which indicate whether the patient is at risk of developing pressure ulcers and whether they have one or more unhealed pressure ulcers at stage 2 or higher. The supplemental items include the proportion of patients with pressure ulcers who had stage 2, 3, or 4 ulcers. The pressure ulcer items were developed by a CMS workgroup including representatives from the Wound, Ostomy, and Continence Nurses (WOCN) and the National Pressure Ulcer Advisory Panel (NPUAP).
The tool also includes a core item assessing the presence of major wounds and supplemental items designed to further characterize the types of major wounds that may be present. Supplemental items are only reported for cases having a core item present. For
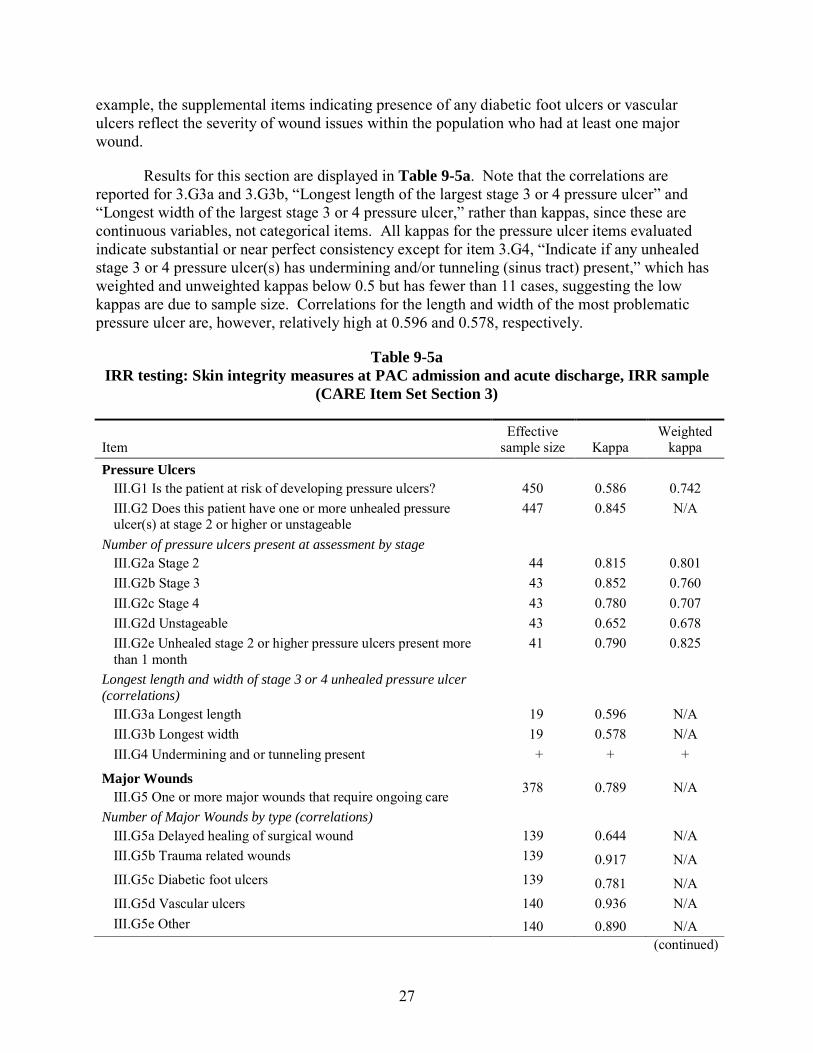
27
example, the supplemental items indicating presence of any diabetic foot ulcers or vascular ulcers reflect the severity of wound issues within the population who had at least one major wound.
Results for this section are displayed in Table 9-5a. Note that the correlations are reported for 3.G3a and 3.G3b, “Longest length of the largest stage 3 or 4 pressure ulcer” and “Longest width of the largest stage 3 or 4 pressure ulcer,” rather than kappas, since these are continuous variables, not categorical items. All kappas for the pressure ulcer items evaluated indicate substantial or near perfect consistency except for item 3.G4, “Indicate if any unhealed stage 3 or 4 pressure ulcer(s) has undermining and/or tunneling (sinus tract) present,” which has weighted and unweighted kappas below 0.5 but has fewer than 11 cases, suggesting the low kappas are due to sample size. Correlations for the length and width of the most problematic pressure ulcer are, however, relatively high at 0.596 and 0.578, respectively.
Table 9-5a IRR testing: Skin integrity measures at PAC admission and acute discharge, IRR sample
(CARE Item Set Section 3)
Item Effective
sample size Kappa Weighted
kappa Pressure Ulcers
III.G1 Is the patient at risk of developing pressure ulcers? 450 0.586 0.742 III.G2 Does this patient have one or more unhealed pressure ulcer(s) at stage 2 or higher or unstageable
447 0.845 N/A
Number of pressure ulcers present at assessment by stage III.G2a Stage 2 44 0.815 0.801 III.G2b Stage 3 43 0.852 0.760 III.G2c Stage 4 43 0.780 0.707 III.G2d Unstageable 43 0.652 0.678 III.G2e Unhealed stage 2 or higher pressure ulcers present more than 1 month
41 0.790 0.825
Longest length and width of stage 3 or 4 unhealed pressure ulcer (correlations)
III.G3a Longest length 19 0.596 N/A III.G3b Longest width 19 0.578 N/A III.G4 Undermining and or tunneling present + + +
Major Wounds III.G5 One or more major wounds that require ongoing care
378 0.789 N/A
Number of Major Wounds by type (correlations) III.G5a Delayed healing of surgical wound 139 0.644 N/A III.G5b Trauma related wounds 139 0.917 N/A III.G5c Diabetic foot ulcers 139 0.781 N/A III.G5d Vascular ulcers 140 0.936 N/A III.G5e Other 140 0.890 N/A
(continued)
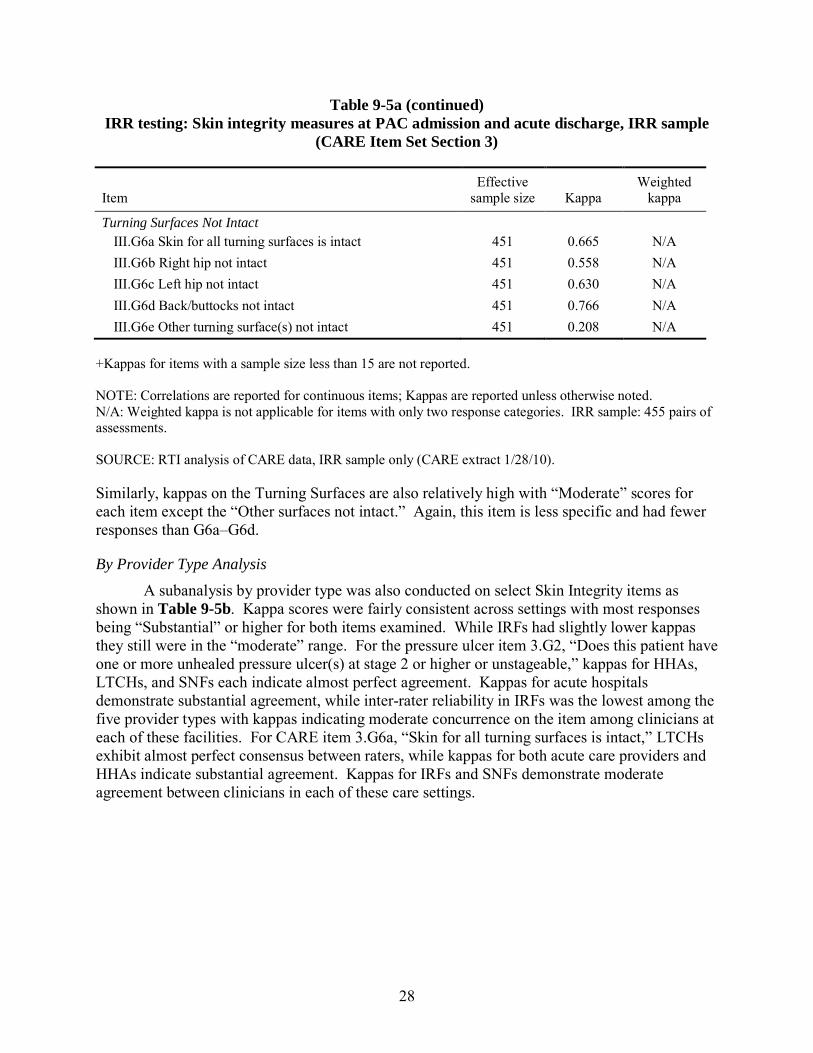
28
Table 9-5a (continued) IRR testing: Skin integrity measures at PAC admission and acute discharge, IRR sample
(CARE Item Set Section 3)
Item Effective
sample size Kappa Weighted
kappa
Turning Surfaces Not Intact III.G6a Skin for all turning surfaces is intact 451 0.665 N/A III.G6b Right hip not intact 451 0.558 N/A III.G6c Left hip not intact 451 0.630 N/A III.G6d Back/buttocks not intact 451 0.766 N/A III.G6e Other turning surface(s) not intact 451 0.208 N/A
+Kappas for items with a sample size less than 15 are not reported.
NOTE: Correlations are reported for continuous items; Kappas are reported unless otherwise noted. N/A: Weighted kappa is not applicable for items with only two response categories. IRR sample: 455 pairs of assessments.
SOURCE: RTI analysis of CARE data, IRR sample only (CARE extract 1/28/10).
Similarly, kappas on the Turning Surfaces are also relatively high with “Moderate” scores for each item except the “Other surfaces not intact.” Again, this item is less specific and had fewer responses than G6a–G6d.
By Provider Type Analysis A subanalysis by provider type was also conducted on select Skin Integrity items as
shown in Table 9-5b. Kappa scores were fairly consistent across settings with most responses being “Substantial” or higher for both items examined. While IRFs had slightly lower kappas they still were in the “moderate” range. For the pressure ulcer item 3.G2, “Does this patient have one or more unhealed pressure ulcer(s) at stage 2 or higher or unstageable,” kappas for HHAs, LTCHs, and SNFs each indicate almost perfect agreement. Kappas for acute hospitals demonstrate substantial agreement, while inter-rater reliability in IRFs was the lowest among the five provider types with kappas indicating moderate concurrence on the item among clinicians at each of these facilities. For CARE item 3.G6a, “Skin for all turning surfaces is intact,” LTCHs exhibit almost perfect consensus between raters, while kappas for both acute care providers and HHAs indicate substantial agreement. Kappas for IRFs and SNFs demonstrate moderate agreement between clinicians in each of these care settings.
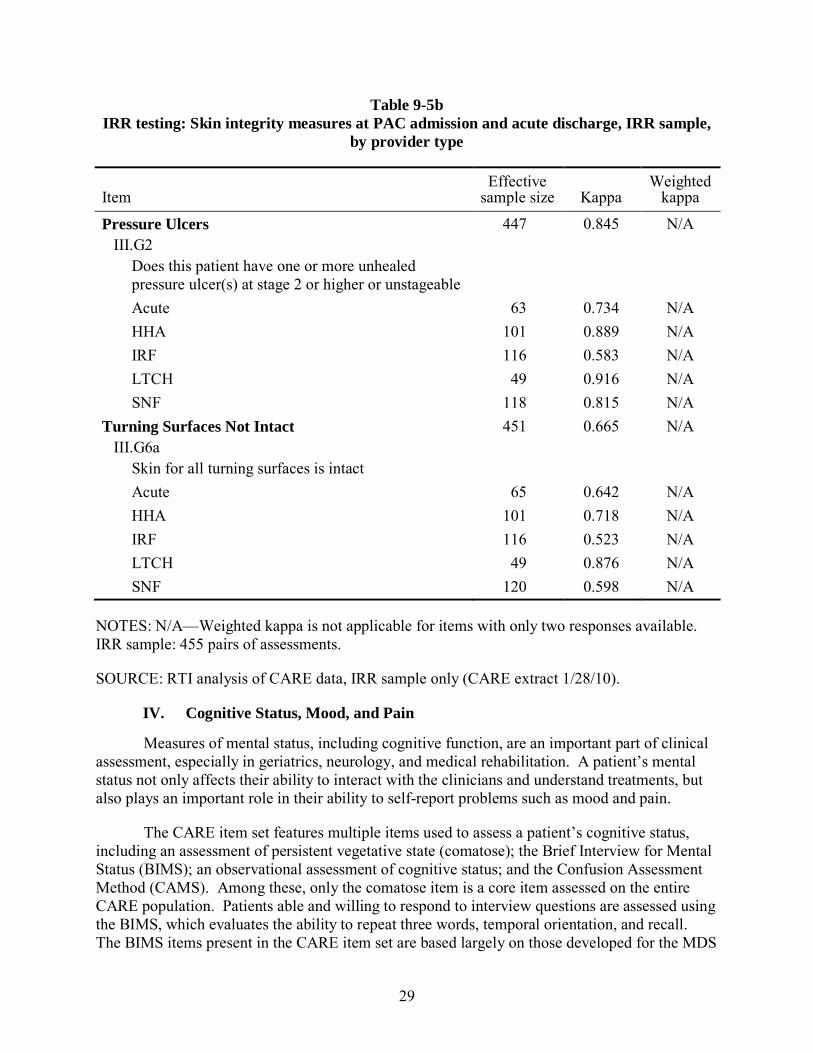
29
Table 9-5b IRR testing: Skin integrity measures at PAC admission and acute discharge, IRR sample,
by provider type
Item Effective
sample size Kappa Weighted
kappa
Pressure Ulcers III.G2
Does this patient have one or more unhealed pressure ulcer(s) at stage 2 or higher or unstageable
447 0.845 N/A
Acute 63 0.734 N/A HHA 101 0.889 N/A IRF 116 0.583 N/A LTCH 49 0.916 N/A SNF 118 0.815 N/A
Turning Surfaces Not Intact III.G6a
Skin for all turning surfaces is intact
451 0.665 N/A
Acute 65 0.642 N/A HHA 101 0.718 N/A IRF 116 0.523 N/A LTCH 49 0.876 N/A SNF 120 0.598 N/A
NOTES: N/A—Weighted kappa is not applicable for items with only two responses available. IRR sample: 455 pairs of assessments.
SOURCE: RTI analysis of CARE data, IRR sample only (CARE extract 1/28/10).
IV. Cognitive Status, Mood, and Pain
Measures of mental status, including cognitive function, are an important part of clinical assessment, especially in geriatrics, neurology, and medical rehabilitation. A patient’s mental status not only affects their ability to interact with the clinicians and understand treatments, but also plays an important role in their ability to self-report problems such as mood and pain.
The CARE item set features multiple items used to assess a patient’s cognitive status, including an assessment of persistent vegetative state (comatose); the Brief Interview for Mental Status (BIMS); an observational assessment of cognitive status; and the Confusion Assessment Method (CAMS). Among these, only the comatose item is a core item assessed on the entire CARE population. Patients able and willing to respond to interview questions are assessed using the BIMS, which evaluates the ability to repeat three words, temporal orientation, and recall. The BIMS items present in the CARE item set are based largely on those developed for the MDS
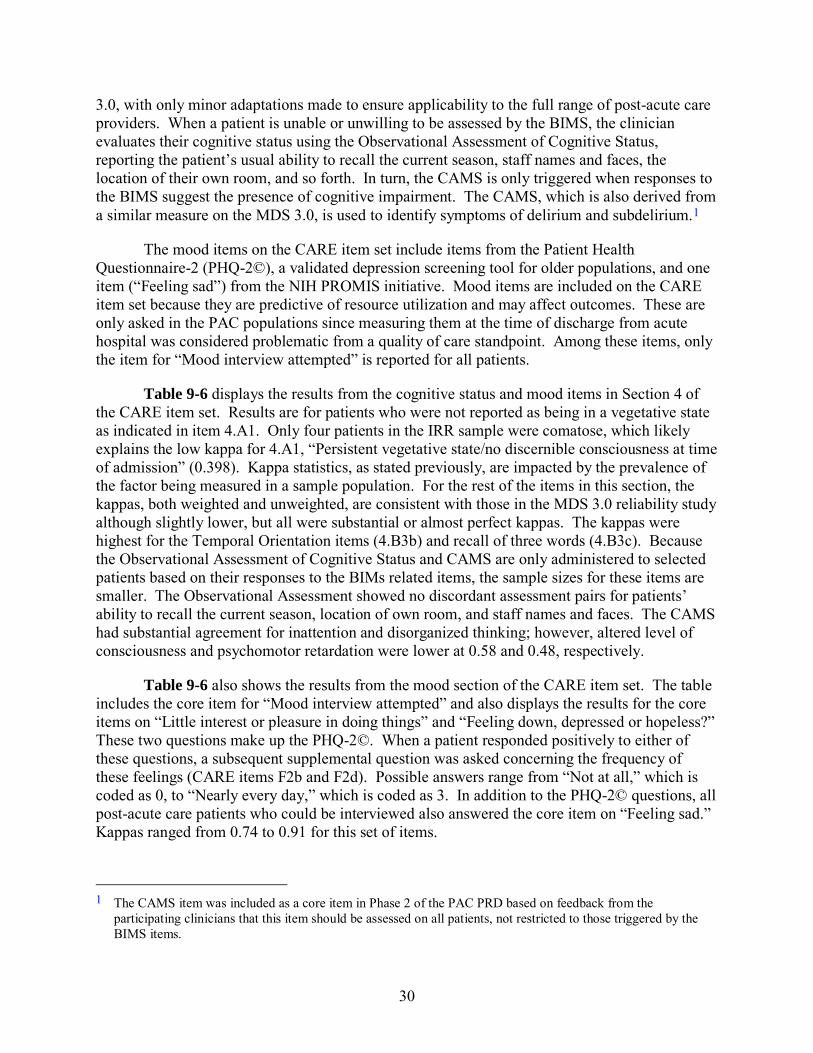
30
3.0, with only minor adaptations made to ensure applicability to the full range of post-acute care providers. When a patient is unable or unwilling to be assessed by the BIMS, the clinician evaluates their cognitive status using the Observational Assessment of Cognitive Status, reporting the patient’s usual ability to recall the current season, staff names and faces, the location of their own room, and so forth. In turn, the CAMS is only triggered when responses to the BIMS suggest the presence of cognitive impairment. The CAMS, which is also derived from a similar measure on the MDS 3.0, is used to identify symptoms of delirium and subdelirium.1
The mood items on the CARE item set include items from the Patient Health Questionnaire-2 (PHQ-2©), a validated depression screening tool for older populations, and one item (“Feeling sad”) from the NIH PROMIS initiative. Mood items are included on the CARE item set because they are predictive of resource utilization and may affect outcomes. These are only asked in the PAC populations since measuring them at the time of discharge from acute hospital was considered problematic from a quality of care standpoint. Among these items, only the item for “Mood interview attempted” is reported for all patients.
Table 9-6 displays the results from the cognitive status and mood items in Section 4 of the CARE item set. Results are for patients who were not reported as being in a vegetative state as indicated in item 4.A1. Only four patients in the IRR sample were comatose, which likely explains the low kappa for 4.A1, “Persistent vegetative state/no discernible consciousness at time of admission” (0.398). Kappa statistics, as stated previously, are impacted by the prevalence of the factor being measured in a sample population. For the rest of the items in this section, the kappas, both weighted and unweighted, are consistent with those in the MDS 3.0 reliability study although slightly lower, but all were substantial or almost perfect kappas. The kappas were highest for the Temporal Orientation items (4.B3b) and recall of three words (4.B3c). Because the Observational Assessment of Cognitive Status and CAMS are only administered to selected patients based on their responses to the BIMs related items, the sample sizes for these items are smaller. The Observational Assessment showed no discordant assessment pairs for patients’ ability to recall the current season, location of own room, and staff names and faces. The CAMS had substantial agreement for inattention and disorganized thinking; however, altered level of consciousness and psychomotor retardation were lower at 0.58 and 0.48, respectively.
Table 9-6 also shows the results from the mood section of the CARE item set. The table includes the core item for “Mood interview attempted” and also displays the results for the core items on “Little interest or pleasure in doing things” and “Feeling down, depressed or hopeless?” These two questions make up the PHQ-2©. When a patient responded positively to either of these questions, a subsequent supplemental question was asked concerning the frequency of these feelings (CARE items F2b and F2d). Possible answers range from “Not at all,” which is coded as 0, to “Nearly every day,” which is coded as 3. In addition to the PHQ-2© questions, all post-acute care patients who could be interviewed also answered the core item on “Feeling sad.” Kappas ranged from 0.74 to 0.91 for this set of items.
1 The CAMS item was included as a core item in Phase 2 of the PAC PRD based on feedback from the
participating clinicians that this item should be assessed on all patients, not restricted to those triggered by the BIMS items.
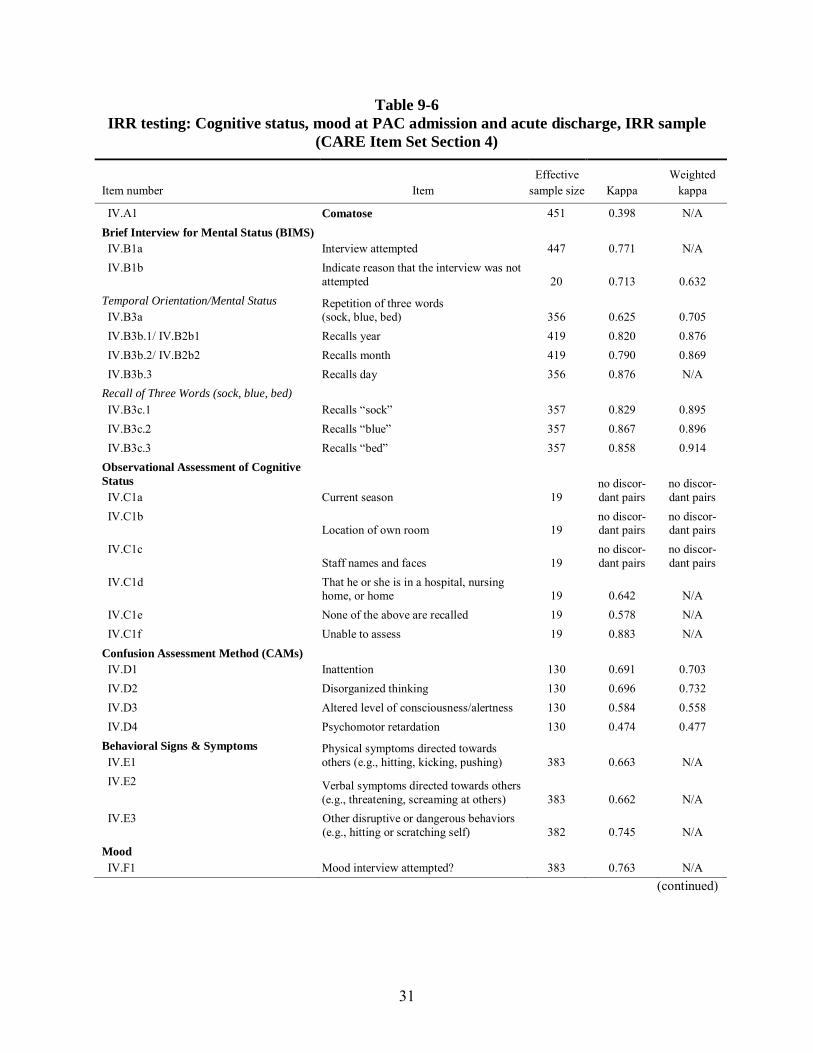
31
Table 9-6 IRR testing: Cognitive status, mood at PAC admission and acute discharge, IRR sample
(CARE Item Set Section 4)
Item number Item Effective
sample size Kappa Weighted
kappa
IV.A1 Comatose 451 0.398 N/A Brief Interview for Mental Status (BIMS) IV.B1a Interview attempted 447 0.771 N/A IV.B1b Indicate reason that the interview was not
attempted 20 0.713 0.632 Temporal Orientation/Mental Status IV.B3a
Repetition of three words (sock, blue, bed) 356 0.625 0.705
IV.B3b.1/ IV.B2b1 Recalls year 419 0.820 0.876 IV.B3b.2/ IV.B2b2 Recalls month 419 0.790 0.869 IV.B3b.3 Recalls day 356 0.876 N/A
Recall of Three Words (sock, blue, bed) IV.B3c.1 Recalls “sock” 357 0.829 0.895 IV.B3c.2 Recalls “blue” 357 0.867 0.896 IV.B3c.3 Recalls “bed” 357 0.858 0.914
Observational Assessment of Cognitive Status IV.C1a Current season 19
no discor-dant pairs
no discor-dant pairs
IV.C1b Location of own room 19
no discor-dant pairs
no discor-dant pairs
IV.C1c Staff names and faces 19
no discor-dant pairs
no discor-dant pairs
IV.C1d That he or she is in a hospital, nursing home, or home 19 0.642 N/A
IV.C1e None of the above are recalled 19 0.578 N/A IV.C1f Unable to assess 19 0.883 N/A
Confusion Assessment Method (CAMs) IV.D1 Inattention 130 0.691 0.703 IV.D2 Disorganized thinking 130 0.696 0.732 IV.D3 Altered level of consciousness/alertness 130 0.584 0.558 IV.D4 Psychomotor retardation 130 0.474 0.477
Behavioral Signs & Symptoms IV.E1
Physical symptoms directed towards others (e.g., hitting, kicking, pushing) 383 0.663 N/A
IV.E2 Verbal symptoms directed towards others (e.g., threatening, screaming at others) 383 0.662 N/A
IV.E3 Other disruptive or dangerous behaviors (e.g., hitting or scratching self) 382 0.745 N/A
Mood IV.F1 Mood interview attempted? 383 0.763 N/A
(continued)
32
Table 9-6 (continued) IRR testing: Cognitive status, mood at PAC admission and acute discharge, IRR sample
(CARE Item Set Section 4)
Item number Item
Effective sample
size Kappa Weighted
kappa
Effective sample size* Kappa*
Weighted kappa*
Patient Health Questionnaire (PHQ-2©)
IV.F2a
Little interest or pleasure in doing things
328
0.860
0.856
317
0.866
N/A
IV.F2b Number of days in the last 2 weeks (little interest or pleasure in doing things)
98 0.809 0.887 — — —
IV.F2c Feeling down, depressed, or hopeless
328 0.844 0.841 317 0.841 N/A
IV.F2d Number of days in the last 2 weeks (feeling down, depressed, or helpless?)
112 0.849 0.907 — — —
IV.F3 Feeling sad 328 0.742 0.842 318 0.732 0.823
* With unknown, not applicable responses excluded.
NOTE: N/A—Weighted kappa is not applicable for items with only two responses available. IRR sample: 455 pairs of assessments.
SOURCE: RTI analysis of CARE data, IRR sample only (CARE extract 1/28/10).
The CARE included both the PHQ-2© and the PROMIS item to identify whether one was more reliable than another with these populations. The PROMIS item was based on the SF-36 which was developed for the general population, including the healthy as well as this population where everyone is receiving acute or PAC care. The kappas suggest the PHQ-2© items were slightly more reliable across the range of populations than the “Feeling sad” item (more kappas above 0.80 although the lowest kappa on the “Feeling sad” item was 0.742) suggesting both are fairly reliable in these populations. Identifying the presence of and severity of pain is critical not only for understanding severity of illness and anticipating resource utilization, but is also an important quality of care domain. The CARE item set includes items measuring three domains of pain: a core item asked of all patients (“Presence of pain in last 2 days”) and two supplemental items asked of patients who answered yes to the core pain item (“Severity of pain” and “Effect of pain on function”). Table 9-7a displays the IRR results from the Pain section of the CARE item set. The table includes the item for “Pain interview attempted,” as well as the core item assessing the “Presence of pain in the last two days.” If a patient indicated pain was present, they were asked to categorize that pain using a 0–10 scale. The effect of pain on sleep and activities was also assessed for these patients. Clinical observation was used to determine the possible presence of pain for patients who could not be interviewed.
33
The interview based pain items (4.G1 through 4.G5) had substantial to almost perfect kappas whether coded non-response items were included in calculations or not (weighted kappa range: 0.61–0.91). Observational assessment items had lower kappa values than the interview items, as expected, but were still substantial for non-verbal sounds, vocal complaints of pain, and facial expressions (range 0.61–0.66). Protective body movements or postures (4.G6d) had a lower kappa at 0.42.
By Provider Type Analysis Provider-specific analyses of agreement for selected cognitive section items were
conducted and are displayed in Table 9-7b. Agreement was substantial or higher for all items examined, regardless of provider type. SNFs had slightly lower kappas than other settings across the selected items, though differences were not marked. Results are described in more detail below.
The BIMS CARE item set item “Recalls year” (4.B3b.1/4.B2b1) shows a high level of consistency with weighted kappas for all inpatient hospitals (acute care, IRFs, and LTCHs) ranging from 0.91 to 1.00, indicating almost perfect agreement. Participating HHAs and SNFs each had substantial agreement for the item with unweighted kappas of 0.73 and 0.62, respectively, while the weighted kappa for HHAs (0.90) indicates almost perfect agreement. On the CAMS item “Inattention” (4.D1), the unweighted kappa for HHAs indicates moderate agreement while the weighted kappa indicates substantial agreement. IRFs’ kappa was higher in the weighted version as well, indicating almost perfect agreement as compared to the substantial agreement indicated by the simple kappa. Both the simple and weighted kappas for LTCHs demonstrate substantial inter-rater agreement. Lastly, SNFs’ simple kappa indicates moderate agreement on the item while the weighted kappa indicates substantial agreement.
For the PHQ-2 item 4.F2c, “Feeling down, depressed, or hopeless,” kappas with “Unable to answer” or “No response” excluded indicate almost perfect agreement with values ranging from 0.81 to 0.89 for all provider types excepting acute hospitals, which did not have this item on their tool (weighted kappas are not applicable since there are only two possible responses for the variable with excluded answers). Analyses with “Unable to answer” or “No response” categories of the variable included resulted in unweighted kappas that indicate almost perfect agreement between clinicians in HHAs, IRFs, LTCHs, and SNFs, while weighted kappas indicate almost perfect agreement in IRFs and SNFs and substantial agreement in LTCHS. There was no weighted kappa computed for HHAs with the “Unable to answer” or “No response” categories included because respondents only used two levels of the variable. Again, data for acute hospitals were not available.
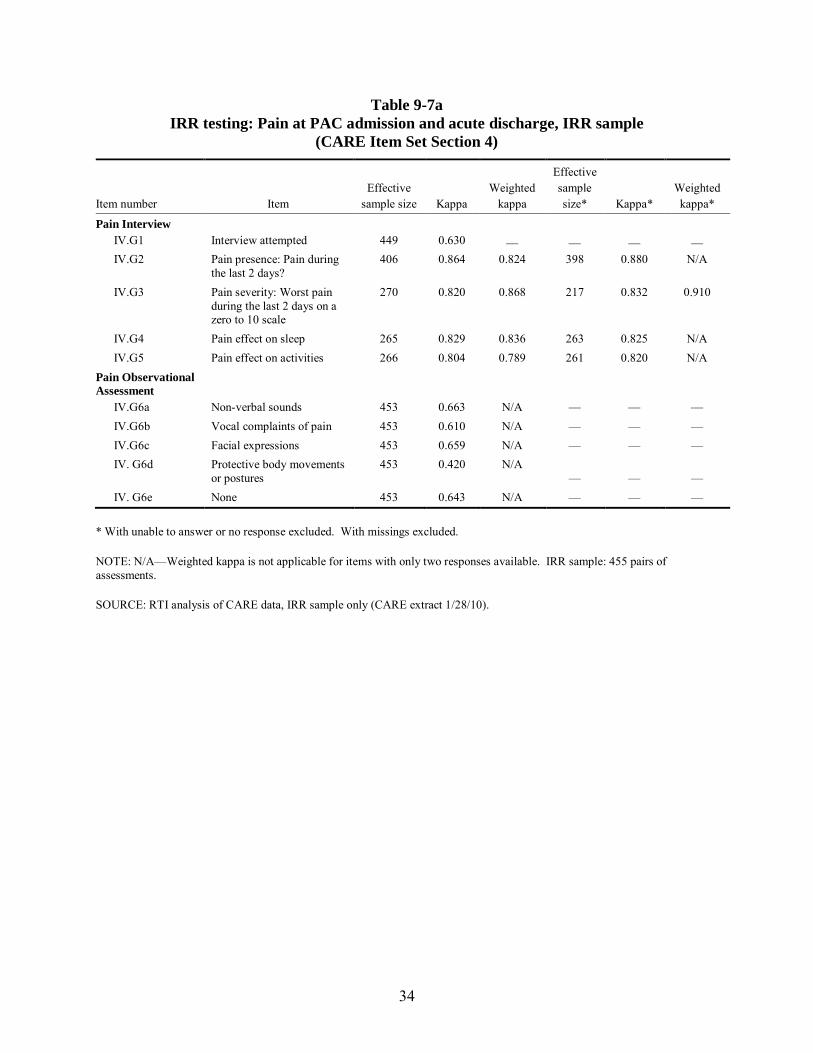
34
Table 9-7a IRR testing: Pain at PAC admission and acute discharge, IRR sample
(CARE Item Set Section 4)
Item number Item Effective
sample size Kappa Weighted
kappa
Effective sample size* Kappa*
Weighted kappa*
Pain Interview IV.G1 Interview attempted 449 0.630 — — — — IV.G2 Pain presence: Pain during
the last 2 days? 406 0.864 0.824 398 0.880 N/A
IV.G3 Pain severity: Worst pain during the last 2 days on a zero to 10 scale
270 0.820 0.868 217 0.832 0.910
IV.G4 Pain effect on sleep 265 0.829 0.836 263 0.825 N/A IV.G5 Pain effect on activities 266 0.804 0.789 261 0.820 N/A
Pain Observational Assessment
IV.G6a Non-verbal sounds 453 0.663 N/A — — — IV.G6b Vocal complaints of pain 453 0.610 N/A — — — IV.G6c Facial expressions 453 0.659 N/A — — — IV. G6d Protective body movements
or postures 453 0.420 N/A
— — — IV. G6e None 453 0.643 N/A — — —
* With unable to answer or no response excluded. With missings excluded.
NOTE: N/A—Weighted kappa is not applicable for items with only two responses available. IRR sample: 455 pairs of assessments.
SOURCE: RTI analysis of CARE data, IRR sample only (CARE extract 1/28/10).
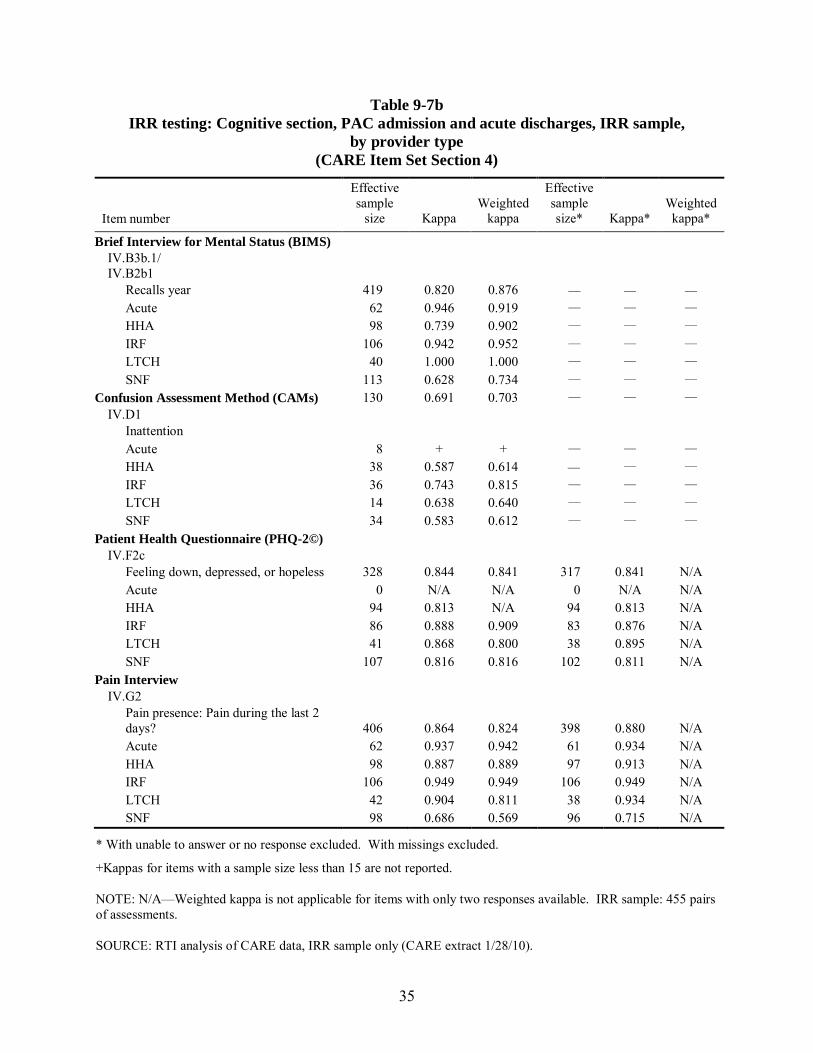
35
Table 9-7b IRR testing: Cognitive section, PAC admission and acute discharges, IRR sample,
by provider type (CARE Item Set Section 4)
Item number
Effective sample
size Kappa Weighted
kappa
Effective sample size* Kappa*
Weighted kappa*
Brief Interview for Mental Status (BIMS) IV.B3b.1/ IV.B2b1
Recalls year 419 0.820 0.876 — — — Acute 62 0.946 0.919 — — — HHA 98 0.739 0.902 — — — IRF 106 0.942 0.952 — — — LTCH 40 1.000 1.000 — — — SNF 113 0.628 0.734 — — —
Confusion Assessment Method (CAMs) IV.D1
Inattention
130 0.691 0.703 — — —
Acute 8 + + — — — HHA 38 0.587 0.614 — — — IRF 36 0.743 0.815 — — — LTCH 14 0.638 0.640 — — — SNF 34 0.583 0.612 — — —
Patient Health Questionnaire (PHQ-2©) IV.F2c
Feeling down, depressed, or hopeless 328 0.844 0.841 317 0.841 N/A Acute 0 N/A N/A 0 N/A N/A HHA 94 0.813 N/A 94 0.813 N/A IRF 86 0.888 0.909 83 0.876 N/A LTCH 41 0.868 0.800 38 0.895 N/A SNF 107 0.816 0.816 102 0.811 N/A
Pain Interview IV.G2
Pain presence: Pain during the last 2 days? 406 0.864 0.824 398 0.880 N/A Acute 62 0.937 0.942 61 0.934 N/A HHA 98 0.887 0.889 97 0.913 N/A IRF 106 0.949 0.949 106 0.949 N/A LTCH 42 0.904 0.811 38 0.934 N/A SNF 98 0.686 0.569 96 0.715 N/A
* With unable to answer or no response excluded. With missings excluded.
+Kappas for items with a sample size less than 15 are not reported.
NOTE: N/A—Weighted kappa is not applicable for items with only two responses available. IRR sample: 455 pairs of assessments.
SOURCE: RTI analysis of CARE data, IRR sample only (CARE extract 1/28/10).
36
For the pain interview item in the cognitive section of the CARE item set, “Pain presence: Pain during the last 2 days?” (4.G2), kappas with “Unable to answer” or “No response” excluded indicate almost perfect agreement (ranging from 0.91to 0.94) in all care settings except for SNFs, whose kappa value indicates substantial agreement. Simple and weighted kappas with “Unable to answer” and “No response” included indicate almost perfect agreement among the clinicians in each inpatient hospital (acute hospitals, IRFs, and LTCHs) and in HHA settings, and moderate agreement in SNFs.
V. Impairments
Impairment items are important measures of patient severity and resource utilization. According to the disablement model developed by Nagi (1965), impairment is defined as any loss or abnormality of anatomic, physiologic, mental, or emotional structure or function. These may or may not result in functional performance limitations. This section of the CARE item set has 7 individual subsections to measure impairments in bladder and bowel management, swallowing, hearing/vision/communication, weight-bearing restrictions, grip strength, respiratory status, and endurance. Each section has its own unique screening items for each type of impairment followed by the supplemental item to measure impairment level on those having an impairment (as noted in the screening item). Kappas reported for the screening items below apply to the full IRR sample; kappas for the supplemental items are only for the segment of patients who were reported to have that type of impairment.
Table 9-8 shows results IRR results for impairments in bowel and bladder management, in addition to swallowing. Bladder and bowel management can be predictive of resource utilization and outcomes. A patient with frequent incontinence and need for assistance in managing these issues will require more resources. A patient’s ability to swallow is predictive of resource utilization and may affect post-acute care discharge options. Dysphagia, or difficulty with swallowing, is associated with increased morbidity and in some cases mortality. The swallowing item included in this table is based on input from the American Speech Language Hearing Association and asks the assessor to identify signs and symptoms of a possible swallowing disorder including complaints of difficulty or pain with swallowing, coughing or choking during meals, holding food in mouth, or loss of liquids or solids from mouth when eating and drinking, and no food intake by mouth. Results have been reported for all responses (see the first three columns) and for responses excluding “Not applicable” codes (in the second three columns).
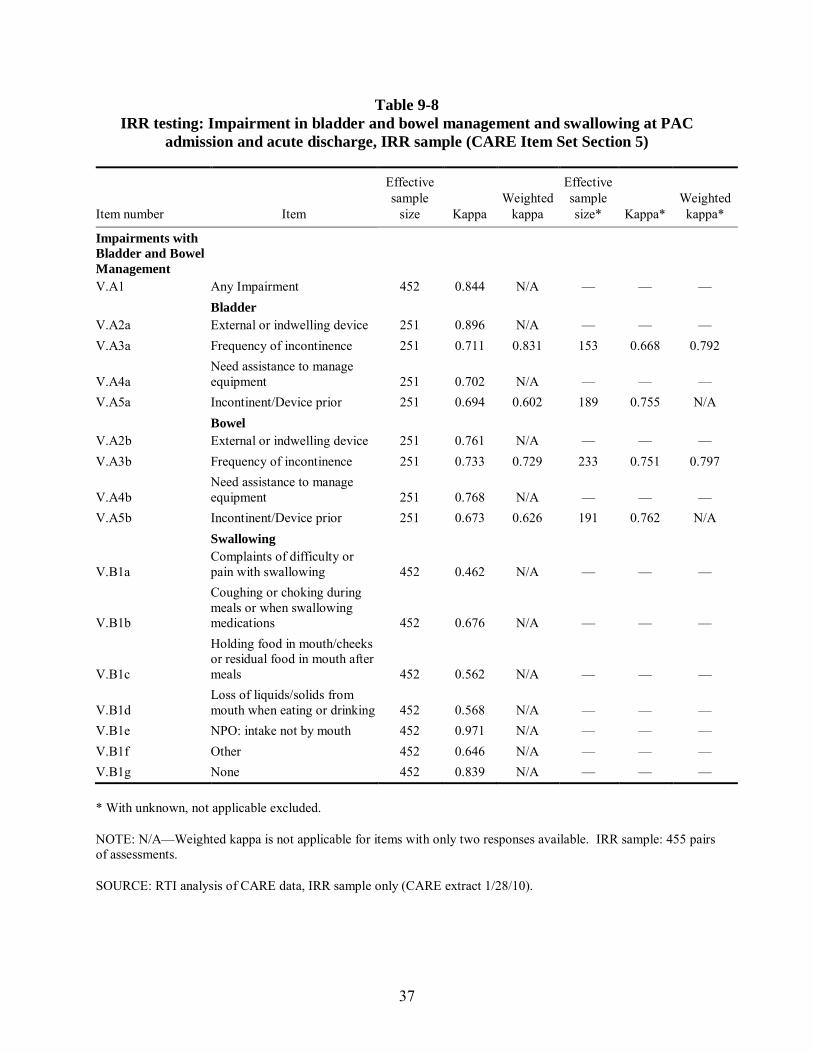
37
Table 9-8 IRR testing: Impairment in bladder and bowel management and swallowing at PAC
admission and acute discharge, IRR sample (CARE Item Set Section 5)
Item number Item
Effective sample
size Kappa Weighted
kappa
Effective sample size* Kappa*
Weighted kappa*
Impairments with Bladder and Bowel Management V.A1 Any Impairment 452 0.844 N/A — — —
V.A2a Bladder External or indwelling device 251 0.896 N/A — — —
V.A3a Frequency of incontinence 251 0.711 0.831 153 0.668 0.792
V.A4a Need assistance to manage equipment 251 0.702 N/A — — —
V.A5a Incontinent/Device prior 251 0.694 0.602 189 0.755 N/A
V.A2b Bowel External or indwelling device 251 0.761 N/A — — —
V.A3b Frequency of incontinence 251 0.733 0.729 233 0.751 0.797
V.A4b Need assistance to manage equipment 251 0.768 N/A — — —
V.A5b Incontinent/Device prior 251 0.673 0.626 191 0.762 N/A
V.B1a
Swallowing Complaints of difficulty or pain with swallowing 452 0.462 N/A — — —
V.B1b
Coughing or choking during meals or when swallowing medications 452 0.676 N/A — — —
V.B1c
Holding food in mouth/cheeks or residual food in mouth after meals 452 0.562 N/A — — —
V.B1d Loss of liquids/solids from mouth when eating or drinking 452 0.568 N/A — — —
V.B1e NPO: intake not by mouth 452 0.971 N/A — — — V.B1f Other 452 0.646 N/A — — — V.B1g None 452 0.839 N/A — — —
* With unknown, not applicable excluded.
NOTE: N/A—Weighted kappa is not applicable for items with only two responses available. IRR sample: 455 pairs of assessments.
SOURCE: RTI analysis of CARE data, IRR sample only (CARE extract 1/28/10).
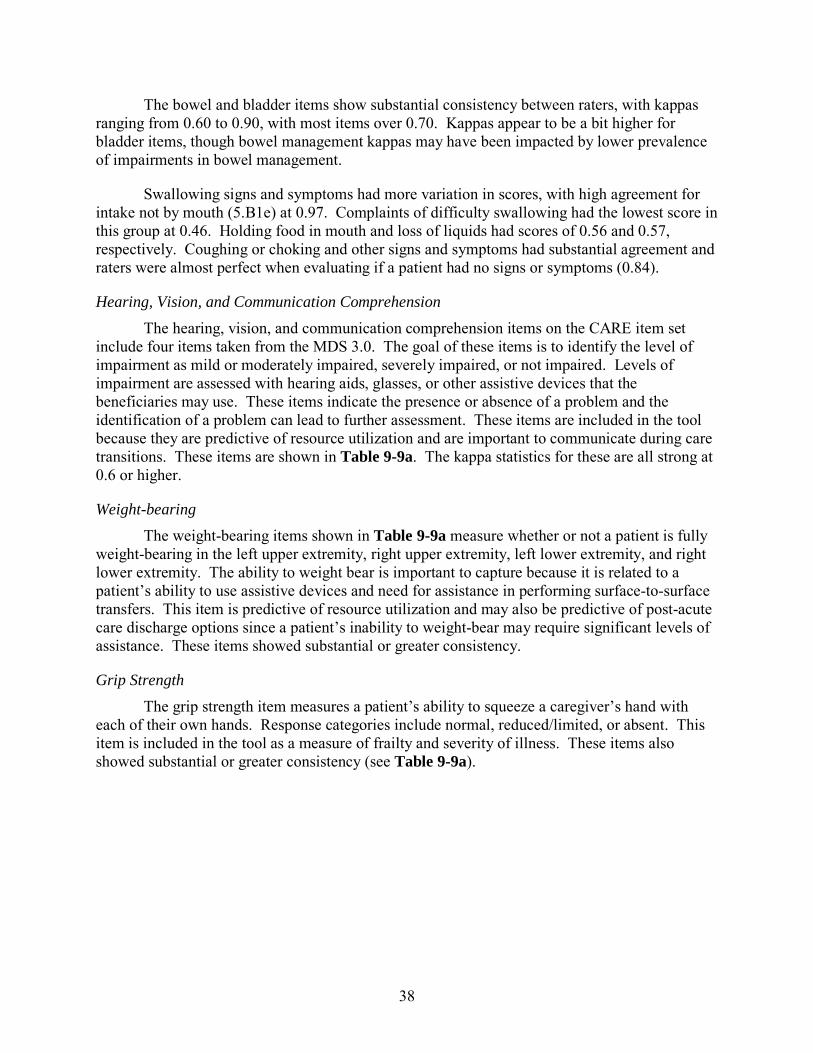
38
The bowel and bladder items show substantial consistency between raters, with kappas ranging from 0.60 to 0.90, with most items over 0.70. Kappas appear to be a bit higher for bladder items, though bowel management kappas may have been impacted by lower prevalence of impairments in bowel management.
Swallowing signs and symptoms had more variation in scores, with high agreement for intake not by mouth (5.B1e) at 0.97. Complaints of difficulty swallowing had the lowest score in this group at 0.46. Holding food in mouth and loss of liquids had scores of 0.56 and 0.57, respectively. Coughing or choking and other signs and symptoms had substantial agreement and raters were almost perfect when evaluating if a patient had no signs or symptoms (0.84).
Hearing, Vision, and Communication Comprehension The hearing, vision, and communication comprehension items on the CARE item set
include four items taken from the MDS 3.0. The goal of these items is to identify the level of impairment as mild or moderately impaired, severely impaired, or not impaired. Levels of impairment are assessed with hearing aids, glasses, or other assistive devices that the beneficiaries may use. These items indicate the presence or absence of a problem and the identification of a problem can lead to further assessment. These items are included in the tool because they are predictive of resource utilization and are important to communicate during care transitions. These items are shown in Table 9-9a. The kappa statistics for these are all strong at 0.6 or higher.
Weight-bearing The weight-bearing items shown in Table 9-9a measure whether or not a patient is fully
weight-bearing in the left upper extremity, right upper extremity, left lower extremity, and right lower extremity. The ability to weight bear is important to capture because it is related to a patient’s ability to use assistive devices and need for assistance in performing surface-to-surface transfers. This item is predictive of resource utilization and may also be predictive of post-acute care discharge options since a patient’s inability to weight-bear may require significant levels of assistance. These items showed substantial or greater consistency.
Grip Strength The grip strength item measures a patient’s ability to squeeze a caregiver’s hand with
each of their own hands. Response categories include normal, reduced/limited, or absent. This item is included in the tool as a measure of frailty and severity of illness. These items also showed substantial or greater consistency (see Table 9-9a).
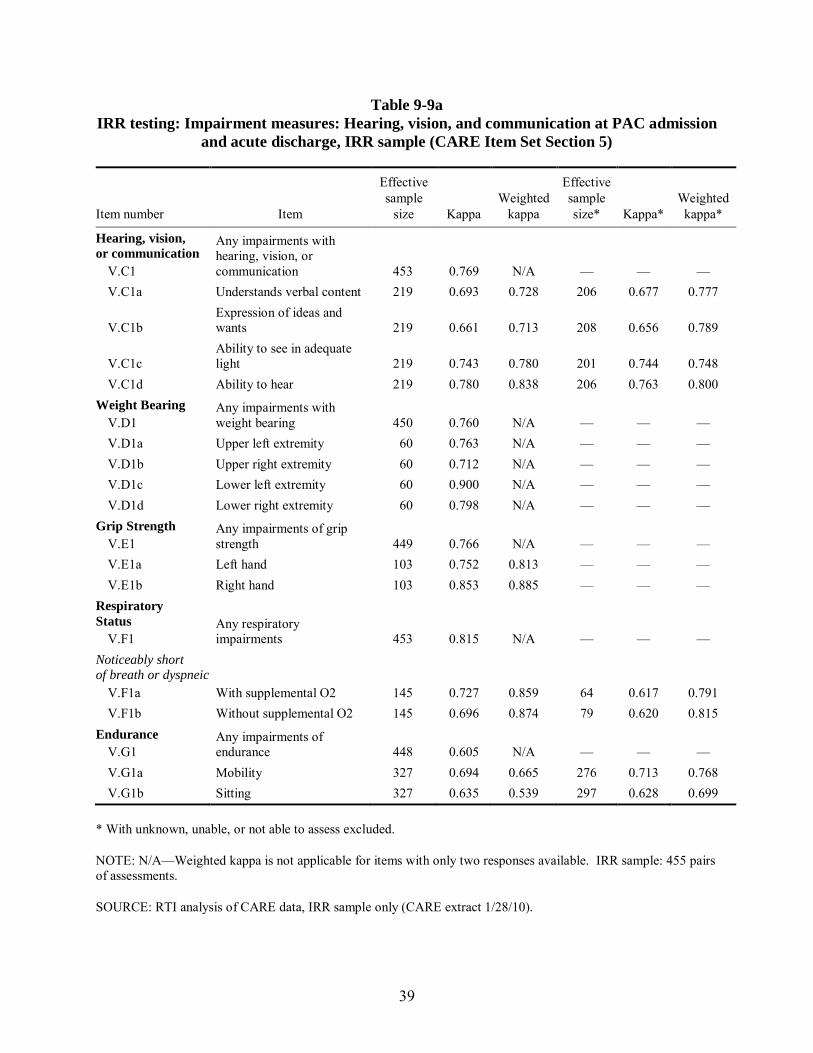
39
Table 9-9a IRR testing: Impairment measures: Hearing, vision, and communication at PAC admission
and acute discharge, IRR sample (CARE Item Set Section 5)
Item number Item
Effective sample
size Kappa Weighted
kappa
Effective sample size* Kappa*
Weighted kappa*
Hearing, vision, or communication
V.C1
Any impairments with hearing, vision, or communication 453 0.769 N/A — — —
V.C1a Understands verbal content 219 0.693 0.728 206 0.677 0.777
V.C1b Expression of ideas and wants 219 0.661 0.713 208 0.656 0.789
V.C1c Ability to see in adequate light 219 0.743 0.780 201 0.744 0.748
V.C1d Ability to hear 219 0.780 0.838 206 0.763 0.800 Weight Bearing
V.D1 Any impairments with weight bearing 450 0.760 N/A — — —
V.D1a Upper left extremity 60 0.763 N/A — — — V.D1b Upper right extremity 60 0.712 N/A — — — V.D1c Lower left extremity 60 0.900 N/A — — — V.D1d Lower right extremity 60 0.798 N/A — — —
Grip Strength V.E1
Any impairments of grip strength 449 0.766 N/A — — —
V.E1a Left hand 103 0.752 0.813 — — — V.E1b Right hand 103 0.853 0.885 — — —
Respiratory Status
V.F1 Any respiratory impairments 453 0.815 N/A — — —
Noticeably short of breath or dyspneic
V.F1a With supplemental O2 145 0.727 0.859 64 0.617 0.791 V.F1b Without supplemental O2 145 0.696 0.874 79 0.620 0.815
Endurance V.G1
Any impairments of endurance 448 0.605 N/A — — —
V.G1a Mobility 327 0.694 0.665 276 0.713 0.768 V.G1b Sitting 327 0.635 0.539 297 0.628 0.699
* With unknown, unable, or not able to assess excluded.
NOTE: N/A—Weighted kappa is not applicable for items with only two responses available. IRR sample: 455 pairs of assessments.
SOURCE: RTI analysis of CARE data, IRR sample only (CARE extract 1/28/10).
40
Table 9-9b IRR testing: Impairments at PAC admission and acute discharge, IRR sample, by provider
type (CARE Item Set Section 5)
Item number
Effective sample
size Kappa Weighted
kappa
Effective sample size* Kappa*
Weighted kappa*
Impairments with Bladder and Bowel Management
V.A1 Any impairment 452 0.844 N/A — — — Acute 66 0.905 N/A — — — HHA 102 0.874 N/A — — — IRF 115 0.770 N/A — — — LTCH 49 0.764 N/A — — — SNF 120 0.834 N/A — — —
Bladder V.A3a
Frequency of incontinence 251 0.711 0.831 153 0.668 0.792 Acute 25 0.541 0.768 11 + + HHA 61 0.579 0.757 59 0.550 0.715 IRF 69 0.727 0.865 35 0.681 0.808 LTCH 40 0.644 0.661 9 + + SNF 56 0.750 0.840 39 0.717 0.805
Bowel V.A3b
Frequency of incontinence 251 0.733 0.729 233 0.751 0.797 Acute 25 0.556 0.363 21 0.654 0.681 HHA 61 0.821 0.787 59 0.841 0.862 IRF 69 0.630 0.739 64 0.571 0.613 LTCH 40 0.611 0.706 34 0.631 0.859 SNF 56 0.842 0.846 55 0.836 0.824
Swallowing V.B1g
None 452 0.839 N/A — — — Acute 65 0.882 N/A — — — HHA 102 0.649 N/A — — — IRF 115 0.922 N/A — — — LTCH 49 0.671 N/A — — — SNF 121 0.880 N/A — — —
Endurance V.G1b
Sitting 327 0.635 0.539 297 0.628 0.699 Acute 25 0.732 0.612 22 0.725 0.784 HHA 79 0.664 0.584 76 0.682 0.738 IRF 85 0.386 0.492 84 0.360 0.412 LTCH 44 0.427 0.374 25 0.443 0.728 SNF 94 0.758 0.794 90 0.752 0.746
*With unknown, N/A excluded. +Kappas for items with a sample size less than 15 are not reported NOTE: N/A—Weighted kappa is not applicable for items with only two responses available. IRR sample: 455 pairs of assessments. SOURCE: RTI analysis of CARE data, IRR sample only (CARE extract 1/28/10).
41
Respiratory Status Providers were asked to report on shortness of breath or dyspnea associated with different
levels of activity. Scores were assessed for those with or without supplemental oxygen (as appropriate) for patients with any respiratory impairments during the 2-day assessment period. Identifying the level of activity which causes or contributes to a patient being out of breath is predictive of patient severity of illness and potential resource utilization. If patients had no respiratory impairment, the level of activity item was skipped. If patients were not using supplemental oxygen, the item is entered as not applicable, likewise for patients on supplemental oxygen who would not be taken off oxygen for safety reasons. Reliability statistics for respiratory impairments items are displayed in Table 9-9a. Weighted kappas ranged from 0.79 to 0.87 for items requesting levels of impairment by with and without oxygen indicating very high to almost perfect consistency between raters. Kappas from prior analyses of a similar item on the OASIS ranged from 0.49 to 0.82 across several studies (Berg,1999; Hittle, Shaughnessy, and Crisler, 2002; Abt/CHSR, 2008; Madigan and Fortinsky, 2004), suggesting these results were equal to or better than past efforts in this area.
Endurance The results for the two endurance items included on the CARE item set are also shown in
Table 9-9a. The first is mobility endurance, which asks if the patient is able to walk or wheel 50 feet in the two-day assessment period. The second item is sitting endurance, which asks if the patient is able to tolerate sitting for 15 minutes. Endurance is important to capture in the CARE item set because patients with low endurance are unlikely to be discharged to a rehabilitation setting where treatment includes a minimum of 15 hours of physical therapy/week. This item will be used to predict resource utilization and post-acute care discharge options. Kappas for both items showed substantial agreement (0.63–0.77).
Provider-Specific Analyses Table 9-9b shows provider-level analyses of some of the impairment items in
Table 9-9a. In general, these items were rated consistently across settings. The exceptions were lower kappas for bowel incontinence in the acute hospital (0.56) and lower kappas for the sitting endurance items in the IRF (kappas ranging from 0.386 unweighted to 0.412 weighted kappas). However, provider-level differences were not apparent on these items for the other providers. Kappas ranged among the moderate to substantial kappas. For the frequency of bladder incontinence item (5.A3a), IRFs, LTCHs, and SNFs had substantial agreement in all analyses, while acute hospitals and HHAs had moderate agreement when unknown and not applicable responses were included. For the frequency of bowel incontinence (5.A3b), IRFs, LTCHs and Acute settings had lower, but still substantial kappas, than SNFs and HHA, which had almost perfect agreement, when looking across all kappas calculated for this item. For the swallowing item indicating the presence or absence of any signs and symptoms of a swallowing disorder (5.B1g, “None”), simple kappas for acute hospitals, IRFs, and SNFs indicate almost perfect agreement, while HHAs and LTCHs demonstrate substantial agreement. Unweighted kappas were not applicable since there are only two response categories for the variable. For the sitting endurance item (5.G1b), acute hospitals and SNFs had the highest kappas; followed by the HHAs which had substantial to moderate agreement, looking across weighted and unweighted kappas. LTCHs and IRFs had lower agreement.
VI. Functional Status
Core Function Items The CARE item set includes a core set of six self care items and five functional mobility
items that are asked of all patients. Items represent a range of difficulty. Many of these are based on measure concepts found on the OASIS, MDS 3.0, and IRF-PAI. The primary purpose of each of the function items is to understand the potential resource utilization and post-acute care discharge decisions as measured through the independence or need for assistance scale.
The core items are rated using a six-level rating scale measuring the patient’s independence or need for assistance. Rating scale levels include total dependence, substantial/maximal assistance, partial/moderate assistance, supervision or touching assistance, setup or clean-up assistance, or total independence. Respondents can also indicate that the item was not attempted due to medical or safety concerns, attempted but not completed, not applicable to the patient, or the patient refused. Because these not attempted responses are not ordinal to each other nor were clinicians trained to differentiate finely between these responses, we are reporting a set of kappas where these responses have been set to missing. An additional analysis, not shown, was conducted where kappas were calculated using recoded function items that grouped “Not attempted” responses together, results uniformly showed only slight increases in the unweighted kappas, largely in the third decimal, and slight decreases in the weighted kappas from what is reported below.
This core set of items evaluate all patients, regardless of functional level on basic self care activities such as eating, tube feeding, oral hygiene, toilet hygiene, and upper and lower body dressing. The core mobility items include patient ability to move from lying to sitting on the side of the bed, to move from sitting position to standing, to transfer to and from a chair (or wheelchair), and to get on and off a toilet or commode. Results for these core items are reported in Table 9-10a and are split into two conceptual groupings corresponding to self care and mobility items.
The core mobility section of the CARE item set includes items characterizing patient’s level of independence in locomotion or ambulation structured with a screening question that asks the patient’s mode of mobility, or whether the patient primarily uses a wheelchair for mobility. The subsequent questions request information on the patient’s level of independence in mobility at the longest distance they are able to ambulate (150, 100, or 50 feet or in room), separating responses for patients who walk from those who primarily wheel. Effective sample sizes for these items are smaller because each patient has a response for a single one of these eight modes of mobility items.
Kappa statistics for all core items, self care and mobility, indicate substantial agreement among raters. (Note that the “wheel 100 feet” item (6.B5b1) was excluded due to a low sample size (n = 7).) The weighted kappa values for the self care items range between 0.78 for eating to 0.869 for upper body dressing. At the provider level, these values are in line with the values available for the equivalent FIM® and OASIS items (eating, toilet hygiene, upper and lower body dressing), but lower than for the equivalent items on MDS, including both studies evaluating MDS 2.0 and 3.0. Differences in item design are described in the following comparisons with current CMS assessment tools. Differences in kappa may be explained by different sample
42
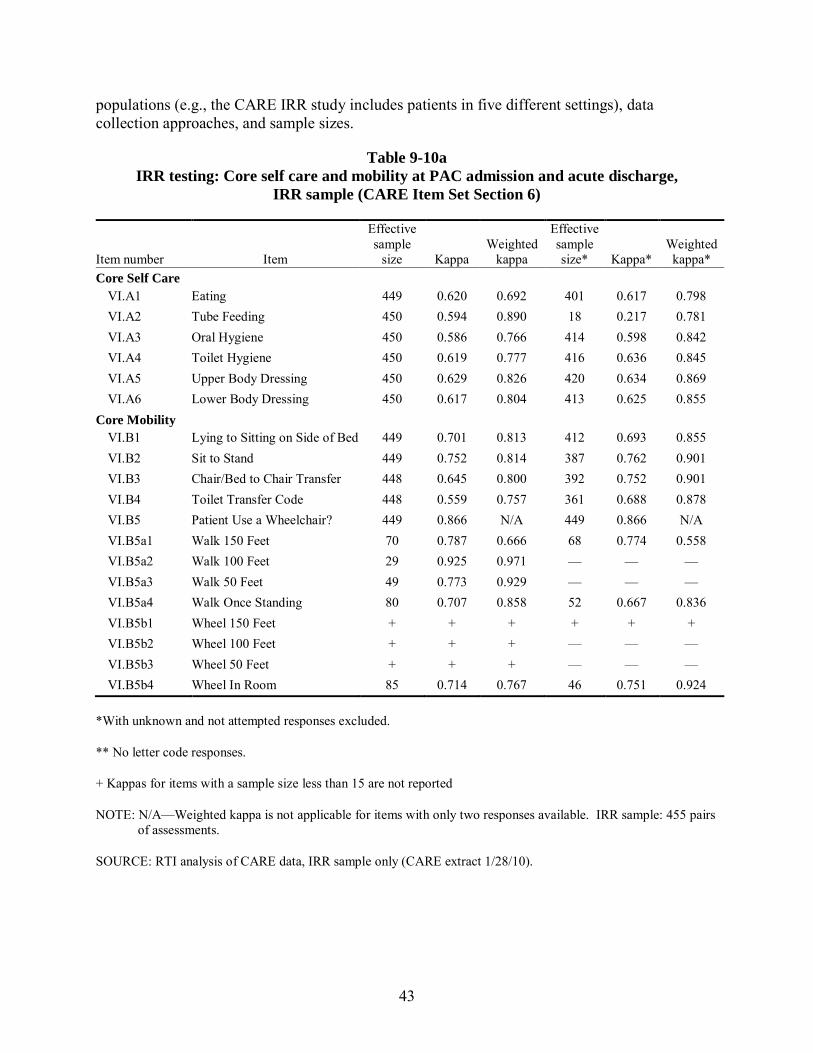
43
populations (e.g., the CARE IRR study includes patients in five different settings), data collection approaches, and sample sizes.
Table 9-10a IRR testing: Core self care and mobility at PAC admission and acute discharge,
IRR sample (CARE Item Set Section 6)
Item number Item
Effective sample
size Kappa Weighted
kappa
Effective sample size* Kappa*
Weighted kappa*
Core Self Care VI.A1 Eating 449 0.620 0.692 401 0.617 0.798 VI.A2 Tube Feeding 450 0.594 0.890 18 0.217 0.781 VI.A3 Oral Hygiene 450 0.586 0.766 414 0.598 0.842 VI.A4 Toilet Hygiene 450 0.619 0.777 416 0.636 0.845 VI.A5 Upper Body Dressing 450 0.629 0.826 420 0.634 0.869 VI.A6 Lower Body Dressing 450 0.617 0.804 413 0.625 0.855
Core Mobility VI.B1 Lying to Sitting on Side of Bed 449 0.701 0.813 412 0.693 0.855 VI.B2 Sit to Stand 449 0.752 0.814 387 0.762 0.901 VI.B3 Chair/Bed to Chair Transfer 448 0.645 0.800 392 0.752 0.901 VI.B4 Toilet Transfer Code 448 0.559 0.757 361 0.688 0.878 VI.B5 Patient Use a Wheelchair? 449 0.866 N/A 449 0.866 N/A VI.B5a1 Walk 150 Feet 70 0.787 0.666 68 0.774 0.558 VI.B5a2 Walk 100 Feet 29 0.925 0.971 — — — VI.B5a3 Walk 50 Feet 49 0.773 0.929 — — — VI.B5a4 Walk Once Standing 80 0.707 0.858 52 0.667 0.836 VI.B5b1 Wheel 150 Feet + + + + + + VI.B5b2 Wheel 100 Feet + + + — — — VI.B5b3 Wheel 50 Feet + + + — — — VI.B5b4 Wheel In Room 85 0.714 0.767 46 0.751 0.924
*With unknown and not attempted responses excluded.
** No letter code responses.
+ Kappas for items with a sample size less than 15 are not reported
NOTE: N/A—Weighted kappa is not applicable for items with only two responses available. IRR sample: 455 pairs of assessments.
SOURCE: RTI analysis of CARE data, IRR sample only (CARE extract 1/28/10).
44
Provider-Specific Analyses Provider-specific analyses of a selection of core self care and mobility items in
Table 9-10b show similar agreement to the overall estimates. IRFs and LTCHs appear to have slightly lower rates of agreement across items than other settings. For the eating core self care item, acute hospitals have substantial to almost perfect agreement (0.95). Simple kappas for HHAs, IRFs, LTCHs, and SNFs each indicate a moderate level of agreement, with the weighted kappa for both HHAs and SNFs showing substantial agreement between raters. The simple kappas for HHAs, IRFs, LTCHs, and SNFs, when the not assessed responses are excluded, show a moderate level of agreement, and in each case the weighted kappa is markedly higher with SNFs demonstrating almost perfect agreement and substantial agreement for HHAs, IRFs, and LTCHs.
For the oral hygiene self care item (6.A3), unweighted kappa scores including not attempted responses indicate substantial agreement in both acute care hospitals and HHAs, with the weighted kappa for acute care providers indicating almost perfect agreement (0.94). The simple kappa for SNFs indicates moderate agreement, while the weighted kappa indicates almost perfect agreement among raters. Unweighted kappas for both IRFs and LTCHs indicate only fair agreement, whereas the weighted kappa indicates moderate agreement in IRFs and substantial agreement for LTCHs. In the analyses excluding not attempted responses, unweighted kappas for all provider types remain in the same range. The weighted kappas for acute hospitals and SNFs indicate almost perfect agreement, substantial agreement for HHAs and IRFs, and moderate agreement for LTCHs. For the toilet hygiene self care item (6.A4), unweighted kappa scores including not attempted responses indicate substantial agreement for acute care hospitals and SNFs, moderate agreement for HHAs and IRFs, and fair agreement in LTCHs. Weighted kappas are higher across the board, with almost perfect agreement for acute hospitals; substantial for HHAs, LTCHs, and SNFs; and moderate agreement for IRFs. When not attempted responses are excluded unweighted kappas for all provider types remain in the same range. The weighted kappa for acute hospitals indicates almost perfect agreement, substantial agreement for HHAs; LTCHs, and SNFs; and almost perfect agreement for LTCHs. For the lower body dressing self care item (6.A6), unweighted kappa scores with not attempted included indicate substantial inter-rater agreement for acute care hospitals and moderate agreement for HHAs, IRFs, LTCHs, and SNFs. The weighted kappas indicate greater agreement for all provider types with almost perfect agreement for acute hospitals and IRFs, and substantial agreement for HHAs, LTCHs, and SNFs. When not attempted responses are excluded, unweighted kappas indicate substantial inter-rater agreement in acute care hospitals; moderate agreement for HHAs, IRFs, and SNFs; and fair agreement in LTCHs (n = 20). The weighted kappas again indicate greater agreement for all provider types with acute care hospitals and IRFs demonstrating almost perfect agreement, and HHAs, LTCHs, and SNFs demonstrating substantial agreement.
For the core mobility item, “Lying to sitting on side of bed” (6.B1), the unweighted kappas with not attempted responses included indicate almost perfect agreement in SNFs, substantial agreement in HHAs, and moderate agreement in acute care hospitals, IRFs, and LTCHs. The weighted kappas for LTCHs and SNFs indicate almost perfect agreement, and for acute hospitals, HHAs, and IRFs they indicate substantial agreement. In the analyses with not attempted excluded, unweighted kappas indicate almost perfect agreement for SNFs; moderate agreement for acute care hospitals, HHAs, and IRFs; and fair agreement for LTCHs (n = 27).
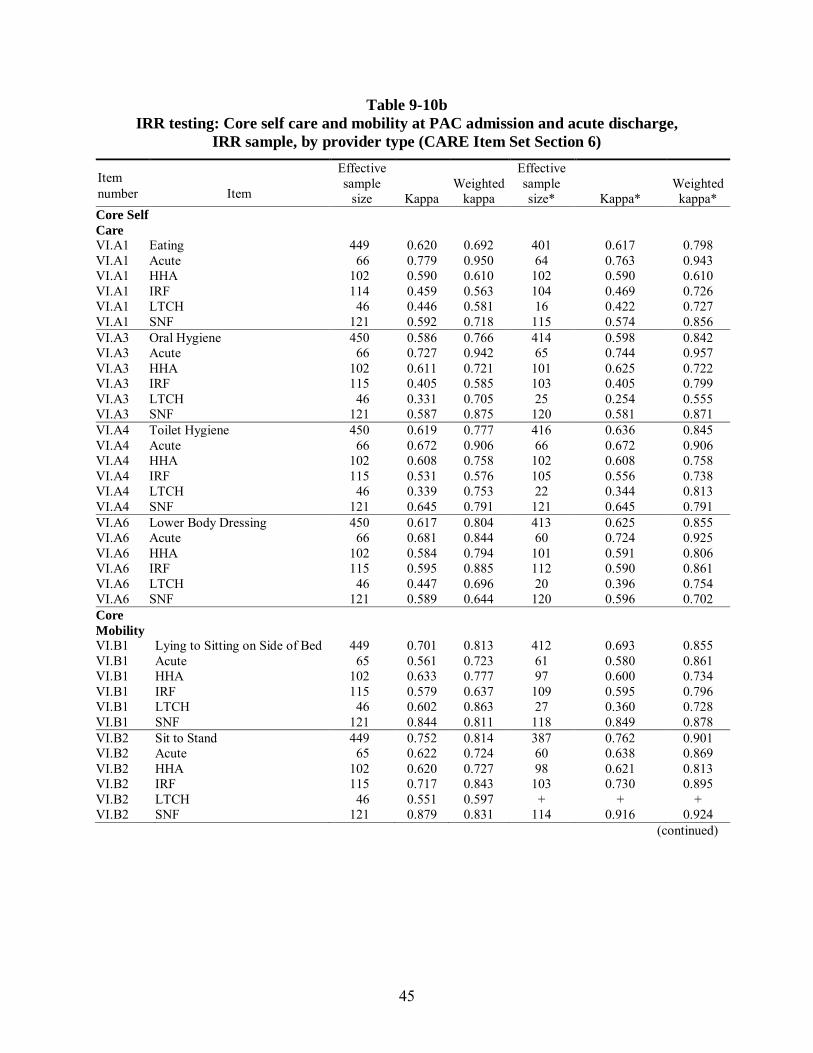
45
Table 9-10b IRR testing: Core self care and mobility at PAC admission and acute discharge,
IRR sample, by provider type (CARE Item Set Section 6)
Item number Item
Effective sample
size Kappa Weighted
kappa
Effective sample size* Kappa*
Weighted kappa*
Core Self Care VI.A1 Eating 449 0.620 0.692 401 0.617 0.798 VI.A1 Acute 66 0.779 0.950 64 0.763 0.943 VI.A1 HHA 102 0.590 0.610 102 0.590 0.610 VI.A1 IRF 114 0.459 0.563 104 0.469 0.726 VI.A1 LTCH 46 0.446 0.581 16 0.422 0.727 VI.A1 SNF 121 0.592 0.718 115 0.574 0.856 VI.A3 Oral Hygiene 450 0.586 0.766 414 0.598 0.842 VI.A3 Acute 66 0.727 0.942 65 0.744 0.957 VI.A3 HHA 102 0.611 0.721 101 0.625 0.722 VI.A3 IRF 115 0.405 0.585 103 0.405 0.799 VI.A3 LTCH 46 0.331 0.705 25 0.254 0.555 VI.A3 SNF 121 0.587 0.875 120 0.581 0.871 VI.A4 Toilet Hygiene 450 0.619 0.777 416 0.636 0.845 VI.A4 Acute 66 0.672 0.906 66 0.672 0.906 VI.A4 HHA 102 0.608 0.758 102 0.608 0.758 VI.A4 IRF 115 0.531 0.576 105 0.556 0.738 VI.A4 LTCH 46 0.339 0.753 22 0.344 0.813 VI.A4 SNF 121 0.645 0.791 121 0.645 0.791 VI.A6 Lower Body Dressing 450 0.617 0.804 413 0.625 0.855 VI.A6 Acute 66 0.681 0.844 60 0.724 0.925 VI.A6 HHA 102 0.584 0.794 101 0.591 0.806 VI.A6 IRF 115 0.595 0.885 112 0.590 0.861 VI.A6 LTCH 46 0.447 0.696 20 0.396 0.754 VI.A6 SNF 121 0.589 0.644 120 0.596 0.702 Core Mobility VI.B1 Lying to Sitting on Side of Bed 449 0.701 0.813 412 0.693 0.855 VI.B1 Acute 65 0.561 0.723 61 0.580 0.861 VI.B1 HHA 102 0.633 0.777 97 0.600 0.734 VI.B1 IRF 115 0.579 0.637 109 0.595 0.796 VI.B1 LTCH 46 0.602 0.863 27 0.360 0.728 VI.B1 SNF 121 0.844 0.811 118 0.849 0.878 VI.B2 Sit to Stand 449 0.752 0.814 387 0.762 0.901 VI.B2 Acute 65 0.622 0.724 60 0.638 0.869 VI.B2 HHA 102 0.620 0.727 98 0.621 0.813 VI.B2 IRF 115 0.717 0.843 103 0.730 0.895 VI.B2 LTCH 46 0.551 0.597 + + + VI.B2 SNF 121 0.879 0.831 114 0.916 0.924
(continued)
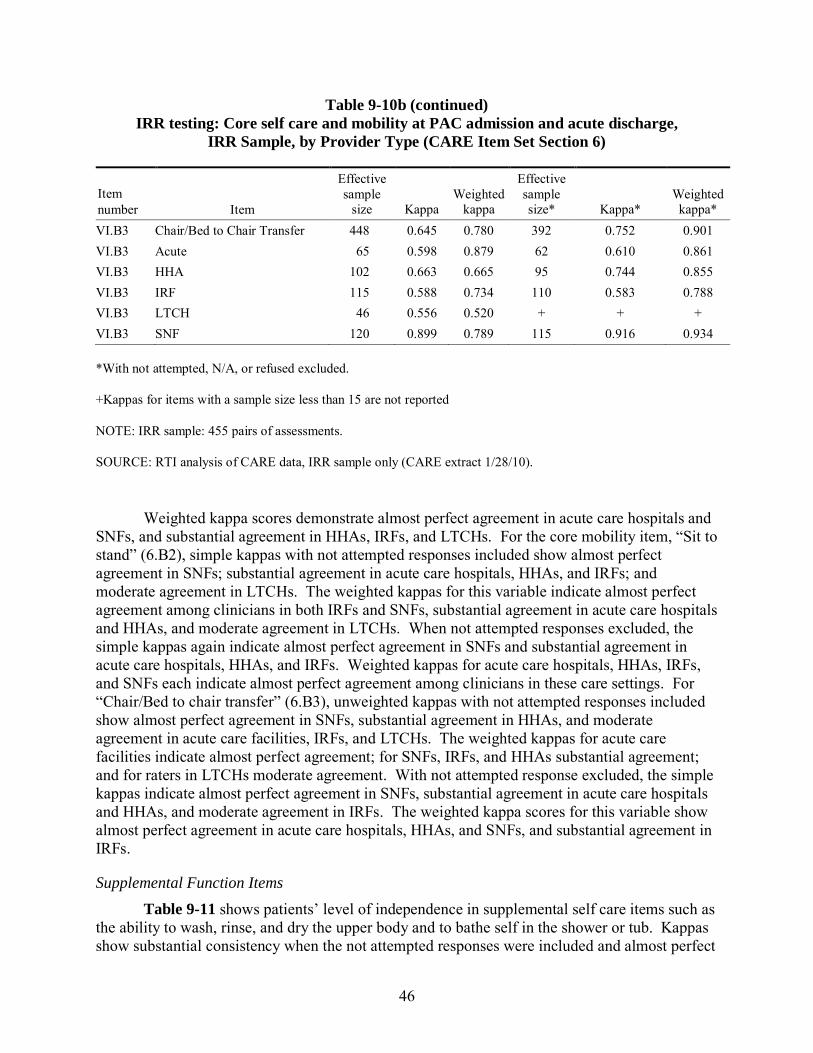
46
Table 9-10b (continued) IRR testing: Core self care and mobility at PAC admission and acute discharge,
IRR Sample, by Provider Type (CARE Item Set Section 6)
Item number Item
Effective sample
size Kappa Weighted
kappa
Effective sample size* Kappa*
Weighted kappa*
VI.B3 Chair/Bed to Chair Transfer 448 0.645 0.780 392 0.752 0.901 VI.B3 Acute 65 0.598 0.879 62 0.610 0.861 VI.B3 HHA 102 0.663 0.665 95 0.744 0.855 VI.B3 IRF 115 0.588 0.734 110 0.583 0.788 VI.B3 LTCH 46 0.556 0.520 + + + VI.B3 SNF 120 0.899 0.789 115 0.916 0.934
*With not attempted, N/A, or refused excluded.
+Kappas for items with a sample size less than 15 are not reported
NOTE: IRR sample: 455 pairs of assessments.
SOURCE: RTI analysis of CARE data, IRR sample only (CARE extract 1/28/10).
Weighted kappa scores demonstrate almost perfect agreement in acute care hospitals and SNFs, and substantial agreement in HHAs, IRFs, and LTCHs. For the core mobility item, “Sit to stand” (6.B2), simple kappas with not attempted responses included show almost perfect agreement in SNFs; substantial agreement in acute care hospitals, HHAs, and IRFs; and moderate agreement in LTCHs. The weighted kappas for this variable indicate almost perfect agreement among clinicians in both IRFs and SNFs, substantial agreement in acute care hospitals and HHAs, and moderate agreement in LTCHs. When not attempted responses excluded, the simple kappas again indicate almost perfect agreement in SNFs and substantial agreement in acute care hospitals, HHAs, and IRFs. Weighted kappas for acute care hospitals, HHAs, IRFs, and SNFs each indicate almost perfect agreement among clinicians in these care settings. For “Chair/Bed to chair transfer” (6.B3), unweighted kappas with not attempted responses included show almost perfect agreement in SNFs, substantial agreement in HHAs, and moderate agreement in acute care facilities, IRFs, and LTCHs. The weighted kappas for acute care facilities indicate almost perfect agreement; for SNFs, IRFs, and HHAs substantial agreement; and for raters in LTCHs moderate agreement. With not attempted response excluded, the simple kappas indicate almost perfect agreement in SNFs, substantial agreement in acute care hospitals and HHAs, and moderate agreement in IRFs. The weighted kappa scores for this variable show almost perfect agreement in acute care hospitals, HHAs, and SNFs, and substantial agreement in IRFs.
Supplemental Function Items Table 9-11 shows patients’ level of independence in supplemental self care items such as
the ability to wash, rinse, and dry the upper body and to bathe self in the shower or tub. Kappas show substantial consistency when the not attempted responses were included and almost perfect
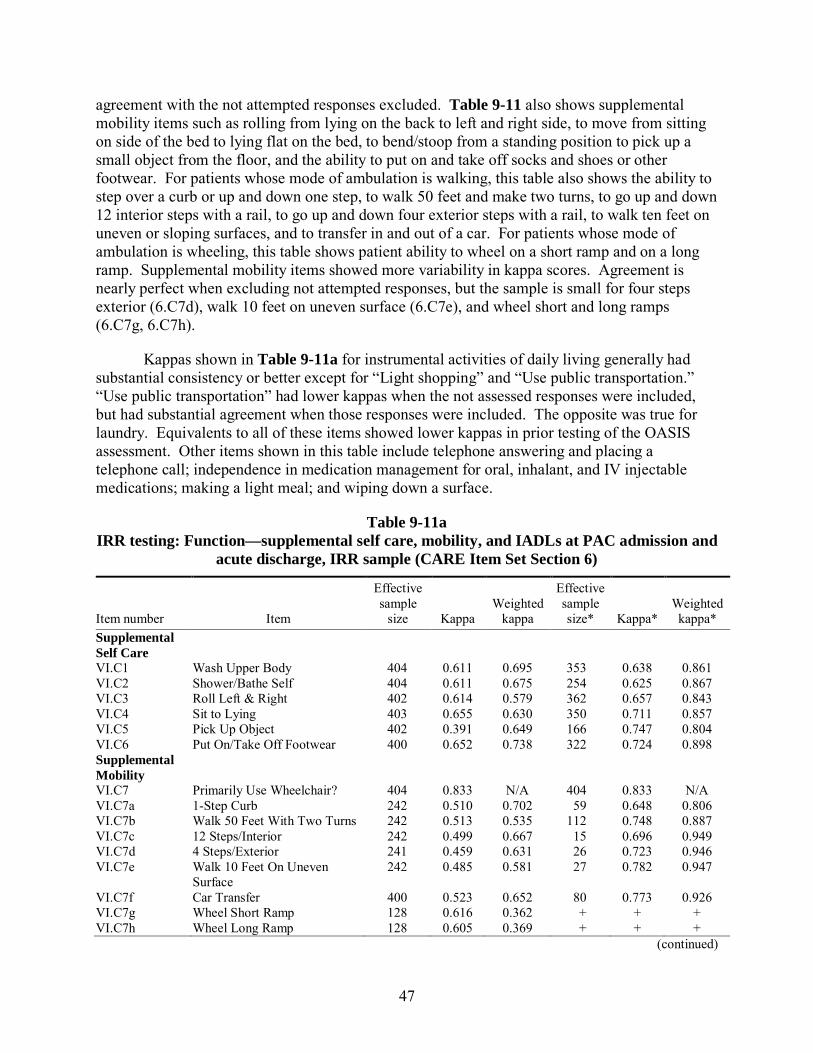
47
agreement with the not attempted responses excluded. Table 9-11 also shows supplemental mobility items such as rolling from lying on the back to left and right side, to move from sitting on side of the bed to lying flat on the bed, to bend/stoop from a standing position to pick up a small object from the floor, and the ability to put on and take off socks and shoes or other footwear. For patients whose mode of ambulation is walking, this table also shows the ability to step over a curb or up and down one step, to walk 50 feet and make two turns, to go up and down 12 interior steps with a rail, to go up and down four exterior steps with a rail, to walk ten feet on uneven or sloping surfaces, and to transfer in and out of a car. For patients whose mode of ambulation is wheeling, this table shows patient ability to wheel on a short ramp and on a long ramp. Supplemental mobility items showed more variability in kappa scores. Agreement is nearly perfect when excluding not attempted responses, but the sample is small for four steps exterior (6.C7d), walk 10 feet on uneven surface (6.C7e), and wheel short and long ramps (6.C7g, 6.C7h).
Kappas shown in Table 9-11a for instrumental activities of daily living generally had substantial consistency or better except for “Light shopping” and “Use public transportation.” “Use public transportation” had lower kappas when the not assessed responses were included, but had substantial agreement when those responses were included. The opposite was true for laundry. Equivalents to all of these items showed lower kappas in prior testing of the OASIS assessment. Other items shown in this table include telephone answering and placing a telephone call; independence in medication management for oral, inhalant, and IV injectable medications; making a light meal; and wiping down a surface.
Table 9-11a IRR testing: Function—supplemental self care, mobility, and IADLs at PAC admission and
acute discharge, IRR sample (CARE Item Set Section 6)
Item number Item
Effective sample
size Kappa Weighted
kappa
Effective sample size* Kappa*
Weighted kappa*
Supplemental Self Care VI.C1 Wash Upper Body 404 0.611 0.695 353 0.638 0.861 VI.C2 Shower/Bathe Self 404 0.611 0.675 254 0.625 0.867 VI.C3 Roll Left & Right 402 0.614 0.579 362 0.657 0.843 VI.C4 Sit to Lying 403 0.655 0.630 350 0.711 0.857 VI.C5 Pick Up Object 402 0.391 0.649 166 0.747 0.804 VI.C6 Put On/Take Off Footwear 400 0.652 0.738 322 0.724 0.898 Supplemental Mobility VI.C7 Primarily Use Wheelchair? 404 0.833 N/A 404 0.833 N/A VI.C7a 1-Step Curb 242 0.510 0.702 59 0.648 0.806 VI.C7b Walk 50 Feet With Two Turns 242 0.513 0.535 112 0.748 0.887 VI.C7c 12 Steps/Interior 242 0.499 0.667 15 0.696 0.949 VI.C7d 4 Steps/Exterior 241 0.459 0.631 26 0.723 0.946 VI.C7e Walk 10 Feet On Uneven
Surface 242 0.485 0.581 27 0.782 0.947
VI.C7f Car Transfer 400 0.523 0.652 80 0.773 0.926 VI.C7g Wheel Short Ramp 128 0.616 0.362 + + + VI.C7h Wheel Long Ramp 128 0.605 0.369 + + +
(continued)
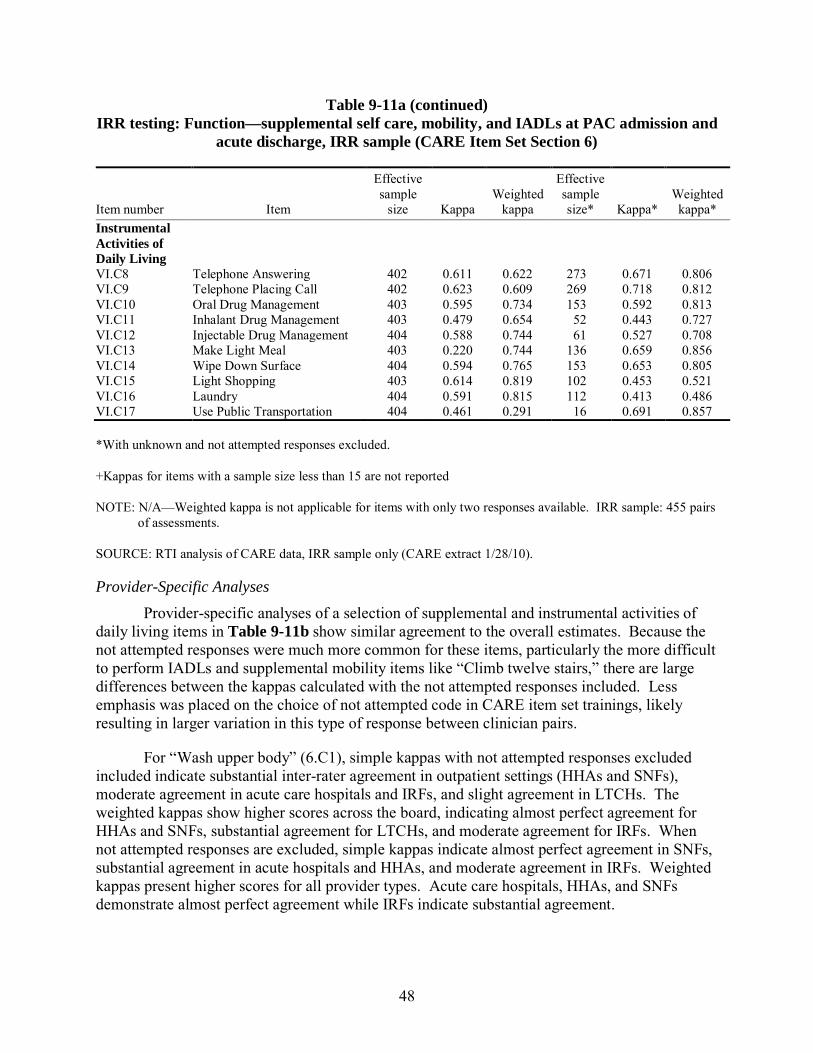
48
Table 9-11a (continued) IRR testing: Function—supplemental self care, mobility, and IADLs at PAC admission and
acute discharge, IRR sample (CARE Item Set Section 6)
Item number Item
Effective sample
size Kappa Weighted
kappa
Effective sample size* Kappa*
Weighted kappa*
Instrumental Activities of Daily Living VI.C8 Telephone Answering 402 0.611 0.622 273 0.671 0.806 VI.C9 Telephone Placing Call 402 0.623 0.609 269 0.718 0.812 VI.C10 Oral Drug Management 403 0.595 0.734 153 0.592 0.813 VI.C11 Inhalant Drug Management 403 0.479 0.654 52 0.443 0.727 VI.C12 Injectable Drug Management 404 0.588 0.744 61 0.527 0.708 VI.C13 Make Light Meal 403 0.220 0.744 136 0.659 0.856 VI.C14 Wipe Down Surface 404 0.594 0.765 153 0.653 0.805 VI.C15 Light Shopping 403 0.614 0.819 102 0.453 0.521 VI.C16 Laundry 404 0.591 0.815 112 0.413 0.486 VI.C17 Use Public Transportation 404 0.461 0.291 16 0.691 0.857
*With unknown and not attempted responses excluded.
+Kappas for items with a sample size less than 15 are not reported
NOTE: N/A—Weighted kappa is not applicable for items with only two responses available. IRR sample: 455 pairs of assessments.
SOURCE: RTI analysis of CARE data, IRR sample only (CARE extract 1/28/10).
Provider-Specific Analyses Provider-specific analyses of a selection of supplemental and instrumental activities of
daily living items in Table 9-11b show similar agreement to the overall estimates. Because the not attempted responses were much more common for these items, particularly the more difficult to perform IADLs and supplemental mobility items like “Climb twelve stairs,” there are large differences between the kappas calculated with the not attempted responses included. Less emphasis was placed on the choice of not attempted code in CARE item set trainings, likely resulting in larger variation in this type of response between clinician pairs.
For “Wash upper body” (6.C1), simple kappas with not attempted responses excluded included indicate substantial inter-rater agreement in outpatient settings (HHAs and SNFs), moderate agreement in acute care hospitals and IRFs, and slight agreement in LTCHs. The weighted kappas show higher scores across the board, indicating almost perfect agreement for HHAs and SNFs, substantial agreement for LTCHs, and moderate agreement for IRFs. When not attempted responses are excluded, simple kappas indicate almost perfect agreement in SNFs, substantial agreement in acute hospitals and HHAs, and moderate agreement in IRFs. Weighted kappas present higher scores for all provider types. Acute care hospitals, HHAs, and SNFs demonstrate almost perfect agreement while IRFs indicate substantial agreement.
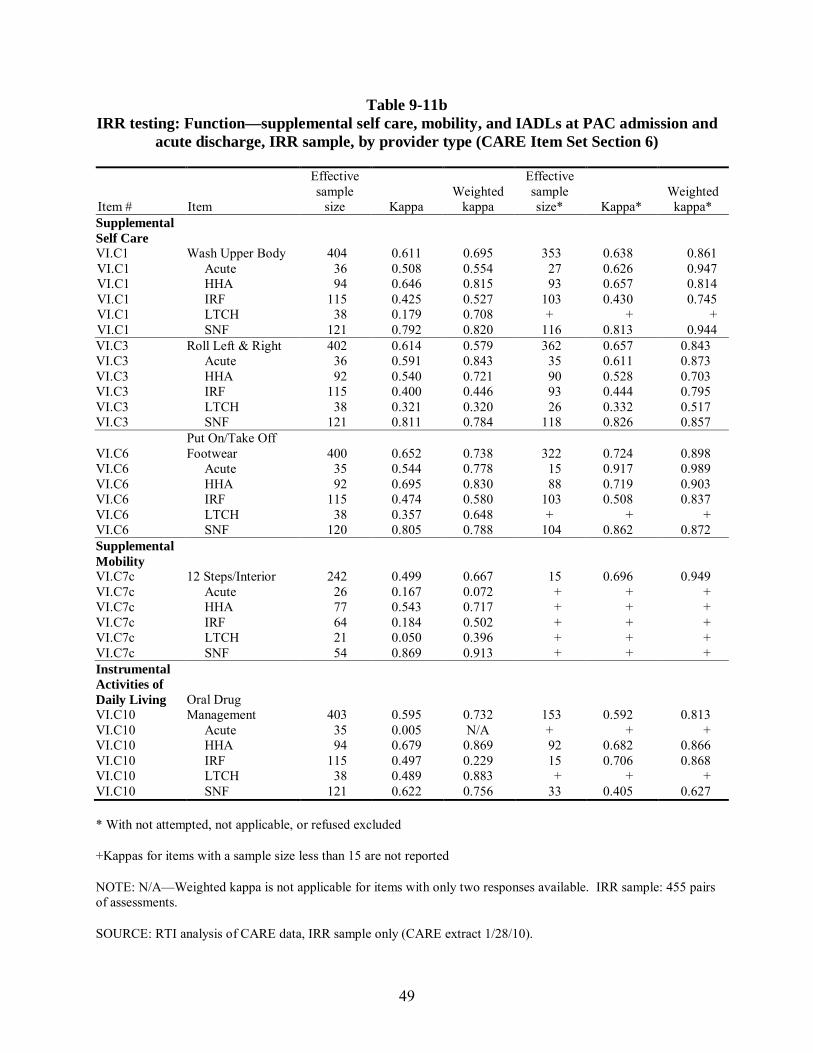
49
Table 9-11b IRR testing: Function—supplemental self care, mobility, and IADLs at PAC admission and
acute discharge, IRR sample, by provider type (CARE Item Set Section 6)
Item # Item
Effective sample
size Kappa Weighted
kappa
Effective sample size* Kappa*
Weighted kappa*
Supplemental Self Care VI.C1 Wash Upper Body 404 0.611 0.695 353 0.638 0.861 VI.C1 Acute 36 0.508 0.554 27 0.626 0.947 VI.C1 HHA 94 0.646 0.815 93 0.657 0.814 VI.C1 IRF 115 0.425 0.527 103 0.430 0.745 VI.C1 LTCH 38 0.179 0.708 + + + VI.C1 SNF 121 0.792 0.820 116 0.813 0.944 VI.C3 Roll Left & Right 402 0.614 0.579 362 0.657 0.843 VI.C3 Acute 36 0.591 0.843 35 0.611 0.873 VI.C3 HHA 92 0.540 0.721 90 0.528 0.703 VI.C3 IRF 115 0.400 0.446 93 0.444 0.795 VI.C3 LTCH 38 0.321 0.320 26 0.332 0.517 VI.C3 SNF 121 0.811 0.784 118 0.826 0.857
VI.C6 Put On/Take Off Footwear 400 0.652 0.738 322 0.724 0.898
VI.C6 Acute 35 0.544 0.778 15 0.917 0.989 VI.C6 HHA 92 0.695 0.830 88 0.719 0.903 VI.C6 IRF 115 0.474 0.580 103 0.508 0.837 VI.C6 LTCH 38 0.357 0.648 + + + VI.C6 SNF 120 0.805 0.788 104 0.862 0.872 Supplemental Mobility VI.C7c 12 Steps/Interior 242 0.499 0.667 15 0.696 0.949 VI.C7c Acute 26 0.167 0.072 + + + VI.C7c HHA 77 0.543 0.717 + + + VI.C7c IRF 64 0.184 0.502 + + + VI.C7c LTCH 21 0.050 0.396 + + + VI.C7c SNF 54 0.869 0.913 + + + Instrumental Activities of Daily Living VI.C10
Oral Drug Management 403 0.595 0.732 153 0.592 0.813
VI.C10 Acute 35 0.005 N/A + + + VI.C10 HHA 94 0.679 0.869 92 0.682 0.866 VI.C10 IRF 115 0.497 0.229 15 0.706 0.868 VI.C10 LTCH 38 0.489 0.883 + + + VI.C10 SNF 121 0.622 0.756 33 0.405 0.627
* With not attempted, not applicable, or refused excluded
+Kappas for items with a sample size less than 15 are not reported
NOTE: N/A—Weighted kappa is not applicable for items with only two responses available. IRR sample: 455 pairs of assessments.
SOURCE: RTI analysis of CARE data, IRR sample only (CARE extract 1/28/10).
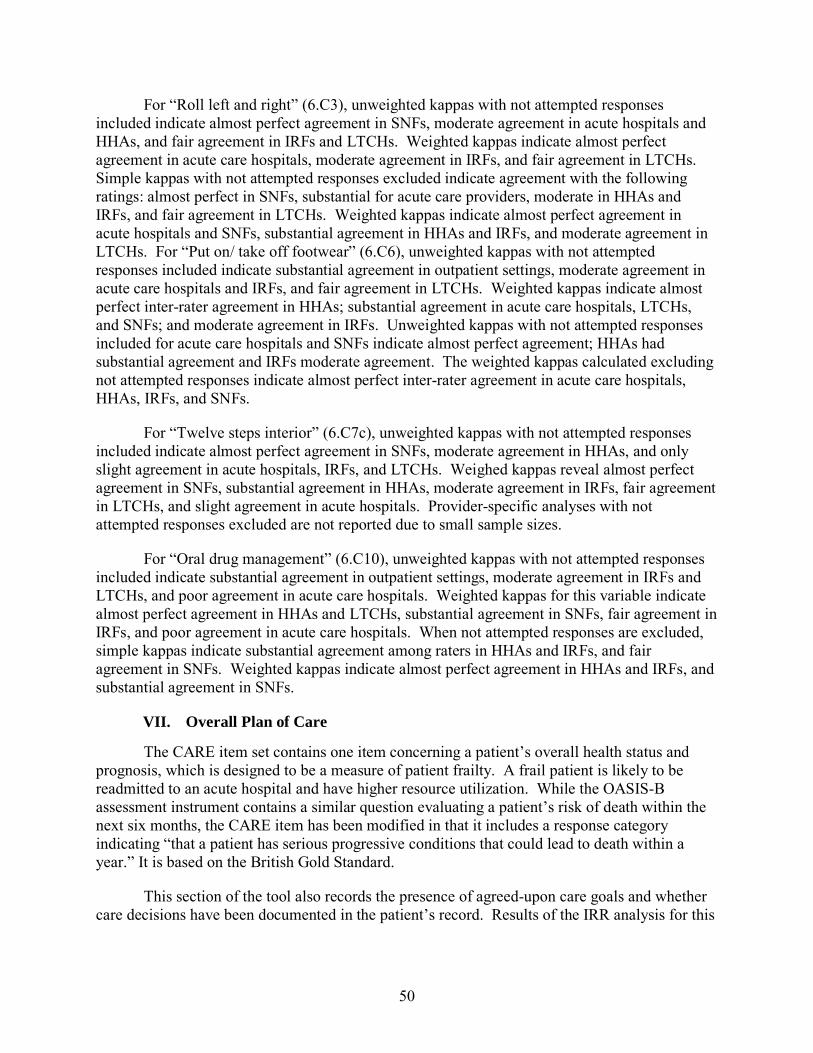
50
For “Roll left and right” (6.C3), unweighted kappas with not attempted responses included indicate almost perfect agreement in SNFs, moderate agreement in acute hospitals and HHAs, and fair agreement in IRFs and LTCHs. Weighted kappas indicate almost perfect agreement in acute care hospitals, moderate agreement in IRFs, and fair agreement in LTCHs. Simple kappas with not attempted responses excluded indicate agreement with the following ratings: almost perfect in SNFs, substantial for acute care providers, moderate in HHAs and IRFs, and fair agreement in LTCHs. Weighted kappas indicate almost perfect agreement in acute hospitals and SNFs, substantial agreement in HHAs and IRFs, and moderate agreement in LTCHs. For “Put on/ take off footwear” (6.C6), unweighted kappas with not attempted responses included indicate substantial agreement in outpatient settings, moderate agreement in acute care hospitals and IRFs, and fair agreement in LTCHs. Weighted kappas indicate almost perfect inter-rater agreement in HHAs; substantial agreement in acute care hospitals, LTCHs, and SNFs; and moderate agreement in IRFs. Unweighted kappas with not attempted responses included for acute care hospitals and SNFs indicate almost perfect agreement; HHAs had substantial agreement and IRFs moderate agreement. The weighted kappas calculated excluding not attempted responses indicate almost perfect inter-rater agreement in acute care hospitals, HHAs, IRFs, and SNFs.
For “Twelve steps interior” (6.C7c), unweighted kappas with not attempted responses included indicate almost perfect agreement in SNFs, moderate agreement in HHAs, and only slight agreement in acute hospitals, IRFs, and LTCHs. Weighed kappas reveal almost perfect agreement in SNFs, substantial agreement in HHAs, moderate agreement in IRFs, fair agreement in LTCHs, and slight agreement in acute hospitals. Provider-specific analyses with not attempted responses excluded are not reported due to small sample sizes.
For “Oral drug management” (6.C10), unweighted kappas with not attempted responses included indicate substantial agreement in outpatient settings, moderate agreement in IRFs and LTCHs, and poor agreement in acute care hospitals. Weighted kappas for this variable indicate almost perfect agreement in HHAs and LTCHs, substantial agreement in SNFs, fair agreement in IRFs, and poor agreement in acute care hospitals. When not attempted responses are excluded, simple kappas indicate substantial agreement among raters in HHAs and IRFs, and fair agreement in SNFs. Weighted kappas indicate almost perfect agreement in HHAs and IRFs, and substantial agreement in SNFs.
VII. Overall Plan of Care
The CARE item set contains one item concerning a patient’s overall health status and prognosis, which is designed to be a measure of patient frailty. A frail patient is likely to be readmitted to an acute hospital and have higher resource utilization. While the OASIS-B assessment instrument contains a similar question evaluating a patient’s risk of death within the next six months, the CARE item has been modified in that it includes a response category indicating “that a patient has serious progressive conditions that could lead to death within a year.” It is based on the British Gold Standard.
This section of the tool also records the presence of agreed-upon care goals and whether care decisions have been documented in the patient’s record. Results of the IRR analysis for this
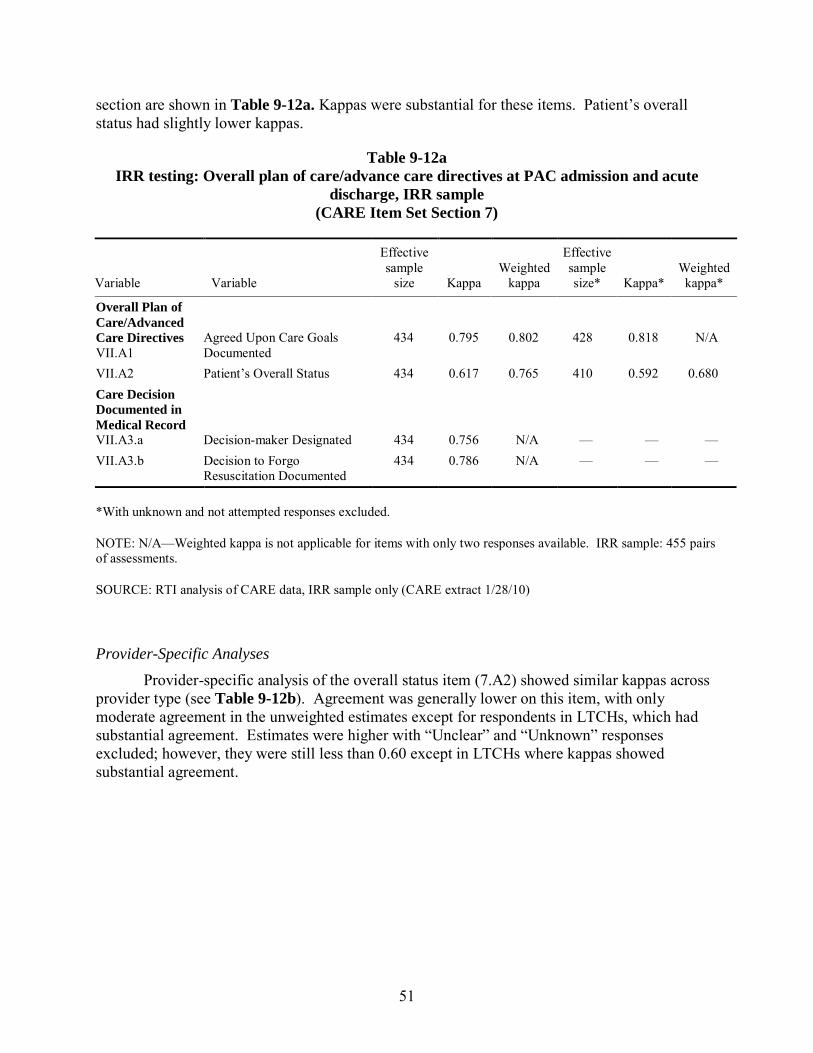
51
section are shown in Table 9-12a. Kappas were substantial for these items. Patient’s overall status had slightly lower kappas.
Table 9-12a IRR testing: Overall plan of care/advance care directives at PAC admission and acute
discharge, IRR sample (CARE Item Set Section 7)
Variable Variable
Effective sample
size Kappa Weighted
kappa
Effective sample size* Kappa*
Weighted kappa*
Overall Plan of Care/Advanced Care Directives VII.A1
Agreed Upon Care Goals Documented
434
0.795
0.802
428
0.818
N/A
VII.A2 Patient’s Overall Status 434 0.617 0.765 410 0.592 0.680 Care Decision Documented in Medical Record VII.A3.a Decision-maker Designated 434 0.756 N/A — — — VII.A3.b Decision to Forgo
Resuscitation Documented 434 0.786 N/A — — —
*With unknown and not attempted responses excluded.
NOTE: N/A—Weighted kappa is not applicable for items with only two responses available. IRR sample: 455 pairs of assessments.
SOURCE: RTI analysis of CARE data, IRR sample only (CARE extract 1/28/10)
Provider-Specific Analyses Provider-specific analysis of the overall status item (7.A2) showed similar kappas across
provider type (see Table 9-12b). Agreement was generally lower on this item, with only moderate agreement in the unweighted estimates except for respondents in LTCHs, which had substantial agreement. Estimates were higher with “Unclear” and “Unknown” responses excluded; however, they were still less than 0.60 except in LTCHs where kappas showed substantial agreement.
52
Table 9-12b IRR testing: Patient overall status at PAC admission and acute discharge, IRR sample, by
provider type (CARE Item Set Section 7)
Variable Variable
Effective sample
size Kappa Weighted
kappa
Effective sample size* Kappa*
Weighted kappa*
VII.A2 Patient’s Overall Status 434 0.617 0.765 410 0.592 0.680 VII.A2 Acute 64 0.545 0.666 64 0.545 0.666 VII.A2 HHA 102 0.554 0.726 102 0.554 0.726 VII.A2 IRF 101 0.615 0.813 80 0.425 0.353 VII.A2 LTCH 49 0.759 0.696 48 0.787 0.739 VII.A2 SNF 118 0.553 0.489 116 0.566 0.553
*With unclear or unknown excluded.
NOTE: IRR sample: 455 pairs of assessments.
SOURCE: RTI analysis of CARE data, IRR sample only (CARE extract 1/28/10).
9.9 Summary
Reliability estimates for the vast majority of items evaluated were substantial or almost perfect. Caution should be exercised in interpreting the few lower kappa items that were likely the result of low prevalence of the item being measured (e.g., persistent vegetative state). The kappa results for CARE items are consistently in line with the reported agreement statistics available from items testing equivalent concepts on MDS, OASIS, and FIM®.
53
SECTION 10 VIDEO RELIABILITY TESTING OF THE CARE ITEM SET
10.1 Overview
This section presents results from the second set of reliability tests, which are designed to measure the level of clinician agreement across levels of care. A wide range of clinicians in each setting were asked to assess a standard set of patients presented through a videotape of a patient evaluation. This ensured the same information was presented to each clinician and allowed examination of differences in scoring effects among different types of clinicians examining the “same” patient. This section summarizes data collection efforts and results from the video testing initiative.
10.2 Background
The goal of the CARE item development is to standardize items used across multiple health care settings, unlike the items in the existing instruments. Therefore, it will be important that CARE items capture sufficient variation in patient health status both within and across populations. In addition, it will be important to examine whether the ability to consistently measure a patient’s health status is impacted by differences in disciplinary background (e.g., registered nurse, physical therapist, occupational therapist, etc.) or level of care (e.g., acute hospital, LTCH, IRF, SNF, and HHA). In this section we evaluate this question by analyzing the ability of clinicians from varying disciplines and provider settings to assess a standard set of nine patients presented via video using the CARE items.
10.3 Methods
Video Criteria and Development The videos for this part of the Reliability testing were developed by key RTI project staff,
clinicians, and subcontractors, with input from CMS. The team developed a total of nine videos to distribute to the providers participating in video testing. The patient “case studies” in each of the videos vary by medical complexity, functional abilities, and cognitive impairments. The nine videos allowed patients to be classified as high, medium, or low on each of these three factors. Each facility or agency received three videos where at least one video demonstrated the following elements: cognitive impairments, skin integrity problems, a wheelchair dependent case study patient, and a variety of mid-level functional items. The mid-level functional items were considered to be the most challenging for clinicians to score and are thus of particular interest in establishing reliability.
The Rehabilitation Institute of Chicago (RIC), a subcontractor on the CARE item set development project, created, revised, and edited the nine videos for testing use. Each video underwent two phases of review. First, the reliability team internally reviewed the videos through a multistep process. This process began with the range of clinicians from RTI, RIC, and the Visiting Nurse Service of New York (VNS-NY) watching the videos, scoring the corresponding tools, and submitting responses anonymously. Once the scores were compiled, the clinicians met to discuss the content of the videos as well as any discrepancies in scoring; at least five clinicians with various clinical backgrounds (nursing, rehabilitation, and home health)
54
attended each of the video review meetings. The clinicians agreed to and submitted clarifying revisions and edits for each of the videos. These revisions commonly consisted of clarifying voiceovers. The clinical team repeated the process of viewing, scoring, discussing, editing, and finalizing the videos until all nine were ready for distribution. An internal team clinical consensus in the scoring of each item was achieved using this method.
This work provides valuable insight on whether the CARE items can be used reliably by clinicians of diverse clinical backgrounds and provider settings. In addition, because there is relatively high turnover of staff in health care settings, the ability of a brief training to produce acceptably consistent ratings is important.
10.4 Sample Selection, Data Collection, and Instrument
RTI estimated the required sample size for this work and determined that approximately 5–10 unique providers should be recruited from each of the five levels of care (Acute Hospitals, Home Health Agencies, Inpatient Rehabilitation Facilities, Long-Term Care Hospitals, and Skilled Nursing Facilities). Each CARE item set clinician involved in reliability testing was asked to view three short videos and assess these patient “case studies” in accordance with the guidelines and protocols developed by RTI. Each video was approximately 20 minutes in length and had a corresponding CARE item set, with the items arranged in the sequence in which they appeared in the respective video.
Table 10-1 provides a brief description of the clinical characteristics of each of the nine video “patients.” The impairment levels of the patient “case studies” in the videos is classified as high, medium, or low, and each facility or agency received at least one video including each of the following elements: cognitive impairments, skin integrity problems, a wheelchair dependent case study patient, and a variety of mid-level functional items. Please see Appendix B for fuller profiles of each of the case study patients.
10.5 Recruitment
Participants in this part of the study were again selected from the nearly 150 providers within the PAC PRD market areas focusing particularly on providers that were mid-way through their CARE data collection; many of the same providers that participated in the inter-rater reliability tests participated in this component. RTI recruited 28 providers from the set of providers already enrolled in the PAC PRD data collection. See Table 10-2 for counts of providers and the number of assessments submitted by provider type.
All CARE-trained clinicians from acute hospitals, LTCHs, IRFs, SNFs, and HHAs participating in the inter-rater reliability testing were asked to watch three short videos and assess patient “case studies.” Only staff previously collecting CARE information in the demonstration participated in video reliability testing. Each demonstration site identified the clinician(s) who would participate in this part of the data collection. To account for different lengths of time elapsed since the initial PAC Demonstration CARE training in each market, each clinician participating in the video testing attended a 1.5-hour CARE refresher training prior to beginning the data collection. Following the CARE refresher trainings, RTI also reviewed the video data collection instructions with the demonstration project coordinators.
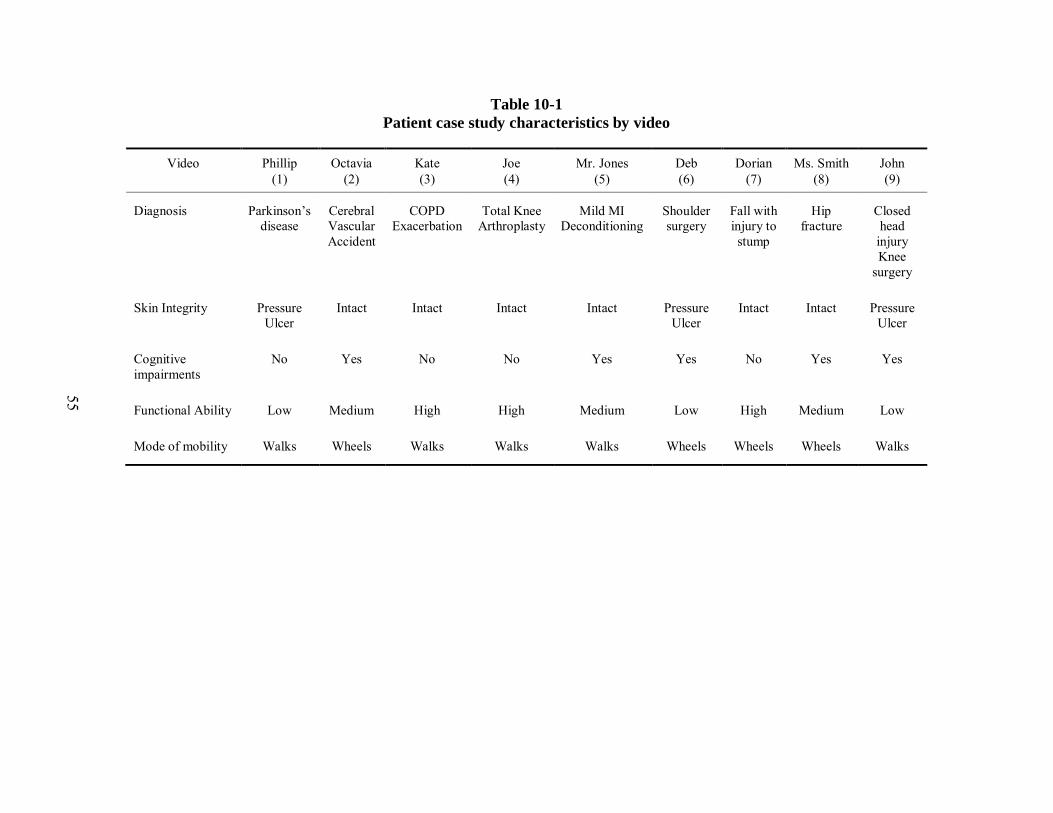
55
Table 10-1 Patient case study characteristics by video
Video Phillip (1)
Octavia (2)
Kate (3)
Joe (4)
Mr. Jones (5)
Deb (6)
Dorian (7)
Ms. Smith (8)
John (9)
Diagnosis Parkinson’s disease
Cerebral Vascular Accident
COPD Exacerbation
Total Knee Arthroplasty
Mild MI Deconditioning
Shoulder surgery
Fall with injury to stump
Hip fracture
Closed head
injury Knee
surgery
Skin Integrity Pressure Ulcer
Intact Intact Intact Intact Pressure Ulcer
Intact Intact Pressure Ulcer
Cognitive impairments
No Yes No No Yes Yes No Yes Yes
Functional Ability Low Medium High High Medium Low High Medium Low
Mode of mobility Walks Wheels Walks Walks Walks Wheels Wheels Wheels Walks
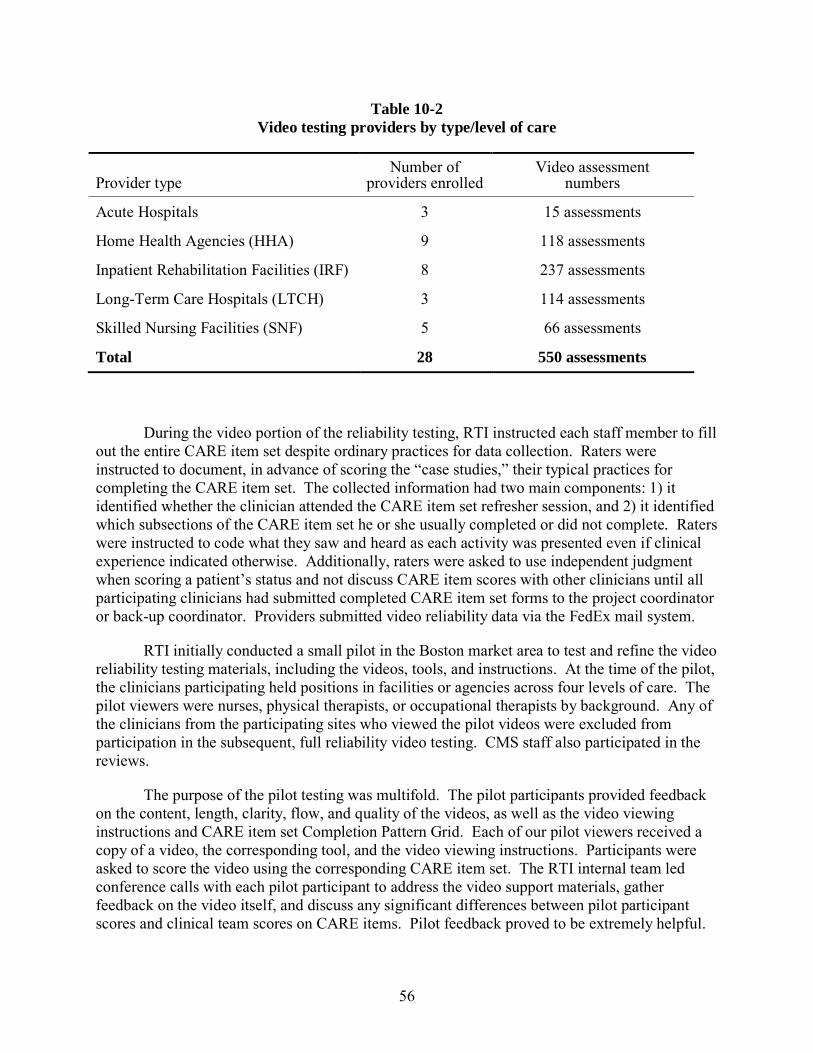
56
Table 10-2 Video testing providers by type/level of care
Provider type Number of
providers enrolled Video assessment
numbers
Acute Hospitals 3 15 assessments
Home Health Agencies (HHA) 9 118 assessments
Inpatient Rehabilitation Facilities (IRF) 8 237 assessments
Long-Term Care Hospitals (LTCH) 3 114 assessments
Skilled Nursing Facilities (SNF) 5 66 assessments
Total 28 550 assessments
During the video portion of the reliability testing, RTI instructed each staff member to fill out the entire CARE item set despite ordinary practices for data collection. Raters were instructed to document, in advance of scoring the “case studies,” their typical practices for completing the CARE item set. The collected information had two main components: 1) it identified whether the clinician attended the CARE item set refresher session, and 2) it identified which subsections of the CARE item set he or she usually completed or did not complete. Raters were instructed to code what they saw and heard as each activity was presented even if clinical experience indicated otherwise. Additionally, raters were asked to use independent judgment when scoring a patient’s status and not discuss CARE item scores with other clinicians until all participating clinicians had submitted completed CARE item set forms to the project coordinator or back-up coordinator. Providers submitted video reliability data via the FedEx mail system.
RTI initially conducted a small pilot in the Boston market area to test and refine the video reliability testing materials, including the videos, tools, and instructions. At the time of the pilot, the clinicians participating held positions in facilities or agencies across four levels of care. The pilot viewers were nurses, physical therapists, or occupational therapists by background. Any of the clinicians from the participating sites who viewed the pilot videos were excluded from participation in the subsequent, full reliability video testing. CMS staff also participated in the reviews.
The purpose of the pilot testing was multifold. The pilot participants provided feedback on the content, length, clarity, flow, and quality of the videos, as well as the video viewing instructions and CARE item set Completion Pattern Grid. Each of our pilot viewers received a copy of a video, the corresponding tool, and the video viewing instructions. Participants were asked to score the video using the corresponding CARE item set. The RTI internal team led conference calls with each pilot participant to address the video support materials, gather feedback on the video itself, and discuss any significant differences between pilot participant scores and clinical team scores on CARE items. Pilot feedback proved to be extremely helpful.
57
The pilot viewers provided comments and suggestions on several aspects of the videos. Based on this feedback, further revisions were made prior to video release.
10.6 Item Selection for Testing
CARE item set items selected for video testing fell into one (or more) of the following categories: items that were subjective in nature, items that have not previously appeared in CMS tools (i.e., new CARE items), items that influence payments or are used in payment models currently, or items not previously tested in certain settings.
10.7 Analyses
Two primary analytic approaches were used for assessing the video reliability of the CARE item set items, adhering closely to the methods used by Fricke et al. to assess the reliability of the FIM® items using videos (Fricke et al., 1993). First, for each CARE item included in at least one of the nine videos, percent agreement was calculated with the mode response. Unlike the approach used by Fricke et al., RTI did not consider agreement at one response level above and below the mode; instead using a stricter approach looking at direct modal agreement only. In the second approach, percent agreement with the internal clinical team’s consensus response was also calculated. This second measure not only gives an indication of item reliability, but reflects on training consistency.
10.8 Results
I. Sample: Assessor Demographics
Tables 10-3 and 10-4 show the basic characteristics of the clinicians who assessed the videos, both in terms of their discipline and provider setting.
Table 10-3 indicates that the highest proportion of assessments was completed by registered nurses (RNs), at 47%, followed by physical therapists (PTs) at 21% and occupational therapists (OTs) at 14%. The category of “Other,” which would incorporate licensed nurse practitioners (LPNs) made up 8% of the assessments, while case managers and speech therapists contributed 6% and 5%, respectively. In turn, Table 10-4 shows that IRFs contributed the most video assessments (43%), followed by HHAs (22%), LTCHs (21%), and SNFs (12%). Due to the small number of clinicians involved in collecting CARE data in the acute setting, the video assessments contributed from this setting was notably lower, at 3%.
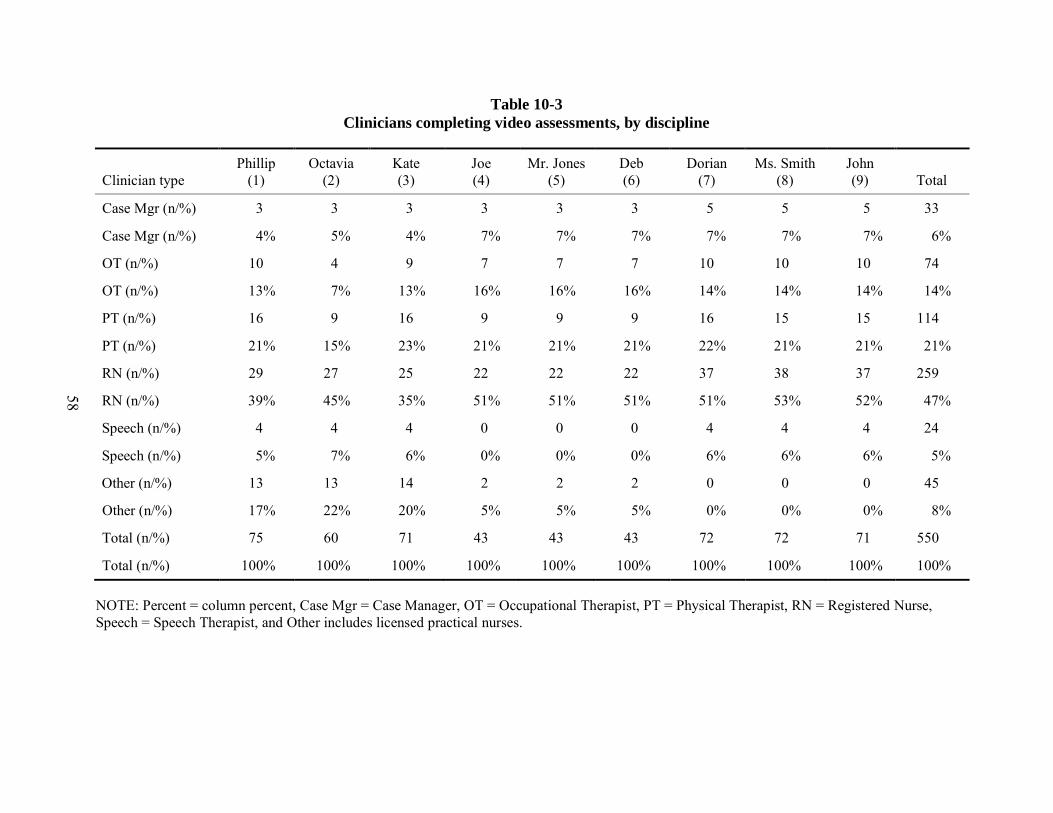
58
Table 10-3 Clinicians completing video assessments, by discipline
Clinician type Phillip
(1) Octavia
(2) Kate (3)
Joe (4)
Mr. Jones (5)
Deb (6)
Dorian (7)
Ms. Smith (8)
John (9) Total
Case Mgr (n/%) 3 3 3 3 3 3 5 5 5 33
Case Mgr (n/%) 4% 5% 4% 7% 7% 7% 7% 7% 7% 6%
OT (n/%) 10 4 9 7 7 7 10 10 10 74
OT (n/%) 13% 7% 13% 16% 16% 16% 14% 14% 14% 14%
PT (n/%) 16 9 16 9 9 9 16 15 15 114
PT (n/%) 21% 15% 23% 21% 21% 21% 22% 21% 21% 21%
RN (n/%) 29 27 25 22 22 22 37 38 37 259
RN (n/%) 39% 45% 35% 51% 51% 51% 51% 53% 52% 47%
Speech (n/%) 4 4 4 0 0 0 4 4 4 24
Speech (n/%) 5% 7% 6% 0% 0% 0% 6% 6% 6% 5%
Other (n/%) 13 13 14 2 2 2 0 0 0 45
Other (n/%) 17% 22% 20% 5% 5% 5% 0% 0% 0% 8%
Total (n/%) 75 60 71 43 43 43 72 72 71 550
Total (n/%) 100% 100% 100% 100% 100% 100% 100% 100% 100% 100%
NOTE: Percent = column percent, Case Mgr = Case Manager, OT = Occupational Therapist, PT = Physical Therapist, RN = Registered Nurse, Speech = Speech Therapist, and Other includes licensed practical nurses.
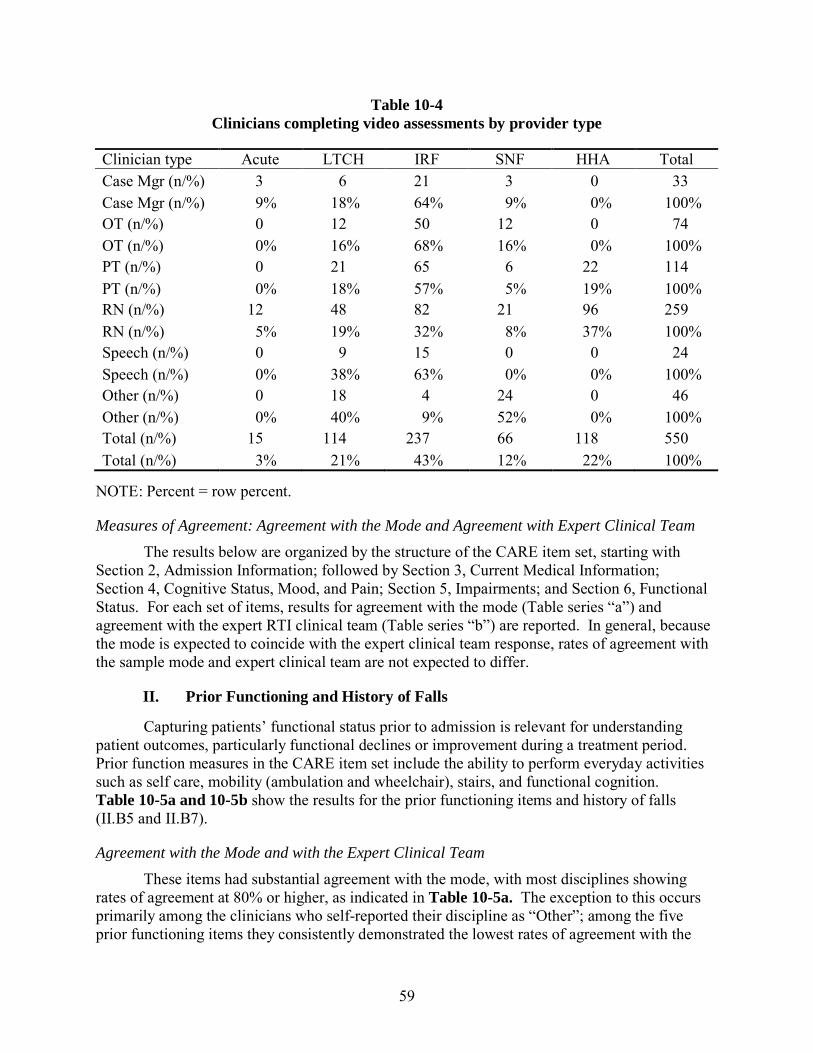
59
Table 10-4 Clinicians completing video assessments by provider type
Clinician type Acute LTCH IRF SNF HHA Total Case Mgr (n/%) 3 6 21 3 0 33 Case Mgr (n/%) 9% 18% 64% 9% 0% 100% OT (n/%) 0 12 50 12 0 74 OT (n/%) 0% 16% 68% 16% 0% 100% PT (n/%) 0 21 65 6 22 114 PT (n/%) 0% 18% 57% 5% 19% 100% RN (n/%) 12 48 82 21 96 259 RN (n/%) 5% 19% 32% 8% 37% 100% Speech (n/%) 0 9 15 0 0 24 Speech (n/%) 0% 38% 63% 0% 0% 100% Other (n/%) 0 18 4 24 0 46 Other (n/%) 0% 40% 9% 52% 0% 100% Total (n/%) 15 114 237 66 118 550 Total (n/%) 3% 21% 43% 12% 22% 100%
NOTE: Percent = row percent.
Measures of Agreement: Agreement with the Mode and Agreement with Expert Clinical Team The results below are organized by the structure of the CARE item set, starting with
Section 2, Admission Information; followed by Section 3, Current Medical Information; Section 4, Cognitive Status, Mood, and Pain; Section 5, Impairments; and Section 6, Functional Status. For each set of items, results for agreement with the mode (Table series “a”) and agreement with the expert RTI clinical team (Table series “b”) are reported. In general, because the mode is expected to coincide with the expert clinical team response, rates of agreement with the sample mode and expert clinical team are not expected to differ.
II. Prior Functioning and History of Falls
Capturing patients’ functional status prior to admission is relevant for understanding patient outcomes, particularly functional declines or improvement during a treatment period. Prior function measures in the CARE item set include the ability to perform everyday activities such as self care, mobility (ambulation and wheelchair), stairs, and functional cognition. Table 10-5a and 10-5b show the results for the prior functioning items and history of falls (II.B5 and II.B7).
Agreement with the Mode and with the Expert Clinical Team These items had substantial agreement with the mode, with most disciplines showing
rates of agreement at 80% or higher, as indicated in Table 10-5a. The exception to this occurs primarily among the clinicians who self-reported their discipline as “Other”; among the five prior functioning items they consistently demonstrated the lowest rates of agreement with the
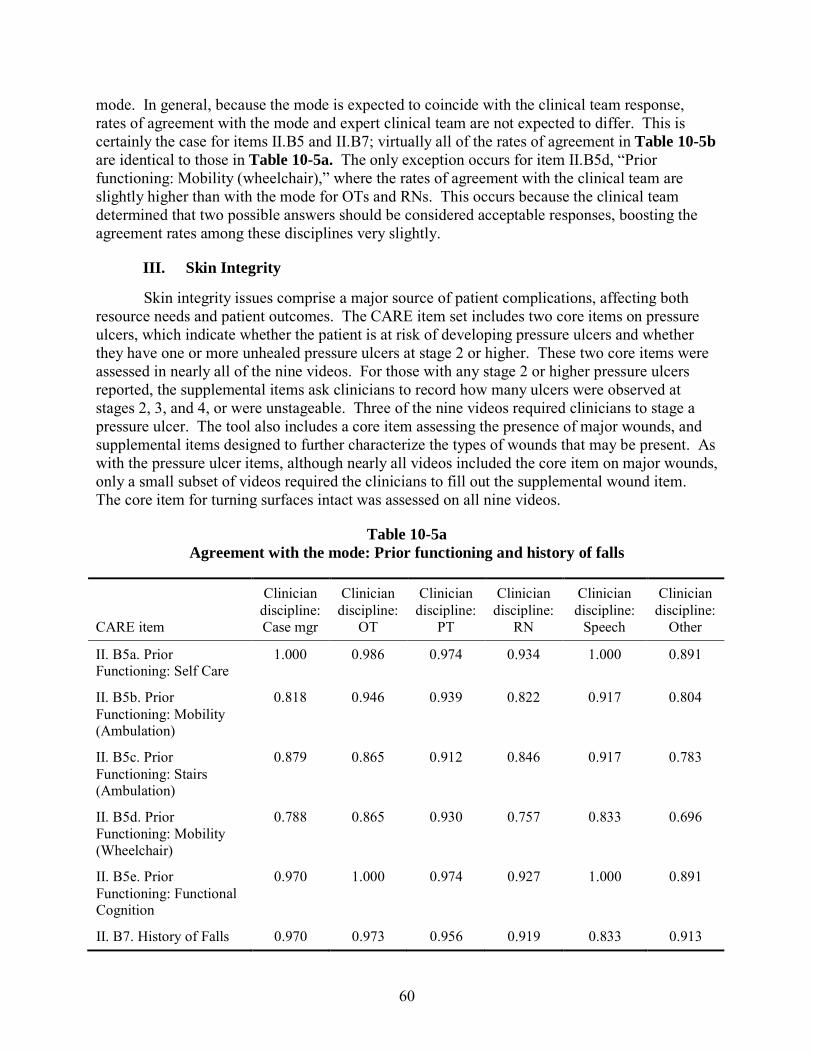
60
mode. In general, because the mode is expected to coincide with the clinical team response, rates of agreement with the mode and expert clinical team are not expected to differ. This is certainly the case for items II.B5 and II.B7; virtually all of the rates of agreement in Table 10-5b are identical to those in Table 10-5a. The only exception occurs for item II.B5d, “Prior functioning: Mobility (wheelchair),” where the rates of agreement with the clinical team are slightly higher than with the mode for OTs and RNs. This occurs because the clinical team determined that two possible answers should be considered acceptable responses, boosting the agreement rates among these disciplines very slightly.
III. Skin Integrity
Skin integrity issues comprise a major source of patient complications, affecting both resource needs and patient outcomes. The CARE item set includes two core items on pressure ulcers, which indicate whether the patient is at risk of developing pressure ulcers and whether they have one or more unhealed pressure ulcers at stage 2 or higher. These two core items were assessed in nearly all of the nine videos. For those with any stage 2 or higher pressure ulcers reported, the supplemental items ask clinicians to record how many ulcers were observed at stages 2, 3, and 4, or were unstageable. Three of the nine videos required clinicians to stage a pressure ulcer. The tool also includes a core item assessing the presence of major wounds, and supplemental items designed to further characterize the types of wounds that may be present. As with the pressure ulcer items, although nearly all videos included the core item on major wounds, only a small subset of videos required the clinicians to fill out the supplemental wound item. The core item for turning surfaces intact was assessed on all nine videos.
Table 10-5a Agreement with the mode: Prior functioning and history of falls
CARE item
Clinician discipline: Case mgr
Clinician discipline:
OT
Clinician discipline:
PT
Clinician discipline:
RN
Clinician discipline:
Speech
Clinician discipline:
Other
II. B5a. Prior Functioning: Self Care
1.000 0.986 0.974 0.934 1.000 0.891
II. B5b. Prior Functioning: Mobility (Ambulation)
0.818 0.946 0.939 0.822 0.917 0.804
II. B5c. Prior Functioning: Stairs (Ambulation)
0.879 0.865 0.912 0.846 0.917 0.783
II. B5d. Prior Functioning: Mobility (Wheelchair)
0.788 0.865 0.930 0.757 0.833 0.696
II. B5e. Prior Functioning: Functional Cognition
0.970 1.000 0.974 0.927 1.000 0.891
II. B7. History of Falls 0.970 0.973 0.956 0.919 0.833 0.913
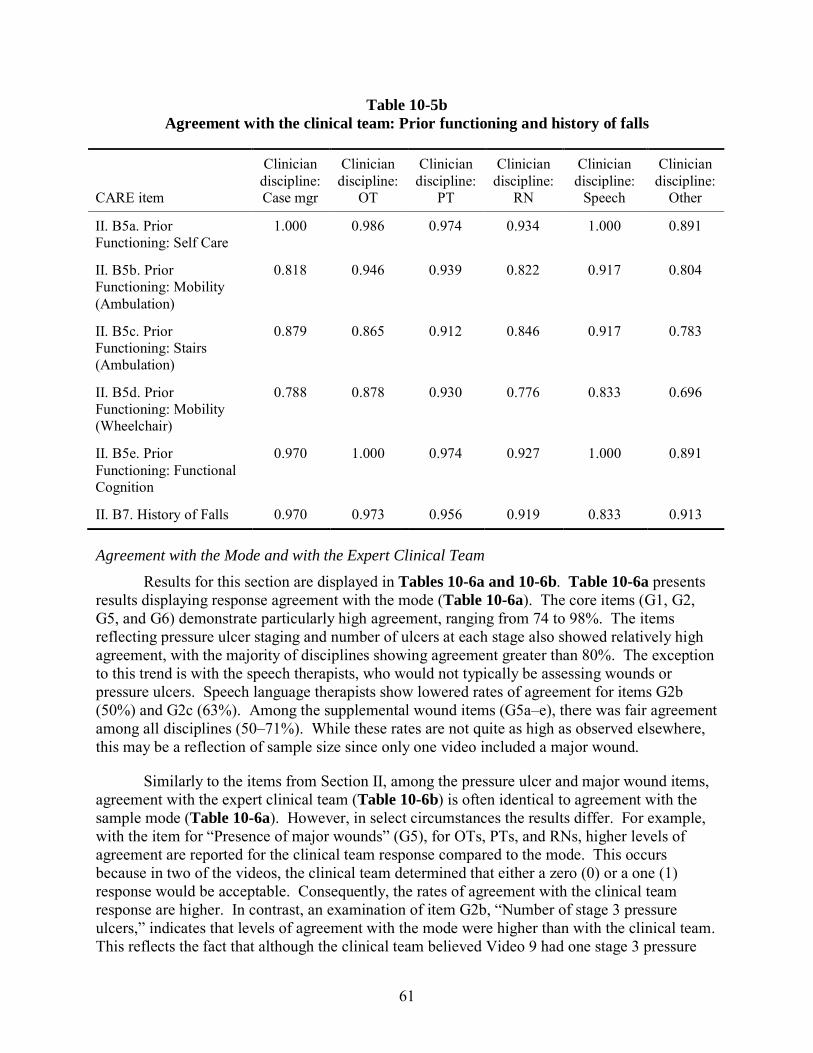
61
Table 10-5b Agreement with the clinical team: Prior functioning and history of falls
CARE item
Clinician discipline: Case mgr
Clinician discipline:
OT
Clinician discipline:
PT
Clinician discipline:
RN
Clinician discipline:
Speech
Clinician discipline:
Other
II. B5a. Prior Functioning: Self Care
1.000 0.986 0.974 0.934 1.000 0.891
II. B5b. Prior Functioning: Mobility (Ambulation)
0.818 0.946 0.939 0.822 0.917 0.804
II. B5c. Prior Functioning: Stairs (Ambulation)
0.879 0.865 0.912 0.846 0.917 0.783
II. B5d. Prior Functioning: Mobility (Wheelchair)
0.788 0.878 0.930 0.776 0.833 0.696
II. B5e. Prior Functioning: Functional Cognition
0.970 1.000 0.974 0.927 1.000 0.891
II. B7. History of Falls 0.970 0.973 0.956 0.919 0.833 0.913
Agreement with the Mode and with the Expert Clinical Team Results for this section are displayed in Tables 10-6a and 10-6b. Table 10-6a presents
results displaying response agreement with the mode (Table 10-6a). The core items (G1, G2, G5, and G6) demonstrate particularly high agreement, ranging from 74 to 98%. The items reflecting pressure ulcer staging and number of ulcers at each stage also showed relatively high agreement, with the majority of disciplines showing agreement greater than 80%. The exception to this trend is with the speech therapists, who would not typically be assessing wounds or pressure ulcers. Speech language therapists show lowered rates of agreement for items G2b (50%) and G2c (63%). Among the supplemental wound items (G5a–e), there was fair agreement among all disciplines (50–71%). While these rates are not quite as high as observed elsewhere, this may be a reflection of sample size since only one video included a major wound.
Similarly to the items from Section II, among the pressure ulcer and major wound items, agreement with the expert clinical team (Table 10-6b) is often identical to agreement with the sample mode (Table 10-6a). However, in select circumstances the results differ. For example, with the item for “Presence of major wounds” (G5), for OTs, PTs, and RNs, higher levels of agreement are reported for the clinical team response compared to the mode. This occurs because in two of the videos, the clinical team determined that either a zero (0) or a one (1) response would be acceptable. Consequently, the rates of agreement with the clinical team response are higher. In contrast, an examination of item G2b, “Number of stage 3 pressure ulcers,” indicates that levels of agreement with the mode were higher than with the clinical team. This reflects the fact that although the clinical team believed Video 9 had one stage 3 pressure
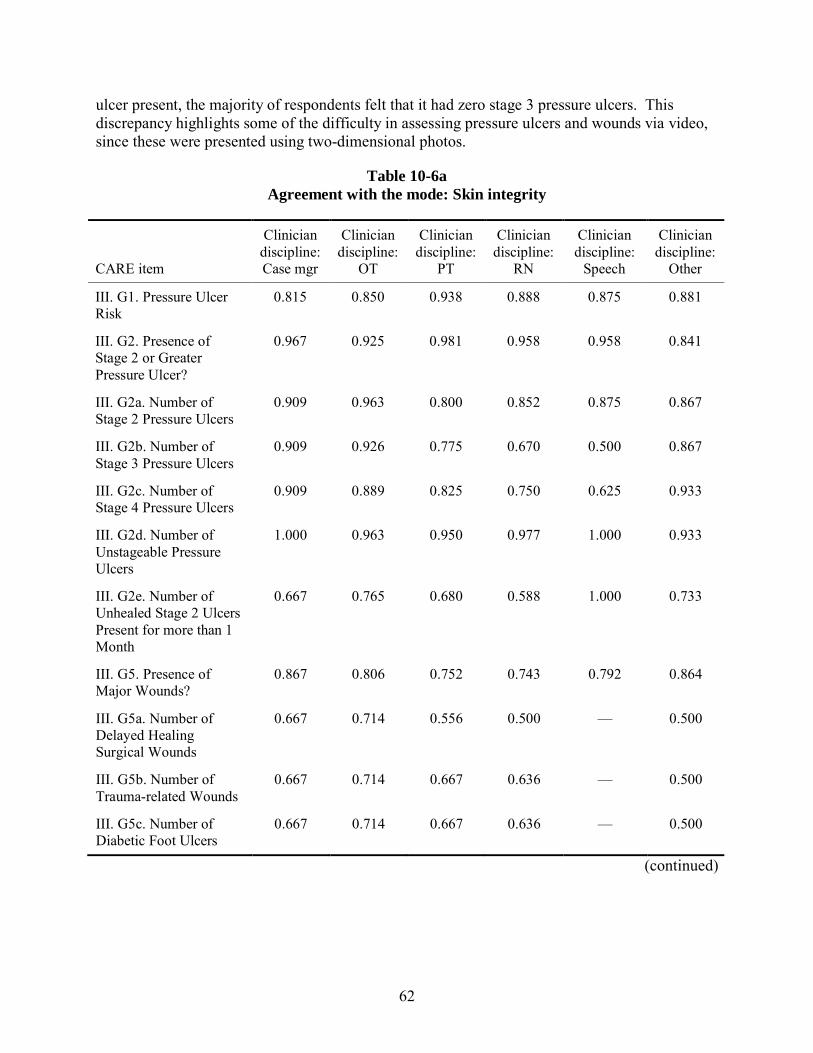
62
ulcer present, the majority of respondents felt that it had zero stage 3 pressure ulcers. This discrepancy highlights some of the difficulty in assessing pressure ulcers and wounds via video, since these were presented using two-dimensional photos.
Table 10-6a Agreement with the mode: Skin integrity
CARE item
Clinician discipline: Case mgr
Clinician discipline:
OT
Clinician discipline:
PT
Clinician discipline:
RN
Clinician discipline:
Speech
Clinician discipline:
Other
III. G1. Pressure Ulcer Risk
0.815 0.850 0.938 0.888 0.875 0.881
III. G2. Presence of Stage 2 or Greater Pressure Ulcer?
0.967 0.925 0.981 0.958 0.958 0.841
III. G2a. Number of Stage 2 Pressure Ulcers
0.909 0.963 0.800 0.852 0.875 0.867
III. G2b. Number of Stage 3 Pressure Ulcers
0.909 0.926 0.775 0.670 0.500 0.867
III. G2c. Number of Stage 4 Pressure Ulcers
0.909 0.889 0.825 0.750 0.625 0.933
III. G2d. Number of Unstageable Pressure Ulcers
1.000 0.963 0.950 0.977 1.000 0.933
III. G2e. Number of Unhealed Stage 2 Ulcers Present for more than 1 Month
0.667 0.765 0.680 0.588 1.000 0.733
III. G5. Presence of Major Wounds?
0.867 0.806 0.752 0.743 0.792 0.864
III. G5a. Number of Delayed Healing Surgical Wounds
0.667 0.714 0.556 0.500 — 0.500
III. G5b. Number of Trauma-related Wounds
0.667 0.714 0.667 0.636 — 0.500
III. G5c. Number of Diabetic Foot Ulcers
0.667 0.714 0.667 0.636 — 0.500
(continued)
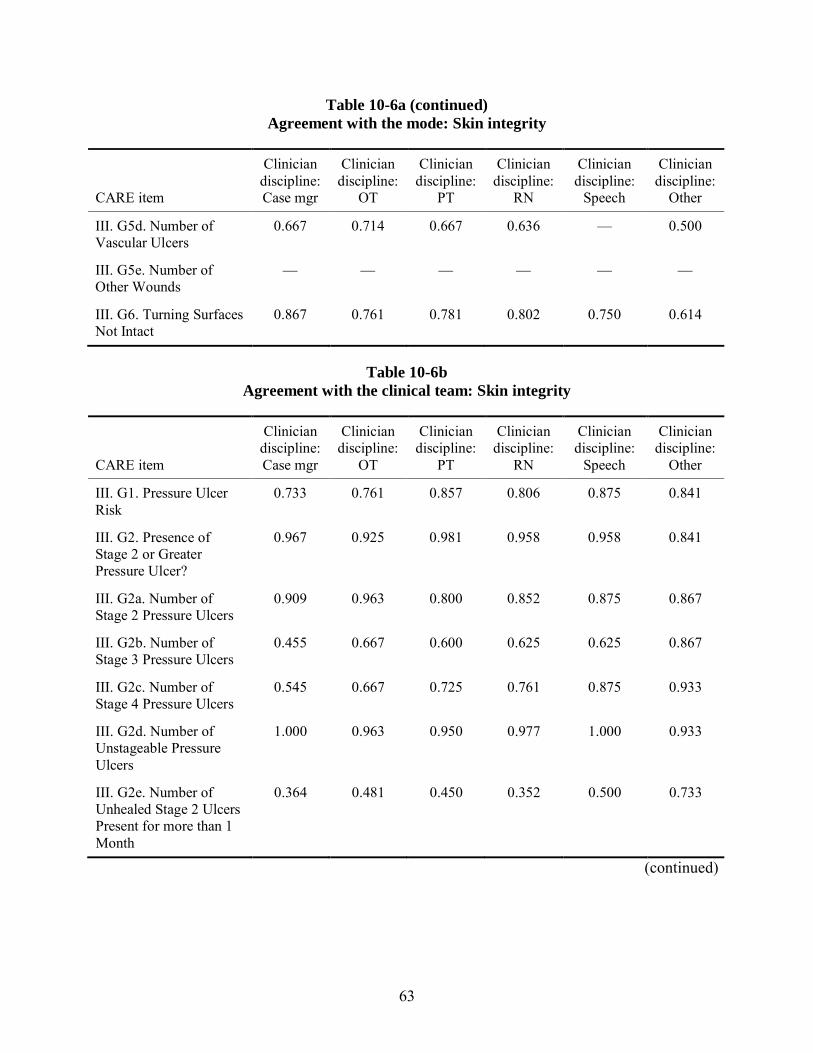
63
Table 10-6a (continued) Agreement with the mode: Skin integrity
CARE item
Clinician discipline: Case mgr
Clinician discipline:
OT
Clinician discipline:
PT
Clinician discipline:
RN
Clinician discipline:
Speech
Clinician discipline:
Other
III. G5d. Number of Vascular Ulcers
0.667 0.714 0.667 0.636 — 0.500
III. G5e. Number of Other Wounds
— — — — — —
III. G6. Turning Surfaces Not Intact
0.867 0.761 0.781 0.802 0.750 0.614
Table 10-6b Agreement with the clinical team: Skin integrity
CARE item
Clinician discipline: Case mgr
Clinician discipline:
OT
Clinician discipline:
PT
Clinician discipline:
RN
Clinician discipline:
Speech
Clinician discipline:
Other
III. G1. Pressure Ulcer Risk
0.733 0.761 0.857 0.806 0.875 0.841
III. G2. Presence of Stage 2 or Greater Pressure Ulcer?
0.967 0.925 0.981 0.958 0.958 0.841
III. G2a. Number of Stage 2 Pressure Ulcers
0.909 0.963 0.800 0.852 0.875 0.867
III. G2b. Number of Stage 3 Pressure Ulcers
0.455 0.667 0.600 0.625 0.625 0.867
III. G2c. Number of Stage 4 Pressure Ulcers
0.545 0.667 0.725 0.761 0.875 0.933
III. G2d. Number of Unstageable Pressure Ulcers
1.000 0.963 0.950 0.977 1.000 0.933
III. G2e. Number of Unhealed Stage 2 Ulcers Present for more than 1 Month
0.364 0.481 0.450 0.352 0.500 0.733
(continued)
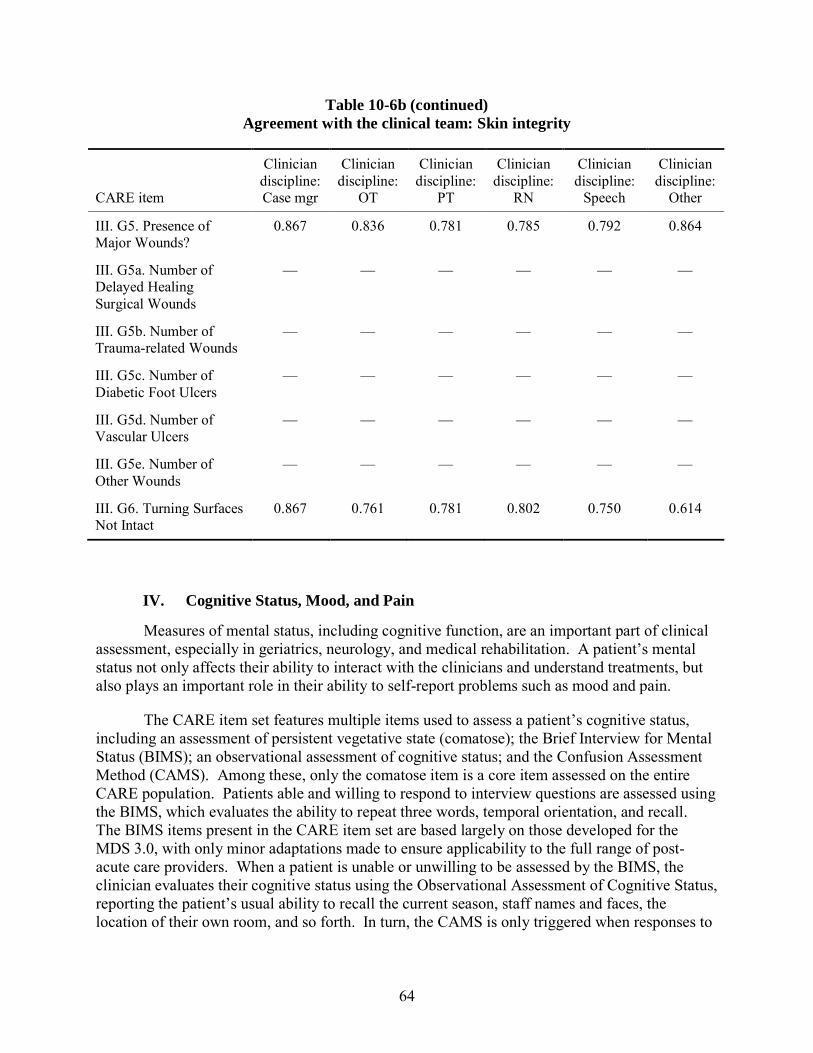
64
Table 10-6b (continued) Agreement with the clinical team: Skin integrity
CARE item
Clinician discipline: Case mgr
Clinician discipline:
OT
Clinician discipline:
PT
Clinician discipline:
RN
Clinician discipline:
Speech
Clinician discipline:
Other
III. G5. Presence of Major Wounds?
0.867 0.836 0.781 0.785 0.792 0.864
III. G5a. Number of Delayed Healing Surgical Wounds
— — — — — —
III. G5b. Number of Trauma-related Wounds
— — — — — —
III. G5c. Number of Diabetic Foot Ulcers
— — — — — —
III. G5d. Number of Vascular Ulcers
— — — — — —
III. G5e. Number of Other Wounds
— — — — — —
III. G6. Turning Surfaces Not Intact
0.867 0.761 0.781 0.802 0.750 0.614
IV. Cognitive Status, Mood, and Pain
Measures of mental status, including cognitive function, are an important part of clinical assessment, especially in geriatrics, neurology, and medical rehabilitation. A patient’s mental status not only affects their ability to interact with the clinicians and understand treatments, but also plays an important role in their ability to self-report problems such as mood and pain.
The CARE item set features multiple items used to assess a patient’s cognitive status, including an assessment of persistent vegetative state (comatose); the Brief Interview for Mental Status (BIMS); an observational assessment of cognitive status; and the Confusion Assessment Method (CAMS). Among these, only the comatose item is a core item assessed on the entire CARE population. Patients able and willing to respond to interview questions are assessed using the BIMS, which evaluates the ability to repeat three words, temporal orientation, and recall. The BIMS items present in the CARE item set are based largely on those developed for the MDS 3.0, with only minor adaptations made to ensure applicability to the full range of post-acute care providers. When a patient is unable or unwilling to be assessed by the BIMS, the clinician evaluates their cognitive status using the Observational Assessment of Cognitive Status, reporting the patient’s usual ability to recall the current season, staff names and faces, the location of their own room, and so forth. In turn, the CAMS is only triggered when responses to
65
the BIMS suggest the presence of cognitive impairment. The CAMS, which is also derived from a similar measure on the MDS 3.0, is used to identify symptoms of delirium and subdelirium.
Among the nine videos, the items that comprise the BIMS are assessed on nearly all of them. The CAMS is triggered on 3 videos, and the observational assessment of cognitive status is utilized once.
The mood items on the CARE item set include items from the Patient Health Questionnaire-2 (PHQ-2©), a validated depression screening tool for older populations, and one item (“Feeling sad”) from the NIH PROMIS initiative. Mood items are included on the CARE item set because they are predictive of resource utilization and may affect outcomes. These are only asked in the PAC populations since measuring them at the time of discharge from acute hospital was considered problematic from a quality of care standpoint. Among these items, only the item for “Mood interview attempted” is reported for all patients.
Among the nine videos, the CARE items designed to evaluate mood are assessed on nearly every video.
Agreement with the Mode and with the Expert Clinical Team Results for the cognitive status and mood items are displayed in Tables 10-7a and 10-7b.
Among all disciplines, the levels of agreement with the mode and clinical team were very high, rarely falling below 90%. The minor exception to this trend was item IV.C, “Observation of cognitive status” (C1), which is used when the BIMS cannot be administered. For this item, levels of agreement showed a great deal of variability among disciplines, varying from 0% among speech therapists to 40% among PTs, 76% among RNs, and 100% for case managers. However, it is important to recall that because the standard method of assessing cognitive status on the CARE item set is the BIMS, the “Observation of cognitive status item” was only used on one of the nine videos (Video 9). Among the 72 assessments completed on this video, 5 were completed by speech therapists and 4 were completed by case managers, so the variability reported is likely to be highly influenced by sample size. Among RNs, who were the largest group assessing this particular video (n = 37 or 51%), a substantial level of agreement was observed (76%). Similarly to Section II, the results for agreement with the mode (Table 10-7a) were almost entirely identical to the results for agreement with the clinical team response (Table 10-7b). The only exception to this occurs for item IV.B3b2, which asks the patient for the current month. For this item, rates of agreement with the mode are slightly higher because in one video, the mode differed from the clinical team response.
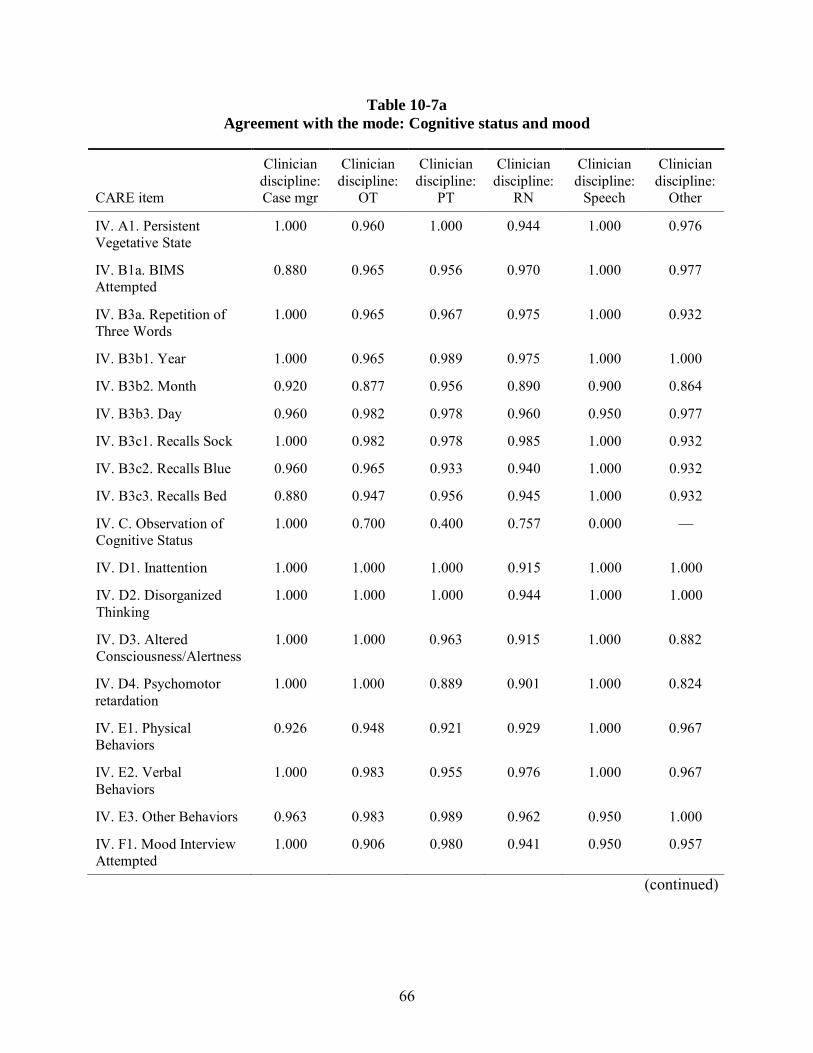
66
Table 10-7a Agreement with the mode: Cognitive status and mood
CARE item
Clinician discipline: Case mgr
Clinician discipline:
OT
Clinician discipline:
PT
Clinician discipline:
RN
Clinician discipline:
Speech
Clinician discipline:
Other
IV. A1. Persistent Vegetative State
1.000 0.960 1.000 0.944 1.000 0.976
IV. B1a. BIMS Attempted
0.880 0.965 0.956 0.970 1.000 0.977
IV. B3a. Repetition of Three Words
1.000 0.965 0.967 0.975 1.000 0.932
IV. B3b1. Year 1.000 0.965 0.989 0.975 1.000 1.000
IV. B3b2. Month 0.920 0.877 0.956 0.890 0.900 0.864
IV. B3b3. Day 0.960 0.982 0.978 0.960 0.950 0.977
IV. B3c1. Recalls Sock 1.000 0.982 0.978 0.985 1.000 0.932
IV. B3c2. Recalls Blue 0.960 0.965 0.933 0.940 1.000 0.932
IV. B3c3. Recalls Bed 0.880 0.947 0.956 0.945 1.000 0.932
IV. C. Observation of Cognitive Status
1.000 0.700 0.400 0.757 0.000 —
IV. D1. Inattention 1.000 1.000 1.000 0.915 1.000 1.000
IV. D2. Disorganized Thinking
1.000 1.000 1.000 0.944 1.000 1.000
IV. D3. Altered Consciousness/Alertness
1.000 1.000 0.963 0.915 1.000 0.882
IV. D4. Psychomotor retardation
1.000 1.000 0.889 0.901 1.000 0.824
IV. E1. Physical Behaviors
0.926 0.948 0.921 0.929 1.000 0.967
IV. E2. Verbal Behaviors
1.000 0.983 0.955 0.976 1.000 0.967
IV. E3. Other Behaviors 0.963 0.983 0.989 0.962 0.950 1.000
IV. F1. Mood Interview Attempted
1.000 0.906 0.980 0.941 0.950 0.957
(continued)
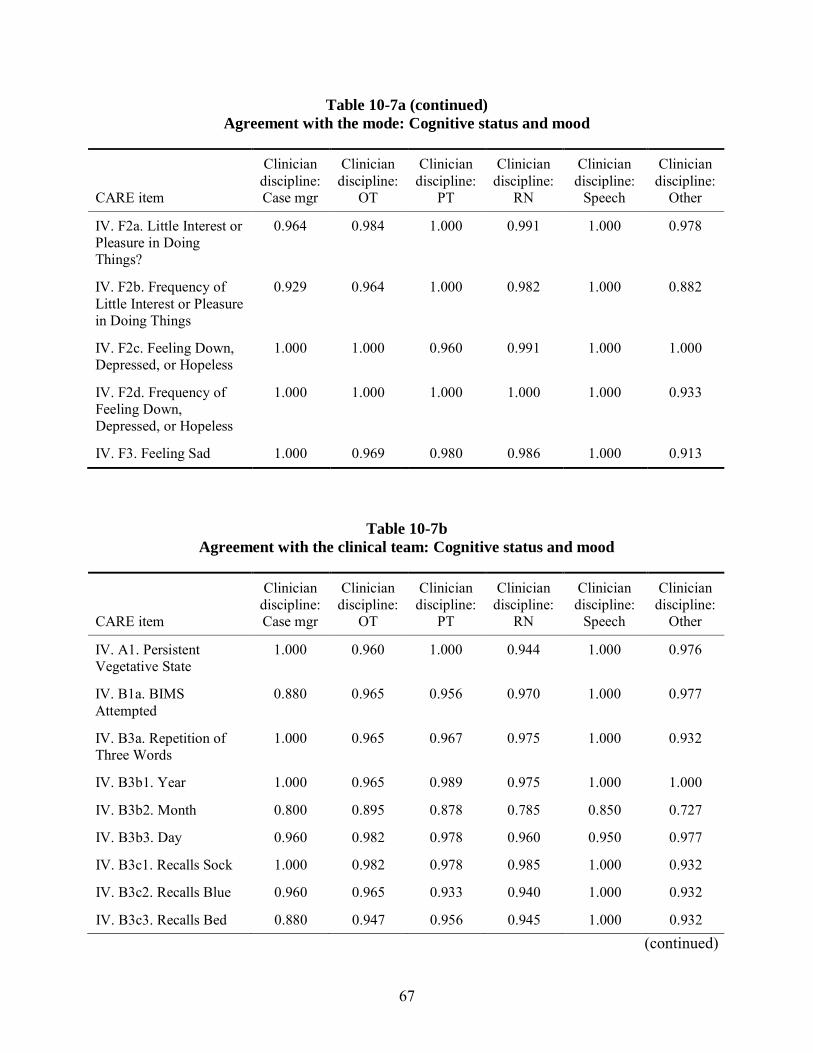
67
Table 10-7a (continued) Agreement with the mode: Cognitive status and mood
CARE item
Clinician discipline: Case mgr
Clinician discipline:
OT
Clinician discipline:
PT
Clinician discipline:
RN
Clinician discipline:
Speech
Clinician discipline:
Other
IV. F2a. Little Interest or Pleasure in Doing Things?
0.964 0.984 1.000 0.991 1.000 0.978
IV. F2b. Frequency of Little Interest or Pleasure in Doing Things
0.929 0.964 1.000 0.982 1.000 0.882
IV. F2c. Feeling Down, Depressed, or Hopeless
1.000 1.000 0.960 0.991 1.000 1.000
IV. F2d. Frequency of Feeling Down, Depressed, or Hopeless
1.000 1.000 1.000 1.000 1.000 0.933
IV. F3. Feeling Sad 1.000 0.969 0.980 0.986 1.000 0.913
Table 10-7b Agreement with the clinical team: Cognitive status and mood
CARE item
Clinician discipline: Case mgr
Clinician discipline:
OT
Clinician discipline:
PT
Clinician discipline:
RN
Clinician discipline:
Speech
Clinician discipline:
Other
IV. A1. Persistent Vegetative State
1.000 0.960 1.000 0.944 1.000 0.976
IV. B1a. BIMS Attempted
0.880 0.965 0.956 0.970 1.000 0.977
IV. B3a. Repetition of Three Words
1.000 0.965 0.967 0.975 1.000 0.932
IV. B3b1. Year 1.000 0.965 0.989 0.975 1.000 1.000
IV. B3b2. Month 0.800 0.895 0.878 0.785 0.850 0.727
IV. B3b3. Day 0.960 0.982 0.978 0.960 0.950 0.977
IV. B3c1. Recalls Sock 1.000 0.982 0.978 0.985 1.000 0.932
IV. B3c2. Recalls Blue 0.960 0.965 0.933 0.940 1.000 0.932
IV. B3c3. Recalls Bed 0.880 0.947 0.956 0.945 1.000 0.932 (continued)
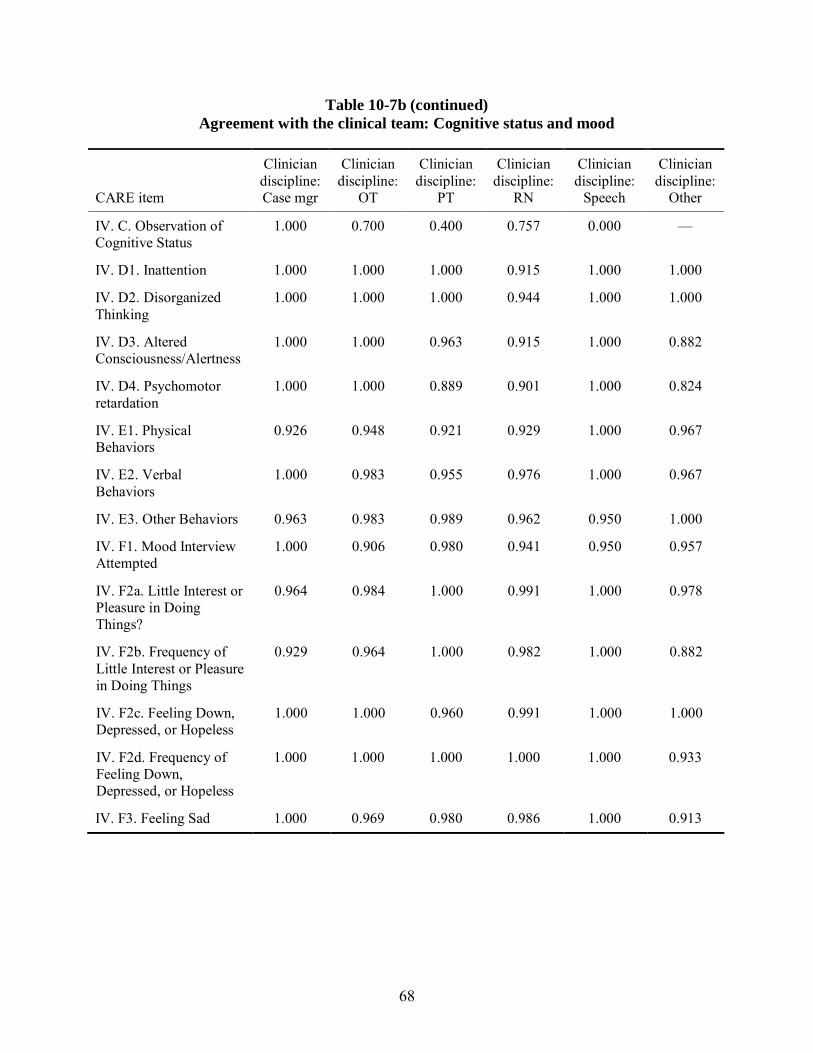
68
Table 10-7b (continued) Agreement with the clinical team: Cognitive status and mood
CARE item
Clinician discipline: Case mgr
Clinician discipline:
OT
Clinician discipline:
PT
Clinician discipline:
RN
Clinician discipline:
Speech
Clinician discipline:
Other
IV. C. Observation of Cognitive Status
1.000 0.700 0.400 0.757 0.000 —
IV. D1. Inattention 1.000 1.000 1.000 0.915 1.000 1.000
IV. D2. Disorganized Thinking
1.000 1.000 1.000 0.944 1.000 1.000
IV. D3. Altered Consciousness/Alertness
1.000 1.000 0.963 0.915 1.000 0.882
IV. D4. Psychomotor retardation
1.000 1.000 0.889 0.901 1.000 0.824
IV. E1. Physical Behaviors
0.926 0.948 0.921 0.929 1.000 0.967
IV. E2. Verbal Behaviors
1.000 0.983 0.955 0.976 1.000 0.967
IV. E3. Other Behaviors 0.963 0.983 0.989 0.962 0.950 1.000
IV. F1. Mood Interview Attempted
1.000 0.906 0.980 0.941 0.950 0.957
IV. F2a. Little Interest or Pleasure in Doing Things?
0.964 0.984 1.000 0.991 1.000 0.978
IV. F2b. Frequency of Little Interest or Pleasure in Doing Things
0.929 0.964 1.000 0.982 1.000 0.882
IV. F2c. Feeling Down, Depressed, or Hopeless
1.000 1.000 0.960 0.991 1.000 1.000
IV. F2d. Frequency of Feeling Down, Depressed, or Hopeless
1.000 1.000 1.000 1.000 1.000 0.933
IV. F3. Feeling Sad 1.000 0.969 0.980 0.986 1.000 0.913
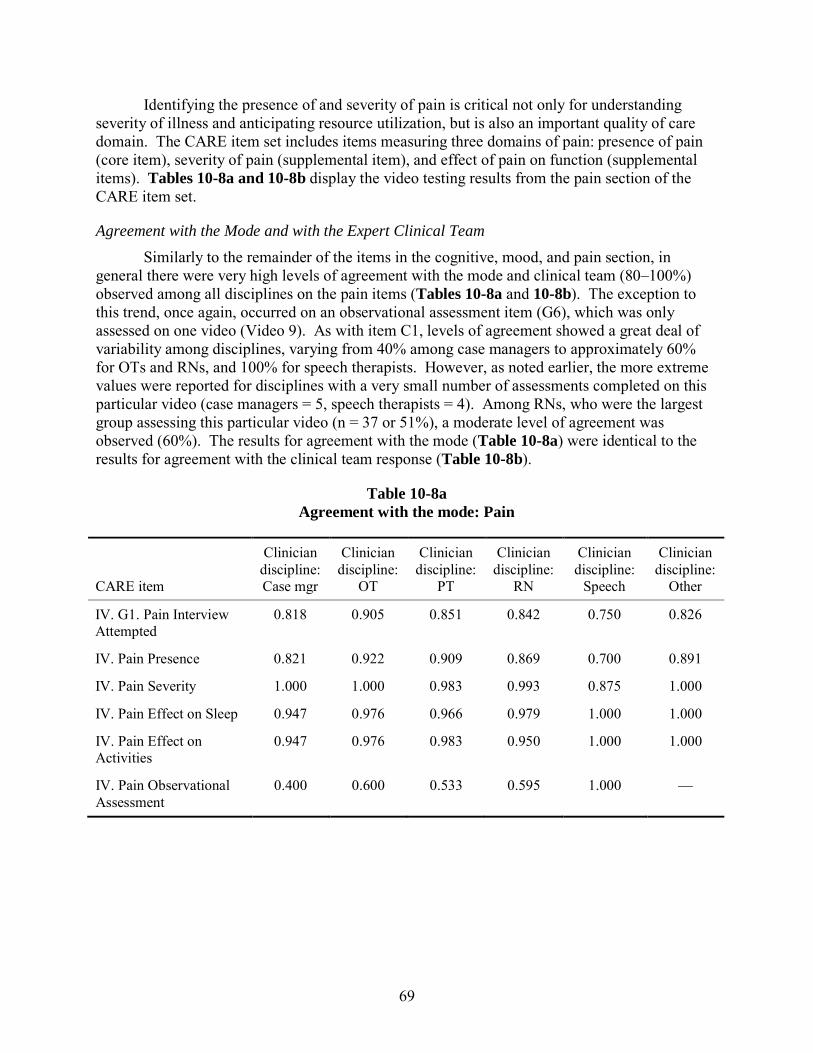
69
Identifying the presence of and severity of pain is critical not only for understanding severity of illness and anticipating resource utilization, but is also an important quality of care domain. The CARE item set includes items measuring three domains of pain: presence of pain (core item), severity of pain (supplemental item), and effect of pain on function (supplemental items). Tables 10-8a and 10-8b display the video testing results from the pain section of the CARE item set.
Agreement with the Mode and with the Expert Clinical Team Similarly to the remainder of the items in the cognitive, mood, and pain section, in
general there were very high levels of agreement with the mode and clinical team (80–100%) observed among all disciplines on the pain items (Tables 10-8a and 10-8b). The exception to this trend, once again, occurred on an observational assessment item (G6), which was only assessed on one video (Video 9). As with item C1, levels of agreement showed a great deal of variability among disciplines, varying from 40% among case managers to approximately 60% for OTs and RNs, and 100% for speech therapists. However, as noted earlier, the more extreme values were reported for disciplines with a very small number of assessments completed on this particular video (case managers = 5, speech therapists = 4). Among RNs, who were the largest group assessing this particular video (n = 37 or 51%), a moderate level of agreement was observed (60%). The results for agreement with the mode (Table 10-8a) were identical to the results for agreement with the clinical team response (Table 10-8b).
Table 10-8a Agreement with the mode: Pain
CARE item
Clinician discipline: Case mgr
Clinician discipline:
OT
Clinician discipline:
PT
Clinician discipline:
RN
Clinician discipline:
Speech
Clinician discipline:
Other
IV. G1. Pain Interview Attempted
0.818 0.905 0.851 0.842 0.750 0.826
IV. Pain Presence 0.821 0.922 0.909 0.869 0.700 0.891
IV. Pain Severity 1.000 1.000 0.983 0.993 0.875 1.000
IV. Pain Effect on Sleep 0.947 0.976 0.966 0.979 1.000 1.000
IV. Pain Effect on Activities
0.947 0.976 0.983 0.950 1.000 1.000
IV. Pain Observational Assessment
0.400 0.600 0.533 0.595 1.000 —
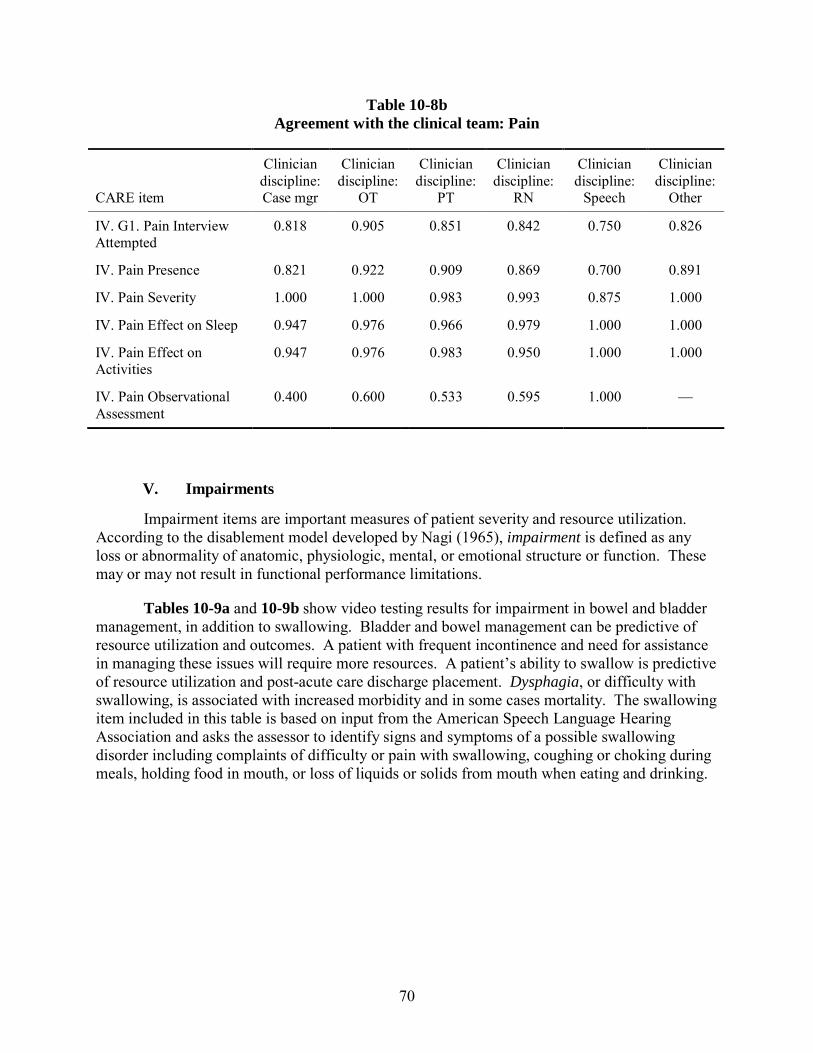
70
Table 10-8b Agreement with the clinical team: Pain
CARE item
Clinician discipline: Case mgr
Clinician discipline:
OT
Clinician discipline:
PT
Clinician discipline:
RN
Clinician discipline:
Speech
Clinician discipline:
Other
IV. G1. Pain Interview Attempted
0.818 0.905 0.851 0.842 0.750 0.826
IV. Pain Presence 0.821 0.922 0.909 0.869 0.700 0.891
IV. Pain Severity 1.000 1.000 0.983 0.993 0.875 1.000
IV. Pain Effect on Sleep 0.947 0.976 0.966 0.979 1.000 1.000
IV. Pain Effect on Activities
0.947 0.976 0.983 0.950 1.000 1.000
IV. Pain Observational Assessment
0.400 0.600 0.533 0.595 1.000 —
V. Impairments
Impairment items are important measures of patient severity and resource utilization. According to the disablement model developed by Nagi (1965), impairment is defined as any loss or abnormality of anatomic, physiologic, mental, or emotional structure or function. These may or may not result in functional performance limitations.
Tables 10-9a and 10-9b show video testing results for impairment in bowel and bladder management, in addition to swallowing. Bladder and bowel management can be predictive of resource utilization and outcomes. A patient with frequent incontinence and need for assistance in managing these issues will require more resources. A patient’s ability to swallow is predictive of resource utilization and post-acute care discharge placement. Dysphagia, or difficulty with swallowing, is associated with increased morbidity and in some cases mortality. The swallowing item included in this table is based on input from the American Speech Language Hearing Association and asks the assessor to identify signs and symptoms of a possible swallowing disorder including complaints of difficulty or pain with swallowing, coughing or choking during meals, holding food in mouth, or loss of liquids or solids from mouth when eating and drinking.
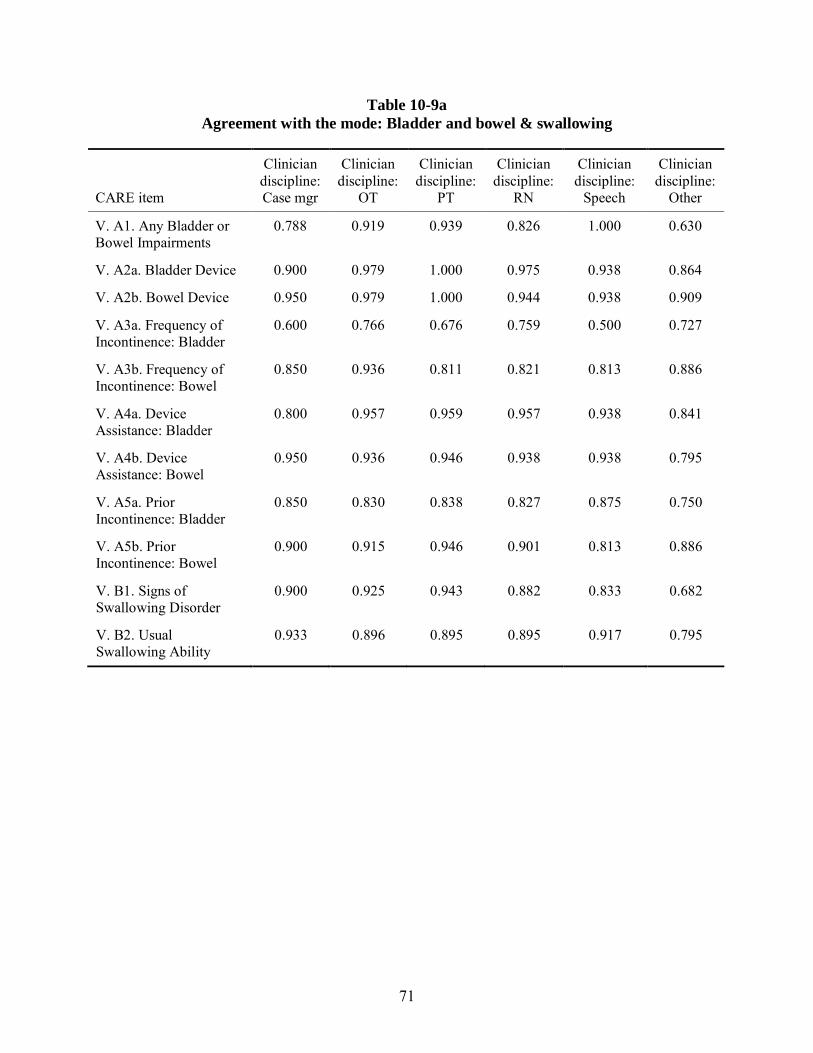
71
Table 10-9a Agreement with the mode: Bladder and bowel & swallowing
CARE item
Clinician discipline: Case mgr
Clinician discipline:
OT
Clinician discipline:
PT
Clinician discipline:
RN
Clinician discipline:
Speech
Clinician discipline:
Other
V. A1. Any Bladder or Bowel Impairments
0.788 0.919 0.939 0.826 1.000 0.630
V. A2a. Bladder Device 0.900 0.979 1.000 0.975 0.938 0.864
V. A2b. Bowel Device 0.950 0.979 1.000 0.944 0.938 0.909
V. A3a. Frequency of Incontinence: Bladder
0.600 0.766 0.676 0.759 0.500 0.727
V. A3b. Frequency of Incontinence: Bowel
0.850 0.936 0.811 0.821 0.813 0.886
V. A4a. Device Assistance: Bladder
0.800 0.957 0.959 0.957 0.938 0.841
V. A4b. Device Assistance: Bowel
0.950 0.936 0.946 0.938 0.938 0.795
V. A5a. Prior Incontinence: Bladder
0.850 0.830 0.838 0.827 0.875 0.750
V. A5b. Prior Incontinence: Bowel
0.900 0.915 0.946 0.901 0.813 0.886
V. B1. Signs of Swallowing Disorder
0.900 0.925 0.943 0.882 0.833 0.682
V. B2. Usual Swallowing Ability
0.933 0.896 0.895 0.895 0.917 0.795
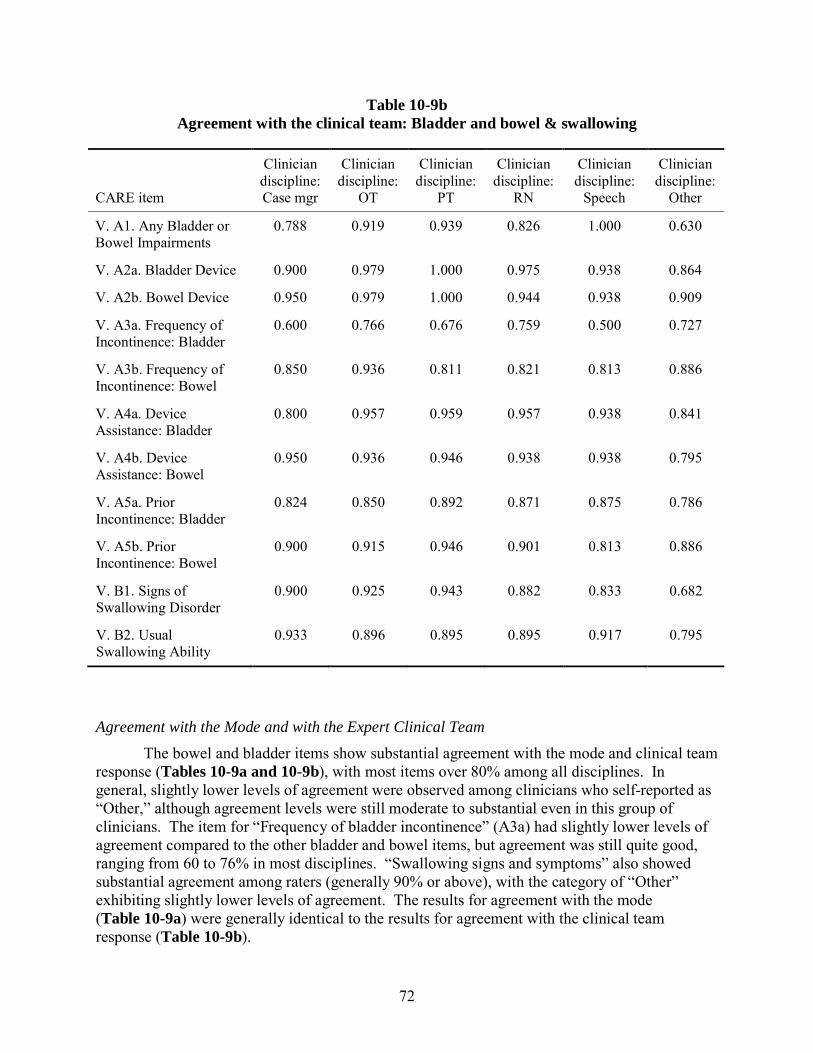
72
Table 10-9b Agreement with the clinical team: Bladder and bowel & swallowing
CARE item
Clinician discipline: Case mgr
Clinician discipline:
OT
Clinician discipline:
PT
Clinician discipline:
RN
Clinician discipline:
Speech
Clinician discipline:
Other
V. A1. Any Bladder or Bowel Impairments
0.788 0.919 0.939 0.826 1.000 0.630
V. A2a. Bladder Device 0.900 0.979 1.000 0.975 0.938 0.864
V. A2b. Bowel Device 0.950 0.979 1.000 0.944 0.938 0.909
V. A3a. Frequency of Incontinence: Bladder
0.600 0.766 0.676 0.759 0.500 0.727
V. A3b. Frequency of Incontinence: Bowel
0.850 0.936 0.811 0.821 0.813 0.886
V. A4a. Device Assistance: Bladder
0.800 0.957 0.959 0.957 0.938 0.841
V. A4b. Device Assistance: Bowel
0.950 0.936 0.946 0.938 0.938 0.795
V. A5a. Prior Incontinence: Bladder
0.824 0.850 0.892 0.871 0.875 0.786
V. A5b. Prior Incontinence: Bowel
0.900 0.915 0.946 0.901 0.813 0.886
V. B1. Signs of Swallowing Disorder
0.900 0.925 0.943 0.882 0.833 0.682
V. B2. Usual Swallowing Ability
0.933 0.896 0.895 0.895 0.917 0.795
Agreement with the Mode and with the Expert Clinical Team The bowel and bladder items show substantial agreement with the mode and clinical team
response (Tables 10-9a and 10-9b), with most items over 80% among all disciplines. In general, slightly lower levels of agreement were observed among clinicians who self-reported as “Other,” although agreement levels were still moderate to substantial even in this group of clinicians. The item for “Frequency of bladder incontinence” (A3a) had slightly lower levels of agreement compared to the other bladder and bowel items, but agreement was still quite good, ranging from 60 to 76% in most disciplines. “Swallowing signs and symptoms” also showed substantial agreement among raters (generally 90% or above), with the category of “Other” exhibiting slightly lower levels of agreement. The results for agreement with the mode (Table 10-9a) were generally identical to the results for agreement with the clinical team response (Table 10-9b).
73
Hearing, Vision and Communication Comprehension The hearing, vision, and communication comprehension items on the CARE item set
include four items taken from the MDS 3.0. The goal of these items is to identify the level of impairment as mild or moderately impaired, severely impaired, or not impaired. Levels of impairment are assessed with hearing aids, glasses, or other assistive devices that the beneficiaries may use. These items indicate the presence or absence of a problem and the identification of a problem will lead to further assessment. These items are shown in Tables 10-10a and 10-10b. The levels of agreement with the mode and clinical team for these items generally exceeded 80%.
Weight-bearing The weight-bearing items shown in Tables 10-10a and 10-10b measure whether or not a
patient is fully weight-bearing in the left upper extremity, right upper extremity, left lower extremity, and right lower extremity. The ability to weight bear is important to capture because it is related to a patient’s ability to use assistive devices and need for assistance in performing surface-to-surface transfers. This item is predictive of resource utilization and may also be predictive of post-acute care discharge options since a patient’s inability to weight-bear will require significant staffing resources to provide assistance. These items showed moderate/substantial levels of agreement with the mode and clinical team varying from 60 to 93%.
Grip Strength The grip strength item measures a patient’s ability to squeeze a caregiver’s hand with
each of their own hands. Response categories include normal, reduced/limited, or absent. This item is included in the tool as a measure of frailty and severity of illness. These items also showed substantial agreement with the mode and clinical team, with all disciplines reporting agreement exceeding 81% (see Tables 10-10a and 10-10b).
Respiratory Status Providers were asked to report on level of activity and occurrence of shortness of breath
or dyspnea with or without supplemental oxygen for patients with any respiratory impairments during 2-day assessment period. Identifying the situation that causes a patient to be out of breath is predictive of patient severity of illness and potential resource utilization. If patients had no respiratory impairment, the level of activity item was skipped. If patients were not using supplemental oxygen, the item is entered as not applicable, likewise for patients on supplemental oxygen who would not be taken off oxygen for safety reasons. Reliability statistics for respiratory impairments items are displayed in Tables 10-10a and 10-10b. While levels of agreement with the mode for the core respiratory item (F1) were substantial across all disciplines (74–94%), agreement on the two supplemental items was more moderate (48–75%). This same trend is apparent in the rates of agreement with the clinical team responses. In addition, there are notable differences observed in level of agreement with the mode and clinical team for these items. This is largely due to the fact that on two videos, the mode for items F1a and F1b differed from the expert clinical team response.
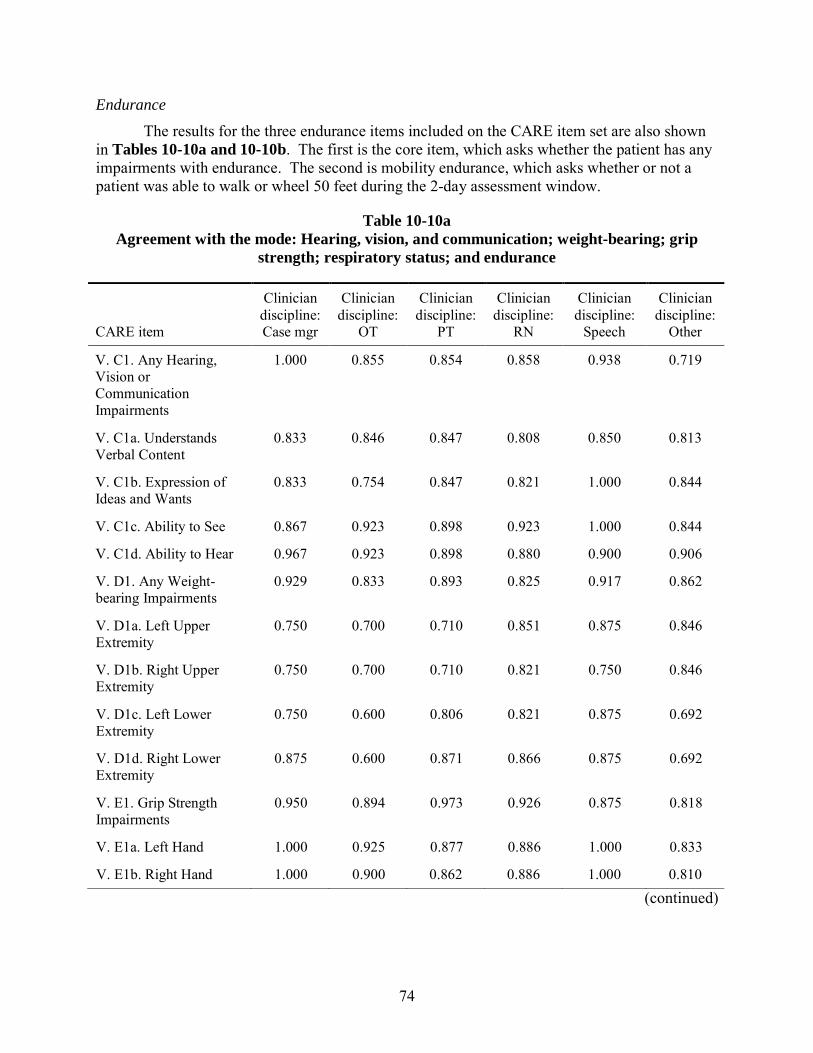
74
Endurance The results for the three endurance items included on the CARE item set are also shown
in Tables 10-10a and 10-10b. The first is the core item, which asks whether the patient has any impairments with endurance. The second is mobility endurance, which asks whether or not a patient was able to walk or wheel 50 feet during the 2-day assessment window.
Table 10-10a Agreement with the mode: Hearing, vision, and communication; weight-bearing; grip
strength; respiratory status; and endurance
CARE item
Clinician discipline: Case mgr
Clinician discipline:
OT
Clinician discipline:
PT
Clinician discipline:
RN
Clinician discipline:
Speech
Clinician discipline:
Other
V. C1. Any Hearing, Vision or Communication Impairments
1.000 0.855 0.854 0.858 0.938 0.719
V. C1a. Understands Verbal Content
0.833 0.846 0.847 0.808 0.850 0.813
V. C1b. Expression of Ideas and Wants
0.833 0.754 0.847 0.821 1.000 0.844
V. C1c. Ability to See 0.867 0.923 0.898 0.923 1.000 0.844
V. C1d. Ability to Hear 0.967 0.923 0.898 0.880 0.900 0.906
V. D1. Any Weight-bearing Impairments
0.929 0.833 0.893 0.825 0.917 0.862
V. D1a. Left Upper Extremity
0.750 0.700 0.710 0.851 0.875 0.846
V. D1b. Right Upper Extremity
0.750 0.700 0.710 0.821 0.750 0.846
V. D1c. Left Lower Extremity
0.750 0.600 0.806 0.821 0.875 0.692
V. D1d. Right Lower Extremity
0.875 0.600 0.871 0.866 0.875 0.692
V. E1. Grip Strength Impairments
0.950 0.894 0.973 0.926 0.875 0.818
V. E1a. Left Hand 1.000 0.925 0.877 0.886 1.000 0.833
V. E1b. Right Hand 1.000 0.900 0.862 0.886 1.000 0.810 (continued)
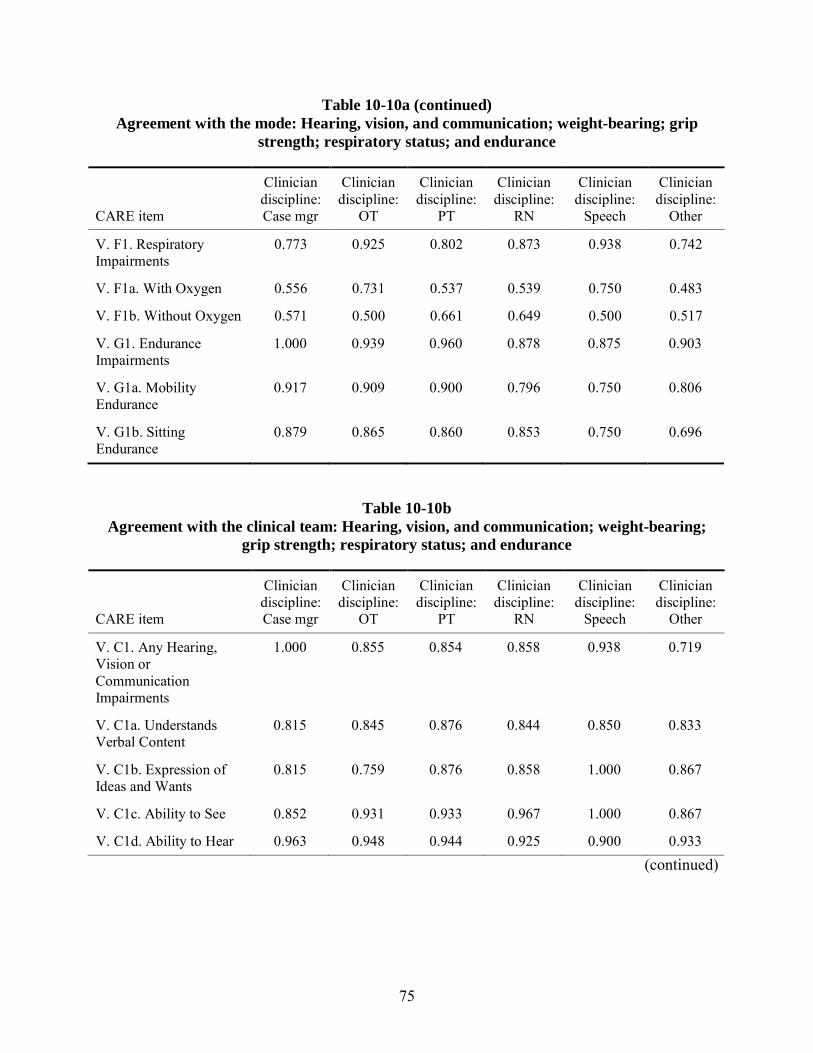
75
Table 10-10a (continued) Agreement with the mode: Hearing, vision, and communication; weight-bearing; grip
strength; respiratory status; and endurance
CARE item
Clinician discipline: Case mgr
Clinician discipline:
OT
Clinician discipline:
PT
Clinician discipline:
RN
Clinician discipline:
Speech
Clinician discipline:
Other
V. F1. Respiratory Impairments
0.773 0.925 0.802 0.873 0.938 0.742
V. F1a. With Oxygen 0.556 0.731 0.537 0.539 0.750 0.483
V. F1b. Without Oxygen 0.571 0.500 0.661 0.649 0.500 0.517
V. G1. Endurance Impairments
1.000 0.939 0.960 0.878 0.875 0.903
V. G1a. Mobility Endurance
0.917 0.909 0.900 0.796 0.750 0.806
V. G1b. Sitting Endurance
0.879 0.865 0.860 0.853 0.750 0.696
Table 10-10b Agreement with the clinical team: Hearing, vision, and communication; weight-bearing;
grip strength; respiratory status; and endurance
CARE item
Clinician discipline: Case mgr
Clinician discipline:
OT
Clinician discipline:
PT
Clinician discipline:
RN
Clinician discipline:
Speech
Clinician discipline:
Other
V. C1. Any Hearing, Vision or Communication Impairments
1.000 0.855 0.854 0.858 0.938 0.719
V. C1a. Understands Verbal Content
0.815 0.845 0.876 0.844 0.850 0.833
V. C1b. Expression of Ideas and Wants
0.815 0.759 0.876 0.858 1.000 0.867
V. C1c. Ability to See 0.852 0.931 0.933 0.967 1.000 0.867
V. C1d. Ability to Hear 0.963 0.948 0.944 0.925 0.900 0.933 (continued)
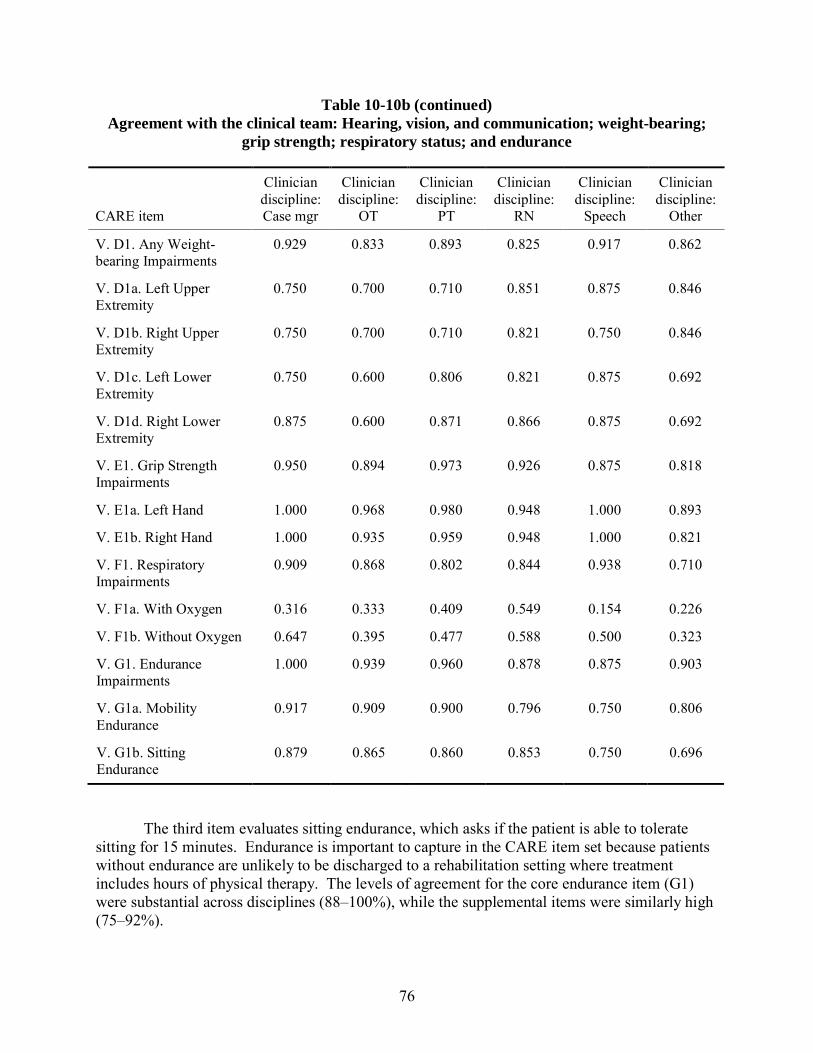
76
Table 10-10b (continued) Agreement with the clinical team: Hearing, vision, and communication; weight-bearing;
grip strength; respiratory status; and endurance
CARE item
Clinician discipline: Case mgr
Clinician discipline:
OT
Clinician discipline:
PT
Clinician discipline:
RN
Clinician discipline:
Speech
Clinician discipline:
Other
V. D1. Any Weight-bearing Impairments
0.929 0.833 0.893 0.825 0.917 0.862
V. D1a. Left Upper Extremity
0.750 0.700 0.710 0.851 0.875 0.846
V. D1b. Right Upper Extremity
0.750 0.700 0.710 0.821 0.750 0.846
V. D1c. Left Lower Extremity
0.750 0.600 0.806 0.821 0.875 0.692
V. D1d. Right Lower Extremity
0.875 0.600 0.871 0.866 0.875 0.692
V. E1. Grip Strength Impairments
0.950 0.894 0.973 0.926 0.875 0.818
V. E1a. Left Hand 1.000 0.968 0.980 0.948 1.000 0.893
V. E1b. Right Hand 1.000 0.935 0.959 0.948 1.000 0.821
V. F1. Respiratory Impairments
0.909 0.868 0.802 0.844 0.938 0.710
V. F1a. With Oxygen 0.316 0.333 0.409 0.549 0.154 0.226
V. F1b. Without Oxygen 0.647 0.395 0.477 0.588 0.500 0.323
V. G1. Endurance Impairments
1.000 0.939 0.960 0.878 0.875 0.903
V. G1a. Mobility Endurance
0.917 0.909 0.900 0.796 0.750 0.806
V. G1b. Sitting Endurance
0.879 0.865 0.860 0.853 0.750 0.696
The third item evaluates sitting endurance, which asks if the patient is able to tolerate sitting for 15 minutes. Endurance is important to capture in the CARE item set because patients without endurance are unlikely to be discharged to a rehabilitation setting where treatment includes hours of physical therapy. The levels of agreement for the core endurance item (G1) were substantial across disciplines (88–100%), while the supplemental items were similarly high (75–92%).
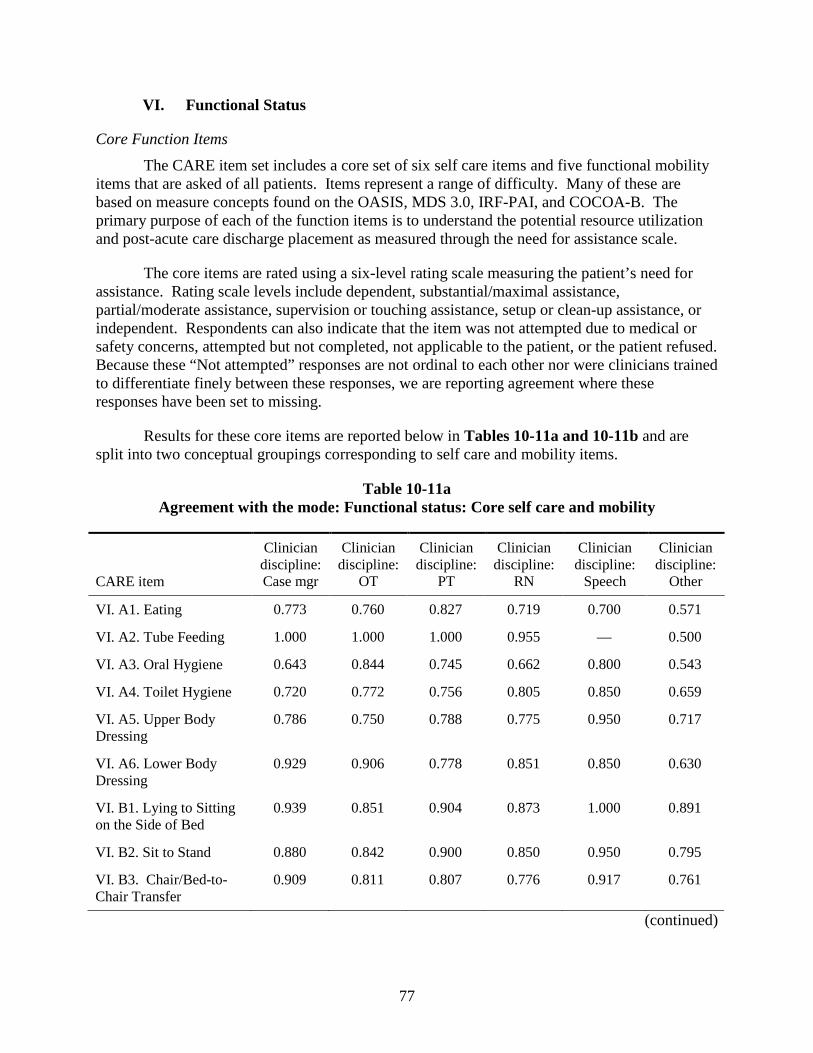
77
VI. Functional Status
Core Function Items The CARE item set includes a core set of six self care items and five functional mobility
items that are asked of all patients. Items represent a range of difficulty. Many of these are based on measure concepts found on the OASIS, MDS 3.0, IRF-PAI, and COCOA-B. The primary purpose of each of the function items is to understand the potential resource utilization and post-acute care discharge placement as measured through the need for assistance scale.
The core items are rated using a six-level rating scale measuring the patient’s need for assistance. Rating scale levels include dependent, substantial/maximal assistance, partial/moderate assistance, supervision or touching assistance, setup or clean-up assistance, or independent. Respondents can also indicate that the item was not attempted due to medical or safety concerns, attempted but not completed, not applicable to the patient, or the patient refused. Because these “Not attempted” responses are not ordinal to each other nor were clinicians trained to differentiate finely between these responses, we are reporting agreement where these responses have been set to missing.
Results for these core items are reported below in Tables 10-11a and 10-11b and are split into two conceptual groupings corresponding to self care and mobility items.
Table 10-11a Agreement with the mode: Functional status: Core self care and mobility
CARE item
Clinician discipline: Case mgr
Clinician discipline:
OT
Clinician discipline:
PT
Clinician discipline:
RN
Clinician discipline:
Speech
Clinician discipline:
Other
VI. A1. Eating 0.773 0.760 0.827 0.719 0.700 0.571
VI. A2. Tube Feeding 1.000 1.000 1.000 0.955 — 0.500
VI. A3. Oral Hygiene 0.643 0.844 0.745 0.662 0.800 0.543
VI. A4. Toilet Hygiene 0.720 0.772 0.756 0.805 0.850 0.659
VI. A5. Upper Body Dressing
0.786 0.750 0.788 0.775 0.950 0.717
VI. A6. Lower Body Dressing
0.929 0.906 0.778 0.851 0.850 0.630
VI. B1. Lying to Sitting on the Side of Bed
0.939 0.851 0.904 0.873 1.000 0.891
VI. B2. Sit to Stand 0.880 0.842 0.900 0.850 0.950 0.795
VI. B3. Chair/Bed-to-Chair Transfer
0.909 0.811 0.807 0.776 0.917 0.761
(continued)
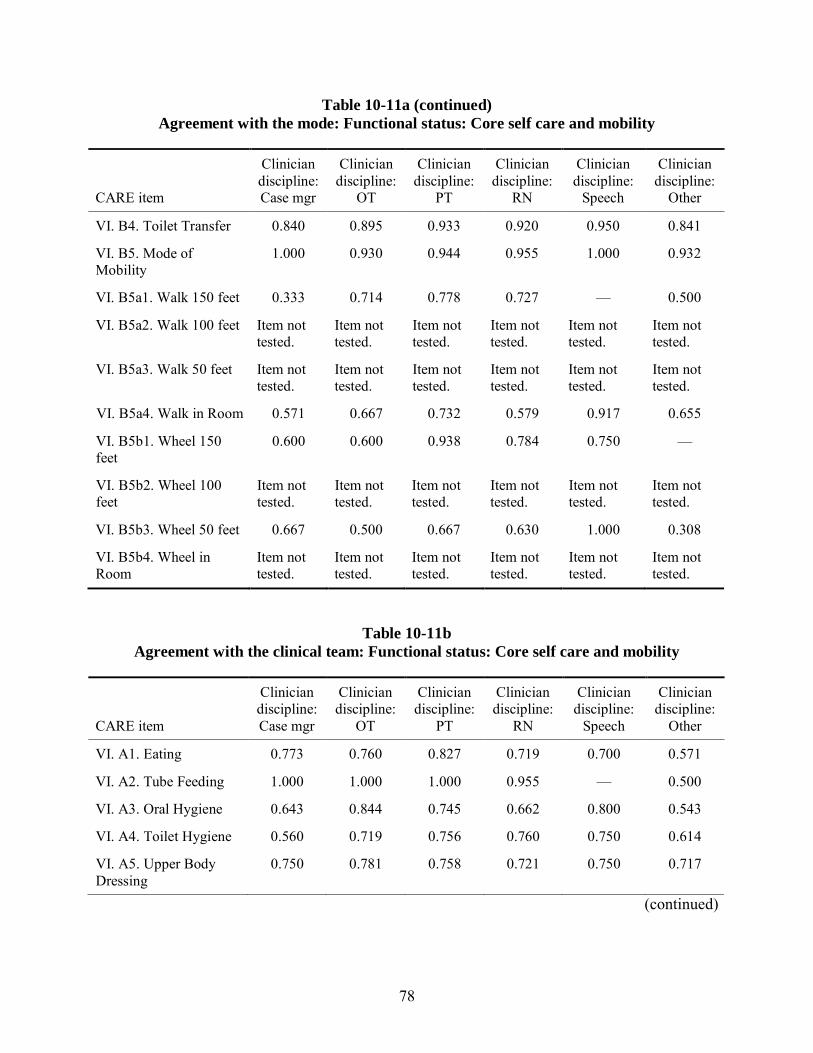
78
Table 10-11a (continued) Agreement with the mode: Functional status: Core self care and mobility
CARE item
Clinician discipline: Case mgr
Clinician discipline:
OT
Clinician discipline:
PT
Clinician discipline:
RN
Clinician discipline:
Speech
Clinician discipline:
Other
VI. B4. Toilet Transfer 0.840 0.895 0.933 0.920 0.950 0.841
VI. B5. Mode of Mobility
1.000 0.930 0.944 0.955 1.000 0.932
VI. B5a1. Walk 150 feet 0.333 0.714 0.778 0.727 — 0.500
VI. B5a2. Walk 100 feet Item not tested.
Item not tested.
Item not tested.
Item not tested.
Item not tested.
Item not tested.
VI. B5a3. Walk 50 feet Item not tested.
Item not tested.
Item not tested.
Item not tested.
Item not tested.
Item not tested.
VI. B5a4. Walk in Room 0.571 0.667 0.732 0.579 0.917 0.655
VI. B5b1. Wheel 150 feet
0.600 0.600 0.938 0.784 0.750 —
VI. B5b2. Wheel 100 feet
Item not tested.
Item not tested.
Item not tested.
Item not tested.
Item not tested.
Item not tested.
VI. B5b3. Wheel 50 feet 0.667 0.500 0.667 0.630 1.000 0.308
VI. B5b4. Wheel in Room
Item not tested.
Item not tested.
Item not tested.
Item not tested.
Item not tested.
Item not tested.
Table 10-11b Agreement with the clinical team: Functional status: Core self care and mobility
CARE item
Clinician discipline: Case mgr
Clinician discipline:
OT
Clinician discipline:
PT
Clinician discipline:
RN
Clinician discipline:
Speech
Clinician discipline:
Other
VI. A1. Eating 0.773 0.760 0.827 0.719 0.700 0.571
VI. A2. Tube Feeding 1.000 1.000 1.000 0.955 — 0.500
VI. A3. Oral Hygiene 0.643 0.844 0.745 0.662 0.800 0.543
VI. A4. Toilet Hygiene 0.560 0.719 0.756 0.760 0.750 0.614
VI. A5. Upper Body Dressing
0.750 0.781 0.758 0.721 0.750 0.717
(continued)
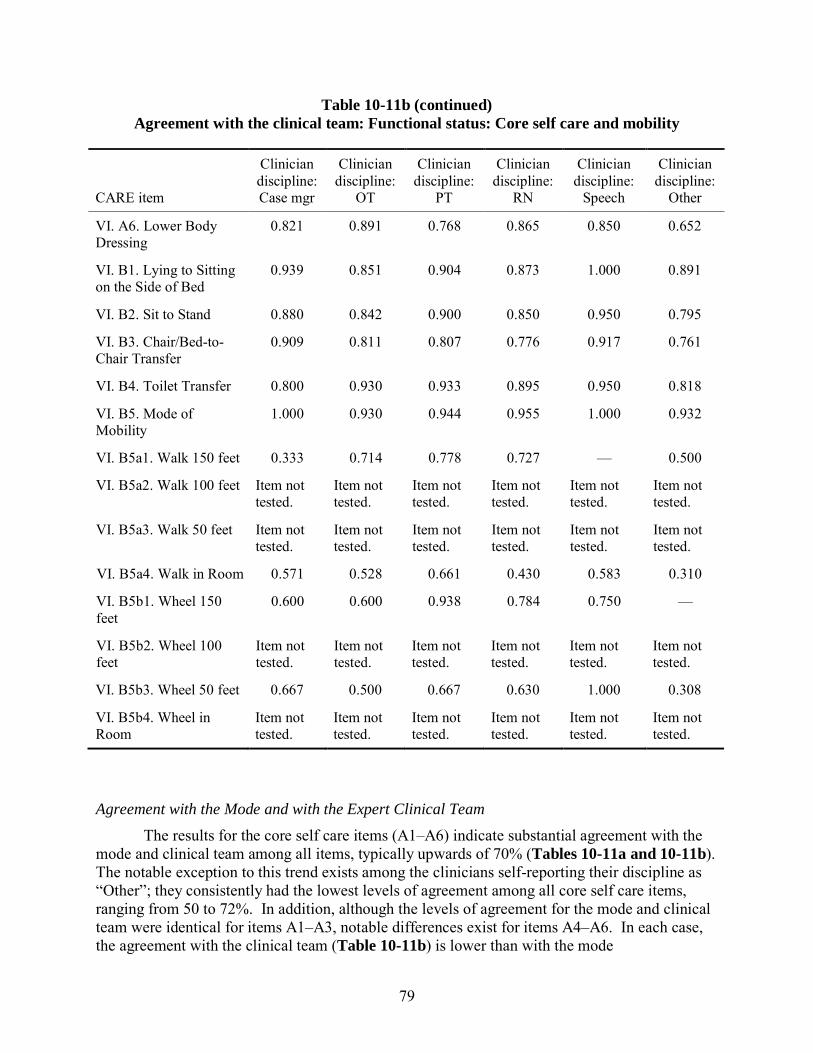
79
Table 10-11b (continued) Agreement with the clinical team: Functional status: Core self care and mobility
CARE item
Clinician discipline: Case mgr
Clinician discipline:
OT
Clinician discipline:
PT
Clinician discipline:
RN
Clinician discipline:
Speech
Clinician discipline:
Other
VI. A6. Lower Body Dressing
0.821 0.891 0.768 0.865 0.850 0.652
VI. B1. Lying to Sitting on the Side of Bed
0.939 0.851 0.904 0.873 1.000 0.891
VI. B2. Sit to Stand 0.880 0.842 0.900 0.850 0.950 0.795
VI. B3. Chair/Bed-to-Chair Transfer
0.909 0.811 0.807 0.776 0.917 0.761
VI. B4. Toilet Transfer 0.800 0.930 0.933 0.895 0.950 0.818
VI. B5. Mode of Mobility
1.000 0.930 0.944 0.955 1.000 0.932
VI. B5a1. Walk 150 feet 0.333 0.714 0.778 0.727 — 0.500
VI. B5a2. Walk 100 feet Item not tested.
Item not tested.
Item not tested.
Item not tested.
Item not tested.
Item not tested.
VI. B5a3. Walk 50 feet Item not tested.
Item not tested.
Item not tested.
Item not tested.
Item not tested.
Item not tested.
VI. B5a4. Walk in Room 0.571 0.528 0.661 0.430 0.583 0.310
VI. B5b1. Wheel 150 feet
0.600 0.600 0.938 0.784 0.750 —
VI. B5b2. Wheel 100 feet
Item not tested.
Item not tested.
Item not tested.
Item not tested.
Item not tested.
Item not tested.
VI. B5b3. Wheel 50 feet 0.667 0.500 0.667 0.630 1.000 0.308
VI. B5b4. Wheel in Room
Item not tested.
Item not tested.
Item not tested.
Item not tested.
Item not tested.
Item not tested.
Agreement with the Mode and with the Expert Clinical Team The results for the core self care items (A1–A6) indicate substantial agreement with the
mode and clinical team among all items, typically upwards of 70% (Tables 10-11a and 10-11b). The notable exception to this trend exists among the clinicians self-reporting their discipline as “Other”; they consistently had the lowest levels of agreement among all core self care items, ranging from 50 to 72%. In addition, although the levels of agreement for the mode and clinical team were identical for items A1–A3, notable differences exist for items A4–A6. In each case, the agreement with the clinical team (Table 10-11b) is lower than with the mode
80
(Table 10-11a). This occurs because for these three items, in either one or two videos (two videos for item VI.A4 and one video each for items VI.A5 and A6) the clinical team response differed from the mode. Nonetheless, because the clinical team response and mode were identical on seven to eight videos, agreement is still quite high for these items.
The agreement levels for the core functional mobility items (B1–B5) also were substantial, generally exceeding 84%. Again, while rates of agreement with the mode and clinical team response were generally identical, for item VI.B4, the clinical team agreement is slightly lower. This occurs because for one video, the clinical team response differed from the mode, while in the remaining videos the mode and the clinical team responses were identical. The items for walking and wheeling distances (B5a1–4 and B5b1–4, respectively) showed more variable levels of agreement across disciplines, with overall agreement generally in the moderate range (50–78%). For item VI.B5a4, “Walk in room,” there is a notable decrease in the agreement with the clinical team compared to agreement with the mode. This occurs because in two of the four videos where this item was assessed, the clinical team response differed from the mode.
Supplemental Function Items Tables 10-12a and 10-12b show patients’ level of independence in supplemental self
care items such as the ability to wash, rinse, and dry the upper body and to bathe self in the shower or tub. These tables also show supplemental mobility items such as rolling from lying on the back to left and right side, to move from sitting on side of the bed to lying flat on the bed, to bend/stoop from a standing position to pick up a small object from the floor, and the ability to put on and take off socks and shoes or other footwear. For patients whose mode of ambulation is walking, this table also shows the ability to step over a curb or up and down one step, to walk 50 feet and make two turns, to go up and down 12 interior steps with a rail, to go up and down four exterior steps with a rail, to walk 10 feet on uneven or sloping surfaces, and to transfer in and out of a car. For patients whose mode of ambulation is wheeling, this table shows patient ability to wheel on a short ramp and on a long ramp.
The levels of agreement reflected in Tables 10-12a and 10-12b suggest a fair amount of variability between disciplines. For items C1–C6, the OTs, PTs, and RNs reported substantial levels of agreement with both the mode and clinical team that ranged from 65 to 94%. Case managers, speech therapists, and the “Other” category tended to show slightly lower levels of agreement on certain items, e.g., 50% for “Other” and 63% for speech therapists on “Shower/bathe” and 50% for case managers on “Picking up an object.” While the results for agreement with the mode and agreement with the clinical team were largely identical, differences were observed on selected items. In particular, for item C3, “Roll left and right,” agreement with the clinical team was generally less than the values for agree with the mode. This difference is largely attributed to the fact that on one video, the clinicians’ consensus response differed from the mode. A similar result is seen on item C6, “Putting on/taking off footwear.” Although agreement is still quite high, ranging from 71 to 90%, this is slightly lower than the rates of agreement with the mode. This difference results from the fact that in two videos, the clinical team response differed from the mode.
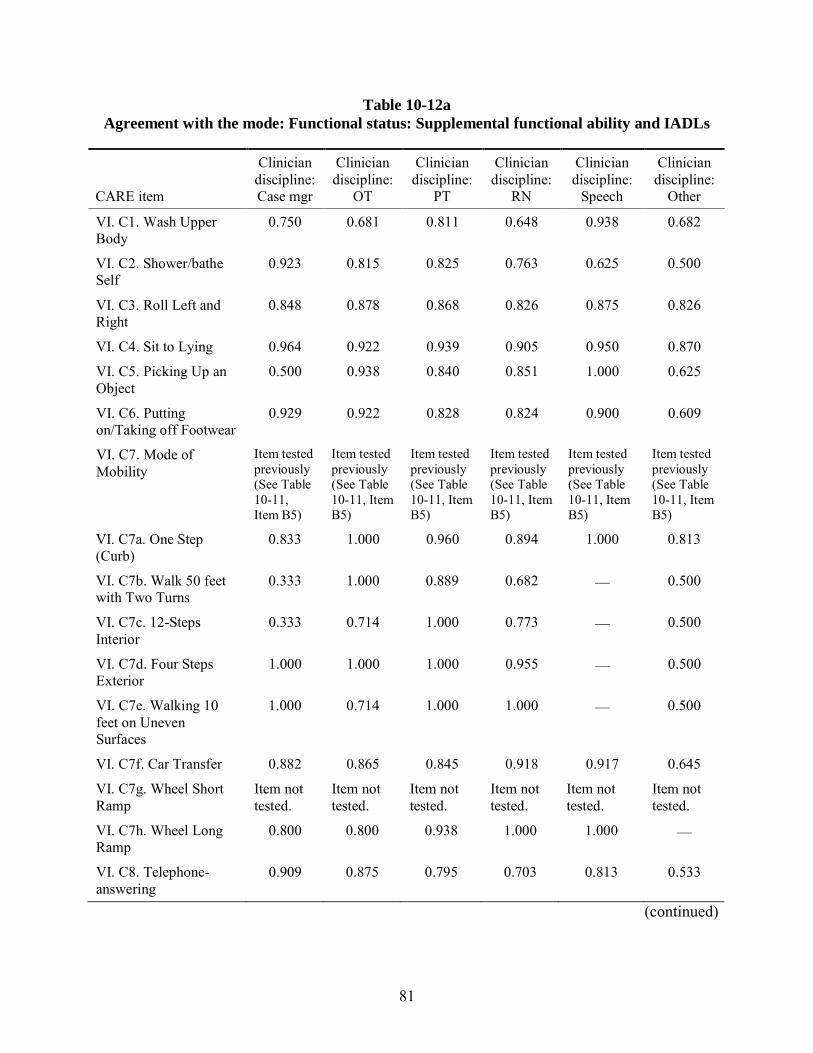
81
Table 10-12a Agreement with the mode: Functional status: Supplemental functional ability and IADLs
CARE item
Clinician discipline: Case mgr
Clinician discipline:
OT
Clinician discipline:
PT
Clinician discipline:
RN
Clinician discipline:
Speech
Clinician discipline:
Other
VI. C1. Wash Upper Body
0.750 0.681 0.811 0.648 0.938 0.682
VI. C2. Shower/bathe Self
0.923 0.815 0.825 0.763 0.625 0.500
VI. C3. Roll Left and Right
0.848 0.878 0.868 0.826 0.875 0.826
VI. C4. Sit to Lying 0.964 0.922 0.939 0.905 0.950 0.870
VI. C5. Picking Up an Object
0.500 0.938 0.840 0.851 1.000 0.625
VI. C6. Putting on/Taking off Footwear
0.929 0.922 0.828 0.824 0.900 0.609
VI. C7. Mode of Mobility
Item tested previously (See Table 10-11, Item B5)
Item tested previously (See Table 10-11, Item B5)
Item tested previously (See Table 10-11, Item B5)
Item tested previously (See Table 10-11, Item B5)
Item tested previously (See Table 10-11, Item B5)
Item tested previously (See Table 10-11, Item B5)
VI. C7a. One Step (Curb)
0.833 1.000 0.960 0.894 1.000 0.813
VI. C7b. Walk 50 feet with Two Turns
0.333 1.000 0.889 0.682 — 0.500
VI. C7c. 12-Steps Interior
0.333 0.714 1.000 0.773 — 0.500
VI. C7d. Four Steps Exterior
1.000 1.000 1.000 0.955 — 0.500
VI. C7e. Walking 10 feet on Uneven Surfaces
1.000 0.714 1.000 1.000 — 0.500
VI. C7f. Car Transfer 0.882 0.865 0.845 0.918 0.917 0.645
VI. C7g. Wheel Short Ramp
Item not tested.
Item not tested.
Item not tested.
Item not tested.
Item not tested.
Item not tested.
VI. C7h. Wheel Long Ramp
0.800 0.800 0.938 1.000 1.000 —
VI. C8. Telephone-answering
0.909 0.875 0.795 0.703 0.813 0.533
(continued)
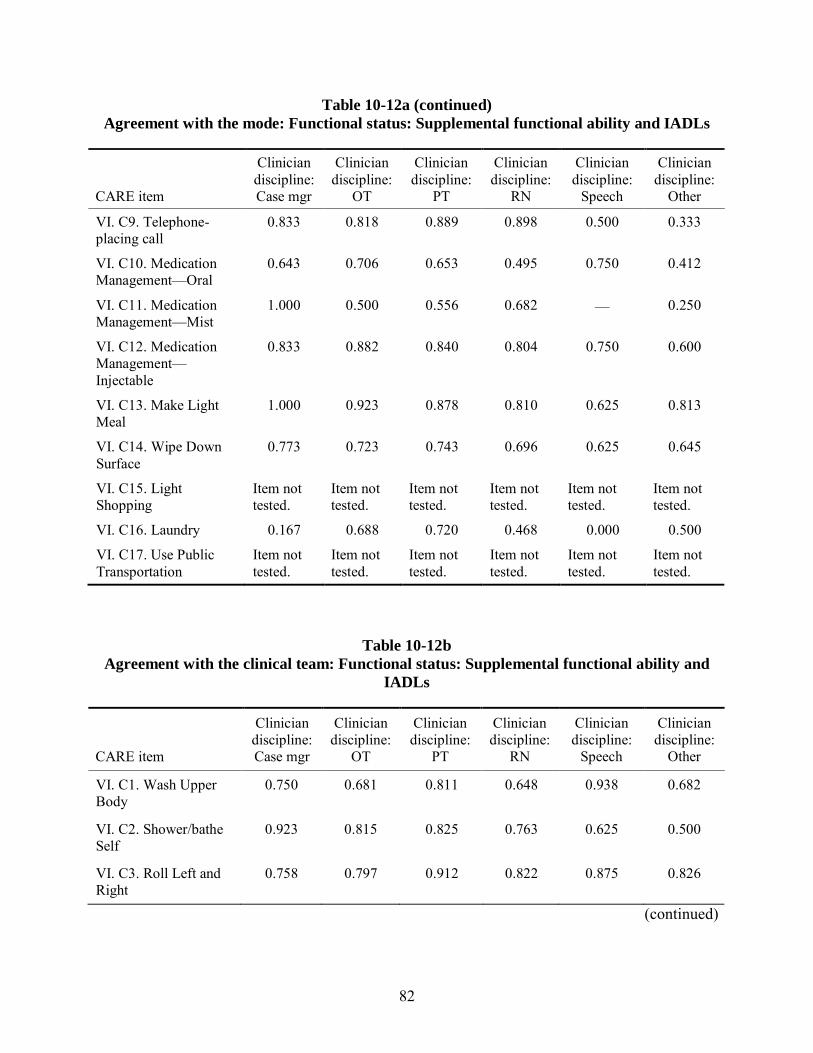
82
Table 10-12a (continued) Agreement with the mode: Functional status: Supplemental functional ability and IADLs
CARE item
Clinician discipline: Case mgr
Clinician discipline:
OT
Clinician discipline:
PT
Clinician discipline:
RN
Clinician discipline:
Speech
Clinician discipline:
Other
VI. C9. Telephone-placing call
0.833 0.818 0.889 0.898 0.500 0.333
VI. C10. Medication Management—Oral
0.643 0.706 0.653 0.495 0.750 0.412
VI. C11. Medication Management—Mist
1.000 0.500 0.556 0.682 — 0.250
VI. C12. Medication Management—Injectable
0.833 0.882 0.840 0.804 0.750 0.600
VI. C13. Make Light Meal
1.000 0.923 0.878 0.810 0.625 0.813
VI. C14. Wipe Down Surface
0.773 0.723 0.743 0.696 0.625 0.645
VI. C15. Light Shopping
Item not tested.
Item not tested.
Item not tested.
Item not tested.
Item not tested.
Item not tested.
VI. C16. Laundry 0.167 0.688 0.720 0.468 0.000 0.500
VI. C17. Use Public Transportation
Item not tested.
Item not tested.
Item not tested.
Item not tested.
Item not tested.
Item not tested.
Table 10-12b Agreement with the clinical team: Functional status: Supplemental functional ability and
IADLs
CARE item
Clinician discipline: Case mgr
Clinician discipline:
OT
Clinician discipline:
PT
Clinician discipline:
RN
Clinician discipline:
Speech
Clinician discipline:
Other
VI. C1. Wash Upper Body
0.750 0.681 0.811 0.648 0.938 0.682
VI. C2. Shower/bathe Self
0.923 0.815 0.825 0.763 0.625 0.500
VI. C3. Roll Left and Right
0.758 0.797 0.912 0.822 0.875 0.826
(continued)
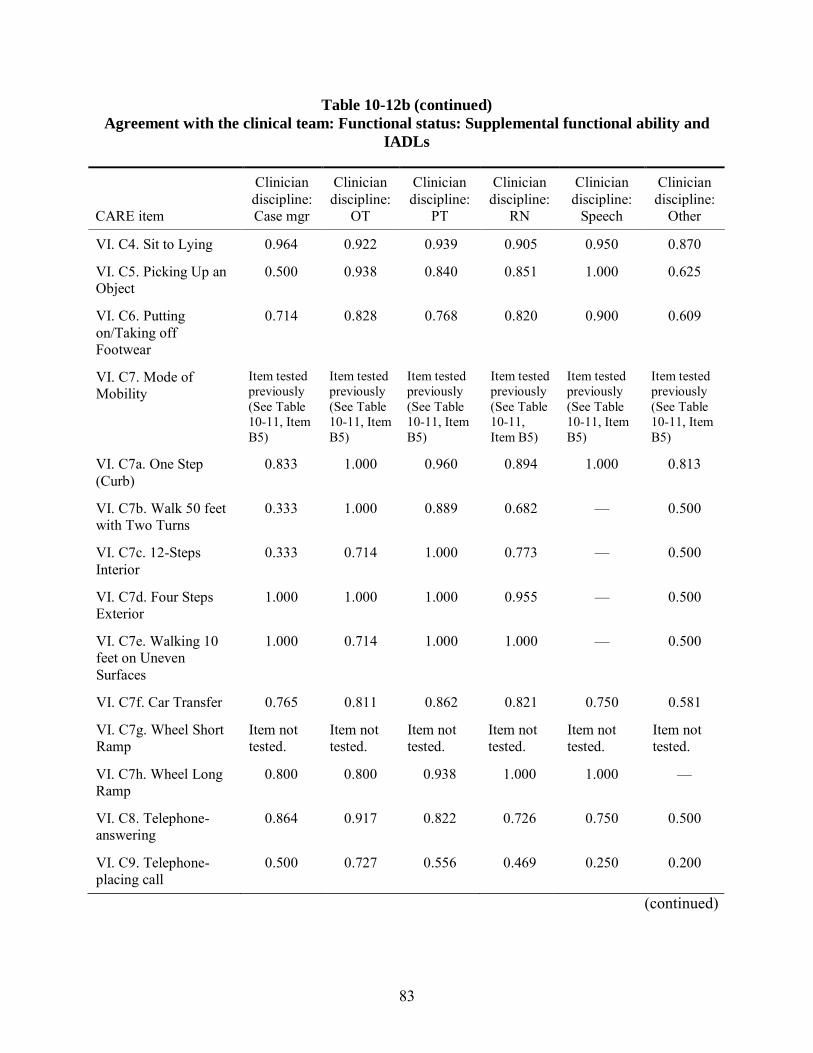
83
Table 10-12b (continued) Agreement with the clinical team: Functional status: Supplemental functional ability and
IADLs
CARE item
Clinician discipline: Case mgr
Clinician discipline:
OT
Clinician discipline:
PT
Clinician discipline:
RN
Clinician discipline:
Speech
Clinician discipline:
Other
VI. C4. Sit to Lying 0.964 0.922 0.939 0.905 0.950 0.870
VI. C5. Picking Up an Object
0.500 0.938 0.840 0.851 1.000 0.625
VI. C6. Putting on/Taking off Footwear
0.714 0.828 0.768 0.820 0.900 0.609
VI. C7. Mode of Mobility
Item tested previously (See Table 10-11, Item B5)
Item tested previously (See Table 10-11, Item B5)
Item tested previously (See Table 10-11, Item B5)
Item tested previously (See Table 10-11, Item B5)
Item tested previously (See Table 10-11, Item B5)
Item tested previously (See Table 10-11, Item B5)
VI. C7a. One Step (Curb)
0.833 1.000 0.960 0.894 1.000 0.813
VI. C7b. Walk 50 feet with Two Turns
0.333 1.000 0.889 0.682 — 0.500
VI. C7c. 12-Steps Interior
0.333 0.714 1.000 0.773 — 0.500
VI. C7d. Four Steps Exterior
1.000 1.000 1.000 0.955 — 0.500
VI. C7e. Walking 10 feet on Uneven Surfaces
1.000 0.714 1.000 1.000 — 0.500
VI. C7f. Car Transfer 0.765 0.811 0.862 0.821 0.750 0.581
VI. C7g. Wheel Short Ramp
Item not tested.
Item not tested.
Item not tested.
Item not tested.
Item not tested.
Item not tested.
VI. C7h. Wheel Long Ramp
0.800 0.800 0.938 1.000 1.000 —
VI. C8. Telephone-answering
0.864 0.917 0.822 0.726 0.750 0.500
VI. C9. Telephone-placing call
0.500 0.727 0.556 0.469 0.250 0.200
(continued)
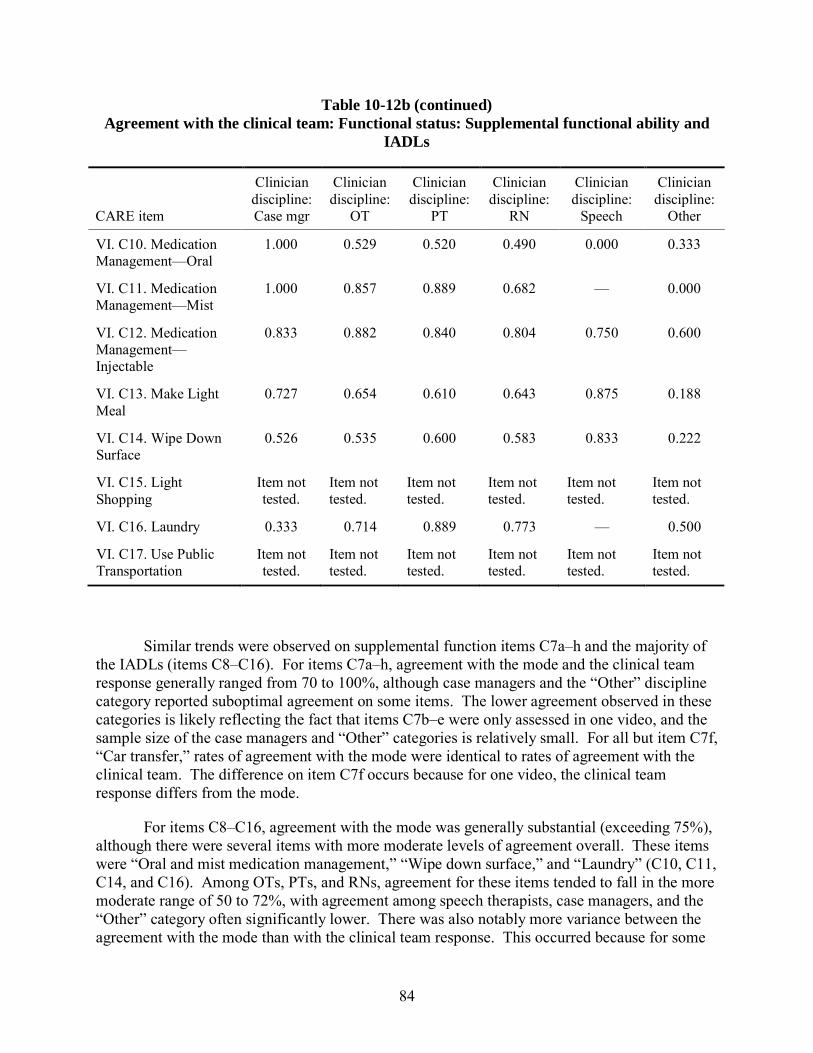
84
Table 10-12b (continued) Agreement with the clinical team: Functional status: Supplemental functional ability and
IADLs
CARE item
Clinician discipline: Case mgr
Clinician discipline:
OT
Clinician discipline:
PT
Clinician discipline:
RN
Clinician discipline:
Speech
Clinician discipline:
Other
VI. C10. Medication Management—Oral
1.000 0.529 0.520 0.490 0.000 0.333
VI. C11. Medication Management—Mist
1.000 0.857 0.889 0.682 — 0.000
VI. C12. Medication Management—Injectable
0.833 0.882 0.840 0.804 0.750 0.600
VI. C13. Make Light Meal
0.727 0.654 0.610 0.643 0.875 0.188
VI. C14. Wipe Down Surface
0.526 0.535 0.600 0.583 0.833 0.222
VI. C15. Light Shopping
Item not tested.
Item not tested.
Item not tested.
Item not tested.
Item not tested.
Item not tested.
VI. C16. Laundry 0.333 0.714 0.889 0.773 — 0.500
VI. C17. Use Public Transportation
Item not tested.
Item not tested.
Item not tested.
Item not tested.
Item not tested.
Item not tested.
Similar trends were observed on supplemental function items C7a–h and the majority of the IADLs (items C8–C16). For items C7a–h, agreement with the mode and the clinical team response generally ranged from 70 to 100%, although case managers and the “Other” discipline category reported suboptimal agreement on some items. The lower agreement observed in these categories is likely reflecting the fact that items C7b–e were only assessed in one video, and the sample size of the case managers and “Other” categories is relatively small. For all but item C7f, “Car transfer,” rates of agreement with the mode were identical to rates of agreement with the clinical team. The difference on item C7f occurs because for one video, the clinical team response differs from the mode.
For items C8–C16, agreement with the mode was generally substantial (exceeding 75%), although there were several items with more moderate levels of agreement overall. These items were “Oral and mist medication management,” “Wipe down surface,” and “Laundry” (C10, C11, C14, and C16). Among OTs, PTs, and RNs, agreement for these items tended to fall in the more moderate range of 50 to 72%, with agreement among speech therapists, case managers, and the “Other” category often significantly lower. There was also notably more variance between the agreement with the mode than with the clinical team response. This occurred because for some
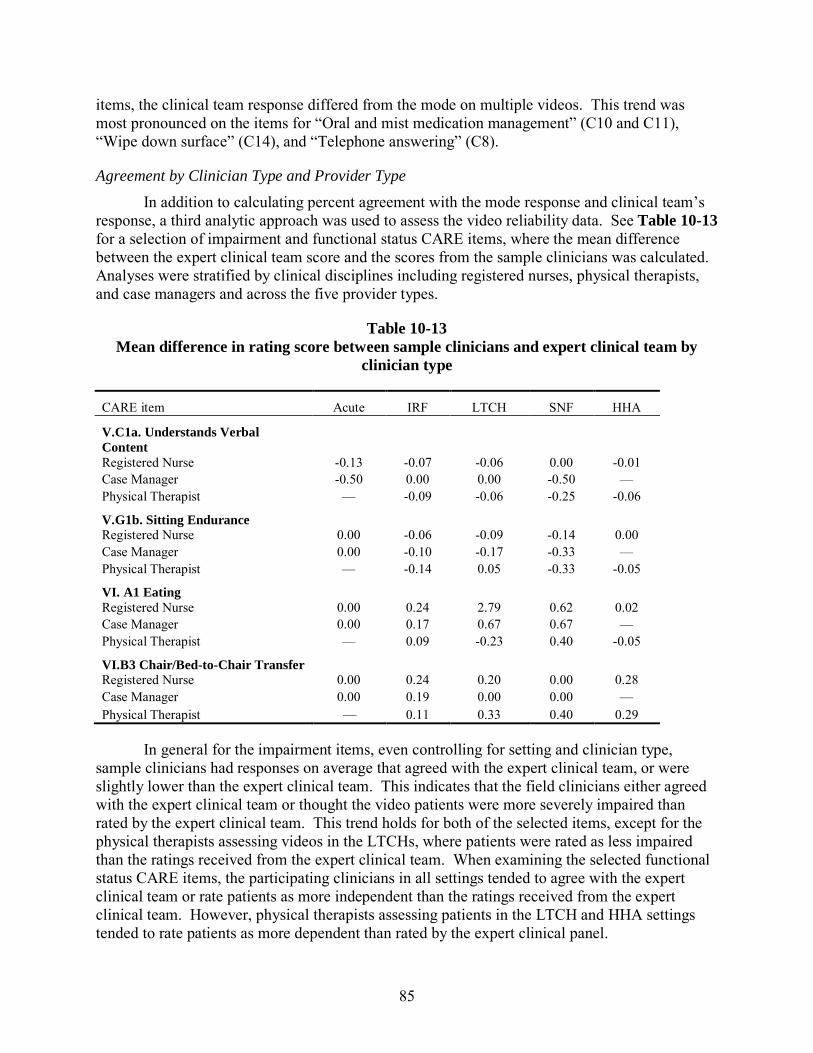
85
items, the clinical team response differed from the mode on multiple videos. This trend was most pronounced on the items for “Oral and mist medication management” (C10 and C11), “Wipe down surface” (C14), and “Telephone answering” (C8).
Agreement by Clinician Type and Provider Type In addition to calculating percent agreement with the mode response and clinical team’s
response, a third analytic approach was used to assess the video reliability data. See Table 10-13 for a selection of impairment and functional status CARE items, where the mean difference between the expert clinical team score and the scores from the sample clinicians was calculated. Analyses were stratified by clinical disciplines including registered nurses, physical therapists, and case managers and across the five provider types.
Table 10-13 Mean difference in rating score between sample clinicians and expert clinical team by
clinician type
CARE item Acute IRF LTCH SNF HHA
V.C1a. Understands Verbal Content Registered Nurse -0.13 -0.07 -0.06 0.00 -0.01 Case Manager -0.50 0.00 0.00 -0.50 — Physical Therapist — -0.09 -0.06 -0.25 -0.06
V.G1b. Sitting Endurance Registered Nurse 0.00 -0.06 -0.09 -0.14 0.00 Case Manager 0.00 -0.10 -0.17 -0.33 — Physical Therapist — -0.14 0.05 -0.33 -0.05
VI. A1 Eating Registered Nurse 0.00 0.24 2.79 0.62 0.02 Case Manager 0.00 0.17 0.67 0.67 — Physical Therapist — 0.09 -0.23 0.40 -0.05
VI.B3 Chair/Bed-to-Chair Transfer Registered Nurse 0.00 0.24 0.20 0.00 0.28 Case Manager 0.00 0.19 0.00 0.00 — Physical Therapist — 0.11 0.33 0.40 0.29
In general for the impairment items, even controlling for setting and clinician type, sample clinicians had responses on average that agreed with the expert clinical team, or were slightly lower than the expert clinical team. This indicates that the field clinicians either agreed with the expert clinical team or thought the video patients were more severely impaired than rated by the expert clinical team. This trend holds for both of the selected items, except for the physical therapists assessing videos in the LTCHs, where patients were rated as less impaired than the ratings received from the expert clinical team. When examining the selected functional status CARE items, the participating clinicians in all settings tended to agree with the expert clinical team or rate patients as more independent than the ratings received from the expert clinical team. However, physical therapists assessing patients in the LTCH and HHA settings tended to rate patients as more dependent than rated by the expert clinical panel.
86
10.9 Summary
Levels of agreement for the vast majority of items evaluated were substantial nearly across the board. As noted, for selected items levels of agreement are lower but should be interpreted with caution due to small sample sizes, and were generally on items that the credential type with the low agreement would not typically assess in day-to-day practice. Where this occurs, the potential impact of small sample size has been noted. In general, these levels of agreement are consistent with the kappa statistics reported for the inter-rater reliability testing in Section 2 of this volume.
87
SECTION 11 FUNCTIONAL STATUS INTERNAL CONSISTENCY AND ITEM LEVEL ANALYSIS
11.1 Overview and Methods
11.1.1 Overview
This section is part of a series of internal consistency analyses that examine the development of the CARE item set’s functional status subscales. Development of the CARE functional status subscales was theoretically driven based on our efforts to capture the strongest qualities of each of the three legacy measures (MDS, FIM® , and OASIS) while recognizing that the characteristics of patients seen in the various post-acute care (PAC) settings and thus their functional status measurement needs are both overlapping and distinct (Granger et al., 1986; Jette, Haley, and Ni, 2003). We recognized that the CARE function measures must reflect a wider range of disability than any of the three existing measures to be relevant across the service continuum. We further attempted to enhance quality of existing instruments by writing questions that tapped into the expression of a single dimension of functional status, that is, need for assistance. To optimize measurement of performance levels we created a 6-level response scale to gain more sensitivity than the legacy measures. However, we found that a 4-level response scale best captured function for the instrumental activities of daily living (IADL) items.
Measurement Range and PAC Setting
The acquisition, loss, and/or recovery of functioning is known in part to be hierarchical, proceeding from the easiest and most basic of every activities through more difficult and complex functional activities. At the easiest end of the range, the most basic measures express simple movement disorders (Verbrugge and Jette, 1994) such as rolling left to right. These are closest to impairment on the pathway from disease to its functional consequences and most appropriate to people in long-term care hospitals (LTCHs). There are no functional status measures mandated for use in LTCHs; thus, currently this level of measurement is not strongly represented in the legacy measures. Basic movements are preconditions for performance of activities of daily living (ADLs). Basic ADLs are self care activities necessary to all people in all circumstances and will be relevant to measurement across most settings for most people (i.e., at acute care hospital discharge, LTCHs, inpatient rehabilitation facilities [IRFs], skilled nursing facilities [SNFs], and home health agencies [HHAs]). ADLs in some form are included in all three of the legacy tools. IADLs (Lawton and Brody, 1969), in contrast, are more complex, advanced, and difficult activities, typically appropriate in acute rehabilitation discharge and in home care settings. IADLs are currently included only in the OASIS legacy measure. The more complex the activity, the more environmental barriers and facilitators potentially influence its performance (Stineman et al., 2007; World Health Organization, 2001).
Dimensionality
The current PAC payment systems generally measure motor function on a single dimension. For example, the motor score of the IRF-PAI characterizes a patient’s functioning on 13 physical activities that include both self care and mobility. Our goal in developing the CARE function items was to maximize both discrimination and predictive power by creating two function-related subscales, mobility and self care. The use of two subscales is consistent with
88
the current literature, which suggests that the use of two scales will improve differentiation among patients with different types of impairments. Mobility and self care scales have been used in prior work (Haley et al., 2002) and also have clinical validity. Although not currently included in the IRF classification, mobility and self care subscales have also been identified in the FIM®. Specifically, these subscales are nested within its broader motor score (Stineman et al., 1997). The decision to use a complete motor scale or mobility and self care subscales depends in part on the question being asked. If the intent is to approximate total disability in one large metric, then more aggregated scales are stronger, but details about the disability, particularly by diagnosis, may be obscured. For example, studies have shown that different types of impairment may result in distinct patterns of disability (Qu et al., 2011).
Consistent with the ICF model of disability, sphincter management is not included in the CARE functional status measure, as bowel and bladder incontinence is defined at the level of impairment (organ dysfunction). The functional task “toilet hygiene” reflects the related toileting management activities. The more complex instrumental ADLs were written to be conceptually consistent with items of the motor scale (i.e., focusing on the physical ability to complete the tasks) but may have the potential to form a third psychometrically distinct dimension (Lawton and Brody, 1969; Stineman, Ross, and Maislin, 2005). Patients attempting to reintegrate themselves back into their communities often have therapeutic goals in these more complex areas of living.
Preliminary analyses begin with classic analytic approaches widely utilized to evaluate new instruments and scales and progresses to item level assessment techniques. Appendix C provides information on these preliminary analyses, which are the building blocks for the analyses provided in this section. Part A of Appendix C presents a series of Cronbach’s alpha reliability analyses followed by exploratory factor analyses. These analyses are useful for determining the internal consistency of an item set and looking at the underlying structure of the data. That is, these analyses help assess how well items that theoretically should be highly interrelated actually correlate with one another. Part B in Appendix C provides the initial Rasch analyses, which are used to confirm and build on the internal consistency findings by identifying items that may require further evaluation as to their fit in a mobility or self care scale. This parallel use of both classical psychometric analyses along with Rasch techniques is being used increasingly in scale construction and measurement today (Jette et al., 2008) and is reflected in our current work on the CARE item set.
The analyses presented below take into account the lessons learned from the preliminary results displayed in Appendix C. Results Section 1 begins with Rasch reanalyses of the self care items. In Results Section 2, the internal consistency analysis will be revisited in light of what is learned from the Rasch analysis. Finally, Results Section 3 contains an examination of the functional status items with a split data file, which provides admission and discharge data representation without repeated measures.
The data for these analyses are subset into admission data (N = 17,773) and discharge data (N = 18,403), but spanning across all provider types. The number of completed cases limits the sample size available for the analysis of each variable. The number of completed cases is influenced by whether the item is core or supplemental (supplemental by definition are scored on
89
a subset of patients) and whether an item was “not attempted,” for example, due to medical or safety concerns.
11.1.2 CARE Items Analyzed
Previous analyses (see Appendix C) of the CARE functional status items indicated three potential groupings: self care, mobility, and IADL. Note: The self care and mobility items were also assessed in a combined motor scale. The results presented in this section evaluate how well the CARE items map onto the theoretical classifications with separate as well as combined admission and discharge data sets. The items in the CARE functional status section were classified as follows:
• Self Care
◦ Eating (A1)
◦ Oral Hygiene (A3)
◦ Toilet Hygiene (A4)
◦ Upper Body Dressing (A5)
◦ Lower Body Dressing (A6)
◦ Wash Upper Body (C1, Supplement)
◦ Shower/Bathe Self (C2, Supplement)
◦ Putting On/Taking Off Footwear (C6, Supplement)
• Mobility ◦ Lying to Sitting on Side of Bed (B1)
◦ Sit to Stand (B2)
◦ Chair/Bed-to-Chair Transfer (B3)
◦ Toilet Transfer (B4)
◦ Walk 150 ft (B5a1)
◦ Walk 100 ft (B5a2)
◦ Walk 50 ft (B5a3)
◦ Walk in Room Once Standing (B5a4)
◦ Roll Left and Right (C3, Supplement)
◦ Sit to Lying (C4, Supplement)
◦ Picking Up Objects (C5, Supplement)
◦ 1 Step (C7a, Supplement)
◦ Walk 50 Feet with 2 Turns (C7b, Supplement)
◦ 12 Steps-interior (C7c, Supplement)
90
◦ 4 Steps-exterior (C7d, Supplement)
◦ Walking 10 Feet on Uneven Surfaces (C7e, Supplement)
◦ Car Transfer (C7f, Supplement)
• IADL
◦ Telephone Answering (C8, Supplement)
◦ Telephone-placing Call (C9, Supplement)
◦ Medication Management (C10–C12, Supplement)
• Oral (C10), inhalant/mist (C11), and injectable (C12) ◦ Make Light Meal (C13, Supplement)
◦ Wipe Down Surface (C14, Supplement)
◦ Light Shopping (C15, Supplement)
◦ Laundry (C16, Supplement)
◦ Use Public Transportation (C17, Supplement)
11.1.3 Analysis Methods for CARE Items
The analysis of the CARE functional status items began with a classical assessment of scale psychometrics, Cronbach’s alpha, followed by exploratory factor analysis (see Appendix C). Cronbach’s alpha is an assessment of internal consistency reliability that is frequently assessed when survey instruments or scale psychometrics are published. The Cronbach’s alpha reliability estimate ranges from zero to one, with an estimate of zero indicating that there is no consistency of measurement among the items, and an estimate of one indicating perfect consistency. Many cut-off criteria exist to determine whether or not a scale shows good consistency or whether the items “hang together” well. The general consensus is that Cronbach’s alpha should be at least 0.80 for an adequate scale. Results suggest that self care and mobility subscales formed internally consistent constructs at both admission and discharge, and across provider types.
In conjunction with the Cronbach’s alpha, an exploratory factor analysis was conducted to determine if there are underlying latent constructs in the data that might indicate whether or not a single construct (i.e., motor function) explains the variability in the CARE items or if multiple constructs provide a better explanation (i.e., self care and mobility). Exploratory factor analysis is a commonly utilized variable reduction technique that identifies the number of latent constructs in a variable set. Those latent constructs and the variables associated with them are then tested in confirmatory factor analysis. A series of estimates are used to determine if the model provides good “fit” or explanation of the data. The results of these initial analyses can be found in Appendix C. They suggest that IADLs could load on their own factor, while self care and mobility items could form a single motor scale. When self care and mobility items are factor analyzed without IADL items, results suggest that self care and mobility items form discrete subscales.
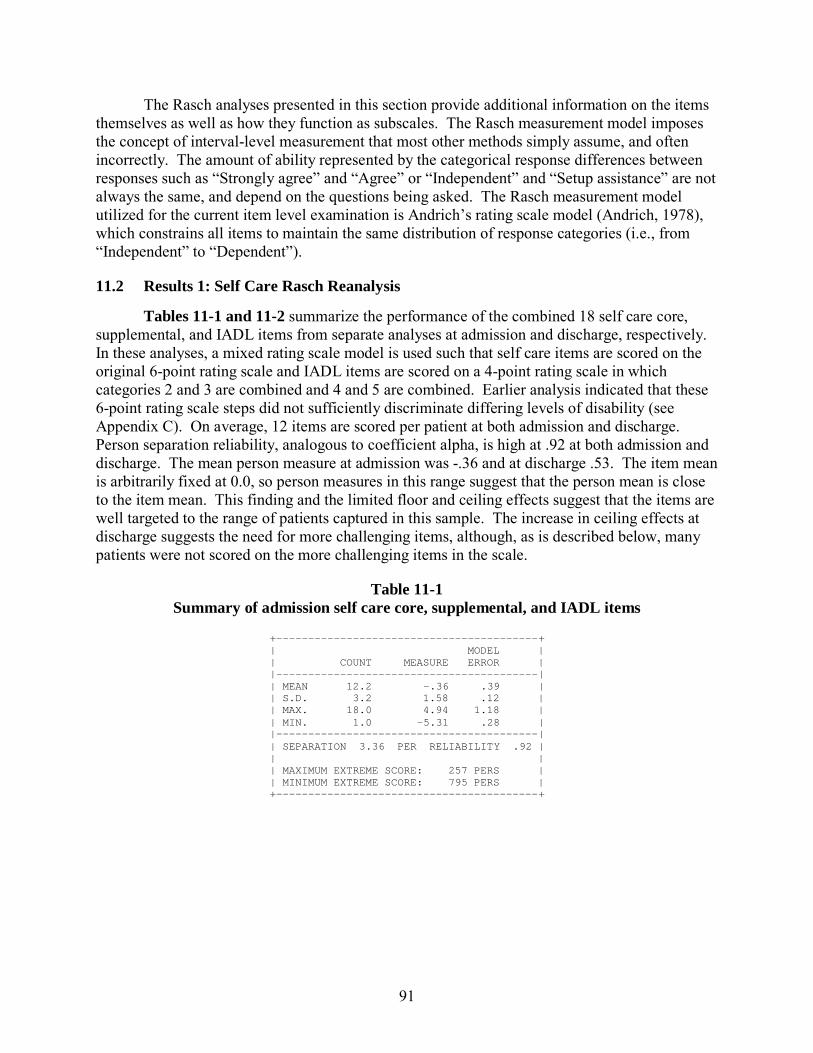
91
The Rasch analyses presented in this section provide additional information on the items themselves as well as how they function as subscales. The Rasch measurement model imposes the concept of interval-level measurement that most other methods simply assume, and often incorrectly. The amount of ability represented by the categorical response differences between responses such as “Strongly agree” and “Agree” or “Independent” and “Setup assistance” are not always the same, and depend on the questions being asked. The Rasch measurement model utilized for the current item level examination is Andrich’s rating scale model (Andrich, 1978), which constrains all items to maintain the same distribution of response categories (i.e., from “Independent” to “Dependent”).
11.2 Results 1: Self Care Rasch Reanalysis
Tables 11-1 and 11-2 summarize the performance of the combined 18 self care core, supplemental, and IADL items from separate analyses at admission and discharge, respectively. In these analyses, a mixed rating scale model is used such that self care items are scored on the original 6-point rating scale and IADL items are scored on a 4-point rating scale in which categories 2 and 3 are combined and 4 and 5 are combined. Earlier analysis indicated that these 6-point rating scale steps did not sufficiently discriminate differing levels of disability (see Appendix C). On average, 12 items are scored per patient at both admission and discharge. Person separation reliability, analogous to coefficient alpha, is high at .92 at both admission and discharge. The mean person measure at admission was -.36 and at discharge .53. The item mean is arbitrarily fixed at 0.0, so person measures in this range suggest that the person mean is close to the item mean. This finding and the limited floor and ceiling effects suggest that the items are well targeted to the range of patients captured in this sample. The increase in ceiling effects at discharge suggests the need for more challenging items, although, as is described below, many patients were not scored on the more challenging items in the scale.
Table 11-1 Summary of admission self care core, supplemental, and IADL items
+ ----------------------------------------- + | MODEL | | COUNT MEASURE ERROR | | ----------------------------------------- | | MEAN 12.2 - .36 .39 | | S.D. 3.2 1.58 .12 | | MAX. 18.0 4.94 1.18 |
| MIN. 1.0 - 5.31 .28 | | ----------------------------------------- |
| SEPARATION 3.36 PER RELIABILIT Y .92 | | | | MAXIMUM EXTREME SCORE: 257 PERS | | MINIMUM EXTREME SCORE: 795 PERS | + ----------------------------------------- +
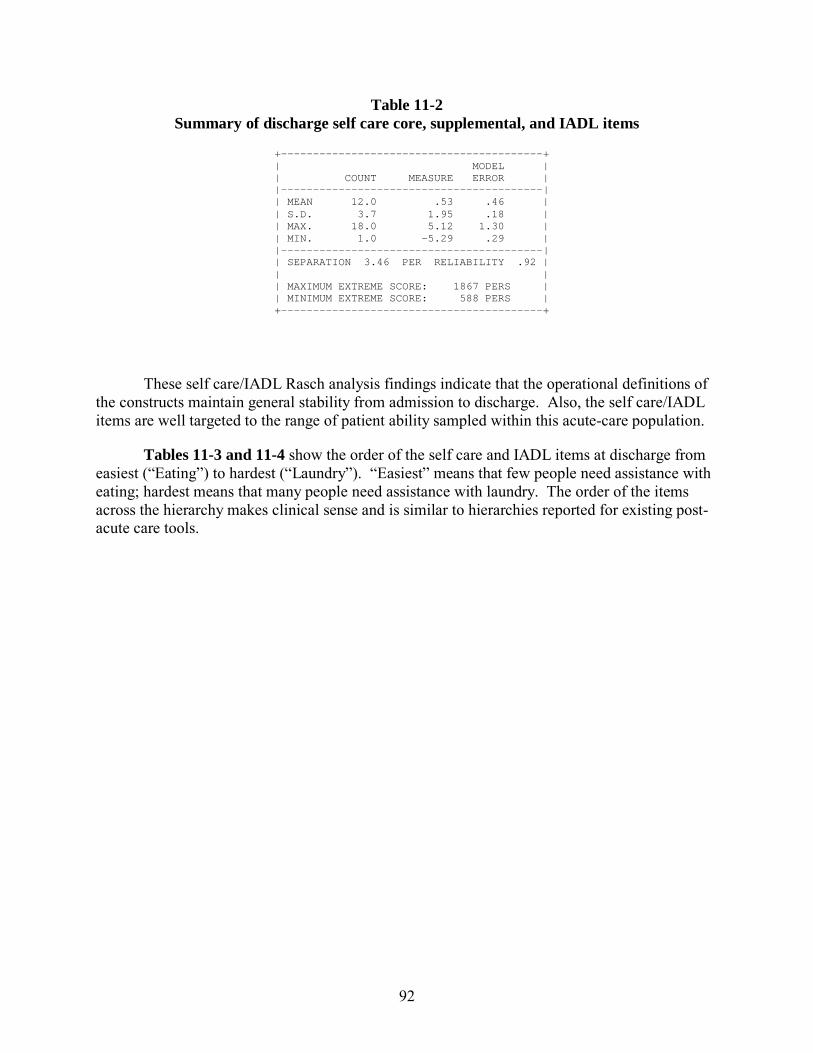
92
Table 11-2 Summary of discharge self care core, supplemental, and IADL items
+ ----------------------------------------- +
| MODEL | | COUNT MEASURE ERROR | | ----------------------------------------- | | MEAN 12.0 .53 .46 |
| S.D. 3.7 1.95
.18 | | MAX. 18.0 5.12 1.30 |
| MIN. 1.0 - 5.29 .29 | | ----------------------------------------- | | SEPARATION 3.46 PER RELIABILITY .92 |
| | | MAXIMUM EXTREME SCO RE: 1867 PERS | | MINIMUM EXTREME SCORE: 588 PERS | + ----------------------------------------- +
These self care/IADL Rasch analysis findings indicate that the operational definitions of the constructs maintain general stability from admission to discharge. Also, the self care/IADL items are well targeted to the range of patient ability sampled within this acute-care population.
Tables 11-3 and 11-4 show the order of the self care and IADL items at discharge from easiest (“Eating”) to hardest (“Laundry”). “Easiest” means that few people need assistance with eating; hardest means that many people need assistance with laundry. The order of the items across the hierarchy makes clinical sense and is similar to hierarchies reported for existing post-acute care tools.
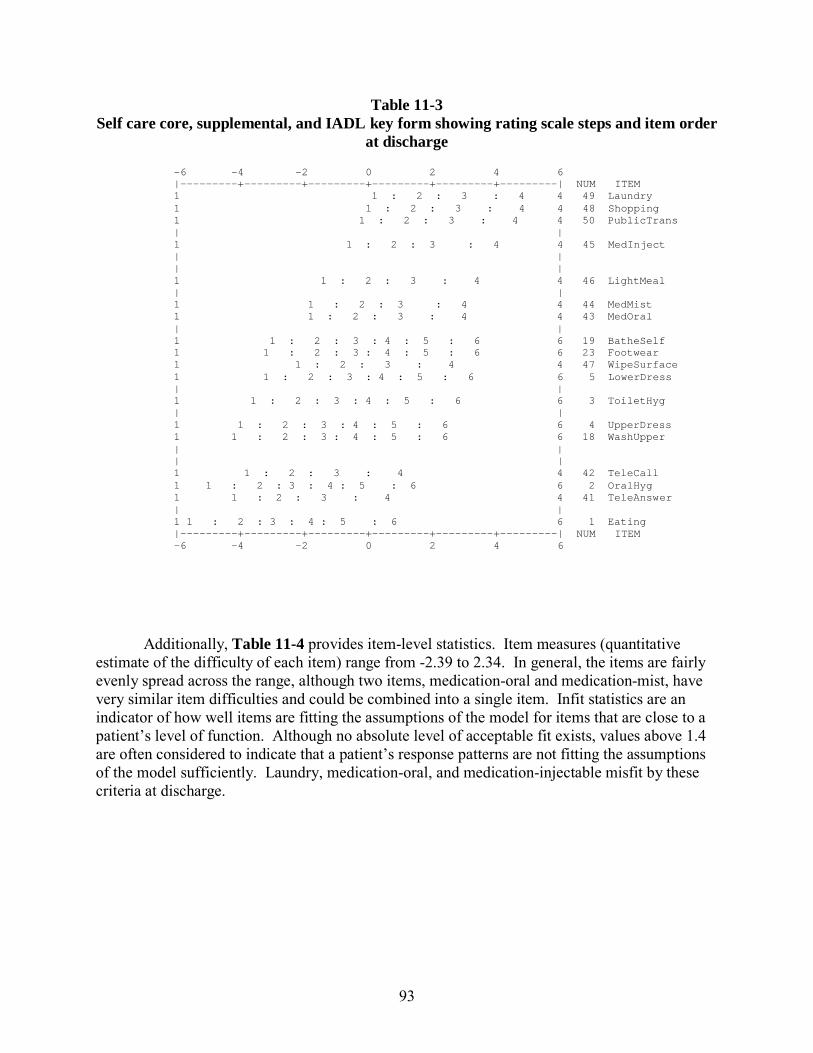
93
Table 11-3 Self care core, supplemental, and IADL key form showing rating scale steps and item order
at discharge
- 6 - 4 - 2 0 2 4 6 | --------- + --------- + --------- + --------- + --------- + --------- | NUM ITEM
1 1 : 2 : 3 : 4 4 49 Laundry
1
1 : 2 : 3 : 4 4 48 Shopping 1 1 : 2 : 3 : 4 4 50 PublicTrans
| |
1 1 : 2 : 3 : 4 4 45 MedInject | |
| |
1 1 : 2 : 3 : 4 4 46 LightMeal |
| 1 1 : 2 : 3 : 4 4 44 MedMist
1 1 : 2 : 3 : 4 4 43 MedOral
| | 1
1 : 2 : 3 : 4 : 5 : 6 6 19 BatheSelf
1 1 : 2 : 3 : 4 : 5 : 6 6 23 Footwear 1 1 : 2 : 3 : 4 4 47 WipeSurface
1 1 : 2
: 3 : 4 : 5 : 6 6 5 LowerDress | | 1 1 : 2 : 3 : 4 : 5 : 6 6 3 ToiletHyg
| | 1 1 : 2 : 3 : 4 : 5 : 6 6 4 UpperDress
1 1 : 2 : 3 : 4 : 5 : 6 6 18 WashUpper
| | |
| 1 1 : 2 : 3 : 4 4 42 TeleCall
1 1 : 2 : 3 : 4 : 5 : 6 6 2 OralHyg
1 1 : 2 : 3 : 4 4 41 TeleAnsw er
| | 1 1 : 2 : 3 : 4 : 5 : 6 6 1 Eating
| --------- + --------- + --------- + --------- + --------- + --------- | NUM ITEM - 6 - 4 - 2 0 2
4 6
Additionally, Table 11-4 provides item-level statistics. Item measures (quantitative estimate of the difficulty of each item) range from -2.39 to 2.34. In general, the items are fairly evenly spread across the range, although two items, medication-oral and medication-mist, have very similar item difficulties and could be combined into a single item. Infit statistics are an indicator of how well items are fitting the assumptions of the model for items that are close to a patient’s level of function. Although no absolute level of acceptable fit exists, values above 1.4 are often considered to indicate that a patient’s response patterns are not fitting the assumptions of the model sufficiently. Laundry, medication-oral, and medication-injectable misfit by these criteria at discharge.
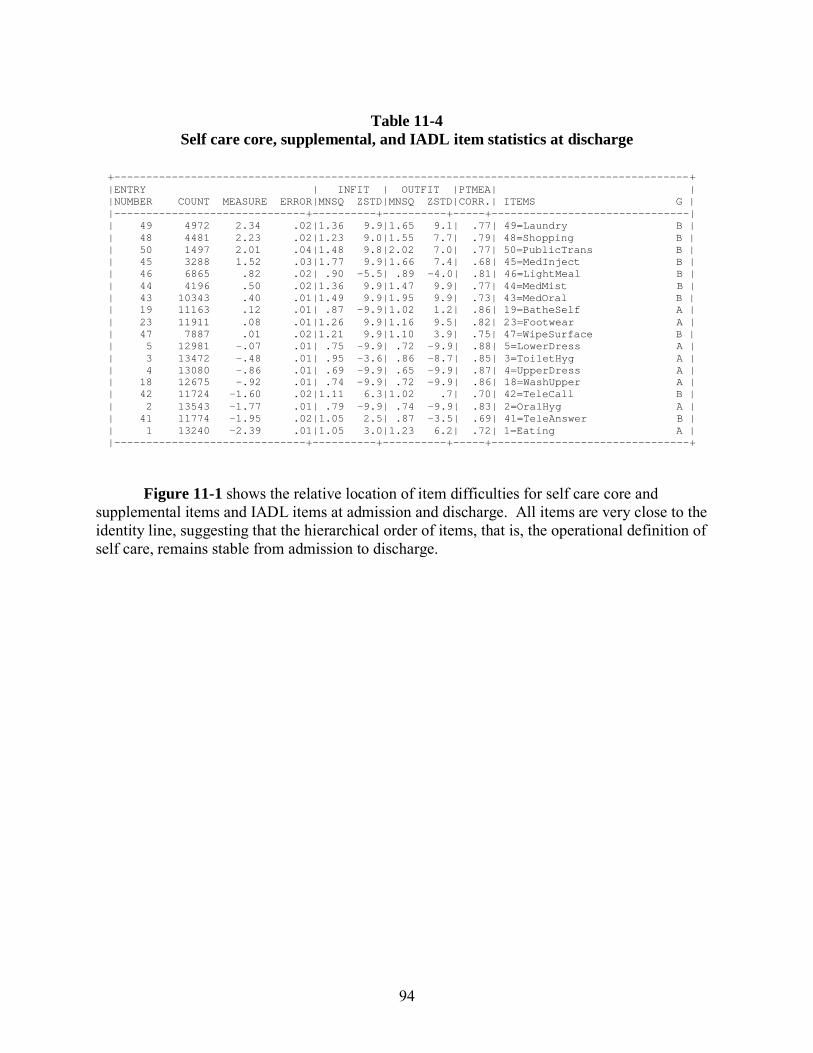
94
Table 11-4 Self care core, supplemental, and IADL item statistics at discharge
+ ------------------------------------------------------------------------------------------ +
|ENTRY | INFIT | OUTFIT |PTMEA|
| |NUMBER COUNT MEASURE ERROR|MNSQ ZSTD|MNSQ ZSTD|CORR.| ITEMS G |
| ------------------------------ + ---------- + ---------- + ----- + ------------------------------- | | 49 4972 2.34 .02|1.36
9.9|1.65 9.1| .77| 49=Laundry B | | 48 4481 2.23 .02|1.23 9.0|1.55 7.7| .79| 48=Shopping B |
| 50 1497 2.01 .04|1.48 9.8|2.02 7.0| .77| 50=PublicTrans B | | 45 3288
1.52 .03|1.77 9.9|1.66 7.4| .68| 45=MedInject B |
| 46 6865 .82 .02| .90 - 5.5| .89 - 4.0| .81| 46=LightMeal B |
| 44 4196 .50 .02|1.36 9.9|1.47 9.9| .77| 44=MedMist
B | | 43 10343 .40 .01|1.49 9.9|1.95 9.9| .73| 43=MedOral B | | 19 11163 .12 .01| .87 - 9.9|1.02 1.2| .86| 19=BatheSelf A |
| 23 11911 .08 .01|1.26 9.9|1.16 9.5| .82| 2 3=Footwear A | | 47 7887 .01 .02|1.21 9.9|1.10 3.9| .75| 47=WipeSurface B | | 5 12981 - .07 .01| .75 - 9.9| .72 - 9.9| .88| 5=LowerDress A |
| 3 13472 - .48 .01| .95 - 3.6| .86 - 8.7| .85| 3=ToiletHyg A | | 4 13080 - .86 .01| .69 - 9.9| .65 - 9.9| .87| 4=UpperDress A | | 18 12675 - .92 .01| .74 - 9.9| .72 - 9.9| .86| 18=WashUpper A | | 42 11724
- 1.60 .02|1.11 6.3|1.02 .7| .70| 42=TeleCall B |
| 2 13543 - 1.77 .01| .79 - 9.9| .74 - 9.9| .83| 2=OralHyg A |
| 41 11774 - 1.95 .02|1.05 2.5| .87 - 3.5| .69| 41=TeleAnswer
B |
| 1 13240 - 2.39 .01|1.05 3.0|1.23 6.2| .72| 1=Eating A | | ------------------------------ + ---------- + ---------- + ----- + ------------------------------- +
Figure 11-1 shows the relative location of item difficulties for self care core and
supplemental items and IADL items at admission and discharge. All items are very close to the identity line, suggesting that the hierarchical order of items, that is, the operational definition of self care, remains stable from admission to discharge.
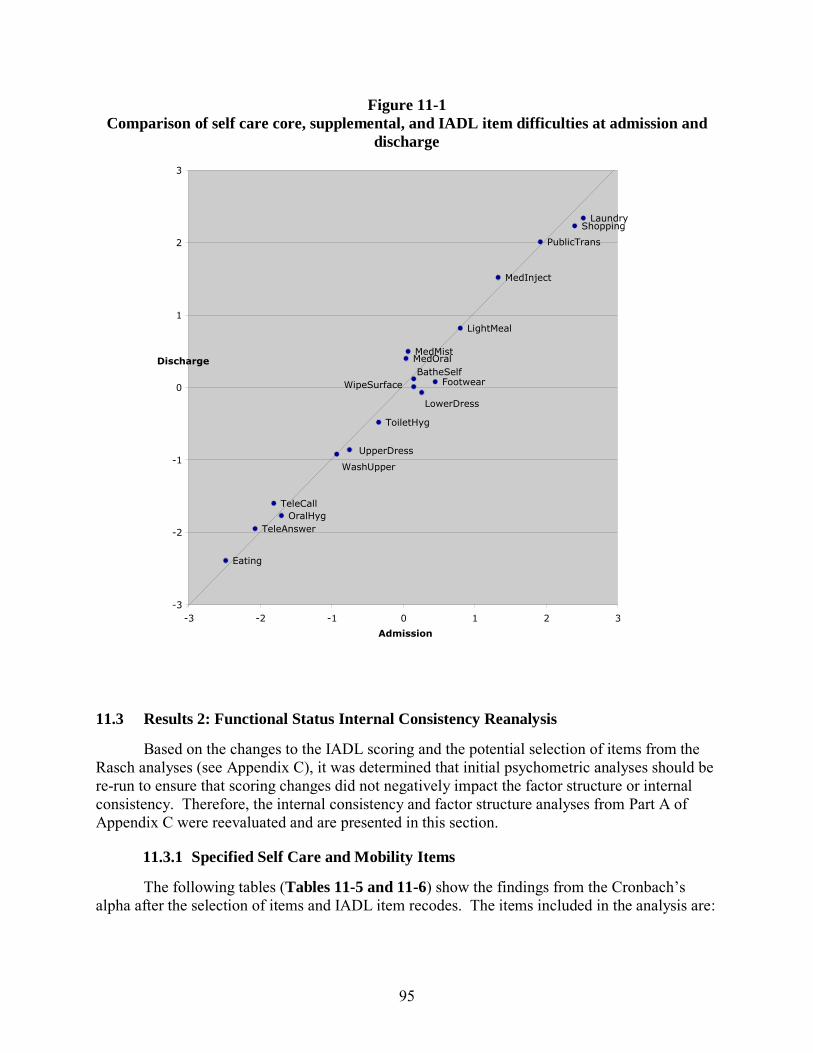
95
Figure 11-1 Comparison of self care core, supplemental, and IADL item difficulties at admission and
discharge
Eating
OralHyg
ToiletHyg
UpperDress
LowerDress
WashUpper
BatheSelf Footwear
TeleAnswer TeleCall
MedOral MedMist
MedInject
LightMeal
WipeSurface
Shopping Laundry PublicTrans
-3
-2
-1
0
1
2
3
-3 -2 -1 0 1 2 3 Admission
Discharge
11.3 Results 2: Functional Status Internal Consistency Reanalysis
Based on the changes to the IADL scoring and the potential selection of items from the Rasch analyses (see Appendix C), it was determined that initial psychometric analyses should be re-run to ensure that scoring changes did not negatively impact the factor structure or internal consistency. Therefore, the internal consistency and factor structure analyses from Part A of Appendix C were reevaluated and are presented in this section.
11.3.1 Specified Self Care and Mobility Items
The following tables (Tables 11-5 and 11-6) show the findings from the Cronbach’s alpha after the selection of items and IADL item recodes. The items included in the analysis are:
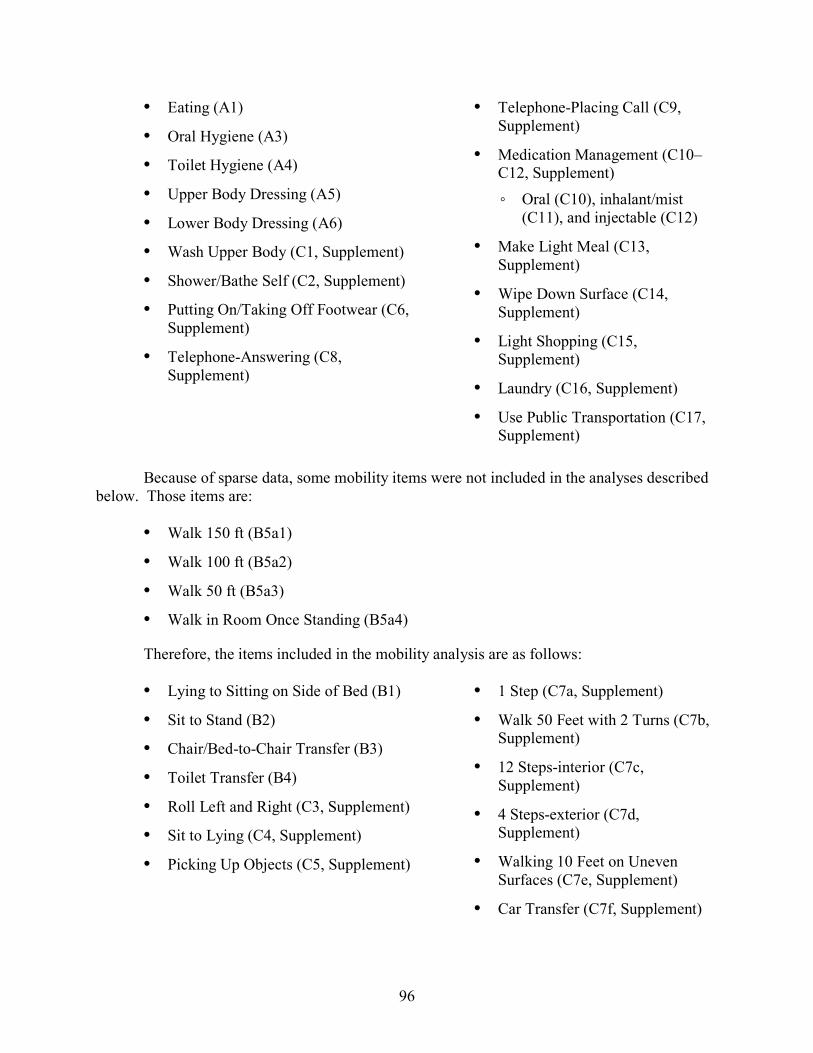
96
• Eating (A1)
• Oral Hygiene (A3)
• Toilet Hygiene (A4)
• Upper Body Dressing (A5)
• Lower Body Dressing (A6)
• Wash Upper Body (C1, Supplement)
• Shower/Bathe Self (C2, Supplement)
• Putting On/Taking Off Footwear (C6, Supplement)
• Telephone-Answering (C8, Supplement)
• Telephone-Placing Call (C9, Supplement)
• Medication Management (C10–C12, Supplement)
◦ Oral (C10), inhalant/mist (C11), and injectable (C12)
• Make Light Meal (C13, Supplement)
• Wipe Down Surface (C14, Supplement)
• Light Shopping (C15, Supplement)
• Laundry (C16, Supplement)
• Use Public Transportation (C17, Supplement)
Because of sparse data, some mobility items were not included in the analyses described below. Those items are:
• Walk 150 ft (B5a1)
• Walk 100 ft (B5a2)
• Walk 50 ft (B5a3)
• Walk in Room Once Standing (B5a4)
Therefore, the items included in the mobility analysis are as follows:
• Lying to Sitting on Side of Bed (B1)
• Sit to Stand (B2)
• Chair/Bed-to-Chair Transfer (B3)
• Toilet Transfer (B4)
• Roll Left and Right (C3, Supplement)
• Sit to Lying (C4, Supplement)
• Picking Up Objects (C5, Supplement)
• 1 Step (C7a, Supplement)
• Walk 50 Feet with 2 Turns (C7b, Supplement)
• 12 Steps-interior (C7c, Supplement)
• 4 Steps-exterior (C7d, Supplement)
• Walking 10 Feet on Uneven Surfaces (C7e, Supplement)
• Car Transfer (C7f, Supplement)
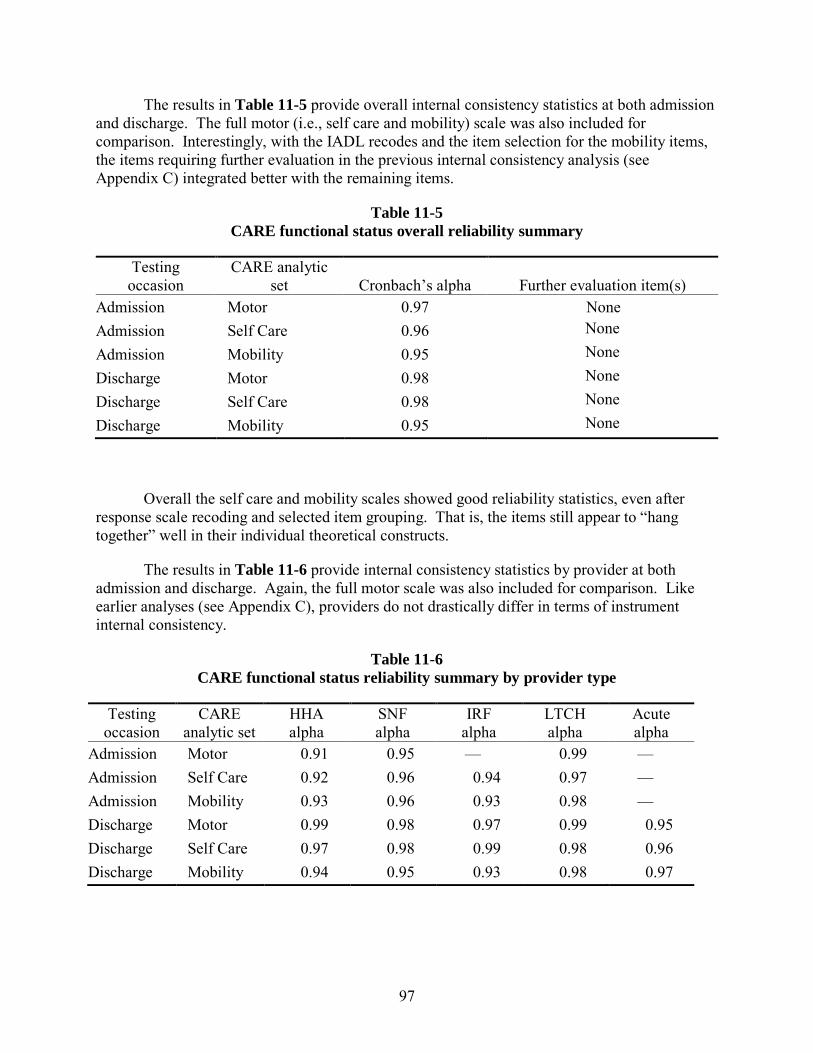
97
The results in Table 11-5 provide overall internal consistency statistics at both admission and discharge. The full motor (i.e., self care and mobility) scale was also included for comparison. Interestingly, with the IADL recodes and the item selection for the mobility items, the items requiring further evaluation in the previous internal consistency analysis (see Appendix C) integrated better with the remaining items.
Table 11-5 CARE functional status overall reliability summary
Testing occasion
CARE analytic set Cronbach’s alpha Further evaluation item(s)
Admission Motor 0.97 None Admission Self Care 0.96 None
Admission Mobility 0.95 None
Discharge Motor 0.98 None
Discharge Self Care 0.98 None
Discharge Mobility 0.95 None
Overall the self care and mobility scales showed good reliability statistics, even after response scale recoding and selected item grouping. That is, the items still appear to “hang together” well in their individual theoretical constructs.
The results in Table 11-6 provide internal consistency statistics by provider at both admission and discharge. Again, the full motor scale was also included for comparison. Like earlier analyses (see Appendix C), providers do not drastically differ in terms of instrument internal consistency.
Table 11-6 CARE functional status reliability summary by provider type
Testing occasion
CARE analytic set
HHA alpha
SNF alpha
IRF alpha
LTCH alpha
Acute alpha
Admission Motor 0.91 0.95 — 0.99 — Admission Self Care 0.92 0.96 0.94 0.97 — Admission Mobility 0.93 0.96 0.93 0.98 — Discharge Motor 0.99 0.98 0.97 0.99 0.95 Discharge Self Care 0.97 0.98 0.99 0.98 0.96 Discharge Mobility 0.94 0.95 0.93 0.98 0.97
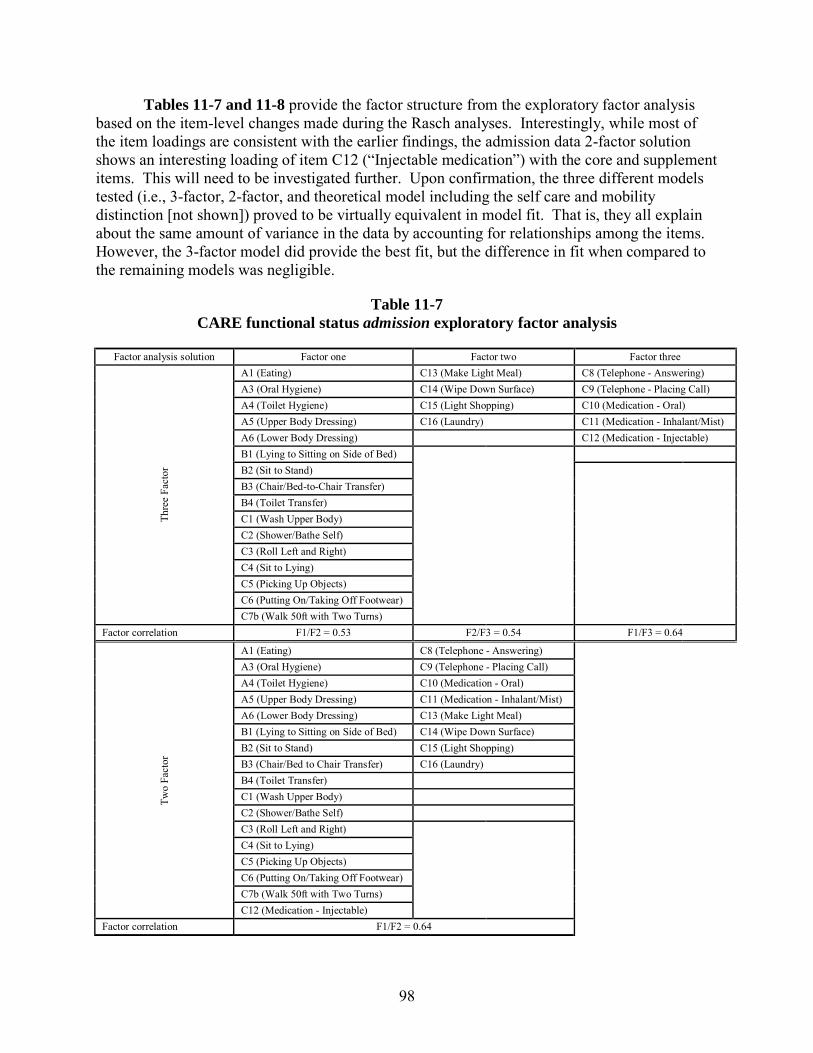
98
Tables 11-7 and 11-8 provide the factor structure from the exploratory factor analysis based on the item-level changes made during the Rasch analyses. Interestingly, while most of the item loadings are consistent with the earlier findings, the admission data 2-factor solution shows an interesting loading of item C12 (“Injectable medication”) with the core and supplement items. This will need to be investigated further. Upon confirmation, the three different models tested (i.e., 3-factor, 2-factor, and theoretical model including the self care and mobility distinction [not shown]) proved to be virtually equivalent in model fit. That is, they all explain about the same amount of variance in the data by accounting for relationships among the items. However, the 3-factor model did provide the best fit, but the difference in fit when compared to the remaining models was negligible.
Table 11-7 CARE functional status admission exploratory factor analysis
Factor analysis solution Factor one Factor two Factor three
Thre
e Fa
ctor
A1 (Eating) A3 (Oral Hygiene) A4 (Toilet Hygiene) A5 (Upper Body Dressing) A6 (Lower Body Dressing) B1 (Lying to Sitting on Side of Bed) B2 (Sit to Stand) B3 (Chair/Bed-to-Chair Transfer) B4 (Toilet Transfer) C1 (Wash Upper Body) C2 (Shower/Bathe Self) C3 (Roll Left and Right) C4 (Sit to Lying) C5 (Picking Up Objects) C6 (Putting On/Taking Off Footwear) C7b (Walk 50ft with Two Turns)
C13 (Make Light Meal) C14 (Wipe Down Surface) C15 (Light Shopping) C16 (Laundry)
C8 (Telephone - Answering) C9 (Telephone - Placing Call) C10 (Medication - Oral) C11 (Medication - Inhalant/Mist) C12 (Medication - Injectable)
Factor correlation F1/F2 = 0.53 F2/F3 = 0.54 F1/F3 = 0.64
Two
Fact
or
A1 (Eating) A3 (Oral Hygiene) A4 (Toilet Hygiene) A5 (Upper Body Dressing) A6 (Lower Body Dressing) B1 (Lying to Sitting on Side of Bed) B2 (Sit to Stand) B3 (Chair/Bed to Chair Transfer) B4 (Toilet Transfer) C1 (Wash Upper Body) C2 (Shower/Bathe Self) C3 (Roll Left and Right) C4 (Sit to Lying) C5 (Picking Up Objects) C6 (Putting On/Taking Off Footwear) C7b (Walk 50ft with Two Turns) C12 (Medication - Injectable)
C8 (Telephone - Answering) C9 (Telephone - Placing Call) C10 (Medication - Oral) C11 (Medication - Inhalant/Mist) C13 (Make Light Meal) C14 (Wipe Down Surface) C15 (Light Shopping) C16 (Laundry)
Factor correlation F1/F2 = 0.64
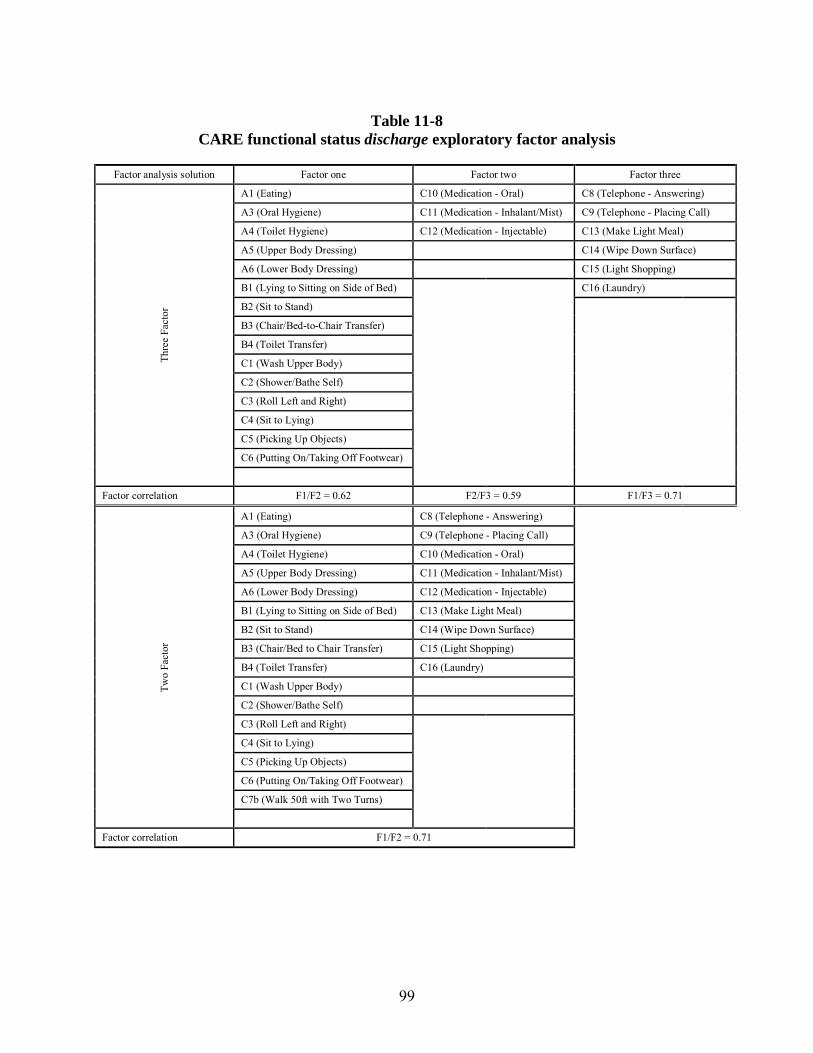
99
Table 11-8 CARE functional status discharge exploratory factor analysis
Factor analysis solution Factor one Factor two Factor three Th
ree
Fact
or
A1 (Eating)
A3 (Oral Hygiene)
A4 (Toilet Hygiene)
A5 (Upper Body Dressing)
A6 (Lower Body Dressing)
B1 (Lying to Sitting on Side of Bed)
B2 (Sit to Stand)
B3 (Chair/Bed-to-Chair Transfer)
B4 (Toilet Transfer)
C1 (Wash Upper Body)
C2 (Shower/Bathe Self)
C3 (Roll Left and Right)
C4 (Sit to Lying)
C5 (Picking Up Objects)
C6 (Putting On/Taking Off Footwear)
C10 (Medication - Oral)
C11 (Medication - Inhalant/Mist)
C12 (Medication - Injectable)
C8 (Telephone - Answering)
C9 (Telephone - Placing Call)
C13 (Make Light Meal)
C14 (Wipe Down Surface)
C15 (Light Shopping)
C16 (Laundry)
Factor correlation F1/F2 = 0.62 F2/F3 = 0.59 F1/F3 = 0.71
Two
Fact
or
A1 (Eating)
A3 (Oral Hygiene)
A4 (Toilet Hygiene)
A5 (Upper Body Dressing)
A6 (Lower Body Dressing)
B1 (Lying to Sitting on Side of Bed)
B2 (Sit to Stand)
B3 (Chair/Bed to Chair Transfer)
B4 (Toilet Transfer)
C1 (Wash Upper Body)
C2 (Shower/Bathe Self)
C3 (Roll Left and Right)
C4 (Sit to Lying)
C5 (Picking Up Objects)
C6 (Putting On/Taking Off Footwear)
C7b (Walk 50ft with Two Turns)
C8 (Telephone - Answering)
C9 (Telephone - Placing Call)
C10 (Medication - Oral)
C11 (Medication - Inhalant/Mist)
C12 (Medication - Injectable)
C13 (Make Light Meal)
C14 (Wipe Down Surface)
C15 (Light Shopping)
C16 (Laundry)
Factor correlation F1/F2 = 0.71
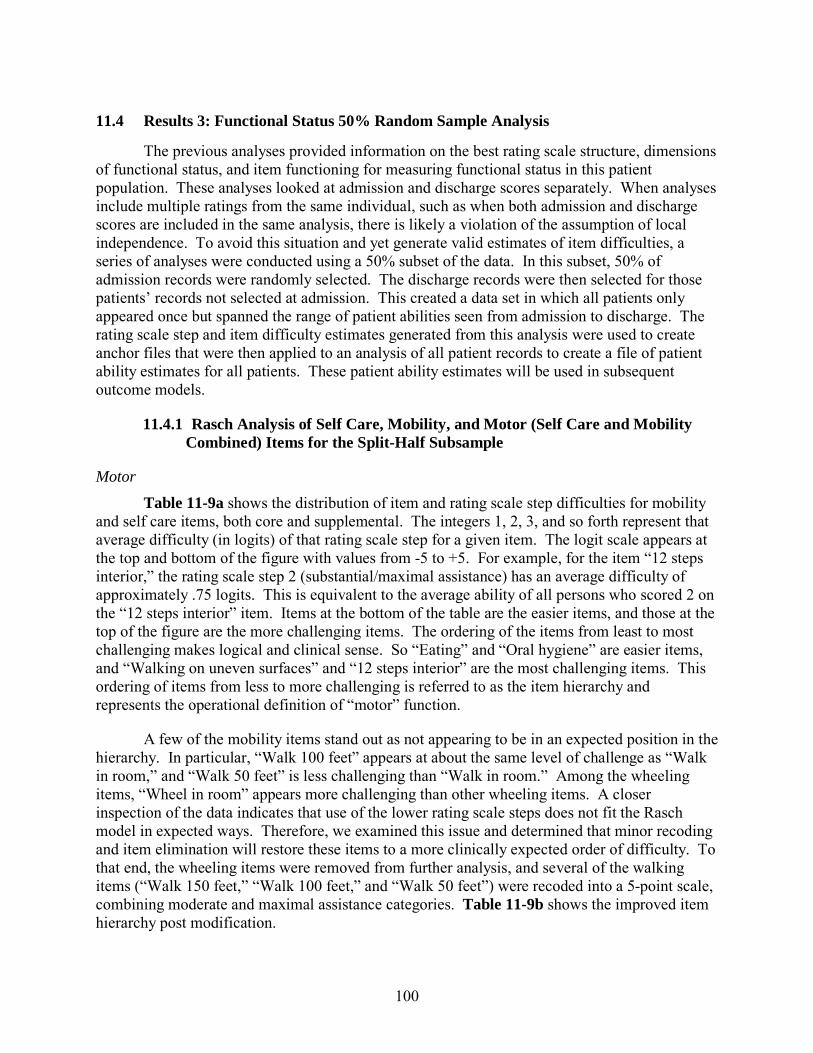
100
11.4 Results 3: Functional Status 50% Random Sample Analysis
The previous analyses provided information on the best rating scale structure, dimensions of functional status, and item functioning for measuring functional status in this patient population. These analyses looked at admission and discharge scores separately. When analyses include multiple ratings from the same individual, such as when both admission and discharge scores are included in the same analysis, there is likely a violation of the assumption of local independence. To avoid this situation and yet generate valid estimates of item difficulties, a series of analyses were conducted using a 50% subset of the data. In this subset, 50% of admission records were randomly selected. The discharge records were then selected for those patients’ records not selected at admission. This created a data set in which all patients only appeared once but spanned the range of patient abilities seen from admission to discharge. The rating scale step and item difficulty estimates generated from this analysis were used to create anchor files that were then applied to an analysis of all patient records to create a file of patient ability estimates for all patients. These patient ability estimates will be used in subsequent outcome models.
11.4.1 Rasch Analysis of Self Care, Mobility, and Motor (Self Care and Mobility Combined) Items for the Split-Half Subsample
Motor Table 11-9a shows the distribution of item and rating scale step difficulties for mobility
and self care items, both core and supplemental. The integers 1, 2, 3, and so forth represent that average difficulty (in logits) of that rating scale step for a given item. The logit scale appears at the top and bottom of the figure with values from -5 to +5. For example, for the item “12 steps interior,” the rating scale step 2 (substantial/maximal assistance) has an average difficulty of approximately .75 logits. This is equivalent to the average ability of all persons who scored 2 on the “12 steps interior” item. Items at the bottom of the table are the easier items, and those at the top of the figure are the more challenging items. The ordering of the items from least to most challenging makes logical and clinical sense. So “Eating” and “Oral hygiene” are easier items, and “Walking on uneven surfaces” and “12 steps interior” are the most challenging items. This ordering of items from less to more challenging is referred to as the item hierarchy and represents the operational definition of “motor” function.
A few of the mobility items stand out as not appearing to be in an expected position in the hierarchy. In particular, “Walk 100 feet” appears at about the same level of challenge as “Walk in room,” and “Walk 50 feet” is less challenging than “Walk in room.” Among the wheeling items, “Wheel in room” appears more challenging than other wheeling items. A closer inspection of the data indicates that use of the lower rating scale steps does not fit the Rasch model in expected ways. Therefore, we examined this issue and determined that minor recoding and item elimination will restore these items to a more clinically expected order of difficulty. To that end, the wheeling items were removed from further analysis, and several of the walking items (“Walk 150 feet,” “Walk 100 feet,” and “Walk 50 feet”) were recoded into a 5-point scale, combining moderate and maximal assistance categories. Table 11-9b shows the improved item hierarchy post modification.
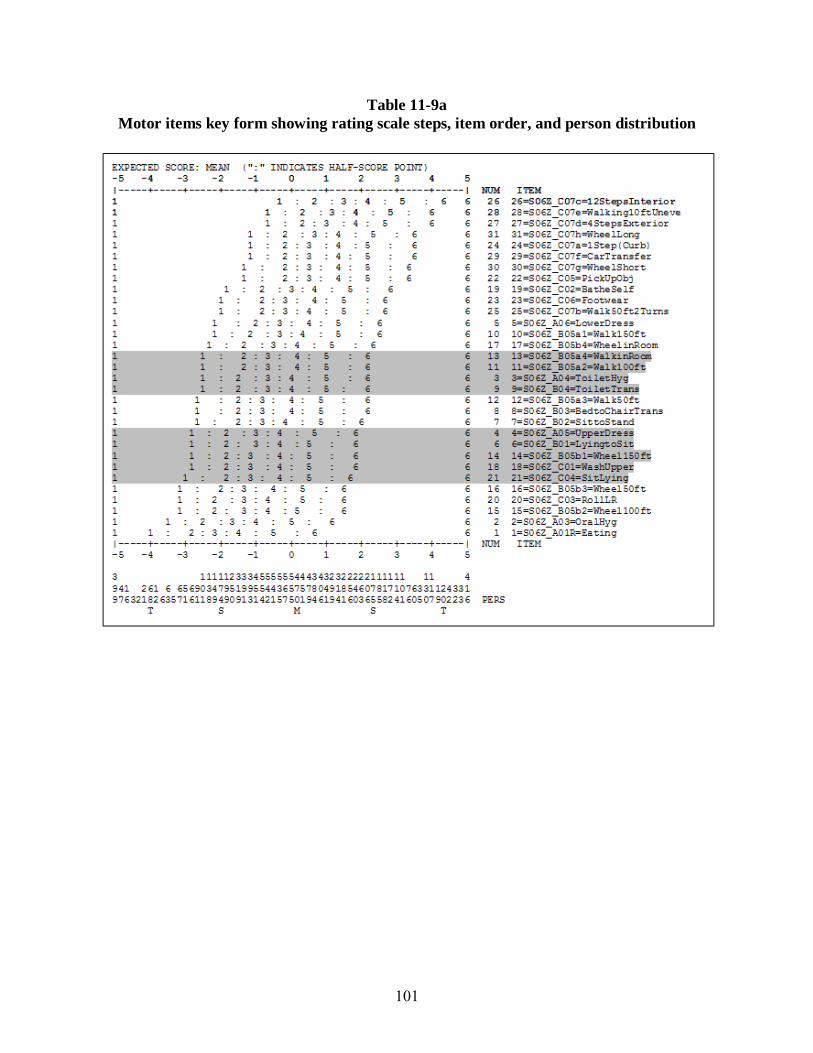
101
Table 11-9a Motor items key form showing rating scale steps, item order, and person distribution
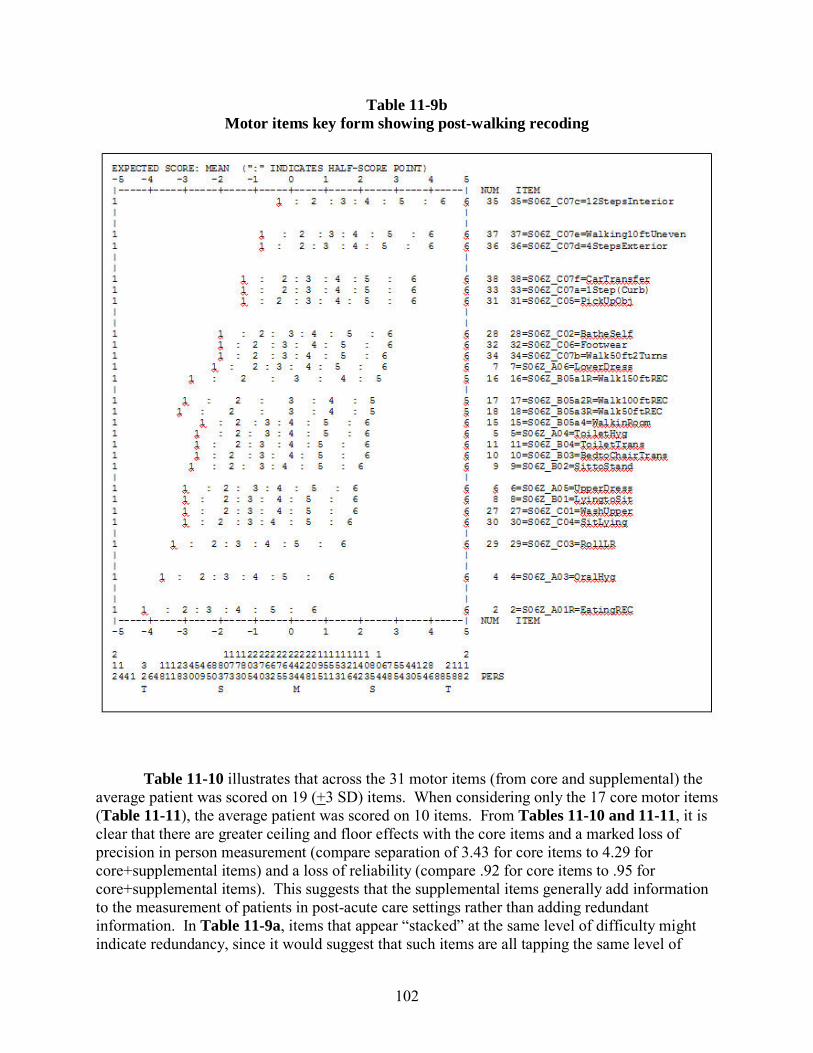
102
Table 11-9b Motor items key form showing post-walking recoding
Table 11-10 illustrates that across the 31 motor items (from core and supplemental) the average patient was scored on 19 (+3 SD) items. When considering only the 17 core motor items (Table 11-11), the average patient was scored on 10 items. From Tables 11-10 and 11-11, it is clear that there are greater ceiling and floor effects with the core items and a marked loss of precision in person measurement (compare separation of 3.43 for core items to 4.29 for core+supplemental items) and a loss of reliability (compare .92 for core items to .95 for core+supplemental items). This suggests that the supplemental items generally add information to the measurement of patients in post-acute care settings rather than adding redundant information. In Table 11-9a, items that appear “stacked” at the same level of difficulty might indicate redundancy, since it would suggest that such items are all tapping the same level of
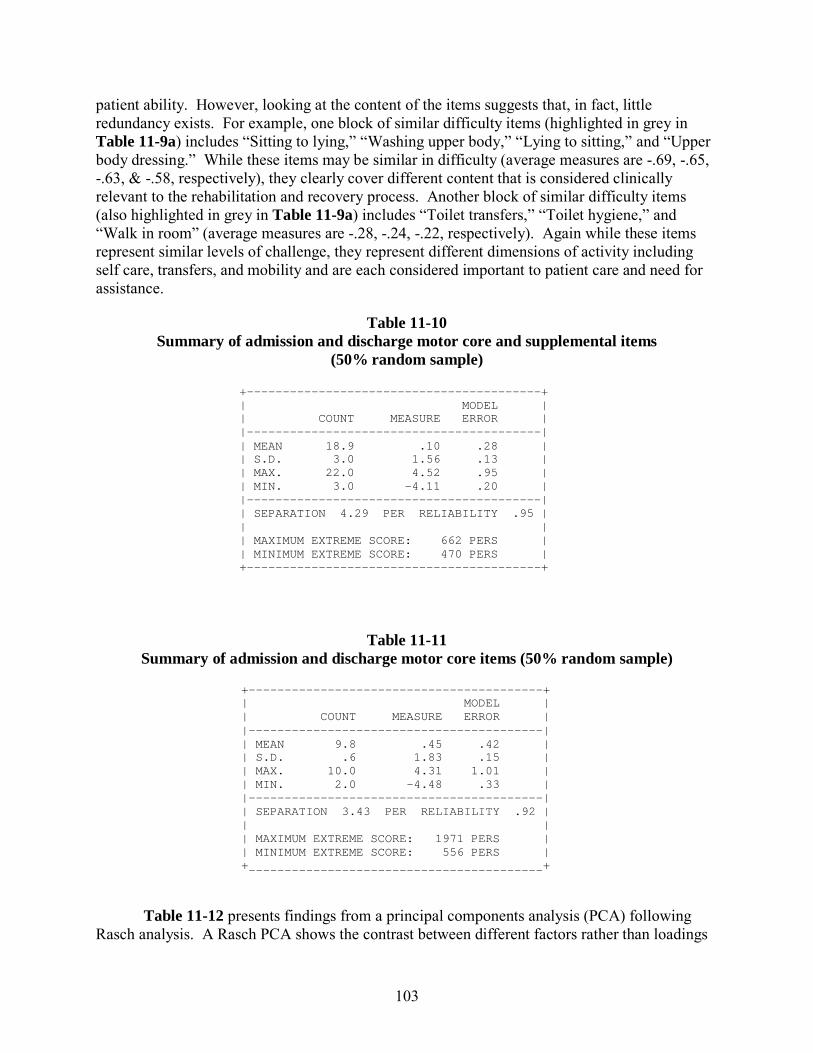
103
patient ability. However, looking at the content of the items suggests that, in fact, little redundancy exists. For example, one block of similar difficulty items (highlighted in grey in Table 11-9a) includes “Sitting to lying,” “Washing upper body,” “Lying to sitting,” and “Upper body dressing.” While these items may be similar in difficulty (average measures are -.69, -.65, -.63, & -.58, respectively), they clearly cover different content that is considered clinically relevant to the rehabilitation and recovery process. Another block of similar difficulty items (also highlighted in grey in Table 11-9a) includes “Toilet transfers,” “Toilet hygiene,” and “Walk in room” (average measures are -.28, -.24, -.22, respectively). Again while these items represent similar levels of challenge, they represent different dimensions of activity including self care, transfers, and mobility and are each considered important to patient care and need for assistance.
Table 11-10 Summary of admission and discharge motor core and supplemental items
(50% random sample)
+ ----------------------------------------- + | MODEL | | COUNT MEASURE ERROR | | ----------------------------------------- | | MEAN 18.9 .10 .28 | | S.D. 3.0 1.56 .13 | | MAX. 22.0 4.52 .95 | | MIN. 3.0 - 4.11 .20 | | ---------- ------------------------------- | | SEPARATION 4.29 PER RELIABILITY .95 | | | | MAXIMUM EXTREME SCORE: 662 PERS | | MINIMUM EXTREME SCORE: 470 PERS | + ----------------------------------------- +
Table 11-11 Summary of admission and discharge motor core items (50% random sample)
+ ----------------------------------------- + | MODEL | | COUNT MEASURE ERROR | | ----------------------------------------- | | MEAN 9.8 .45 .42 | | S.D. .6 1.83 .15 | | MAX. 10.0 4.31 1.01 | | MIN. 2.0 - 4.48 .33 | | ----------------------------------------- | | SEPARATION 3.43 PER RELIABILIT Y .92 | | | | MAXIMUM EXTREME SCORE: 1971 PERS | | MINIMUM EXTREME SCORE: 556 PERS | + + -----------------------------------------
Table 11-12 presents findings from a principal components analysis (PCA) following Rasch analysis. A Rasch PCA shows the contrast between different factors rather than loadings
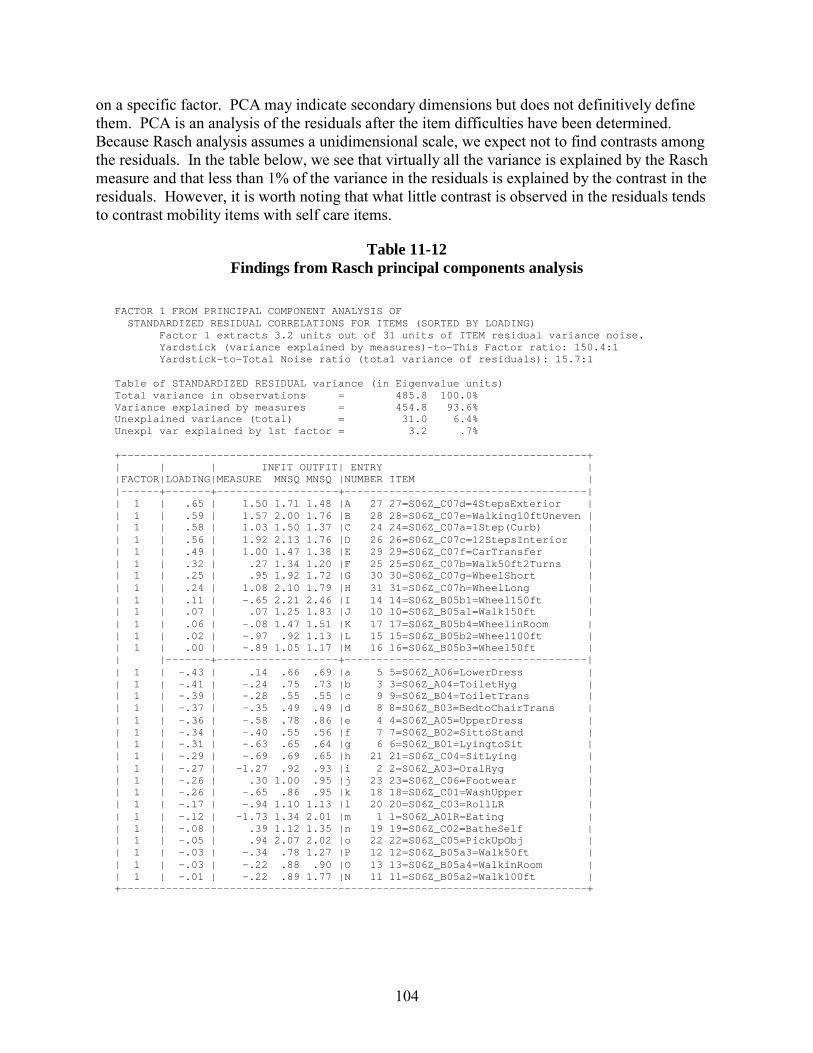
104
on a specific factor. PCA may indicate secondary dimensions but does not definitively define them. PCA is an analysis of the residuals after the item difficulties have been determined. Because Rasch analysis assumes a unidimensional scale, we expect not to find contrasts among the residuals. In the table below, we see that virtually all the variance is explained by the Rasch measure and that less than 1% of the variance in the residuals is explained by the contrast in the residuals. However, it is worth noting that what little contrast is observed in the residuals tends to contrast mobility items with self care items.
Table 11-12 Findings from Rasch principal components analysis
FACTOR 1 FROM PRINCIPAL COMPONENT ANALYSIS OF
STANDARDIZED RESIDUAL CORRELATIONS FOR ITEMS (SORTED BY LOADING)
Factor 1 extracts 3.2 units out of 31 units of ITEM residual variance noise.
Yardstick (variance explained by meas ures) - to - This Factor ratio: 150.4:1
Yardstick - to - Total Noise ratio (total variance of residuals): 15.7:1
Table of STANDARDIZED RESIDUAL variance (in Eigenvalue units) Total variance in observations = 485.8 100.0%
Variance explained by measures = 454.8 93.6% Unexplained variance (total) = 31.0 6.4% Unexpl var explained by 1st factor = 3.2 .7%
+ ------------------------------------------------------------------------- + | | | INF IT OUTFIT| ENTRY | |FACTOR|LOADING|MEASURE MNSQ MNSQ |NUMBER ITEM |
| ------ + ------- + ------------------- + -------------------------------------- | | 1 | .65 | 1.50 1.71 1.48 |A 27 27=S06Z_C07 d=4StepsExterior |
| 1 | .59 | 1.57 2.00 1.76 |B 28 28=S06Z_C07e=Walking10ftUneven | | 1 | .58 | 1.03 1.50 1.37 |C 24 24=S06Z_C07a=1Step(Curb) |
| 1 | .56 | 1.92 2.13 1.76 |D 26 26=S06Z_C07c=12StepsInterior | | 1
| .49 | 1.00 1.47 1.38 |E 29 29=S06Z_C07f=CarTransfer | | 1 | .32 | .27 1.34 1.20 |F 25 25=S06Z_C07b=Walk50ft2Turns |
| 1 | .25 | .95 1.92 1.72 |G 30 30=S06Z_C07g=WheelShort |
| 1 | .24 | 1.08 2.10 1.79 |H 31 31=S06Z_C07h=WheelLong |
| 1 | .11 | - .65 2.21 2.46 |I 14 14=S06Z_B05b1=Wheel150ft | | 1 | .07 | .07 1.25 1.83 |J 10 10=S06Z_B05a1=Walk150ft |
| 1 | .06 | - .08 1.47 1.51 |K 17 17=S06Z_B05b4=Wheel inRoom | | 1 | .02 | - .97 .92 1.13 |L 15 15=S06Z_B05b2=Wheel100ft | | 1 | .00 | - .89 1.05 1.17 |M 16 16=S06Z_B05b3=Wheel50ft | | | ------- + ------------------- + -------------------------------------- |
| 1 | - .43 | .14 .66 .69 |a 5 5=S06Z_A06=LowerDress | | 1 | - .41 | - .24 .75 .73 |b 3 3=S06Z_A04=ToiletHyg |
| 1 | - .39 | - .28 .55 .55 |c 9 9=S06Z_B04=ToiletTrans | | 1 | - .37 | - .35 .49 .49 |d 8
8=S06Z_B03=BedtoChairTrans | | 1 | - .36 | - .58 .78 .86 |e 4 4=S06Z_A05=UpperDress |
| 1 | - .34 | - .40 .55 .56 |f 7 7=S06Z_B02=SittoStand | | 1 | - .31 | - .63 .65 .64 |g 6 6=S06Z_B01=LyingtoSit
| | 1 | - .29 | - .69 .69 .65 |h 21 21=S06Z_C04=SitLying |
| 1 | - .27 | - 1.27 .92 .93 |i 2 2=S06Z_A03=OralHyg | | 1 | - .26 | .30 1.00 .95 |j 23 23=S06Z_C06=Footwear | | 1 | - .26 | - . 65 .86 .95 |k 18 18=S06Z_C01=WashUpper | | 1 | - .17 | - .94 1.10 1.13 |l 20 20=S06Z_C03=RollLR |
| 1 | - .12 | - 1.73 1.34 2.01 |m 1 1=S06Z_A01R=Eating | | 1 | - .08 | .39 1.12 1.35 |n 19 19=S06Z _C02=BatheSelf | | 1 | - .05 | .94 2.07 2.02 |o 22 22=S06Z_C05=PickUpObj | | 1 | - .03 | - .34 .78 1.27 |P 12 12=S06Z_B05a3=Walk50ft |
| 1 | - .03 | - .22 .88 .90 |O 13 13=S06Z_B05a4=WalkinRoom | |
1 | - .01 | - .22 .89 1.77 |N 11 11=S06Z_B05a2=Walk100ft | + ------------------------------------------------------------------------- +
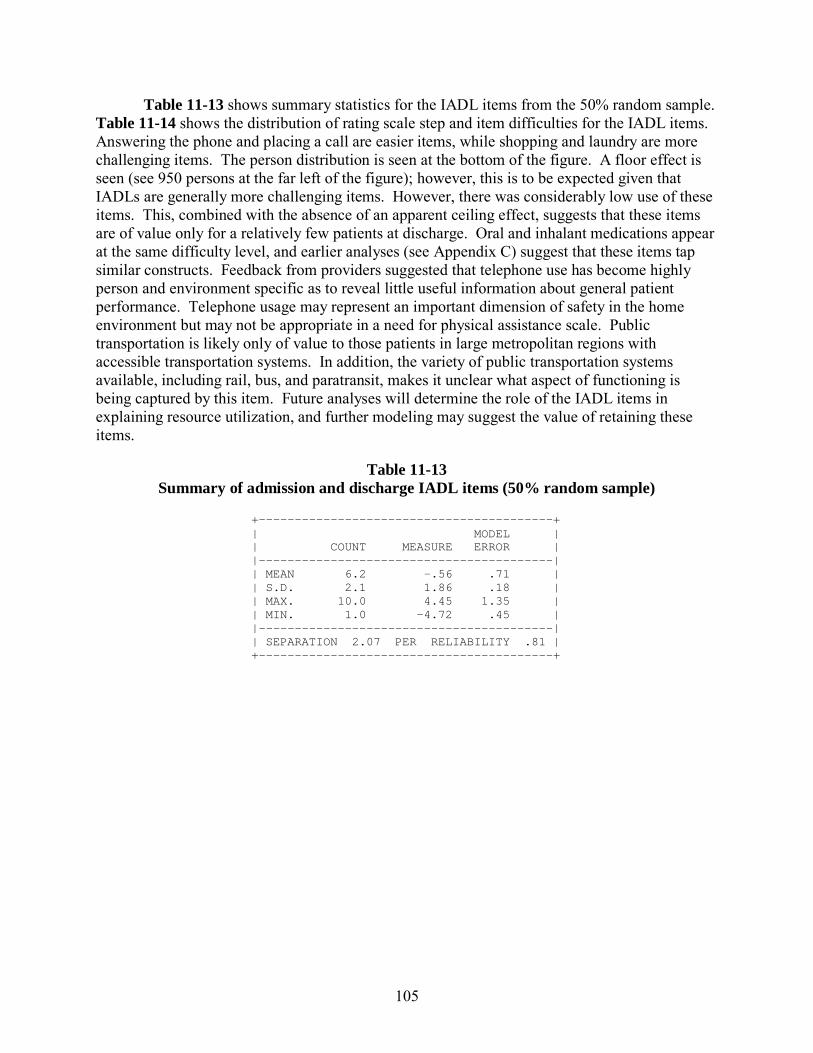
105
Table 11-13 shows summary statistics for the IADL items from the 50% random sample. Table 11-14 shows the distribution of rating scale step and item difficulties for the IADL items. Answering the phone and placing a call are easier items, while shopping and laundry are more challenging items. The person distribution is seen at the bottom of the figure. A floor effect is seen (see 950 persons at the far left of the figure); however, this is to be expected given that IADLs are generally more challenging items. However, there was considerably low use of these items. This, combined with the absence of an apparent ceiling effect, suggests that these items are of value only for a relatively few patients at discharge. Oral and inhalant medications appear at the same difficulty level, and earlier analyses (see Appendix C) suggest that these items tap similar constructs. Feedback from providers suggested that telephone use has become highly person and environment specific as to reveal little useful information about general patient performance. Telephone usage may represent an important dimension of safety in the home environment but may not be appropriate in a need for physical assistance scale. Public transportation is likely only of value to those patients in large metropolitan regions with accessible transportation systems. In addition, the variety of public transportation systems available, including rail, bus, and paratransit, makes it unclear what aspect of functioning is being captured by this item. Future analyses will determine the role of the IADL items in explaining resource utilization, and further modeling may suggest the value of retaining these items.
Table 11-13 Summary of admission and discharge IADL items (50% random sample)
+ ----------------------------------------- + | MODEL | | COUNT MEASURE ERROR | | ----------------------------------------- | | MEAN 6.2 - .56 .71 | | S.D. 2.1 1.86 .18 | | MAX. 10.0 4.45 1.35 | | MIN. 1.0 - 4.72 .45 | | ---------------------------- ------------- | | SEPARATION 2.07 PER RELIABILITY .81 | + ----------------------------------------- +
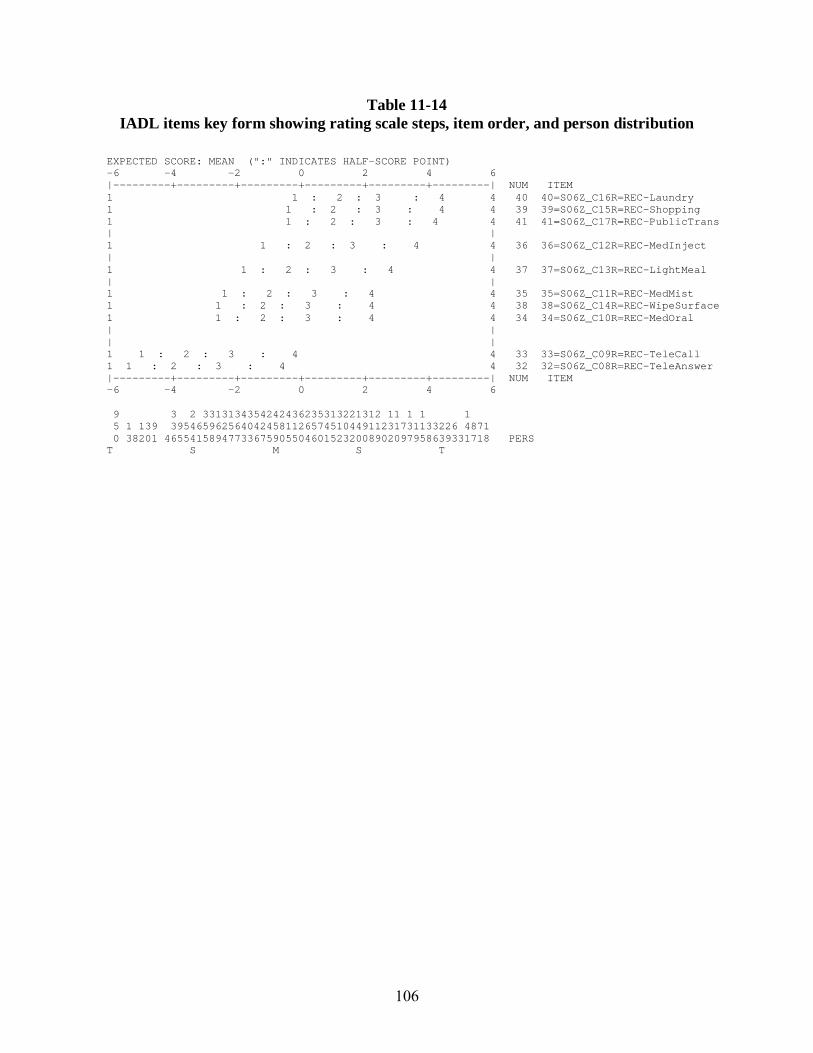
106
Table 11-14 IADL items key form showing rating scale steps, item order, and person distribution
EXPECTED SCORE: MEAN (":" INDICATES HALF - SCORE POINT) - 6 - 4 - 2 0 2 4 6
| --------- + --------- + --------- + --------- + --------- + --------- | NUM ITEM
1 1 : 2 : 3 : 4 4 40 40=S06Z_C16R=REC - Laundry 1
1 : 2 : 3 : 4 4 39 39=S06Z_C15R=REC - Shopping 1 1 : 2 : 3 : 4 4 41 41=S06Z_C17R=REC - PublicTrans
| | 1 1 :
2 : 3 : 4 4 36 36=S06Z_C12R=REC - MedInject | |
1 1 : 2 : 3 : 4 4 37 37=S06Z_C13R=REC - LightMeal |
| 1 1 : 2 : 3 : 4 4 35 35=S06Z_C11R=REC - MedMist
1 1 : 2 : 3 : 4 4 38 38=S06Z_C14R=REC - WipeSurface
1 1 : 2 : 3 :
4 4 34 34=S06Z_C10R=REC - MedOral | |
| |
1 1 : 2 : 3 : 4 4 33 33=S06Z_C 09R=REC - TeleCall 1 1 : 2 : 3 : 4 4 32 32=S06Z_C08R=REC - TeleAnswer
| --------- + --------- + --------- + --------- + --------- + --------- | NUM ITEM - 6 - 4 - 2 0 2 4 6
9 3 2 3313134354242436235313221312 11 1 1 1 5 1 139 395465962564042458112657451044911231731133226 4871 0 38201 465541589477336759055046015232008902097958639331718 PERS T S M S T
107
REFERENCES
Andrich, D.: Application of a psychometric rating model to ordered categories which are scored with successive integers. Applied Psychological Measurement 2(4):581-594, 1978.
Fricke, J., Unsworth, C., and Worrell, D.: Reliability of the functional independence measure with occupational therapists. Aust Occup Ther J 40(1):7-15, 1993.
Gage, B.J., Morley, M., Constantine, R., et al.: Examining Relationships in an Integrated Hospital System. Contract No 06EASPE060059. Waltham, MA: RTI, March 2008.
Granger, C.V., Hamilton, B.B., Keith, R.A., et al.: Advances in functional assessment for medical rehabilitation. Top Geriatr Rehabil 1(3):59-74, 1986.
Haley, S.M., Jette, A.M., Coster, W.J., et al.: Late Life Function and Disability Instrument: II. Development and evaluation of the function component. J Gerontol A Biol Sci Med Sci 57(4): M217-222, 2002.
Hirdes, J.P., Smith, T.F., Rabinowitz, T., et al.: The Resident Assessment Instrument-Mental Health (RAI-MH): Inter-rater reliability and convergent validity. J Behav Health Serv Res 29(4):419-432, 2002.
Jette, A.M., Haley, S.M., and Ni, P.: Comparison of functional status tools used in post-acute care. Health Care Financ Rev 24(3):13-24, 2003.
Jette, A.M., Haley, S.M., Ni, P., et al.: Creating a computer adaptive test version of the late-life function and disability instrument. J Gerontol A Biol Sci Med Sci 63(11):1246-1256, Nov. 2008.
Jette, A.M., Katz, S., Ford, A.B., et al.: Studies of illness in the aged. The Index of ADL: A standardized measure of biological and psychosocial function. JAMA 185:914-919, Sep 21, 1963.
Lawton, M.P., and Brody, E.M.: Assessment of older people: self-maintaining and instrumental activities of daily living. Gerontologist 9(3):179-186, Autumn 1969.
Linacre, J.M., Heinemann, A.W., Wright, B.D., et al.: The structure and stability of the Functional Independence Measure. Arch Phys Med Rehabil 75(2):127-132, Feb. 1994.
Nagi, S.Z.: Some conceptual issues in disability and rehabilitation. In M.B. Sussman (Ed.), Sociology and Rehabilitation (pp. 100-113). Washington, DC: U.S. Department of Health, Education, and Welfare, 1965.
Qu, W., Stineman, M.G., Streim, J.E., et al.: Understanding the linkages between perceived causative impairment and activity limitations among older people living in the community. Am J Phys Med Rehabil 90(6):466-476, 2011.
Stineman, M.G., Jette, A., Fiedler, R., et al.: Impairment-specific dimensions within the Functional Independence Measure. Arch Phys Med Rehabil 78(6):636-643, 1997.
108
Stineman, M.G., Ross, R.N., and Maislin, G.: Functional status measures for integrating medical and social care. International Journal of Integrated Care [serial online]:5, Dec. 2005. Available from http://www.ijic.org/
Stineman, M.G., Shea, J.A., Jette, A., et al.: The Functional Independence Measure: Tests of scaling assumptions, structure, and reliability across 20 diverse impairment categories. Arch Phys Med Rehabil 77:1101-1108, 1996.
Stineman, G., Ross, R., Maislin, G., et al.: Population-based study of home accessibility features and the activities of daily living: Clinical and policy implications. Disability and Rehabilitation 29(15):1165-1175, 2007.
Streiner, D.L., & Norman, G.R.: Health Measurement Scales: A Practical Guide to Their Development and Use (Second ed.). Oxford: Oxford University Press, 1995.
Verbrugge, L.M., and Jette, A.M.: The disablement process. Social Science & Medicine 38(1):1-14, 1994.
World Health Organization: International Classification of Functioning, Disability and Health: ICF. Geneva, Switzerland: World Health Organization, 2001.
109
APPENDIX A RTI COMPARISON OF ITEMS RELIABILITY FOR CARE AND RELATED ITEMS
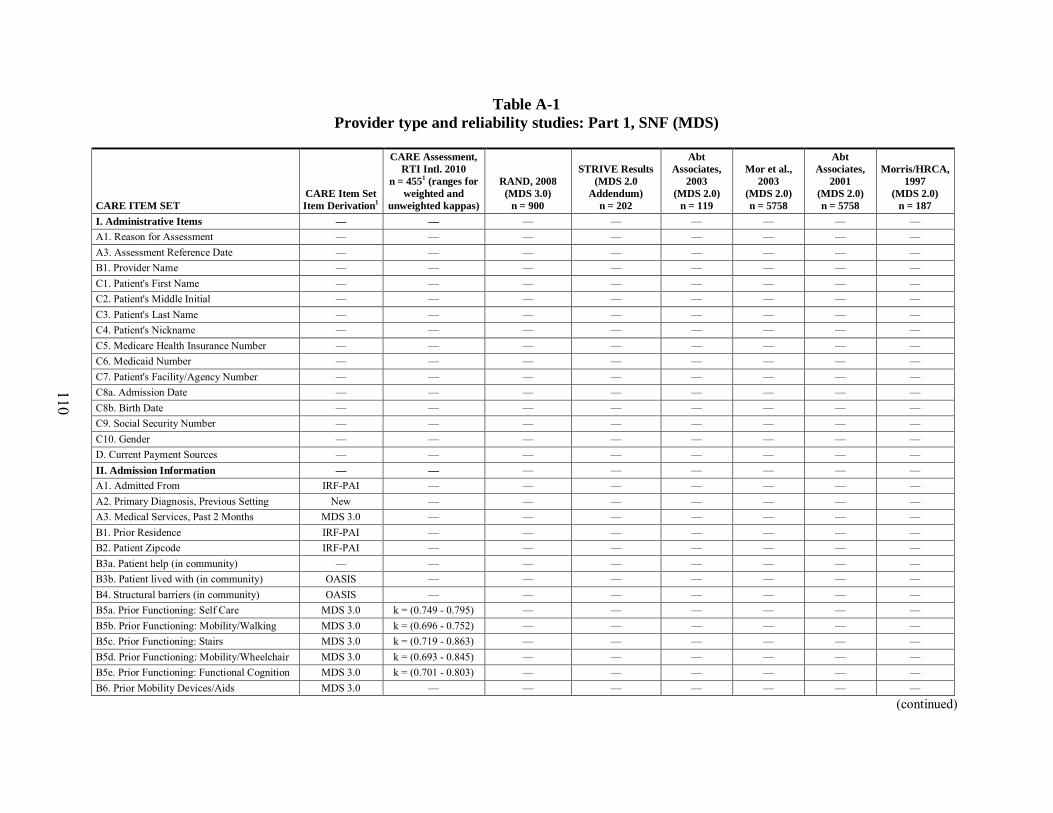
110
Table A-1 Provider type and reliability studies: Part 1, SNF (MDS)
CARE ITEM SET CARE Item Set Item Derivation1
CARE Assessment, RTI Intl. 2010
n = 4551 (ranges for weighted and
unweighted kappas)
RAND, 2008 (MDS 3.0)
n = 900
STRIVE Results (MDS 2.0
Addendum) n = 202
Abt Associates,
2003 (MDS 2.0)
n = 119
Mor et al., 2003
(MDS 2.0) n = 5758
Abt Associates,
2001 (MDS 2.0) n = 5758
Morris/HRCA, 1997
(MDS 2.0) n = 187
I. Administrative Items — — — — — — — — A1. Reason for Assessment — — — — — — — — A3. Assessment Reference Date — — — — — — — — B1. Provider Name — — — — — — — — C1. Patient's First Name — — — — — — — — C2. Patient's Middle Initial — — — — — — — — C3. Patient's Last Name — — — — — — — — C4. Patient's Nickname — — — — — — — — C5. Medicare Health Insurance Number — — — — — — — — C6. Medicaid Number — — — — — — — — C7. Patient's Facility/Agency Number — — — — — — — — C8a. Admission Date — — — — — — — — C8b. Birth Date — — — — — — — — C9. Social Security Number — — — — — — — — C10. Gender — — — — — — — — D. Current Payment Sources — — — — — — — — II. Admission Information — — — — — — — — A1. Admitted From IRF-PAI — — — — — — — A2. Primary Diagnosis, Previous Setting New — — — — — — — A3. Medical Services, Past 2 Months MDS 3.0 — — — — — — — B1. Prior Residence IRF-PAI — — — — — — — B2. Patient Zipcode IRF-PAI — — — — — — — B3a. Patient help (in community) — — — — — — — — B3b. Patient lived with (in community) OASIS — — — — — — — B4. Structural barriers (in community) OASIS — — — — — — — B5a. Prior Functioning: Self Care MDS 3.0 k = (0.749 - 0.795) — — — — — — B5b. Prior Functioning: Mobility/Walking MDS 3.0 k = (0.696 - 0.752) — — — — — — B5c. Prior Functioning: Stairs MDS 3.0 k = (0.719 - 0.863) — — — — — — B5d. Prior Functioning: Mobility/Wheelchair MDS 3.0 k = (0.693 - 0.845) — — — — — — B5e. Prior Functioning: Functional Cognition MDS 3.0 k = (0.701 - 0.803) — — — — — — B6. Prior Mobility Devices/Aids MDS 3.0 — — — — — — —
(continued)
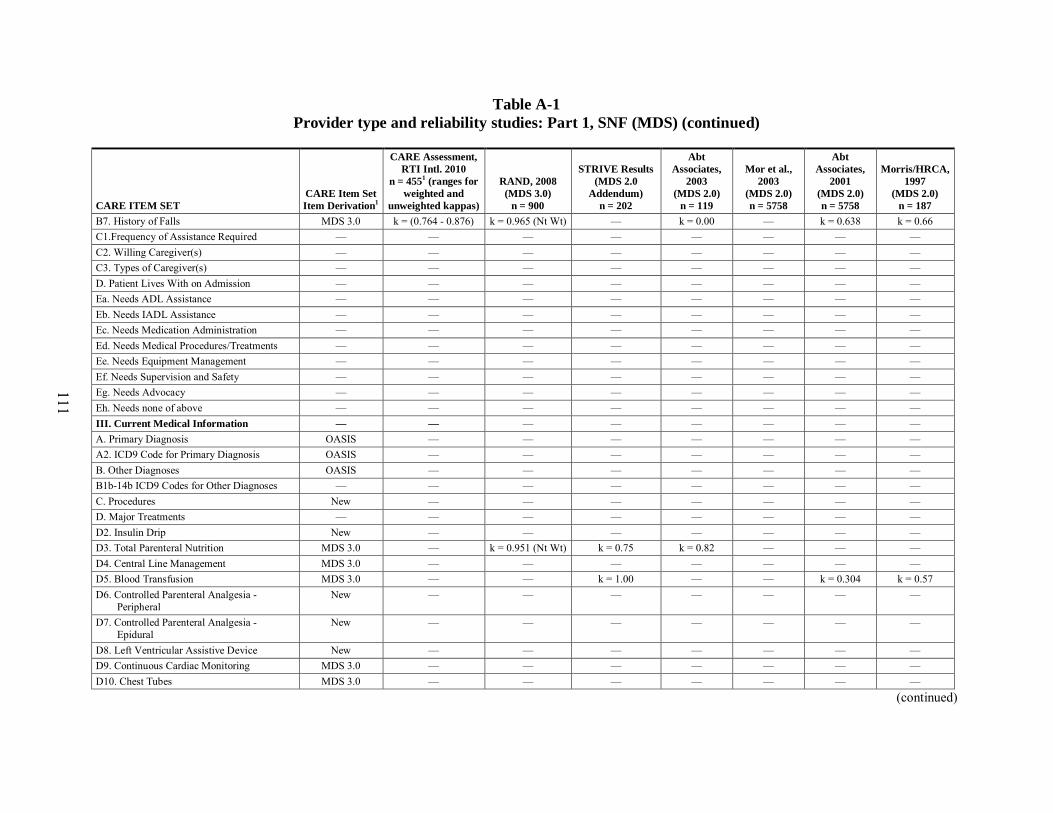
111
Table A-1 Provider type and reliability studies: Part 1, SNF (MDS) (continued)
CARE ITEM SET CARE Item Set Item Derivation1
CARE Assessment, RTI Intl. 2010
n = 4551 (ranges for weighted and
unweighted kappas)
RAND, 2008 (MDS 3.0)
n = 900
STRIVE Results (MDS 2.0
Addendum) n = 202
Abt Associates,
2003 (MDS 2.0)
n = 119
Mor et al., 2003
(MDS 2.0) n = 5758
Abt Associates,
2001 (MDS 2.0) n = 5758
Morris/HRCA, 1997
(MDS 2.0) n = 187
B7. History of Falls MDS 3.0 k = (0.764 - 0.876) k = 0.965 (Nt Wt) — k = 0.00 — k = 0.638 k = 0.66 C1.Frequency of Assistance Required — — — — — — — — C2. Willing Caregiver(s) — — — — — — — — C3. Types of Caregiver(s) — — — — — — — — D. Patient Lives With on Admission — — — — — — — — Ea. Needs ADL Assistance — — — — — — — — Eb. Needs IADL Assistance — — — — — — — — Ec. Needs Medication Administration — — — — — — — — Ed. Needs Medical Procedures/Treatments — — — — — — — — Ee. Needs Equipment Management — — — — — — — — Ef. Needs Supervision and Safety — — — — — — — — Eg. Needs Advocacy — — — — — — — — Eh. Needs none of above — — — — — — — — III. Current Medical Information — — — — — — — — A. Primary Diagnosis OASIS — — — — — — — A2. ICD9 Code for Primary Diagnosis OASIS — — — — — — — B. Other Diagnoses OASIS — — — — — — — B1b-14b ICD9 Codes for Other Diagnoses — — — — — — — — C. Procedures New — — — — — — — D. Major Treatments — — — — — — — — D2. Insulin Drip New — — — — — — — D3. Total Parenteral Nutrition MDS 3.0 — k = 0.951 (Nt Wt) k = 0.75 k = 0.82 — — — D4. Central Line Management MDS 3.0 — — — — — — — D5. Blood Transfusion MDS 3.0 — — k = 1.00 — — k = 0.304 k = 0.57 D6. Controlled Parenteral Analgesia -
Peripheral New — — — — — — —
D7. Controlled Parenteral Analgesia - Epidural
New — — — — — — —
D8. Left Ventricular Assistive Device New — — — — — — — D9. Continuous Cardiac Monitoring MDS 3.0 — — — — — — — D10. Chest Tubes MDS 3.0 — — — — — — —
(continued)
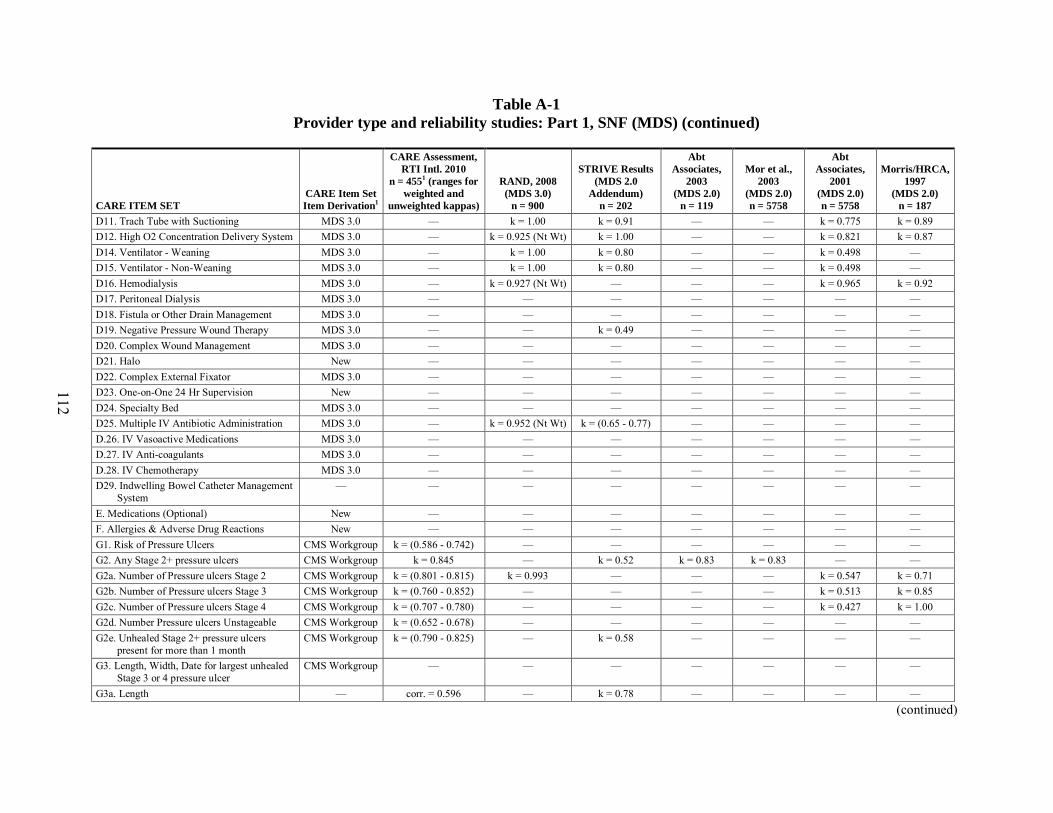
112
Table A-1 Provider type and reliability studies: Part 1, SNF (MDS) (continued)
CARE ITEM SET CARE Item Set Item Derivation1
CARE Assessment, RTI Intl. 2010
n = 4551 (ranges for weighted and
unweighted kappas)
RAND, 2008 (MDS 3.0)
n = 900
STRIVE Results (MDS 2.0
Addendum) n = 202
Abt Associates,
2003 (MDS 2.0)
n = 119
Mor et al., 2003
(MDS 2.0) n = 5758
Abt Associates,
2001 (MDS 2.0) n = 5758
Morris/HRCA, 1997
(MDS 2.0) n = 187
D11. Trach Tube with Suctioning MDS 3.0 — k = 1.00 k = 0.91 — — k = 0.775 k = 0.89 D12. High O2 Concentration Delivery System MDS 3.0 — k = 0.925 (Nt Wt) k = 1.00 — — k = 0.821 k = 0.87 D14. Ventilator - Weaning MDS 3.0 — k = 1.00 k = 0.80 — — k = 0.498 — D15. Ventilator - Non-Weaning MDS 3.0 — k = 1.00 k = 0.80 — — k = 0.498 — D16. Hemodialysis MDS 3.0 — k = 0.927 (Nt Wt) — — — k = 0.965 k = 0.92 D17. Peritoneal Dialysis MDS 3.0 — — — — — — — D18. Fistula or Other Drain Management MDS 3.0 — — — — — — — D19. Negative Pressure Wound Therapy MDS 3.0 — — k = 0.49 — — — — D20. Complex Wound Management MDS 3.0 — — — — — — — D21. Halo New — — — — — — — D22. Complex External Fixator MDS 3.0 — — — — — — — D23. One-on-One 24 Hr Supervision New — — — — — — — D24. Specialty Bed MDS 3.0 — — — — — — — D25. Multiple IV Antibiotic Administration MDS 3.0 — k = 0.952 (Nt Wt) k = (0.65 - 0.77) — — — — D.26. IV Vasoactive Medications MDS 3.0 — — — — — — — D.27. IV Anti-coagulants MDS 3.0 — — — — — — — D.28. IV Chemotherapy MDS 3.0 — — — — — — — D29. Indwelling Bowel Catheter Management
System — — — — — — — —
E. Medications (Optional) New — — — — — — — F. Allergies & Adverse Drug Reactions New — — — — — — — G1. Risk of Pressure Ulcers CMS Workgroup k = (0.586 - 0.742) — — — — — — G2. Any Stage 2+ pressure ulcers CMS Workgroup k = 0.845 — k = 0.52 k = 0.83 k = 0.83 — — G2a. Number of Pressure ulcers Stage 2 CMS Workgroup k = (0.801 - 0.815) k = 0.993 — — — k = 0.547 k = 0.71 G2b. Number of Pressure ulcers Stage 3 CMS Workgroup k = (0.760 - 0.852) — — — — k = 0.513 k = 0.85 G2c. Number of Pressure ulcers Stage 4 CMS Workgroup k = (0.707 - 0.780) — — — — k = 0.427 k = 1.00 G2d. Number Pressure ulcers Unstageable CMS Workgroup k = (0.652 - 0.678) — — — — — — G2e. Unhealed Stage 2+ pressure ulcers
present for more than 1 month CMS Workgroup k = (0.790 - 0.825) — k = 0.58 — — — —
G3. Length, Width, Date for largest unhealed Stage 3 or 4 pressure ulcer
CMS Workgroup — — — — — — —
G3a. Length — corr. = 0.596 — k = 0.78 — — — — (continued)
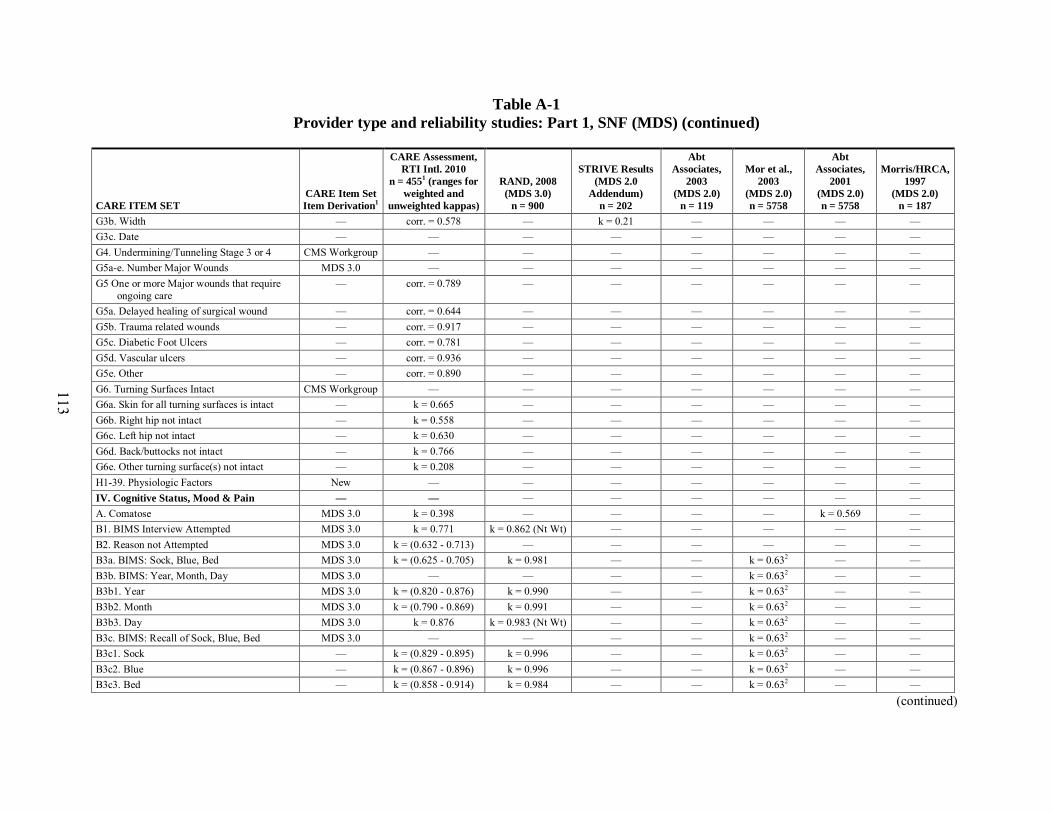
113
Table A-1 Provider type and reliability studies: Part 1, SNF (MDS) (continued)
CARE ITEM SET CARE Item Set Item Derivation1
CARE Assessment, RTI Intl. 2010
n = 4551 (ranges for weighted and
unweighted kappas)
RAND, 2008 (MDS 3.0)
n = 900
STRIVE Results (MDS 2.0
Addendum) n = 202
Abt Associates,
2003 (MDS 2.0)
n = 119
Mor et al., 2003
(MDS 2.0) n = 5758
Abt Associates,
2001 (MDS 2.0) n = 5758
Morris/HRCA, 1997
(MDS 2.0) n = 187
G3b. Width — corr. = 0.578 — k = 0.21 — — — — G3c. Date — — — — — — — — G4. Undermining/Tunneling Stage 3 or 4 CMS Workgroup — — — — — — — G5a-e. Number Major Wounds MDS 3.0 — — — — — — — G5 One or more Major wounds that require
ongoing care — corr. = 0.789 — — — — — —
G5a. Delayed healing of surgical wound — corr. = 0.644 — — — — — — G5b. Trauma related wounds — corr. = 0.917 — — — — — — G5c. Diabetic Foot Ulcers — corr. = 0.781 — — — — — — G5d. Vascular ulcers — corr. = 0.936 — — — — — — G5e. Other — corr. = 0.890 — — — — — — G6. Turning Surfaces Intact CMS Workgroup — — — — — — — G6a. Skin for all turning surfaces is intact — k = 0.665 — — — — — — G6b. Right hip not intact — k = 0.558 — — — — — — G6c. Left hip not intact — k = 0.630 — — — — — — G6d. Back/buttocks not intact — k = 0.766 — — — — — — G6e. Other turning surface(s) not intact — k = 0.208 — — — — — — H1-39. Physiologic Factors New — — — — — — — IV. Cognitive Status, Mood & Pain — — — — — — — — A. Comatose MDS 3.0 k = 0.398 — — — — k = 0.569 — B1. BIMS Interview Attempted MDS 3.0 k = 0.771 k = 0.862 (Nt Wt) — — — — — B2. Reason not Attempted MDS 3.0 k = (0.632 - 0.713) — — — — — — B3a. BIMS: Sock, Blue, Bed MDS 3.0 k = (0.625 - 0.705) k = 0.981 — — k = 0.632 — — B3b. BIMS: Year, Month, Day MDS 3.0 — — — — k = 0.632 — — B3b1. Year MDS 3.0 k = (0.820 - 0.876) k = 0.990 — — k = 0.63 2 — — B3b2. Month MDS 3.0 k = (0.790 - 0.869) k = 0.991 — — k = 0.632 — — B3b3. Day MDS 3.0 k = 0.876 k = 0.983 (Nt Wt) — — k = 0.632 — — B3c. BIMS: Recall of Sock, Blue, Bed MDS 3.0 — — — — k = 0.632 — — B3c1. Sock — k = (0.829 - 0.895) k = 0.996 — — k = 0.632 — — B3c2. Blue — k = (0.867 - 0.896) k = 0.996 — — k = 0.632 — — B3c3. Bed — k = (0.858 - 0.914) k = 0.984 — — k = 0.632 — —
(continued)
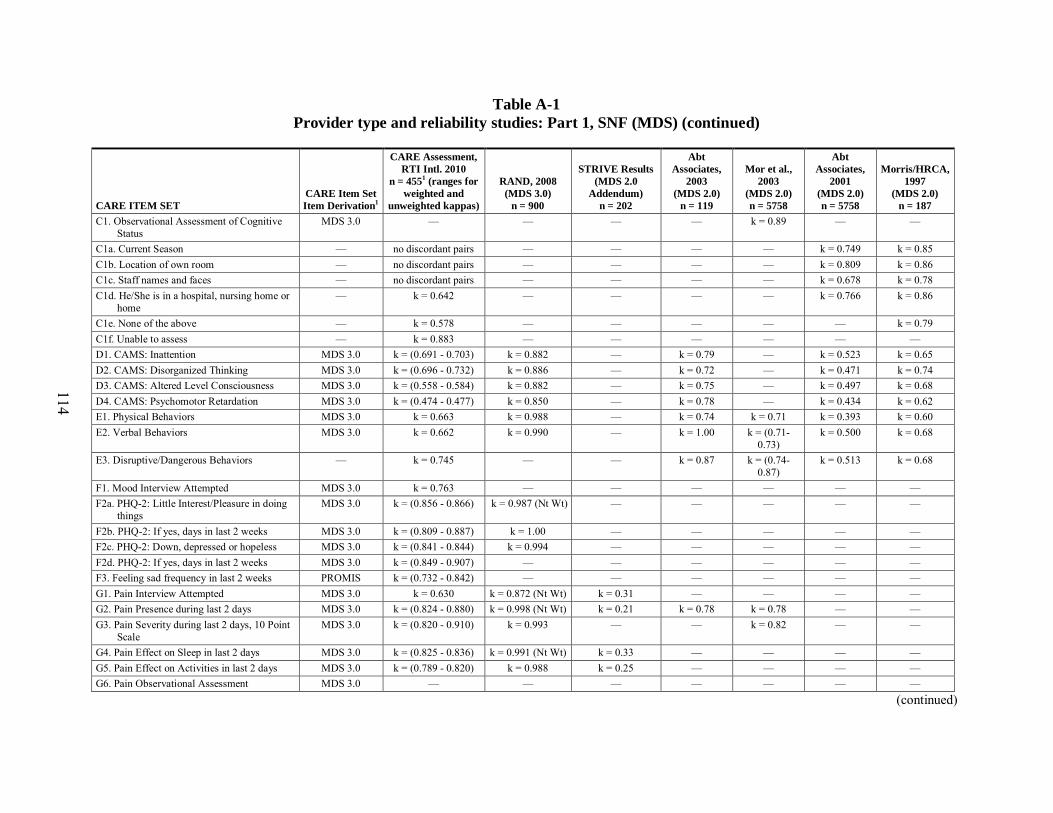
114
Table A-1 Provider type and reliability studies: Part 1, SNF (MDS) (continued)
CARE ITEM SET CARE Item Set Item Derivation1
CARE Assessment, RTI Intl. 2010
n = 4551 (ranges for weighted and
unweighted kappas)
RAND, 2008 (MDS 3.0)
n = 900
STRIVE Results (MDS 2.0
Addendum) n = 202
Abt Associates,
2003 (MDS 2.0)
n = 119
Mor et al., 2003
(MDS 2.0) n = 5758
Abt Associates,
2001 (MDS 2.0) n = 5758
Morris/HRCA, 1997
(MDS 2.0) n = 187
C1. Observational Assessment of Cognitive Status
MDS 3.0 — — — — k = 0.89 — —
C1a. Current Season — no discordant pairs — — — — k = 0.749 k = 0.85 C1b. Location of own room — no discordant pairs — — — — k = 0.809 k = 0.86 C1c. Staff names and faces — no discordant pairs — — — — k = 0.678 k = 0.78 C1d. He/She is in a hospital, nursing home or
home — k = 0.642 — — — — k = 0.766 k = 0.86
C1e. None of the above — k = 0.578 — — — — — k = 0.79 C1f. Unable to assess — k = 0.883 — — — — — — D1. CAMS: Inattention MDS 3.0 k = (0.691 - 0.703) k = 0.882 — k = 0.79 — k = 0.523 k = 0.65 D2. CAMS: Disorganized Thinking MDS 3.0 k = (0.696 - 0.732) k = 0.886 — k = 0.72 — k = 0.471 k = 0.74 D3. CAMS: Altered Level Consciousness MDS 3.0 k = (0.558 - 0.584) k = 0.882 — k = 0.75 — k = 0.497 k = 0.68 D4. CAMS: Psychomotor Retardation MDS 3.0 k = (0.474 - 0.477) k = 0.850 — k = 0.78 — k = 0.434 k = 0.62 E1. Physical Behaviors MDS 3.0 k = 0.663 k = 0.988 — k = 0.74 k = 0.71 k = 0.393 k = 0.60 E2. Verbal Behaviors MDS 3.0 k = 0.662 k = 0.990 — k = 1.00 k = (0.71-
0.73) k = 0.500 k = 0.68
E3. Disruptive/Dangerous Behaviors — k = 0.745 — — k = 0.87 k = (0.74-0.87)
k = 0.513 k = 0.68
F1. Mood Interview Attempted MDS 3.0 k = 0.763 — — — — — — F2a. PHQ-2: Little Interest/Pleasure in doing
things MDS 3.0 k = (0.856 - 0.866) k = 0.987 (Nt Wt) — — — — —
F2b. PHQ-2: If yes, days in last 2 weeks MDS 3.0 k = (0.809 - 0.887) k = 1.00 — — — — — F2c. PHQ-2: Down, depressed or hopeless MDS 3.0 k = (0.841 - 0.844) k = 0.994 — — — — — F2d. PHQ-2: If yes, days in last 2 weeks MDS 3.0 k = (0.849 - 0.907) — — — — — — F3. Feeling sad frequency in last 2 weeks PROMIS k = (0.732 - 0.842) — — — — — — G1. Pain Interview Attempted MDS 3.0 k = 0.630 k = 0.872 (Nt Wt) k = 0.31 — — — — G2. Pain Presence during last 2 days MDS 3.0 k = (0.824 - 0.880) k = 0.998 (Nt Wt) k = 0.21 k = 0.78 k = 0.78 — — G3. Pain Severity during last 2 days, 10 Point
Scale MDS 3.0 k = (0.820 - 0.910) k = 0.993 — — k = 0.82 — —
G4. Pain Effect on Sleep in last 2 days MDS 3.0 k = (0.825 - 0.836) k = 0.991 (Nt Wt) k = 0.33 — — — — G5. Pain Effect on Activities in last 2 days MDS 3.0 k = (0.789 - 0.820) k = 0.988 k = 0.25 — — — — G6. Pain Observational Assessment MDS 3.0 — — — — — — —
(continued)
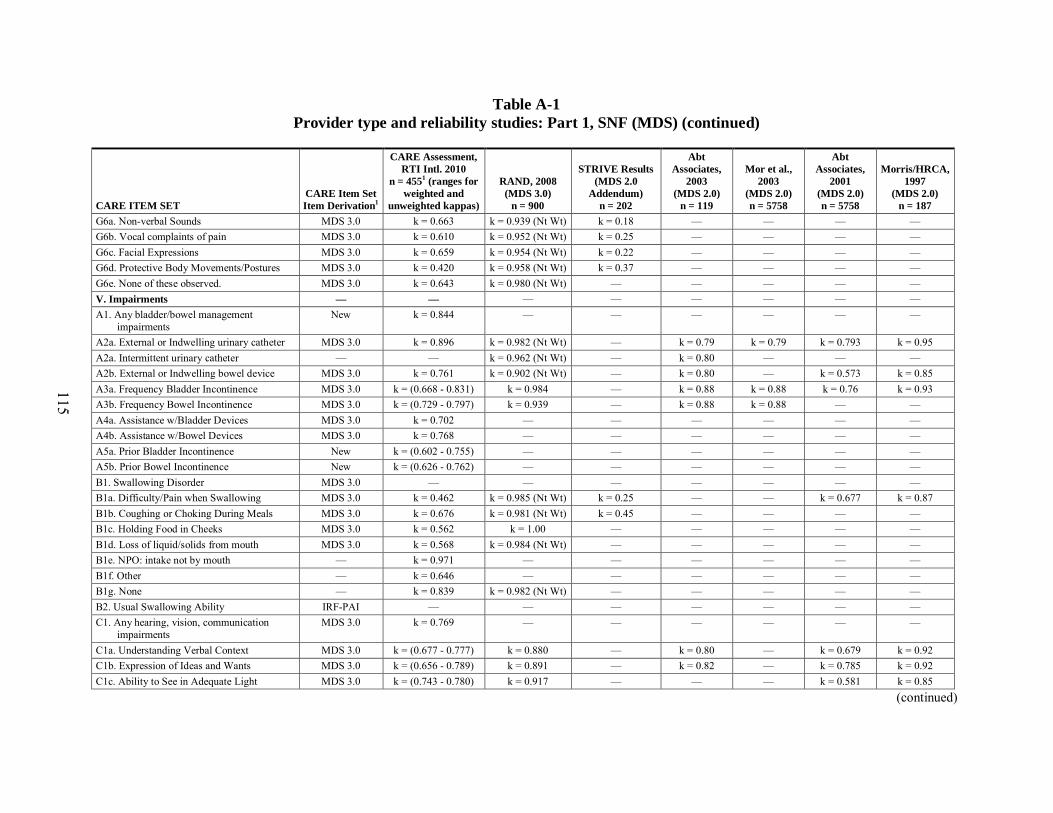
115
Table A-1 Provider type and reliability studies: Part 1, SNF (MDS) (continued)
CARE ITEM SET CARE Item Set Item Derivation1
CARE Assessment, RTI Intl. 2010
n = 4551 (ranges for weighted and
unweighted kappas)
RAND, 2008 (MDS 3.0)
n = 900
STRIVE Results (MDS 2.0
Addendum) n = 202
Abt Associates,
2003 (MDS 2.0)
n = 119
Mor et al., 2003
(MDS 2.0) n = 5758
Abt Associates,
2001 (MDS 2.0) n = 5758
Morris/HRCA, 1997
(MDS 2.0) n = 187
G6a. Non-verbal Sounds MDS 3.0 k = 0.663 k = 0.939 (Nt Wt) k = 0.18 — — — — G6b. Vocal complaints of pain MDS 3.0 k = 0.610 k = 0.952 (Nt Wt) k = 0.25 — — — — G6c. Facial Expressions MDS 3.0 k = 0.659 k = 0.954 (Nt Wt) k = 0.22 — — — — G6d. Protective Body Movements/Postures MDS 3.0 k = 0.420 k = 0.958 (Nt Wt) k = 0.37 — — — — G6e. None of these observed. MDS 3.0 k = 0.643 k = 0.980 (Nt Wt) — — — — — V. Impairments — — — — — — — — A1. Any bladder/bowel management
impairments New k = 0.844 — — — — — —
A2a. External or Indwelling urinary catheter MDS 3.0 k = 0.896 k = 0.982 (Nt Wt) — k = 0.79 k = 0.79 k = 0.793 k = 0.95 A2a. Intermittent urinary catheter — — k = 0.962 (Nt Wt) — k = 0.80 — — — A2b. External or Indwelling bowel device MDS 3.0 k = 0.761 k = 0.902 (Nt Wt) — k = 0.80 — k = 0.573 k = 0.85 A3a. Frequency Bladder Incontinence MDS 3.0 k = (0.668 - 0.831) k = 0.984 — k = 0.88 k = 0.88 k = 0.76 k = 0.93 A3b. Frequency Bowel Incontinence MDS 3.0 k = (0.729 - 0.797) k = 0.939 — k = 0.88 k = 0.88 — — A4a. Assistance w/Bladder Devices MDS 3.0 k = 0.702 — — — — — — A4b. Assistance w/Bowel Devices MDS 3.0 k = 0.768 — — — — — — A5a. Prior Bladder Incontinence New k = (0.602 - 0.755) — — — — — — A5b. Prior Bowel Incontinence New k = (0.626 - 0.762) — — — — — — B1. Swallowing Disorder MDS 3.0 — — — — — — — B1a. Difficulty/Pain when Swallowing MDS 3.0 k = 0.462 k = 0.985 (Nt Wt) k = 0.25 — — k = 0.677 k = 0.87 B1b. Coughing or Choking During Meals MDS 3.0 k = 0.676 k = 0.981 (Nt Wt) k = 0.45 — — — — B1c. Holding Food in Cheeks MDS 3.0 k = 0.562 k = 1.00 — — — — — B1d. Loss of liquid/solids from mouth MDS 3.0 k = 0.568 k = 0.984 (Nt Wt) — — — — — B1e. NPO: intake not by mouth — k = 0.971 — — — — — — B1f. Other — k = 0.646 — — — — — — B1g. None — k = 0.839 k = 0.982 (Nt Wt) — — — — — B2. Usual Swallowing Ability IRF-PAI — — — — — — — C1. Any hearing, vision, communication
impairments MDS 3.0 k = 0.769 — — — — — —
C1a. Understanding Verbal Context MDS 3.0 k = (0.677 - 0.777) k = 0.880 — k = 0.80 — k = 0.679 k = 0.92 C1b. Expression of Ideas and Wants MDS 3.0 k = (0.656 - 0.789) k = 0.891 — k = 0.82 — k = 0.785 k = 0.92 C1c. Ability to See in Adequate Light MDS 3.0 k = (0.743 - 0.780) k = 0.917 — — — k = 0.581 k = 0.85
(continued)
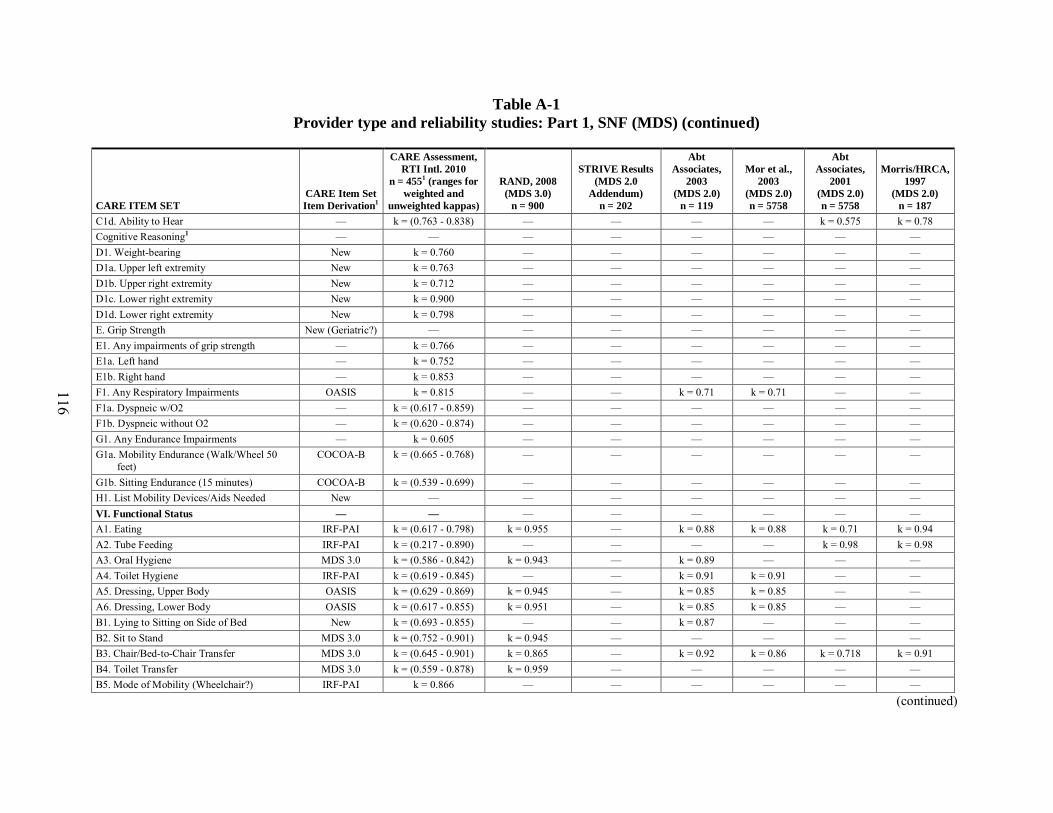
116
Table A-1 Provider type and reliability studies: Part 1, SNF (MDS) (continued)
CARE ITEM SET CARE Item Set Item Derivation1
CARE Assessment, RTI Intl. 2010
n = 4551 (ranges for weighted and
unweighted kappas)
RAND, 2008 (MDS 3.0)
n = 900
STRIVE Results (MDS 2.0
Addendum) n = 202
Abt Associates,
2003 (MDS 2.0)
n = 119
Mor et al., 2003
(MDS 2.0) n = 5758
Abt Associates,
2001 (MDS 2.0) n = 5758
Morris/HRCA, 1997
(MDS 2.0) n = 187
C1d. Ability to Hear — k = (0.763 - 0.838) — — — — k = 0.575 k = 0.78 Cognitive Reasoning1 — — — — — — — — D1. Weight-bearing New k = 0.760 — — — — — — D1a. Upper left extremity New k = 0.763 — — — — — — D1b. Upper right extremity New k = 0.712 — — — — — — D1c. Lower right extremity New k = 0.900 — — — — — — D1d. Lower right extremity New k = 0.798 — — — — — — E. Grip Strength New (Geriatric?) — — — — — — — E1. Any impairments of grip strength — k = 0.766 — — — — — — E1a. Left hand — k = 0.752 — — — — — — E1b. Right hand — k = 0.853 — — — — — — F1. Any Respiratory Impairments OASIS k = 0.815 — — k = 0.71 k = 0.71 — — F1a. Dyspneic w/O2 — k = (0.617 - 0.859) — — — — — — F1b. Dyspneic without O2 — k = (0.620 - 0.874) — — — — — — G1. Any Endurance Impairments — k = 0.605 — — — — — — G1a. Mobility Endurance (Walk/Wheel 50
feet) COCOA-B k = (0.665 - 0.768) — — — — — —
G1b. Sitting Endurance (15 minutes) COCOA-B k = (0.539 - 0.699) — — — — — — H1. List Mobility Devices/Aids Needed New — — — — — — — VI. Functional Status — — — — — — — — A1. Eating IRF-PAI k = (0.617 - 0.798) k = 0.955 — k = 0.88 k = 0.88 k = 0.71 k = 0.94 A2. Tube Feeding IRF-PAI k = (0.217 - 0.890) — — — — k = 0.98 k = 0.98 A3. Oral Hygiene MDS 3.0 k = (0.586 - 0.842) k = 0.943 — k = 0.89 — — — A4. Toilet Hygiene IRF-PAI k = (0.619 - 0.845) — — k = 0.91 k = 0.91 — — A5. Dressing, Upper Body OASIS k = (0.629 - 0.869) k = 0.945 — k = 0.85 k = 0.85 — — A6. Dressing, Lower Body OASIS k = (0.617 - 0.855) k = 0.951 — k = 0.85 k = 0.85 — — B1. Lying to Sitting on Side of Bed New k = (0.693 - 0.855) — — k = 0.87 — — — B2. Sit to Stand MDS 3.0 k = (0.752 - 0.901) k = 0.945 — — — — — B3. Chair/Bed-to-Chair Transfer MDS 3.0 k = (0.645 - 0.901) k = 0.865 — k = 0.92 k = 0.86 k = 0.718 k = 0.91 B4. Toilet Transfer MDS 3.0 k = (0.559 - 0.878) k = 0.959 — — — — — B5. Mode of Mobility (Wheelchair?) IRF-PAI k = 0.866 — — — — — —
(continued)
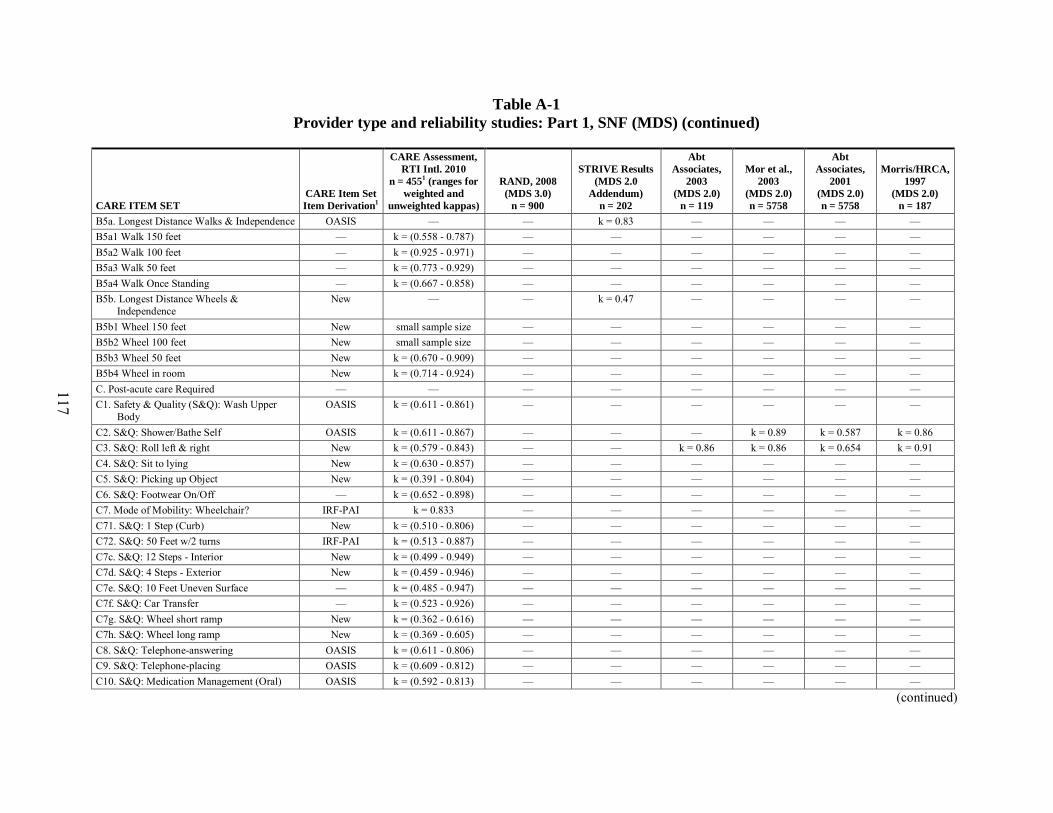
117
Table A-1 Provider type and reliability studies: Part 1, SNF (MDS) (continued)
CARE ITEM SET CARE Item Set Item Derivation1
CARE Assessment, RTI Intl. 2010
n = 4551 (ranges for weighted and
unweighted kappas)
RAND, 2008 (MDS 3.0)
n = 900
STRIVE Results (MDS 2.0
Addendum) n = 202
Abt Associates,
2003 (MDS 2.0)
n = 119
Mor et al., 2003
(MDS 2.0) n = 5758
Abt Associates,
2001 (MDS 2.0) n = 5758
Morris/HRCA, 1997
(MDS 2.0) n = 187
B5a. Longest Distance Walks & Independence OASIS — — k = 0.83 — — — — B5a1 Walk 150 feet — k = (0.558 - 0.787) — — — — — — B5a2 Walk 100 feet — k = (0.925 - 0.971) — — — — — — B5a3 Walk 50 feet — k = (0.773 - 0.929) — — — — — — B5a4 Walk Once Standing — k = (0.667 - 0.858) — — — — — — B5b. Longest Distance Wheels &
Independence New — — k = 0.47 — — — —
B5b1 Wheel 150 feet New small sample size — — — — — — B5b2 Wheel 100 feet New small sample size — — — — — — B5b3 Wheel 50 feet New k = (0.670 - 0.909) — — — — — — B5b4 Wheel in room New k = (0.714 - 0.924) — — — — — — C. Post-acute care Required — — — — — — — — C1. Safety & Quality (S&Q): Wash Upper
Body OASIS k = (0.611 - 0.861) — — — — — —
C2. S&Q: Shower/Bathe Self OASIS k = (0.611 - 0.867) — — — k = 0.89 k = 0.587 k = 0.86 C3. S&Q: Roll left & right New k = (0.579 - 0.843) — — k = 0.86 k = 0.86 k = 0.654 k = 0.91 C4. S&Q: Sit to lying New k = (0.630 - 0.857) — — — — — — C5. S&Q: Picking up Object New k = (0.391 - 0.804) — — — — — — C6. S&Q: Footwear On/Off — k = (0.652 - 0.898) — — — — — — C7. Mode of Mobility: Wheelchair? IRF-PAI k = 0.833 — — — — — — C71. S&Q: 1 Step (Curb) New k = (0.510 - 0.806) — — — — — — C72. S&Q: 50 Feet w/2 turns IRF-PAI k = (0.513 - 0.887) — — — — — — C7c. S&Q: 12 Steps - Interior New k = (0.499 - 0.949) — — — — — — C7d. S&Q: 4 Steps - Exterior New k = (0.459 - 0.946) — — — — — — C7e. S&Q: 10 Feet Uneven Surface — k = (0.485 - 0.947) — — — — — — C7f. S&Q: Car Transfer — k = (0.523 - 0.926) — — — — — — C7g. S&Q: Wheel short ramp New k = (0.362 - 0.616) — — — — — — C7h. S&Q: Wheel long ramp New k = (0.369 - 0.605) — — — — — — C8. S&Q: Telephone-answering OASIS k = (0.611 - 0.806) — — — — — — C9. S&Q: Telephone-placing OASIS k = (0.609 - 0.812) — — — — — — C10. S&Q: Medication Management (Oral) OASIS k = (0.592 - 0.813) — — — — — —
(continued)
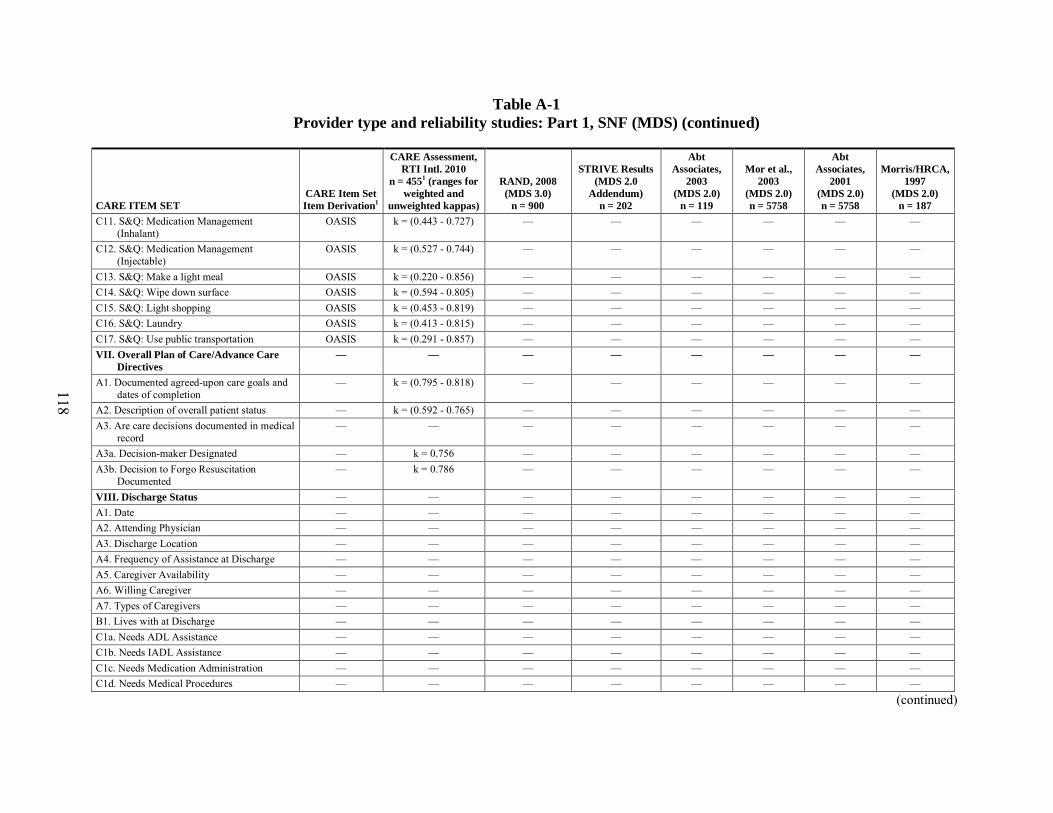
118
Table A-1 Provider type and reliability studies: Part 1, SNF (MDS) (continued)
CARE ITEM SET CARE Item Set Item Derivation1
CARE Assessment, RTI Intl. 2010
n = 4551 (ranges for weighted and
unweighted kappas)
RAND, 2008 (MDS 3.0)
n = 900
STRIVE Results (MDS 2.0
Addendum) n = 202
Abt Associates,
2003 (MDS 2.0)
n = 119
Mor et al., 2003
(MDS 2.0) n = 5758
Abt Associates,
2001 (MDS 2.0) n = 5758
Morris/HRCA, 1997
(MDS 2.0) n = 187
C11. S&Q: Medication Management (Inhalant)
OASIS k = (0.443 - 0.727) — — — — — —
C12. S&Q: Medication Management (Injectable)
OASIS k = (0.527 - 0.744) — — — — — —
C13. S&Q: Make a light meal OASIS k = (0.220 - 0.856) — — — — — — C14. S&Q: Wipe down surface OASIS k = (0.594 - 0.805) — — — — — — C15. S&Q: Light shopping OASIS k = (0.453 - 0.819) — — — — — — C16. S&Q: Laundry OASIS k = (0.413 - 0.815) — — — — — — C17. S&Q: Use public transportation OASIS k = (0.291 - 0.857) — — — — — — VII. Overall Plan of Care/Advance Care
Directives — — — — — — — —
A1. Documented agreed-upon care goals and dates of completion
— k = (0.795 - 0.818) — — — — — —
A2. Description of overall patient status — k = (0.592 - 0.765) — — — — — — A3. Are care decisions documented in medical
record — — — — — — — —
A3a. Decision-maker Designated — k = 0.756 — — — — — — A3b. Decision to Forgo Resuscitation
Documented — k = 0.786 — — — — — —
VIII. Discharge Status — — — — — — — — A1. Date — — — — — — — — A2. Attending Physician — — — — — — — — A3. Discharge Location — — — — — — — — A4. Frequency of Assistance at Discharge — — — — — — — — A5. Caregiver Availability — — — — — — — — A6. Willing Caregiver — — — — — — — — A7. Types of Caregivers — — — — — — — — B1. Lives with at Discharge — — — — — — — — C1a. Needs ADL Assistance — — — — — — — — C1b. Needs IADL Assistance — — — — — — — — C1c. Needs Medication Administration — — — — — — — — C1d. Needs Medical Procedures — — — — — — — —
(continued)
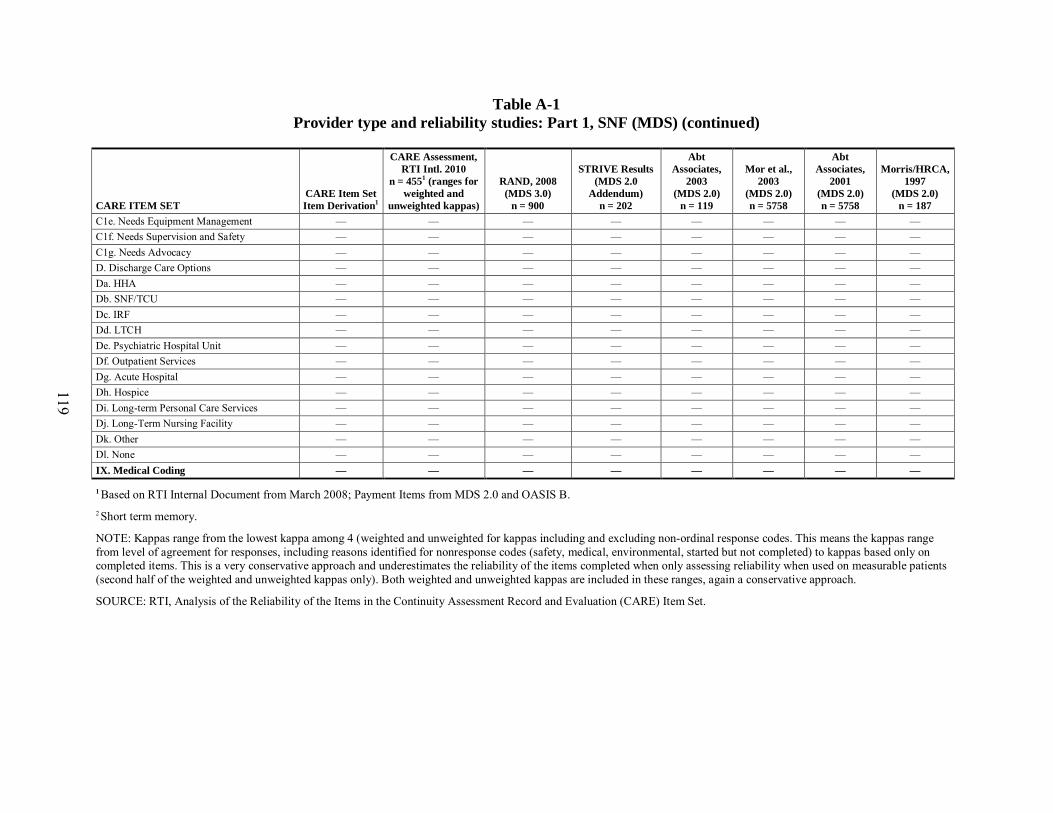
119
Table A-1 Provider type and reliability studies: Part 1, SNF (MDS) (continued)
CARE ITEM SET CARE Item Set Item Derivation1
CARE Assessment, RTI Intl. 2010
n = 4551 (ranges for weighted and
unweighted kappas)
RAND, 2008 (MDS 3.0)
n = 900
STRIVE Results (MDS 2.0
Addendum) n = 202
Abt Associates,
2003 (MDS 2.0)
n = 119
Mor et al., 2003
(MDS 2.0) n = 5758
Abt Associates,
2001 (MDS 2.0) n = 5758
Morris/HRCA, 1997
(MDS 2.0) n = 187
C1e. Needs Equipment Management — — — — — — — — C1f. Needs Supervision and Safety — — — — — — — — C1g. Needs Advocacy — — — — — — — — D. Discharge Care Options — — — — — — — — Da. HHA — — — — — — — — Db. SNF/TCU — — — — — — — — Dc. IRF — — — — — — — — Dd. LTCH — — — — — — — — De. Psychiatric Hospital Unit — — — — — — — — Df. Outpatient Services — — — — — — — — Dg. Acute Hospital — — — — — — — — Dh. Hospice — — — — — — — — Di. Long-term Personal Care Services — — — — — — — — Dj. Long-Term Nursing Facility — — — — — — — — Dk. Other — — — — — — — — Dl. None — — — — — — — — IX. Medical Coding — — — — — — — —
1 Based on RTI Internal Document from March 2008; Payment Items from MDS 2.0 and OASIS B. 2 Short term memory.
NOTE: Kappas range from the lowest kappa among 4 (weighted and unweighted for kappas including and excluding non-ordinal response codes. This means the kappas range from level of agreement for responses, including reasons identified for nonresponse codes (safety, medical, environmental, started but not completed) to kappas based only on completed items. This is a very conservative approach and underestimates the reliability of the items completed when only assessing reliability when used on measurable patients (second half of the weighted and unweighted kappas only). Both weighted and unweighted kappas are included in these ranges, again a conservative approach.
SOURCE: RTI, Analysis of the Reliability of the Items in the Continuity Assessment Record and Evaluation (CARE) Item Set.
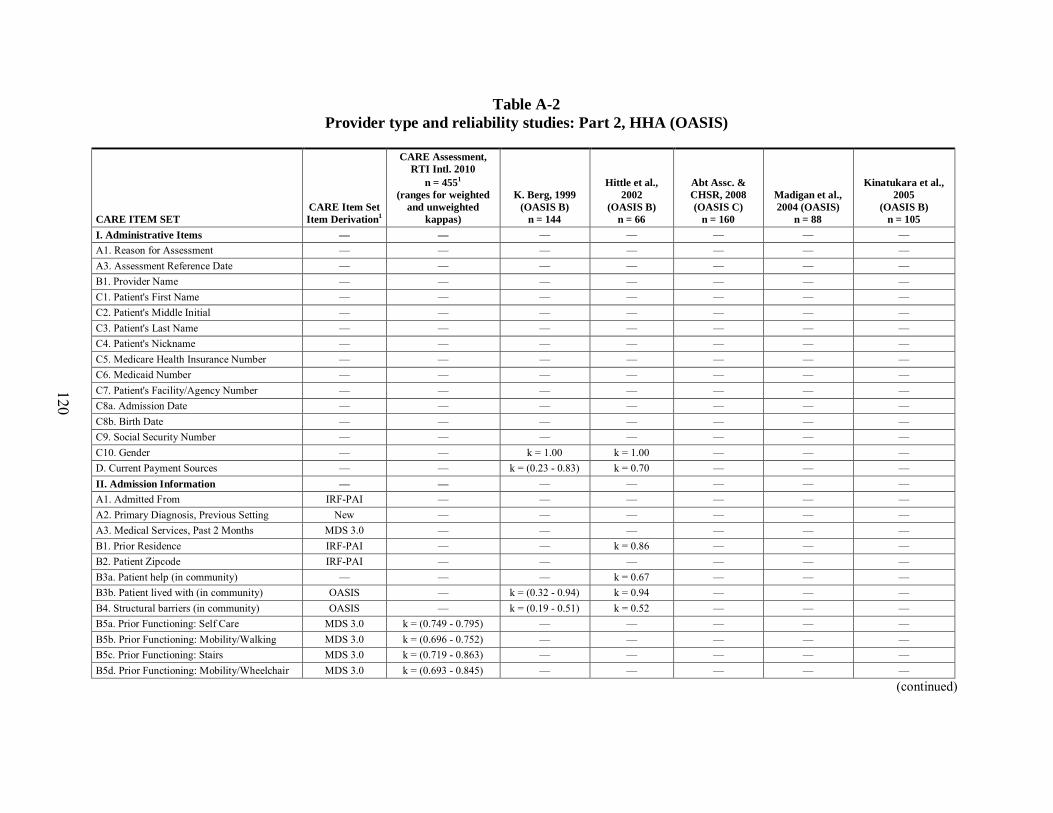
120
Table A-2 Provider type and reliability studies: Part 2, HHA (OASIS)
CARE ITEM SET CARE Item Set Item Derivation1
CARE Assessment, RTI Intl. 2010
n = 4551 (ranges for weighted
and unweighted kappas)
K. Berg, 1999 (OASIS B)
n = 144
Hittle et al., 2002
(OASIS B) n = 66
Abt Assc. & CHSR, 2008 (OASIS C)
n = 160
Madigan et al., 2004 (OASIS)
n = 88
Kinatukara et al., 2005
(OASIS B) n = 105
I. Administrative Items — — — — — — — A1. Reason for Assessment — — — — — — — A3. Assessment Reference Date — — — — — — — B1. Provider Name — — — — — — — C1. Patient's First Name — — — — — — — C2. Patient's Middle Initial — — — — — — — C3. Patient's Last Name — — — — — — — C4. Patient's Nickname — — — — — — — C5. Medicare Health Insurance Number — — — — — — — C6. Medicaid Number — — — — — — — C7. Patient's Facility/Agency Number — — — — — — — C8a. Admission Date — — — — — — — C8b. Birth Date — — — — — — — C9. Social Security Number — — — — — — — C10. Gender — — k = 1.00 k = 1.00 — — — D. Current Payment Sources — — k = (0.23 - 0.83) k = 0.70 — — — II. Admission Information — — — — — — — A1. Admitted From IRF-PAI — — — — — — A2. Primary Diagnosis, Previous Setting New — — — — — — A3. Medical Services, Past 2 Months MDS 3.0 — — — — — — B1. Prior Residence IRF-PAI — — k = 0.86 — — — B2. Patient Zipcode IRF-PAI — — — — — — B3a. Patient help (in community) — — — k = 0.67 — — — B3b. Patient lived with (in community) OASIS — k = (0.32 - 0.94) k = 0.94 — — — B4. Structural barriers (in community) OASIS — k = (0.19 - 0.51) k = 0.52 — — — B5a. Prior Functioning: Self Care MDS 3.0 k = (0.749 - 0.795) — — — — — B5b. Prior Functioning: Mobility/Walking MDS 3.0 k = (0.696 - 0.752) — — — — — B5c. Prior Functioning: Stairs MDS 3.0 k = (0.719 - 0.863) — — — — — B5d. Prior Functioning: Mobility/Wheelchair MDS 3.0 k = (0.693 - 0.845) — — — — —
(continued)
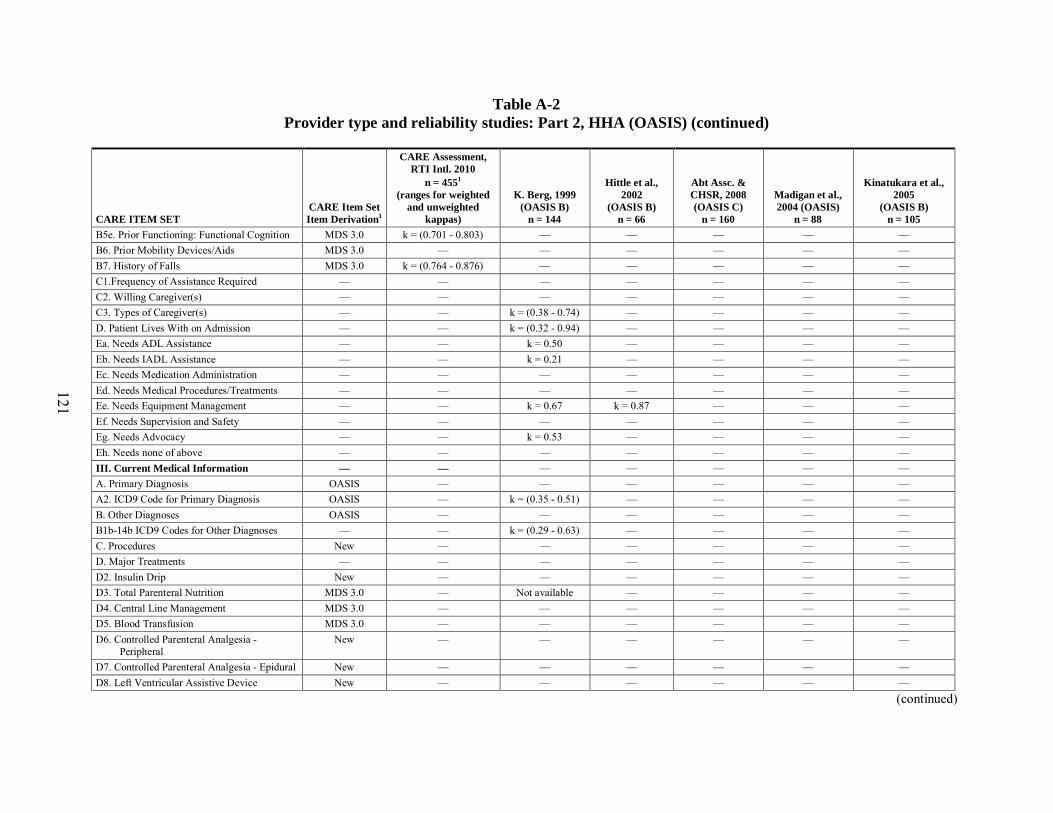
121
Table A-2 Provider type and reliability studies: Part 2, HHA (OASIS) (continued)
CARE ITEM SET CARE Item Set Item Derivation1
CARE Assessment, RTI Intl. 2010
n = 4551 (ranges for weighted
and unweighted kappas)
K. Berg, 1999 (OASIS B)
n = 144
Hittle et al., 2002
(OASIS B) n = 66
Abt Assc. & CHSR, 2008 (OASIS C)
n = 160
Madigan et al., 2004 (OASIS)
n = 88
Kinatukara et al., 2005
(OASIS B) n = 105
B5e. Prior Functioning: Functional Cognition MDS 3.0 k = (0.701 - 0.803) — — — — — B6. Prior Mobility Devices/Aids MDS 3.0 — — — — — — B7. History of Falls MDS 3.0 k = (0.764 - 0.876) — — — — — C1.Frequency of Assistance Required — — — — — — — C2. Willing Caregiver(s) — — — — — — — C3. Types of Caregiver(s) — — k = (0.38 - 0.74) — — — — D. Patient Lives With on Admission — — k = (0.32 - 0.94) — — — — Ea. Needs ADL Assistance — — k = 0.50 — — — — Eb. Needs IADL Assistance — — k = 0.21 — — — — Ec. Needs Medication Administration — — — — — — — Ed. Needs Medical Procedures/Treatments — — — — — — — Ee. Needs Equipment Management — — k = 0.67 k = 0.87 — — — Ef. Needs Supervision and Safety — — — — — — — Eg. Needs Advocacy — — k = 0.53 — — — — Eh. Needs none of above — — — — — — — III. Current Medical Information — — — — — — — A. Primary Diagnosis OASIS — — — — — — A2. ICD9 Code for Primary Diagnosis OASIS — k = (0.35 - 0.51) — — — — B. Other Diagnoses OASIS — — — — — — B1b-14b ICD9 Codes for Other Diagnoses — — k = (0.29 - 0.63) — — — — C. Procedures New — — — — — — D. Major Treatments — — — — — — — D2. Insulin Drip New — — — — — — D3. Total Parenteral Nutrition MDS 3.0 — Not available — — — — D4. Central Line Management MDS 3.0 — — — — — — D5. Blood Transfusion MDS 3.0 — — — — — — D6. Controlled Parenteral Analgesia -
Peripheral New — — — — — —
D7. Controlled Parenteral Analgesia - Epidural New — — — — — — D8. Left Ventricular Assistive Device New — — — — — —
(continued)
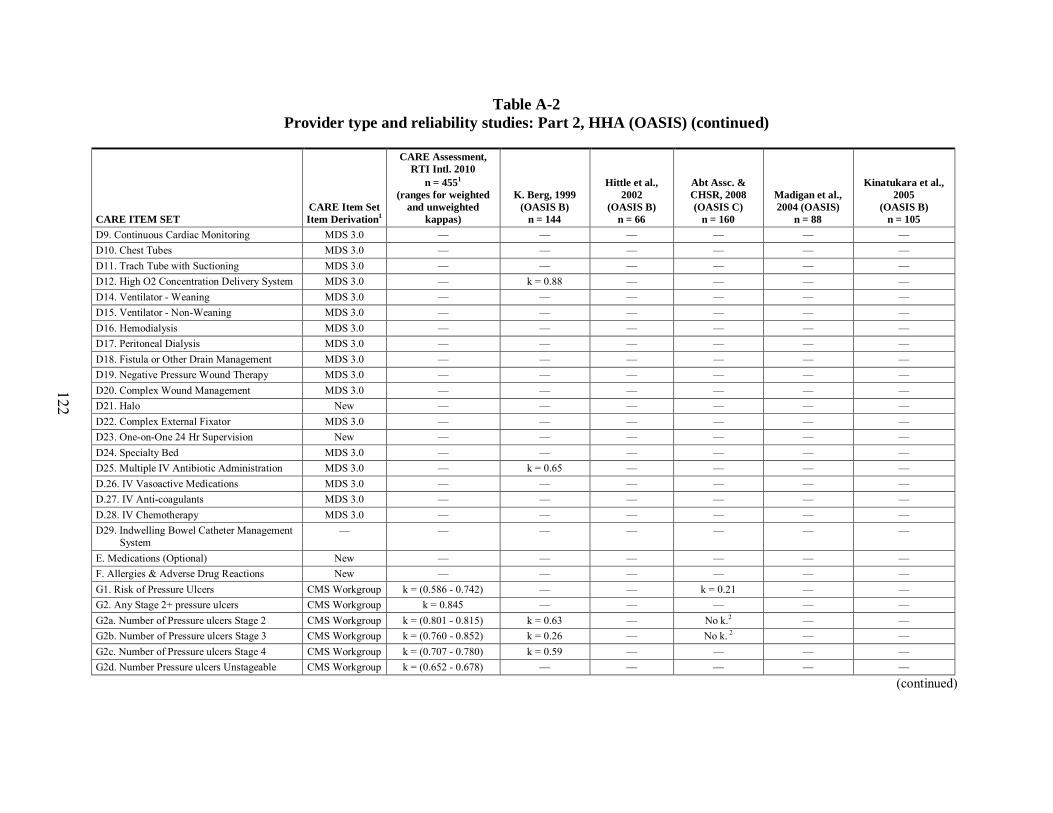
122
Table A-2 Provider type and reliability studies: Part 2, HHA (OASIS) (continued)
CARE ITEM SET CARE Item Set Item Derivation1
CARE Assessment, RTI Intl. 2010
n = 4551 (ranges for weighted
and unweighted kappas)
K. Berg, 1999 (OASIS B)
n = 144
Hittle et al., 2002
(OASIS B) n = 66
Abt Assc. & CHSR, 2008 (OASIS C)
n = 160
Madigan et al., 2004 (OASIS)
n = 88
Kinatukara et al., 2005
(OASIS B) n = 105
D9. Continuous Cardiac Monitoring MDS 3.0 — — — — — — D10. Chest Tubes MDS 3.0 — — — — — — D11. Trach Tube with Suctioning MDS 3.0 — — — — — — D12. High O2 Concentration Delivery System MDS 3.0 — k = 0.88 — — — — D14. Ventilator - Weaning MDS 3.0 — — — — — — D15. Ventilator - Non-Weaning MDS 3.0 — — — — — — D16. Hemodialysis MDS 3.0 — — — — — — D17. Peritoneal Dialysis MDS 3.0 — — — — — — D18. Fistula or Other Drain Management MDS 3.0 — — — — — — D19. Negative Pressure Wound Therapy MDS 3.0 — — — — — — D20. Complex Wound Management MDS 3.0 — — — — — — D21. Halo New — — — — — — D22. Complex External Fixator MDS 3.0 — — — — — — D23. One-on-One 24 Hr Supervision New — — — — — — D24. Specialty Bed MDS 3.0 — — — — — — D25. Multiple IV Antibiotic Administration MDS 3.0 — k = 0.65 — — — — D.26. IV Vasoactive Medications MDS 3.0 — — — — — — D.27. IV Anti-coagulants MDS 3.0 — — — — — — D.28. IV Chemotherapy MDS 3.0 — — — — — — D29. Indwelling Bowel Catheter Management
System — — — — — — —
E. Medications (Optional) New — — — — — — F. Allergies & Adverse Drug Reactions New — — — — — — G1. Risk of Pressure Ulcers CMS Workgroup k = (0.586 - 0.742) — — k = 0.21 — — G2. Any Stage 2+ pressure ulcers CMS Workgroup k = 0.845 — — — — — G2a. Number of Pressure ulcers Stage 2 CMS Workgroup k = (0.801 - 0.815) k = 0.63 — No k.2 — — G2b. Number of Pressure ulcers Stage 3 CMS Workgroup k = (0.760 - 0.852) k = 0.26 — No k. 2 — — G2c. Number of Pressure ulcers Stage 4 CMS Workgroup k = (0.707 - 0.780) k = 0.59 — — — — G2d. Number Pressure ulcers Unstageable CMS Workgroup k = (0.652 - 0.678) — — — — —
(continued)
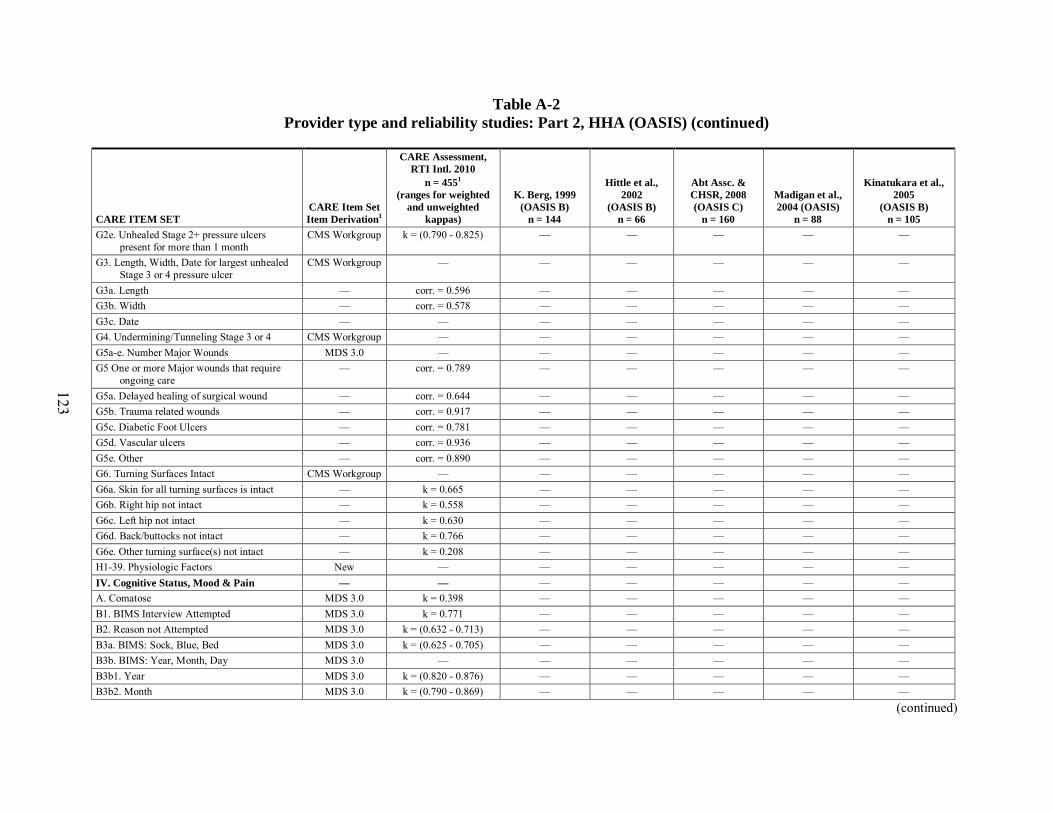
123
Table A-2 Provider type and reliability studies: Part 2, HHA (OASIS) (continued)
CARE ITEM SET CARE Item Set Item Derivation1
CARE Assessment, RTI Intl. 2010
n = 4551 (ranges for weighted
and unweighted kappas)
K. Berg, 1999 (OASIS B)
n = 144
Hittle et al., 2002
(OASIS B) n = 66
Abt Assc. & CHSR, 2008 (OASIS C)
n = 160
Madigan et al., 2004 (OASIS)
n = 88
Kinatukara et al., 2005
(OASIS B) n = 105
G2e. Unhealed Stage 2+ pressure ulcers present for more than 1 month
CMS Workgroup k = (0.790 - 0.825) — — — — —
G3. Length, Width, Date for largest unhealed Stage 3 or 4 pressure ulcer
CMS Workgroup — — — — — —
G3a. Length — corr. = 0.596 — — — — — G3b. Width — corr. = 0.578 — — — — — G3c. Date — — — — — — — G4. Undermining/Tunneling Stage 3 or 4 CMS Workgroup — — — — — — G5a-e. Number Major Wounds MDS 3.0 — — — — — — G5 One or more Major wounds that require
ongoing care — corr. = 0.789 — — — — —
G5a. Delayed healing of surgical wound — corr. = 0.644 — — — — — G5b. Trauma related wounds — corr. = 0.917 — — — — — G5c. Diabetic Foot Ulcers — corr. = 0.781 — — — — — G5d. Vascular ulcers — corr. = 0.936 — — — — — G5e. Other — corr. = 0.890 — — — — — G6. Turning Surfaces Intact CMS Workgroup — — — — — — G6a. Skin for all turning surfaces is intact — k = 0.665 — — — — — G6b. Right hip not intact — k = 0.558 — — — — — G6c. Left hip not intact — k = 0.630 — — — — — G6d. Back/buttocks not intact — k = 0.766 — — — — — G6e. Other turning surface(s) not intact — k = 0.208 — — — — — H1-39. Physiologic Factors New — — — — — — IV. Cognitive Status, Mood & Pain — — — — — — — A. Comatose MDS 3.0 k = 0.398 — — — — — B1. BIMS Interview Attempted MDS 3.0 k = 0.771 — — — — — B2. Reason not Attempted MDS 3.0 k = (0.632 - 0.713) — — — — — B3a. BIMS: Sock, Blue, Bed MDS 3.0 k = (0.625 - 0.705) — — — — — B3b. BIMS: Year, Month, Day MDS 3.0 — — — — — — B3b1. Year MDS 3.0 k = (0.820 - 0.876) — — — — — B3b2. Month MDS 3.0 k = (0.790 - 0.869) — — — — —
(continued)
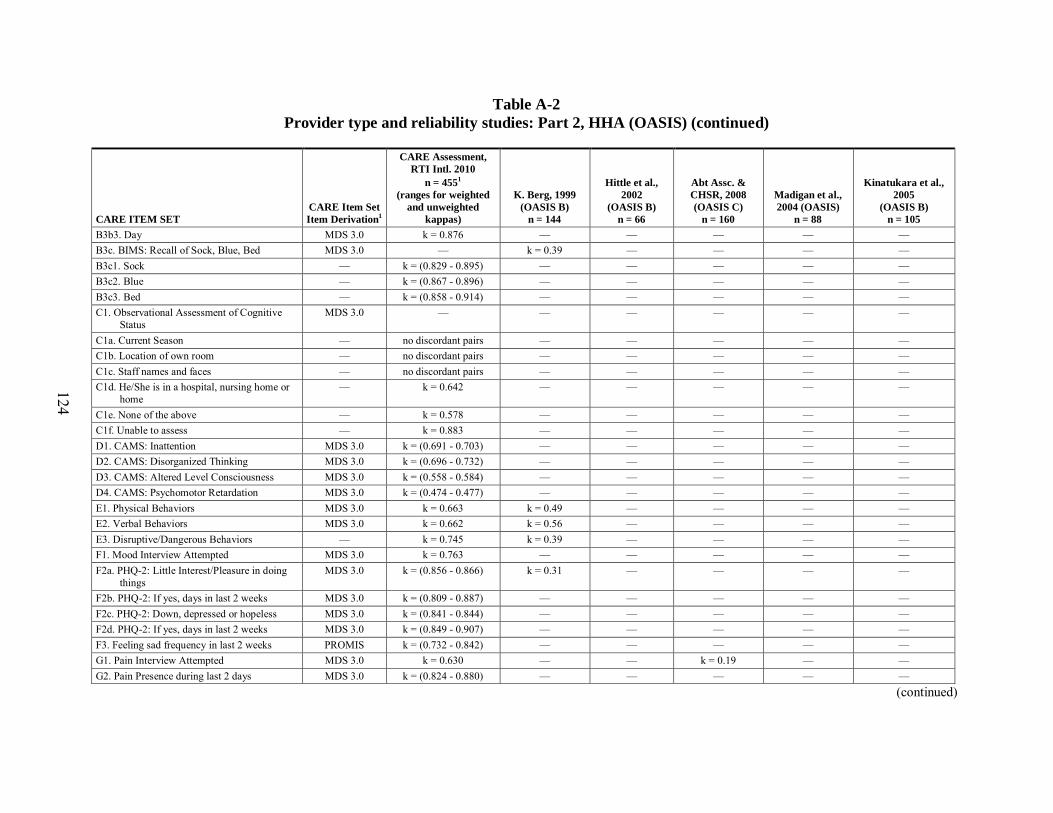
124
Table A-2 Provider type and reliability studies: Part 2, HHA (OASIS) (continued)
CARE ITEM SET CARE Item Set Item Derivation1
CARE Assessment, RTI Intl. 2010
n = 4551 (ranges for weighted
and unweighted kappas)
K. Berg, 1999 (OASIS B)
n = 144
Hittle et al., 2002
(OASIS B) n = 66
Abt Assc. & CHSR, 2008 (OASIS C)
n = 160
Madigan et al., 2004 (OASIS)
n = 88
Kinatukara et al., 2005
(OASIS B) n = 105
B3b3. Day MDS 3.0 k = 0.876 — — — — — B3c. BIMS: Recall of Sock, Blue, Bed MDS 3.0 — k = 0.39 — — — — B3c1. Sock — k = (0.829 - 0.895) — — — — — B3c2. Blue — k = (0.867 - 0.896) — — — — — B3c3. Bed — k = (0.858 - 0.914) — — — — — C1. Observational Assessment of Cognitive
Status MDS 3.0 — — — — — —
C1a. Current Season — no discordant pairs — — — — — C1b. Location of own room — no discordant pairs — — — — — C1c. Staff names and faces — no discordant pairs — — — — — C1d. He/She is in a hospital, nursing home or
home — k = 0.642 — — — — —
C1e. None of the above — k = 0.578 — — — — — C1f. Unable to assess — k = 0.883 — — — — — D1. CAMS: Inattention MDS 3.0 k = (0.691 - 0.703) — — — — — D2. CAMS: Disorganized Thinking MDS 3.0 k = (0.696 - 0.732) — — — — — D3. CAMS: Altered Level Consciousness MDS 3.0 k = (0.558 - 0.584) — — — — — D4. CAMS: Psychomotor Retardation MDS 3.0 k = (0.474 - 0.477) — — — — — E1. Physical Behaviors MDS 3.0 k = 0.663 k = 0.49 — — — — E2. Verbal Behaviors MDS 3.0 k = 0.662 k = 0.56 — — — — E3. Disruptive/Dangerous Behaviors — k = 0.745 k = 0.39 — — — — F1. Mood Interview Attempted MDS 3.0 k = 0.763 — — — — — F2a. PHQ-2: Little Interest/Pleasure in doing
things MDS 3.0 k = (0.856 - 0.866) k = 0.31 — — — —
F2b. PHQ-2: If yes, days in last 2 weeks MDS 3.0 k = (0.809 - 0.887) — — — — — F2c. PHQ-2: Down, depressed or hopeless MDS 3.0 k = (0.841 - 0.844) — — — — — F2d. PHQ-2: If yes, days in last 2 weeks MDS 3.0 k = (0.849 - 0.907) — — — — — F3. Feeling sad frequency in last 2 weeks PROMIS k = (0.732 - 0.842) — — — — — G1. Pain Interview Attempted MDS 3.0 k = 0.630 — — k = 0.19 — — G2. Pain Presence during last 2 days MDS 3.0 k = (0.824 - 0.880) — — — — —
(continued)
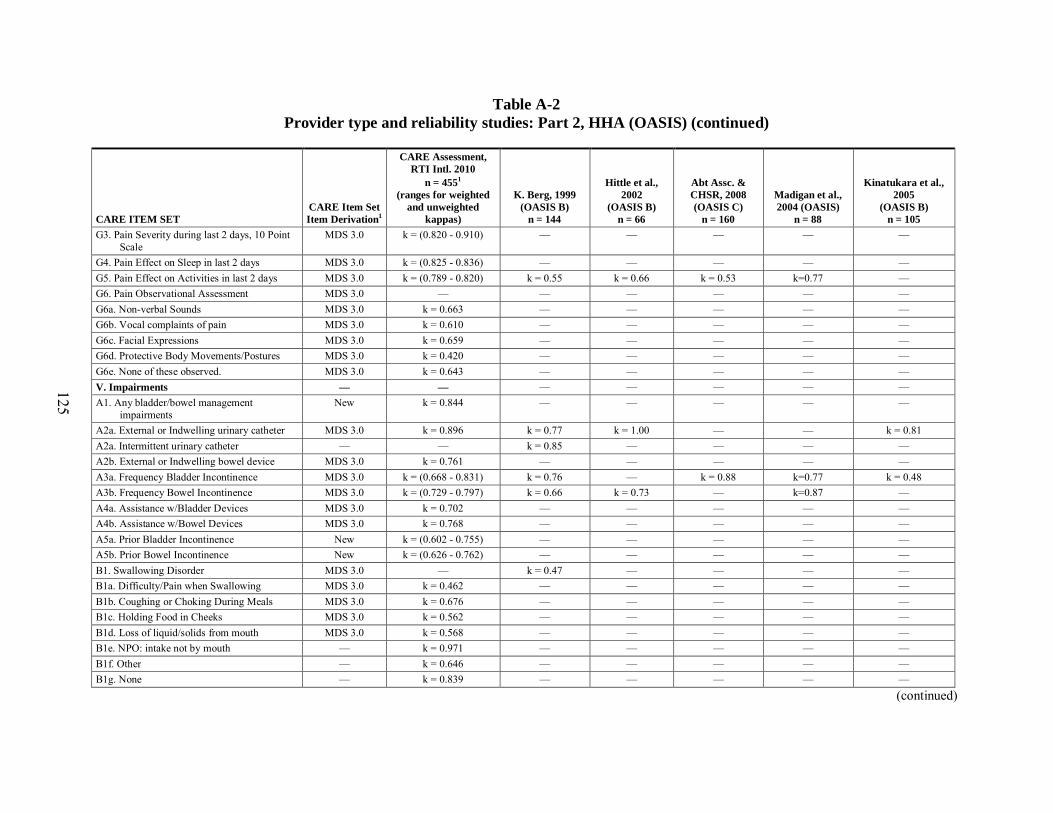
125
Table A-2 Provider type and reliability studies: Part 2, HHA (OASIS) (continued)
CARE ITEM SET CARE Item Set Item Derivation1
CARE Assessment, RTI Intl. 2010
n = 4551 (ranges for weighted
and unweighted kappas)
K. Berg, 1999 (OASIS B)
n = 144
Hittle et al., 2002
(OASIS B) n = 66
Abt Assc. & CHSR, 2008 (OASIS C)
n = 160
Madigan et al., 2004 (OASIS)
n = 88
Kinatukara et al., 2005
(OASIS B) n = 105
G3. Pain Severity during last 2 days, 10 Point Scale
MDS 3.0 k = (0.820 - 0.910) — — — — —
G4. Pain Effect on Sleep in last 2 days MDS 3.0 k = (0.825 - 0.836) — — — — — G5. Pain Effect on Activities in last 2 days MDS 3.0 k = (0.789 - 0.820) k = 0.55 k = 0.66 k = 0.53 k=0.77 — G6. Pain Observational Assessment MDS 3.0 — — — — — — G6a. Non-verbal Sounds MDS 3.0 k = 0.663 — — — — — G6b. Vocal complaints of pain MDS 3.0 k = 0.610 — — — — — G6c. Facial Expressions MDS 3.0 k = 0.659 — — — — — G6d. Protective Body Movements/Postures MDS 3.0 k = 0.420 — — — — — G6e. None of these observed. MDS 3.0 k = 0.643 — — — — — V. Impairments — — — — — — — A1. Any bladder/bowel management
impairments New k = 0.844 — — — — —
A2a. External or Indwelling urinary catheter MDS 3.0 k = 0.896 k = 0.77 k = 1.00 — — k = 0.81 A2a. Intermittent urinary catheter — — k = 0.85 — — — — A2b. External or Indwelling bowel device MDS 3.0 k = 0.761 — — — — — A3a. Frequency Bladder Incontinence MDS 3.0 k = (0.668 - 0.831) k = 0.76 — k = 0.88 k=0.77 k = 0.48 A3b. Frequency Bowel Incontinence MDS 3.0 k = (0.729 - 0.797) k = 0.66 k = 0.73 — k=0.87 — A4a. Assistance w/Bladder Devices MDS 3.0 k = 0.702 — — — — — A4b. Assistance w/Bowel Devices MDS 3.0 k = 0.768 — — — — — A5a. Prior Bladder Incontinence New k = (0.602 - 0.755) — — — — — A5b. Prior Bowel Incontinence New k = (0.626 - 0.762) — — — — — B1. Swallowing Disorder MDS 3.0 — k = 0.47 — — — — B1a. Difficulty/Pain when Swallowing MDS 3.0 k = 0.462 — — — — — B1b. Coughing or Choking During Meals MDS 3.0 k = 0.676 — — — — — B1c. Holding Food in Cheeks MDS 3.0 k = 0.562 — — — — — B1d. Loss of liquid/solids from mouth MDS 3.0 k = 0.568 — — — — — B1e. NPO: intake not by mouth — k = 0.971 — — — — — B1f. Other — k = 0.646 — — — — — B1g. None — k = 0.839 — — — — —
(continued)
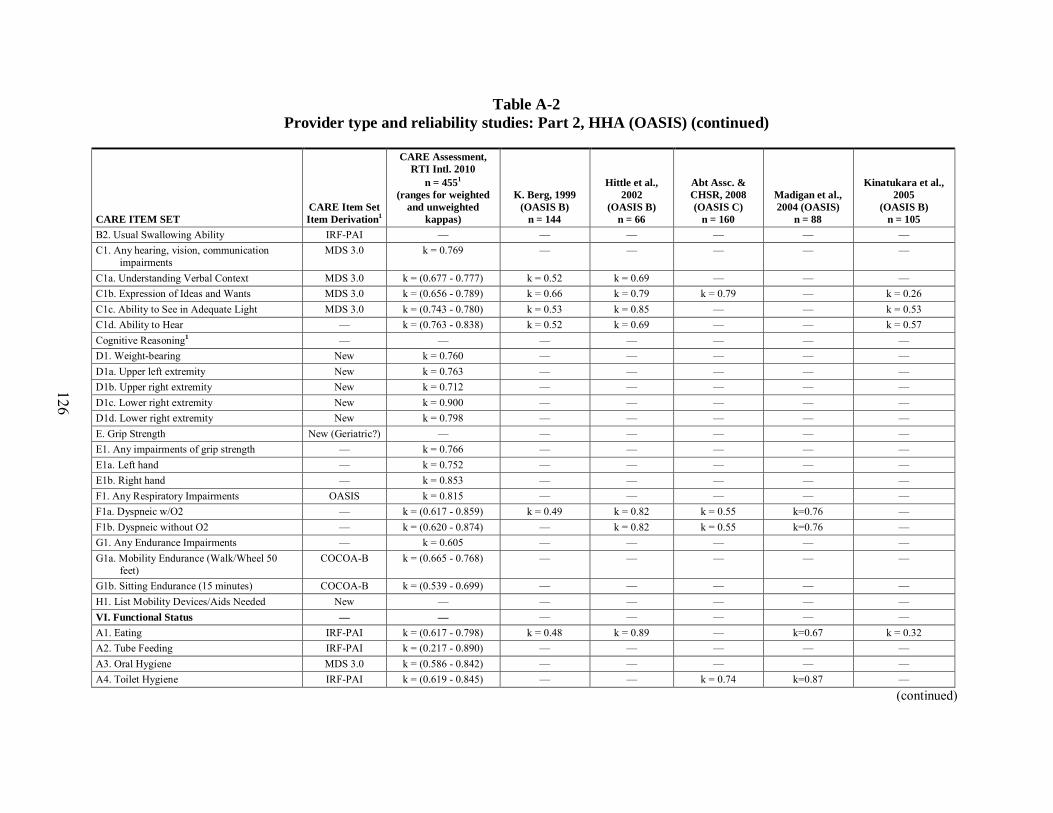
126
Table A-2 Provider type and reliability studies: Part 2, HHA (OASIS) (continued)
CARE ITEM SET CARE Item Set Item Derivation1
CARE Assessment, RTI Intl. 2010
n = 4551 (ranges for weighted
and unweighted kappas)
K. Berg, 1999 (OASIS B)
n = 144
Hittle et al., 2002
(OASIS B) n = 66
Abt Assc. & CHSR, 2008 (OASIS C)
n = 160
Madigan et al., 2004 (OASIS)
n = 88
Kinatukara et al., 2005
(OASIS B) n = 105
B2. Usual Swallowing Ability IRF-PAI — — — — — — C1. Any hearing, vision, communication
impairments MDS 3.0 k = 0.769 — — — — —
C1a. Understanding Verbal Context MDS 3.0 k = (0.677 - 0.777) k = 0.52 k = 0.69 — — — C1b. Expression of Ideas and Wants MDS 3.0 k = (0.656 - 0.789) k = 0.66 k = 0.79 k = 0.79 — k = 0.26 C1c. Ability to See in Adequate Light MDS 3.0 k = (0.743 - 0.780) k = 0.53 k = 0.85 — — k = 0.53 C1d. Ability to Hear — k = (0.763 - 0.838) k = 0.52 k = 0.69 — — k = 0.57 Cognitive Reasoning1 — — — — — — — D1. Weight-bearing New k = 0.760 — — — — — D1a. Upper left extremity New k = 0.763 — — — — — D1b. Upper right extremity New k = 0.712 — — — — — D1c. Lower right extremity New k = 0.900 — — — — — D1d. Lower right extremity New k = 0.798 — — — — — E. Grip Strength New (Geriatric?) — — — — — — E1. Any impairments of grip strength — k = 0.766 — — — — — E1a. Left hand — k = 0.752 — — — — — E1b. Right hand — k = 0.853 — — — — — F1. Any Respiratory Impairments OASIS k = 0.815 — — — — — F1a. Dyspneic w/O2 — k = (0.617 - 0.859) k = 0.49 k = 0.82 k = 0.55 k=0.76 — F1b. Dyspneic without O2 — k = (0.620 - 0.874) — k = 0.82 k = 0.55 k=0.76 — G1. Any Endurance Impairments — k = 0.605 — — — — — G1a. Mobility Endurance (Walk/Wheel 50
feet) COCOA-B k = (0.665 - 0.768) — — — — —
G1b. Sitting Endurance (15 minutes) COCOA-B k = (0.539 - 0.699) — — — — — H1. List Mobility Devices/Aids Needed New — — — — — — VI. Functional Status — — — — — — — A1. Eating IRF-PAI k = (0.617 - 0.798) k = 0.48 k = 0.89 — k=0.67 k = 0.32 A2. Tube Feeding IRF-PAI k = (0.217 - 0.890) — — — — — A3. Oral Hygiene MDS 3.0 k = (0.586 - 0.842) — — — — — A4. Toilet Hygiene IRF-PAI k = (0.619 - 0.845) — — k = 0.74 k=0.87 —
(continued)
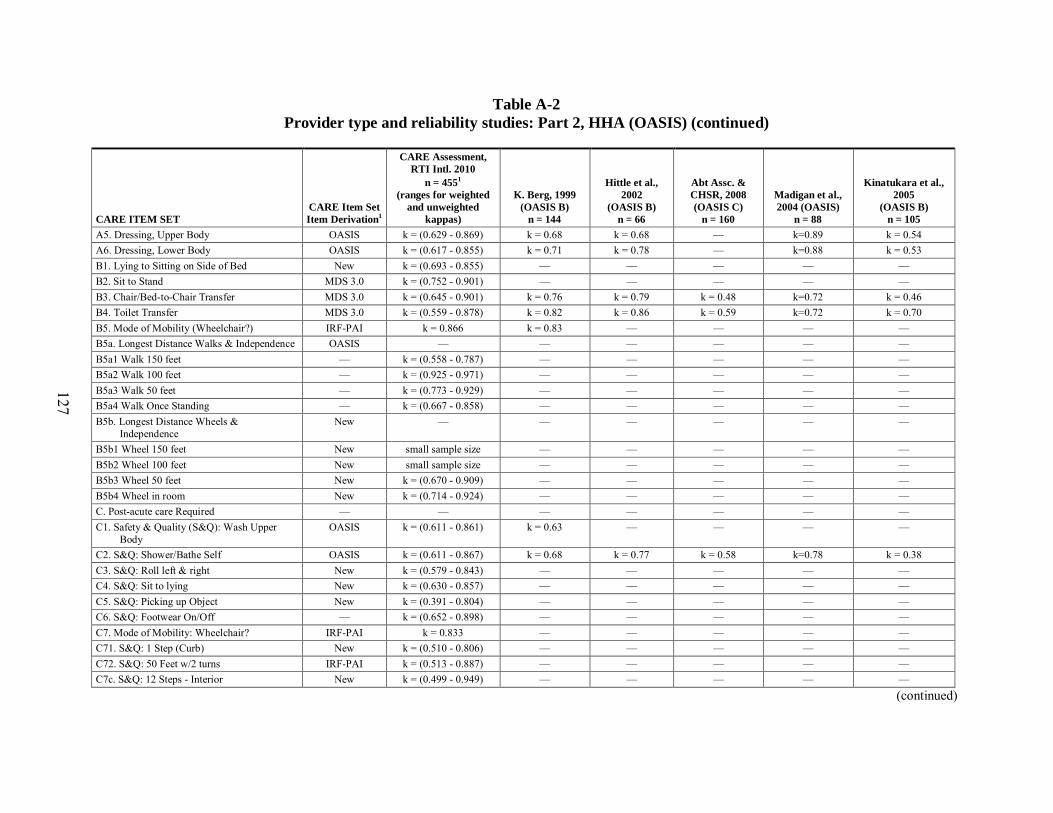
127
Table A-2 Provider type and reliability studies: Part 2, HHA (OASIS) (continued)
CARE ITEM SET CARE Item Set Item Derivation1
CARE Assessment, RTI Intl. 2010
n = 4551 (ranges for weighted
and unweighted kappas)
K. Berg, 1999 (OASIS B)
n = 144
Hittle et al., 2002
(OASIS B) n = 66
Abt Assc. & CHSR, 2008 (OASIS C)
n = 160
Madigan et al., 2004 (OASIS)
n = 88
Kinatukara et al., 2005
(OASIS B) n = 105
A5. Dressing, Upper Body OASIS k = (0.629 - 0.869) k = 0.68 k = 0.68 — k=0.89 k = 0.54 A6. Dressing, Lower Body OASIS k = (0.617 - 0.855) k = 0.71 k = 0.78 — k=0.88 k = 0.53 B1. Lying to Sitting on Side of Bed New k = (0.693 - 0.855) — — — — — B2. Sit to Stand MDS 3.0 k = (0.752 - 0.901) — — — — — B3. Chair/Bed-to-Chair Transfer MDS 3.0 k = (0.645 - 0.901) k = 0.76 k = 0.79 k = 0.48 k=0.72 k = 0.46 B4. Toilet Transfer MDS 3.0 k = (0.559 - 0.878) k = 0.82 k = 0.86 k = 0.59 k=0.72 k = 0.70 B5. Mode of Mobility (Wheelchair?) IRF-PAI k = 0.866 k = 0.83 — — — — B5a. Longest Distance Walks & Independence OASIS — — — — — — B5a1 Walk 150 feet — k = (0.558 - 0.787) — — — — — B5a2 Walk 100 feet — k = (0.925 - 0.971) — — — — — B5a3 Walk 50 feet — k = (0.773 - 0.929) — — — — — B5a4 Walk Once Standing — k = (0.667 - 0.858) — — — — — B5b. Longest Distance Wheels &
Independence New — — — — — —
B5b1 Wheel 150 feet New small sample size — — — — — B5b2 Wheel 100 feet New small sample size — — — — — B5b3 Wheel 50 feet New k = (0.670 - 0.909) — — — — — B5b4 Wheel in room New k = (0.714 - 0.924) — — — — — C. Post-acute care Required — — — — — — — C1. Safety & Quality (S&Q): Wash Upper
Body OASIS k = (0.611 - 0.861) k = 0.63 — — — —
C2. S&Q: Shower/Bathe Self OASIS k = (0.611 - 0.867) k = 0.68 k = 0.77 k = 0.58 k=0.78 k = 0.38 C3. S&Q: Roll left & right New k = (0.579 - 0.843) — — — — — C4. S&Q: Sit to lying New k = (0.630 - 0.857) — — — — — C5. S&Q: Picking up Object New k = (0.391 - 0.804) — — — — — C6. S&Q: Footwear On/Off — k = (0.652 - 0.898) — — — — — C7. Mode of Mobility: Wheelchair? IRF-PAI k = 0.833 — — — — — C71. S&Q: 1 Step (Curb) New k = (0.510 - 0.806) — — — — — C72. S&Q: 50 Feet w/2 turns IRF-PAI k = (0.513 - 0.887) — — — — — C7c. S&Q: 12 Steps - Interior New k = (0.499 - 0.949) — — — — —
(continued)
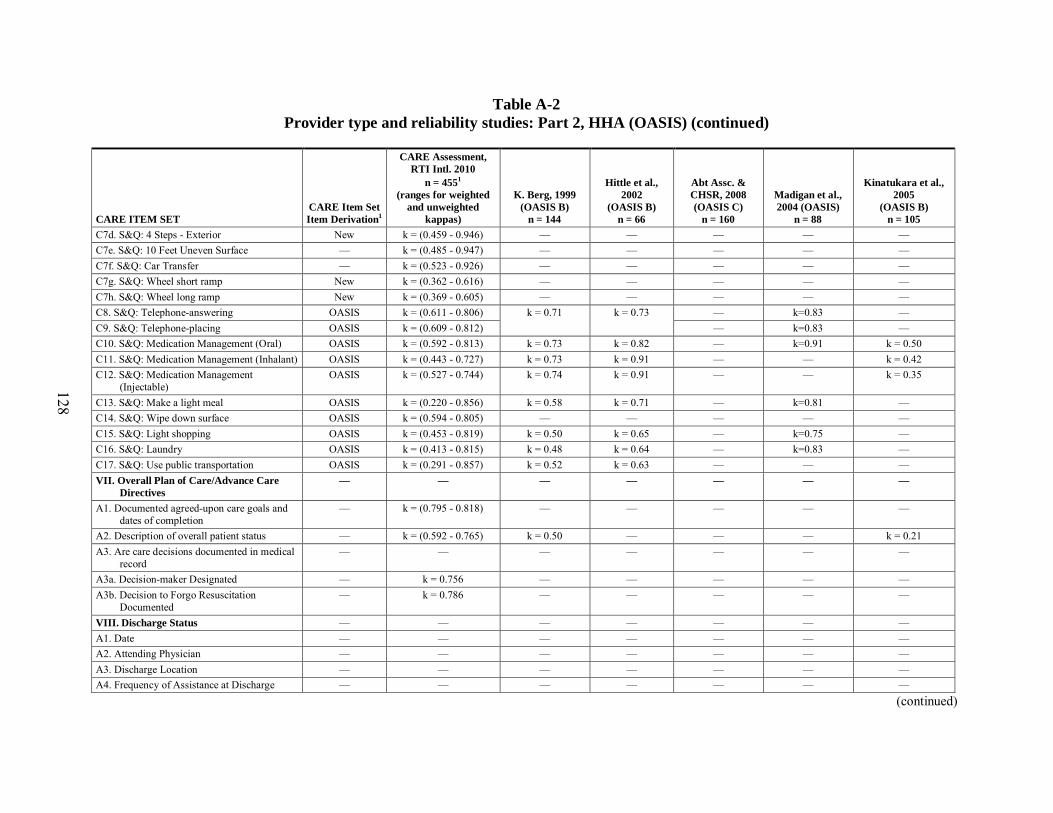
128
Table A-2 Provider type and reliability studies: Part 2, HHA (OASIS) (continued)
CARE ITEM SET CARE Item Set Item Derivation1
CARE Assessment, RTI Intl. 2010
n = 4551 (ranges for weighted
and unweighted kappas)
K. Berg, 1999 (OASIS B)
n = 144
Hittle et al., 2002
(OASIS B) n = 66
Abt Assc. & CHSR, 2008 (OASIS C)
n = 160
Madigan et al., 2004 (OASIS)
n = 88
Kinatukara et al., 2005
(OASIS B) n = 105
C7d. S&Q: 4 Steps - Exterior New k = (0.459 - 0.946) — — — — — C7e. S&Q: 10 Feet Uneven Surface — k = (0.485 - 0.947) — — — — — C7f. S&Q: Car Transfer — k = (0.523 - 0.926) — — — — — C7g. S&Q: Wheel short ramp New k = (0.362 - 0.616) — — — — — C7h. S&Q: Wheel long ramp New k = (0.369 - 0.605) — — — — — C8. S&Q: Telephone-answering OASIS k = (0.611 - 0.806) k = 0.71 k = 0.73 — k=0.83 — C9. S&Q: Telephone-placing OASIS k = (0.609 - 0.812) — k=0.83 — C10. S&Q: Medication Management (Oral) OASIS k = (0.592 - 0.813) k = 0.73 k = 0.82 — k=0.91 k = 0.50 C11. S&Q: Medication Management (Inhalant) OASIS k = (0.443 - 0.727) k = 0.73 k = 0.91 — — k = 0.42 C12. S&Q: Medication Management
(Injectable) OASIS k = (0.527 - 0.744) k = 0.74 k = 0.91 — — k = 0.35
C13. S&Q: Make a light meal OASIS k = (0.220 - 0.856) k = 0.58 k = 0.71 — k=0.81 — C14. S&Q: Wipe down surface OASIS k = (0.594 - 0.805) — — — — — C15. S&Q: Light shopping OASIS k = (0.453 - 0.819) k = 0.50 k = 0.65 — k=0.75 — C16. S&Q: Laundry OASIS k = (0.413 - 0.815) k = 0.48 k = 0.64 — k=0.83 — C17. S&Q: Use public transportation OASIS k = (0.291 - 0.857) k = 0.52 k = 0.63 — — — VII. Overall Plan of Care/Advance Care
Directives — — — — — — —
A1. Documented agreed-upon care goals and dates of completion
— k = (0.795 - 0.818) — — — — —
A2. Description of overall patient status — k = (0.592 - 0.765) k = 0.50 — — — k = 0.21 A3. Are care decisions documented in medical
record — — — — — — —
A3a. Decision-maker Designated — k = 0.756 — — — — — A3b. Decision to Forgo Resuscitation
Documented — k = 0.786 — — — — —
VIII. Discharge Status — — — — — — — A1. Date — — — — — — — A2. Attending Physician — — — — — — — A3. Discharge Location — — — — — — — A4. Frequency of Assistance at Discharge — — — — — — —
(continued)
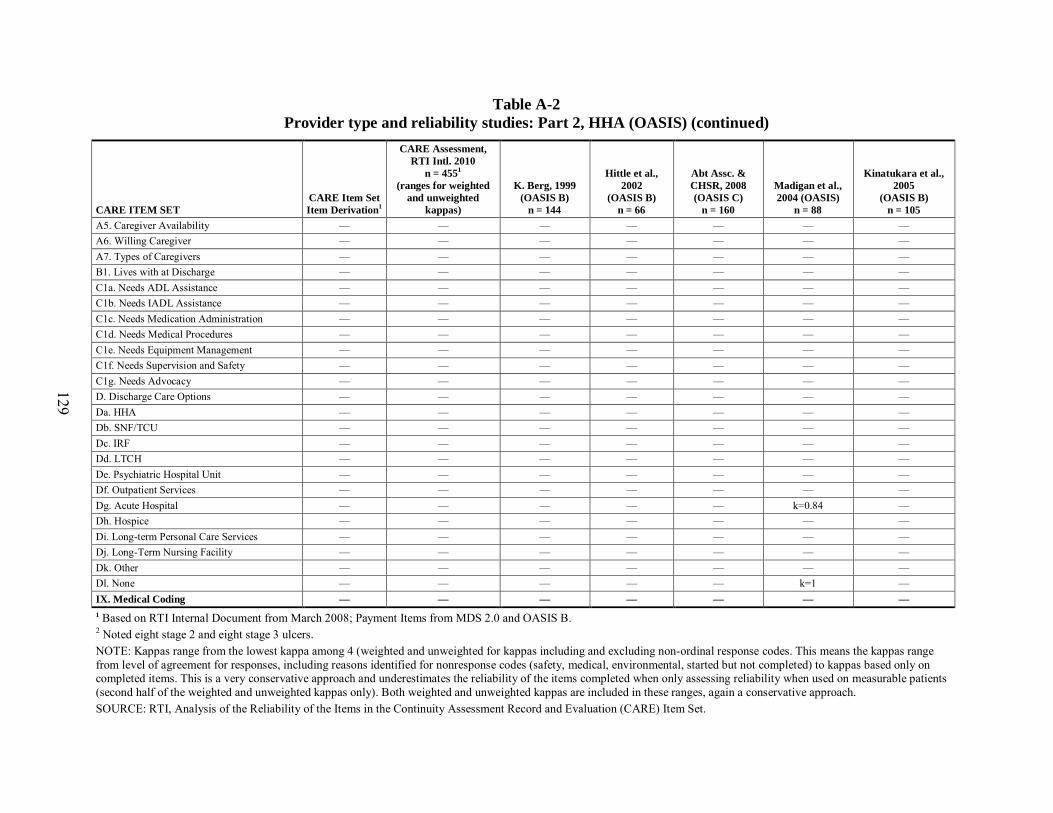
129
Table A-2 Provider type and reliability studies: Part 2, HHA (OASIS) (continued)
CARE ITEM SET CARE Item Set Item Derivation1
CARE Assessment, RTI Intl. 2010
n = 4551 (ranges for weighted
and unweighted kappas)
K. Berg, 1999 (OASIS B)
n = 144
Hittle et al., 2002
(OASIS B) n = 66
Abt Assc. & CHSR, 2008 (OASIS C)
n = 160
Madigan et al., 2004 (OASIS)
n = 88
Kinatukara et al., 2005
(OASIS B) n = 105
A5. Caregiver Availability — — — — — — — A6. Willing Caregiver — — — — — — — A7. Types of Caregivers — — — — — — — B1. Lives with at Discharge — — — — — — — C1a. Needs ADL Assistance — — — — — — — C1b. Needs IADL Assistance — — — — — — — C1c. Needs Medication Administration — — — — — — — C1d. Needs Medical Procedures — — — — — — — C1e. Needs Equipment Management — — — — — — — C1f. Needs Supervision and Safety — — — — — — — C1g. Needs Advocacy — — — — — — — D. Discharge Care Options — — — — — — — Da. HHA — — — — — — — Db. SNF/TCU — — — — — — — Dc. IRF — — — — — — — Dd. LTCH — — — — — — — De. Psychiatric Hospital Unit — — — — — — — Df. Outpatient Services — — — — — — — Dg. Acute Hospital — — — — — k=0.84 — Dh. Hospice — — — — — — — Di. Long-term Personal Care Services — — — — — — — Dj. Long-Term Nursing Facility — — — — — — — Dk. Other — — — — — — — Dl. None — — — — — k=1 — IX. Medical Coding — — — — — — — 1 Based on RTI Internal Document from March 2008; Payment Items from MDS 2.0 and OASIS B. 2 Noted eight stage 2 and eight stage 3 ulcers. NOTE: Kappas range from the lowest kappa among 4 (weighted and unweighted for kappas including and excluding non-ordinal response codes. This means the kappas range from level of agreement for responses, including reasons identified for nonresponse codes (safety, medical, environmental, started but not completed) to kappas based only on completed items. This is a very conservative approach and underestimates the reliability of the items completed when only assessing reliability when used on measurable patients (second half of the weighted and unweighted kappas only). Both weighted and unweighted kappas are included in these ranges, again a conservative approach. SOURCE: RTI, Analysis of the Reliability of the Items in the Continuity Assessment Record and Evaluation (CARE) Item Set.
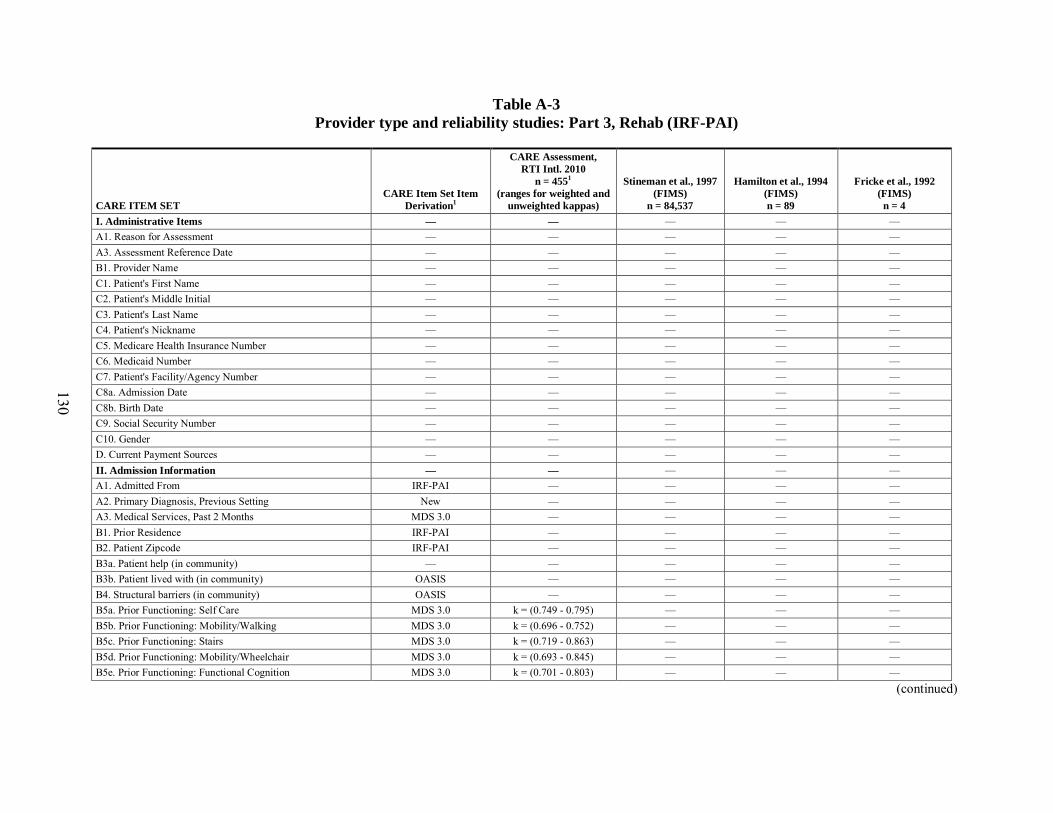
130
Table A-3 Provider type and reliability studies: Part 3, Rehab (IRF-PAI)
CARE ITEM SET CARE Item Set Item
Derivation1
CARE Assessment, RTI Intl. 2010
n = 4551 (ranges for weighted and
unweighted kappas)
Stineman et al., 1997 (FIMS)
n = 84,537
Hamilton et al., 1994 (FIMS) n = 89
Fricke et al., 1992 (FIMS)
n = 4 I. Administrative Items — — — — — A1. Reason for Assessment — — — — — A3. Assessment Reference Date — — — — — B1. Provider Name — — — — — C1. Patient's First Name — — — — — C2. Patient's Middle Initial — — — — — C3. Patient's Last Name — — — — — C4. Patient's Nickname — — — — — C5. Medicare Health Insurance Number — — — — — C6. Medicaid Number — — — — — C7. Patient's Facility/Agency Number — — — — — C8a. Admission Date — — — — — C8b. Birth Date — — — — — C9. Social Security Number — — — — — C10. Gender — — — — — D. Current Payment Sources — — — — — II. Admission Information — — — — — A1. Admitted From IRF-PAI — — — — A2. Primary Diagnosis, Previous Setting New — — — — A3. Medical Services, Past 2 Months MDS 3.0 — — — — B1. Prior Residence IRF-PAI — — — — B2. Patient Zipcode IRF-PAI — — — — B3a. Patient help (in community) — — — — — B3b. Patient lived with (in community) OASIS — — — — B4. Structural barriers (in community) OASIS — — — — B5a. Prior Functioning: Self Care MDS 3.0 k = (0.749 - 0.795) — — — B5b. Prior Functioning: Mobility/Walking MDS 3.0 k = (0.696 - 0.752) — — — B5c. Prior Functioning: Stairs MDS 3.0 k = (0.719 - 0.863) — — — B5d. Prior Functioning: Mobility/Wheelchair MDS 3.0 k = (0.693 - 0.845) — — — B5e. Prior Functioning: Functional Cognition MDS 3.0 k = (0.701 - 0.803) — — —
(continued)
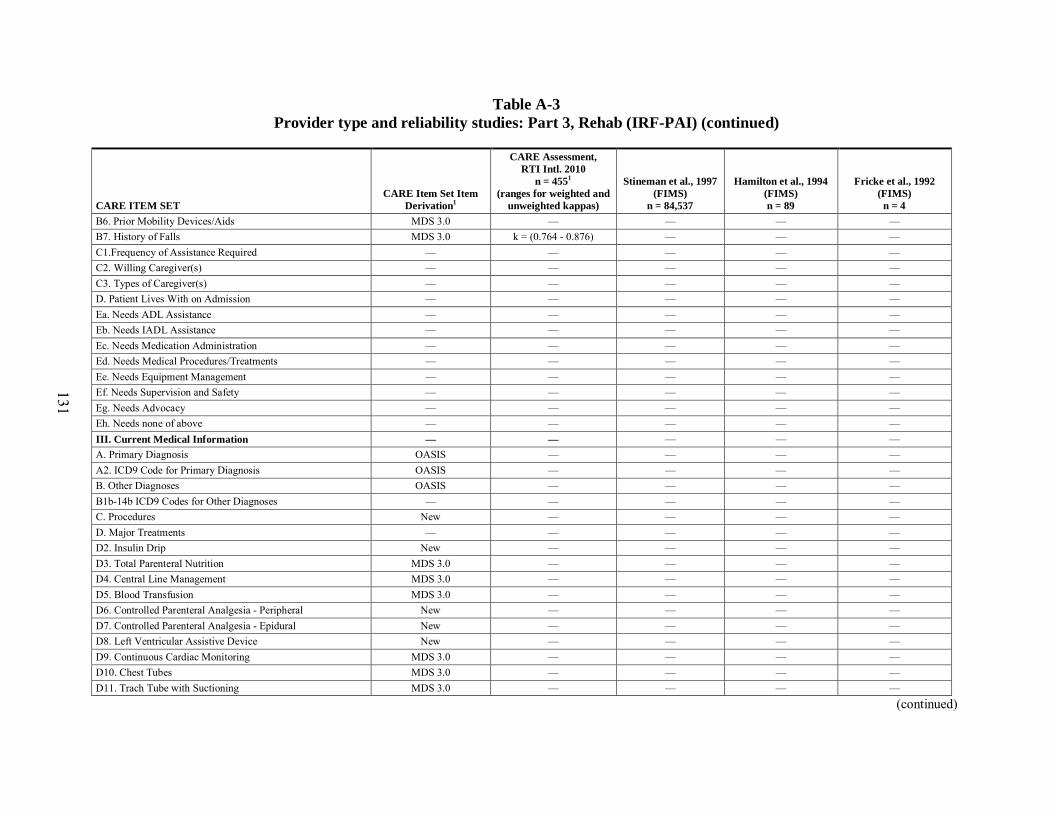
131
Table A-3 Provider type and reliability studies: Part 3, Rehab (IRF-PAI) (continued)
CARE ITEM SET CARE Item Set Item
Derivation1
CARE Assessment, RTI Intl. 2010
n = 4551 (ranges for weighted and
unweighted kappas)
Stineman et al., 1997 (FIMS)
n = 84,537
Hamilton et al., 1994 (FIMS) n = 89
Fricke et al., 1992 (FIMS)
n = 4 B6. Prior Mobility Devices/Aids MDS 3.0 — — — — B7. History of Falls MDS 3.0 k = (0.764 - 0.876) — — — C1.Frequency of Assistance Required — — — — — C2. Willing Caregiver(s) — — — — — C3. Types of Caregiver(s) — — — — — D. Patient Lives With on Admission — — — — — Ea. Needs ADL Assistance — — — — — Eb. Needs IADL Assistance — — — — — Ec. Needs Medication Administration — — — — — Ed. Needs Medical Procedures/Treatments — — — — — Ee. Needs Equipment Management — — — — — Ef. Needs Supervision and Safety — — — — — Eg. Needs Advocacy — — — — — Eh. Needs none of above — — — — — III. Current Medical Information — — — — — A. Primary Diagnosis OASIS — — — — A2. ICD9 Code for Primary Diagnosis OASIS — — — — B. Other Diagnoses OASIS — — — — B1b-14b ICD9 Codes for Other Diagnoses — — — — — C. Procedures New — — — — D. Major Treatments — — — — — D2. Insulin Drip New — — — — D3. Total Parenteral Nutrition MDS 3.0 — — — — D4. Central Line Management MDS 3.0 — — — — D5. Blood Transfusion MDS 3.0 — — — — D6. Controlled Parenteral Analgesia - Peripheral New — — — — D7. Controlled Parenteral Analgesia - Epidural New — — — — D8. Left Ventricular Assistive Device New — — — — D9. Continuous Cardiac Monitoring MDS 3.0 — — — — D10. Chest Tubes MDS 3.0 — — — — D11. Trach Tube with Suctioning MDS 3.0 — — — —
(continued)

132
Table A-3 Provider type and reliability studies: Part 3, Rehab (IRF-PAI) (continued)
CARE ITEM SET CARE Item Set Item
Derivation1
CARE Assessment, RTI Intl. 2010
n = 4551 (ranges for weighted and
unweighted kappas)
Stineman et al., 1997 (FIMS)
n = 84,537
Hamilton et al., 1994 (FIMS) n = 89
Fricke et al., 1992 (FIMS)
n = 4 D12. High O2 Concentration Delivery System MDS 3.0 — — — — D14. Ventilator - Weaning MDS 3.0 — — — — D15. Ventilator - Non-Weaning MDS 3.0 — — — — D16. Hemodialysis MDS 3.0 — — — — D17. Peritoneal Dialysis MDS 3.0 — — — — D18. Fistula or Other Drain Management MDS 3.0 — — — — D19. Negative Pressure Wound Therapy MDS 3.0 — — — — D20. Complex Wound Management MDS 3.0 — — — — D21. Halo New — — — — D22. Complex External Fixator MDS 3.0 — — — — D23. One-on-One 24 Hr Supervision New — — — — D24. Specialty Bed MDS 3.0 — — — — D25. Multiple IV Antibiotic Administration MDS 3.0 — — — — D.26. IV Vasoactive Medications MDS 3.0 — — — — D.27. IV Anti-coagulants MDS 3.0 — — — — D.28. IV Chemotherapy MDS 3.0 — — — — D29. Indwelling Bowel Catheter Management System — — — — — E. Medications (Optional) New — — — — F. Allergies & Adverse Drug Reactions New — — — — G1. Risk of Pressure Ulcers CMS Workgroup k = (0.586 - 0.742) — — — G2. Any Stage 2+ pressure ulcers CMS Workgroup k = 0.845 — — — G2a. Number of Pressure ulcers Stage 2 CMS Workgroup k = (0.801 - 0.815) — — — G2b. Number of Pressure ulcers Stage 3 CMS Workgroup k = (0.760 - 0.852) — — — G2c. Number of Pressure ulcers Stage 4 CMS Workgroup k = (0.707 - 0.780) — — — G2d. Number Pressure ulcers Unstageable CMS Workgroup k = (0.652 - 0.678) — — — G2e. Unhealed Stage 2+ pressure ulcers present for more than
1 month CMS Workgroup k = (0.790 - 0.825) — — —
G3. Length, Width, Date for largest unhealed Stage 3 or 4 pressure ulcer
CMS Workgroup — — — —
G3a. Length — corr. = 0.596 — — — G3b. Width — corr. = 0.578 — — —
(continued)

133
Table A-3 Provider type and reliability studies: Part 3, Rehab (IRF-PAI) (continued)
CARE ITEM SET CARE Item Set Item
Derivation1
CARE Assessment, RTI Intl. 2010
n = 4551 (ranges for weighted and
unweighted kappas)
Stineman et al., 1997 (FIMS)
n = 84,537
Hamilton et al., 1994 (FIMS) n = 89
Fricke et al., 1992 (FIMS)
n = 4 G3c. Date — — — — — G4. Undermining/Tunneling Stage 3 or 4 CMS Workgroup — — — — G5a-e. Number Major Wounds MDS 3.0 — — — — G5 One or more Major wounds that require ongoing care — corr. = 0.789 — — — G5a. Delayed healing of surgical wound — corr. = 0.644 — — — G5b. Trauma related wounds — corr. = 0.917 — — — G5c. Diabetic Foot Ulcers — corr. = 0.781 — — — G5d. Vascular ulcers — corr. = 0.936 — — — G5e. Other — corr. = 0.890 — — — G6. Turning Surfaces Intact CMS Workgroup — — — — G6a. Skin for all turning surfaces is intact — k = 0.665 — — — G6b. Right hip not intact — k = 0.558 — — — G6c. Left hip not intact — k = 0.630 — — — G6d. Back/buttocks not intact — k = 0.766 — — — G6e. Other turning surface(s) not intact — k = 0.208 — — — H1-39. Physiologic Factors New — — — — IV. Cognitive Status, Mood & Pain — — — — — A. Comatose MDS 3.0 k = 0.398 — — — B1. BIMS Interview Attempted MDS 3.0 k = 0.771 — — — B2. Reason not Attempted MDS 3.0 k = (0.632 - 0.713) — — — B3a. BIMS: Sock, Blue, Bed MDS 3.0 k = (0.625 - 0.705) — — — B3b. BIMS: Year, Month, Day MDS 3.0 — — — — B3b1. Year MDS 3.0 k = (0.820 - 0.876) — — — B3b2. Month MDS 3.0 k = (0.790 - 0.869) — — — B3b3. Day MDS 3.0 k = 0.876 — — — B3c. BIMS: Recall of Sock, Blue, Bed MDS 3.0 — — — — B3c1. Sock — k = (0.829 - 0.895) — — — B3c2. Blue — k = (0.867 - 0.896) — — — B3c3. Bed — k = (0.858 - 0.914) — — — C1. Observational Assessment of Cognitive Status MDS 3.0 — — — — C1a. Current Season — no discordant pairs — — —
(continued)
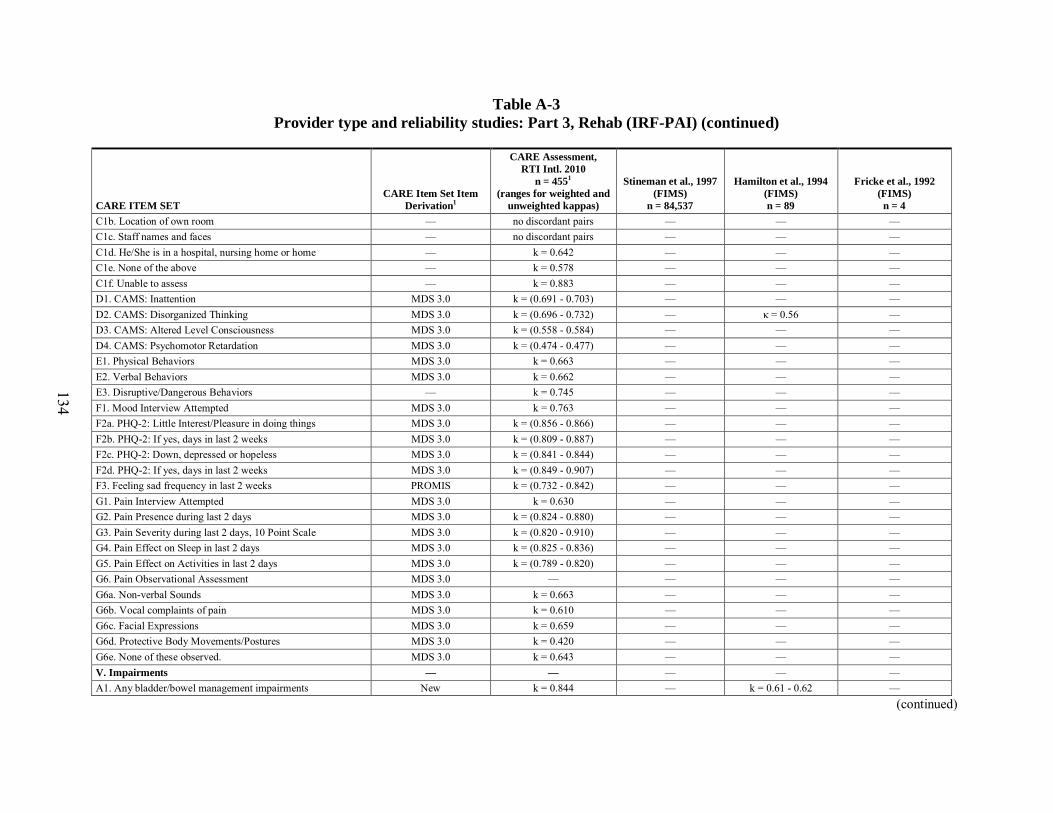
134
Table A-3 Provider type and reliability studies: Part 3, Rehab (IRF-PAI) (continued)
CARE ITEM SET CARE Item Set Item
Derivation1
CARE Assessment, RTI Intl. 2010
n = 4551 (ranges for weighted and
unweighted kappas)
Stineman et al., 1997 (FIMS)
n = 84,537
Hamilton et al., 1994 (FIMS) n = 89
Fricke et al., 1992 (FIMS)
n = 4 C1b. Location of own room — no discordant pairs — — — C1c. Staff names and faces — no discordant pairs — — — C1d. He/She is in a hospital, nursing home or home — k = 0.642 — — — C1e. None of the above — k = 0.578 — — — C1f. Unable to assess — k = 0.883 — — — D1. CAMS: Inattention MDS 3.0 k = (0.691 - 0.703) — — — D2. CAMS: Disorganized Thinking MDS 3.0 k = (0.696 - 0.732) — κ = 0.56 — D3. CAMS: Altered Level Consciousness MDS 3.0 k = (0.558 - 0.584) — — — D4. CAMS: Psychomotor Retardation MDS 3.0 k = (0.474 - 0.477) — — — E1. Physical Behaviors MDS 3.0 k = 0.663 — — — E2. Verbal Behaviors MDS 3.0 k = 0.662 — — — E3. Disruptive/Dangerous Behaviors — k = 0.745 — — — F1. Mood Interview Attempted MDS 3.0 k = 0.763 — — — F2a. PHQ-2: Little Interest/Pleasure in doing things MDS 3.0 k = (0.856 - 0.866) — — — F2b. PHQ-2: If yes, days in last 2 weeks MDS 3.0 k = (0.809 - 0.887) — — — F2c. PHQ-2: Down, depressed or hopeless MDS 3.0 k = (0.841 - 0.844) — — — F2d. PHQ-2: If yes, days in last 2 weeks MDS 3.0 k = (0.849 - 0.907) — — — F3. Feeling sad frequency in last 2 weeks PROMIS k = (0.732 - 0.842) — — — G1. Pain Interview Attempted MDS 3.0 k = 0.630 — — — G2. Pain Presence during last 2 days MDS 3.0 k = (0.824 - 0.880) — — — G3. Pain Severity during last 2 days, 10 Point Scale MDS 3.0 k = (0.820 - 0.910) — — — G4. Pain Effect on Sleep in last 2 days MDS 3.0 k = (0.825 - 0.836) — — — G5. Pain Effect on Activities in last 2 days MDS 3.0 k = (0.789 - 0.820) — — — G6. Pain Observational Assessment MDS 3.0 — — — — G6a. Non-verbal Sounds MDS 3.0 k = 0.663 — — — G6b. Vocal complaints of pain MDS 3.0 k = 0.610 — — — G6c. Facial Expressions MDS 3.0 k = 0.659 — — — G6d. Protective Body Movements/Postures MDS 3.0 k = 0.420 — — — G6e. None of these observed. MDS 3.0 k = 0.643 — — — V. Impairments — — — — — A1. Any bladder/bowel management impairments New k = 0.844 — k = 0.61 - 0.62 —
(continued)
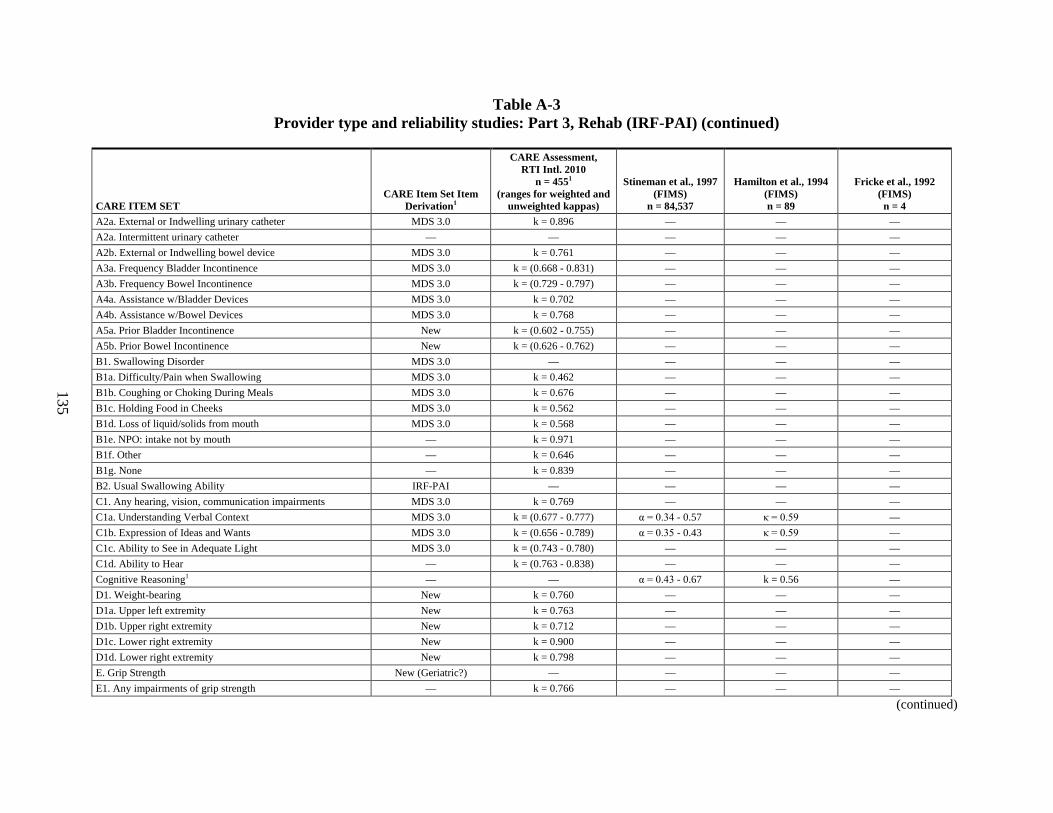
135
Table A-3 Provider type and reliability studies: Part 3, Rehab (IRF-PAI) (continued)
CARE ITEM SET CARE Item Set Item
Derivation1
CARE Assessment, RTI Intl. 2010
n = 4551 (ranges for weighted and
unweighted kappas)
Stineman et al., 1997 (FIMS)
n = 84,537
Hamilton et al., 1994 (FIMS) n = 89
Fricke et al., 1992 (FIMS)
n = 4 A2a. External or Indwelling urinary catheter MDS 3.0 k = 0.896 — — — A2a. Intermittent urinary catheter — — — — — A2b. External or Indwelling bowel device MDS 3.0 k = 0.761 — — — A3a. Frequency Bladder Incontinence MDS 3.0 k = (0.668 - 0.831) — — — A3b. Frequency Bowel Incontinence MDS 3.0 k = (0.729 - 0.797) — — — A4a. Assistance w/Bladder Devices MDS 3.0 k = 0.702 — — — A4b. Assistance w/Bowel Devices MDS 3.0 k = 0.768 — — — A5a. Prior Bladder Incontinence New k = (0.602 - 0.755) — — — A5b. Prior Bowel Incontinence New k = (0.626 - 0.762) — — — B1. Swallowing Disorder MDS 3.0 — — — — B1a. Difficulty/Pain when Swallowing MDS 3.0 k = 0.462 — — — B1b. Coughing or Choking During Meals MDS 3.0 k = 0.676 — — — B1c. Holding Food in Cheeks MDS 3.0 k = 0.562 — — — B1d. Loss of liquid/solids from mouth MDS 3.0 k = 0.568 — — — B1e. NPO: intake not by mouth — k = 0.971 — — — B1f. Other — k = 0.646 — — — B1g. None — k = 0.839 — — — B2. Usual Swallowing Ability IRF-PAI — — — — C1. Any hearing, vision, communication impairments MDS 3.0 k = 0.769 — — — C1a. Understanding Verbal Context MDS 3.0 k = (0.677 - 0.777) α = 0.34 - 0.57 κ = 0.59 — C1b. Expression of Ideas and Wants MDS 3.0 k = (0.656 - 0.789) α = 0.35 - 0.43 κ = 0.59 — C1c. Ability to See in Adequate Light MDS 3.0 k = (0.743 - 0.780) — — — C1d. Ability to Hear — k = (0.763 - 0.838) — — — Cognitive Reasoning1 — — α = 0.43 - 0.67 k = 0.56 — D1. Weight-bearing New k = 0.760 — — — D1a. Upper left extremity New k = 0.763 — — — D1b. Upper right extremity New k = 0.712 — — — D1c. Lower right extremity New k = 0.900 — — — D1d. Lower right extremity New k = 0.798 — — — E. Grip Strength New (Geriatric?) — — — — E1. Any impairments of grip strength — k = 0.766 — — —
(continued)
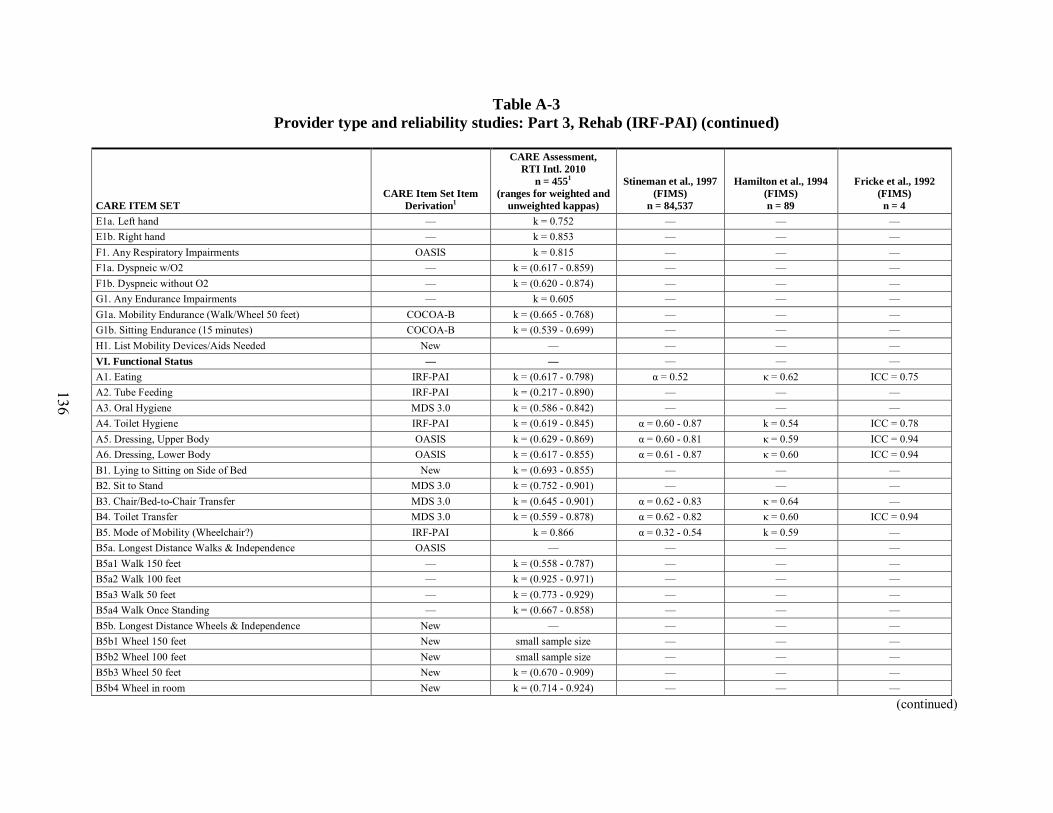
136
Table A-3 Provider type and reliability studies: Part 3, Rehab (IRF-PAI) (continued)
CARE ITEM SET CARE Item Set Item
Derivation1
CARE Assessment, RTI Intl. 2010
n = 4551 (ranges for weighted and
unweighted kappas)
Stineman et al., 1997 (FIMS)
n = 84,537
Hamilton et al., 1994 (FIMS) n = 89
Fricke et al., 1992 (FIMS)
n = 4 E1a. Left hand — k = 0.752 — — — E1b. Right hand — k = 0.853 — — — F1. Any Respiratory Impairments OASIS k = 0.815 — — — F1a. Dyspneic w/O2 — k = (0.617 - 0.859) — — — F1b. Dyspneic without O2 — k = (0.620 - 0.874) — — — G1. Any Endurance Impairments — k = 0.605 — — — G1a. Mobility Endurance (Walk/Wheel 50 feet) COCOA-B k = (0.665 - 0.768) — — — G1b. Sitting Endurance (15 minutes) COCOA-B k = (0.539 - 0.699) — — — H1. List Mobility Devices/Aids Needed New — — — — VI. Functional Status — — — — — A1. Eating IRF-PAI k = (0.617 - 0.798) α = 0.52 κ = 0.62 ICC = 0.75 A2. Tube Feeding IRF-PAI k = (0.217 - 0.890) — — — A3. Oral Hygiene MDS 3.0 k = (0.586 - 0.842) — — — A4. Toilet Hygiene IRF-PAI k = (0.619 - 0.845) α = 0.60 - 0.87 k = 0.54 ICC = 0.78 A5. Dressing, Upper Body OASIS k = (0.629 - 0.869) α = 0.60 - 0.81 κ = 0.59 ICC = 0.94 A6. Dressing, Lower Body OASIS k = (0.617 - 0.855) α = 0.61 - 0.87 κ = 0.60 ICC = 0.94 B1. Lying to Sitting on Side of Bed New k = (0.693 - 0.855) — — — B2. Sit to Stand MDS 3.0 k = (0.752 - 0.901) — — — B3. Chair/Bed-to-Chair Transfer MDS 3.0 k = (0.645 - 0.901) α = 0.62 - 0.83 κ = 0.64 — B4. Toilet Transfer MDS 3.0 k = (0.559 - 0.878) α = 0.62 - 0.82 κ = 0.60 ICC = 0.94 B5. Mode of Mobility (Wheelchair?) IRF-PAI k = 0.866 α = 0.32 - 0.54 k = 0.59 — B5a. Longest Distance Walks & Independence OASIS — — — — B5a1 Walk 150 feet — k = (0.558 - 0.787) — — — B5a2 Walk 100 feet — k = (0.925 - 0.971) — — — B5a3 Walk 50 feet — k = (0.773 - 0.929) — — — B5a4 Walk Once Standing — k = (0.667 - 0.858) — — — B5b. Longest Distance Wheels & Independence New — — — — B5b1 Wheel 150 feet New small sample size — — — B5b2 Wheel 100 feet New small sample size — — — B5b3 Wheel 50 feet New k = (0.670 - 0.909) — — — B5b4 Wheel in room New k = (0.714 - 0.924) — — —
(continued)
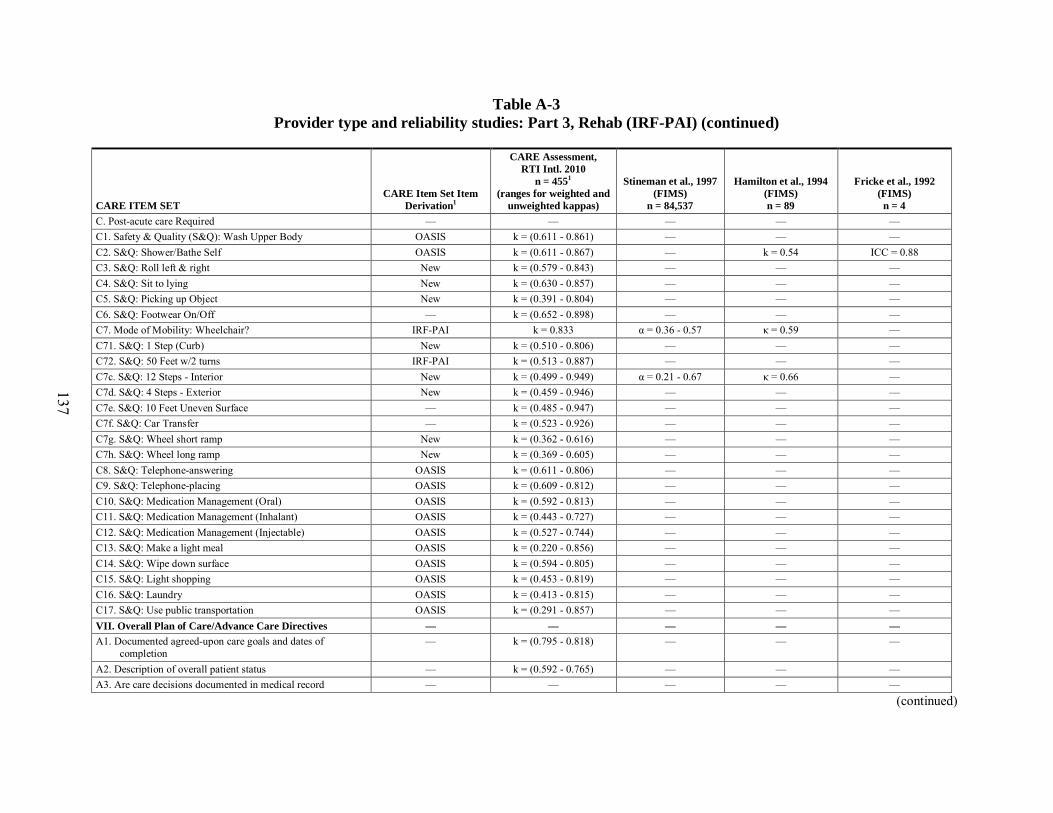
137
Table A-3 Provider type and reliability studies: Part 3, Rehab (IRF-PAI) (continued)
CARE ITEM SET CARE Item Set Item
Derivation1
CARE Assessment, RTI Intl. 2010
n = 4551 (ranges for weighted and
unweighted kappas)
Stineman et al., 1997 (FIMS)
n = 84,537
Hamilton et al., 1994 (FIMS) n = 89
Fricke et al., 1992 (FIMS)
n = 4 C. Post-acute care Required — — — — — C1. Safety & Quality (S&Q): Wash Upper Body OASIS k = (0.611 - 0.861) — — — C2. S&Q: Shower/Bathe Self OASIS k = (0.611 - 0.867) — k = 0.54 ICC = 0.88 C3. S&Q: Roll left & right New k = (0.579 - 0.843) — — — C4. S&Q: Sit to lying New k = (0.630 - 0.857) — — — C5. S&Q: Picking up Object New k = (0.391 - 0.804) — — — C6. S&Q: Footwear On/Off — k = (0.652 - 0.898) — — — C7. Mode of Mobility: Wheelchair? IRF-PAI k = 0.833 α = 0.36 - 0.57 κ = 0.59 — C71. S&Q: 1 Step (Curb) New k = (0.510 - 0.806) — — — C72. S&Q: 50 Feet w/2 turns IRF-PAI k = (0.513 - 0.887) — — — C7c. S&Q: 12 Steps - Interior New k = (0.499 - 0.949) α = 0.21 - 0.67 κ = 0.66 — C7d. S&Q: 4 Steps - Exterior New k = (0.459 - 0.946) — — — C7e. S&Q: 10 Feet Uneven Surface — k = (0.485 - 0.947) — — — C7f. S&Q: Car Transfer — k = (0.523 - 0.926) — — — C7g. S&Q: Wheel short ramp New k = (0.362 - 0.616) — — — C7h. S&Q: Wheel long ramp New k = (0.369 - 0.605) — — — C8. S&Q: Telephone-answering OASIS k = (0.611 - 0.806) — — — C9. S&Q: Telephone-placing OASIS k = (0.609 - 0.812) — — — C10. S&Q: Medication Management (Oral) OASIS k = (0.592 - 0.813) — — — C11. S&Q: Medication Management (Inhalant) OASIS k = (0.443 - 0.727) — — — C12. S&Q: Medication Management (Injectable) OASIS k = (0.527 - 0.744) — — — C13. S&Q: Make a light meal OASIS k = (0.220 - 0.856) — — — C14. S&Q: Wipe down surface OASIS k = (0.594 - 0.805) — — — C15. S&Q: Light shopping OASIS k = (0.453 - 0.819) — — — C16. S&Q: Laundry OASIS k = (0.413 - 0.815) — — — C17. S&Q: Use public transportation OASIS k = (0.291 - 0.857) — — — VII. Overall Plan of Care/Advance Care Directives — — — — — A1. Documented agreed-upon care goals and dates of
completion — k = (0.795 - 0.818) — — —
A2. Description of overall patient status — k = (0.592 - 0.765) — — — A3. Are care decisions documented in medical record — — — — —
(continued)
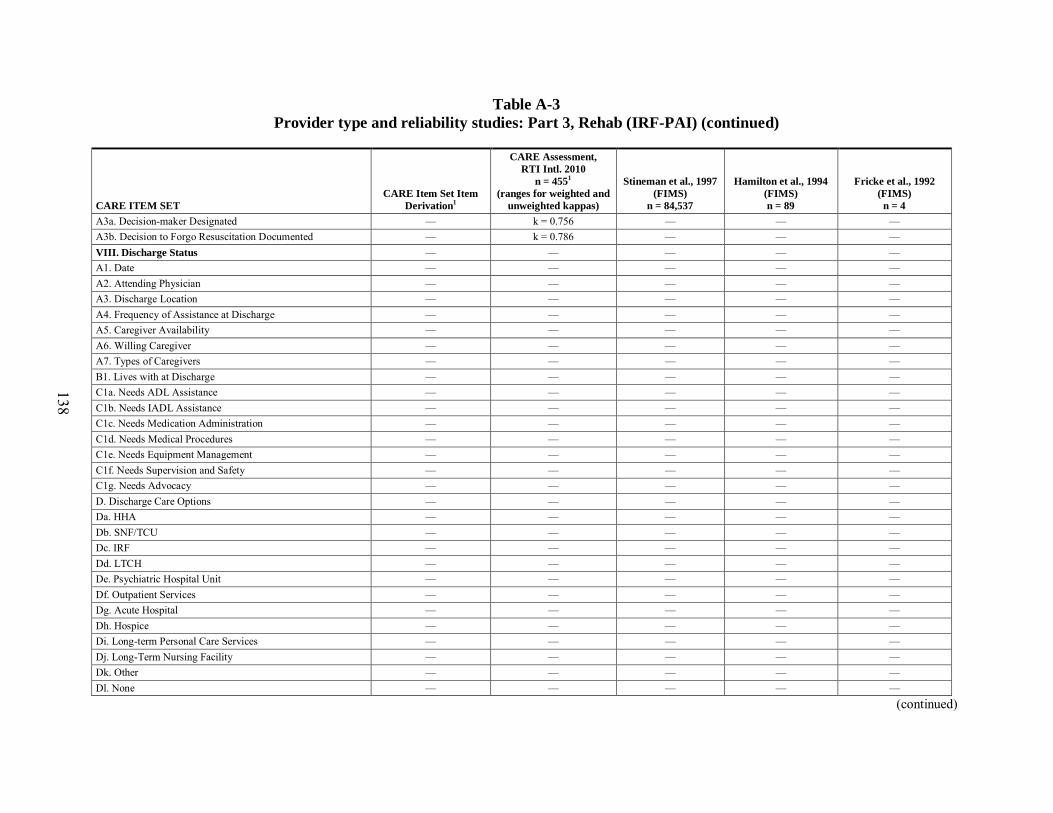
138
Table A-3 Provider type and reliability studies: Part 3, Rehab (IRF-PAI) (continued)
CARE ITEM SET CARE Item Set Item
Derivation1
CARE Assessment, RTI Intl. 2010
n = 4551 (ranges for weighted and
unweighted kappas)
Stineman et al., 1997 (FIMS)
n = 84,537
Hamilton et al., 1994 (FIMS) n = 89
Fricke et al., 1992 (FIMS)
n = 4 A3a. Decision-maker Designated — k = 0.756 — — — A3b. Decision to Forgo Resuscitation Documented — k = 0.786 — — — VIII. Discharge Status — — — — — A1. Date — — — — — A2. Attending Physician — — — — — A3. Discharge Location — — — — — A4. Frequency of Assistance at Discharge — — — — — A5. Caregiver Availability — — — — — A6. Willing Caregiver — — — — — A7. Types of Caregivers — — — — — B1. Lives with at Discharge — — — — — C1a. Needs ADL Assistance — — — — — C1b. Needs IADL Assistance — — — — — C1c. Needs Medication Administration — — — — — C1d. Needs Medical Procedures — — — — — C1e. Needs Equipment Management — — — — — C1f. Needs Supervision and Safety — — — — — C1g. Needs Advocacy — — — — — D. Discharge Care Options — — — — — Da. HHA — — — — — Db. SNF/TCU — — — — — Dc. IRF — — — — — Dd. LTCH — — — — — De. Psychiatric Hospital Unit — — — — — Df. Outpatient Services — — — — — Dg. Acute Hospital — — — — — Dh. Hospice — — — — — Di. Long-term Personal Care Services — — — — — Dj. Long-Term Nursing Facility — — — — — Dk. Other — — — — — Dl. None — — — — —
(continued)
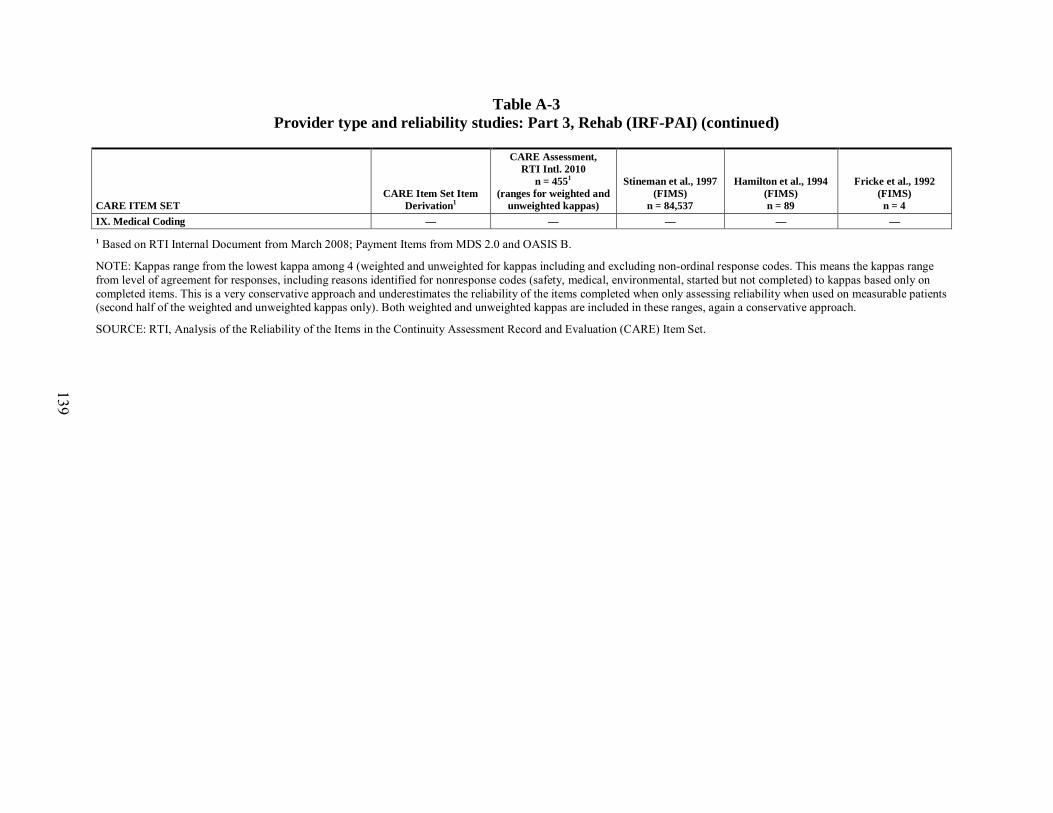
139
Table A-3 Provider type and reliability studies: Part 3, Rehab (IRF-PAI) (continued)
CARE ITEM SET CARE Item Set Item
Derivation1
CARE Assessment, RTI Intl. 2010
n = 4551 (ranges for weighted and
unweighted kappas)
Stineman et al., 1997 (FIMS)
n = 84,537
Hamilton et al., 1994 (FIMS) n = 89
Fricke et al., 1992 (FIMS)
n = 4 IX. Medical Coding — — — — —
1 Based on RTI Internal Document from March 2008; Payment Items from MDS 2.0 and OASIS B.
NOTE: Kappas range from the lowest kappa among 4 (weighted and unweighted for kappas including and excluding non-ordinal response codes. This means the kappas range from level of agreement for responses, including reasons identified for nonresponse codes (safety, medical, environmental, started but not completed) to kappas based only on completed items. This is a very conservative approach and underestimates the reliability of the items completed when only assessing reliability when used on measurable patients (second half of the weighted and unweighted kappas only). Both weighted and unweighted kappas are included in these ranges, again a conservative approach.
SOURCE: RTI, Analysis of the Reliability of the Items in the Continuity Assessment Record and Evaluation (CARE) Item Set.
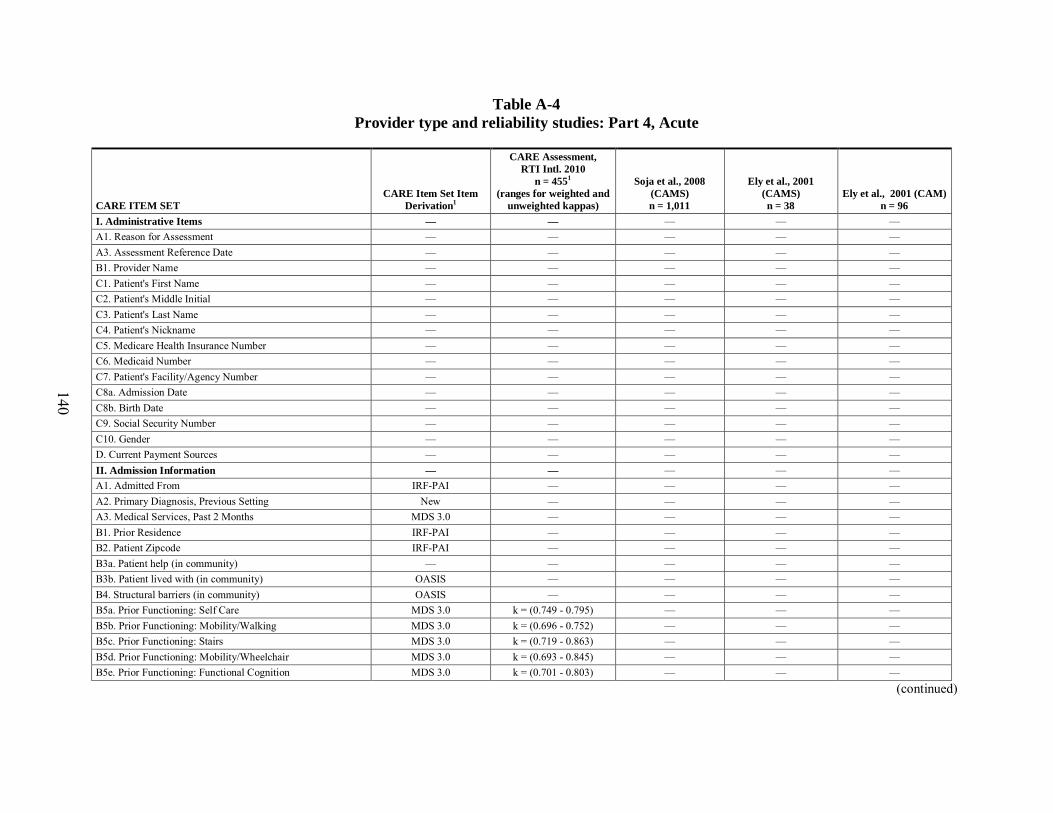
140
Table A-4 Provider type and reliability studies: Part 4, Acute
CARE ITEM SET CARE Item Set Item
Derivation1
CARE Assessment, RTI Intl. 2010
n = 4551 (ranges for weighted and
unweighted kappas)
Soja et al., 2008 (CAMS) n = 1,011
Ely et al., 2001 (CAMS) n = 38
Ely et al., 2001 (CAM) n = 96
I. Administrative Items — — — — — A1. Reason for Assessment — — — — — A3. Assessment Reference Date — — — — — B1. Provider Name — — — — — C1. Patient's First Name — — — — — C2. Patient's Middle Initial — — — — — C3. Patient's Last Name — — — — — C4. Patient's Nickname — — — — — C5. Medicare Health Insurance Number — — — — — C6. Medicaid Number — — — — — C7. Patient's Facility/Agency Number — — — — — C8a. Admission Date — — — — — C8b. Birth Date — — — — — C9. Social Security Number — — — — — C10. Gender — — — — — D. Current Payment Sources — — — — — II. Admission Information — — — — — A1. Admitted From IRF-PAI — — — — A2. Primary Diagnosis, Previous Setting New — — — — A3. Medical Services, Past 2 Months MDS 3.0 — — — — B1. Prior Residence IRF-PAI — — — — B2. Patient Zipcode IRF-PAI — — — — B3a. Patient help (in community) — — — — — B3b. Patient lived with (in community) OASIS — — — — B4. Structural barriers (in community) OASIS — — — — B5a. Prior Functioning: Self Care MDS 3.0 k = (0.749 - 0.795) — — — B5b. Prior Functioning: Mobility/Walking MDS 3.0 k = (0.696 - 0.752) — — — B5c. Prior Functioning: Stairs MDS 3.0 k = (0.719 - 0.863) — — — B5d. Prior Functioning: Mobility/Wheelchair MDS 3.0 k = (0.693 - 0.845) — — — B5e. Prior Functioning: Functional Cognition MDS 3.0 k = (0.701 - 0.803) — — —
(continued)
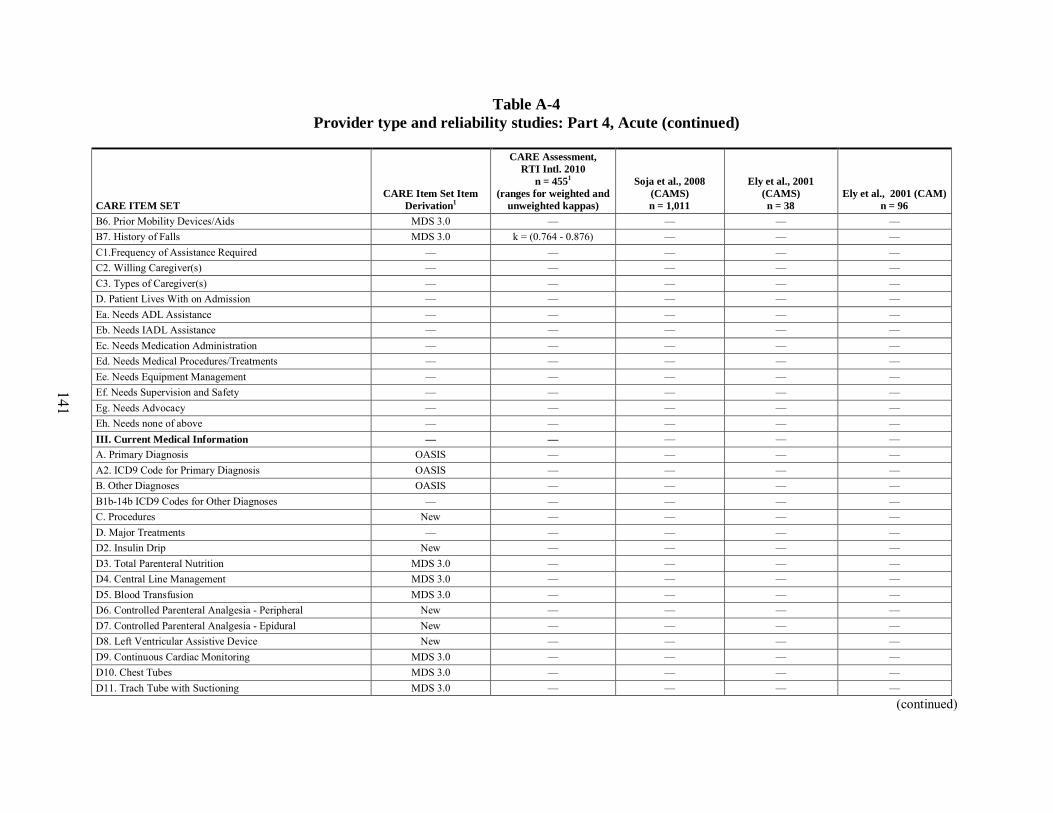
141
Table A-4 Provider type and reliability studies: Part 4, Acute (continued)
CARE ITEM SET CARE Item Set Item
Derivation1
CARE Assessment, RTI Intl. 2010
n = 4551 (ranges for weighted and
unweighted kappas)
Soja et al., 2008 (CAMS) n = 1,011
Ely et al., 2001 (CAMS) n = 38
Ely et al., 2001 (CAM) n = 96
B6. Prior Mobility Devices/Aids MDS 3.0 — — — — B7. History of Falls MDS 3.0 k = (0.764 - 0.876) — — — C1.Frequency of Assistance Required — — — — — C2. Willing Caregiver(s) — — — — — C3. Types of Caregiver(s) — — — — — D. Patient Lives With on Admission — — — — — Ea. Needs ADL Assistance — — — — — Eb. Needs IADL Assistance — — — — — Ec. Needs Medication Administration — — — — — Ed. Needs Medical Procedures/Treatments — — — — — Ee. Needs Equipment Management — — — — — Ef. Needs Supervision and Safety — — — — — Eg. Needs Advocacy — — — — — Eh. Needs none of above — — — — — III. Current Medical Information — — — — — A. Primary Diagnosis OASIS — — — — A2. ICD9 Code for Primary Diagnosis OASIS — — — — B. Other Diagnoses OASIS — — — — B1b-14b ICD9 Codes for Other Diagnoses — — — — — C. Procedures New — — — — D. Major Treatments — — — — — D2. Insulin Drip New — — — — D3. Total Parenteral Nutrition MDS 3.0 — — — — D4. Central Line Management MDS 3.0 — — — — D5. Blood Transfusion MDS 3.0 — — — — D6. Controlled Parenteral Analgesia - Peripheral New — — — — D7. Controlled Parenteral Analgesia - Epidural New — — — — D8. Left Ventricular Assistive Device New — — — — D9. Continuous Cardiac Monitoring MDS 3.0 — — — — D10. Chest Tubes MDS 3.0 — — — — D11. Trach Tube with Suctioning MDS 3.0 — — — —
(continued)
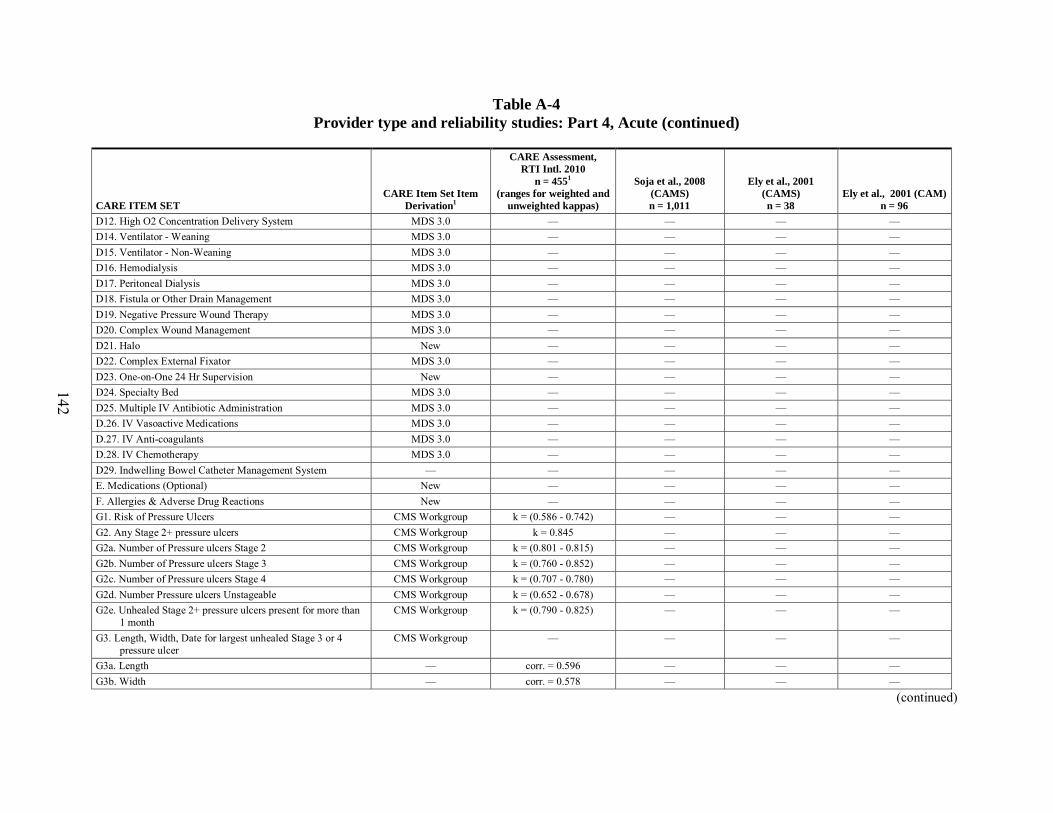
142
Table A-4 Provider type and reliability studies: Part 4, Acute (continued)
CARE ITEM SET CARE Item Set Item
Derivation1
CARE Assessment, RTI Intl. 2010
n = 4551 (ranges for weighted and
unweighted kappas)
Soja et al., 2008 (CAMS) n = 1,011
Ely et al., 2001 (CAMS) n = 38
Ely et al., 2001 (CAM) n = 96
D12. High O2 Concentration Delivery System MDS 3.0 — — — — D14. Ventilator - Weaning MDS 3.0 — — — — D15. Ventilator - Non-Weaning MDS 3.0 — — — — D16. Hemodialysis MDS 3.0 — — — — D17. Peritoneal Dialysis MDS 3.0 — — — — D18. Fistula or Other Drain Management MDS 3.0 — — — — D19. Negative Pressure Wound Therapy MDS 3.0 — — — — D20. Complex Wound Management MDS 3.0 — — — — D21. Halo New — — — — D22. Complex External Fixator MDS 3.0 — — — — D23. One-on-One 24 Hr Supervision New — — — — D24. Specialty Bed MDS 3.0 — — — — D25. Multiple IV Antibiotic Administration MDS 3.0 — — — — D.26. IV Vasoactive Medications MDS 3.0 — — — — D.27. IV Anti-coagulants MDS 3.0 — — — — D.28. IV Chemotherapy MDS 3.0 — — — — D29. Indwelling Bowel Catheter Management System — — — — — E. Medications (Optional) New — — — — F. Allergies & Adverse Drug Reactions New — — — — G1. Risk of Pressure Ulcers CMS Workgroup k = (0.586 - 0.742) — — — G2. Any Stage 2+ pressure ulcers CMS Workgroup k = 0.845 — — — G2a. Number of Pressure ulcers Stage 2 CMS Workgroup k = (0.801 - 0.815) — — — G2b. Number of Pressure ulcers Stage 3 CMS Workgroup k = (0.760 - 0.852) — — — G2c. Number of Pressure ulcers Stage 4 CMS Workgroup k = (0.707 - 0.780) — — — G2d. Number Pressure ulcers Unstageable CMS Workgroup k = (0.652 - 0.678) — — — G2e. Unhealed Stage 2+ pressure ulcers present for more than
1 month CMS Workgroup k = (0.790 - 0.825) — — —
G3. Length, Width, Date for largest unhealed Stage 3 or 4 pressure ulcer
CMS Workgroup — — — —
G3a. Length — corr. = 0.596 — — — G3b. Width — corr. = 0.578 — — —
(continued)
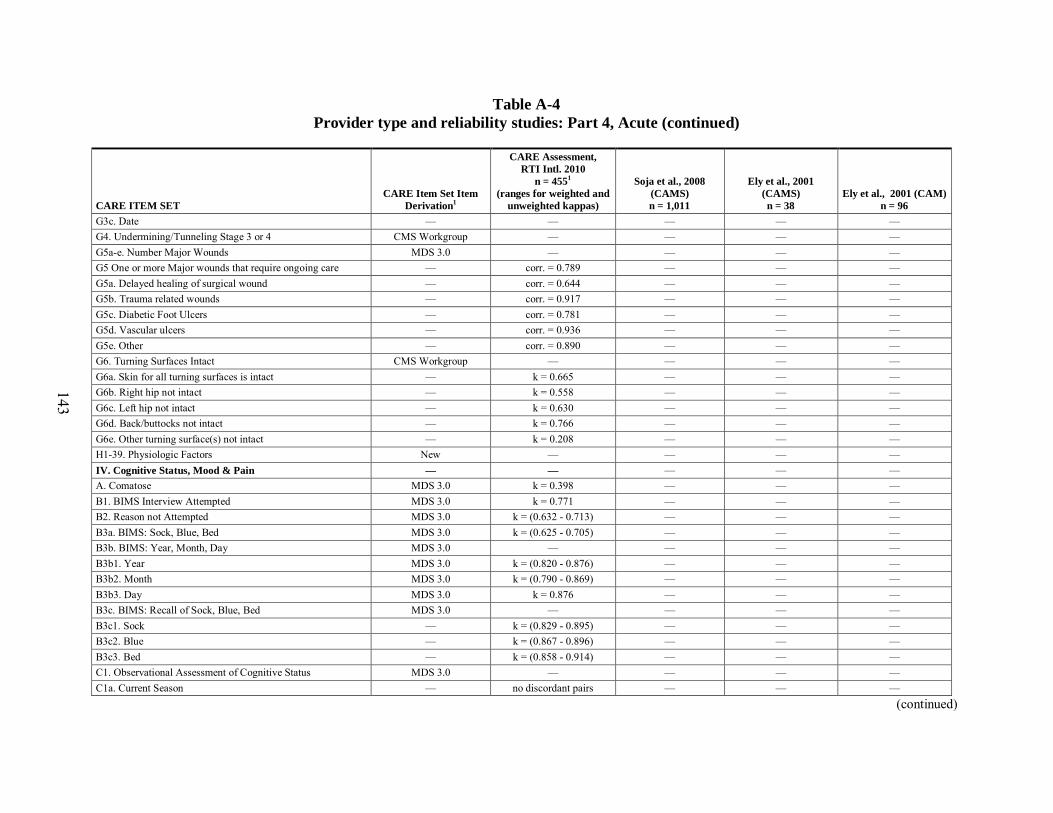
143
Table A-4 Provider type and reliability studies: Part 4, Acute (continued)
CARE ITEM SET CARE Item Set Item
Derivation1
CARE Assessment, RTI Intl. 2010
n = 4551 (ranges for weighted and
unweighted kappas)
Soja et al., 2008 (CAMS) n = 1,011
Ely et al., 2001 (CAMS) n = 38
Ely et al., 2001 (CAM) n = 96
G3c. Date — — — — — G4. Undermining/Tunneling Stage 3 or 4 CMS Workgroup — — — — G5a-e. Number Major Wounds MDS 3.0 — — — — G5 One or more Major wounds that require ongoing care — corr. = 0.789 — — — G5a. Delayed healing of surgical wound — corr. = 0.644 — — — G5b. Trauma related wounds — corr. = 0.917 — — — G5c. Diabetic Foot Ulcers — corr. = 0.781 — — — G5d. Vascular ulcers — corr. = 0.936 — — — G5e. Other — corr. = 0.890 — — — G6. Turning Surfaces Intact CMS Workgroup — — — — G6a. Skin for all turning surfaces is intact — k = 0.665 — — — G6b. Right hip not intact — k = 0.558 — — — G6c. Left hip not intact — k = 0.630 — — — G6d. Back/buttocks not intact — k = 0.766 — — — G6e. Other turning surface(s) not intact — k = 0.208 — — — H1-39. Physiologic Factors New — — — — IV. Cognitive Status, Mood & Pain — — — — — A. Comatose MDS 3.0 k = 0.398 — — — B1. BIMS Interview Attempted MDS 3.0 k = 0.771 — — — B2. Reason not Attempted MDS 3.0 k = (0.632 - 0.713) — — — B3a. BIMS: Sock, Blue, Bed MDS 3.0 k = (0.625 - 0.705) — — — B3b. BIMS: Year, Month, Day MDS 3.0 — — — — B3b1. Year MDS 3.0 k = (0.820 - 0.876) — — — B3b2. Month MDS 3.0 k = (0.790 - 0.869) — — — B3b3. Day MDS 3.0 k = 0.876 — — — B3c. BIMS: Recall of Sock, Blue, Bed MDS 3.0 — — — — B3c1. Sock — k = (0.829 - 0.895) — — — B3c2. Blue — k = (0.867 - 0.896) — — — B3c3. Bed — k = (0.858 - 0.914) — — — C1. Observational Assessment of Cognitive Status MDS 3.0 — — — — C1a. Current Season — no discordant pairs — — —
(continued)
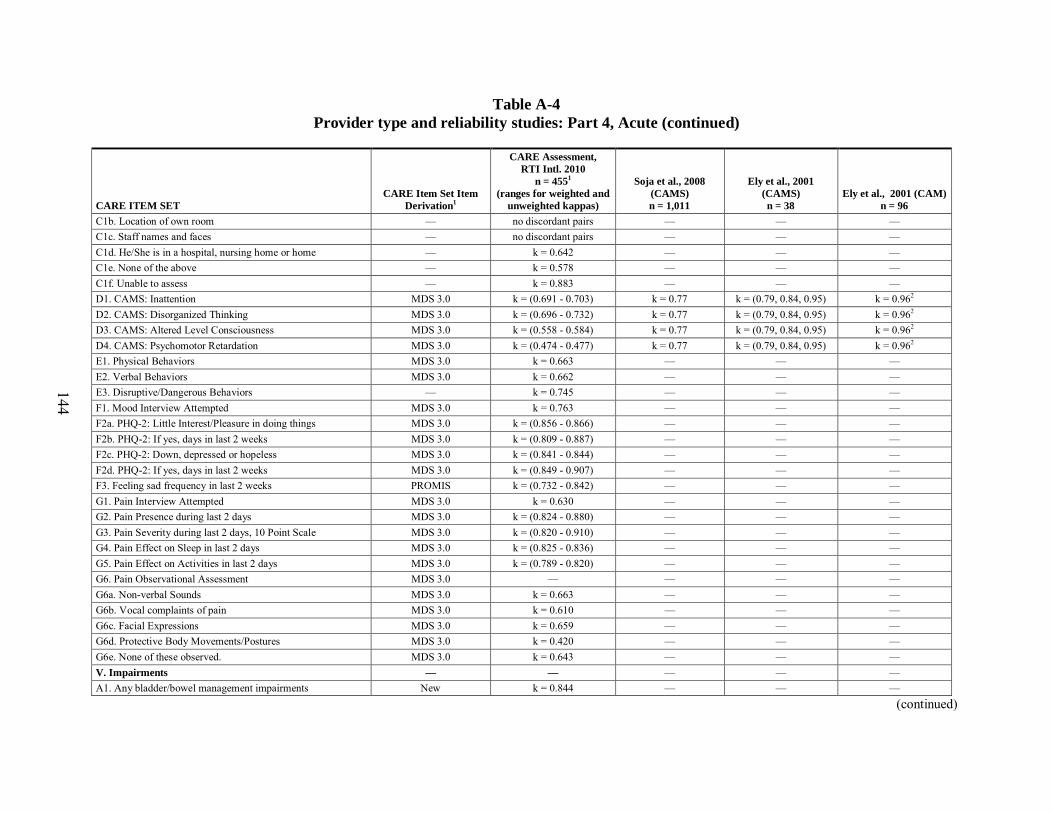
144
Table A-4 Provider type and reliability studies: Part 4, Acute (continued)
CARE ITEM SET CARE Item Set Item
Derivation1
CARE Assessment, RTI Intl. 2010
n = 4551 (ranges for weighted and
unweighted kappas)
Soja et al., 2008 (CAMS) n = 1,011
Ely et al., 2001 (CAMS) n = 38
Ely et al., 2001 (CAM) n = 96
C1b. Location of own room — no discordant pairs — — — C1c. Staff names and faces — no discordant pairs — — — C1d. He/She is in a hospital, nursing home or home — k = 0.642 — — — C1e. None of the above — k = 0.578 — — — C1f. Unable to assess — k = 0.883 — — — D1. CAMS: Inattention MDS 3.0 k = (0.691 - 0.703) k = 0.77 k = (0.79, 0.84, 0.95) k = 0.962 D2. CAMS: Disorganized Thinking MDS 3.0 k = (0.696 - 0.732) k = 0.77 k = (0.79, 0.84, 0.95) k = 0.962 D3. CAMS: Altered Level Consciousness MDS 3.0 k = (0.558 - 0.584) k = 0.77 k = (0.79, 0.84, 0.95) k = 0.962 D4. CAMS: Psychomotor Retardation MDS 3.0 k = (0.474 - 0.477) k = 0.77 k = (0.79, 0.84, 0.95) k = 0.962 E1. Physical Behaviors MDS 3.0 k = 0.663 — — — E2. Verbal Behaviors MDS 3.0 k = 0.662 — — — E3. Disruptive/Dangerous Behaviors — k = 0.745 — — — F1. Mood Interview Attempted MDS 3.0 k = 0.763 — — — F2a. PHQ-2: Little Interest/Pleasure in doing things MDS 3.0 k = (0.856 - 0.866) — — — F2b. PHQ-2: If yes, days in last 2 weeks MDS 3.0 k = (0.809 - 0.887) — — — F2c. PHQ-2: Down, depressed or hopeless MDS 3.0 k = (0.841 - 0.844) — — — F2d. PHQ-2: If yes, days in last 2 weeks MDS 3.0 k = (0.849 - 0.907) — — — F3. Feeling sad frequency in last 2 weeks PROMIS k = (0.732 - 0.842) — — — G1. Pain Interview Attempted MDS 3.0 k = 0.630 — — — G2. Pain Presence during last 2 days MDS 3.0 k = (0.824 - 0.880) — — — G3. Pain Severity during last 2 days, 10 Point Scale MDS 3.0 k = (0.820 - 0.910) — — — G4. Pain Effect on Sleep in last 2 days MDS 3.0 k = (0.825 - 0.836) — — — G5. Pain Effect on Activities in last 2 days MDS 3.0 k = (0.789 - 0.820) — — — G6. Pain Observational Assessment MDS 3.0 — — — — G6a. Non-verbal Sounds MDS 3.0 k = 0.663 — — — G6b. Vocal complaints of pain MDS 3.0 k = 0.610 — — — G6c. Facial Expressions MDS 3.0 k = 0.659 — — — G6d. Protective Body Movements/Postures MDS 3.0 k = 0.420 — — — G6e. None of these observed. MDS 3.0 k = 0.643 — — — V. Impairments — — — — — A1. Any bladder/bowel management impairments New k = 0.844 — — —
(continued)
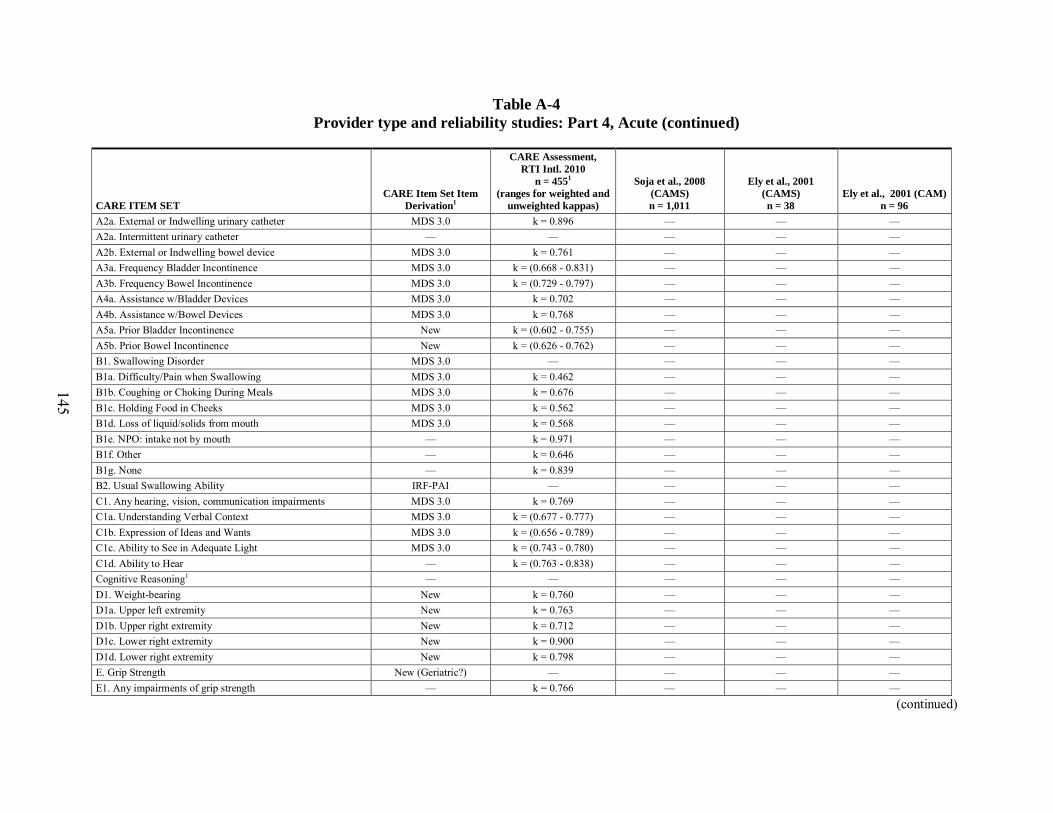
145
Table A-4 Provider type and reliability studies: Part 4, Acute (continued)
CARE ITEM SET CARE Item Set Item
Derivation1
CARE Assessment, RTI Intl. 2010
n = 4551 (ranges for weighted and
unweighted kappas)
Soja et al., 2008 (CAMS) n = 1,011
Ely et al., 2001 (CAMS) n = 38
Ely et al., 2001 (CAM) n = 96
A2a. External or Indwelling urinary catheter MDS 3.0 k = 0.896 — — — A2a. Intermittent urinary catheter — — — — — A2b. External or Indwelling bowel device MDS 3.0 k = 0.761 — — — A3a. Frequency Bladder Incontinence MDS 3.0 k = (0.668 - 0.831) — — — A3b. Frequency Bowel Incontinence MDS 3.0 k = (0.729 - 0.797) — — — A4a. Assistance w/Bladder Devices MDS 3.0 k = 0.702 — — — A4b. Assistance w/Bowel Devices MDS 3.0 k = 0.768 — — — A5a. Prior Bladder Incontinence New k = (0.602 - 0.755) — — — A5b. Prior Bowel Incontinence New k = (0.626 - 0.762) — — — B1. Swallowing Disorder MDS 3.0 — — — — B1a. Difficulty/Pain when Swallowing MDS 3.0 k = 0.462 — — — B1b. Coughing or Choking During Meals MDS 3.0 k = 0.676 — — — B1c. Holding Food in Cheeks MDS 3.0 k = 0.562 — — — B1d. Loss of liquid/solids from mouth MDS 3.0 k = 0.568 — — — B1e. NPO: intake not by mouth — k = 0.971 — — — B1f. Other — k = 0.646 — — — B1g. None — k = 0.839 — — — B2. Usual Swallowing Ability IRF-PAI — — — — C1. Any hearing, vision, communication impairments MDS 3.0 k = 0.769 — — — C1a. Understanding Verbal Context MDS 3.0 k = (0.677 - 0.777) — — — C1b. Expression of Ideas and Wants MDS 3.0 k = (0.656 - 0.789) — — — C1c. Ability to See in Adequate Light MDS 3.0 k = (0.743 - 0.780) — — — C1d. Ability to Hear — k = (0.763 - 0.838) — — — Cognitive Reasoning1 — — — — — D1. Weight-bearing New k = 0.760 — — — D1a. Upper left extremity New k = 0.763 — — — D1b. Upper right extremity New k = 0.712 — — — D1c. Lower right extremity New k = 0.900 — — — D1d. Lower right extremity New k = 0.798 — — — E. Grip Strength New (Geriatric?) — — — — E1. Any impairments of grip strength — k = 0.766 — — —
(continued)
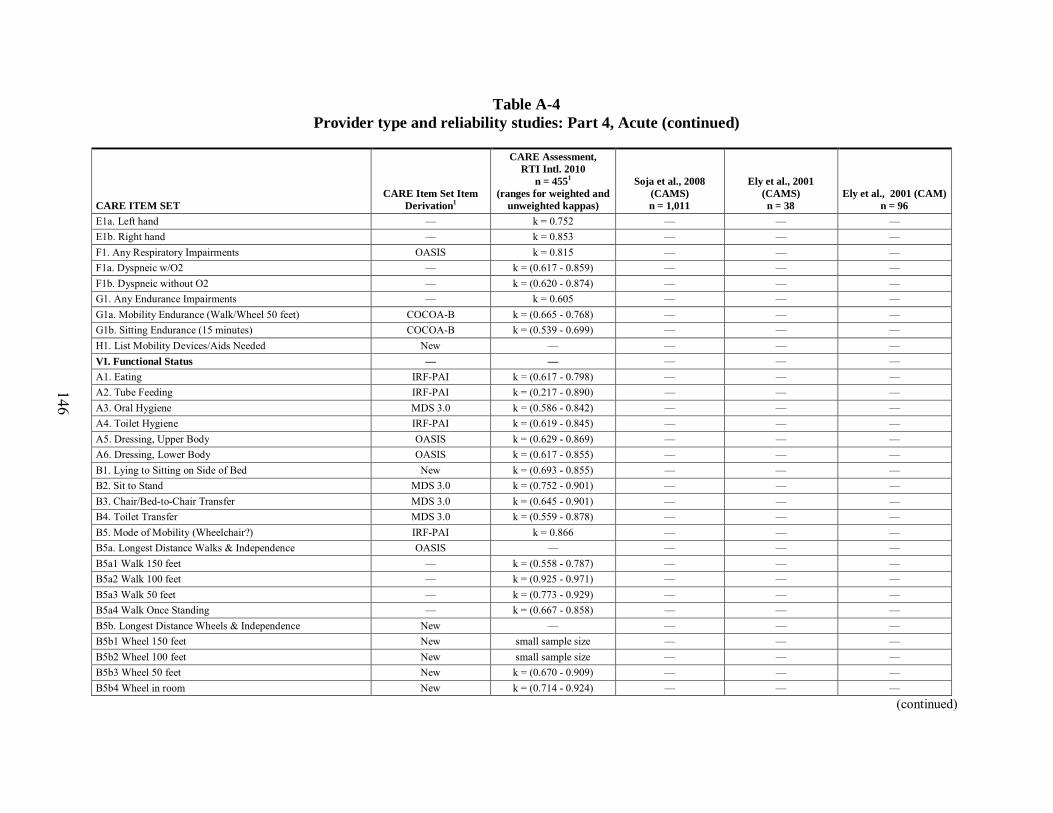
146
Table A-4 Provider type and reliability studies: Part 4, Acute (continued)
CARE ITEM SET CARE Item Set Item
Derivation1
CARE Assessment, RTI Intl. 2010
n = 4551 (ranges for weighted and
unweighted kappas)
Soja et al., 2008 (CAMS) n = 1,011
Ely et al., 2001 (CAMS) n = 38
Ely et al., 2001 (CAM) n = 96
E1a. Left hand — k = 0.752 — — — E1b. Right hand — k = 0.853 — — — F1. Any Respiratory Impairments OASIS k = 0.815 — — — F1a. Dyspneic w/O2 — k = (0.617 - 0.859) — — — F1b. Dyspneic without O2 — k = (0.620 - 0.874) — — — G1. Any Endurance Impairments — k = 0.605 — — — G1a. Mobility Endurance (Walk/Wheel 50 feet) COCOA-B k = (0.665 - 0.768) — — — G1b. Sitting Endurance (15 minutes) COCOA-B k = (0.539 - 0.699) — — — H1. List Mobility Devices/Aids Needed New — — — — VI. Functional Status — — — — — A1. Eating IRF-PAI k = (0.617 - 0.798) — — — A2. Tube Feeding IRF-PAI k = (0.217 - 0.890) — — — A3. Oral Hygiene MDS 3.0 k = (0.586 - 0.842) — — — A4. Toilet Hygiene IRF-PAI k = (0.619 - 0.845) — — — A5. Dressing, Upper Body OASIS k = (0.629 - 0.869) — — — A6. Dressing, Lower Body OASIS k = (0.617 - 0.855) — — — B1. Lying to Sitting on Side of Bed New k = (0.693 - 0.855) — — — B2. Sit to Stand MDS 3.0 k = (0.752 - 0.901) — — — B3. Chair/Bed-to-Chair Transfer MDS 3.0 k = (0.645 - 0.901) — — — B4. Toilet Transfer MDS 3.0 k = (0.559 - 0.878) — — — B5. Mode of Mobility (Wheelchair?) IRF-PAI k = 0.866 — — — B5a. Longest Distance Walks & Independence OASIS — — — — B5a1 Walk 150 feet — k = (0.558 - 0.787) — — — B5a2 Walk 100 feet — k = (0.925 - 0.971) — — — B5a3 Walk 50 feet — k = (0.773 - 0.929) — — — B5a4 Walk Once Standing — k = (0.667 - 0.858) — — — B5b. Longest Distance Wheels & Independence New — — — — B5b1 Wheel 150 feet New small sample size — — — B5b2 Wheel 100 feet New small sample size — — — B5b3 Wheel 50 feet New k = (0.670 - 0.909) — — — B5b4 Wheel in room New k = (0.714 - 0.924) — — —
(continued)
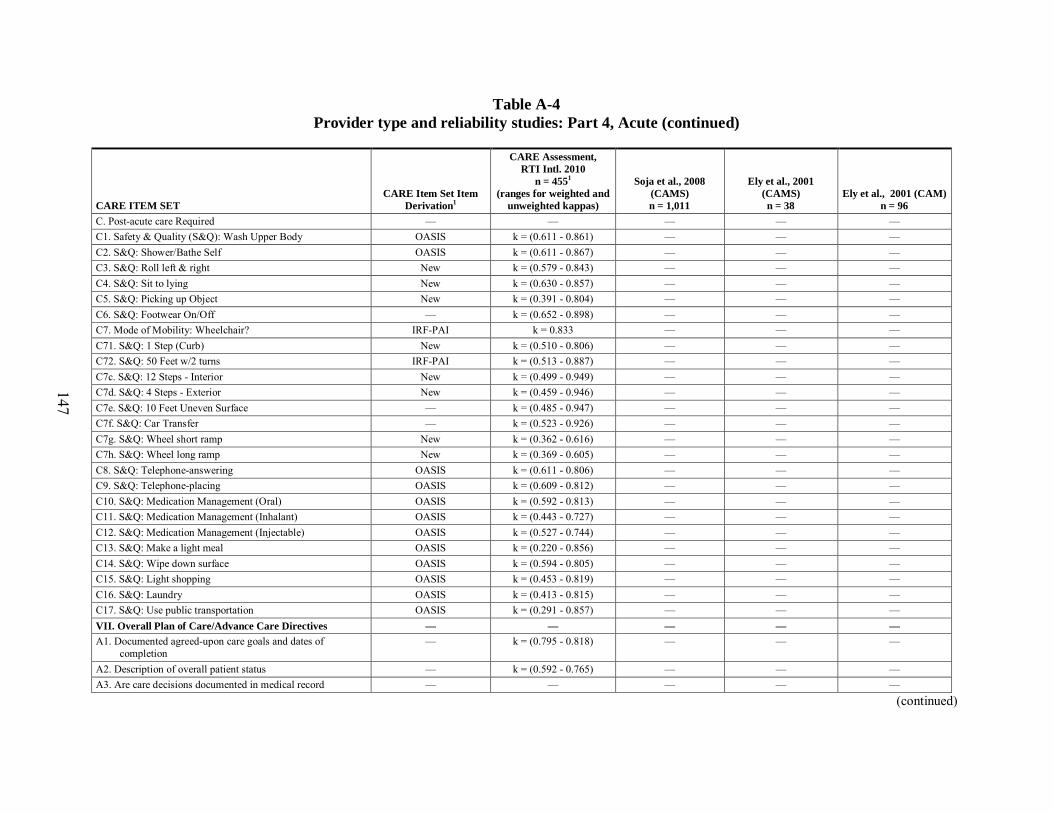
147
Table A-4 Provider type and reliability studies: Part 4, Acute (continued)
CARE ITEM SET CARE Item Set Item
Derivation1
CARE Assessment, RTI Intl. 2010
n = 4551 (ranges for weighted and
unweighted kappas)
Soja et al., 2008 (CAMS) n = 1,011
Ely et al., 2001 (CAMS) n = 38
Ely et al., 2001 (CAM) n = 96
C. Post-acute care Required — — — — — C1. Safety & Quality (S&Q): Wash Upper Body OASIS k = (0.611 - 0.861) — — — C2. S&Q: Shower/Bathe Self OASIS k = (0.611 - 0.867) — — — C3. S&Q: Roll left & right New k = (0.579 - 0.843) — — — C4. S&Q: Sit to lying New k = (0.630 - 0.857) — — — C5. S&Q: Picking up Object New k = (0.391 - 0.804) — — — C6. S&Q: Footwear On/Off — k = (0.652 - 0.898) — — — C7. Mode of Mobility: Wheelchair? IRF-PAI k = 0.833 — — — C71. S&Q: 1 Step (Curb) New k = (0.510 - 0.806) — — — C72. S&Q: 50 Feet w/2 turns IRF-PAI k = (0.513 - 0.887) — — — C7c. S&Q: 12 Steps - Interior New k = (0.499 - 0.949) — — — C7d. S&Q: 4 Steps - Exterior New k = (0.459 - 0.946) — — — C7e. S&Q: 10 Feet Uneven Surface — k = (0.485 - 0.947) — — — C7f. S&Q: Car Transfer — k = (0.523 - 0.926) — — — C7g. S&Q: Wheel short ramp New k = (0.362 - 0.616) — — — C7h. S&Q: Wheel long ramp New k = (0.369 - 0.605) — — — C8. S&Q: Telephone-answering OASIS k = (0.611 - 0.806) — — — C9. S&Q: Telephone-placing OASIS k = (0.609 - 0.812) — — — C10. S&Q: Medication Management (Oral) OASIS k = (0.592 - 0.813) — — — C11. S&Q: Medication Management (Inhalant) OASIS k = (0.443 - 0.727) — — — C12. S&Q: Medication Management (Injectable) OASIS k = (0.527 - 0.744) — — — C13. S&Q: Make a light meal OASIS k = (0.220 - 0.856) — — — C14. S&Q: Wipe down surface OASIS k = (0.594 - 0.805) — — — C15. S&Q: Light shopping OASIS k = (0.453 - 0.819) — — — C16. S&Q: Laundry OASIS k = (0.413 - 0.815) — — — C17. S&Q: Use public transportation OASIS k = (0.291 - 0.857) — — — VII. Overall Plan of Care/Advance Care Directives — — — — — A1. Documented agreed-upon care goals and dates of
completion — k = (0.795 - 0.818) — — —
A2. Description of overall patient status — k = (0.592 - 0.765) — — — A3. Are care decisions documented in medical record — — — — —
(continued)
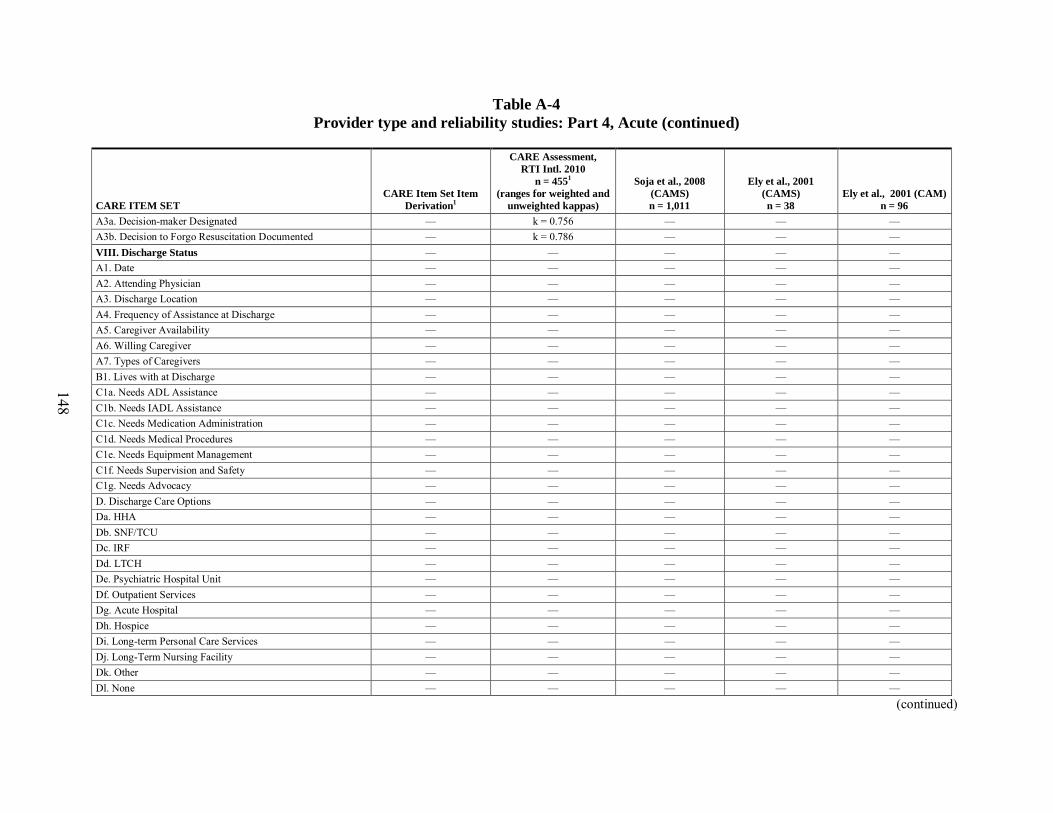
148
Table A-4 Provider type and reliability studies: Part 4, Acute (continued)
CARE ITEM SET CARE Item Set Item
Derivation1
CARE Assessment, RTI Intl. 2010
n = 4551 (ranges for weighted and
unweighted kappas)
Soja et al., 2008 (CAMS) n = 1,011
Ely et al., 2001 (CAMS) n = 38
Ely et al., 2001 (CAM) n = 96
A3a. Decision-maker Designated — k = 0.756 — — — A3b. Decision to Forgo Resuscitation Documented — k = 0.786 — — — VIII. Discharge Status — — — — — A1. Date — — — — — A2. Attending Physician — — — — — A3. Discharge Location — — — — — A4. Frequency of Assistance at Discharge — — — — — A5. Caregiver Availability — — — — — A6. Willing Caregiver — — — — — A7. Types of Caregivers — — — — — B1. Lives with at Discharge — — — — — C1a. Needs ADL Assistance — — — — — C1b. Needs IADL Assistance — — — — — C1c. Needs Medication Administration — — — — — C1d. Needs Medical Procedures — — — — — C1e. Needs Equipment Management — — — — — C1f. Needs Supervision and Safety — — — — — C1g. Needs Advocacy — — — — — D. Discharge Care Options — — — — — Da. HHA — — — — — Db. SNF/TCU — — — — — Dc. IRF — — — — — Dd. LTCH — — — — — De. Psychiatric Hospital Unit — — — — — Df. Outpatient Services — — — — — Dg. Acute Hospital — — — — — Dh. Hospice — — — — — Di. Long-term Personal Care Services — — — — — Dj. Long-Term Nursing Facility — — — — — Dk. Other — — — — — Dl. None — — — — —
(continued)
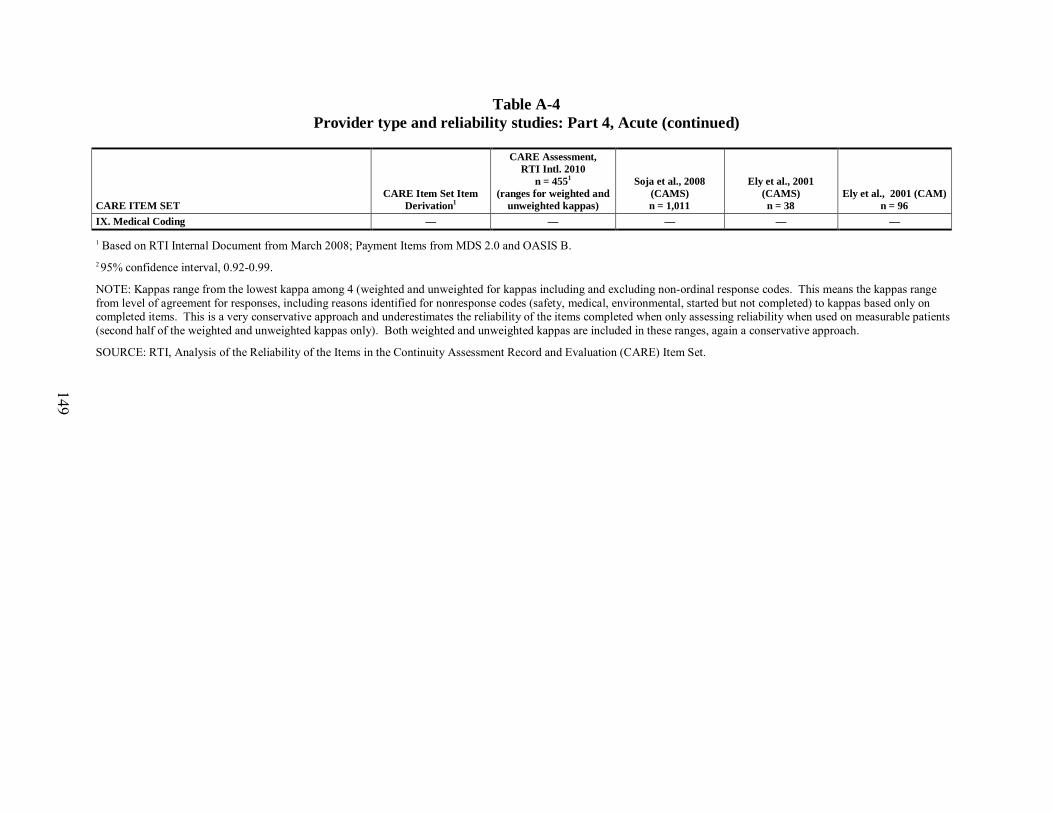
149
Table A-4 Provider type and reliability studies: Part 4, Acute (continued)
CARE ITEM SET CARE Item Set Item
Derivation1
CARE Assessment, RTI Intl. 2010
n = 4551 (ranges for weighted and
unweighted kappas)
Soja et al., 2008 (CAMS) n = 1,011
Ely et al., 2001 (CAMS) n = 38
Ely et al., 2001 (CAM) n = 96
IX. Medical Coding — — — — —
1 Based on RTI Internal Document from March 2008; Payment Items from MDS 2.0 and OASIS B. 2 95% confidence interval, 0.92-0.99.
NOTE: Kappas range from the lowest kappa among 4 (weighted and unweighted for kappas including and excluding non-ordinal response codes. This means the kappas range from level of agreement for responses, including reasons identified for nonresponse codes (safety, medical, environmental, started but not completed) to kappas based only on completed items. This is a very conservative approach and underestimates the reliability of the items completed when only assessing reliability when used on measurable patients (second half of the weighted and unweighted kappas only). Both weighted and unweighted kappas are included in these ranges, again a conservative approach.
SOURCE: RTI, Analysis of the Reliability of the Items in the Continuity Assessment Record and Evaluation (CARE) Item Set.

150
[This page left intentionally blank]
151
References for Appendix A
ABT Associates: Validation of Long Term and Post-Acute Care Quality Indicators. Prepared for the Office of Clinical Standards and Quality: Centers for Medicare and Medicaid Services. Contract Number 500-95-0062/Task Order #4, 2003.
Berg, K.: Appendix G: OASIS+ Inter-rater Reliability Study. In: ABT Associates Inc.: Case-Mix Adjustment for a National Home Health Prospective Payment System: Second Interim Report. Prepared for Office of Strategic Planning: Health Care Financing Administration. Contract Number 500-96-0003/Task Order #2, 1999.
Ely, E., Inouye, S., Bernard, G., et al.: Delirium in mechanically ventilated patient: Validity and reliability of the Confusion Assessment Method for the Intensive Care Unit (CAM-ICU). Journal of the American Medical Association 286(21): 2703-2710, 2001.
Ely, E., Margolin, R., Francis J., et al.: Evaluation of delirium in critically ill patients: Validation of the Confusion Assessment Method for the Intensive Care Unit (CAM-ICU). Critical Care Medicine 29(7):1370-1379, 2001.
Fricke, J., Unsworth, C., and Worrell, D.: Reliability of the functional independence measure with occupational therapists. The Australian Occupational Therapy Journal 40(1): 7-15, 1992.
Hamilton, B., Laughlin, J., Fiedler, R., et al.: Interrater reliability of the 7-level functional independence measure (FIM). Scandanavian Journal of Rehabilitation Medicine 26(3):115-119, 1994.
Hittle, D., Shaughnessy, P., and Crisler, K.: A study of reliability and burden of home health assessment using OASIS. Home Health Care Services Quarterly 22(4):43-63, 2002.
Iowa Foundation of Medical Care: Staff Time and Resource Intensity Validation. Inter-Rater Reliability Worksheet. West Des Moines, Iowa. Data retrieved September 19, 2007.
Kinatukara, S., Rosati, R., and Huang, L.: Assessment of OASIS reliability and validity using several methodological approaches. Home Health Care Services Quarterly 24(3):23-38, 2005.
Madigan, E., and Fortinsky, R.: Interrater reliability of the Outcomes Assessment Information Set: Results from the field. The Gerontologist 44(5):689-692, 2004.
Mor, V., Angelelli, J., Jones, R., et al.: Inter-rater reliability of nursing home quality indicators in the U.S. BMC Health Services Research 3(20):1-13, 2003.
Morris, J., Nonemaker, S., Murphy, K., et al.: A commitment to change: Revision of HCFA's RAI. Journal of the American Geriatrics Society 45(8):1101-1106, 1997.
RAND Health Corporation: Development and Validation of a Revised Nursing Home Assessment Tool: MDS 3.0. Prepared for the Office of Clinical Standards and Quality: Centers for Medicare and Medicaid Services. Contract Number 500-00-0027/Task Order #2, 2008.
152
Soja, S., Pandharipande, P., Fleming, S., et al.: Implementation, reliability testing, and compliance monitoring of the confusion assessment method for the intensive care unit in trauma patients. Intensive Care Medicine 34(7):1263-1268, 2008.
Stineman, M., Shea, J., Jette, A., et al.: The Functional Independence Measure: Tests of scaling assumptions, structure, and reliability across 20 diverse impairment categories. Archives of Physical Medicine and Rehabilitation 77(11): 1101-1108, 1996.
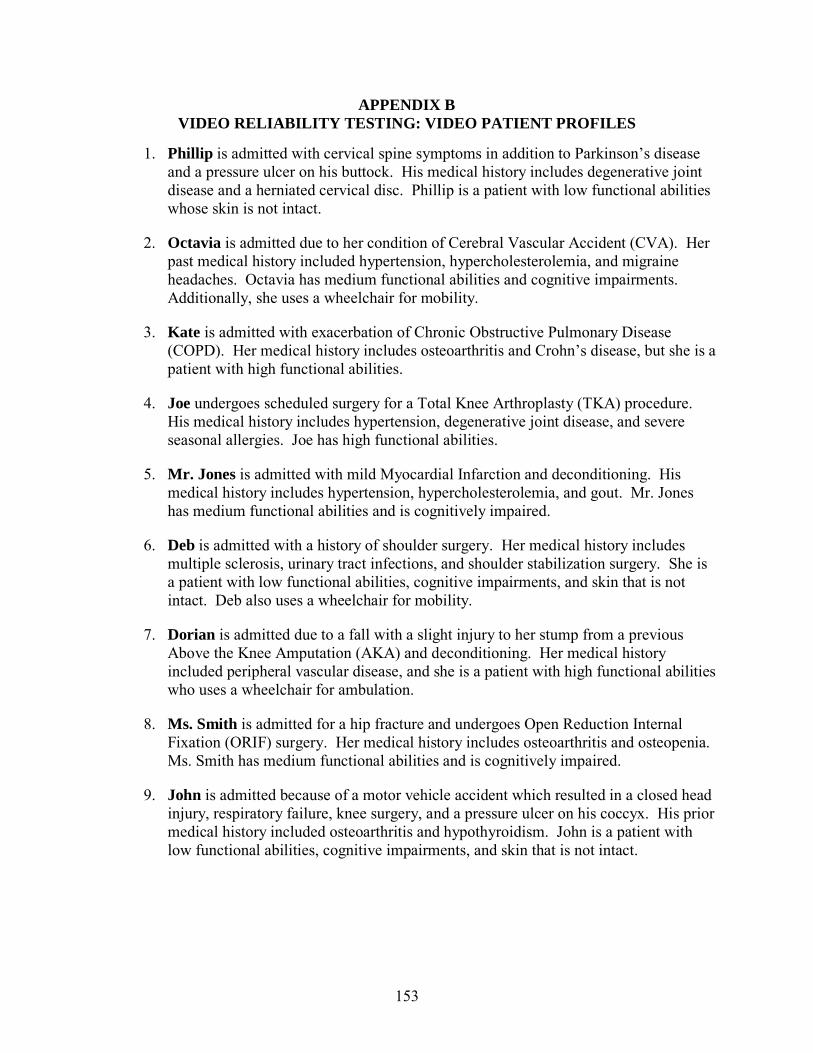
153
APPENDIX B VIDEO RELIABILITY TESTING: VIDEO PATIENT PROFILES
1. Phillip is admitted with cervical spine symptoms in addition to Parkinson’s disease and a pressure ulcer on his buttock. His medical history includes degenerative joint disease and a herniated cervical disc. Phillip is a patient with low functional abilities whose skin is not intact.
2. Octavia is admitted due to her condition of Cerebral Vascular Accident (CVA). Her past medical history included hypertension, hypercholesterolemia, and migraine headaches. Octavia has medium functional abilities and cognitive impairments. Additionally, she uses a wheelchair for mobility.
3. Kate is admitted with exacerbation of Chronic Obstructive Pulmonary Disease (COPD). Her medical history includes osteoarthritis and Crohn’s disease, but she is a patient with high functional abilities.
4. Joe undergoes scheduled surgery for a Total Knee Arthroplasty (TKA) procedure. His medical history includes hypertension, degenerative joint disease, and severe seasonal allergies. Joe has high functional abilities.
5. Mr. Jones is admitted with mild Myocardial Infarction and deconditioning. His medical history includes hypertension, hypercholesterolemia, and gout. Mr. Jones has medium functional abilities and is cognitively impaired.
6. Deb is admitted with a history of shoulder surgery. Her medical history includes multiple sclerosis, urinary tract infections, and shoulder stabilization surgery. She is a patient with low functional abilities, cognitive impairments, and skin that is not intact. Deb also uses a wheelchair for mobility.
7. Dorian is admitted due to a fall with a slight injury to her stump from a previous Above the Knee Amputation (AKA) and deconditioning. Her medical history included peripheral vascular disease, and she is a patient with high functional abilities who uses a wheelchair for ambulation.
8. Ms. Smith is admitted for a hip fracture and undergoes Open Reduction Internal Fixation (ORIF) surgery. Her medical history includes osteoarthritis and osteopenia. Ms. Smith has medium functional abilities and is cognitively impaired.
9. John is admitted because of a motor vehicle accident which resulted in a closed head injury, respiratory failure, knee surgery, and a pressure ulcer on his coccyx. His prior medical history included osteoarthritis and hypothyroidism. John is a patient with low functional abilities, cognitive impairments, and skin that is not intact.

154
[This page left intentionally blank]
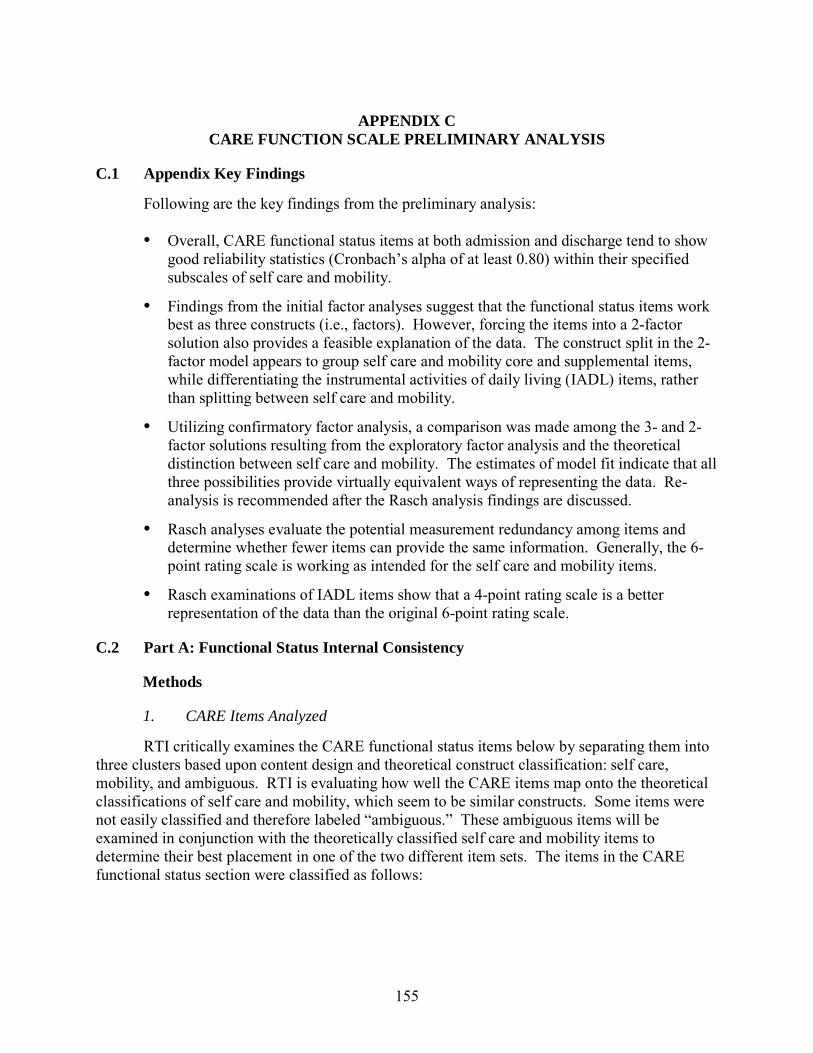
155
APPENDIX C CARE FUNCTION SCALE PRELIMINARY ANALYSIS
C.1 Appendix Key Findings
Following are the key findings from the preliminary analysis:
• Overall, CARE functional status items at both admission and discharge tend to show good reliability statistics (Cronbach’s alpha of at least 0.80) within their specified subscales of self care and mobility.
• Findings from the initial factor analyses suggest that the functional status items work best as three constructs (i.e., factors). However, forcing the items into a 2-factor solution also provides a feasible explanation of the data. The construct split in the 2-factor model appears to group self care and mobility core and supplemental items, while differentiating the instrumental activities of daily living (IADL) items, rather than splitting between self care and mobility.
• Utilizing confirmatory factor analysis, a comparison was made among the 3- and 2-factor solutions resulting from the exploratory factor analysis and the theoretical distinction between self care and mobility. The estimates of model fit indicate that all three possibilities provide virtually equivalent ways of representing the data. Re-analysis is recommended after the Rasch analysis findings are discussed.
• Rasch analyses evaluate the potential measurement redundancy among items and determine whether fewer items can provide the same information. Generally, the 6-point rating scale is working as intended for the self care and mobility items.
• Rasch examinations of IADL items show that a 4-point rating scale is a better representation of the data than the original 6-point rating scale.
C.2 Part A: Functional Status Internal Consistency
Methods
1. CARE Items Analyzed
RTI critically examines the CARE functional status items below by separating them into three clusters based upon content design and theoretical construct classification: self care, mobility, and ambiguous. RTI is evaluating how well the CARE items map onto the theoretical classifications of self care and mobility, which seem to be similar constructs. Some items were not easily classified and therefore labeled “ambiguous.” These ambiguous items will be examined in conjunction with the theoretically classified self care and mobility items to determine their best placement in one of the two different item sets. The items in the CARE functional status section were classified as follows:
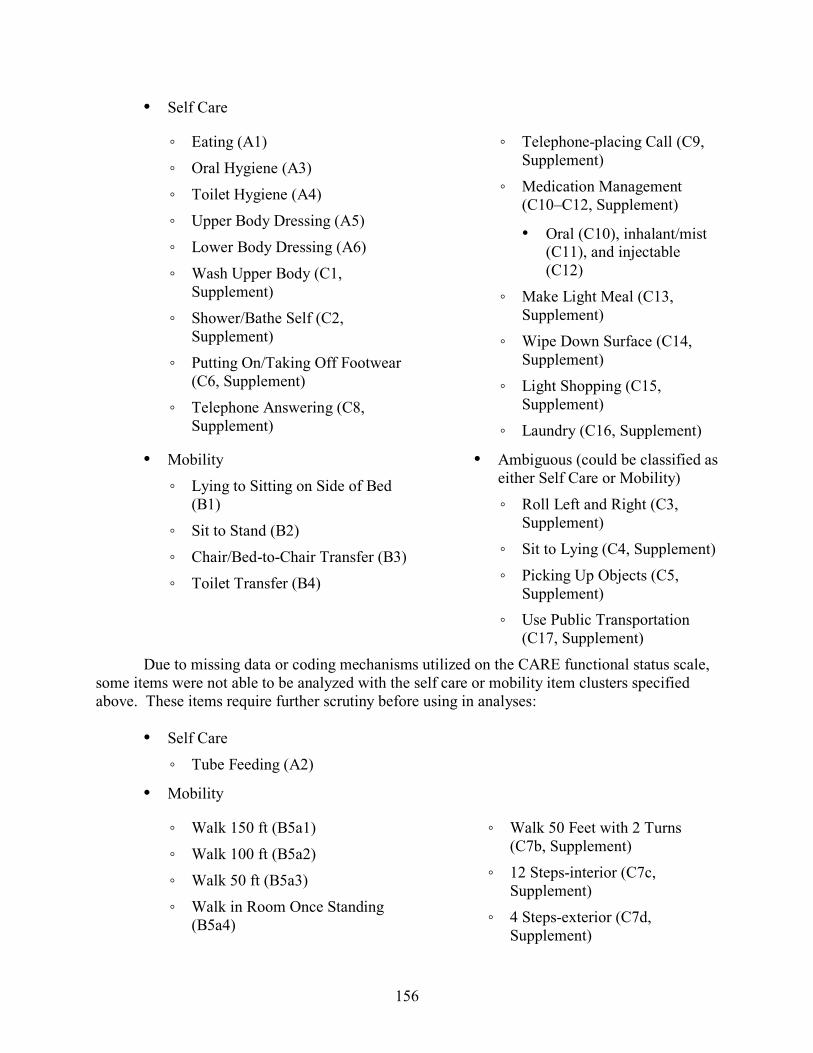
156
• Self Care
◦ Eating (A1)
◦ Oral Hygiene (A3)
◦ Toilet Hygiene (A4)
◦ Upper Body Dressing (A5)
◦ Lower Body Dressing (A6)
◦ Wash Upper Body (C1, Supplement)
◦ Shower/Bathe Self (C2, Supplement)
◦ Putting On/Taking Off Footwear (C6, Supplement)
◦ Telephone Answering (C8, Supplement)
◦ Telephone-placing Call (C9, Supplement)
◦ Medication Management (C10–C12, Supplement)
• Oral (C10), inhalant/mist (C11), and injectable (C12)
◦ Make Light Meal (C13, Supplement)
◦ Wipe Down Surface (C14, Supplement)
◦ Light Shopping (C15, Supplement)
◦ Laundry (C16, Supplement)
• Mobility
◦ Lying to Sitting on Side of Bed (B1)
◦ Sit to Stand (B2)
◦ Chair/Bed-to-Chair Transfer (B3)
◦ Toilet Transfer (B4)
• Ambiguous (could be classified as either Self Care or Mobility)
◦ Roll Left and Right (C3, Supplement)
◦ Sit to Lying (C4, Supplement)
◦ Picking Up Objects (C5, Supplement)
◦ Use Public Transportation (C17, Supplement)
Due to missing data or coding mechanisms utilized on the CARE functional status scale, some items were not able to be analyzed with the self care or mobility item clusters specified above. These items require further scrutiny before using in analyses:
• Self Care
◦ Tube Feeding (A2)
• Mobility
◦ Walk 150 ft (B5a1)
◦ Walk 100 ft (B5a2)
◦ Walk 50 ft (B5a3)
◦ Walk in Room Once Standing (B5a4)
◦ Walk 50 Feet with 2 Turns (C7b, Supplement)
◦ 12 Steps-interior (C7c, Supplement)
◦ 4 Steps-exterior (C7d, Supplement)
157
◦ Wheel 150 ft (B5b1)
◦ Wheel 100 ft (B5b2)
◦ Wheel 50 ft (B5b3)
◦ Wheel in Room Once Seated (B5b4)
◦ 1 Step (C7a, Supplement)
◦ Walking 10 Feet on Uneven Surfaces (C7e, Supplement)
◦ Car Transfer (C7f, Supplement)
◦ Wheel Short Ramp (C7g, Supplement)
◦ Wheel Long Ramp (C7h, Supplement)
2. Analysis Methods for CARE Items
The analysis of the CARE functional status scale begins with classic psychometrics, Cronbach’s alpha, followed by exploratory factor analysis. Cronbach’s alpha is an assessment of internal consistency reliability that is frequently assessed when survey instruments or scale psychometrics are published. The Cronbach’s alpha reliability estimate ranges from zero to one, with an estimate of zero indicating no consistency of measurement among items and an estimate of one indicating perfect consistency. Many cut-off criteria exist to determine whether or not a scale shows good consistency or whether the items “hang together” well. The general consensus is that Cronbach’s alpha should be at least 0.70 for an adequate scale, and alphas closer to one indicate a good scale.
The Cronbach’s alpha analyses are conducted using several item sets to determine the best configuration for the self care and mobility items used in the CARE functional status section. The different analytic sets are outlined below:
• Core items
◦ Self care (A1, A3–A6)
◦ Mobility (B1-B4)
• Core with Supplement ◦ Self care (A1, A3–A6, C1–C2, C6, C8–C16)
• Core with Ambiguous
◦ Self care (A1, A3–A6, C3–C5, C17)
◦ Mobility (B1–B4, C3–C5, C17)
• Core with Supplement and Ambiguous ◦ Self care (A1, A3–A6, C1–C2, C6, C8–C16, C3–C5, C17)
In conjunction with Cronbach’s alpha, exploratory factor analysis was conducted to determine if there are underlying latent constructs in the data that might indicate whether or not a single construct (i.e., motor) explains the variability in the CARE items or if multiple constructs provide a better explanation (i.e., self care and mobility). Exploratory factor analysis is a commonly utilized variable reduction technique that identifies the number of latent constructs in a variable set. Those latent constructs and the variables associated with them are then tested in
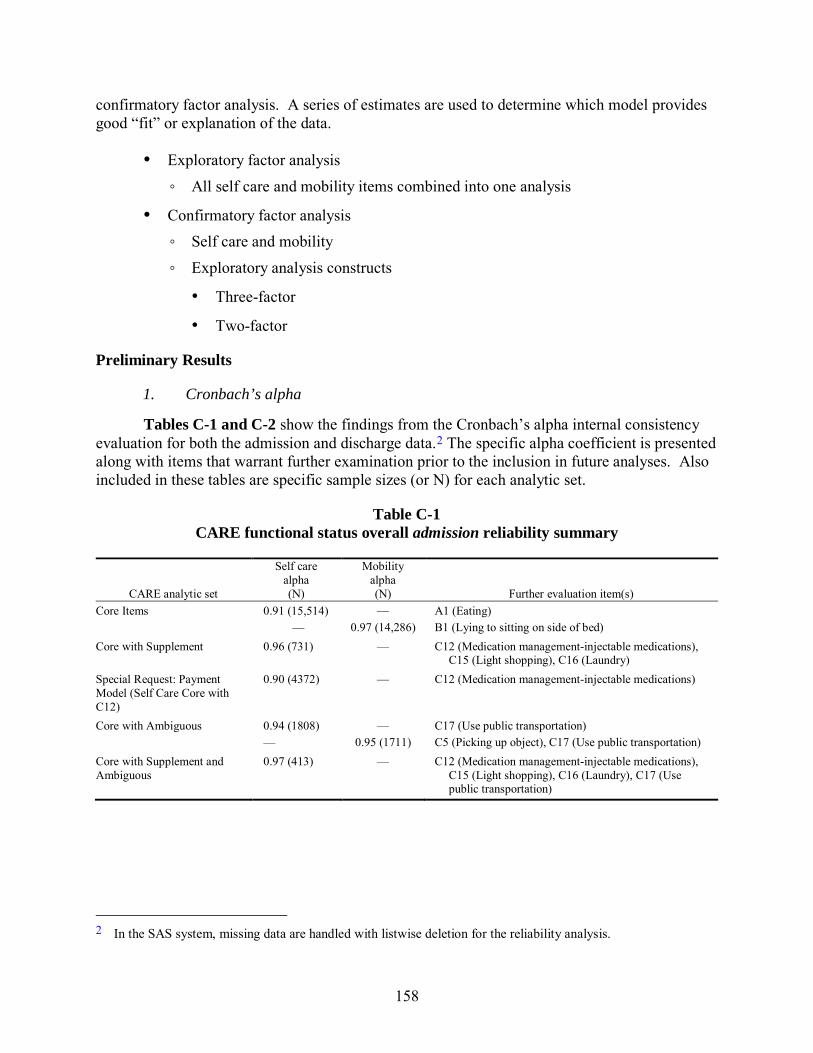
158
confirmatory factor analysis. A series of estimates are used to determine which model provides good “fit” or explanation of the data.
• Exploratory factor analysis
◦ All self care and mobility items combined into one analysis
• Confirmatory factor analysis ◦ Self care and mobility
◦ Exploratory analysis constructs
• Three-factor
• Two-factor
Preliminary Results
1. Cronbach’s alpha
Tables C-1 and C-2 show the findings from the Cronbach’s alpha internal consistency evaluation for both the admission and discharge data.2 The specific alpha coefficient is presented along with items that warrant further examination prior to the inclusion in future analyses. Also included in these tables are specific sample sizes (or N) for each analytic set.
Table C-1 CARE functional status overall admission reliability summary
CARE analytic set
Self care alpha (N)
Mobility alpha (N) Further evaluation item(s)
Core Items 0.91 (15,514) —
— 0.97 (14,286)
A1 (Eating) B1 (Lying to sitting on side of bed)
Core with Supplement 0.96 (731) — C12 (Medication management-injectable medications), C15 (Light shopping), C16 (Laundry)
Special Request: Payment Model (Self Care Core with C12)
0.90 (4372) — C12 (Medication management-injectable medications)
Core with Ambiguous 0.94 (1808) —
— 0.95 (1711)
C17 (Use public transportation) C5 (Picking up object), C17 (Use public transportation)
Core with Supplement and Ambiguous
0.97 (413) — C12 (Medication management-injectable medications), C15 (Light shopping), C16 (Laundry), C17 (Use public transportation)
2 In the SAS system, missing data are handled with listwise deletion for the reliability analysis.
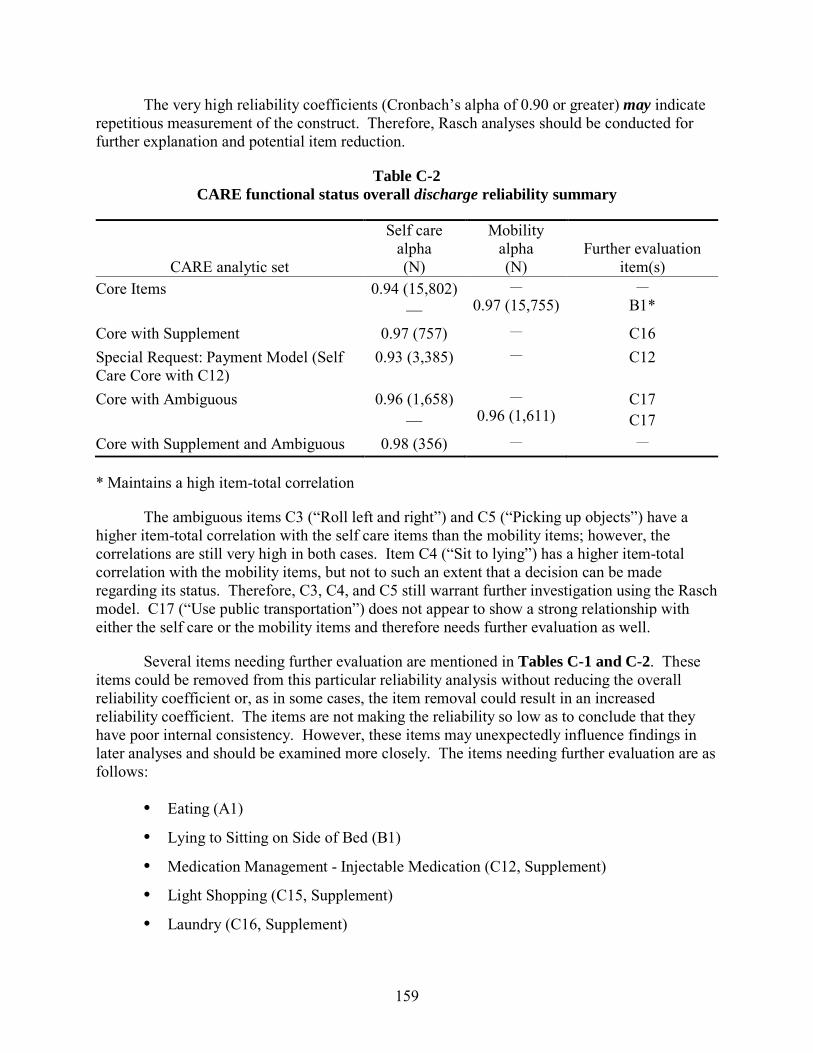
159
The very high reliability coefficients (Cronbach’s alpha of 0.90 or greater) may indicate repetitious measurement of the construct. Therefore, Rasch analyses should be conducted for further explanation and potential item reduction.
Table C-2 CARE functional status overall discharge reliability summary
CARE analytic set
Self care alpha (N)
Mobility alpha (N)
Further evaluation item(s)
Core Items 0.94 (15,802) —
—
0.97 (15,755) —
B1*
Core with Supplement 0.97 (757) — C16 Special Request: Payment Model (Self Care Core with C12)
0.93 (3,385) — C12
Core with Ambiguous 0.96 (1,658) —
—
0.96 (1,611) C17 C17
Core with Supplement and Ambiguous 0.98 (356) — —
* Maintains a high item-total correlation
The ambiguous items C3 (“Roll left and right”) and C5 (“Picking up objects”) have a higher item-total correlation with the self care items than the mobility items; however, the correlations are still very high in both cases. Item C4 (“Sit to lying”) has a higher item-total correlation with the mobility items, but not to such an extent that a decision can be made regarding its status. Therefore, C3, C4, and C5 still warrant further investigation using the Rasch model. C17 (“Use public transportation”) does not appear to show a strong relationship with either the self care or the mobility items and therefore needs further evaluation as well.
Several items needing further evaluation are mentioned in Tables C-1 and C-2. These items could be removed from this particular reliability analysis without reducing the overall reliability coefficient or, as in some cases, the item removal could result in an increased reliability coefficient. The items are not making the reliability so low as to conclude that they have poor internal consistency. However, these items may unexpectedly influence findings in later analyses and should be examined more closely. The items needing further evaluation are as follows:
• Eating (A1)
• Lying to Sitting on Side of Bed (B1)
• Medication Management - Injectable Medication (C12, Supplement)
• Light Shopping (C15, Supplement)
• Laundry (C16, Supplement)
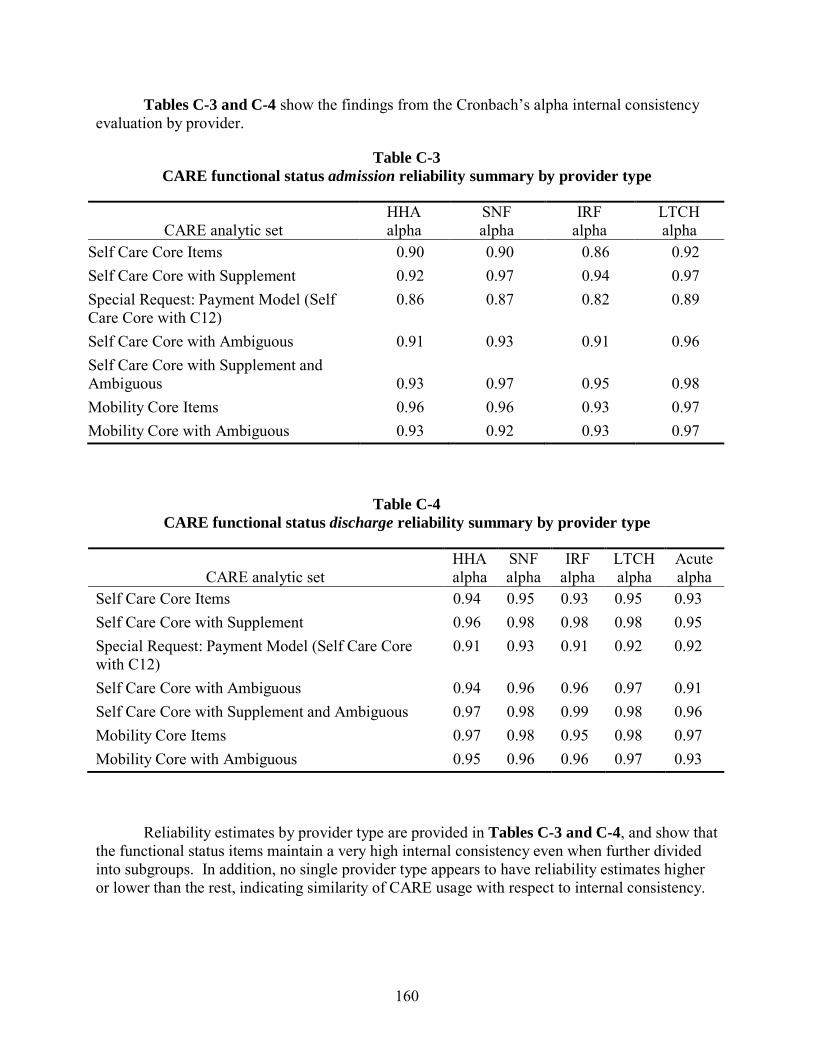
160
Tables C-3 and C-4 show the findings from the Cronbach’s alpha internal consistency evaluation by provider.
Table C-3 CARE functional status admission reliability summary by provider type
CARE analytic set HHA alpha
SNF alpha
IRF alpha
LTCH alpha
Self Care Core Items 0.90 0.90 0.86 0.92 Self Care Core with Supplement 0.92 0.97 0.94 0.97 Special Request: Payment Model (Self Care Core with C12)
0.86 0.87 0.82 0.89
Self Care Core with Ambiguous 0.91 0.93 0.91 0.96 Self Care Core with Supplement and Ambiguous 0.93 0.97 0.95 0.98 Mobility Core Items 0.96 0.96 0.93 0.97 Mobility Core with Ambiguous 0.93 0.92 0.93 0.97
Table C-4 CARE functional status discharge reliability summary by provider type
CARE analytic set HHA alpha
SNF alpha
IRF alpha
LTCH alpha
Acute alpha
Self Care Core Items 0.94 0.95 0.93 0.95 0.93 Self Care Core with Supplement 0.96 0.98 0.98 0.98 0.95 Special Request: Payment Model (Self Care Core with C12)
0.91 0.93 0.91 0.92 0.92
Self Care Core with Ambiguous 0.94 0.96 0.96 0.97 0.91 Self Care Core with Supplement and Ambiguous 0.97 0.98 0.99 0.98 0.96 Mobility Core Items 0.97 0.98 0.95 0.98 0.97 Mobility Core with Ambiguous 0.95 0.96 0.96 0.97 0.93
Reliability estimates by provider type are provided in Tables C-3 and C-4, and show that the functional status items maintain a very high internal consistency even when further divided into subgroups. In addition, no single provider type appears to have reliability estimates higher or lower than the rest, indicating similarity of CARE usage with respect to internal consistency.

161
2. Factor Analysis
In an effort to determine if the CARE functional status items can be combined into a single scale, an exploratory factor analysis was conducted. Tables C-5 and C-6 show the item breakdown findings from the exploratory factor analysis for both the admission and discharge data. The top portion of the table provides the item breakdown for the 3-factor solution and the bottom portion of the table shows the 2-factor solution. The discharge items have slightly higher factor correlation estimates than the admission items, but both groups had good factor loadings (not shown). The 2-factor models had higher factor correlations in both sets of items (0.63 for admission, 0.73 for discharge items).
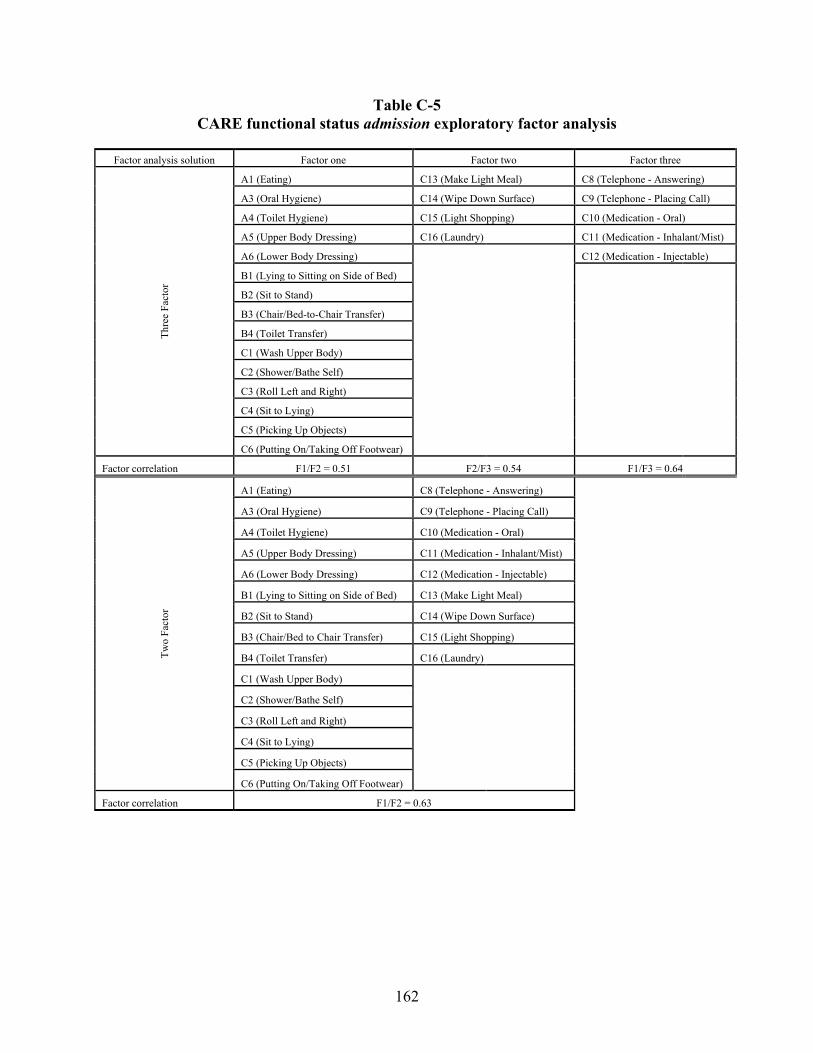
162
Table C-5 CARE functional status admission exploratory factor analysis
Factor analysis solution Factor one Factor two Factor three Th
ree
Fact
or
A1 (Eating)
A3 (Oral Hygiene)
A4 (Toilet Hygiene)
A5 (Upper Body Dressing)
A6 (Lower Body Dressing)
B1 (Lying to Sitting on Side of Bed)
B2 (Sit to Stand)
B3 (Chair/Bed-to-Chair Transfer)
B4 (Toilet Transfer)
C1 (Wash Upper Body)
C2 (Shower/Bathe Self)
C3 (Roll Left and Right)
C4 (Sit to Lying)
C5 (Picking Up Objects)
C6 (Putting On/Taking Off Footwear)
C13 (Make Light Meal)
C14 (Wipe Down Surface)
C15 (Light Shopping)
C16 (Laundry)
C8 (Telephone - Answering)
C9 (Telephone - Placing Call)
C10 (Medication - Oral)
C11 (Medication - Inhalant/Mist)
C12 (Medication - Injectable)
Factor correlation F1/F2 = 0.51 F2/F3 = 0.54 F1/F3 = 0.64
Two
Fact
or
A1 (Eating)
A3 (Oral Hygiene)
A4 (Toilet Hygiene)
A5 (Upper Body Dressing)
A6 (Lower Body Dressing)
B1 (Lying to Sitting on Side of Bed)
B2 (Sit to Stand)
B3 (Chair/Bed to Chair Transfer)
B4 (Toilet Transfer)
C1 (Wash Upper Body)
C2 (Shower/Bathe Self)
C3 (Roll Left and Right)
C4 (Sit to Lying)
C5 (Picking Up Objects)
C6 (Putting On/Taking Off Footwear)
C8 (Telephone - Answering)
C9 (Telephone - Placing Call)
C10 (Medication - Oral)
C11 (Medication - Inhalant/Mist)
C12 (Medication - Injectable)
C13 (Make Light Meal)
C14 (Wipe Down Surface)
C15 (Light Shopping)
C16 (Laundry)
Factor correlation F1/F2 = 0.63
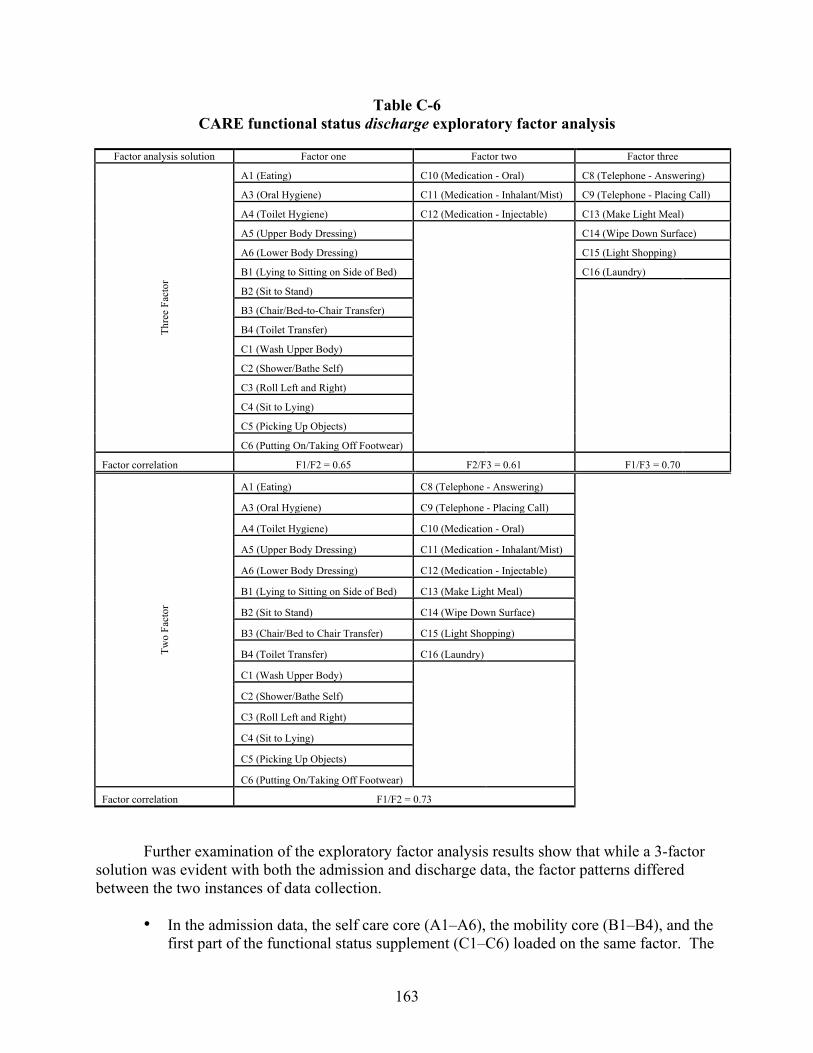
163
Table C-6 CARE functional status discharge exploratory factor analysis
Factor analysis solution Factor one Factor two Factor three Th
ree
Fact
or
A1 (Eating)
A3 (Oral Hygiene)
A4 (Toilet Hygiene)
A5 (Upper Body Dressing)
A6 (Lower Body Dressing)
B1 (Lying to Sitting on Side of Bed)
B2 (Sit to Stand)
B3 (Chair/Bed-to-Chair Transfer)
B4 (Toilet Transfer)
C1 (Wash Upper Body)
C2 (Shower/Bathe Self)
C3 (Roll Left and Right)
C4 (Sit to Lying)
C5 (Picking Up Objects)
C6 (Putting On/Taking Off Footwear)
C10 (Medication - Oral)
C11 (Medication - Inhalant/Mist)
C12 (Medication - Injectable)
C8 (Telephone - Answering)
C9 (Telephone - Placing Call)
C13 (Make Light Meal)
C14 (Wipe Down Surface)
C15 (Light Shopping)
C16 (Laundry)
Factor correlation F1/F2 = 0.65 F2/F3 = 0.61 F1/F3 = 0.70
Two
Fact
or
A1 (Eating)
A3 (Oral Hygiene)
A4 (Toilet Hygiene)
A5 (Upper Body Dressing)
A6 (Lower Body Dressing)
B1 (Lying to Sitting on Side of Bed)
B2 (Sit to Stand)
B3 (Chair/Bed to Chair Transfer)
B4 (Toilet Transfer)
C1 (Wash Upper Body)
C2 (Shower/Bathe Self)
C3 (Roll Left and Right)
C4 (Sit to Lying)
C5 (Picking Up Objects)
C6 (Putting On/Taking Off Footwear)
C8 (Telephone - Answering)
C9 (Telephone - Placing Call)
C10 (Medication - Oral)
C11 (Medication - Inhalant/Mist)
C12 (Medication - Injectable)
C13 (Make Light Meal)
C14 (Wipe Down Surface)
C15 (Light Shopping)
C16 (Laundry)
Factor correlation F1/F2 = 0.73
Further examination of the exploratory factor analysis results show that while a 3-factor solution was evident with both the admission and discharge data, the factor patterns differed between the two instances of data collection.
• In the admission data, the self care core (A1–A6), the mobility core (B1–B4), and the first part of the functional status supplement (C1–C6) loaded on the same factor. The
164
second factor consisted of IADL items C8 through C12, and the third factor consisted of IADL items C13 through C16. This indicates that while the core items may be considered a single scale, some of the IADL items in the supplemental section break off into two different constructs.
• In the discharge data, the self care core (A1–A6), the mobility core (B1–B4), and the first part of the functional status supplement (C1–C6) loaded on the same factor. The second factor consisted of IADL items C8 and C9 with C13 through C16, and the third factor consisted of IADL items C10 through C12.
These models seem to indicate that the IADL items are potentially a separate construct from the remaining functional status items and could be analyzed as a separate subscale in future modeling.
One item of further note: When trying to confirm the various factor configurations with the discharge data, items C10 (“Medication management-oral”) and C11 (“Medication management-inhalant/mist”) were found to be very highly correlated, and could potentially be merged into a single item.
C.3 Part B: Rasch Individual Item Analysis
Overview
Part B supplements the internal consistency examination by focusing on the CARE item set’s functional status section and examining the items on a more individual level. The Rasch analyses presented in this section provide additional information on the items themselves as well as how they function as subscales. The Rasch measurement model imposes the concept of interval-level measurement that most other methods simply assume, and often incorrectly. The amount of ability represented by the categorical response differences between responses such as “Strongly agree” and “Agree” or “Independent” and “Setup assistance” are not always the same, and depend on the questions being asked. Furthermore, this analysis will provide additional information on the capability of the self care and mobility items to function as separate coherent subscales.
Rasch Analysis Methods
In the internal consistency analyses, no final conclusion was reached regarding the items classified as ambiguous (that is, neither clearly self care nor mobility). Therefore, the ambiguous items are examined here in the self care analysis as well as in the mobility analysis in Part B, Item 2.
The Rasch analysis model utilized for the current examination is Andrich’s rating scale model (Andrich, 1978), which constrains all items to maintain the same distribution of response categories (i.e., from “Independent” to “Dependent”). If a great deal of misfit is found using this very constrained version of the Rasch model, it would indicate that there is variability in the response scale usage among the items, and further analysis with a more relaxed model would be necessary.
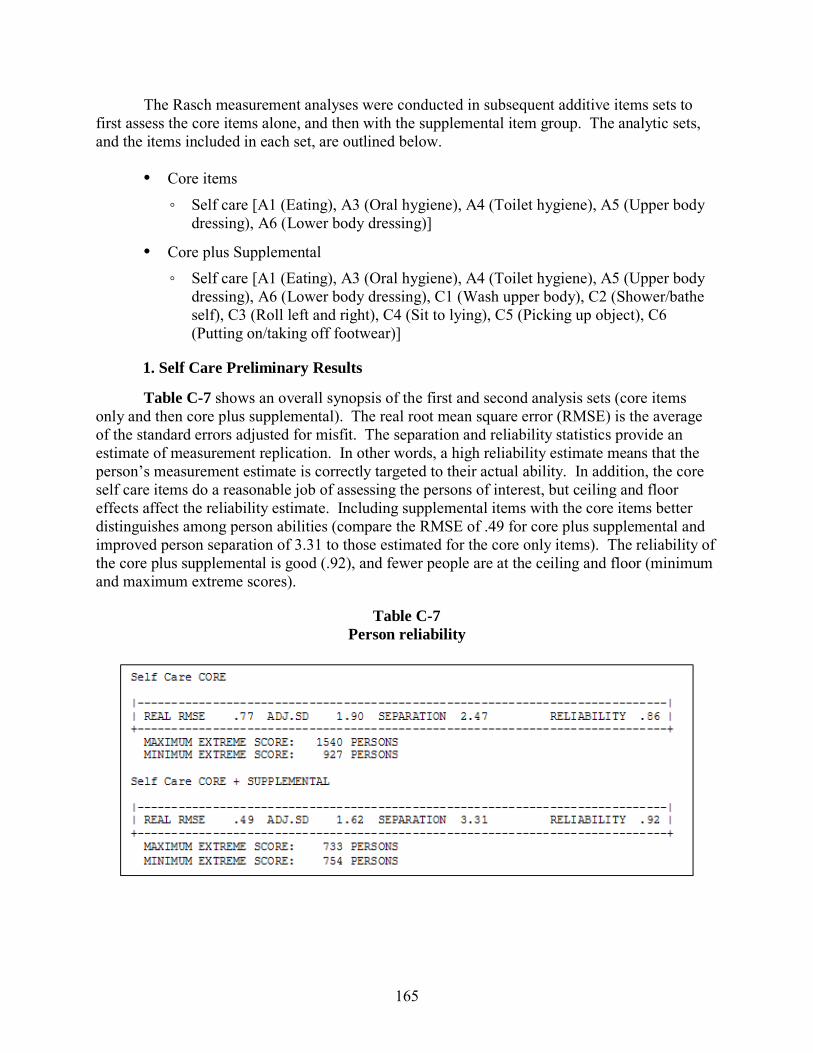
165
The Rasch measurement analyses were conducted in subsequent additive items sets to first assess the core items alone, and then with the supplemental item group. The analytic sets, and the items included in each set, are outlined below.
• Core items
◦ Self care [A1 (Eating), A3 (Oral hygiene), A4 (Toilet hygiene), A5 (Upper body dressing), A6 (Lower body dressing)]
• Core plus Supplemental ◦ Self care [A1 (Eating), A3 (Oral hygiene), A4 (Toilet hygiene), A5 (Upper body
dressing), A6 (Lower body dressing), C1 (Wash upper body), C2 (Shower/bathe self), C3 (Roll left and right), C4 (Sit to lying), C5 (Picking up object), C6 (Putting on/taking off footwear)]
1. Self Care Preliminary Results
Table C-7 shows an overall synopsis of the first and second analysis sets (core items only and then core plus supplemental). The real root mean square error (RMSE) is the average of the standard errors adjusted for misfit. The separation and reliability statistics provide an estimate of measurement replication. In other words, a high reliability estimate means that the person’s measurement estimate is correctly targeted to their actual ability. In addition, the core self care items do a reasonable job of assessing the persons of interest, but ceiling and floor effects affect the reliability estimate. Including supplemental items with the core items better distinguishes among person abilities (compare the RMSE of .49 for core plus supplemental and improved person separation of 3.31 to those estimated for the core only items). The reliability of the core plus supplemental is good (.92), and fewer people are at the ceiling and floor (minimum and maximum extreme scores).
Table C-7 Person reliability
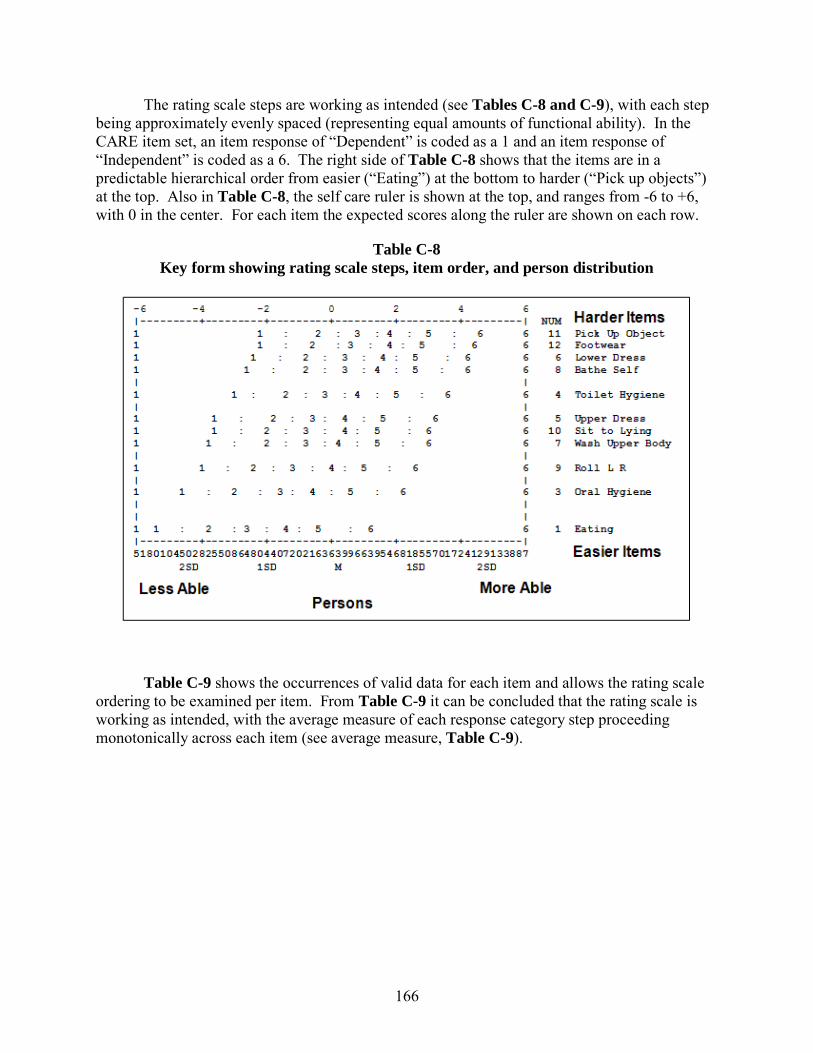
166
The rating scale steps are working as intended (see Tables C-8 and C-9), with each step being approximately evenly spaced (representing equal amounts of functional ability). In the CARE item set, an item response of “Dependent” is coded as a 1 and an item response of “Independent” is coded as a 6. The right side of Table C-8 shows that the items are in a predictable hierarchical order from easier (“Eating”) at the bottom to harder (“Pick up objects”) at the top. Also in Table C-8, the self care ruler is shown at the top, and ranges from -6 to +6, with 0 in the center. For each item the expected scores along the ruler are shown on each row.
Table C-8 Key form showing rating scale steps, item order, and person distribution
Table C-9 shows the occurrences of valid data for each item and allows the rating scale ordering to be examined per item. From Table C-9 it can be concluded that the rating scale is working as intended, with the average measure of each response category step proceeding monotonically across each item (see average measure, Table C-9).
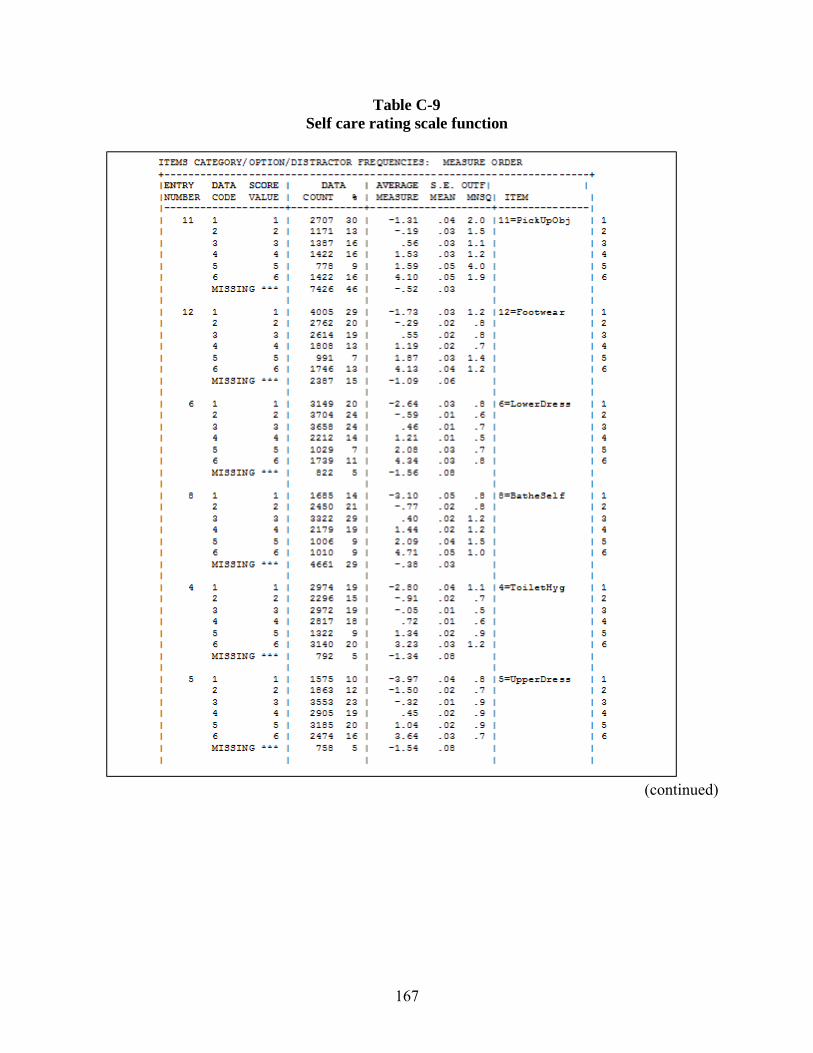
167
Table C-9 Self care rating scale function
(continued)
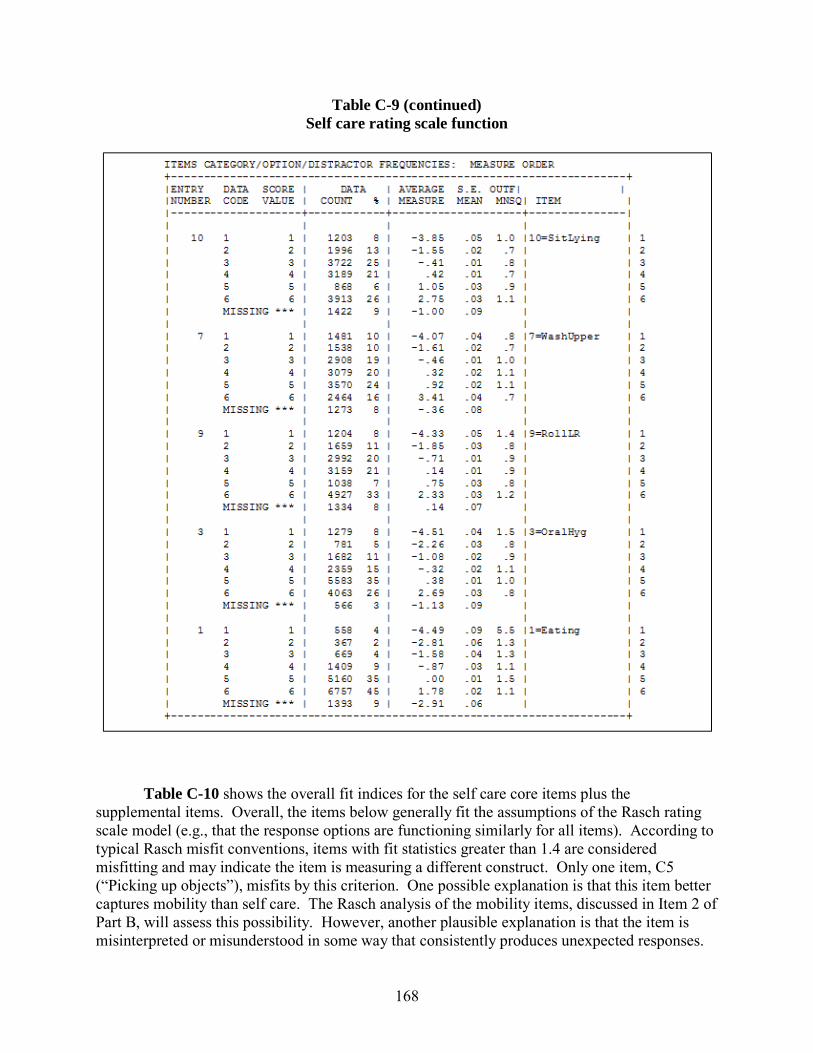
168
Table C-9 (continued) Self care rating scale function
Table C-10 shows the overall fit indices for the self care core items plus the supplemental items. Overall, the items below generally fit the assumptions of the Rasch rating scale model (e.g., that the response options are functioning similarly for all items). According to typical Rasch misfit conventions, items with fit statistics greater than 1.4 are considered misfitting and may indicate the item is measuring a different construct. Only one item, C5 (“Picking up objects”), misfits by this criterion. One possible explanation is that this item better captures mobility than self care. The Rasch analysis of the mobility items, discussed in Item 2 of Part B, will assess this possibility. However, another plausible explanation is that the item is misinterpreted or misunderstood in some way that consistently produces unexpected responses.
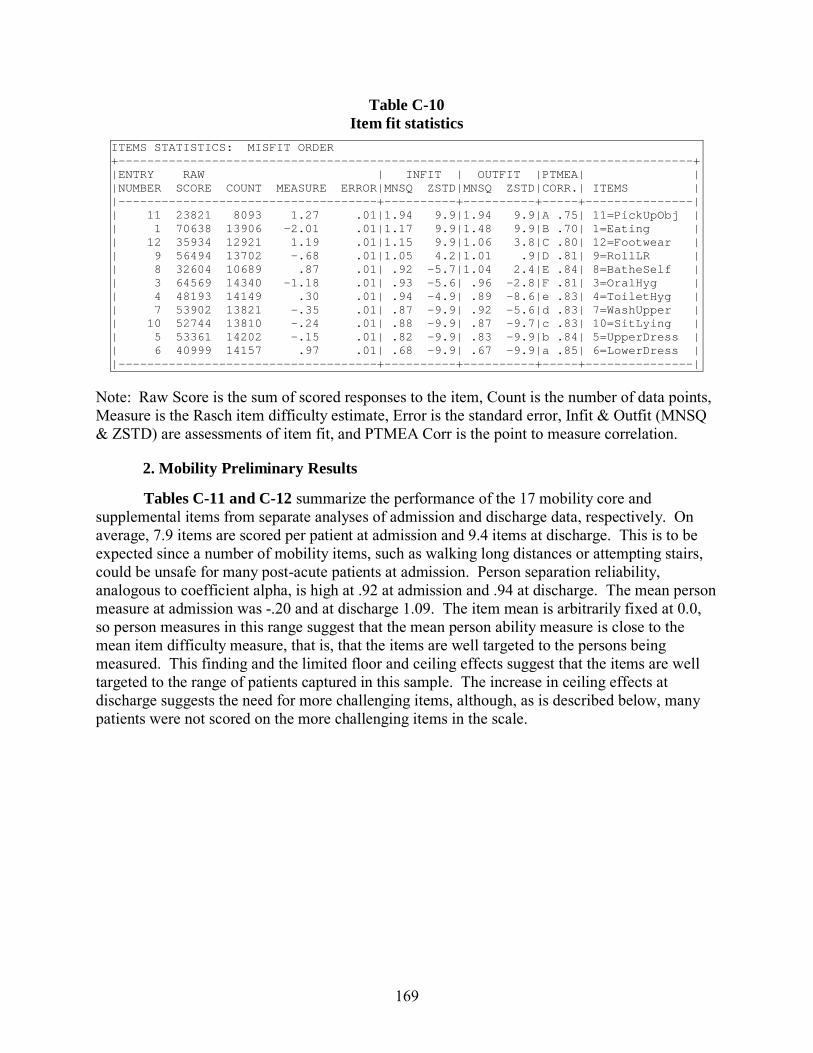
169
Table C-10 Item fit statistics
ITEMS STATISTICS: MISFIT ORDER +--------------------------------------------------------------------------------+ |ENTRY RAW | INFIT | OUTFIT |PTMEA| | |NUMBER SCORE COUNT MEASURE ERROR|MNSQ ZSTD|MNSQ ZSTD|CORR.| ITEMS | |------------------------------------+----------+----------+-----+---------------| | 11 23821 8093 1.27 .01|1.94 9.9|1.94 9.9|A .75| 11=PickUpObj | | 1 70638 13906 -2.01 .01|1.17 9.9|1.48 9.9|B .70| 1=Eating | | 12 35934 12921 1.19 .01|1.15 9.9|1.06 3.8|C .80| 12=Footwear | | 9 56494 13702 -.68 .01|1.05 4.2|1.01 .9|D .81| 9=RollLR | | 8 32604 10689 .87 .01| .92 -5.7|1.04 2.4|E .84| 8=BatheSelf | | 3 64569 14340 -1.18 .01| .93 -5.6| .96 -2.8|F .81| 3=OralHyg | | 4 48193 14149 .30 .01| .94 -4.9| .89 -8.6|e .83| 4=ToiletHyg | | 7 53902 13821 -.35 .01| .87 -9.9| .92 -5.6|d .83| 7=WashUpper | | 10 52744 13810 -.24 .01| .88 -9.9| .87 -9.7|c .83| 10=SitLying | | 5 53361 14202 -.15 .01| .82 -9.9| .83 -9.9|b .84| 5=UpperDress | | 6 40999 14157 .97 .01| .68 -9.9| .67 -9.9|a .85| 6=LowerDress | |------------------------------------+----------+----------+-----+---------------|
Note: Raw Score is the sum of scored responses to the item, Count is the number of data points, Measure is the Rasch item difficulty estimate, Error is the standard error, Infit & Outfit (MNSQ & ZSTD) are assessments of item fit, and PTMEA Corr is the point to measure correlation.
2. Mobility Preliminary Results
Tables C-11 and C-12 summarize the performance of the 17 mobility core and supplemental items from separate analyses of admission and discharge data, respectively. On average, 7.9 items are scored per patient at admission and 9.4 items at discharge. This is to be expected since a number of mobility items, such as walking long distances or attempting stairs, could be unsafe for many post-acute patients at admission. Person separation reliability, analogous to coefficient alpha, is high at .92 at admission and .94 at discharge. The mean person measure at admission was -.20 and at discharge 1.09. The item mean is arbitrarily fixed at 0.0, so person measures in this range suggest that the mean person ability measure is close to the mean item difficulty measure, that is, that the items are well targeted to the persons being measured. This finding and the limited floor and ceiling effects suggest that the items are well targeted to the range of patients captured in this sample. The increase in ceiling effects at discharge suggests the need for more challenging items, although, as is described below, many patients were not scored on the more challenging items in the scale.
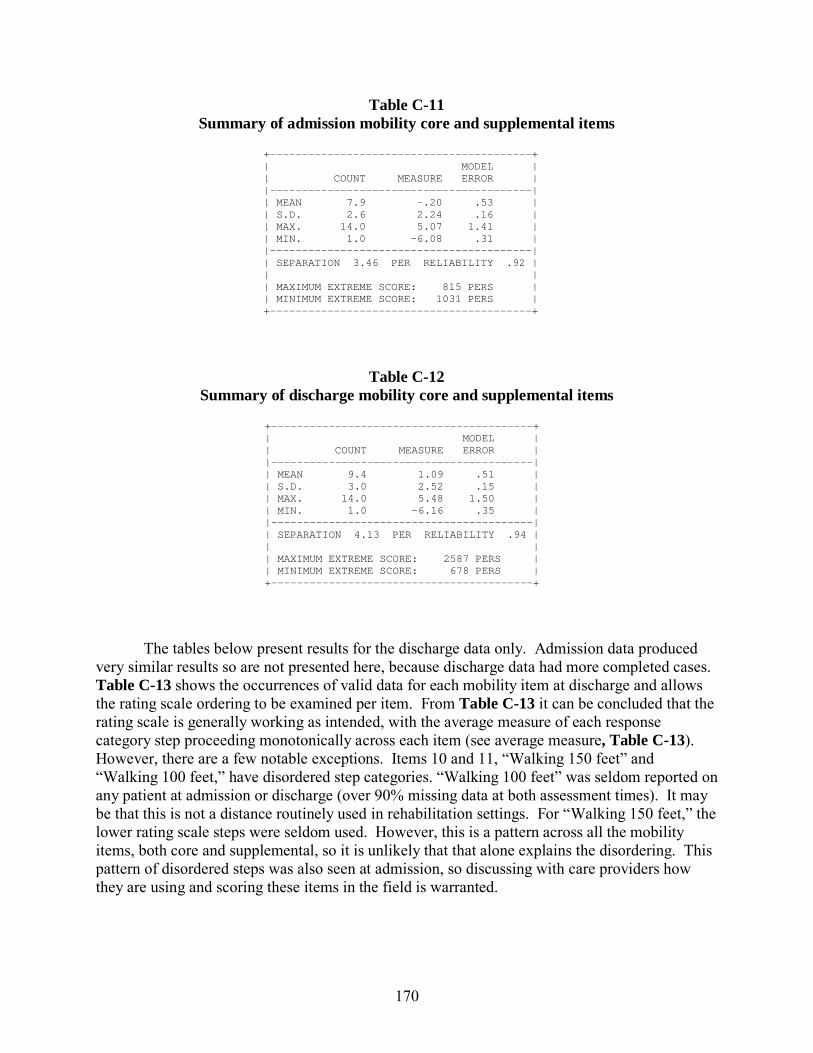
170
Table C-11 Summary of admission mobility core and supplemental items
-----------------------------------------
-----------------------------------------
-----------------------------------------
-----------------------------------------
+ + | MODEL | | COUNT MEASURE ERROR | | | | MEAN 7.9 -.20 .53 | | S.D. 2.6 2.24 .16 | | MAX. 14.0 5.07 1.41 | | MIN. 1.0 -6.08 .31 | | | | SEPARATION 3.46 PER RELIABILITY .92 | | | | MAXIMUM EXTREME SCORE: 815 PERS | | MINIMUM EXTREME SCORE: 1031 PERS | + +
Table C-12 Summary of discharge mobility core and supplemental items
-----------------------------------------
-----------------------------------------
-----------------------------------------
-----------------------------------------
+ + | MODEL | | COUNT MEASURE ERROR | | | | MEAN 9.4 1.09 .51 | | S.D. 3.0 2.52 .15 | | MAX. 14.0 5.48 1.50 | | MIN. 1.0 -6.16 .35 | | | | SEPARATION 4.13 PER RELIABILITY .94 | | | | MAXIMUM EXTREME SCORE: 2587 PERS | | MINIMUM EXTREME SCORE: 678 PERS | + +
The tables below present results for the discharge data only. Admission data produced very similar results so are not presented here, because discharge data had more completed cases. Table C-13 shows the occurrences of valid data for each mobility item at discharge and allows the rating scale ordering to be examined per item. From Table C-13 it can be concluded that the rating scale is generally working as intended, with the average measure of each response category step proceeding monotonically across each item (see average measure, Table C-13). However, there are a few notable exceptions. Items 10 and 11, “Walking 150 feet” and “Walking 100 feet,” have disordered step categories. “Walking 100 feet” was seldom reported on any patient at admission or discharge (over 90% missing data at both assessment times). It may be that this is not a distance routinely used in rehabilitation settings. For “Walking 150 feet,” the lower rating scale steps were seldom used. However, this is a pattern across all the mobility items, both core and supplemental, so it is unlikely that that alone explains the disordering. This pattern of disordered steps was also seen at admission, so discussing with care providers how they are using and scoring these items in the field is warranted.
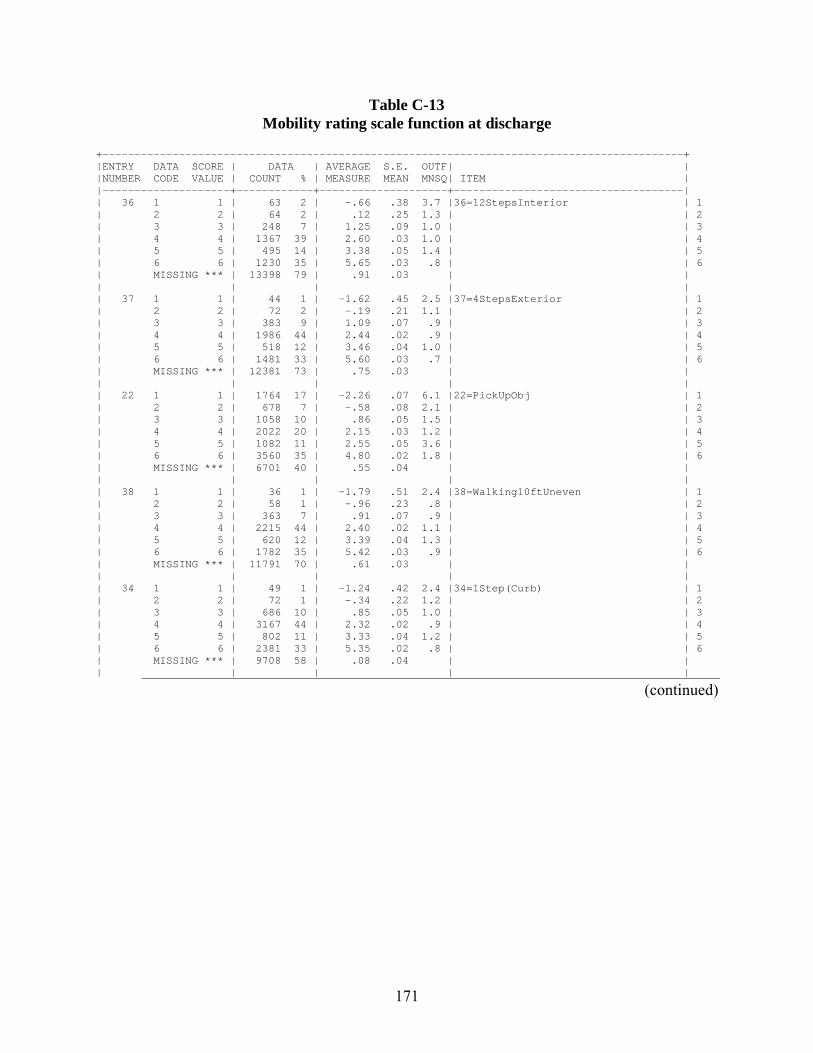
171
Table C-13 Mobility rating scale function at discharge
-------------------------------------------------------------------------------------------
-------------------- ------------ -------------------- ------------------------------------
+ + |ENTRY DATA SCORE | DATA | AVERAGE S.E. OUTF| | |NUMBER CODE VALUE | COUNT % | MEASURE MEAN MNSQ| ITEM | | + + + | | 36 1 1 | 63 2 | -.66 .38 3.7 |36=12StepsInterior | 1 | 2 2 | 64 2 | .12 .25 1.3 | | 2 | 3 3 | 248 7 | 1.25 .09 1.0 | | 3 | 4 4 | 1367 39 | 2.60 .03 1.0 | | 4 | 5 5 | 495 14 | 3.38 .05 1.4 | | 5 | 6 6 | 1230 35 | 5.65 .03 .8 | | 6 | MISSING *** | 13398 79 | .91 .03 | | | | | | | | 37 1 1 | 44 1 | -1.62 .45 2.5 |37=4StepsExterior | 1 | 2 2 | 72 2 | -.19 .21 1.1 | | 2 | 3 3 | 383 9 | 1.09 .07 .9 | | 3 | 4 4 | 1986 44 | 2.44 .02 .9 | | 4 | 5 5 | 518 12 | 3.46 .04 1.0 | | 5 | 6 6 | 1481 33 | 5.60 .03 .7 | | 6 | MISSING *** | 12381 73 | .75 .03 | | | | | | | | 22 1 1 | 1764 17 | -2.26 .07 6.1 |22=PickUpObj | 1 | 2 2 | 678 7 | -.58 .08 2.1 | | 2 | 3 3 | 1058 10 | .86 .05 1.5 | | 3 | 4 4 | 2022 20 | 2.15 .03 1.2 | | 4 | 5 5 | 1082 11 | 2.55 .05 3.6 | | 5 | 6 6 | 3560 35 | 4.80 .02 1.8 | | 6 | MISSING *** | 6701 40 | .55 .04 | | | | | | | | 38 1 1 | 36 1 | -1.79 .51 2.4 |38=Walking10ftUneven | 1 | 2 2 | 58 1 | -.96 .23 .8 | | 2 | 3 3 | 363 7 | .91 .07 .9 | | 3 | 4 4 | 2215 44 | 2.40 .02 1.1 | | 4 | 5 5 | 620 12 | 3.39 .04 1.3 | | 5 | 6 6 | 1782 35 | 5.42 .03 .9 | | 6 | MISSING *** | 11791 70 | .61 .03 | | | | | | | | 34 1 1 | 49 1 | -1.24 .42 2.4 |34=1Step(Curb) | 1 | 2 2 | 72 1 | -.34 .22 1.2 | | 2 | 3 3 | 686 10 | .85 .05 1.0 | | 3 | 4 4 | 3167 44 | 2.32 .02 .9 | | 4 | 5 5 | 802 11 | 3.33 .04 1.2 | | 5 | 6 6 | 2381 33 | 5.35 .02 .8 | | 6 | MISSING *** | 9708 58 | .08 .04 | | | | | | |
(continued)
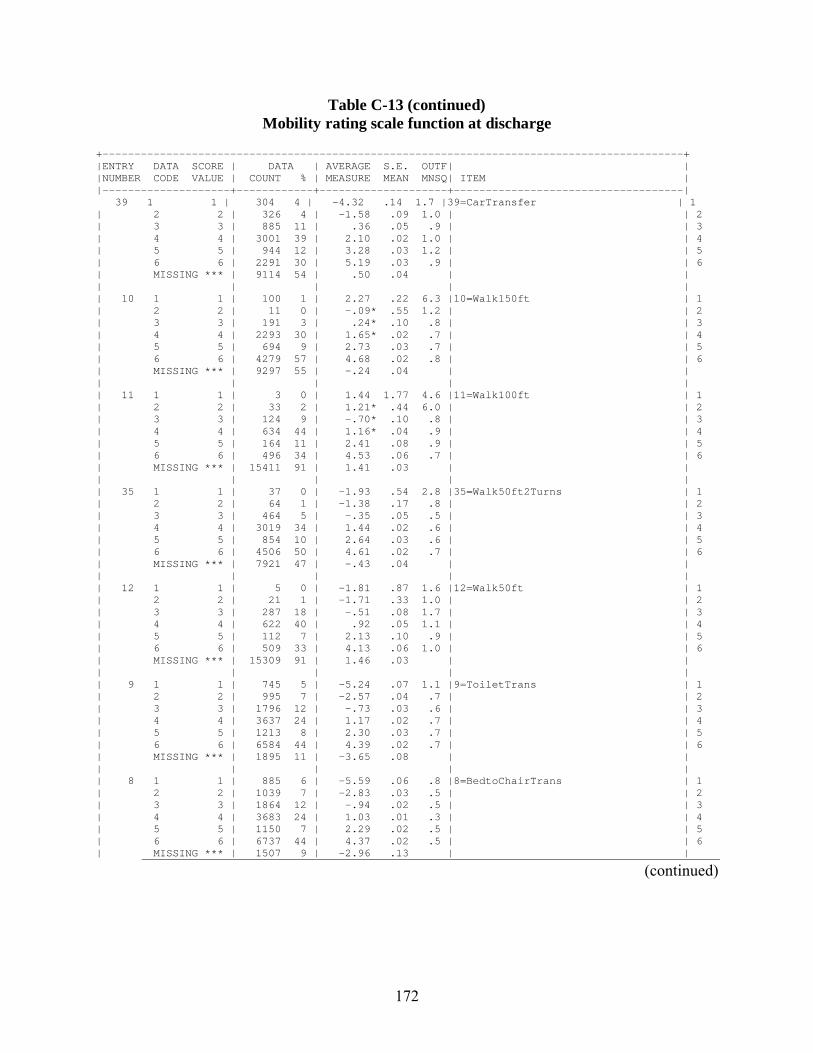
172
Table C-13 (continued) Mobility rating scale function at discharge
-------------------------------------------------------------------------------------------
-------------------- ------------ -------------------- ------------------------------------
+ + |ENTRY DATA SCORE | DATA | AVERAGE S.E. OUTF| | |NUMBER CODE VALUE | COUNT % | MEASURE MEAN MNSQ| ITEM | | + + + | 39 1 1 | 304 4 | -4.32 .14 1.7 |39=CarTransfer | 1 | 2 2 | 326 4 | -1.58 .09 1.0 | | 2 | 3 3 | 885 11 | .36 .05 .9 | | 3 | 4 4 | 3001 39 | 2.10 .02 1.0 | | 4 | 5 5 | 944 12 | 3.28 .03 1.2 | | 5 | 6 6 | 2291 30 | 5.19 .03 .9 | | 6 | MISSING *** | 9114 54 | .50 .04 | | | | | | | | 10 1 1 | 100 1 | 2.27 .22 6.3 |10=Walk150ft | 1 | 2 2 | 11 0 | -.09* .55 1.2 | | 2 | 3 3 | 191 3 | .24* .10 .8 | | 3 | 4 4 | 2293 30 | 1.65* .02 .7 | | 4 | 5 5 | 694 9 | 2.73 .03 .7 | | 5 | 6 6 | 4279 57 | 4.68 .02 .8 | | 6 | MISSING *** | 9297 55 | -.24 .04 | | | | | | | | 11 1 1 | 3 0 | 1.44 1.77 4.6 |11=Walk100ft | 1 | 2 2 | 33 2 | 1.21* .44 6.0 | | 2 | 3 3 | 124 9 | -.70* .10 .8 | | 3 | 4 4 | 634 44 | 1.16* .04 .9 | | 4 | 5 5 | 164 11 | 2.41 .08 .9 | | 5 | 6 6 | 496 34 | 4.53 .06 .7 | | 6 | MISSING *** | 15411 91 | 1.41 .03 | | | | | | | | 35 1 1 | 37 0 | -1.93 .54 2.8 |35=Walk50ft2Turns | 1 | 2 2 | 64 1 | -1.38 .17 .8 | | 2 | 3 3 | 464 5 | -.35 .05 .5 | | 3 | 4 4 | 3019 34 | 1.44 .02 .6 | | 4 | 5 5 | 854 10 | 2.64 .03 .6 | | 5 | 6 6 | 4506 50 | 4.61 .02 .7 | | 6 | MISSING *** | 7921 47 | -.43 .04 | | | | | | | | 12 1 1 | 5 0 | -1.81 .87 1.6 |12=Walk50ft | 1 | 2 2 | 21 1 | -1.71 .33 1.0 | | 2 | 3 3 | 287 18 | -.51 .08 1.7 | | 3 | 4 4 | 622 40 | .92 .05 1.1 | | 4 | 5 5 | 112 7 | 2.13 .10 .9 | | 5 | 6 6 | 509 33 | 4.13 .06 1.0 | | 6 | MISSING *** | 15309 91 | 1.46 .03 | | | | | | | | 9 1 1 | 745 5 | -5.24 .07 1.1 |9=ToiletTrans | 1 | 2 2 | 995 7 | -2.57 .04 .7 | | 2 | 3 3 | 1796 12 | -.73 .03 .6 | | 3 | 4 4 | 3637 24 | 1.17 .02 .7 | | 4 | 5 5 | 1213 8 | 2.30 .03 .7 | | 5 | 6 6 | 6584 44 | 4.39 .02 .7 | | 6 | MISSING *** | 1895 11 | -3.65 .08 | | | | | | | | 8 1 1 | 885 6 | -5.59 .06 .8 |8=BedtoChairTrans | 1 | 2 2 | 1039 7 | -2.83 .03 .5 | | 2 | 3 3 | 1864 12 | -.94 .02 .5 | | 3 | 4 4 | 3683 24 | 1.03 .01 .3 | | 4 | 5 5 | 1150 7 | 2.29 .02 .5 | | 5 | 6 6 | 6737 44 | 4.37 .02 .5 | | 6 | MISSING *** | 1507 9 | -2.96 .13 | |
(continued)
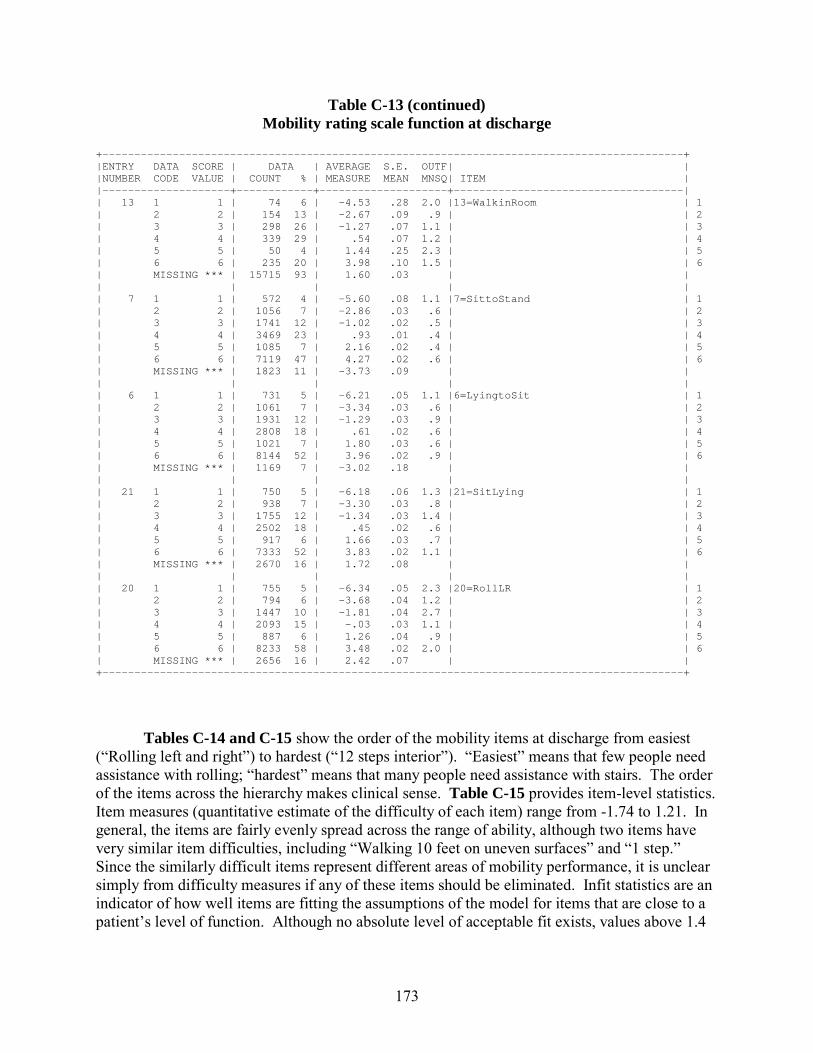
173
Table C-13 (continued) Mobility rating scale function at discharge
-------------------------------------------------------------------------------------------
-------------------- ------------ -------------------- ------------------------------------
-------------------------------------------------------------------------------------------
+ + |ENTRY DATA SCORE | DATA | AVERAGE S.E. OUTF| | |NUMBER CODE VALUE | COUNT % | MEASURE MEAN MNSQ| ITEM | | + + + | | 13 1 1 | 74 6 | -4.53 .28 2.0 |13=WalkinRoom | 1 | 2 2 | 154 13 | -2.67 .09 .9 | | 2 | 3 3 | 298 26 | -1.27 .07 1.1 | | 3 | 4 4 | 339 29 | .54 .07 1.2 | | 4 | 5 5 | 50 4 | 1.44 .25 2.3 | | 5 | 6 6 | 235 20 | 3.98 .10 1.5 | | 6 | MISSING *** | 15715 93 | 1.60 .03 | | | | | | | | 7 1 1 | 572 4 | -5.60 .08 1.1 |7=SittoStand | 1 | 2 2 | 1056 7 | -2.86 .03 .6 | | 2 | 3 3 | 1741 12 | -1.02 .02 .5 | | 3 | 4 4 | 3469 23 | .93 .01 .4 | | 4 | 5 5 | 1085 7 | 2.16 .02 .4 | | 5 | 6 6 | 7119 47 | 4.27 .02 .6 | | 6 | MISSING *** | 1823 11 | -3.73 .09 | | | | | | | | 6 1 1 | 731 5 | -6.21 .05 1.1 |6=LyingtoSit | 1 | 2 2 | 1061 7 | -3.34 .03 .6 | | 2 | 3 3 | 1931 12 | -1.29 .03 .9 | | 3 | 4 4 | 2808 18 | .61 .02 .6 | | 4 | 5 5 | 1021 7 | 1.80 .03 .6 | | 5 | 6 6 | 8144 52 | 3.96 .02 .9 | | 6 | MISSING *** | 1169 7 | -3.02 .18 | | | | | | | | 21 1 1 | 750 5 | -6.18 .06 1.3 |21=SitLying | 1 | 2 2 | 938 7 | -3.30 .03 .8 | | 2 | 3 3 | 1755 12 | -1.34 .03 1.4 | | 3 | 4 4 | 2502 18 | .45 .02 .6 | | 4 | 5 5 | 917 6 | 1.66 .03 .7 | | 5 | 6 6 | 7333 52 | 3.83 .02 1.1 | | 6 | MISSING *** | 2670 16 | 1.72 .08 | | | | | | | | 20 1 1 | 755 5 | -6.34 .05 2.3 |20=RollLR | 1 | 2 2 | 794 6 | -3.68 .04 1.2 | | 2 | 3 3 | 1447 10 | -1.81 .04 2.7 | | 3 | 4 4 | 2093 15 | -.03 .03 1.1 | | 4 | 5 5 | 887 6 | 1.26 .04 .9 | | 5 | 6 6 | 8233 58 | 3.48 .02 2.0 | | 6 | MISSING *** | 2656 16 | 2.42 .07 | | + +
Tables C-14 and C-15 show the order of the mobility items at discharge from easiest (“Rolling left and right”) to hardest (“12 steps interior”). “Easiest” means that few people need assistance with rolling; “hardest” means that many people need assistance with stairs. The order of the items across the hierarchy makes clinical sense. Table C-15 provides item-level statistics. Item measures (quantitative estimate of the difficulty of each item) range from -1.74 to 1.21. In general, the items are fairly evenly spread across the range of ability, although two items have very similar item difficulties, including “Walking 10 feet on uneven surfaces” and “1 step.” Since the similarly difficult items represent different areas of mobility performance, it is unclear simply from difficulty measures if any of these items should be eliminated. Infit statistics are an indicator of how well items are fitting the assumptions of the model for items that are close to a patient’s level of function. Although no absolute level of acceptable fit exists, values above 1.4
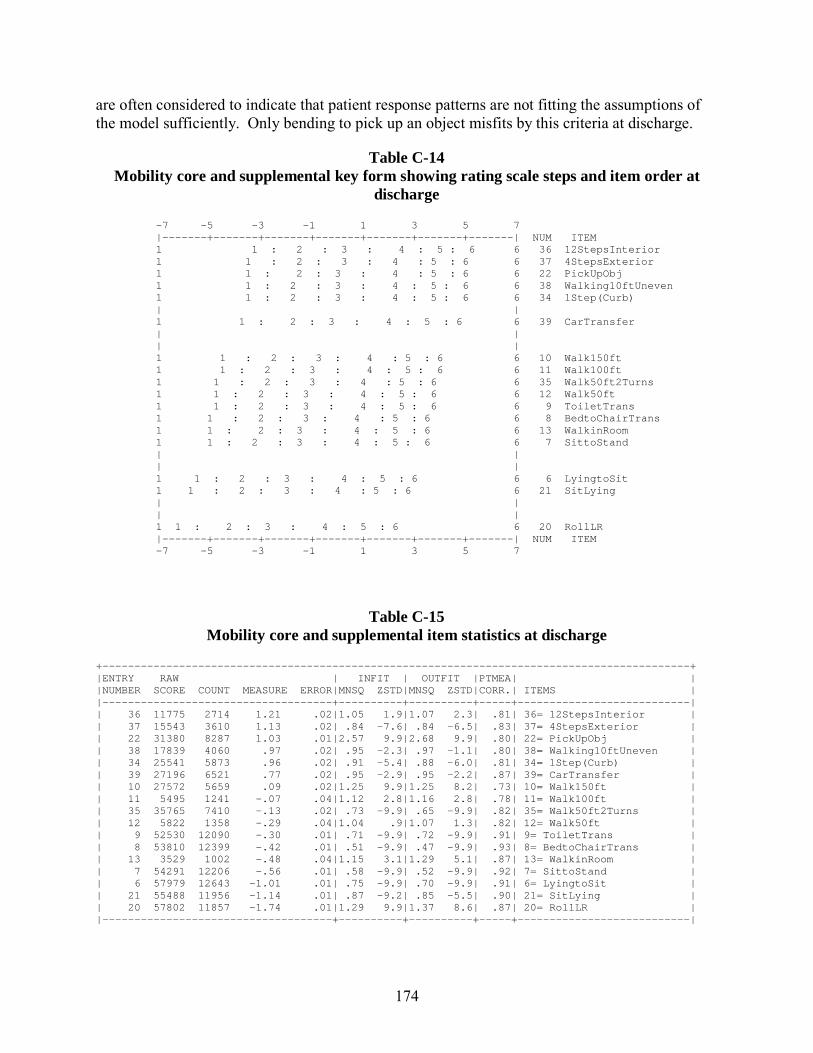
174
are often considered to indicate that patient response patterns are not fitting the assumptions of the model sufficiently. Only bending to pick up an object misfits by this criteria at discharge.
Table C-14 Mobility core and supplemental key form showing rating scale steps and item order at
discharge
------- ------- ------- ------- ------- ------- -------
------- ------- ------- ------- ------- ------- -------
-7 -5 -3 -1 1 3 5 7 | + + + + + + | NUM ITEM 1 1 : 2 : 3 : 4 : 5 : 6 6 36 12StepsInterior 1 1 : 2 : 3 : 4 : 5 : 6 6 37 4StepsExterior 1 1 : 2 : 3 : 4 : 5 : 6 6 22 PickUpObj 1 1 : 2 : 3 : 4 : 5 : 6 6 38 Walking10ftUneven 1 1 : 2 : 3 : 4 : 5 : 6 6 34 1Step(Curb) | | 1 1 : 2 : 3 : 4 : 5 : 6 6 39 CarTransfer | | | | 1 1 : 2 : 3 : 4 : 5 : 6 6 10 Walk150ft 1 1 : 2 : 3 : 4 : 5 : 6 6 11 Walk100ft 1 1 : 2 : 3 : 4 : 5 : 6 6 35 Walk50ft2Turns 1 1 : 2 : 3 : 4 : 5 : 6 6 12 Walk50ft 1 1 : 2 : 3 : 4 : 5 : 6 6 9 ToiletTrans 1 1 : 2 : 3 : 4 : 5 : 6 6 8 BedtoChairTrans 1 1 : 2 : 3 : 4 : 5 : 6 6 13 WalkinRoom 1 1 : 2 : 3 : 4 : 5 : 6 6 7 SittoStand | | | | 1 1 : 2 : 3 : 4 : 5 : 6 6 6 LyingtoSit 1 1 : 2 : 3 : 4 : 5 : 6 6 21 SitLying | | | | 1 1 : 2 : 3 : 4 : 5 : 6 6 20 RollLR | + + + + + + | NUM ITEM -7 -5 -3 -1 1 3 5 7
Table C-15 Mobility core and supplemental item statistics at discharge
--------------------------------------------------------------------------------------------
------------------------------------ ---------- ---------- ----- ---------------------------
------------------------------------ ---------- ---------- ----- ---------------------------
+ + |ENTRY RAW | INFIT | OUTFIT |PTMEA| | |NUMBER SCORE COUNT MEASURE ERROR|MNSQ ZSTD|MNSQ ZSTD|CORR.| ITEMS | | + + + + | | 36 11775 2714 1.21 .02|1.05 1.9|1.07 2.3| .81| 36= 12StepsInterior | | 37 15543 3610 1.13 .02| .84 -7.6| .84 -6.5| .83| 37= 4StepsExterior | | 22 31380 8287 1.03 .01|2.57 9.9|2.68 9.9| .80| 22= PickUpObj | | 38 17839 4060 .97 .02| .95 -2.3| .97 -1.1| .80| 38= Walking10ftUneven | | 34 25541 5873 .96 .02| .91 -5.4| .88 -6.0| .81| 34= 1Step(Curb) | | 39 27196 6521 .77 .02| .95 -2.9| .95 -2.2| .87| 39= CarTransfer | | 10 27572 5659 .09 .02|1.25 9.9|1.25 8.2| .73| 10= Walk150ft | | 11 5495 1241 -.07 .04|1.12 2.8|1.16 2.8| .78| 11= Walk100ft | | 35 35765 7410 -.13 .02| .73 -9.9| .65 -9.9| .82| 35= Walk50ft2Turns | | 12 5822 1358 -.29 .04|1.04 .9|1.07 1.3| .82| 12= Walk50ft | | 9 52530 12090 -.30 .01| .71 -9.9| .72 -9.9| .91| 9= ToiletTrans | | 8 53810 12399 -.42 .01| .51 -9.9| .47 -9.9| .93| 8= BedtoChairTrans | | 13 3529 1002 -.48 .04|1.15 3.1|1.29 5.1| .87| 13= WalkinRoom | | 7 54291 12206 -.56 .01| .58 -9.9| .52 -9.9| .92| 7= SittoStand | | 6 57979 12643 -1.01 .01| .75 -9.9| .70 -9.9| .91| 6= LyingtoSit | | 21 55488 11956 -1.14 .01| .87 -9.2| .85 -5.5| .90| 21= SitLying | | 20 57802 11857 -1.74 .01|1.29 9.9|1.37 8.6| .87| 20= RollLR | | + + + + |
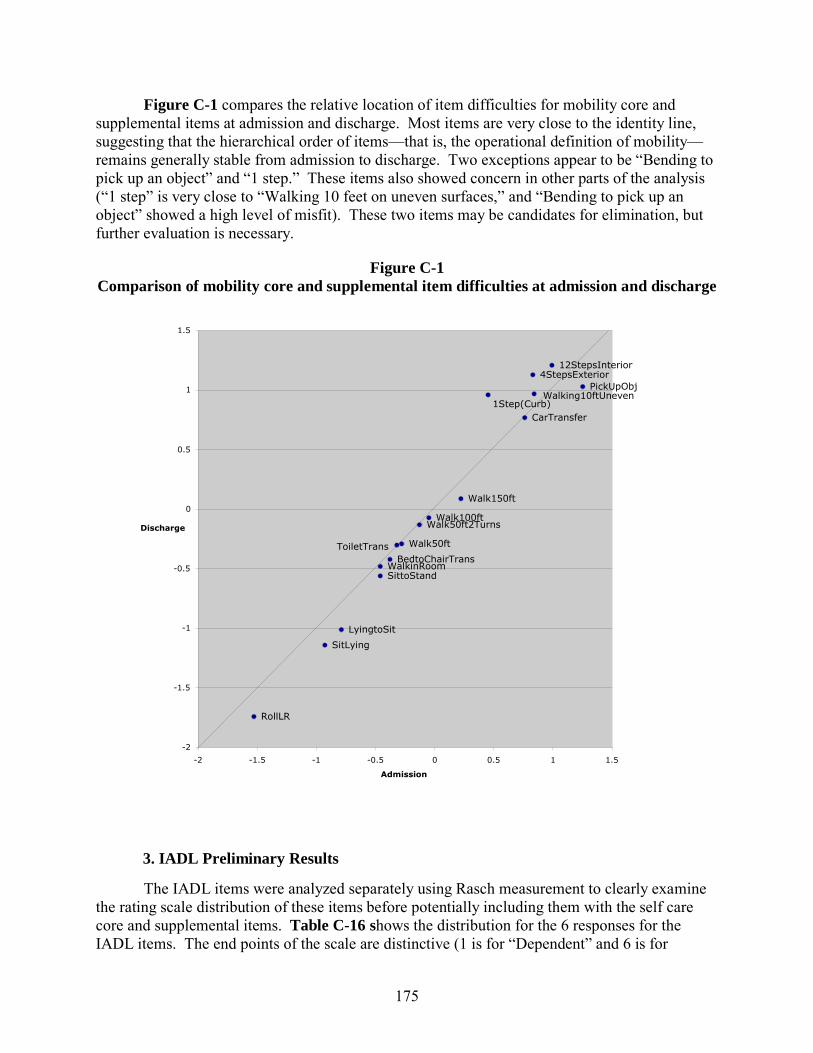
175
Figure C-1 compares the relative location of item difficulties for mobility core and supplemental items at admission and discharge. Most items are very close to the identity line, suggesting that the hierarchical order of items—that is, the operational definition of mobility—remains generally stable from admission to discharge. Two exceptions appear to be “Bending to pick up an object” and “1 step.” These items also showed concern in other parts of the analysis (“1 step” is very close to “Walking 10 feet on uneven surfaces,” and “Bending to pick up an object” showed a high level of misfit). These two items may be candidates for elimination, but further evaluation is necessary.
Figure C-1 Comparison of mobility core and supplemental item difficulties at admission and discharge
CarTransfer Walking10ftUneven 4StepsExterior 12StepsInterior
Walk50ft2Turns
1Step(Curb) PickUpObj
SitLying
RollLR
WalkinRoom Walk50ft
Walk100ft Walk150ft
ToiletTrans BedtoChairTrans
SittoStand
LyingtoSit
-2
-1.5
-1
-0.5
0
0.5
1
1.5
-2 -1.5 -1 -0.5 0 0.5 1 1.5 Admission
Discharge
3. IADL Preliminary Results
The IADL items were analyzed separately using Rasch measurement to clearly examine the rating scale distribution of these items before potentially including them with the self care core and supplemental items. Table C-16 shows the distribution for the 6 responses for the IADL items. The end points of the scale are distinctive (1 is for “Dependent” and 6 is for
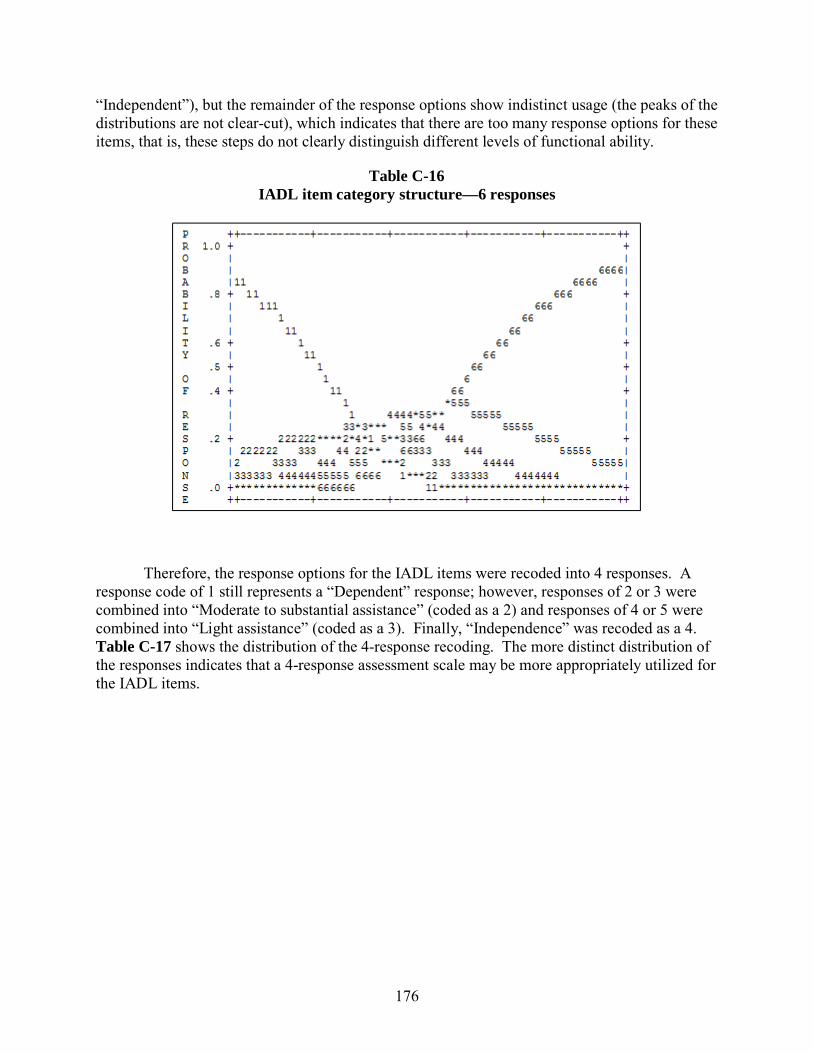
176
“Independent”), but the remainder of the response options show indistinct usage (the peaks of the distributions are not clear-cut), which indicates that there are too many response options for these items, that is, these steps do not clearly distinguish different levels of functional ability.
Table C-16 IADL item category structure—6 responses
Therefore, the response options for the IADL items were recoded into 4 responses. A response code of 1 still represents a “Dependent” response; however, responses of 2 or 3 were combined into “Moderate to substantial assistance” (coded as a 2) and responses of 4 or 5 were combined into “Light assistance” (coded as a 3). Finally, “Independence” was recoded as a 4. Table C-17 shows the distribution of the 4-response recoding. The more distinct distribution of the responses indicates that a 4-response assessment scale may be more appropriately utilized for the IADL items.
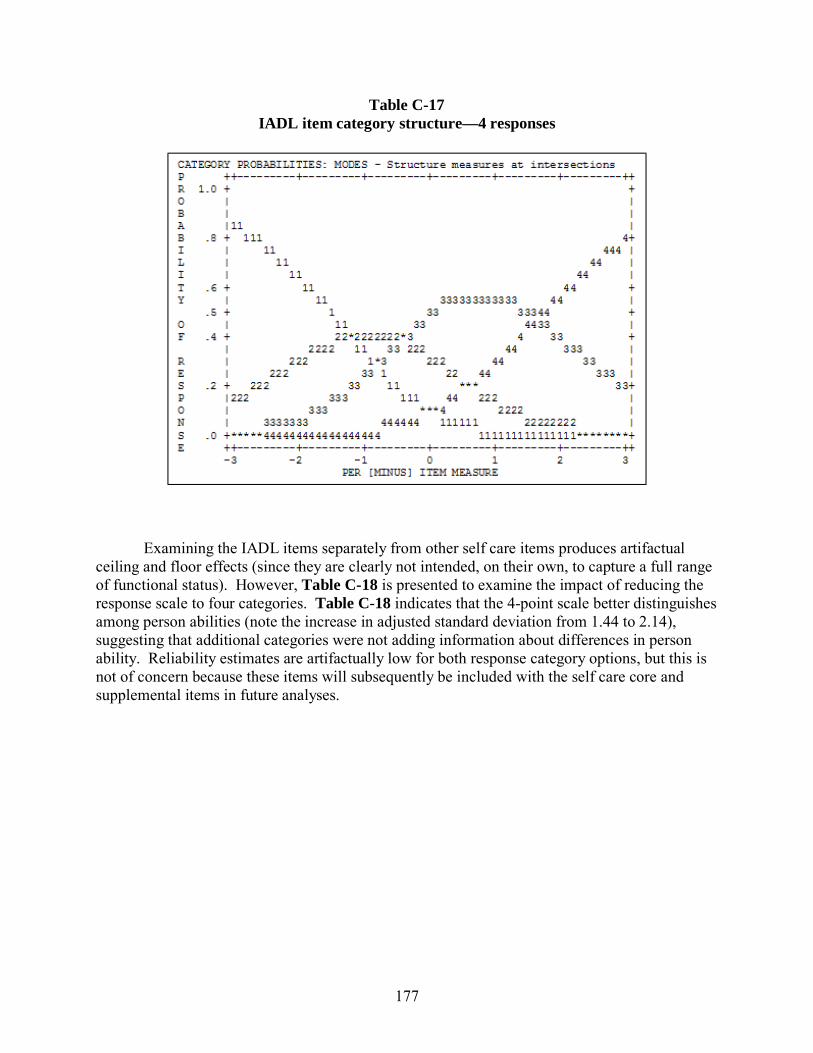
177
Table C-17 IADL item category structure—4 responses
Examining the IADL items separately from other self care items produces artifactual ceiling and floor effects (since they are clearly not intended, on their own, to capture a full range of functional status). However, Table C-18 is presented to examine the impact of reducing the response scale to four categories. Table C-18 indicates that the 4-point scale better distinguishes among person abilities (note the increase in adjusted standard deviation from 1.44 to 2.14), suggesting that additional categories were not adding information about differences in person ability. Reliability estimates are artifactually low for both response category options, but this is not of concern because these items will subsequently be included with the self care core and supplemental items in future analyses.
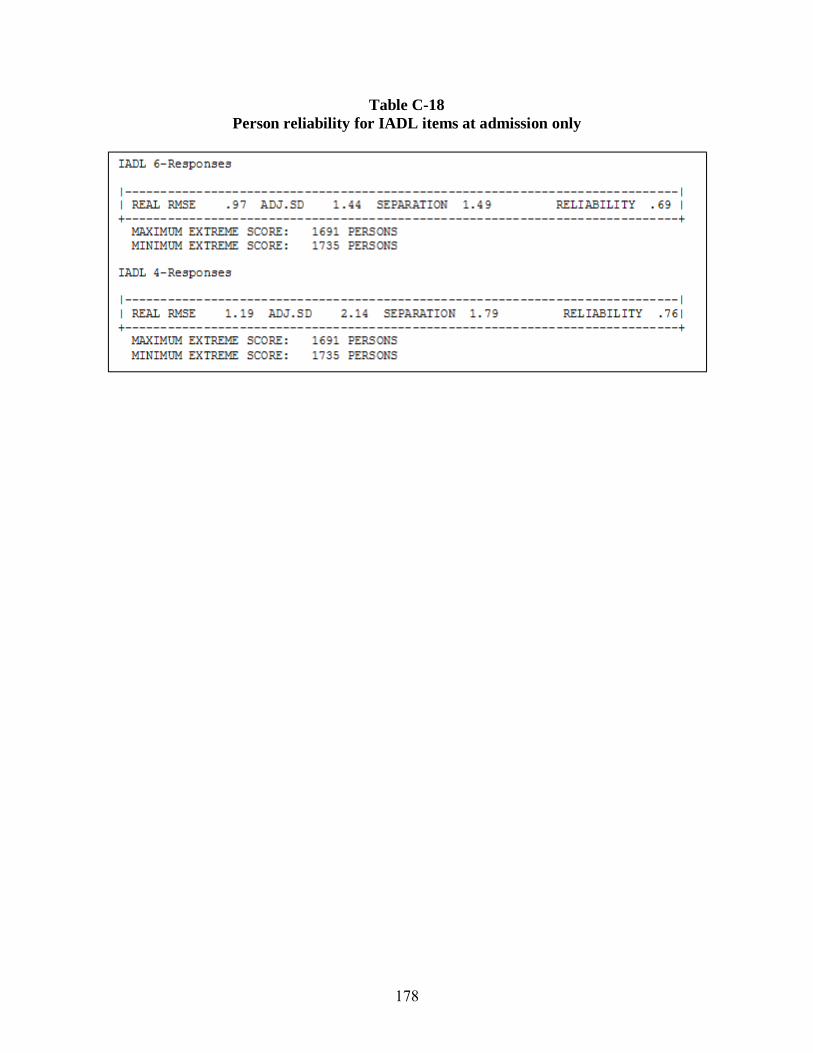
178
Table C-18 Person reliability for IADL items at admission only
Related Documents