ORIGINAL ARTICLE Development and Experimental Validation of a 20K Atlantic Cod (Gadus morhua) Oligonucleotide Microarray Based on a Collection of over 150,000 ESTs Marije Booman & Tudor Borza & Charles Y. Feng & Tiago S. Hori & Brent Higgins & Adrian Culf & Daniel Léger & Ian C. Chute & Anissa Belkaid & Marlies Rise & A. Kurt Gamperl & Sophie Hubert & Jennifer Kimball & Rodney J. Ouellette & Stewart C. Johnson & Sharen Bowman & Matthew L. Rise Received: 27 August 2010 / Accepted: 5 November 2010 / Published online: 3 December 2010 # The Author(s) 2010. This article is published with open access at Springerlink.com. Abstract The collapse of Atlantic cod (Gadus morhua) wild populations strongly impacted the Atlantic cod fishery and led to the development of cod aquaculture. In order to improve aquaculture and broodstock quality, we need to gain knowledge of genes and pathways involved in Atlantic cod responses to pathogens and other stressors. The Atlantic Cod Genomics and Broodstock Development Project has generated over 150,000 expressed sequence tags from 42 cDNA libraries representing various tissues, developmental stages, and stimuli. We used this resource to develop an Atlantic cod oligonucleotide microarray con- taining 20,000 unique probes. Selection of sequences from the full range of cDNA libraries enables application of the microarray for a broad spectrum of Atlantic cod functional genomics studies. We included sequences that were highly abundant in suppression subtractive hybridization (SSH) libraries, which were enriched for transcripts responsive to pathogens or other stressors. These sequences represent genes that potentially play an important role in stress and/or immune responses, making the microarray particularly useful for studies of Atlantic cod gene expression responses to immune stimuli and other stressors. To demonstrate its value, we used the microarray to analyze the Atlantic cod spleen response to stimulation with formalin-killed, atypical Aeromonas salmonicida, resulting in a gene expression profile that indicates a strong innate immune response. These results were further validated by quantitative PCR analysis and comparison to results from previous analysis of an SSH library. This study shows that the Atlantic cod 20K oligonucleotide microarray is a valuable new tool for Atlantic cod functional genomics research. Keywords Atlantic cod . Aquaculture . Microarray . Gene expression profiling Electronic supplementary material The online version of this article (doi:10.1007/s10126-010-9335-6) contains supplementary material, which is available to authorized users. M. Booman : C. Y. Feng : T. S. Hori : M. Rise : A. K. Gamperl : M. L. Rise Ocean Sciences Centre, Memorial University of Newfoundland, 1 Marine Lab Road, St. John’s, NL, Canada A1C 5S7 T. Borza : B. Higgins : M. Rise : S. Hubert : S. Bowman Genome Atlantic, 1721 Lower Water Street, Halifax, NS, Canada B3J 1S5 A. Culf : D. Léger : I. C. Chute : A. Belkaid : R. J. Ouellette Atlantic Microarray Facility, Atlantic Cancer Research Institute, 35 Providence Street, Moncton, NB, Canada E1C 8X3 J. Kimball NRC Institute for Marine Biosciences, 1411 Oxford Street, Halifax, NS, Canada B3H 3Z1 S. C. Johnson Pacific Biological Station, Fisheries and Oceans Canada, Nanaimo, BC, Canada V9T 6N7 M. L. Rise (*) Canada Research Chair (Tier 2) in Marine Biotechnology, Ocean Sciences Centre, Memorial University of Newfoundland, 1 Marine Lab Road, St. John’s, NL, Canada A1C 5S7 e-mail: [email protected] Mar Biotechnol (2011) 13:733–750 DOI 10.1007/s10126-010-9335-6

Welcome message from author
This document is posted to help you gain knowledge. Please leave a comment to let me know what you think about it! Share it to your friends and learn new things together.
Transcript

ORIGINAL ARTICLE
Development and Experimental Validation of a 20K AtlanticCod (Gadus morhua) Oligonucleotide Microarray Basedon a Collection of over 150,000 ESTs
Marije Booman & Tudor Borza & Charles Y. Feng & Tiago S. Hori & Brent Higgins &
Adrian Culf & Daniel Léger & Ian C. Chute & Anissa Belkaid & Marlies Rise &
A. Kurt Gamperl & Sophie Hubert & Jennifer Kimball & Rodney J. Ouellette &
Stewart C. Johnson & Sharen Bowman & Matthew L. Rise
Received: 27 August 2010 /Accepted: 5 November 2010 /Published online: 3 December 2010# The Author(s) 2010. This article is published with open access at Springerlink.com.
Abstract The collapse of Atlantic cod (Gadus morhua)wild populations strongly impacted the Atlantic cod fisheryand led to the development of cod aquaculture. In order toimprove aquaculture and broodstock quality, we need togain knowledge of genes and pathways involved in Atlanticcod responses to pathogens and other stressors. TheAtlantic Cod Genomics and Broodstock DevelopmentProject has generated over 150,000 expressed sequencetags from 42 cDNA libraries representing various tissues,developmental stages, and stimuli. We used this resource todevelop an Atlantic cod oligonucleotide microarray con-taining 20,000 unique probes. Selection of sequences fromthe full range of cDNA libraries enables application of themicroarray for a broad spectrum of Atlantic cod functionalgenomics studies. We included sequences that were highlyabundant in suppression subtractive hybridization (SSH)libraries, which were enriched for transcripts responsive to
pathogens or other stressors. These sequences representgenes that potentially play an important role in stress and/orimmune responses, making the microarray particularlyuseful for studies of Atlantic cod gene expression responsesto immune stimuli and other stressors. To demonstrate itsvalue, we used the microarray to analyze the Atlantic codspleen response to stimulation with formalin-killed, atypicalAeromonas salmonicida, resulting in a gene expressionprofile that indicates a strong innate immune response.These results were further validated by quantitative PCRanalysis and comparison to results from previous analysisof an SSH library. This study shows that the Atlantic cod20K oligonucleotide microarray is a valuable new tool forAtlantic cod functional genomics research.
Keywords Atlantic cod . Aquaculture . Microarray . Geneexpression profiling
Electronic supplementary material The online version of this article(doi:10.1007/s10126-010-9335-6) contains supplementary material,which is available to authorized users.
M. Booman : C. Y. Feng : T. S. Hori :M. Rise :A. K. Gamperl :M. L. RiseOcean Sciences Centre, Memorial University of Newfoundland,1 Marine Lab Road,St. John’s, NL, Canada A1C 5S7
T. Borza : B. Higgins :M. Rise : S. Hubert : S. BowmanGenome Atlantic,1721 Lower Water Street,Halifax, NS, Canada B3J 1S5
A. Culf :D. Léger : I. C. Chute :A. Belkaid : R. J. OuelletteAtlantic Microarray Facility, Atlantic CancerResearch Institute,35 Providence Street,Moncton, NB, Canada E1C 8X3
J. KimballNRC Institute for Marine Biosciences,1411 Oxford Street,Halifax, NS, Canada B3H 3Z1
S. C. JohnsonPacific Biological Station, Fisheries and Oceans Canada,Nanaimo, BC, Canada V9T 6N7
M. L. Rise (*)Canada Research Chair (Tier 2) in Marine Biotechnology,Ocean Sciences Centre,Memorial University of Newfoundland,1 Marine Lab Road,St. John’s, NL, Canada A1C 5S7e-mail: [email protected]
Mar Biotechnol (2011) 13:733–750DOI 10.1007/s10126-010-9335-6
Introduction
The collapse of wild populations of Atlantic cod (Gadusmorhua) has had a large impact on the cod fishery, whichhas historically been an important industry in severalcountries including Canada and Norway. To allow wildcod stocks to recover while still satisfying consumerdemands, Atlantic cod aquaculture is an important alterna-tive to wild fishery. However, attempts at commercial-scalecod aquaculture have not been fully successful and arehampered by slow growth, early maturation (Hansen et al.2001), infectious diseases (Samuelsen et al. 2006), andstress associated with handling (Brown et al. 2003) andwith fluctuating temperatures in sea cages (Gollock et al.2006). In order to solve these problems, we need to learnmore about cod biology, especially the response to stressand pathogens as the high-density of fish populations inaquaculture makes them more prone to exposure to thesefactors.
Atlantic cod has a peculiar immune system compared toother teleosts (reviewed in Pilstrom et al. 2005; Samuelsenet al. 2006; Solem and Stenvik 2006). Specific antibodyresponses to pathogens are weak or absent, althoughAtlantic cod does respond to vaccination (Gudmundsdóttiret al. 2009; Lund et al. 2006, 2007). Atlantic cod has arelatively high level of natural antibodies with a broadspecificity and an affinity at least comparable to that ofacquired antibodies, which might play an important role inthe immune response (Magnadottir et al. 2009). Comparedto other teleost species, Atlantic cod express an exception-ally high number of MH class I genes (Miller et al. 2002;Persson et al. 1999). However, despite significant efforts,MH class II sequences have not yet been identified inAtlantic cod. Further studies of the genes, proteins, cells,and molecular pathways involved in Atlantic cod immuneresponses will greatly benefit from large-scale genomicsprojects that are currently being conducted on this species.By understanding the genes and pathways involved inAtlantic cod responses to pathogens and other stressors, wewill gain valuable knowledge to use in the management ofAtlantic cod aquaculture and to improve broodstock quality.
The Atlantic Cod Genomics and Broodstock DevelopmentProject (CGP, www.codgene.ca) aims to provide genomictools that can be used to increase our understanding of codbiology and to identify molecular markers for the selectionof broodstock with favorable commercial phenotypes (suchas rapid growth characteristics and resistance to stress anddisease). These tools will also be useful in the developmentof new vaccines and therapeutics against the pathogens thatthreaten Atlantic cod aquaculture. As part of the CGP, wehave previously used suppression subtractive hybridization(SSH) cDNA library construction, and sequencing andquantitative reverse transcription–polymerase chain reaction
(QPCR) analysis of SSH-identified transcripts, to study geneexpression responses of Atlantic cod to different stimuli suchas heat stress (Hori et al. 2010; Pérez-Casanova et al. 2008),subclinical high nodavirus carrier state (Rise et al. 2008,2010), and intraperitoneal (IP) injection of viral mimicpolyriboinosinic polyribocytidylic acid [poly(I:C)] (Riseet al. 2008, 2010) or formalin-killed, atypical Aeromonassalmonicida (Feng et al. 2009). In total, the CGP created42 SSH and normalized cDNA libraries and generatedover 150,000 expressed sequence tags (ESTs; Bowman etal. 2010).
Aquaculture-relevant genomics research has benefittedgreatly from the development of microarray platforms for avariety of teleost species (reviewed in Rise et al. 2009). ForAtlantic cod, only two microarray platforms have beenpublished to date. The small-scale CodStress microarraycontains 746 ESTs (Lie et al. 2009) that were selected fromfour cDNA libraries constructed from tissues of Atlanticcod that were exposed to toxicants, and this microarray wasdesigned for use as a diagnostic tool in ecotoxicologystudies. The IMR 16K cDNA microarray (Edvardsen et al.2010) contains 16,384 sequences that were selected from arelatively small set of ~44,000 ESTs from 20 un-normalizedcDNA libraries.
Here, we describe the development of a large-scalemicroarray platform, the Atlantic cod oligonucleotidemicroarray containing 20,000 elements (20K), based onthe EST resources that were generated by the CGPcontaining over 150,000 ESTs from 42 cDNA libraries,representing multiple tissues, developmental stages, andstimuli (Bowman et al. 2010). To test the newly developedmicroarray platform, we used it in a study of the spleentranscriptome response to IP injection with formalin-killed,atypical A. salmonicida using the same samples as werepreviously used in our SSH study (Feng et al. 2009).Results from the current microarray study were validated byQPCR assays, by comparing them to results from the SSHstudy (Feng et al. 2009), and by functional analysis of theresulting informative gene list. This study shows that theAtlantic cod 20K oligonucleotide microarray is a valuablenew tool for Atlantic cod functional genomics research.
Materials and Methods
EST Clustering and the Selection of RepresentativeSequences for Microarray Probe Design
The CGP has generated a database of 158,877 Atlantic codESTs from 23 normalized cDNA libraries and 19 SSHcDNA libraries, representing a variety of tissue types,developmental stages, and stimuli (Bowman et al. 2010).The SSH libraries were constructed using tissues from fish
734 Mar Biotechnol (2011) 13:733–750
stimulated with IP-injected formalin-killed, atypical A.salmonicida (Feng et al. 2009), IP-injected viral mimicpoly(I:C) (Rise et al. 2008, 2010), or heat stress (Hori et al.2010). The “All Version 2.0” sequence set consists of allESTs from the CGP database that passed screening criteriaof Paracel Transcript Assembler (PTA; Paracel Inc.,Pasadena, CA), and this set of 154,142 ESTs was clusteredand assembled using PTA as described by Bowman et al.(2010). Our use of the terms “cluster,” “contig,” “cluster-singleton,” and “singleton” is based on the PTA procedure.During the clustering process, PTA starts by placing eachEST in its own unique cluster. Then, a pairwise comparisonis performed between each EST and all other ESTs todetermine which pairs of sequences are similar. PTA thenconsiders all pairwise comparison hits (i.e., sequences thatwere found to be similar) and merges the two sequencesthat generated the hit into one cluster. PTA then continuesby iterating through the pairwise comparison hits, each timemerging the two clusters that contain the two sequences thatgenerated a hit. By the end of this clustering process, someclusters will contain multiple ESTs, while others will onlycontain one EST. These latter sequences are no longercalled “clusters” but are defined as “singletons,” i.e., ESTsthat did not show sequence similarity to any other ESTs.For the subsequent assembly procedure, each cluster isprocessed separately and PTA assembles the ESTs withineach cluster into one or more contiguous sequences(contigs). During this process, it might not be able toassemble all ESTs from a cluster into a contig. The singleESTs that were clustered (i.e., showed sequence similarityto other ESTs) but are not part of a contig are defined as“cluster-singletons.” “Clusters” are thus defined as groupsof ESTs that show sequence similarity and that can formone or multiple contigs, or remain as “cluster-singletons.”
Clustering and assembly of the 154,142 ESTs resulted in51,814 putative transcripts corresponding to 23,838 contigsand 27,976 singletons (Bowman et al. 2010). From thiscollection of 51,814 putative transcripts, a selection wasmade of candidate sequences for probe design.
To reduce redundancy, multiple contigs from the samecluster were only selected if they showed <60% identityover their entire length, and cluster-singletons withincontig-containing clusters were discarded. For those clus-ters containing only cluster-singletons, the longest cluster-singleton within the cluster was selected. This screeningstep allowed for the selection of one or a few representativecontigs or cluster-singletons from each cluster and, alongwith non-clustered singletons, produced a total number of39,247 unique candidate sequences. For this microarray,oligonucleotide probes would be designed in sense (5′–3′)orientation, which requires that the orientation of selectedsequences is known. For sequences from normalizedlibraries, which were generated using directional cloning
(Bowman et al. 2010), the orientation could be inferred;however, for sequences from SSH libraries, which weregenerated using non-directional TA cloning (Feng et al.2009; Hori et al. 2010; Rise et al. 2008, 2010), this was notpossible since the orientation of inserts was unknown. Inorder to design probes with a proper 5′–3′ orientation, theorientation of all candidate sequences was checked in twosteps. In the first step, a BLASTX search was performedagainst GenBank database release 165.0; all sequenceshaving significant BLASTX hits (E value <10−5) in theopposite orientation were reversed and complemented. Inthe second step, sequences lacking significant BLASTXhits were reversed and complemented, when necessary,based on directional cloning information. Candidatesequences were thus divided into two categories: 34,355“known orientation” candidate sequences with known orinferred orientation (determined by BLASTX alignmentand/or directional cloning information) and 4,892 “un-known orientation” candidate sequences (i.e., sequencesoriginating from SSH libraries without significant BLASThits). Based on homology search in UniRef90 (UniProt), nr(NCBI), Kyoto Encyclopedia of Genes and Genomes,Clusters of Orthologous Groups, Protein Families, LargeSubunit Ribosomal RNA, and Small Subunit RibosomalRNA databases using AutoFACT (Koski et al. 2005), thecategory of 34,355 “known orientation” candidate sequenceswas split further into three groups: 11,152 “annotated”sequences showing significant homology (bit score >40) tosequences with functional annotation; 2,861 “unassigned”sequences showing significant homology to sequences withnon-informative annotation, i.e., to sequences correspondingto proteins with unknown function; and 20,342 “unclassi-fied” sequences showing no significant homology to anysequences in these databases. A schematic representation ofthe complete selection process is given in Fig. 1.
In addition to the four sequence categories describedabove (“annotated,” “unassigned,” “unclassified,” and“unknown orientation”), a fifth category of 58 “custom”sequences was chosen based on gene function. Thesesequences originated from CGP and included hemoglobingenes (Borza et al. 2009), CC chemokines (Borza et al.2010), and genes involved in immune-relevant signalingpathways such as the RIG-I-like receptor signalingpathway, Toll-like receptor signaling, and interferonstimulation.
Oligonucleotide Probe Design
The design of 50-mer oligonucleotide probes wasperformed separately on each of the five sequencecategories using ArrayDesigner version 4.2 (PremierBiosoft International, Palo Alto, CA) with the followingrelevant parameters: melting temperature, 72±5°C;
Mar Biotechnol (2011) 13:733–750 735

length, 50 nucleotides; position from the 3′ end:anywhere (for “annotated,” “unassigned,” and “custom”sequences) or 500 (for “unclassified” and “non-directed”sequences); hairpin dG, −6.0; dimer dG, −8.0; run/repeat,5 max; word size, 15; BLASTN-DUST filtering: on;avoid homology: checked. Using these parameters, goodprobes could be designed for 25,695 “known orientation”and 2,695 “unknown orientation” sequences (ElectronicSupplementary Material (ESM) Fig. S1). However, morethan 60% of the “known orientation” sequences wererepresented by “unclassified” sequences, i.e., by sequen-ces for which the homology search failed to reveal anyrelevant hits in databases. In order to maximize thenumber of probes designed from “annotated” and “unas-signed” sequences, a second pass of probe design wascarried out with sequences from these two categories thatwere rejected in the first pass; in this second pass,homology was allowed to occur among probes. Thesecond pass produced good probes for 1,956 “annotated”and “unassigned” sequences. Probes from both designsteps were checked by reciprocal BLASTN search toremove highly homologous probes. All probes were alsochecked for the presence of simple sequence repeats usingTandemRepeat Finder (Benson 1999) and two online versionsof Repeat Masker (http://lucy.ceh.uvic.ca/repeatmasker/cbr_repeatmasker.py; http://www.repeatmasker.org/cgi-bin/WEBRepeatMasker); the probes identified as having repeatedsequences or harboring low complexity regions were replacedwith non-repetitive probes designed from the same transcriptwhere possible. Finally, all probes having homologues indatabases were checked for correct 5′ to 3′ orientation byrunning BLAST searches against GenBank database release168.0 for confirmation purposes.
For the “annotated,” “unassigned,” and “custom”sequences, the selection process was now complete,resulting in 10,318 probes from the “annotated” sequences,2,625 from the “unassigned” sequences, and 202 from the“custom” sequences. For the “unclassified” sequences, anadditional selection step followed based on the number ofESTs contributing to each contig sequence, resulting in6,397 probes from the “unclassified” sequences (5,953 withthree or more ESTs per contig, 444 with two ESTs percontig). For the “unknown orientation” sequences, anadditional selection step followed based on the abundancein SSH libraries and predicted roles in the immune andstress responses, resulting in 458 probes (one sense and oneantisense for each of 229 selected sequences) from the“unknown orientation” sequences. Only one probe percandidate sequence was included for all categories ofsequences, except for the “custom” sequences where twoor more probes per candidate sequence were included. Thetotal number of designed oligonucleotide probes was20,000.
Oligonucleotide Synthesis and Microarray Production
Oligonucleotide probes were synthesized by the phosphor-amidite method at a 1-nmol scale and desalted (IntegratedDNA Technologies, Coralville, IA). Isolated DNA wasanalyzed by matrix-assisted laser desorption/ionization–time of flight mass spectrometry. DNA of low quality wasresynthesized. In addition to the 20,000 specific probesdescribed above, the following positive and negativecontrol features were included: cod actin oligo (192 spots),human actin oligo (192 spots), SpotReport Alien Oligos(nos. 4, 6, 7, and 8; Stratagene, La Jolla, CA; 96 spots
Fig. 1 Sequence selection and probe design. Flowchart of theprocedure of selection of representative candidate sequences andprobe design. In this flowchart, arrowheads indicate a reduction in thenumber of sequences. The gray bar indicates the probe designprocess. Asterisks indicate an additional probe selection procedure
based on the number of ESTs contributing to each contig sequence(for probes from “unclassified” sequences) or on the abundance inSSH libraries and predicted roles in immune and stress responses (forprobes from “unknown orientation” sequences). For more details on theprobe design process, see “Materials and Methods” and ESM Fig. S1
736 Mar Biotechnol (2011) 13:733–750
each), and buffer-only spots (704 spots). Probes wereresuspended in sodium phosphate buffer (Schott-NexterionSpot; Schott, Louisville, KY), to a final concentration of30 μM, in Genetix X7020 384-well plates (Genetics, Boston,MA) using a Janus liquid-handling robot (PerkinElmer,Waltham, MA) and spotted in duplicate on epoxy microarrayslides (Schott-Nexterion Slide E) using an OmniGrid 100microarrayer (Genomic Solutions, Ann Arbor, MI) equippedwith SMT-S50 silicon print pins (Parallel Synthesis Technol-ogies, Santa Clara, CA). The microarray contains 41,472features (i.e., 20,000 specific probes spotted in duplicate and1,472 control spots) spotted in 48 blocks of 29 rows and 30columns each (the last row of each block contains only 24features). Microarrays were produced at the Atlantic Micro-array Facility of the Atlantic Cancer Research Institute(ACRI, Moncton, NB).
Two microarrays of each print batch were analyzed by saltreflection scan and by hybridization with Cy3 SpotQCDetector Oligo (Integrated DNA Technologies) and subse-quent scanning on an Axon GenePix 4200AL scanner(Molecular Devices, Sunnyvale, CA) for any defects thatmay have occurred in spotting. Before use, microarrays werestored at room temperature in vacuum-sealed microarraypouches (Corning, Corning, NY).
The microarray platform is available in the NCBI GeneExpression Omnibus (GEO) under accession no.GPL10532. The annotation file for the probes on themicroarray is available as ESM Table S1.
Bacterial Antigen Stimulation and Tissue SampleCollection
The spleen tissue samples used for the microarray studywere part of a larger study on Atlantic cod immuneresponse to bacterial antigens, and study setup, bacterialantigen preparation, bacterial antigen stimulation, and tissuecollection have been described previously (Feng et al.2009). In short, 150 juvenile, healthy-appearing Atlanticcod from a single family were divided over three tankscorresponding to three treatments. At the pre-injection timepoint (0 h), eight individuals were sampled from each tank,euthanized, and spleens and brains collected in RNAse-free1.5-ml tubes and flash-frozen in liquid nitrogen and storedat −80°C until RNA extraction. The remaining individualsreceived one of three treatments: IP injection of 100 μlsterile phosphate-buffered saline (PBS; PBS group), IPinjection of 100 μl formalin-killed, atypical A. salmonicida(referred to as Asal) in PBS (Asal group), or no handling atall (undisturbed control group). At 2, 6, 24, and 72 h post-injection (HPI) and 1 week post-injection, eight individualswere sampled from each tank, euthanized, and spleens andbrains collected as described for the 0 h individuals. Thecurrent study used spleen tissues from PBS and Asal fish
from 0 h and 24 HPI time points for microarray and QPCR;spleen tissues from undisturbed control fish from all timepoints were used for the microarray common referencesample (ESM Fig. S2). Immune stimulation and samplingof the fish were carried out in accordance with an AnimalCare Utilization Protocol issued by Memorial University ofNewfoundland’s Animal Care Committee.
Nodavirus Testing
To determine if any individuals were asymptomatic carriersof nodavirus, an RT-PCR test was conducted. For eachindividual, 1 μg of DNAse-I-treated, column-purified totalRNA from brain tissue was reverse-transcribed using theMoloney murine leukemia virus reverse transcriptase andrandom hexamers (Invitrogen, Burlington, ON) at 37°C for50 min. PCR reactions contained 1 U of DyNAzyme EXTDNA polymerase (MJ Research, Waltham, MA), 1XDyNAzyme EXT Buffer, 0.2 mM dNTPs, 4 μl of 10xdiluted cDNA (corresponding to 20 ng of input total RNA),and 0.2 μM each of nodavirus-specific primers AC2F1 (5′-GTGGTTACGTGGCTGGCTTC-3′) and AC2R4 (5′-GTTCTGCTTTCCCACCATTTG-3′). PCR cycling condi-tions consisted of 40 cycles of (94°C for 30 s, 61°C for30 s, and 72°C for 10 s). For each of the 50 μl PCRreactions, 5.5 μl of 10X Blue juice (Invitrogen) wasadded, and 15 μl of this mixture was resolved on 1.5%agarose gels using a 100-bp ladder (Invitrogen) as amarker. Gels were photographed under UV light usingG:BOX and GeneSnap software (Syngene, Frederick,MD), and the intensities of the bands from the PCRproducts were quantified as a measure of carrier stateusing GeneTools (Syngene). Mean pixel intensity back-ground levels, as measured in the lane where the “notemplate control” PCR product was loaded, were 5,456.Individuals with mean pixel intensities between 5,200and 7,310 (no band or very low-intensity bands) wereclassified as “no/low nodavirus carrier” and individualswith pixel intensities above 11,130 (high-intensity,clearly visible bands) were classified as “high nodaviruscarrier” as described previously (Rise et al. 2010; ESMFig. S3).
RNA Extraction
Total RNA extraction was described in detail in Feng et al.(2009). Briefly, total RNA was extracted from spleen tissuesamples from individual fish using TRIzol reagent (Invitro-gen) according to the manufacturer’s instructions. TotalRNA was treated with DNAse I (RNAse-Free DNAse Set;Qiagen, Valencia, CA) and column-purified using theRNeasy MinElute Cleanup kit (Qiagen) according to themanufacturer’s instructions. Quality and quantity of isolated
Mar Biotechnol (2011) 13:733–750 737

total RNA samples were assessed by agarose gel electro-phoresis and NanoDrop spectrophotometry.
Microarray Hybridization
Spleen DNAse-treated and column-purified total RNAsamples from six individual fish each from the PBS 0 h,PBS 24 HPI, Asal 0 h, and Asal 24 HPI groups wereused for microarray analysis (ESM Fig. S3). SpleenDNAse-treated and column-purified total RNA samplesfrom 31 “undisturbed control” fish from all time pointswere pooled (with each individual contributing an equalamount of RNA) and used as common reference. For eachindividual sample, 5 μg of total RNA was labeled withAlexaFluor 647 using the Invitrogen SuperScript DirectcDNA Labeling kit according to the manufacturer’sprotocol (Invitrogen). For the pooled common reference,5 μg of total RNA was labeled with AlexaFluor 555 usingthe same protocol. Formamide-based hybridization buffer(2x concentrated) and LNA dT blocker (Genisphere,Hatfield, PA) were added to purified, labeled cDNA, andon each microarray, an experimental sample was co-hybridized with the common reference using LifterSlips(Thermo Scientific, Waltham, MA). Hybridizations wereperformed overnight (~16 h) at 42°C. Detailed protocolsfor slide pre-hybridization, hybridization, and washing aredescribed in ESM Methods S1.
Microarray Data Acquisition
Tiff images containing fluorescence data were obtainedusing a ScanArray Gx Plus scanner and ScanExpress v4.0(Perkin Elmer), and signal intensity data were extractedusing Imagene v7.5 (Biodiscovery, El Segundo, CA).Using R and Bioconductor package marray, control spotsand flagged spots were removed and data were log2-transformed and Loess-normalized per subgrid. Rawsignal cutoff levels per microarray per channel werecalculated as the average of the median backgroundsignal+2 standard deviations, and data were thresholdedby replacing normalized log ratios of spots with rawsignal values below cutoff with “NA.” Normalized logratios of flagged spots were also replaced with “NA.”Normalized log ratios from duplicate probes were aver-aged. The final normalized, thresholded, and averageddataset contains 20,000 probes. Detailed protocols includ-ing the R scripts for these procedures are available inESM Methods S2. This microarray dataset is described inGEO series GSE22312, and individual sample processedand raw data are available under GEO accession nos.GSM555358–GS555380.
Microarray Data Analysis
Before further data analysis, all probes that were absentin more than 25% of all microarrays were discarded fromthe dataset, leaving a final dataset of 15,429 probes.Two-class comparison analysis was performed using theSignificance Analysis of Microarrays (SAM) algorithm(Tusher et al. 2001) as implemented in the Bioconductorpackage siggenes (Schwender et al. 2006). First, missingvalues were imputed using the EM_array method from theLSimpute package (Bø et al. 2004; Celton et al. 2010).After running SAM, a false discovery rate (FDR) cutoff of0.01 was used to determine significant differentiallyexpressed genes. An additional analysis was performedusing a less stringent FDR cutoff of 0.05; results from thisanalysis are not discussed (they are available as ESMTable S2), but three genes were selected from this list forQPCR analysis (Table 1). Detailed protocols including theR scripts for these procedures are available in ESMMethods S3. In Genesis (Sturn et al. 2002), the data wereclustered using Pearson uncentered correlation and com-plete linkage hierarchical clustering.
A final gene list of 82 probes responsive to Asal wasmanually annotated by comparing the full sequences that theprobes were representing against the nr database from NCBIusing BLASTX and by choosing the most significant (bitscore >40, E value <10−4) hit with an informative description.Gene Ontology (GO) annotation was added to the gene listby choosing the most significant (bit score >40) human ormouse hit with a reviewed UniProt entry. That UniProtaccession number was used to query QuickGO for theassociated GO Biological Process entries.
Quantitative RT-PCR Analysis
Fifteen genes were selected for QPCR analysis. For fourgenes (HAMP, CAMP, GmSCYA123, and IL8), primerswere designed and tested and QPCR analysis wasperformed previously (Feng et al. 2009). Because theQPCR analysis for these four genes was previouslyperformed on a different real-time instrument and usingtechnical duplicates instead of technical triplicates, thesefour genes were reanalyzed in the current study using thereal-time instrument and protocol described here. For theremaining 11 genes, QPCR primers were designed from thesequences that were used to design the microarray probes(Table 1) using the Primer 3 program (http://frodo.wi.mit.edu). Prior to QPCR analysis, a quality control procedurewas performed for all newly designed primer pairs. Theywere first tested using a no reverse transcription control astemplate, for which none of the selected primer pairs
738 Mar Biotechnol (2011) 13:733–750

showed detectable amplification. Each primer pair wasfurther tested using a five-point 5x dilution series of cDNAfrom pooled Asal 24 HPI samples as template. Primer pairsshowed a single peak in the dissociation curve and had noamplification in no-template controls. Amplification effi-ciencies were determined and are listed in Table 1.Ribosomal RNA 18S was chosen as a normalizer gene,and its amplification efficiency and suitability as anormalizer has been determined previously (Rise et al.2008). Seven fish each from the PBS 0 h, PBS 24 HPI, andAsal 0 h groups and eight fish from the Asal 24 HPI groupwere used in the QPCR study (ESM Fig. S3). For each
sample, 1 μg of column-purified, DNAse-treated total RNAwas reverse-transcribed as described in Rise et al. (2008).PCR amplification was performed using Power SYBRGreen chemistry and a 7500 Fast Real-Time PCR machine(Applied Biosystems, Foster City, CA) in a total reactionvolume of 13 μl containing 1 μl of cDNA (correspondingto 10 ng of input total RNA), 50 nM each of forward andreverse primers, and 1x PowerSYBR mastermix (AppliedBiosystems). The PCR program consisted of one cycle of50°C for 2 min, one cycle of 95°C for 10 min, followed by 40cycles of 95°C for 15 s and 60°C for 1 min, with datacollection after each 60°C step. For each sample, the gene of
Table 1 QPCR primers
Gene Probe name Sequence 5′–3′ R2 Efficiency (%) Amplicon size (bp)
CAMPa all_v2.0.1631.C1 Forward ATTGCAATTTCACCCTGAGC 0.999 94 118Reverse CCAGACCTGCTCCTTCTCAC
GmSCYA123a EX175275_probe3 Forward CTCAAACCTCTGCATCGTCA 0.997 96 188Reverse CACGGAGAGGTAAGCAGCTC
HAMPa all_v2.0.796.C2 Forward CCACAGGCTCCTCTCAAGTC 0.988 89 146Reverse CTGCAACTGCAATGCTGAAT
IL8a all_v2.0.37.C2 Forward CCAATCTGACGGCTCTCTGT 0.990 103 116Reverse ATCGGCTCCCTACTGGTTCT
C1S sb_gmnlsfas_0002o02.t7 Forward TCACTGACCGTTGAGACTCG 0.999 100 134Reverse CCATTGTTGGAGCCGTAGTT
CEBPB2 all_v2.0.3759.C1 Forward ACTCCGCAACCTGCTCTCT 0.995 99 183Reverse GGTGATGGCTGTTTTCACCT
CTSL all_v2.0.8187.C1 Forward CTACGAGGCTGAGGATGGAC 0.999 99 109Reverse GGCCTTCTGTAGGGCTTTCT
SDF1 all_v2.0.9962.C1 Forward GCGCAGACATGGATATGAAA 0.999 95 115Reverse GAGCGGCAGTAGCATCTCTC
all_v2.0.2958.C1 all_v2.0.2958.C1 Forward CCCAAAAAGGTCTTTGGTCA 0.989 105 140Reverse CTCCCCAAGCACATTTAACC
all_v2.0.6615.C2 all_v2.0.6615.C2 Forward ACGCTGGGAAAATGAATCAC 0.993 89 176Reverse TGAAACCTTATTGCCGGTTC
BPI/LBP all_v2.0.992.C2 Forward TCGGATCCCTTAGCAACATC 0.998 100 134Reverse GATTTGCAGCTGGGTGTTTT
IIGP_b all_v2.0.3462.C1 Forward ACGACACAATGAGTGCCAAG 0.999 97 126Reverse TTCCTGCTCCACACTCTCCT
CYBB all_v2.0.1278.C1 Forward TTGTGTAGCGTGTCGTTGAA 0.995 94 131Reverse GGAAACTGAAACGCAAAAGC
GmSCYA104 EX731124_probe1 Forward GATCCGAGGGTCACTGAATG 0.991 90 104Reverse GCATTGACGCAGGGATAGTT
IIGP_a all_v2.0.13188.C1 Forward TACTGGTGTGGTGGAAACGA 0.998 96 106Reverse TGAGAATGTGGTGGTTCCAA
18Sb Forward ATGGCCGTTCTTAGTTGGTG 0.990 109 180Reverse GGACATTTAAGGGCGTCTCA
Genes in bold were shown to be Asal-responsive in SSH analysis (Feng et al. 2009). Genes in italics were chosen from the less stringent (FDRcutoff 0.05) gene list (ESM Table S2)a Primers for these genes were designed and tested previously (Feng et al. 2009)b Primers for 18S ribosomal RNA were designed and tested previously (Rise et al. 2008)
Mar Biotechnol (2011) 13:733–750 739
interest and the normalizer gene were run on the same platein triplicate. ABI 7500 software v2.0 (Applied Biosystems)was used to automatically determine baseline and thresholdsettings, except for 18S and interferon-inducible GTPase_bfor which the baseline was set manually. Threshold cycle(Ct) values were averaged over triplicates, and for each genethe relative quantity (RQ) values were calculated using themethod described by Pfaffl (2001) using the individual withlowest RQ for that gene as calibrator to avoid RQ valueslower than 1. When the standard deviation of triplicates washigher than 0.5, Dixon’s Q test (Rorabacher 1991) was usedto determine if there was an outlier within the triplicate (at aconfidence level of 95%). If an outlier was detected, it wasdiscarded and the average Ct was calculated using theremaining two Ct values. If no outlier was detected, allthree Ct values were discarded. For one of the genes(interferon-inducible GTPase_b), Ct values could not bedetected in all samples due to extremely low or absenttranscript levels in some individuals. To enable statisticalanalysis of this gene, all samples without detectable Ctvalues were assigned a Ct value of 39.01, which corre-sponds to the highest detectable Ct value among theremaining samples for that gene.
Gene expression differences between treatments withineach time point, and between time points within eachtreatment, were determined by t tests on RQ values usingSYSTAT 12.0 with a p value cutoff of 0.05.
Results
Microarray Design
Sequences to be represented on the microarray wereselected from the CGP EST sequence set All Version 2.0,which contains 154,142 ESTs that were assembled into23,838 contigs and 27,976 singletons for a total of 51,814putative transcripts (Bowman et al. 2010; Fig. 1). Since thenumber of assembled sequences was significantly higherthan the 20,000 unique Atlantic cod probes that ourmicroarray layout design was based on, a selectionprocedure was designed to reduce the number of sequencesthat exhibit high homology to each other, to maximize thenumber of sequences that have functional annotation, andto minimize the number of sequences for which homologysearch in public databases failed to reveal any significanthits (using AutoFACT with a bit score threshold of 40).These latter sequences, indicated as “unclassified” in Fig. 1,underwent an additional highly stringent selection proce-dure based on the depth of the contig so that no“unclassified” singletons were included on the microarray.We also aimed to minimize the number of sequences withunknown orientation that show no significant homology to
any known sequences (as determined by BLASTX searchusing an E value threshold of 10−5). However, thesesequences all originated from SSH libraries that wereenriched for transcripts responsive to pathogens or otherstressors and so could potentially represent genes that playan important role in stress and/or immune responses.Therefore, we chose to include 229 of the most highlyabundant sequences from this group and designed probes inboth orientations for these sequences. No singletons wereincluded on the microarray unless they had significantsequence homology with an annotated entry in a publicdatabase.
Because the majority of sequences (19,798 of 20,000)were selected from the complete CGP EST database, whichis based on normalized and SSH cDNA libraries from avariety of tissues, developmental stages, and treatments(Bowman et al. 2010), the microarray provides goodcoverage of genes from many pathways including thoseinvolved in stress and immune responses. To ensure theusefulness of the microarray for specific research areas, 58Atlantic cod sequences were manually selected to representgenes of special interest to CGP research. These include 9hemoglobin genes, 18 CC chemokines, and 31 genes fromthree immune-relevant functional groups: interferon-stimulated genes, genes involved in Toll-like receptorsignaling, and genes from the RIG-I-like receptor signalingpathway.
Microarray-Based Gene Expression Analysis
Global gene expression profiles were analyzed using spleenRNA samples from four treatment groups: PBS pre-injection (PBS 0 h), PBS 24 h post-injection (PBS24 HPI), formalin-killed, atypical A. salmonicida pre-injection (Asal 0 h), and formalin-killed, atypical A.salmonicida 24 h post-injection (Asal 24 HPI; ESM Fig.S2). Fish from the PBS groups and Asal groups were keptin separate tanks. For each treatment group, spleen RNAsamples from six fish were analyzed, except from the PBS0 h group where one of the six samples failed due toconsistent low signal intensities on the microarray. RT-PCRwith brain RNA templates and nodavirus-specific primersshowed that some fish involved in this study wereasymptomatic carriers of nodavirus (ESM Fig. S3). Com-parison of global gene expression profiles of asymptomaticnodavirus “high carrier” and “no/low carrier” pre-injection(0 h) spleen samples using SAM, with an FDR cutoff of0.05, showed no significant differences in gene expression(data not shown).
To determine which transcripts were responsive toAsal, we compared the Asal 24 HPI group to both theAsal 0 h group and the PBS 24 HPI group using SAMwith an FDR cutoff of 0.01. Only the genes found to be
740 Mar Biotechnol (2011) 13:733–750

responsive in both comparisons were included in thefinal gene list (Fig. 2). This highly stringent analysis wasemployed to minimize false positives in the final informa-tive gene list.
When comparing the Asal 0 h and Asal 24 HPIgroups, there were 104 differentially expressed probes,all upregulated in response to Asal (Fig. 2 and ESMTable S3). Since the fish in the pre-injection group (Asal0 h) were never handled during the experiment, this list of104 probes represents genes responding to stimulationwith Asal as well as handling, anesthesia, and injectionstress. We sought to identify genes responding only tohandling and injection stress by comparing PBS 0 h andPBS 24 HPI groups, but no significant differences werefound. In conclusion, all 104 probes were responsive tostimulation with Asal when comparing Asal 0 h and Asal24 HPI groups.
When comparing the two post-injection groups, PBS24 HPI and Asal 24 HPI, we identified 1,313 differentiallyexpressed probes, of which 1,012 were upregulated and 301were downregulated in response to Asal (Fig. 2 and ESMTable S4). Since the “PBS fish” and “Asal fish” were heldin two separate tanks, this list of 1,313 probes representsgenes responding to stimulation with Asal and/or differ-ences between tanks. The genes that were associated withdifferences between tanks were determined by comparingthe two pre-injection groups PBS 0 h and Asal 0 h,resulting in 31 informative probes, of which 12 were alsopresent in the list of 1,313 probes from the PBS 24 HPI andAsal 24 HPI comparison (Fig. 2 and ESM Table S4). These12 probes that were associated with tank differences wereremoved from the list of 1,313 probes. In conclusion, 1,301probes were responsive to stimulation with Asal when
comparing PBS 24 HPI and Asal 24 HPI groups (indicatedin bold type in ESM Table S4).
The final list consisted of 82 probes that were allsignificantly upregulated in response to Asal in bothcomparisons (Asal 0 h with Asal 24 HPI and PBS 24 HPIwith Asal 24 HPI, i.e., present in both lists of 104 and1,301 probes; Fig. 2). This final list is available as ESMTable S5. The samples and probes were clustered accordingto the expression of these 82 probes using a hierarchicalclustering algorithm (Fig. 3). Clustering shows a cleargeneral distinction between the Asal 24 HPI samples andthe control samples (Asal 0 h, PBS 0 h, and PBS 24 HPI),with the exception of one control sample from the PBS24HPI group that clusters together with the Asal 24 HPIgroup. Within the Asal 24 HPI group, the leftmost sampleclusters away from the other samples in this group andshows a weaker upregulation of gene expression. The list of82 Asal-responsive probes was manually annotated withgene names and GO Biological Process entries usingBLASTX (E value <10−5, bit score >40) and QuickGo(ESM Table S5A). There is some redundancy in annotationof the list and the 82 probes represent 71 unique genes, ofwhich 51 had a gene name annotation (ESM Table S5B).The other 20 were “unclassified” (i.e., had no significanthomology with any sequence in the NCBI nr database).Twenty-seven genes were associated with one or moreBiological Process GO entries. The GO entries that weremost common (i.e., represented by three or more genes)were “proteolysis,” “transport,” “immune response,” and“oxidation reduction” (ESM Table S6). Because the numberof genes with GO annotation was low, a second functionalclassification was made based on information from literature,GO annotation, UniProt, and Entrez Gene databases. If nofunctional information specific for cod or other teleosts wasavailable, information for putative human or mouse orthologswas used. The most abundant categories were “immune,inflammatory and bactericidal response,” “proteolysis,” and“transport.” These categories and the genes associated withthem are listed in Table 2.
QPCR Analysis
To confirm the results of the microarray, 12 genes from the71 unique genes responsive to Asal were chosen for QPCRanalysis (Table 1): cathelicidin (CAMP), CC chemokine“CCL19 group” GmSCYA123, hepcidin (HAMP), comple-ment component 1, s subcomponent (C1S), CCAAT/enhancer-binding protein beta 2 (CEBPB2), cathepsin L(CTSL), stromal cell-derived factor 1 precursor (SDF1),unclassified gene all_v2.0.2958.C1, unclassified geneall_v2.0.6615.C2, bactericidal permeability increasing pro-tein/lipopolysaccharide binding protein variant b (BPI/LBP), interferon-inducible GTPase_b (IIGP_b), and cyto-
Fig. 2 Overview of informative probe lists and their intersections.This figure shows how the final list of 82 probes responsive to Asalwas constructed (gray area). The 12 probes that were responsive tovariability between tanks (from the comparison of PBS 0 h and Asal0 h, left) were removed from the list of probes resulting from thecomparison of PBS 24 HPI with Asal 24 HPI (middle) so that onlyprobes responsive to Asal remained. Then, the final probe list wasconstructed by taking only the 82 probes that were responsive to Asalin both the comparisons of Asal 0 h with Asal 24 HPI (right) and ofPBS 24 HPI with Asal 24 HPI (middle)
Mar Biotechnol (2011) 13:733–750 741

chrome b-245 beta polypeptide (CYBB). Three genes thatwere Asal-responsive in a less stringent analysis (using anFDR cutoff of 0.05 instead of 0.01; ESM Table S2),interleukin 8 (IL8), CC chemokine “fish group”GmSCYA104, and interferon-inducible GTPase_a(IIGP_a), were added to provide further validation of themicroarray results. This makes a total of 15 microarray-
identified genes that were subjected to QPCR. Thirteen ofthose were chosen based on their functional annotationsuggesting a role in the immune or defense response; theremaining two were selected from the “unclassified” genes(all_v2.0.2958.C1 and all_v2.0.6615.C2). Eight of the 15genes we selected that were identified by microarray asAsal-responsive were also identified as Asal-responsive in
Asal 24HPI Controls
* *
36742490195151754467503914570351377397634506848172382314100451903549243863846148444534444842021360905320036354360914446437609526674845147291426773917635750423863861445202363913853747847386184013839869396264084537858405185360438743552084141641428434354197845982471934862050512394344244744463444584446144470444714445444467444654444645561544895214055211455063917352139430803640438591474854912742676363644066041207
Cytochrome b-245, beta polypeptide (chronic granulomatous disease) [Danio rerio]hypothetical protein LOC100194683 [Salmo salar]no significant blastx hitno significant blastx hitno significant blastx hitno significant blastx hitno significant blastx hitNucleoporin GLE1 [Salmo salar]PREDICTED: very large inducible GTPase-1-like [Danio rerio]PREDICTED: very large inducible GTPase-1-like [Danio rerio]Putative transferase C1orf69 homolog, mitochondrial-like [Danio rerio]SH2 domain-containing protein 1B [Homo sapiens]no significant blastx hitno significant blastx hitinterleukin-8 variant 5 [Ictalurus punctatus]PREDICTED: very large inducible GTPase-1-like [Danio rerio]CC chemokine GmSCYA123 (CCL19 group)CC chemokine GmSCYA123 (CCL19 group)Stromal cell-derived factor 1 precursor [Anoplopoma fimbria] (CXCL12)bactericidal permeability increasing protein/lipopolysaccharide binding protein variant b [Gadus morhua]no significant blastx hitcathelicidin 1 [Gadus morhua]bactericidal permeability increasing protein/lipopolysaccharide binding protein variant b [Gadus morhua]CC chemokine GmSCYA123 (CCL19 group)hepcidin precursor [Gadus morhua]no significant blastx hitMetalloreductase STEAP4 [Salmo salar]CD63-like protein [Psetta maxima]transglutaminase [Oreochromis niloticus]muscleblind-like 2 (Drosophila) [Danio rerio]actin [Pyrocystis lunula]Metalloreductase STEAP4 [Salmo salar]interferon stimulated gene 15-2 [Gadus morhua]reverse transcriptase-like protein [Takifugu rubripes]CCAAT/enhancer-binding protein beta 2 [Epinephelus coioides]hypoxanthine phosphoribosyltransferase [Solea senegalensis]FXYD domain containing ion transport regulator 5b [Salmo salar]interferon-inducible GTPase_b [Salmo salar]78 kDa glucose-regulated protein [Salmo salar]pre-B-cell leukemia homeobox 4 [Danio rerio]unknown protein [Siniperca chuatsi]LOC100148704; similar to Poly [ADP-ribose] polymerase 14 (PARP-14) (B aggressive lymphoma protein 2) [Danio rerio]complement component 1, s subcomponent [Xenopus laevis]GTPase activating protein Rap1-GAP [Gallus gallus]no significant blastx hitLAG1 longevity assurance homolog 2 [Osmerus mordax]no significant blastx hitProteasome subunit alpha type-6 [Salmo salar]Proteasome subunit beta type-7 precursor [Esox lucius]novel protein similar to H.sapiens MPEG1, macrophage expressed gene 1 (MPEG1, zgc:110354) [Danio rerio]ribonucleotide reductase M2 b [Danio rerio] (TP53 inducible)Digestive cysteine proteinase 2 precursor [Salmo salar] (cathepsin L-like)SLAM family member 7 [Salmo salar]no significant blastx hitno significant blastx hitnovel protein similar to mucosa associated lymphoid tissue lymphoma translocation gene 1 (malt1) [Danio rerio]syndecan-2 [Danio rerio]CC chemokine GmSCYA109 (Fish group )CC chemokine GmSCYA108 (Fish group )CC chemokine GmSCYA110, 111 (Fish group )CC chemokine GmSCYA108 (Fish group )CC chemokine GmSCYA111 (Fish group )CC chemokine GmSCYA110 (Fish group )CC chemokine GmSCYA112 (Fish group )CC chemokine GmSCYA112 (Fish group )CC chemokine GmSCYA113 (Fish group )no significant blastx hitno significant blastx hitno significant blastx hitno significant blastx hitno significant blastx hitMultiple myeloma tumor-associated protein 2 homolog [Salmo salar]no significant blastx hitPREDICTED: uromodulin-like [Danio rerio]CD63 antigen [Salmo salar]Integrin beta-2 [Salmo salar]FXYD domain containing ion transport regulator 5b [Salmo salar]no significant blastx hittransglutaminase [Oncorhynchus keta]Cathepsin L precursor [Anoplopoma fimbria]cysteine protease [Haemaphysalis longicornis] (cathepsin L-like)vimentin variant 3 [Homo sapiens]
-3.0 1:1 3.0
Fig. 3 Hierarchical clustering of 82 probes that are responsive tostimulation with formalin-killed, atypical A. salmonicida. Samplegroups are indicated at the top. Asal 24 HPI (red); Asal 0 h (green);PBS 0 h (blue); PBS 24 HPI (yellow). Two outlier individuals are
indicated with an asterisk. Probe ID and description are indicated onthe right side. Two gene clusters have been highlighted (see“Discussion”): antimicrobial genes (blue); CC chemokines (orange).A larger version of this image is available as ESM Fig. S5
742 Mar Biotechnol (2011) 13:733–750

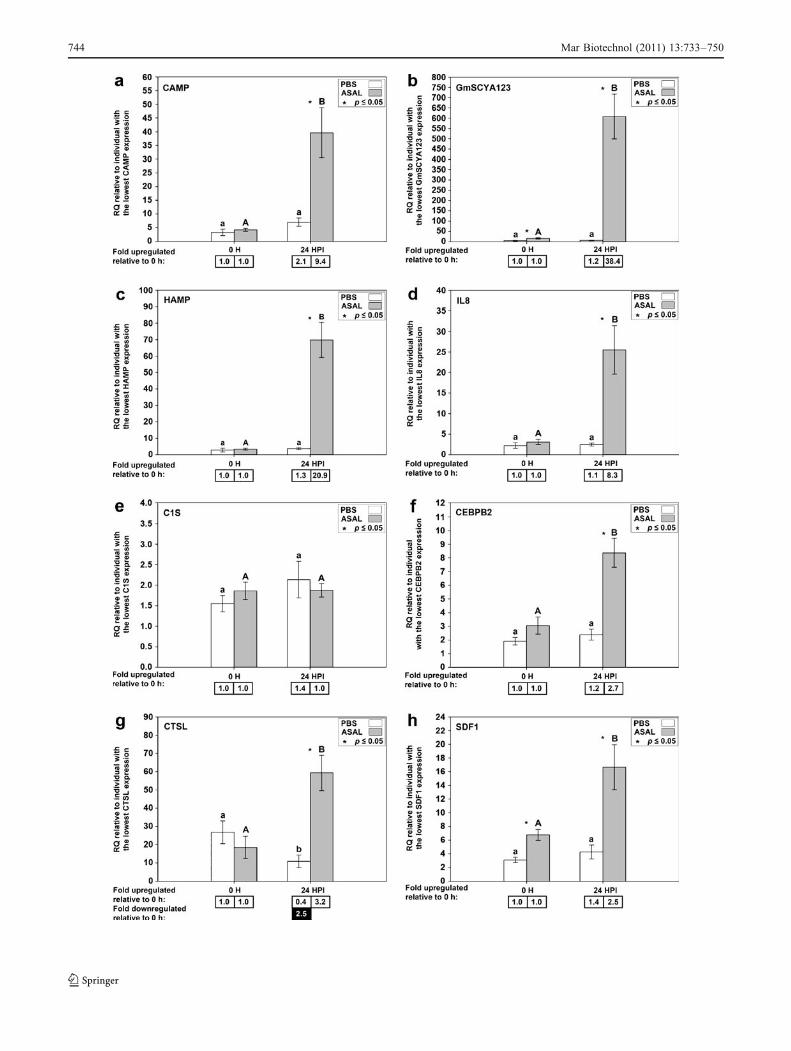
SSH analysis (Feng et al. 2009). Results from the QPCRanalysis of spleen tissue for these eight genes are shown inFig. 4. Of these genes, CAMP, GmSCYA123, HAMP, andIL8 were analyzed previously by QPCR using the samespleen samples but with a different QPCR instrument andusing technical duplicates instead of technical triplicates(Feng et al. 2009). QPCR for these genes was repeated forthe current study to ensure that all genes were analyzedusing the same protocol. Seven of the 15 genes we selectedwere newly identified as Asal-responsive by microarrayanalysis, and results from QPCR analysis for these genesare shown in Fig. 5. Of 15 genes tested, 12 showed a
significant difference in gene expression levels (p < 0.05)between Asal 0 h and Asal 24 HPI samples and/or betweenPBS 24 HPI and Asal 24 HPI samples, as expected fromthe microarray results. For three genes (CYBB, C1S, andall_v2.0.2958.C1), QPCR could not confirm a significanttranscript expression response to Asal.
As was found with SAM analysis of the microarray data,QPCR data did not show significant differences in spleentranscript expression levels between asymptomatic nodavirus“high carrier” and “no/low carrier” pre-injection samples(data not shown). QPCR data for individual samples areincluded as ESM Table S7.
Table 2 Selection of genes that show increased expression upon stimulation with formalin-killed, atypical A. salmonicida
Accession no.
Immune, inflammatory and bactericidal responses (20/46, 43%)
Bactericidal/permeability increasing protein/lipopolysaccharide binding protein variant b AAM52336
Cathelicidin 1 ACE96051
CC chemokine (fish group) FF411846a
CC chemokine GmSCYA123 (CCL19 group) EX175275
CCAAT/enhancer-binding protein beta 2 ACL98106
CD63 antigen ACI66138
Complement component 1, s subcomponent AAI08809
Cytochrome b-245, beta polypeptide (chronic granulomatous disease) AAH54624
Hepcidin precursor ACA42770
Integrin beta-2 ACN10489
Interferon stimulated gene 15-2 ACZ02438
Interferon-inducible GTPase_b ABW94984
Interleukin-8 variant 5 AAN41457
Novel protein similar to mucosa associated lymphoid tissue lymphoma translocation gene 1 CAK11171
PREDICTED: very large inducible GTPase-1-like XP_684086
SH2 domain-containing protein 1B O14796
SLAM family member 7 ACI68624
Stromal cell-derived factor 1 precursor ACQ58846
Syndecan-2 AAK49414
78-kDa glucose-regulated protein ACI33778
Proteolysis
Cathepsin L precursor ACQ58501
Cysteine protease BAH86062
Digestive cysteine proteinase 2 precursor ACI34170
Proteasome subunit alpha type-6 ACI70015
Proteasome subunit beta type-7 precursor ACO14028
Transport
FXYD domain containing ion transport regulator 5a DAA06142
Nucleoporin GLE1 ACN10786
Metalloreductase STEAP4 ACN11487
These genes were all responsive to Asal using an FDR cutoff of 0.01a “CC chemokine (fish group)” represents multiple related sequences with accession nos. FF411846, FF411294, AY614590, AY614592, ES779792,AY614591, FF415129
Mar Biotechnol (2011) 13:733–750 743
744 Mar Biotechnol (2011) 13:733–750

Discussion
Highly Stringent Analysis of Microarray Data Identifies 82Probes That Were Responsive to Stimulation withFormalin-Killed, Atypical A. salmonicida
Because this study was set up to test the newly developedAtlantic cod 20K microarray platform, we chose to use astringent selection of the final Asal-responsive gene list.Therefore, all gene lists were based on an FDR cutoff of0.01 and the final responsive gene list contained only the 82probes that were responsive to Asal when compared to bothunstimulated and PBS-stimulated fish.
The list of Asal-responsive probes from the comparisonbetween Asal 24 HPI and Asal 0 h was considerablysmaller (104 probes) than the list of Asal-responsive probesfrom the comparison between Asal 24 HPI and PBS 24 HPI(1,313 probes; Fig. 2 and ESM Tables S3 and S4). Closerinvestigation by hierarchical clustering of the samples usingthese gene lists gives a possible explanation for this (ESMFig. S4). When clustering the Asal 24 HPI and PBS 24 HPIsamples using the 1,313 probes that were differentiallyexpressed, the results showed that overall within-groupvariation between individuals was comparable betweenthese two groups, apart from one outlier sample in theAsal 24 HPI group. However, when clustering the Asal 0 hand Asal 24 HPI samples using the 104 probes that weredifferentially expressed, within-group variation in the Asal0 h group was much larger than within-group variation inthe Asal 24 HPI group. Because the SAM algorithm isbased on a modified t test, large variability within a groupcould negatively impact the statistical power to detectsignificant gene expression differences, which could ex-plain the shorter list of Asal-responsive genes found whencomparing the Asal 0 h and Asal 24 HPI groups. Despitethis, we have chosen to restrict the final Asal-responsivegene list to the overlap of both comparisons to minimize thepossibility of false positives, which is preferable to
minimizing false negatives for validation of the new 20Kmicroarray platform.
The final list of 82 Asal-responsive probes represents 71unique genes. The list includes nine probes for six relatedCC chemokines, which belong to a phylogenetic clade ofteleost CC chemokines with no equivalent in mammals, andare therefore designated “fish group” CC chemokines(Borza et al. 2010). Because these genes are related (seeSupplementary data 2 in Borza et al. 2010) and the probesshare different levels of homology with each other, themRNA expression levels of individual “fish group” CCchemokines as measured by the microarray are probablyaffected by the presence of mRNA from related “fishgroup” CC chemokines. Therefore, expression levels ofindividual “fish group” CC chemokines have to beinterpreted with care. In Table 2, all “fish group” CCchemokine genes have been grouped under one entry.
QPCR Analysis and Comparison with SSH AnalysisConfirm Validity of Microarray Results
For 12 of the 15 genes (80%) that were chosen for QPCRvalidation, the QPCR analysis confirmed that they weresignificantly upregulated (p<0.05) in response to Asalstimulation (indicated in ESM Table S5B). There areseveral possible explanations why QPCR and microarrayresults were different for the other three genes, such asdifferent location of microarray probe and QPCR amplicon,possible misassembly of contigs, and differences inspecificity between the QPCR assay and the correspondinginformative 50-mer microarray probe.
The spleen tissue samples used in the microarrayexperiments were previously used for SSH analysis (Fenget al. 2009). When comparing the 71 unique Asal-responsive genes to the 820 assembled contigs and single-tons from the spleen forward SSH library (i.e., enriched fortranscripts that were upregulated in response to Asal;Supplementary Table S1A in Feng et al. 2009), there wasan overlap of 13 genes (indicated in ESM Table S5B). TheSSH libraries were constructed from samples from multiplesampling times (2, 6, 24, and 72 HPI), and so it is expectedthat a large number of SSH sequences will not be found inthe current microarray analysis which is limited to onesampling time point (24 HPI).
The three deepest contigs reported in the spleen forwardSSH library were small inducible cytokine SCYA (which isGmSCYA123, a CC chemokine of the “CCL19 group”;Borza et al. 2010), cathelicidin, and hemoglobin subunitbeta 1 (Feng et al. 2009). Both GmSCYA123 andcathelicidin were found in the list of Asal-responsive genesas determined by microarray and showed some of thehighest transcript level changes (respectively 17 and 6times higher in the Asal 24 HPI group than in the Asal 0 h
Fig. 4 QPCR results for genes identified as Asal-responsive bymicroarray and SSH. Average relative quantity (RQ) values with SEMerror bars. Gene expression differences were determined by t tests onRQ values with a p value cutoff of 0.05. Statistically significantdifferences between treatments within time points are indicated withan asterisk. Statistically significant differences between time pointswithin treatments are indicated with letters (lowercase for PBS,uppercase for A. salmonicida; different letters indicate significantdifference). Fold upregulation was calculated as (average RQ 24 HPI)/(average RQ 0 h) for both PBS and Asal groups. Fold downregulationwas calculated as 1/(fold upregulation). CAMP, GmSCYA123,HAMP, and IL8 were analyzed previously by QPCR using the samespleen samples but with a different QPCR instrument and usingtechnical duplicates instead of technical triplicates (Feng et al. 2009).QPCR for these genes was repeated for the current study to ensure thatall genes were analyzed using the same instrument and protocol
R
Mar Biotechnol (2011) 13:733–750 745
746 Mar Biotechnol (2011) 13:733–750

group). Hemoglobin subunit beta 1 was not found to beresponsive to Asal in the current microarray study, but thisis not surprising since hemoglobin subunit beta 1 was alsorepresented by two deep contigs (of 15 and 7 ESTs) in thereverse (i.e., enriched for transcripts that were downregu-lated by Asal) spleen SSH library (Supplementary TableS1B in Feng et al. 2009). These data suggest thathemoglobin subunit beta 1 transcripts were highly abundantin both tester and driver RNA pools involved in SSHlibrary construction rather than up- or downregulated inresponse to Asal stimulation.
Functional Analysis Shows a Large Numberof Formalin-Killed, Atypical A. salmonicida-ResponsiveGenes are Immune-Related
Analysis of GO annotations and manual functional annota-tions both showed that a large number of genes were involvedin immune response or associated functions such as inflam-matory response and bactericidal response. In the hierarchicalclustering procedure, a large number of these genes clusteredtogether. In Fig. 3, two colored bars indicate two suchclusters; the blue cluster contains genes with antimicrobialfunctions such as cathelicidin, hepcidin, and bactericidal/permeability-increasing protein (BPI)/lipopolysaccharide-binding protein (LBP), and the orange cluster contains mostof the CC chemokine “fish group” probes. Previously, SSHanalysis of these samples also showed that “immuneresponse” and “proteolysis” were the most abundant GOcategories in the spleen forward library (i.e., genes that wereupregulated by stimulation with Asal; Feng et al. 2009).
The current microarray study has identified someadditional Asal-responsive genes that were not found inSSH analysis, such as BPI/LBP, several “fish group” CCchemokines, syndecan-2, and a novel protein similar toMALT1. BPI/LBP and the “fish group” CC chemokineGmSCYA104 were also confirmed to be Asal-responsiveby QPCR. Atlantic cod BPI/LBP is a probable descendantof the ancestral gene that gave rise to mammalian BPI andLBP genes (Stenvik et al. 2004), like its putative orthologidentified in rainbow trout (Inagawa et al. 2002). Based onmRNA expression, protein charge, and amino acid se-
quence, Stenvik et al. (2004) suggest that Atlantic cod BPI/LBP might have a function that is more similar to that ofmammalian BPI than LBP. Mammalian BPI has strongantimicrobial activity against Gram-negative bacteria andcan neutralize endotoxins (reviewed in Schultz and Weiss2007). Stenvik et al. (2004) also showed that BPI/LBPmRNA expression is upregulated in cod spleen afterstimulation with formalin-killed Vibrio anguillarum, similarto the response we have shown to stimulation with Asal.The “fish group” CC chemokines have both a homeostaticand an inflammatory function and have been shownpreviously to be upregulated by stimulation with Asal(Borza et al. 2010). Syndecan-2 is a cell surface heparansulfate proteoglycan that is a co-receptor for IL8, thought toimmobilize IL8 on the cell surface to mediate communica-tion between endothelial cells and neutrophils in humans(Halden et al. 2004). The human Malt1 protein, when incomplex with Bcl10, can activate NFκB (Lucas et al. 2001,2004). Interestingly, Martin et al. (2009) found that the CBMcomplex, containing Carma3, Bcl10, and Malt1, was a keycomponent of the activation of NFκB by IL8.
There are some well-known genes involved in theantibacterial response, such as g-type lysozyme, transferrin,ferritin, and MH class I, which are missing from our stringentlist of 82 Asal-responsive probes. However, these genes arepresent in the less stringent list of 1,313 Asal-responsiveprobes that are informative when comparing Asal 24HPI toPBS 24HPI (ESM Table S4). As mentioned earlier, hierar-chical clustering revealed that the Asal 0 h samples’transcript expression profiles were more heterogeneous thanthose of the other groups. This may be the cause of therelatively short Asal-responsive probe list when comparingAsal 24 HPI to Asal 0 h (ESM Table S3), and of the absenceof a number of “expected” genes from this list, whichtherefore are also missing from our stringent final gene list.
Recently, Caipang et al. (2010) reported on geneexpression changes in Atlantic cod gill tissue in responseto A. salmonicida using semiquantitative RT-PCR. Theyshowed an increase in expression of several antibacterialand cytokine genes. Our microarray study corroboratedthese results and identified a large number of additionalgenes involved in antimicrobial, inflammatory, and immuneresponses that are responsive to Asal. Some of the genes thatwere Asal-responsive in our study were also found to beresponsive toA. salmonicida in other species such as Atlanticsalmon (Salmo salar; Ewart et al. 2005; Fast et al. 2007;Martin et al. 2006), rainbow trout (Oncorhynchus mykiss;Mulder et al. 2007), and Atlantic halibut (Hippoglossushippoglossus; Park et al. 2005).
Overall, our analysis shows that in response to stimula-tion with Asal, a large number of genes involved in theinnate immune response are upregulated. Since Atlantic codis known to mount at best a weak specific antibody
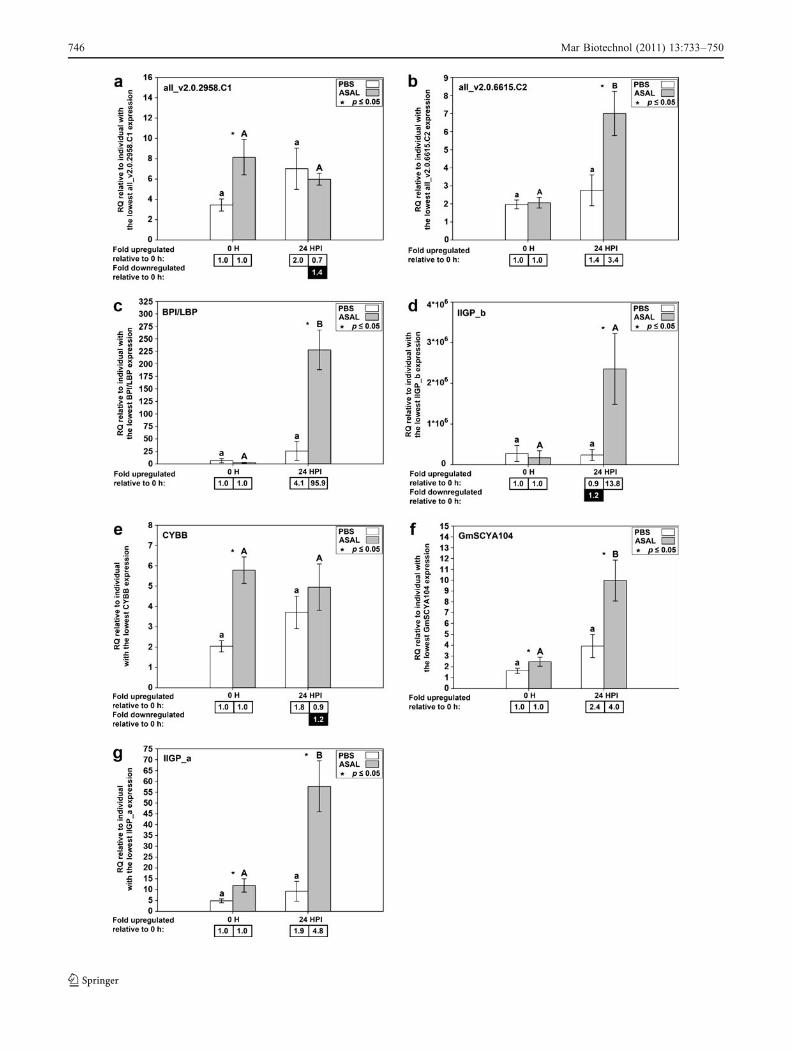
Fig. 5 QPCR results for genes identified as Asal-responsive bymicroarray only. Average relative quantity (RQ) values with SEMerror bars. Gene expression differences were determined by t tests onRQ values with a p value cutoff of 0.05. Statistically significantdifferences between treatments within time points are indicated withan asterisk. Statistically significant differences between time pointswithin treatments are indicated with letters (lowercase for PBS,uppercase for A. salmonicida; different letters indicate significantdifference). Fold upregulation was calculated as (average RQ 24 HPI)/(average RQ 0 h) for both PBS and Asal groups. Fold downregulationwas calculated as 1/(fold upregulation)
R
Mar Biotechnol (2011) 13:733–750 747

response to pathogens, this strong innate immune responsemight be an alternative mechanism in the defense ofAtlantic cod against bacterial pathogens.
The Atlantic cod 20K Oligonucleotide Microarrayis a Valuable New Tool for Genomics Research
Our newly developed Atlantic cod 20K oligonucleotidemicroarray platform is a large-scale microarray thatcontains genes from a large variety of tissues and involvedin many pathways. There are only two other Atlantic codmicroarray platforms currently published: the IMR Atlanticcod 16K cDNA microarray (Edvardsen et al. 2010) and thesmall-scale CodStress microarray with genes involved instress and immune responses (Lie et al. 2009). The IMREST database used by Edvardsen et al. (2010) is relativelysmall (it consists of ~44,000 ESTs from 20 un-normalizedcDNA libraries), and sequences for the IMR 16K cDNAmicroarray were only selected from ten of those cDNAlibraries, representing ~27,000 ESTs. In addition, 3,967 ofthe 16,000 sequences selected were singletons withoutannotation. In contrast, our Atlantic cod 20K oligonucleo-tide array contains sequences selected from a much largercollection of 154,142 ESTs from 42 normalized and SSHcDNA libraries, representing a diverse set of tissues,developmental stages, and stimuli, and no un-annotatedsingletons were included on the array. Therefore, weanticipate our Atlantic cod 20K oligonucleotide micro-array to be an excellent representation of the Atlantic codtranscriptome in a broad range of conditions and thus avaluable tool for Atlantic cod functional genomicsresearch. The CodStress microarray contains genes thatoriginated from tissues of Atlantic cod exposed totoxicants (Lie et al. 2009), a treatment that is notrepresented in the collection of CGP cDNA libraries.Therefore, the CodStress microarray and the newlydeveloped Atlantic cod 20K oligonucleotide microarraycould supplement each other in toxicology and otherresearch. Together with the recently constructed SNPplatform and linkage map (Hubert et al. 2010), and anongoing effort to sequence the full Atlantic cod genome(Johansen et al. 2009), they form an important set of toolsfor marker-assisted selection to improve Atlantic codaquaculture.
In summary, we developed and validated the CGPAtlantic cod 20K oligonucleotide microarray. The selec-tion of sequences from a diverse collection of ESTsensures that the microarray can be applied in a broadspectrum of Atlantic cod functional genomics studies.The incorporation of sequences selected from SSHlibraries, which were enriched for defense-related genes,makes this microarray platform particularly useful forstudies of Atlantic cod global gene expression responses
to immune stimuli and other stressors. We demonstratedthis by using the 20K microarray to analyze the Atlanticcod spleen response to IP injection with formalin-killed,atypical A. salmonicida, resulting in a gene expressionprofile that indicates strong antimicrobial and innateimmune responses.
Acknowledgments We would like to thank the fish husbandry staffat the Dr. Joe Brown Aquatic Research Building (Ocean SciencesCentre, MUN) as well as everyone involved in tissue sampling. Wealso thank Yves Daigle at the Atlantic Microarray Facility at ACRI(www.atlanticcancer.ca/amf) for coordinating the production of themicroarrays. This research was supported in part by Genome Canada,Genome Atlantic, and the Atlantic Canada Opportunities Agencythrough the Atlantic Cod Genomics and Broodstock DevelopmentProject. A complete list of supporting partners can be found at www.codgene.ca/partners.php. Funding was also provided by a NaturalSciences and Engineering Research Council of Canada (NSERC)Discovery Grant and a Canada Research Chair to MLR, and through aNSERC Major Facilities Grant to the Ocean Sciences Centre(Memorial University of Newfoundland, MUN).
Open Access This article is distributed under the terms of theCreative Commons Attribution Noncommercial License whichpermits any noncommercial use, distribution, and reproduction inany medium, provided the original author(s) and source arecredited.
References
Benson G (1999) Tandem repeats finder: a program to analyze DNAsequences. Nucleic Acids Res 27:573–580
Borza T, Stone C, Gamperl AK, Bowman S (2009) Atlantic cod (Gadusmorhua) hemoglobin genes: multiplicity and polymorphism. BMCGenet 10:51
Borza T, Stone C, Rise ML, Bowman S, Johnson SC (2010) Atlanticcod (Gadus morhua) CC chemokines: diversity and expressionanalysis. Dev Comp Immunol 34:904–913
Bowman S, Hubert S, Higgins B, Stone C, Kimball J, Borza T, BusseyJT, Simpson G, Kozera C, Curtis BA, Hall JR, Hori TS, FengCY, Rise M, Booman M, Gamperl AK, Trippel E, Symonds J,Johnson SC, Rise ML (2010) An integrated approach to genediscovery and marker development in Atlantic cod (Gadusmorhua). Mar Biotechnol (NY). doi:10.1007/s10126-010-9285-z
Bø TH, Dysvik B, Jonassen I (2004) LSimpute: accurate estimation ofmissing values in microarray data with least squares methods.Nucleic Acids Research 32:e34
Brown JA,Minkoff G, Puvanendran V (2003) Larviculture of Atlantic cod(Gadus morhua): progress, protocols and problems. Aquaculture227:357–372
Caipang CM, Lazado CC, Brinchmann MF, Kiron V (2010) Infection-induced changes in expression of antibacterial and cytokinegenes in the gill epithelial cells of Atlantic cod, Gadus morhuaduring incubation with bacterial pathogens. Comp BiochemPhysiol B Biochem Mol Biol 156:319–325
Celton M, Malpertuy A, Lelandais G, de Brevern AG (2010)Comparative analysis of missing value imputation methods toimprove clustering and interpretation of microarray experiments.BMC Genomics 11:15
Edvardsen RB, Malde K, Mittelholzer C, Taranger GL, Nilsen F(2010) EST resources and establishment and validation of a 16k
748 Mar Biotechnol (2011) 13:733–750

cDNA microarray from Atlantic cod (Gadus morhua). CompBiochem Physiol Part D Genomics Proteomics. doi:10.1016/j.cbd.2010.06.002
Ewart KV, Belanger JC, Williams J, Karakach T, Penny S, Tsoi SC,Richards RC, Douglas SE (2005) Identification of genesdifferentially expressed in Atlantic salmon (Salmo salar) inresponse to infection by Aeromonas salmonicida using cDNAmicroarray technology. Dev Comp Immunol 29:333–347
Fast MD, Johnson SC, Jones SR (2007) Differential expression of thepro-inflammatory cytokines IL-1beta-1, TNFalpha-1 and IL-8 invaccinated pink (Oncorhynchus gorbuscha) and chum (Onco-rhynchus keta) salmon juveniles. Fish Shellfish Immunol22:403–407
Feng CY, Johnson SC, Hori TS, Rise M, Hall JR, Gamperl AK,Hubert S, Kimball J, Bowman S, Rise ML (2009) Identificationand analysis of differentially expressed genes in immune tissuesof Atlantic cod stimulated with formalin-killed, atypical Aeromonassalmonicida. Physiol Genomics 37:149–163
Gollock MJ, Currie S, Petersen LH, Gamperl AK (2006) Cardiovascularand haematological responses of Atlantic cod (Gadus morhua) toacute temperature increase. J Exp Biol 209:2961–2970
Gudmundsdóttir S, Magnadóttir B, Björnsdóttir B, Arnadóttir H,Gudmundsdóttir BK (2009) Specific and natural antibodyresponse of cod juveniles vaccinated against Vibrio anguillarum.Fish Shellfish Immunol 26:619–624
Halden Y, Rek A, Atzenhofer W, Szilak L, Wabnig A, Kungl AJ(2004) Interleukin-8 binds to syndecan-2 on human endothelialcells. Biochem J 377:533–538
Hansen T, Karlsen O, Taranger GL, Hemre GI, Holm JC, Kjesbu OS(2001) Growth, gonadal development and spawning time ofAtlantic cod (Gadus morhua) reared under different photoperiods.Aquaculture 203:51–67
Hori TS, Gamperl AK, Afonso LO, Johnson SC, Hubert S, Kimball J,Bowman S, Rise ML (2010) Heat-shock responsive genesidentified and validated in Atlantic cod (Gadus morhua) liver,head kidney and skeletal muscle using genomic techniques.BMC Genomics 11:72
Hubert S, Higgins B, Borza T, Bowman S (2010) Development of aSNP resource and a genetic linkage map for Atlantic cod (Gadusmorhua). BMC Genomics 11:191
Inagawa H, Honda T, Kohchi C, Nishizawa T, Yoshiura Y, NakanishiT, Yokomizo Y, Soma G (2002) Cloning and characterization ofthe homolog of mammalian lipopolysaccharide-binding proteinand bactericidal permeability-increasing protein in rainbow troutOncorhynchus mykiss. J Immunol 168:5638–5644
Johansen SD, Coucheron DH, Andreassen M, Karlsen BO, FurmanekT, Jørgensen TE, Emblem A, Breines R, Nordeide JT, Moum T,Nederbragt AJ, Stenseth NC, Jakobsen KS (2009) Large-scalesequence analyses of Atlantic cod. N Biotechnol 25:263–271
Koski LB, Gray MW, Lang BF, Burger G (2005) AutoFACT: anautomatic functional annotation and classification tool. BMCBioinformatics 6:151
Lie KK, Lanzen A, Breilid H, Olsvik PA (2009) Gene expressionprofiling in Atlantic cod (Gadus morhua L.) from two contaminatedsites using a custom-made cDNA microarray. Environ ToxicolChem 28:1711–1721
Lucas PC, Yonezumi M, Inohara N, McAllister-Lucas LM, AbazeedME, Chen FF, Yamaoka S, Seto M, Nunez G (2001) Bcl10 andMALT1, independent targets of chromosomal translocation inmalt lymphoma, cooperate in a novel NF-kappa B signalingpathway. J Biol Chem 276:19012–19019
Lucas PC, McAllister-Lucas LM, Nunez G (2004) NF-kappaBsignaling in lymphocytes: a new cast of characters. J Cell Sci117:31–39
Lund V, Børdal S, Kjellsen O, Mikkelsen H, Schrøder MB (2006)Comparison of antibody responses in Atlantic cod (Gadus
morhua L.) to Aeromonas salmonicida and Vibrio anguillarum.Dev Comp Immunol 30:1145–1155
Lund V, Børdal S, Schrøder MB (2007) Specificity and durability ofantibody responses in Atlantic cod (Gadus morhua L.) immu-nised with Vibrio anguillarum O2b. Fish Shellfish Immunol23:906–910
Magnadottir B, Gudmundsdottir S, Gudmundsdottir BK, Helgason S(2009) Natural antibodies of cod (Gadus morhua L.): specificity,activity and affinity. Comp Biochem Physiol B Biochem MolBiol 154:309–316
Martin SA, Blaney SC, Houlihan DF, Secombes CJ (2006) Tran-scriptome response following administration of a live bacterialvaccine in Atlantic salmon (Salmo salar). Mol Immunol43:1900–1911
Martin D, Galisteo R, Gutkind JS (2009) CXCL8/IL8 stimulatesvascular endothelial growth factor (VEGF) expression and theautocrine activation of VEGFR2 in endothelial cells by activatingNFkappaB through the CBM (Carma3/Bcl10/Malt1) complex. JBiol Chem 284:6038–6042
Miller KM, Kaukinen KH, Schulze AD (2002) Expansion andcontraction of major histocompatibility complex genes: ateleostean example. Immunogenetics 53:941–963
Mulder IE, Wadsworth S, Secombes CJ (2007) Cytokine expression inthe intestine of rainbow trout (Oncorhynchus mykiss) duringinfection with Aeromonas salmonicida. Fish Shellfish Immunol23:747–759
Park KC, Osborne JA, Tsoi SC, Brown LL, Johnson SC (2005)Expressed sequence tags analysis of Atlantic halibut (Hippoglossushippoglossus) liver, kidney and spleen tissues following vaccina-tion against Vibrio anguillarum and Aeromonas salmonicida.Fish Shellfish Immunol 18:393–415
Persson AC, Stet RJ, Pilström L (1999) Characterization of MHCclass I and beta(2)-microglobulin sequences in Atlantic codreveals an unusually high number of expressed class I genes.Immunogenetics 50:49–59
Pérez-Casanova JC, Rise ML, Dixon B, Afonso LO, Hall JR, JohnsonSC, Gamperl AK (2008) The immune and stress responses ofAtlantic cod to long-term increases in water temperature. FishShellfish Immunol 24:600–609
Pfaffl MW (2001) A new mathematical model for relative quantifi-cation in real-time RT-PCR. Nucleic Acids Research 29:e45
Pilstrom L, Warr GW, Stromberg S (2005) Why is the antibodyresponse of Atlantic cod so poor? The search for a geneticexplanation. Fisheries Science 71:961–971
Rise ML, Hall J, Rise M, Hori T, Gamperl AK, Kimball J, Hubert S,Bowman S, Johnson SC (2008) Functional genomic analysis ofthe response of Atlantic cod (Gadus morhua) spleen to the viralmimic polyriboinosinic polyribocytidylic acid (pIC). Dev CompImmunol 32:916–931
Rise ML, Liu Z, Douglas SE, Brown LL, Nash JHE, McFall-Ngai MJ(2009) Aquaculture-related applications of DNA microarraytechnology. In: Overturf K (ed) Molecular research in aquaculture.Blackwell, Ames, pp 63–101
Rise ML, Hall JR, Rise M, Hori TS, Browne MJ, Gamperl AK,Hubert S, Kimball J, Bowman S, Johnson SC (2010) Impact ofasymptomatic nodavirus carrier state and intraperitoneal viralmimic injection on brain transcript expression in Atlantic cod(Gadus morhua). Physiol Genomics 42:266–280
Rorabacher DB (1991) Statistical treatment for rejection of deviantvalues: critical values of Dixon’s “Q” parameter and relatedsubrange ratios at the 95% confidence level. Anal Chem63:139–146
Samuelsen OB, Nerland AH, Jørgensen T, Schrøder MB, Svåsand T,Bergh O (2006) Viral and bacterial diseases of Atlantic codGadus morhua, their prophylaxis and treatment: a review. DisAquat Organ 71:239–254
Mar Biotechnol (2011) 13:733–750 749

Schultz H, Weiss JP (2007) The bactericidal/permeability-increasingprotein (BPI) in infection and inflammatory disease. Clin ChimActa 384:12–23
Schwender H, Krause A, Ickstadt K (2006) Identifying interestinggenes with siggenes. RNews 6:45–50
Solem ST, Stenvik J (2006) Antibody repertoire development inteleosts—a review with emphasis on salmonids and Gadusmorhua L. Dev Comp Immunol 30:57–76
Stenvik J, Solstad T, Strand C, Leiros I, TØ JT (2004) Cloning andanalyses of a BPI/LBP cDNA of the Atlantic cod (Gadus morhuaL.). Dev Comp Immunol 28:307–323
Sturn A, Quackenbush J, Trajanoski Z (2002) Genesis: cluster analysisof microarray data. Bioinformatics 18:207–208
Tusher VG, Tibshirani R, Chu G (2001) Significance analysis ofmicroarrays applied to the ionizing radiation response. Proc NatlAcad Sci USA 98:5116–5121
750 Mar Biotechnol (2011) 13:733–750
Related Documents