RESEARCH ARTICLE 10.1002/2014GC005563 Development and evolution of detachment faulting along 50 km of the Mid-Atlantic Ridge near 16.5 N Deborah K. Smith 1 , Hans Schouten 1 , Henry J. B. Dick 1 , Johnson R. Cann 2 , Vincent Salters 3 , Horst R. Marschall 1 , Fuwu Ji 4 , Dana Yoerger 1 , Alessio Sanfilippo 5 , Ross Parnell-Turner 6 , Camilla Palmiotto 7 , Alexei Zheleznov 8 , Hailong Bai 9 , Will Junkin 9 , Ben Urann 1 , Spencer Dick 10 , Margaret Sulanowska 1 , Peter Lemmond 1 , and Scott Curry 1 1 Department of Geology and Geophysics, Woods Hole Oceanographic Institution, Woods Hole, Massachusetts, USA, 2 School of Earth and Environment, University of Leeds and Curlew Cottage, Penrith, UK, 3 Department of Geological Scien- ces, Florida State University, Tallahassee, Florida, USA, 4 School of Ocean and Earth Science, Tongji University, Shanghai, People’s Republic of China, 5 Department of Earth and Environmental Sciences, University of Pavia, Pavia, Italy, 6 Bullard Laboratories, Department of Earth Sciences, University of Cambridge, Cambridge, UK, 7 Istituto di Scienze Marine, ISMAR- CNR, Bologna, Italy, 8 Department of Geomorphology, Institute of Earth Sciences, Saint Petersburg State University, St. Petersburg, Russia, 9 Department of Geology, University of Maryland, College Park, Maryland, USA, 10 Geology and Geogra- phy Department, Ohio Wesleyan University, Delaware, Ohio, USA Abstract A multifaceted study of the slow spreading Mid-Atlantic Ridge (MAR) at 16.5 N provides new insights into detachment faulting and its evolution through time. The survey included regional multibeam bathymetry mapping, high-resolution mapping using AUV Sentry, seafloor imaging using the TowCam sys- tem, and an extensive rock-dredging program. At different times, detachment faulting was active along 50 km of the western flank of the study area, and may have dominated spreading on that flank for the last 5 Ma. Detachment morphologies vary and include a classic corrugated massif, noncorrugated massifs, and back-tilted ridges marking detachment breakaways. High-resolution Sentry data reveal a new detach- ment morphology; a low-angle, irregular surface in the regional bathymetry is shown to be a finely corru- gated detachment surface (corrugation wavelength of only tens of meters and relief of just a few meters). Multiscale corrugations are observed 2–3 km from the detachment breakaway suggesting that they formed in the brittle layer, perhaps by anastomosing faults. The thin wedge of hanging wall lavas that covers a low- angle (6 ) detachment footwall near its termination are intensely faulted and fissured; this deformation may be enhanced by the low angle of the emerging footwall. Active detachment faulting currently is limited to the western side of the rift valley. Nonetheless, detachment fault morphologies also are present over a large portion of the eastern flank on crust >2 Ma, indicating that within the last 5 Ma parts of the ridge axis have experienced periods of two-sided detachment faulting. 1. Introduction Normal faults at slower spreading ridges may have very large offsets (tens of km to greater than a hundred km) and account locally for 60–100% of the plate separation [e.g., Baines et al., 2008; Cannat et al., 2006; Grimes et al., 2008; Ohara et al., 2001; Okino et al., 2004; Searle et al., 2003; Smith et al., 2006, 2008; Tucholke et al., 1998]. These long-lived, large-offset faults (commonly referred to as detachment faults) exhume lower crustal and upper mantle rocks. As multibeam bathymetry data coverage increases, significant advances in our understanding of detachment faults are being made. A number of different morphologies are now associated with oceanic detachment faulting. These include the well-known domed, corrugated detachment surfaces, noncorrugated massifs, highly back-tilted fault breakaways, and broad smooth hills [Cann et al., 1997; Cannat et al., 2006; Dick et al., 2003; MacLeod et al., 2009; Schroeder et al., 2007; Smith et al., 2008; Tucholke et al., 1998]. In addition, detachment fault formation is not restricted to the ends of spreading segments; detachment faults form anywhere along the length of a segment [e.g., Cannat et al., 2006; Smith et al., 2006, 2008], and may link along axis over a significant portion of a ridge segment [e.g., Reston and Ranero, 2011; Smith et al., 2008]. Spreading by detachment faulting may dominate a region for several millions of years and generate broad expanses of seafloor [Cannat et al., 1995; Escart ın et al., 2008; Schroeder et al., 2007]. Escart ın et al. [2008] Special Section: Oceanic Detachment Faults Key Points: Study provides new insights into oceanic detachment faults Several morphologic expressions of oceanic detachment faulting are described Relationship between detachment faulting and axial volcanism is examined Correspondence to: D. K. Smith, [email protected] Citation: Smith, D. K., et al. (2014), Development and evolution of detachment faulting along 50 km of the Mid-Atlantic Ridge near 16.5 N, Geochem. Geophys. Geosyst., 15, 4692–4711, doi:10.1002/ 2014GC005563. Received 28 AUG 2014 Accepted 12 NOV 2014 Accepted article online 18 NOV 2014 Published online 5 DEC 2014 SMITH ET AL V C 2014. American Geophysical Union. All Rights Reserved. 4692 Geochemistry, Geophysics, Geosystems PUBLICATIONS

Welcome message from author
This document is posted to help you gain knowledge. Please leave a comment to let me know what you think about it! Share it to your friends and learn new things together.
Transcript

RESEARCH ARTICLE10.1002/2014GC005563
Development and evolution of detachment faulting along50 km of the Mid-Atlantic Ridge near 16.5�NDeborah K. Smith1, Hans Schouten1, Henry J. B. Dick1, Johnson R. Cann2, Vincent Salters3,Horst R. Marschall1, Fuwu Ji4, Dana Yoerger1, Alessio Sanfilippo5, Ross Parnell-Turner6,Camilla Palmiotto7, Alexei Zheleznov8, Hailong Bai9, Will Junkin9, Ben Urann1, Spencer Dick10,Margaret Sulanowska1, Peter Lemmond1, and Scott Curry1
1Department of Geology and Geophysics, Woods Hole Oceanographic Institution, Woods Hole, Massachusetts, USA,2School of Earth and Environment, University of Leeds and Curlew Cottage, Penrith, UK, 3Department of Geological Scien-ces, Florida State University, Tallahassee, Florida, USA, 4School of Ocean and Earth Science, Tongji University, Shanghai,People’s Republic of China, 5Department of Earth and Environmental Sciences, University of Pavia, Pavia, Italy, 6BullardLaboratories, Department of Earth Sciences, University of Cambridge, Cambridge, UK, 7Istituto di Scienze Marine, ISMAR-CNR, Bologna, Italy, 8Department of Geomorphology, Institute of Earth Sciences, Saint Petersburg State University, St.Petersburg, Russia, 9Department of Geology, University of Maryland, College Park, Maryland, USA, 10Geology and Geogra-phy Department, Ohio Wesleyan University, Delaware, Ohio, USA
Abstract A multifaceted study of the slow spreading Mid-Atlantic Ridge (MAR) at 16.5�N provides newinsights into detachment faulting and its evolution through time. The survey included regional multibeambathymetry mapping, high-resolution mapping using AUV Sentry, seafloor imaging using the TowCam sys-tem, and an extensive rock-dredging program. At different times, detachment faulting was active along�50 km of the western flank of the study area, and may have dominated spreading on that flank for thelast 5 Ma. Detachment morphologies vary and include a classic corrugated massif, noncorrugated massifs,and back-tilted ridges marking detachment breakaways. High-resolution Sentry data reveal a new detach-ment morphology; a low-angle, irregular surface in the regional bathymetry is shown to be a finely corru-gated detachment surface (corrugation wavelength of only tens of meters and relief of just a few meters).Multiscale corrugations are observed 2–3 km from the detachment breakaway suggesting that they formedin the brittle layer, perhaps by anastomosing faults. The thin wedge of hanging wall lavas that covers a low-angle (6�) detachment footwall near its termination are intensely faulted and fissured; this deformation maybe enhanced by the low angle of the emerging footwall. Active detachment faulting currently is limited tothe western side of the rift valley. Nonetheless, detachment fault morphologies also are present over a largeportion of the eastern flank on crust >2 Ma, indicating that within the last 5 Ma parts of the ridge axis haveexperienced periods of two-sided detachment faulting.
1. Introduction
Normal faults at slower spreading ridges may have very large offsets (tens of km to greater than a hundredkm) and account locally for 60–100% of the plate separation [e.g., Baines et al., 2008; Cannat et al., 2006; Grimeset al., 2008; Ohara et al., 2001; Okino et al., 2004; Searle et al., 2003; Smith et al., 2006, 2008; Tucholke et al.,1998]. These long-lived, large-offset faults (commonly referred to as detachment faults) exhume lower crustaland upper mantle rocks. As multibeam bathymetry data coverage increases, significant advances in ourunderstanding of detachment faults are being made. A number of different morphologies are now associatedwith oceanic detachment faulting. These include the well-known domed, corrugated detachment surfaces,noncorrugated massifs, highly back-tilted fault breakaways, and broad smooth hills [Cann et al., 1997; Cannatet al., 2006; Dick et al., 2003; MacLeod et al., 2009; Schroeder et al., 2007; Smith et al., 2008; Tucholke et al., 1998].In addition, detachment fault formation is not restricted to the ends of spreading segments; detachment faultsform anywhere along the length of a segment [e.g., Cannat et al., 2006; Smith et al., 2006, 2008], and may linkalong axis over a significant portion of a ridge segment [e.g., Reston and Ranero, 2011; Smith et al., 2008].
Spreading by detachment faulting may dominate a region for several millions of years and generate broadexpanses of seafloor [Cannat et al., 1995; Escart�ın et al., 2008; Schroeder et al., 2007]. Escart�ın et al. [2008]
Special Section:Oceanic Detachment Faults
Key Points:� Study provides new insights into
oceanic detachment faults� Several morphologic expressions of
oceanic detachment faulting aredescribed� Relationship between detachment
faulting and axial volcanism isexamined
Correspondence to:D. K. Smith,[email protected]
Citation:Smith, D. K., et al. (2014), Developmentand evolution of detachment faultingalong 50 km of the Mid-Atlantic Ridgenear 16.5�N, Geochem. Geophys.Geosyst., 15, 4692–4711, doi:10.1002/2014GC005563.
Received 28 AUG 2014
Accepted 12 NOV 2014
Accepted article online 18 NOV 2014
Published online 5 DEC 2014
SMITH ET AL VC 2014. American Geophysical Union. All Rights Reserved. 4692
Geochemistry, Geophysics, Geosystems
PUBLICATIONS

estimated that active detach-ment faulting occurs alongclose to 50% of the northernMAR axis between 12.5�N and35�N implying that as much as25% of new seafloor in thisregion may be formed bydetachment faulting. Smithet al. [2008] estimated thatdetachment fault morpholo-gies cover >60% of the sea-floor on the west flank of the13�N segment of the MAR.More recently, it has been sug-gested that the occurrence ofdetachment faults may beeven more widespread if theirsurfaces are masked by raftedblocks [Reston and Ranero,2011].
The formation of detachmentfaults is likely dependent on abalance between several fac-tors, but magma input has
always been considered a key variable. Modeling suggests that detachment faults may form primarily whenthe fraction of plate separation (M) taken up by magma accretion is between �0.3 and 0.5 [Buck et al., 2005;Olive et al., 2010; Tucholke et al., 2008]. If this is the case, then in regions of the MAR where corrugateddetachment faults form in the presence of large axial volcanic ridges (AVRs) [e.g., Smith et al., 2008], M islikely to be at the high end of the range (0.5), so that 50% of the extension would be taken up by detach-ment faulting and 50% by magmatic accretion and minor small-offset faulting.
In this paper, we investigate the formation and evolution of detachment faulting in the 16.5�N area of theslow spreading MAR (Figure 1), where detachment faulting has dominated the western flank of the axis forseveral millions of years. Regional multibeam bathymetry, gravity, and magnetic data were collected out toabout 60 km (�5 Ma) on each side of the ridge axis. In addition, AUV Sentry collected high-resolution multi-beam bathymetry, side scan, magnetic, CHIRP, and water column data during 14 dives. Seafloor photographswere obtained using the TowCam imaging system during nine tows, and an extensive dredging program wasconducted. The 16.5�N study area presents excellent examples of several different morphologic expressionsof detachment faulting. Here we assess the different seafloor styles associated with detachment faults, wheredetachment faults are active, how they evolve off axis, and their relationship to volcanism at the ridge axis.
2. Background
The 16.5�N study area is located �100 km north of the Fifteen-Twenty fracture zone (Figure 1). Previouswork identified two distinctive narrow ridges (East and West Ridges, Figure 2) on the western side of theaxis as the rotated breakaways of normal faults [Smith et al., 2008]. East Ridge, which is closer to the volcanicaxis, was interpreted as a newly emerging normal fault forming a rafted block on top of the older WestRidge detachment fault. Seafloor photographs from a camera tow near the top of East Ridge show steepfault scarps cutting pillow lavas on the upper section of the 30� inward-facing slope [Smith et al., 2008]. Onthe 20� outward-facing slope, however, more or less equant pillows are observed. Because pillows thaterupt onto steep slopes are typically elongate, Smith et al. [2008] suggested that these equant pillows wereerupted on the subhorizontal surface of the rift valley floor, faulted, and rotated outward. These observa-tions support the idea that East Ridge marks the breakaway of a rotated fault. Smith et al. [2008] also sug-gested that if mass wasting has not significantly modified the geometry of East Ridge, then the inward-
−47˚30' −47˚00' −46˚30' −46˚00'
15˚30'
16˚00'
16˚30'
17˚00'
17˚30'
Fifteen-Twenty FZ
Fig. 2
4000 2000
20 km
Water depth (m)
60o W 40o W 20o W
0
20o N
40o N
MAR
Figure 1. Bathymetric map of the MAR in the 16.5�N region. Inset shows the location of thestudy area. Black lines: track lines of the regional survey. Black rectangle: area shown inFigure 2.
Geochemistry, Geophysics, Geosystems 10.1002/2014GC005563
SMITH ET AL VC 2014. American Geophysical Union. All Rights Reserved. 4693
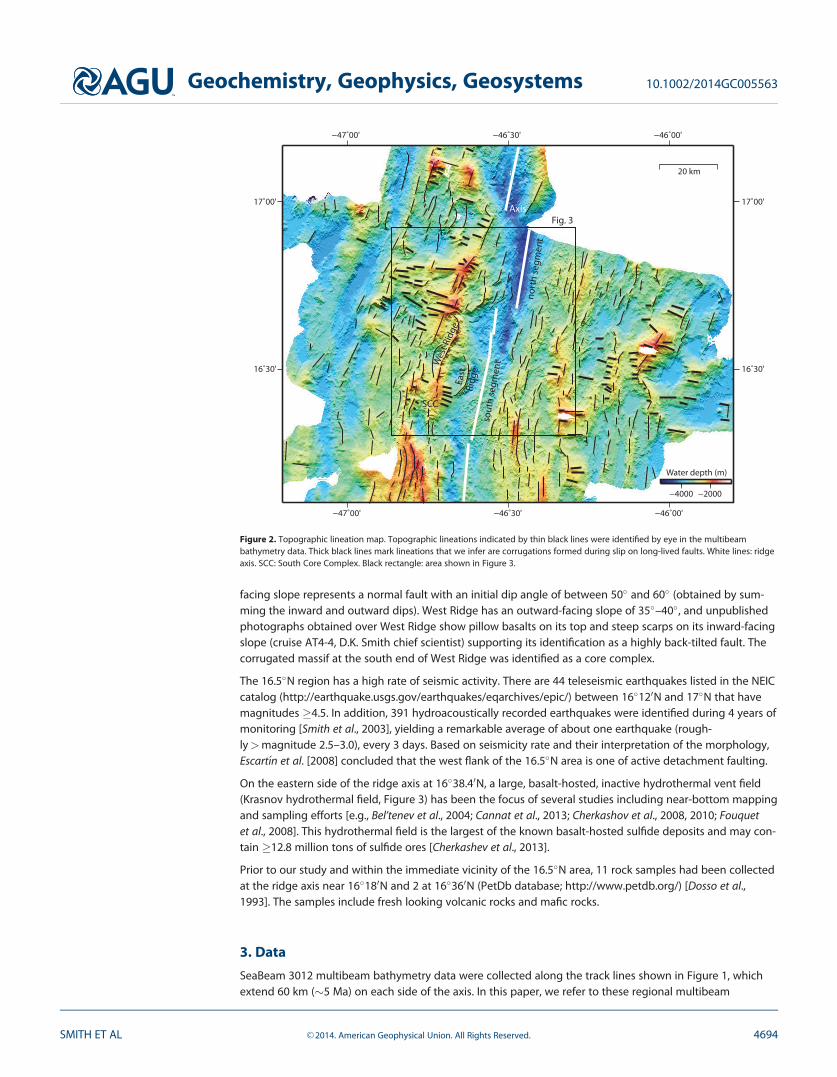
facing slope represents a normal fault with an initial dip angle of between 50� and 60� (obtained by sum-ming the inward and outward dips). West Ridge has an outward-facing slope of 35�–40�, and unpublishedphotographs obtained over West Ridge show pillow basalts on its top and steep scarps on its inward-facingslope (cruise AT4-4, D.K. Smith chief scientist) supporting its identification as a highly back-tilted fault. Thecorrugated massif at the south end of West Ridge was identified as a core complex.
The 16.5�N region has a high rate of seismic activity. There are 44 teleseismic earthquakes listed in the NEICcatalog (http://earthquake.usgs.gov/earthquakes/eqarchives/epic/) between 16�120N and 17�N that havemagnitudes �4.5. In addition, 391 hydroacoustically recorded earthquakes were identified during 4 years ofmonitoring [Smith et al., 2003], yielding a remarkable average of about one earthquake (rough-ly>magnitude 2.5–3.0), every 3 days. Based on seismicity rate and their interpretation of the morphology,Escart�ın et al. [2008] concluded that the west flank of the 16.5�N area is one of active detachment faulting.
On the eastern side of the ridge axis at 16�38.40N, a large, basalt-hosted, inactive hydrothermal vent field(Krasnov hydrothermal field, Figure 3) has been the focus of several studies including near-bottom mappingand sampling efforts [e.g., Bel’tenev et al., 2004; Cannat et al., 2013; Cherkashov et al., 2008, 2010; Fouquetet al., 2008]. This hydrothermal field is the largest of the known basalt-hosted sulfide deposits and may con-tain �12.8 million tons of sulfide ores [Cherkashev et al., 2013].
Prior to our study and within the immediate vicinity of the 16.5�N area, 11 rock samples had been collectedat the ridge axis near 16�180N and 2 at 16�360N (PetDb database; http://www.petdb.org/) [Dosso et al.,1993]. The samples include fresh looking volcanic rocks and mafic rocks.
3. Data
SeaBeam 3012 multibeam bathymetry data were collected along the track lines shown in Figure 1, whichextend 60 km (�5 Ma) on each side of the axis. In this paper, we refer to these regional multibeam
−47˚00'
−47˚00'
−46˚30'
−46˚30'
−46˚00'
−46˚00'
16˚30' 16˚30'
17˚00' 17˚00'Axis
Wes
t R
idg
eEa
stR
idg
e
SCC
−4000 −2000
20 km
Water depth (m)
sou
th s
eg
me
nt
no
rth
se
gm
en
t
Fig. 3
Figure 2. Topographic lineation map. Topographic lineations indicated by thin black lines were identified by eye in the multibeambathymetry data. Thick black lines mark lineations that we infer are corrugations formed during slip on long-lived faults. White lines: ridgeaxis. SCC: South Core Complex. Black rectangle: area shown in Figure 3.
Geochemistry, Geophysics, Geosystems 10.1002/2014GC005563
SMITH ET AL VC 2014. American Geophysical Union. All Rights Reserved. 4694
bathymetry data as SeaBeam data, which are shown in Figure 2 with topographic lineations indicated. Dur-ing the regional survey, a SeaSPY marine magnetometer and a shipboard BG-3 gravimeter collected mag-netic and gravity data. Detailed analyses of these data will be completed as part of another study.
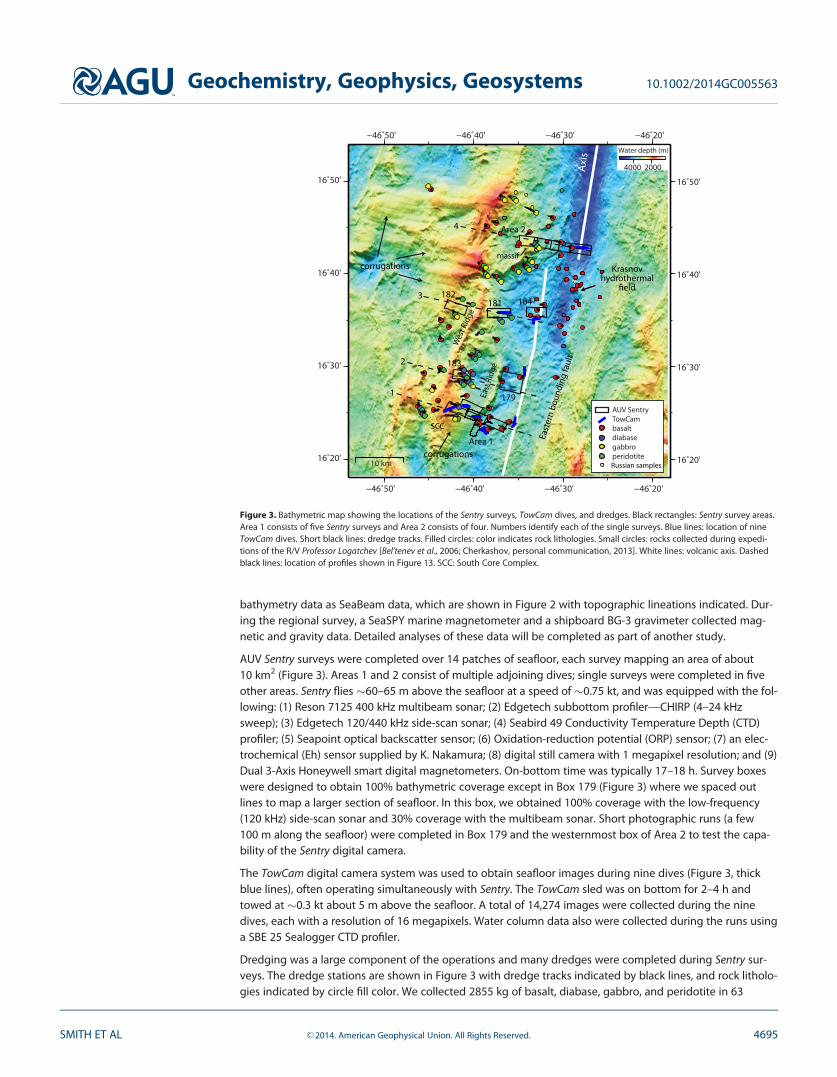
AUV Sentry surveys were completed over 14 patches of seafloor, each survey mapping an area of about10 km2 (Figure 3). Areas 1 and 2 consist of multiple adjoining dives; single surveys were completed in fiveother areas. Sentry flies �60–65 m above the seafloor at a speed of �0.75 kt, and was equipped with the fol-lowing: (1) Reson 7125 400 kHz multibeam sonar; (2) Edgetech subbottom profiler—CHIRP (4–24 kHzsweep); (3) Edgetech 120/440 kHz side-scan sonar; (4) Seabird 49 Conductivity Temperature Depth (CTD)profiler; (5) Seapoint optical backscatter sensor; (6) Oxidation-reduction potential (ORP) sensor; (7) an elec-trochemical (Eh) sensor supplied by K. Nakamura; (8) digital still camera with 1 megapixel resolution; and (9)Dual 3-Axis Honeywell smart digital magnetometers. On-bottom time was typically 17–18 h. Survey boxeswere designed to obtain 100% bathymetric coverage except in Box 179 (Figure 3) where we spaced outlines to map a larger section of seafloor. In this box, we obtained 100% coverage with the low-frequency(120 kHz) side-scan sonar and 30% coverage with the multibeam sonar. Short photographic runs (a few100 m along the seafloor) were completed in Box 179 and the westernmost box of Area 2 to test the capa-bility of the Sentry digital camera.
The TowCam digital camera system was used to obtain seafloor images during nine dives (Figure 3, thickblue lines), often operating simultaneously with Sentry. The TowCam sled was on bottom for 2–4 h andtowed at �0.3 kt about 5 m above the seafloor. A total of 14,274 images were collected during the ninedives, each with a resolution of 16 megapixels. Water column data also were collected during the runs usinga SBE 25 Sealogger CTD profiler.
Dredging was a large component of the operations and many dredges were completed during Sentry sur-veys. The dredge stations are shown in Figure 3 with dredge tracks indicated by black lines, and rock litholo-gies indicated by circle fill color. We collected 2855 kg of basalt, diabase, gabbro, and peridotite in 63
−46˚50'
−46˚50'
−46˚40'
−46˚40'
−46˚30'
−46˚30'
−46˚20'
−46˚20'
16˚20' 16˚20'
16˚30' 16˚30'
16˚40' 16˚40'
16˚50' 16˚50'
AUV Sentry
TowCam
basalt
diabase
gabbro
peridotite
4000 2000
Water depth (m)
10 km
Axi
s
Russian samples
Wes
t R
idg
e
SCC
East
ern
bo
un
din
g fa
ult
East
Rid
ge
Area 1
Area 2
184181182
179
183
Krasnovhydrothermal
corrugations
corrugations
1
2
3
4
massif
Figure 3. Bathymetric map showing the locations of the Sentry surveys, TowCam dives, and dredges. Black rectangles: Sentry survey areas.Area 1 consists of five Sentry surveys and Area 2 consists of four. Numbers identify each of the single surveys. Blue lines: location of nineTowCam dives. Short black lines: dredge tracks. Filled circles: color indicates rock lithologies. Small circles: rocks collected during expedi-tions of the R/V Professor Logatchev [Bel’tenev et al., 2006; Cherkashov, personal communication, 2013]. White lines: volcanic axis. Dashedblack lines: location of profiles shown in Figure 13. SCC: South Core Complex.
Geochemistry, Geophysics, Geosystems 10.1002/2014GC005563
SMITH ET AL VC 2014. American Geophysical Union. All Rights Reserved. 4695
successful dredges. In addition,our Russian colleagues pro-vided the locations and typesof rocks that they obtained in2004–2006 during annualcruises of R/V ProfessorLogatchev [Bel’tenev et al.,2006; G. A. Cherkashov, perso-nal communication, 2013].Small circles on Figure 3 showthese locations and their con-tents. A Miniature AutonomousPlume Recorder (MAPR, http://www.pmel.noaa.gov/eoi/Plu-meStudies/mapr/) wasattached to the dredge wireduring the dredge hauls andrecorded light-backscattering(for suspended particle con-
centrations), oxidation-reduction potential (for detecting the presence of reduced chemical species such asH2S and Fe21), temperature, and pressure.
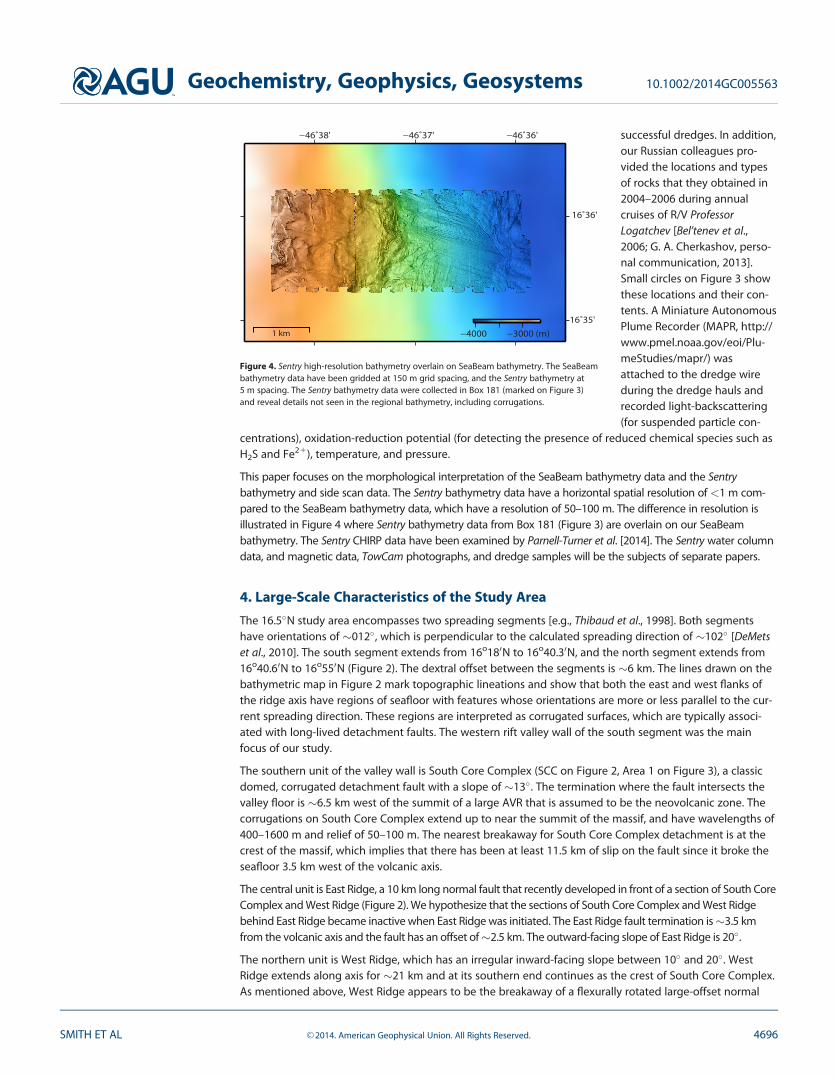
This paper focuses on the morphological interpretation of the SeaBeam bathymetry data and the Sentrybathymetry and side scan data. The Sentry bathymetry data have a horizontal spatial resolution of <1 m com-pared to the SeaBeam bathymetry data, which have a resolution of 50–100 m. The difference in resolution isillustrated in Figure 4 where Sentry bathymetry data from Box 181 (Figure 3) are overlain on our SeaBeambathymetry. The Sentry CHIRP data have been examined by Parnell-Turner et al. [2014]. The Sentry water columndata, and magnetic data, TowCam photographs, and dredge samples will be the subjects of separate papers.
4. Large-Scale Characteristics of the Study Area
The 16.5�N study area encompasses two spreading segments [e.g., Thibaud et al., 1998]. Both segmentshave orientations of �012� , which is perpendicular to the calculated spreading direction of �102� [DeMetset al., 2010]. The south segment extends from 16o180N to 16o40.30N, and the north segment extends from16o40.60N to 16o550N (Figure 2). The dextral offset between the segments is �6 km. The lines drawn on thebathymetric map in Figure 2 mark topographic lineations and show that both the east and west flanks ofthe ridge axis have regions of seafloor with features whose orientations are more or less parallel to the cur-rent spreading direction. These regions are interpreted as corrugated surfaces, which are typically associ-ated with long-lived detachment faults. The western rift valley wall of the south segment was the mainfocus of our study.
The southern unit of the valley wall is South Core Complex (SCC on Figure 2, Area 1 on Figure 3), a classicdomed, corrugated detachment fault with a slope of �13� . The termination where the fault intersects thevalley floor is �6.5 km west of the summit of a large AVR that is assumed to be the neovolcanic zone. Thecorrugations on South Core Complex extend up to near the summit of the massif, and have wavelengths of400–1600 m and relief of 50–100 m. The nearest breakaway for South Core Complex detachment is at thecrest of the massif, which implies that there has been at least 11.5 km of slip on the fault since it broke theseafloor 3.5 km west of the volcanic axis.
The central unit is East Ridge, a 10 km long normal fault that recently developed in front of a section of South CoreComplex and West Ridge (Figure 2). We hypothesize that the sections of South Core Complex and West Ridgebehind East Ridge became inactive when East Ridge was initiated. The East Ridge fault termination is�3.5 kmfrom the volcanic axis and the fault has an offset of�2.5 km. The outward-facing slope of East Ridge is 20�.
The northern unit is West Ridge, which has an irregular inward-facing slope between 10� and 20�. WestRidge extends along axis for �21 km and at its southern end continues as the crest of South Core Complex.As mentioned above, West Ridge appears to be the breakaway of a flexurally rotated large-offset normal
−46˚38' −46˚37' −46˚36'
16˚35'
16˚36'
−4000 −3000 (m)1 km
Figure 4. Sentry high-resolution bathymetry overlain on SeaBeam bathymetry. The SeaBeambathymetry data have been gridded at 150 m grid spacing, and the Sentry bathymetry at5 m spacing. The Sentry bathymetry data were collected in Box 181 (marked on Figure 3)and reveal details not seen in the regional bathymetry, including corrugations.
Geochemistry, Geophysics, Geosystems 10.1002/2014GC005563
SMITH ET AL VC 2014. American Geophysical Union. All Rights Reserved. 4696
fault with outward-facing slope of 35�–40�. Assuming that West Ridge originally broke the valley floor3.5 km from the volcanic axis, West Ridge fault would have an offset of �7.5 km.
Only the southern section of north segment is included in this study (Area 2, Figure 3). The westwall of the rift valley in Area 2 extends up three normal faults with offsets of <1 km, spaced 2–3 kmapart, which end at a small massif with a relief of 800 m (Figure 3). The outward-facing slope of themassif is �25�–30� suggesting that its crest is the breakaway of a long-lived fault. The inward-facingslope is 25�–35� , has no obvious corrugations, and appears eroded by mass wasting. The breakawayof the massif continues south as a narrow ridge and curves westward to follow the offset betweenthe north and south segments. A notable feature here is that the eastern wall of the axial valley isrelatively straight, with little evidence of an offset, composed of what appears to be axis-parallellineated volcanic terrain.
5. Ridge Axis Morphology
The width of the rift valley floor varies between the south and north segments. The south segment valleyfloor averages about 10 km wide, while the north segment valley floor is significantly narrower (�3–4 km inArea 2). An AVR extends along the rift valley floor, the entire length of the south segment (Figure 5a). Itssize does not vary systematically along axis; its height ranges from 200 to 400 m and its width from 3 to5 km. The AVR summit, though, deepens northward and is �500 m deeper in the northern part of the seg-ment (�3600 m) than near Area 1 in the south (�3100 m). No AVR is present in the north segment wherethe seafloor is much deeper (�4500 m in Area 2).
Sentry surveys were completed over four regions on the valley floor (Figure 5a). Sentry bathymetry datafrom three of these surveys (Area 1, Box 184, and Area 2) are shown in Figures 5b–5d. In Area 1, Sentrymapped the western flank of the AVR. Volcanic hummocks dominate the morphology (Figure 5b). Individualhummocks are up to 300 m wide and up to 75 m high, and pile up to form larger features. As an example,the mound of hummocks in the center of the Area 1 swath (Figure 5b) has a relief of �200 m. Faults withrelief of 5–20 m and spacing of only a few tens of meters cut the valley floor becoming more pervasive tothe west, systematically destroying the volcanic features until they are unrecognizable on the western edgeof the survey. Such extensive small-scale faulting is unique to Area 1. Sentry Box 184 (Figure 5c) to the northsurveyed two overlapping AVRs that are offset by �1 km. Both AVRs are built from individual piled up hum-mocks. In Area 2, the Sentry data show a single relatively unfaulted, cratered, smooth flow �1 km wide and�25 m high, and a pile of hummocks rising up to �100 m immediately to the south. Several hummockyridges (�100 m high) are seen in the western half of the survey. Faults with relief of up to 50 m cut the vol-canic morphology. As in Area 1, the degree of faulting increases to the west, but unlike the western edge ofthe valley floor in Area 1, the volcanic features in Area 2 have not been completely destroyed by 5–20 mhigh closely spaced faults.
The low-frequency (120 kHz) side-scan sonar data from Sentry Box 179 are displayed in Figure 6a. Trackspacing during this survey was �600 m, which limited the bathymetric coverage to only 30% of thearea (Figure 6b). The survey covered the hanging wall (valley floor) in front of East Ridge where a flex-ural basin has been created by fault slip. Several constructional volcanic features lie within the basin. Alarge flat-top flow 1600 m in diameter and 250 m high on its western side extends west from the AVR(Figure 6a); the flow represents �0.5 km3 of lava. Other, smaller flat-top flows are identified, some ofwhich appear to have been fed from the west. Seafloor photographs of the top of the large flat-top flowshow sediment covered terrain. The side-scan sonar data indicate that regions on the flank of this largeflow have less sediment cover than the top and thus, might represent more recent lava flows or debrisfans.
TowCam photographs were obtained within or near each of the Sentry surveys at the ridge axis (Figures 5aand 7). Sediment intermingles with pillow lavas in the three camera runs along the AVR in the south seg-ment, and striated pillows were seen in all dives (Figures 7a–7c, TC4, TC5, and TC8). The photographs at thenorth end of the segment (TC8, Figure 7c) show slightly more sediment on top of the pillows, on average,compared to the two camera runs to the south, although we have not quantified the difference. In Area 2,seafloor photographs of the top of the smooth cratered flow (Figure 7d, TC9) show only flat, sedimentedseafloor along the length of the tow.
Geochemistry, Geophysics, Geosystems 10.1002/2014GC005563
SMITH ET AL VC 2014. American Geophysical Union. All Rights Reserved. 4697

6. Western Rift Valley Wall
For each of the Sentry surveys on the western flank of the ridge axis, the Sentry bathymetry data, dredgetracks, rock types sampled, and TowCam tracks are shown in Figures 8–12. Slope maps calculated from theSentry bathymetry highlighting the shapes of features, as well as Sentry bathymetric profiles, are alsoshown.
6.1. Area 1Five adjoining Sentry surveys in Area 1 extend from the valley floor onto the corrugated South Core Com-plex detachment surface to near its crest (Figure 8). The survey includes the southern end of East Ridge andwhat we interpret as the inactive section of South Core Complex behind East Ridge. The topography at theintersection of East Ridge and South Core Complex is complicated and remains to be understood. Small-scale corrugations run from close to the top of the detachment surface downslope for �4 km. These corru-gations have wavelengths of less than a few hundred meters and amplitudes <10 m. Several outward-facing scarps with relief of <10 m are observed on the corrugated detachment surface. The termination ofthe detachment surface behind East Ridge is sharp and easily identified. In contrast, the termination of
Figure 5. Bathymetry of the ridge axis. (a) SeaBeam bathymetric map with topographic profiles drawn across the axis. Shading on profiles: bathymetry shallower than 3000 m. Whitelines: ridge axis. Black rectangles: Sentry survey locations. Blue lines: TowCam (TC) dives labeled by numbers. Sentry bathymetric maps of the valley floor are shown for (b) Area 1, (c) Box184, and (d) Area 2. EBF: eastern boundary fault. Features discussed in the text are labeled.
Geochemistry, Geophysics, Geosystems 10.1002/2014GC005563
SMITH ET AL VC 2014. American Geophysical Union. All Rights Reserved. 4698

South Core Complex with the valley floor is difficult to identify because the western edge of the rift valley isso severely faulted and fissured that it is hard to define where the volcanic morphology begins.
Several dredges completed within and near Area 1 primarily yielded basalt but also diabase, serpenti-nized peridotite, and gabbro near the top of the massif. Five TowCam dives were completed in Area 1.Dive TC4 imaged the AVR as described above (Figure 7a). TC1 was run across the valley floor west of theAVR and the photographs show more extensive sediment cover than along the summit of the AVR.Numerous cracks and faults also are observed on the photographs from TC1 consistent with the obser-vation that deformation of the lavas increases westward from the volcanic axis. TC3 was run over thetermination of South Core Complex at the valley floor. Photographs show areas of completely sedimen-ted seafloor, but in the western half of the run there are outcrops that look like slabs of rock that maybe the fault surface. Along the eastern half of the run there are regions of basalt rubble, cracks filledwith basalt rubble, and what appear to be in situ pillows of the valley floor. The photographs do not pin-point the location of the fault termination, however. TC2 began near the crest of the massif and ranonto the corrugated surface of South Core Complex. Many of the photographs show sedimented sea-floor. Near the top of the massif there are piles of rubble, but it is hard to determine what they repre-sent. Farther along the run, rectangular slabs, some in place, probably represent the fault surface. All ofthe photographs from TC6 on the section of South Core Complex behind East Ridge show only sedi-mented seafloor.
−46˚37' −46˚36' −46˚35' −46˚34'
16˚28'
16˚29'
−46˚37' −46˚36' −46˚35' −46˚34'
16˚28'
16˚29'
−4500 −3500 −2500 1 km
a)
b)
Eas
t R
idg
e f
ault axis
Eas
t R
idg
e f
ault
axis
179
AVR
edge ofAVR
edge ofAVR
AVR
Water depth (m)
Figure 6. High-resolution data from survey Box 179 (location in Figure 5a). (a) Low-frequency (120 kHz) side-scan sonar data provide 100%coverage of the survey box. Light shades: low reflectivity normally indicative of sediment covered terrain. Dark shades: high reflectivity. (b)Bathymetry data cover only 30% of the survey box. Solid black lines: flat tops of flows. Hachured black line: depression at the top of thelarge flat-top flow. Long dashed lines: edge of aprons at the base of two of the flows. Short dashed line: edge of the axial volcanic ridge(AVR). Double black line: ridge axis.
Geochemistry, Geophysics, Geosystems 10.1002/2014GC005563
SMITH ET AL VC 2014. American Geophysical Union. All Rights Reserved. 4699

6.2. Area 2Area 2 (Figure 9) is located north of the right-lateral, nontransform offset between the south and north seg-ments (Figure 3). As described above, there are constructional volcanic features on the valley floor, somewith relief of 100 m. The western valley wall consists of four fault blocks. The first three (f1–f3, Figure 9a)have 1 km offsets or less and minor rotations of <13� . We infer that these are short-lived faults, each aban-doned quickly as the next formed closer to the axis. The top of each fault block is covered by volcanic hum-mocks and flows similar to those on the valley floor. Dredging on these blocks recovered basalt. Anoncorrugated massif is observed west of fault block 3 (f4, Figure 9a). The inward-facing scarp of this massifis significantly modified by mass wasting, producing seafloor slopes of �30�. The headwall scars are deeplyincised, and blocks a few tens of meters wide and up to 10 m high appear to have fallen down the scarps. Adredge on a headwall scar (Figure 9a) recovered diabase, serpentinized peridotite, and gabbro. The top ofthis massif is rotated �25� outward (Figure 9b), and seafloor photographs show nearly sediment-free pillowbasalts on this slope. Presumably the pillows are swept clean of sediments by currents at the top of themassif. We interpret the massif as a detachment fault with an offset of �4 km.
Between Areas 1 and 2, we surveyed three sections of seafloor in regions of ambiguous topography (Figure3). Box 181 is at the base of the rift valley wall, and Boxes 182 and 183 are farther off axis. In Boxes 182and183, the regional SeaBeam bathymetry data suggest relict corrugations.
6.3. Box 181Sentry Box 181 is located at the base of the rift valley wall east of West Ridge (Figures 3 and 10). Thebathymetry data show a finely corrugated, low-angle detachment fault intersecting the valley floor. The cor-rugations have wavelengths on the order of only tens of meters and just a few meters of relief (smaller thanon the South Core Complex detachment surface, see above). The termination of the detachment fault at itsintersection with the volcanic morphology of the valley floor is sharp and located �4.5 km from the vol-canic axis. The base of the detachment surface has an average slope of 15�. Its morphology, however,changes significantly upslope. About 1.5 km west of its termination, the detachment surface appears cov-ered by debris, most likely shed from upslope. The seafloor then ramps up for �0.5 km at an average slopeof 20�. Farther west, the average slope is 15�, and mass wasting has degraded the fault surface producingsmall, curved headwall scars with relief <30 m. Corrugations are still visible but less pronounced in thiswestern section of the survey. Numerous outward-facing scarps with relief <15 m have also formed here,similar to those observed on South Core Complex (Figure 8a).
a) b)
c) d)
TC5TC4
TC8 TC9
1 m
Figure 7. TowCam digital photographs from the ridge axis. TowCam runs are shown in Figure 5a. Sediment and striated pillows areobserved in the photographs from (a) TC4 near Area 1, (b) TC5 near Box 179, and (c) TC8 near Box 184. (d) TC9 in Area 2 was run along thetop of the smooth cratered flow marked on Figure 5d, and all photographs show sedimented seafloor.
Geochemistry, Geophysics, Geosystems 10.1002/2014GC005563
SMITH ET AL VC 2014. American Geophysical Union. All Rights Reserved. 4700

Two dredges were made within the region of Sentry Box 181 (Figure 10a). One was on the lower corrugatedsurface and the other was conducted slightly south of the Sentry box farther upslope. The two dredges con-tained diabase, diabase breccia, and serpentinized peridotite.
6.4. Box 182Box 182 is located behind West Ridge (Figures 3 and 11) where the SeaBeam bathymetry data suggestlarge-scale corrugations (wavelength of several kilometers). The Sentry bathymetry data show a landscapeprofoundly affected by mass wasting. Large sections of the high on the western side of the survey box havecollapsed into the depression on the east, leaving large scars. The relief on the headwall scars reaches up to200 m. Two adjacent semicircular collapses, each nearly 1 km wide, created a spur between them reachingout to the east. It is likely that the spurs are features that we identified previously as corrugations. No vol-canic features are observed in this region, and as in the region of mass wasting in Area 2, blocks a few tensof meters wide are scattered over the landscape. Gabbro and serpentinized peridotite were sampled within
16˚23'
16˚24'
16˚25'
16˚26'
East
Ridge
Area 1
a)
-2500
-3000
-3500
−3500 −2500
basalt
diabase
gabbro
peridotite
VE = 1.5
−46˚42' −46˚40' −46˚38'
16˚23'
16˚24'
16˚25'
16˚26'
dredge tracktowcam
1 km
−46˚36'
Wat
er
de
pth
(m
)
0 2 4 8 10 12Distance along track (km)
6
c)
termination?
EastRidge
corrugations
0 20 40 60
slope (degrees)
b)
14o
6o
hummocky
termination
termination
TC4
TC3
TC1
TC2
TC6
−46˚42' −46˚40' −46˚38' −46˚36'
corrugations
outwardfacing scarps
A
A’
A A’
termination?
Water depth (m)
Figure 8. Sentry data collected in Area 1 (Figure 3). (a) Bathymetric map. Blue lines: locations of TowCam (TC) runs identified by number.Black lines with circles: dredge tracks and rock types indicated by circle fill color. Solid white line: inferred inactive termination of SouthCore Complex behind East Ridge. Dashed white line: inferred location of the active termination. Dashed black line: location of the bathy-metric profile shown in (c). (b) Slope map derived from the Sentry bathymetry data for slopes <60� . Slopes are calculated for four facingdirections (E, W, N, S). Labels as in Figure 8a. (c) Bathymetric profile along the black dashed line in Figure 8a. Seafloor slopes are marked, aswell as the inferred location of the fault termination.
Geochemistry, Geophysics, Geosystems 10.1002/2014GC005563
SMITH ET AL VC 2014. American Geophysical Union. All Rights Reserved. 4701

and close to this survey area indicating that the seafloor behind West Ridge is a detachment surface thathas experienced significant mass wasting as it moved off axis.
6.5. Box 183Box 183 is located over a section of West Ridge behind East Ridge (Figures 3 and 12). Sentry bathymetrydata indicate that this region has experienced mass wasting similar to that in Box 182. A large slump blockis marked in Figure 12a. The associated headwall scar is �1 km wide with a relief of �100 m. This headwallscar and other scars along the eastern slope of West Ridge have produced large spurs between them, whichcan be seen in the SeaBeam bathymetry data. Rockslides and a field of large blocks similar to those identi-fied in Area 2 and Box 182 are also seen in the Sentry bathymetry. A number of dredges were completedwithin and near to Box 183 and yielded basalt, diabase, serpentinized peridotite, and gabbro.
7. Faulting on the Western Flank of the Ridge Axis
To understand the spreading history in the 16.5�N region, we interpret the subsurface faulting along fourSeaBeam bathymetric profiles in Figure 13. The profile locations are indicated in Figure 3. Each profile is�30 km long and modeled following Schouten et al. [2010]. The shapes of the faults are based on the flex-ural fault rotation model of Buck [1988], who showed that as faults continue to slip they rotate outward,
fault breakaway
fault termination
−4500 −3500 −2500 1 km
Area 2a)
c)
basalt
diabase
gabbro
peridotite
VE = 1.5
−46˚34' −46˚33' −46˚32' −46˚31' −46˚30' −46˚29' −46˚28' −46˚27'
16˚43'
16˚44'
dredgetrack
towcam
Wat
er
de
pth
(m
)
−5000
−4000
−3000
−2000
0 2 4 8 10 12 14Distance along track (km)
66
f1f2
f3
f4
1 km
0 30 60
slope (deg)
relativelyunfaultedvolcanics
rotatedvolcanics
30o
13o
33o
35o
27o 23o
b)
TC9
masswasting
volcanicsvolcanics
volcanics
f1
f2
f3
f4
16˚43'
16˚44'
−46˚34' −46˚33' −46˚32' −46˚31' −46˚30' −46˚29' −46˚28' −46˚27'
2-5o
A
A’
A A’
4o
1-2o
Water depth (m)
Figure 9. Sentry data collected in Area 2 (Figure 3). (a) Bathymetric map. Red line: location of a TowCam (TC9) run. Black lines with circles:dredge tracks and rock types indicated by circle fill color. f: fault blocks numbered from the axis. Solid white line: fault terminations.Dashed white lines: breakaways of faults. Dashed black line: location of the bathymetric profile in (c). (b) Slope map derived from the Sentrybathymetry for slopes <60� . Slopes are calculated for four facing directions (E, W, N, S). Vertical lines with open circles: fault breakaways;vertical lines with black filled circles: fault terminations. (c) Bathymetric profile along the black dashed line in Figure 9a. Seafloor slopes aremarked as well as fault breakaways and terminations.
Geochemistry, Geophysics, Geosystems 10.1002/2014GC005563
SMITH ET AL VC 2014. American Geophysical Union. All Rights Reserved. 4702

dome upward, and flatten to near horizontal. Long-lived detachment faults may be covered by raftedblocks, which are slices of hanging wall from the valley floor cutoff by normal faults that root in the sameprimary fault [Buck, 1988]. Rafted blocks are uplifted and rotated with the footwall and carried away fromthe axis [Reston and Ranero, 2011; Smith et al., 2008]. In most cases, it is difficult to determine from the mor-phology alone whether a new fault at the axis is a rafted block or whether the older detachment ceasedextending and a new detachment developed. Therefore, we present two interpretations for each profile:one of discontinuous faulting and the other of faulting on a single detachment and the formation of raftedblocks.
7.1. Profile 1—South Core ComplexProfile 1 runs from the valley floor through Area 1 and continues west of the crest of South Core Complex.In the discontinuous model (Figure 13a), an older detachment stops slipping and normal two-sided
1 km
Wat
er d
epth
(m)
0 1 2 4Distance along track (km)
3
−4000
−3000
valley
corrugations
corrugations
15o
ramp
20o
10o
15o
VE=1
termination
10o
−46˚38' −46˚37' −46˚36'
−4000 −3000
16˚35.5'
16˚36'hanging wall/
termination
debris?ramp
1 km
a)
0 30 60 slope (deg)
TC7
basalt
diabase
gabbro
peridotitedredge tracktowcam
−46˚38' −46˚37' −46˚36'
masswasting
outward-facingscarps
corrugationscorrugations
hanging wall/
termination
debris?ramp
masswasting
outward-facingscarps corrugationscorrugations
b)
c)
181
A
A’
A A’
Water depth (m)
Figure 10. Sentry data collected in Box 181 (Figure 3). (a) Bathymetric map. Blue line: location of TowCam dive (TC7). Black lines withcircles: dredge tracks and rock types indicated by circle fill color. Solid white line: active termination of West Ridge detachment fault. Long-dashed white lines: a section of seafloor that ramps up for �0.5 km at an average slope of 20� . Short-dashed white lines: headwall scarsfrom mass wasting of the detachment surface. Corrugations are observed both east and west of the ramp. Black dashed line: location ofthe bathymetric profile in (c). (b) Slope map derived from the Sentry bathymetry for slopes <60� . Slopes are calculated for four facingdirections (E, W, N, S). Labels as in Figure 10a. (c) Bathymetric profile along the black dashed line in Figure 10a. Seafloor slopes are marked.
Geochemistry, Geophysics, Geosystems 10.1002/2014GC005563
SMITH ET AL VC 2014. American Geophysical Union. All Rights Reserved. 4703

magmatic spreading occurs for a few kilometers of half spreading. The breakaway of the new normal faultrotates outward and the detachment surface domes upward as it continues to extend to form South CoreComplex. Alternatively, in the continuous model, a single detachment fault has existed for �1.5 Ma, assum-ing a half-spreading rate of 12.5 km/Ma. The top of South Core Complex is the breakaway of a rafted blockthat roots into the original detachment surface. Diabase and serpentinized peridotite were dredged west ofSouth Core Complex consistent with the interpretation that a detachment surface is exposed there. Basaltwas also dredged in this region and most likely is from the rotated section of valley floor on the outward-facing slope of South Core Complex.
7.2. Profile 2—East RidgeProfile 2 is �7 km north of Profile 1 (Figure 3), and extends from the volcanic axis, through Box 179, acrossEast Ridge, through Box 183, and across West Ridge (Figure 13b). In the discontinuous model, an earlier
a)
b)
−46˚43' −46˚42' −46˚41'
16˚36'
16˚37'
−2750 −2500
1 km
0 30 60
slope (deg)
Wat
er
de
pth
(m
)
0 1 2 3
−2600
−2400
Distance along track (km)
8o
20o
basalt
diabase
gabbro
peridotitedredge tracktowcam
spur
spur
blocks
VE=1
c)
16˚36'
16˚37'
−46˚43' −46˚42' −46˚41'
masswasting
182
A
A’
A A’
masswasting
masswasting
blocks
Water depth (m)
Figure 11. Sentry data collected in Box 182 (Figure 3). (a) Bathymetric map. Black lines with circles: dredge tracks and rock types indicatedby circle fill color. Dashed white lines: headwall scars from mass wasting of the detachment surface. Fields of large blocks are labeled. Blackdashed line: location of the bathymetric profile in (c). (b) Slope map derived from the Sentry bathymetry for slopes <60� . Slopes are calcu-lated for four facing directions (E, W, N, S). Labels as in Figure 11a. (c) Sentry bathymetric profile along the black dashed line in Figure 11a.Seafloor slopes are marked.
Geochemistry, Geophysics, Geosystems 10.1002/2014GC005563
SMITH ET AL VC 2014. American Geophysical Union. All Rights Reserved. 4704

detachment fault stops slip-ping. After a period of normalmagmatic spreading, WestRidge detachment forms. It toostops slipping and normal two-sided magmatic spreadingoccurs for several km beforeEast Ridge fault forms. In thecontinuous model, both WestRidge and East Ridge are raftedblocks on a single detachmentthat has existed for at least1.7 Ma.
7.3. Profile 3—West RidgeProfile 3 is �12 km north ofProfile 2 and runs across thevalley floor near to Box 184,through Box 181, and extendswestward close to Box 182(Figure 13c). In the discontinu-ous model, an older detach-ment stops slipping andnormal two-sided magmaticspreading occurs for a shortperiod. West Ridge fault formsnext, rotating outward as itslips. The section of magmaticcrust created during the periodbetween faulting is rafted upthe rift valley wall. In this inter-pretation, it is possible that theramp identified in Box 181 (Fig-ure 10) marks the base ofcrustal material.
In a continuous faultingmodel, West Ridge faultbounds a rafted block. In thisinterpretation, the originaldetachment fault has beenslipping for at least 1.7 Ma. IfWest Ridge is a rafted block, itis possible that the ramp,instead of marking the base of
the crust as in the discontinuous model, may mark the deep tip of the rafted block lying on the originaldetachment surface.
7.4. Profile 4—North SegmentProfile 4 runs through Area 2 in the north segment (Figure 13d). In the discontinuous model, an earlierdetachment fault stops slipping and two-sided magmatic spreading occurs. A new detachment fault ini-tiates and forms the small massif on the western edge of Area 2. This detachment has an offset of �4 km; itstops slipping at �0.3 Ma after which three successive short-lived faults form. In a continuous faultingmodel, the massif is a rafted block that roots into an older detachment fault that has been slipping for atleast 1.7 Ma. As in the discontinuous model, however, the Area 2 detachment fault stops slipping at �0.3Ma, and three short-offset faults form.
−46˚42' −46˚41'
16˚29'
16˚30'
−3500 −2500
Water depth (m)a)
1 km
−4000
−3000
−2000
VE=1
0 30 60
slope (deg)
Wat
er
de
pth
(m
)
0 1 2 3Distance along track (km)
25o
10o
28o
20o
11o
basalt
diabase
gabbro
peridotitedredge tracktowcam
b)
c)
blocks
rockslides
blocks
slumpblock
slumpblock 16˚29'
16˚30'
−46˚42' −46˚41'
slumpblock
rockslides
basin
basin
basin
We
st R
idg
eW
est
Rid
ge
183 masswasting
masswasting
masswasting
masswasting
A
A’
A A’
Figure 12. Sentry data collected in Box 183 (Figure 3). (a) Bathymetric map. Black lines withcircles: dredge tracks and rock types indicated by circle fill color. Dashed white lines: head-wall scars from mass wasting of the seafloor. Black dashed line: location of the bathymetricprofile in (c). A field of blocks and the location of rockslides are labeled. (b) Slope mapderived from the Sentry bathymetry for slopes <60� . Slopes are calculated for four facingdirections (E, W, N, S). Labels as in Figure 12a. (c) Bathymetric profile along the black dashedline in Figure 12a. Seafloor slopes are indicated.
Geochemistry, Geophysics, Geosystems 10.1002/2014GC005563
SMITH ET AL VC 2014. American Geophysical Union. All Rights Reserved. 4705

8. Discussion
8.1. Detachment Fault Morphologies at 16.5�NAt the slow spreading MAR, oceanic detachment faults exhibit several morphologies in the regionalbathymetry data. The classic domed, corrugated detachment fault surfaces are easily recognizable, andlower crustal and upper mantle rocks have been drilled and sampled from many of them [Blackman et al.,2006; Cann et al., 1997; Dick et al., 2008; Tucholke et al., 1998]. Noncorrugated massifs from which lowercrustal and upper mantle rocks have been obtained are also interpreted as detachment faults [e.g., Dicket al., 1981]. Examples of noncorrugated massifs include the TAG massif at 26�N, associated with a steeplydipping zone of earthquakes reaching 7 km below the spreading axis, apparently marking the subsurfacedetachment fault [deMartin et al., 2007], and several massifs in the region south of the Fifteen-Twenty frac-ture zone [Schroeder et al., 2007] including Logatchev at 14�450N [Cherkashov et al., 2010]. Finally, narrow lin-ear ridges that are formed as the breakaway of long-lived faults rotate outward are important indicators ofdetachment faulting [MacLeod et al., 2009; Smith et al., 2008]. In our survey area, South Core Complex is aclassic corrugated detachment surface. The detachment fault at the western edge of Area 2 is an exampleof a noncorrugated massif. East and West Ridges are back-tilted ridges marking fault breakaways.
The Sentry survey within Box 181 (Figure 10) revealed a new detachment fault morphology. The irregular,low-angle rift valley wall seen in the SeaBeam bathymetry is in fact, a finely corrugated detachment faultsurface with a sharp termination at the valley floor. The corrugations have a wavelength of tens of metersand relief of a few meters. Fine-scale corrugations have been observed previously on detachment surfaces
05101520Distance from the axis (km)
Discontinuous fault Continuous fault and rafted blocks
Box 181Box 182
Box 181Box 182
Box 183 Box 183
Area 2
SCC
Area 1
Wat
er
de
pth
(m
)
Area 1
SCC
-2000
-5000
-3000
-4000
-2000
-5000
-3000
-4000
-2000
-5000
-3000
-4000
-2000
-5000
-3000
-4000
a)
b)
c)
d)
axis axis
05101520Distance from the axis (km)
1
2
3
4
WR WR
WR WR
ER ER
T T
T T
TT
Area 2
Area 1 Area 1
Box 181Box 18282
Box 181Box 1828
Box 183 Box 183
basalt diabase gabbro peridotite
Figure 13. Subsurface interpretation of faulting along four SeaBeam profiles. The profile locations are shown in Figure 3. (a) Profile 1—Area 1, (b) Profile 2—East Ridge, (c) Profile 3—West Ridge, and (d) Profile 4—Area 2. Two models for detachment fault formation are presented for each profile. In the discontinuous model, faulting ceases on an older detachmentfault, and after a period of normal magmatic spreading a new detachment fault forms. In the continuous model, new normal faults at the axis root into the single, main detachment, anda section of valley floor is transferred from the hanging wall to the footwall as a rafted block. Boxes: locations along the profiles of the Sentry surveys. Bold black line: fault surface. Blackdashed line: subsurface extent of a detachment fault. Black vertical line: ridge axis. T: termination.
Geochemistry, Geophysics, Geosystems 10.1002/2014GC005563
SMITH ET AL VC 2014. American Geophysical Union. All Rights Reserved. 4706

[Blackman et al., 2002; MacLeod et al., 2002, 2009; Mallows and Searle, 2012], but only on those surfaces thatalso have larger-scale corrugations. Thus, it is likely that some of the other areas along the MAR previouslyinterpreted as low-angle and irregular surfaces may in fact be long-lived detachment surfaces with expo-sures of finely corrugated fault surfaces.
As described in the previous section, rafted blocks are sections of hanging wall (valley floor) cutoff by nor-mal faults that root into a primary detachment fault. As they are carried off axis, rafted blocks are upliftedand rotated with the detachment footwall. Rafted blocks have been imaged seismically on older Atlanticseafloor crust [Reston and Ranero, 2011], and their formation is probably common in the oceans. Reston andRanero [2011] suggested that it may be difficult to recognize the morphology of detachment faulting inthose areas where the exhumed detachment surface is covered by rafted blocks. As shown here and in pre-vious studies, the breakaways of rafted blocks rotate outward to form narrow ridges that are similar to theridges that mark the rotated breakaways of new long-lived faults [Schouten et al., 2010; Smith et al., 2008].Thus areas of detachment faulting will still be recognizable by the large outward rotation (>25�) of the faultblocks. As shown in Figure 13, however determining whether a narrow ridge marks the breakaway of arafted block or that of a new detachment fault from the morphology alone is difficult.
8.2. Axial ProcessesThe outward rotation of normal faults with increasing extension, from small offset faults to long-liveddetachments, has been described using models of fault flexure [e.g., Buck, 1988]. Such models require anestimate of the effective elastic thickness of the axial lithosphere, Te, which specifies the flexural wave-length. The west face of East Ridge dips 20� . Assuming this outward-facing slope is due to the flexural rota-tion of an originally subhorizontal section of the rift valley floor, this implies 20� of outward rotation whichfor a 2.5 km offset indicates a Te 5 0.5–1 km [Smith et al., 2008, Figure 6]. This value of Te is similar to the val-ues found at the 13�N detachment faults [Smith et al., 2008] and several central North Atlantic detachmentfaults [Schouten et al., 2010].
A clearly identifiable AVR exists along the length of the south segment adjacent to South Core Complex,East Ridge, and West Ridge. The AVR is several hundred meters high and a few kilometers wide, consistentwith the sizes of AVRs described at other sections of the MAR [e.g., Searle et al., 2010; Smith and Cann,1993]. Because modeling suggests that detachment faults form primarily when the fraction of plate separa-tion (M) taken up by magma accretion is between �0.3 and 0.5 [Buck et al., 2005; Olive et al., 2010; Tucholkeet al., 2008], we infer that M is at the high end of this range in areas with detachment morphology androbust AVRs. An M of 0.5 would imply that 50% of the extension is taken up by detachment faulting and50% by magmatic accretion (which includes minor faulting).
No AVR is present in Area 2 where water depths average �4500 m (compared to �3400 m adjacent toSouth Core Complex). We interpret Area 2 as having lower magma supply and an M << 0.5. It is impossibleto have a better estimate of M, but since only short-offset normal faults have formed in Area 2 for the last�0.3 Ma, the true relationship between magma supply and faulting style probably is not simple.
The distances of fault terminations from the volcanic axis vary along the axis in our study area. At SouthCore Complex, the location of the fault termination is not known precisely, but the data suggest it is�6.5 km from the volcanic axis. At West Ridge (Sentry Box 181), which has slipped for a similar length oftime as South Core Complex, the termination is �4.5 km from the volcanic axis. The location of a fault termi-nation may be controlled by the amount of volcanic infill covering a sloping detachment surface. Thus,because of the large volume of infill adjacent to South Core Complex, lavas cover more of the detachmentsurface and its termination is far from the volcanic axis while at West Ridge where the volume of volcanicinfill is not as large, the termination is closer to the axis. Note that in Area 1 where volcanic infill is large, thevalley floor lavas near to the termination are significantly faulted and fissured. The low angle of the emerg-ing detachment footwall (6�) in this region may enhance deformation of the thin wedge of hanging walllavas covering it, leading to the more intense faulting and fissuring observed in this area.
8.3. Evolution of Detachment SurfacesExcept at South Core Complex, we observe significant mass wasting of detachment surfaces as they move offaxis. Where mass wasting is substantial, spurs have formed between large semicircular headwall scars (see Box183, Figure 11). The spurs are elongate in a direction close to the slip direction, and large enough to be seen in
Geochemistry, Geophysics, Geosystems 10.1002/2014GC005563
SMITH ET AL VC 2014. American Geophysical Union. All Rights Reserved. 4707

the regional bathymetry.Their formation may becontrolled by preexistinglarge-scale corrugations thathave the same wavelengthof a few kilometers.
Outward-facing scarps withrelief of <15 m are seen onthe Sentry bathymetry datacollected over the corru-gated surfaces of SouthCore Complex and WestRidge detachment. The ori-gin of these faults isunknown, but a possibility isthat they form as thedetachment surface flexesand rotates outward to nearhorizontal. Another possibil-ity is that they form fromspalling or flaking of thefault surface once it isexhumed [e.g., Petit, 1987].
8.4. Controls on theFormation ofCorrugationsCorrugations have beenobserved at many scales,from megamullions (wave-length of�10 km and ampli-tude of�500 m) [Tucholkeet al., 1998] through corruga-tions (�1 km,�50–100 m)to small-scale features suchas the corrugationsdescribed on South Core
Complex and West Ridge from the Sentry data (�10–100 m,�5 m) and centimeter-scale striations [e.g., Karson,1999]. On most detachment surfaces, corrugations coexist on a wide range of scales [Blackman et al., 2002;MacLeod et al., 2002, 2009; Mallows and Searle, 2012], superimposed one on the other. How do corrugations form?
Tucholke et al. [2008] suggested that at mid-ocean ridges with low melt supply the uneven distribution ofmagmatic intrusions beneath the ridge axis creates an irregular brittle-ductile transition. As a detachmentextends in such a region, the footwall takes on the shape of the base of the brittle layer exhuming large-scalemegamullions. This is analogous to the geologic continuous casting model of Spencer [1999]. We do not think,however, that the irregularity in magma distribution at the axis could offer a mechanism for the formation ofall corrugations. It is possible that some corrugations, especially those observed above the brittle/ductile tran-sition close to the fault breakaway at West Ridge and South Core Complex, may be formed from segmentedfault traces that break through and connect (anastomosing faults) [Ferrill et al., 1999; Wong and Gans, 2008].Such corrugations continue to be formed as the detachment slips. Of note is that in both areas the corruga-tions close to the breakaway appear to be continuous with the corrugations close to the termination.
8.5. Faulting at 16.5�NIn the 16.5�N region, lineations that parallel the slip direction and are continuous for up to 10 km areobserved on the western flank of the axis. We interpret these lineations as large-scale corrugations formed
16o40’N
East
Rid
ge
Wes
t R
idg
e
16o30’N
−46˚40' −46˚30' −46˚20'
16˚20'
16˚50'
SC
C
inner
valley
corrugations
acti
ved
etac
hm
ent
acti
ved
eta
chm
en
t
det
ach
men
t
det
ach
men
t
det
ach
men
t
det
ach
men
t
massif
axis
Krasnov
10 km
faultbacktilt > 20o
fault
corrugation
volcanicterrain
Figure 14. Interpretation of faulting at the 16.5� region of the MAR. The bathymetry data are shownbeneath the interpretation. Long dashed lines: volcanic axis. Short dashed lines: edge of the inner val-ley floor. Thin hachured black lines: breakaways of faults. Bold hachured black lines: breakaways offaults with outward rotation> 20� . Darker shading: volcanic seafloor. The western flank of the studyarea is composed primarily of active and extinct detachment surfaces. A noncorrugated massif withoutward-facing slope of >20� is present on the eastern flank and may be a detachment fault.
Geochemistry, Geophysics, Geosystems 10.1002/2014GC005563
SMITH ET AL VC 2014. American Geophysical Union. All Rights Reserved. 4708

during slip on long-lived detachment faults. The lineations indicate that detachment faulting has domi-nated parts of the western flank of the 16.5�N region for perhaps as long as 5 Ma (Figure 2), assuming sym-metrical spreading. Nearer to the axis, we extend our findings from the Sentry surveys and ourinterpretation of subsurface faulting to identify the key tectonic features.
Figure 14 summarizes our findings. The breakaways of South Core Complex, West Ridge and the Area 2 massifare 12–15 km from the current axis, suggesting that they were all active at the same time (�0.7–0.9 Ma assumingthey initiated 3.5 km from the volcanic axis and a half-spreading rate of 12.5 km). These features may have linkedtogether to form a single detachment along�50 km of the axis. Detachment faulting stopped in Area 2, withthe initiation of a sequence of short-lived faults. The breakaway of the earliest short-lived fault is�7.5 km fromthe axis suggesting that it formed�0.3 Ma. Farther south the 10 km long East Ridge fault formed at�0.2 Ma(given its 2.5 km offset), and interrupted the slip on the detachment surface behind it. From the data in hand, wecannot determine whether East Ridge is a rafted block or a new fault that formed after a period of two-sidedmagmatic spreading (Figure 13). The curved shape of the north and south tips of East Ridge, however, suggeststhat it could be breaking through to connect to what might be a single segment-long detachment surface.
There are presently no active detachment faults on the eastern side of the ridge axis along the south andnorth segments. The SeaBeam bathymetry data show, however, that detachment fault morphologies arepresent over a large portion of the eastern flank on crust> 2 Ma (Figure 2). The presence of these featureson off-axis seafloor east of the axis, in combination with the detachment morphologies that are observedwest of West Ridge, implies that within the last 5 Ma both sides of the axis have experienced detachmentfaulting perhaps even simultaneously.
9. Conclusions
Detachment faulting has dominated parts of the western flank of the 16.5�N region for perhaps as long as 5Ma. Active detachment faulting currently is limited to the western side of the axis. Nonetheless, detachmentfault morphologies also are present over a large portion of the eastern flank on crust >�2 Ma indicatingthat within the last 5 Ma parts of the ridge axis may have experienced periods of two-sided detachmentfaulting.
The study area exhibits a variety of morphologies indicative of detachment faulting including a classic cor-rugated massif, noncorrugated massifs, and back-tilted narrow ridges marking detachment fault break-aways. We also recognize a new morphology: a low-angle (10�–20�), irregular surface in the regionalbathymetry is shown to be a corrugated detachment surface. These corrugations have wavelengths of onlytens of meters and amplitudes of a few meters and are only visible in the high-resolution Sentrybathymetry.
Multiscale corrugations extend from the termination of detachment fault surfaces to only a few kilometersfrom the fault breakaway. The presence of corrugations that close to the breakaway of the detachmentfaults suggests that some corrugations form above the brittle/ductile transition perhaps by anastomosingfaults.
A robust AVR, several hundred meters high and a few kilometers wide, exists along the 40 km length of thesouth segment adjacent to active detachments faults. We infer that M 5 0.5 in this segment (the fraction ofplate separation accommodated by magma accretion) [Buck et al., 2005; Olive et al., 2010; Tucholke et al.,2008]. In the north segment where water depths reach �4500 m and no AVR is present, we conclude thatmagma supply is lower and thus M << 0.5. Currently, active detachment faulting does not appear to occurin the north segment. These observations add to the growing evidence that detachment faulting is likelydependent on a balance between several factors including magma input.
ReferencesBaines, A. G., M. J. Cheadle, B. E. John, and J. J. Schwartz (2008), The rate of oceanic detachment faulting at Atlantis Bank, SW Indian Ridge,
Earth Planet. Sci. Lett., 273(1-2), 105–114.
Bel’tenev, V., A. Shagin, V. Markov, I. Rozhdestvenskaya, T. Stepanova, G. Cherkashev, I. Fedorov, A. Rumyantsev, and I. Poroshina (2004), Anew hydrothermal field at l6�38.40N, 46�28.50W on the Mid-Atlantic Ridge, InterRidge News, 13, 5–6.
Bel’tenev, V. E., A. A. Shagin, V. F. Markov, I. I. Rozhdestvenskaya, L. I. Lazareva, I. P. Fedorov, G. A. Cherkashev, T. V. Stepanova, I. M. Poroshina,and V. V. Shilov (2006), New hydrothermal ore field at 16�380 N of the Mid-Atlantic Ridge, Doklady Earth Sci., 408(1), 530–534.
AcknowledgmentsThe SeaBeam bathymetry data in thispaper are publicly available at theNational Geophysical Data Center(NGDC). The Sentry data are held on aNational Deep Submergence Server(NDSF) server at Woods HoleOceanographic Institution and areavailable on request. The data fromthe dredges can be accessed on thePetrological Database website (PetDB).The bathymetry and side scan datawere edited, combined, and griddedusing MB-system [Caress and Chayes,1996], and displayed using the GenericMapping Tools (GMT) software [Wesseland Smith, 1991]. This work wassupported by the National ScienceFoundation grant OCE-1155650. Wethank the captain and crew of the R/VKnorr for their help and enthusiasmduring our cruise. We also thank theSentry group who worked hard tocomplete 14 Sentry dives over thechallenging topography of the MAR.L. Christiansen, D. Fornari, andM. Swartz worked tirelessly during theTowCam runs. G. Cherkashovgraciously provided us with thelocations and types of rocks sampledin the 16.5�N area. We had severalfruitful discussions with D. Fornari,B. Tucholke, and J. Escart�ın. We alsothank two anonymous reviewers fortheir constructive comments.
Geochemistry, Geophysics, Geosystems 10.1002/2014GC005563
SMITH ET AL VC 2014. American Geophysical Union. All Rights Reserved. 4709

Blackman, D. K., et al. (2002), Geology of the Atlantis Massif (Mid-Atlantic Ridge, 30�N): Implications for the evolution of an ultramafic oce-anic core complex, Mar. Geophys. Res., 23, 443–469.
Blackman, D. K., B. Ildefonse, B. E. John, Y. Ohara, D. J. Miller, C. J. MacLeod, and Expedition 304/305 Scientists (2006), Oceanic core complexformation, Atlantis Massif, Proceedings of Integrated Ocean Drilling Program, 304/305, 304, 605 pp., Ocean Drill. Program, College Station,Tex., doi:10.2204/iodp.proc.304305.2006.
Buck, W. R. (1988), Flexural rotation of normal faults, Tectonics, 7(5), 959–973.Buck, W. R., L. L. Lavier and A. N. B. Poliakov (2005), Modes of faulting at mid-ocean ridges, Nature, 434, 719–723.Cann, J. R., D. K. Blackman, D. K. Smith, E. McAllister, B. Janssen, S. Mello, E. Avgerinos, A. R. Pascoe, and J. Escart�ın (1997), Corrugated slip
surfaces formed at North Atlantic ridge-transform intersections, Nature, 385, 329–332.Cannat, M., et al. (1995), Thin crust, ultramafic exposures, and rugged faulting patterns at the Mid-Atlantic Ridge (22�-24�N), Geology, 23,
49–52.Cannat, M., D. Sauter, V. Mendel, E. Ruellan, K. Okino, J. Escartin, V. Combier, and M. Baala (2006), Modes of seafloor generation at a melt-
poor ultraslow-spreading ridge, Geology, 34(7), 605–608.Cannat, M., A. Mangeney, H. Ondreas, Y. Fouquet, and A. Normand (2013), High-resolution bathymetry reveals contrasting landslide activity
shaping the walls of the Mid-Atlantic Ridge axial valley, Geochem. Geophys. Geosyst., 14, 998–1011, doi:10.1002/ggge.20056.Caress, D. W., and D. N. Chayes (1996), Improved processing of Hydrosweep DS multibeam data on the R/V Maurice Ewing, Mar. Geophys.
Res., 18, 631–650.Cherkashev, G. A., et al. (2013), Massive sulfide ores of the northern equatorial Mid-Atlantic Ridge, Oceanology, 53(5), 607–619.Cherkashov, G., V. Bel’tenev, V. Ivanov, L. Lasareva, M. Samovarov, V. Shilov, T. Stepanova, G. P. Glasby, and V. Kuznetsov (2008), Two new
hydrothermal fields at the Mid-Atlantic Ridge, Mar. Georesour. Geotechnol., 26, 308–316.Cherkashov, G., et al. (2010), Seafloor massive sulfides from the northern equatorial Mid-Atlantic Ridge: New discoveries and perspectives,
Mar. Georesour. Geotechnol., 28, 222–239.deMartin, B. J., R. A. Reves-Sohn, J. P. Canales, and S. E. Humphris (2007), Kinematics and geometry of active detachment faulting beneath
the TAG hydrothermal field on the Mid-Atlantic Ridge, Geology, 35(8), 711–714. [Available at http://geology.gsapubs.org/content/35/8/711.short.]
DeMets, C., R. G. Gordon, and D. F. Argus (2010), Geologically current plate motions, Geophys. J. Int., 181, 1–80.Dick, H. J. B., G. Thompson, and W. B. Bryan (1981), Low angle faulting and steady-state emplacement of plutonic rocks at ridge-transform
intersections (abstract), EOS Trans. AGU, 62, 406.Dick, H. J. B., J. Lin, and H. Schouten (2003), An ultraslow-spreading class of ocean ridge, Nature, 426, 405–412.Dick, H. J. B., M. A. Tivey, and B. E. Tucholke (2008), Plutonic foundation of a slow-spreading ridge segment: Oceanic core complex at Kane
Megamullion, 23�300N, 45�200W, Geochem. Geophys. Geosyst., 9, Q05014, doi:10.1029/2007GC001645.Dosso, L., H. Bougault, and J.-L. Joron (1993), Geochemical morphology of the North Mid-Atlantic Ridge, 10o224oN: Trace element-isotope
complementarity, Earth Planet. Sci. Lett., 120, 443–462.Escart�ın, J., D. K. Smith, J. Cann, H. Schouten, C. H. Langmuir, and S. Escrig (2008), Central role of detachment faults in accretion of slow-
spread oceanic lithosphere, Nature, 455, 790–794, doi:10.1038/nature07333.Ferrill, D. A., J. A. Stamatakos, and D. Sims (1999), Normal fault corrugation: Implications for growth and seismicity of active normal faults, J.
Struct. Geol., 21(8–9), 1027–1038.Fouquet, Y., et al. (2008), Serpentine cruise—Ultramafic hosted hydrothermal deposits on the Mid-Atlantic Ridge: First submersible studies
on Ashadze 1 and 2, Logatchev 2 and Krasnov vent fields, InterRidge News, 17, 16–21.Grimes, C. B., B. E. John, M. J. Cheadle, and J. L. Wooden (2008), Protracted construction of gabbroic crust at a slow spreading ridge: Con-
straints from 206Pb/238U zircon ages from Atlantis Massif and IODP Hole U1309D (30�N, MAR), Geochem. Geophys. Geosyst., 9, Q08012,doi:10.1029/2008GC002063.
Karson, J. A. (1999), Geological investigation of a lineated massif at the Kane Transform Fault: Implications for oceanic core complexes,Philos. Trans. R. Soc. London A, 357, 713–740.
MacLeod, C. J., et al.(2002), Direct geological evidence for oceanic detachment fauling: The Mid-Atlantic Ridge, 15�450N, Geology, 30(10),279–282.
MacLeod, C. J., R. C. Searle, B. J. Murton, J. F. Casey, C. Mallows, S. C. Unsworth, K. L. Achenbach, and M. Harris (2009), Life cycle of oceaniccore complexes, Earth Planet Sci. Lett., 287, 333–344.
Mallows, C., and R. C. Searle (2012), A geophysical study of oceanic core complexes and surrounding terrain, Mid-Atlantic Ridge 13oN–14oN, Geochem. Geophys. Geosyst., 13, Q0AG08, doi:10.1029/2012GC004075.
Ohara, Y., T. Yoshida, and S. Kasuga (2001), Giant megamullion in the Perece Vela Backarc basin, Mar. Geophys. Res., 22, 47–61.Okino, K., K. Matsuda, D. Christie, Y. Nogi, and K. Koizumi (2004), Development of oceanic detachment and asymmetric spreading at the
Australian-Antarctic Discordance, Geochem. Geophys. Geosyst., 5, Q12012, doi:10.1029/2004GC000793.Olive, J.-A., M. D. Behn, and B. E. Tucholke (2010), The structure of oceanic core complexes controlled by the depth distribution of magma
emplacement, Nat. Geosci., 3, 491–495, doi:10.1038/ngeo888.Parnell-Turner, R., J. R. Cann, D. K. Smith, H. Schouten, D. Yoerger, C. Palmiotto, A. Zheleznov, and H. Bai(2014), Sedimentation rates test
models of oceanic detachment faulting, Geophys. Res. Lett., in press.Petit, J. P. (1987), Criteria for the sense of movement on fault surfaces in brittle rocks, J. Struct. Geol., 9, 597–608.Reston, T. J., and C. R. Ranero (2011), The 3-D geometry of detachment faulting at mid-ocean ridges, Geochem. Geophys. Geosyst., 12,
Q0AG05, doi:10.1029/2011GC003666.Schouten, H., D. K. Smith, J. R. Cann, and J. Escartin (2010), Tectonic versus magmatic extension in the presence of core complexes at slow-
spreading ridges from a visualization of faulted seafloor topography, Geology, 38, 615–618, doi:10.1130/G30803.1.Schroeder, T. J., M. Cheadle, H. J. B. Dick, U. Faul, J. F. Casey, and P. B. Kelemen (2007), Non-volcanic seafloor spreading and corner-flow
rotation accommodated by extensional faulting at 15�N on the Mid Atlantic Ridge: A structural synthesis of ODP Leg 209, Geochem.Geophys. Geosyst., 8, Q06015, doi:10.1029/2006GC001567.
Searle, R. C., M. Cannat, K. Fujioka, C. Mevel, H. Fujimoto, A. Bralee, and L. Parson (2003), FUJI Dome: A large detachment fault near 64oE onthe very slow-spreading Southwest Indian Ridge, Geochem. Geophys. Geosyst., 4(8), 9105, doi:10.1029/2003GC000519.
Searle, R. C., et al.(2010), Structure and development of an axial volcanic ridge: Mid-Atlantic Ridge, 45�N, Earth Planet. Sci. Lett., 299(1–2),228–241.
Smith, D. K., and J. R. Cann (1993), Building the crust at the Mid-Atlantic Ridge, Nature, 365, 707–715.Smith, D. K., J. Escartin, M. Cannat, M. Tolstoy, C.G. Fox, D. Bohnenstiehl, and S. Bazin (2003), Spatial and temporal distribution of seismicity
along the northern Mid-Atlantic Ridge (15o235oN), J. Geophys. Res., 108(B3), 2167, doi:10.1029/2002JB001964.
Geochemistry, Geophysics, Geosystems 10.1002/2014GC005563
SMITH ET AL VC 2014. American Geophysical Union. All Rights Reserved. 4710

Smith, D. K., J. R. Cann, and J. Escartin (2006), Widespread active detachment faulting and core complex formation near 13oN on the Mid-Atlantic Ridge, Nature, 442, 440–443, doi:10.1038/nature04950.
Smith, D. K., J. Escartin, H. Schouten, and J. R. Cann (2008), Fault rotation and core complex formation: Significant processes in seafloor for-mation at slow-spreading mid-ocean ridges (Mid-Atlantic Ridge, 13–25oN), Geochem. Geophys. Geosyst., 9, Q03003, doi:10.1029/2007GC001699.
Spencer, J. E. (1999), Geologic continuous casting below continental and deep-sea detachment faults and at the striated extrusion of Sac-sayhuaman, Peru, Geology, 27, 327–330.
Thibaud, R., P. Gente, and M. Maia (1998), A systematic analysis of the Mid-Atlantic Ridge morphology and gravity between 15�N and40�N: Constraints of the thermal structure, J. Geophys. Res., 103, 24,223–24,243.
Tucholke, B. E., J. Lin, and M. C. Kleinrock (1998), Megamullions and mullion structure defining oceanic metamorphic core complexes onthe mid-Atlantic ridge, J. Geophys. Res., 103, 9857–9866.
Tucholke, B. E., M. D. Behn, W. R. Buck and J. Lin (2008), Role of melt supply in oceanic detachment faulting and formation of megamul-lions, Geology, 36, 455–458, doi:10.1130/G24639A.1.
Wessel, P., and W. H. F. Smith (1991), Free software helps map and display data, Eos Trans. AGU, 72, 441–446.Wong, M. S., and P. B. Gans (2008), Geologic, structural, and thermochronologic constraints on the tectonic evolution of the Sierra Mazat�an
core complex, Sonora, Mexico: New insights into metamorphic core complex formation, Tectonics, 27, TC4013, doi:10.1029/2007TC002173.
Geochemistry, Geophysics, Geosystems 10.1002/2014GC005563
SMITH ET AL VC 2014. American Geophysical Union. All Rights Reserved. 4711
Related Documents


