~ 1643~ The Pharma Innovation Journal 2022; SP-11(4): 1643-1653 ISSN (E): 2277- 7695 ISSN (P): 2349-8242 NAAS Rating: 5.23 TPI 2022; SP-11(4): 1643-1653 © 2022 TPI www.thepharmajournal.com Received: 12-02-2022 Accepted: 14-03-2022 Rupam Chauhan Department of Food Technology, Allahabad University, Prayagraj, Uttar Pradesh, India Anu Singh Department of Food Technology, Allahabad University, Prayagraj, Uttar Pradesh, India Atul Singh Koneru Lakshmaiah University, Vijayawada, Andhra Pradesh, India OP Chauhan Defense Food Research Laboratory, DRDO, Mysore, Karnataka, India Corresponding Author Rupam Chauhan Department of Food Technology, Allahabad University, Prayagraj, Uttar Pradesh, India Development and evaluation of soy based rasgulla blended with dairy milk Rupam Chauhan, Anu Singh, Atul Singh and OP Chauhan Abstract Rasgulla, the popular Indian dairy-based dessert, was blended by using soymilk to improve its nutritional and different physical parameters like color, texture and sensory attributes. Soymilk was blended with dairy milk in the ratio 100:0, 80:20, 60:40 and 40:60 (v/v) and were analyzed for physico-chemical, sensory and microbiological attributes. As such the rasgulla made from pure soy milk shows higher content of phenolics, flavanoids contents as well as antioxidant potential. Blending with dairy milk improve the color of the product in terms of CIE L*, a* and b* values. Hardness of the product also improved with increase in the dairy milk. Sensory score where also found to increase with increase in the level of dairy milk. The products showed shelf life of 60 days on the basis of physico-chemical, microbiological and sensory attributes. Keywords: Physico-chemical, sensory attributes, microbiological, shelf life Introduction Soy foods are traditional foods made from soybeans in Asia, and now become popular in Western Countries. Soy foods have high plant protein content and contain polyphenol components, such as isoflavones. Thus, soy foods are classified as a functional food. In addition, soy foods may decrease the risk of coronary heart disease and have anti-cancer and anti-inflammation properties (Yang and others 2009; Peng and others 2009) [39, 31] , and increase the Calcium absorption for women (Charoenphun and others 2013; Bao and others 2008) [7, 28] provide positive effects for Type 1 or Type 2 diabetes (Zimmermann and others 2012) [41] , and maintain or even relieve dementia symptoms for patients who suffer from Alzheimer’s disease (Duffy and others 2003) [11] . Soybean production in India is estimated to be around 10.450 million metric tonsin the year 2020-2021 accounting for 2.87 percentage of total world production. In 2020-2021, world production of soybeans was over 364.066 million metric tons. Brazil, USA and Argentina are the three major soybean producing countries which dominate global production, accounting for 81.45% of the world's soybean. Soymilk, are considered a good substitution for dairy products for individuals who have milk intolerance. Soybeans are an excellent source of high quality protein, and soy milk has been used as a milk alternative. Soy milk contains high amounts of protein, iron, unsaturated fatty acids, and niacin, but low amounts of fat, carbohydrates, and calcium compared with cow’s milk (Liu, 1997) [27] . Various soy products are made in many countries and have attracted much attention (Li et al., 2013) [26] . The primary focus has been on making rasgulla from mixtures of cow’s milk and soy milk; however, its quality is decreased proportionally with increasing levels of soy milk (Rani and Verma, 1995) [33] . Rasgulla is a popular sweet prepared generally from dairy milk and it is a good source of milk proteins. It is prepared from channa, an intermediate product obtained from heat and acid coagulation of milk Milk is first boiled and curdled, usually by adding an adequate quantity of lemon salt. It is then filtered by filtering into a mull bag and the 'channa` collected and cooled by immersing the mull bag in cold water. Rasgulla is generally made from cow milk (Rao et al., 1989) [34] and there are very few reports regarding the manufacture of rasgulla from buffalo milk (Kanwal et al., 1980) [17] . This dairy product is easily digested and has high food value due to its fairly high protein content, calcium, phosphorus, vitamin A and D content (Tarafdar et al., 2002) [37] . Rasgulla are highly consumed due to its good nutritional and health beneficial property (Chavan et al., 2011; Sahu and Das, 2009) [8, 35] . Due to ongoing trends of vegetarianism, milk cholesterol, saturated milk fat and lactose intolerance production of non- dairy food products has emerged as popular alternative to traditional dairy products.

Welcome message from author
This document is posted to help you gain knowledge. Please leave a comment to let me know what you think about it! Share it to your friends and learn new things together.
Transcript
~ 1643~
The Pharma Innovation Journal 2022; SP-11(4): 1643-1653
ISSN (E): 2277- 7695
ISSN (P): 2349-8242
NAAS Rating: 5.23
TPI 2022; SP-11(4): 1643-1653
© 2022 TPI
www.thepharmajournal.com
Received: 12-02-2022
Accepted: 14-03-2022
Rupam Chauhan
Department of Food Technology,
Allahabad University,
Prayagraj, Uttar Pradesh, India
Anu Singh
Department of Food Technology,
Allahabad University,
Prayagraj, Uttar Pradesh, India
Atul Singh
Koneru Lakshmaiah University,
Vijayawada, Andhra Pradesh,
India
OP Chauhan
Defense Food Research
Laboratory, DRDO, Mysore,
Karnataka, India
Corresponding Author
Rupam Chauhan
Department of Food Technology,
Allahabad University,
Prayagraj, Uttar Pradesh, India
Development and evaluation of soy based rasgulla
blended with dairy milk
Rupam Chauhan, Anu Singh, Atul Singh and OP Chauhan
Abstract Rasgulla, the popular Indian dairy-based dessert, was blended by using soymilk to improve its nutritional
and different physical parameters like color, texture and sensory attributes. Soymilk was blended with
dairy milk in the ratio 100:0, 80:20, 60:40 and 40:60 (v/v) and were analyzed for physico-chemical,
sensory and microbiological attributes. As such the rasgulla made from pure soy milk shows higher
content of phenolics, flavanoids contents as well as antioxidant potential. Blending with dairy milk
improve the color of the product in terms of CIE L*, a* and b* values. Hardness of the product also
improved with increase in the dairy milk. Sensory score where also found to increase with increase in the
level of dairy milk. The products showed shelf life of 60 days on the basis of physico-chemical,
microbiological and sensory attributes.
Keywords: Physico-chemical, sensory attributes, microbiological, shelf life
Introduction
Soy foods are traditional foods made from soybeans in Asia, and now become popular in
Western Countries. Soy foods have high plant protein content and contain polyphenol
components, such as isoflavones. Thus, soy foods are classified as a functional food. In
addition, soy foods may decrease the risk of coronary heart disease and have anti-cancer and
anti-inflammation properties (Yang and others 2009; Peng and others 2009) [39, 31], and
increase the Calcium absorption for women (Charoenphun and others 2013; Bao and others
2008) [7, 28] provide positive effects for Type 1 or Type 2 diabetes (Zimmermann and others
2012) [41], and maintain or even relieve dementia symptoms for patients who suffer from
Alzheimer’s disease (Duffy and others 2003) [11].
Soybean production in India is estimated to be around 10.450 million metric tonsin the year
2020-2021 accounting for 2.87 percentage of total world production. In 2020-2021, world
production of soybeans was over 364.066 million metric tons. Brazil, USA and Argentina are
the three major soybean producing countries which dominate global production, accounting
for 81.45% of the world's soybean.
Soymilk, are considered a good substitution for dairy products for individuals who have milk
intolerance. Soybeans are an excellent source of high quality protein, and soy milk has been
used as a milk alternative. Soy milk contains high amounts of protein, iron, unsaturated fatty
acids, and niacin, but low amounts of fat, carbohydrates, and calcium compared with cow’s
milk (Liu, 1997) [27]. Various soy products are made in many countries and have attracted
much attention (Li et al., 2013) [26]. The primary focus has been on making rasgulla from
mixtures of cow’s milk and soy milk; however, its quality is decreased proportionally with
increasing levels of soy milk (Rani and Verma, 1995) [33].
Rasgulla is a popular sweet prepared generally from dairy milk and it is a good source of milk
proteins. It is prepared from channa, an intermediate product obtained from heat and acid
coagulation of milk Milk is first boiled and curdled, usually by adding an adequate quantity of
lemon salt. It is then filtered by filtering into a mull bag and the 'channa` collected and cooled
by immersing the mull bag in cold water. Rasgulla is generally made from cow milk (Rao et
al., 1989) [34] and there are very few reports regarding the manufacture of rasgulla from buffalo
milk (Kanwal et al., 1980) [17]. This dairy product is easily digested and has high food value
due to its fairly high protein content, calcium, phosphorus, vitamin A and D content (Tarafdar
et al., 2002) [37]. Rasgulla are highly consumed due to its good nutritional and health beneficial
property (Chavan et al., 2011; Sahu and Das, 2009) [8, 35]. Due to ongoing trends of
vegetarianism, milk cholesterol, saturated milk fat and lactose intolerance production of non-
dairy food products has emerged as popular alternative to traditional dairy products.
~ 1644 ~
The Pharma Innovation Journal http://www.thepharmajournal.com
In the present study milk rasgulla prepared from dairy milk
was partially substituted with soy milk to give the product the
health benefits of soybeans by optimizing the levels of
soymilk in dairy milk for the development of rasgulla and to
study the effects of blending soymilk with dairy milk as the
physio-chemical attributes of rasgulla.
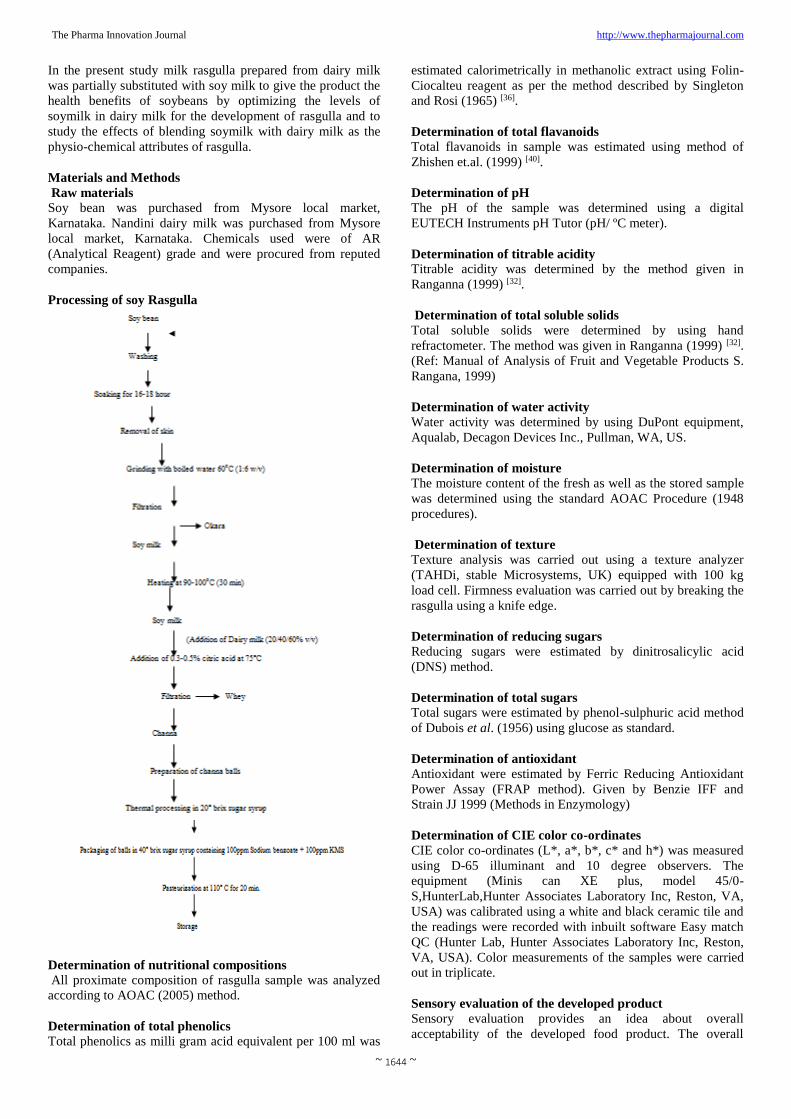
Materials and Methods
Raw materials
Soy bean was purchased from Mysore local market,
Karnataka. Nandini dairy milk was purchased from Mysore
local market, Karnataka. Chemicals used were of AR
(Analytical Reagent) grade and were procured from reputed
companies.
Processing of soy Rasgulla
Determination of nutritional compositions
All proximate composition of rasgulla sample was analyzed
according to AOAC (2005) method.
Determination of total phenolics Total phenolics as milli gram acid equivalent per 100 ml was
estimated calorimetrically in methanolic extract using Folin-
Ciocalteu reagent as per the method described by Singleton
and Rosi (1965) [36].
Determination of total flavanoids Total flavanoids in sample was estimated using method of
Zhishen et.al. (1999) [40].
Determination of pH The pH of the sample was determined using a digital
EUTECH Instruments pH Tutor (pH/ ºC meter).
Determination of titrable acidity
Titrable acidity was determined by the method given in
Ranganna (1999) [32].
Determination of total soluble solids Total soluble solids were determined by using hand
refractometer. The method was given in Ranganna (1999) [32].
(Ref: Manual of Analysis of Fruit and Vegetable Products S.
Rangana, 1999)
Determination of water activity Water activity was determined by using DuPont equipment,
Aqualab, Decagon Devices Inc., Pullman, WA, US.
Determination of moisture The moisture content of the fresh as well as the stored sample
was determined using the standard AOAC Procedure (1948
procedures).
Determination of texture
Texture analysis was carried out using a texture analyzer
(TAHDi, stable Microsystems, UK) equipped with 100 kg
load cell. Firmness evaluation was carried out by breaking the
rasgulla using a knife edge.
Determination of reducing sugars
Reducing sugars were estimated by dinitrosalicylic acid
(DNS) method.
Determination of total sugars
Total sugars were estimated by phenol-sulphuric acid method
of Dubois et al. (1956) using glucose as standard.
Determination of antioxidant
Antioxidant were estimated by Ferric Reducing Antioxidant
Power Assay (FRAP method). Given by Benzie IFF and
Strain JJ 1999 (Methods in Enzymology)
Determination of CIE color co-ordinates CIE color co-ordinates (L*, a*, b*, c* and h*) was measured
using D-65 illuminant and 10 degree observers. The
equipment (Minis can XE plus, model 45/0-
S,HunterLab,Hunter Associates Laboratory Inc, Reston, VA,
USA) was calibrated using a white and black ceramic tile and
the readings were recorded with inbuilt software Easy match
QC (Hunter Lab, Hunter Associates Laboratory Inc, Reston,
VA, USA). Color measurements of the samples were carried
out in triplicate.
Sensory evaluation of the developed product
Sensory evaluation provides an idea about overall
acceptability of the developed food product. The overall
~ 1645 ~
The Pharma Innovation Journal http://www.thepharmajournal.com
acceptability depends on the appearance, flavor, taste, texture
and aftertaste of the food product. In the present study, the
developed products were judged by 10 semi trained panel
members. For sensory evaluation of value added products
nine point rating scale was used. In nine point rating scale
each product characteristics (color, aroma, taste, texture and
overall acceptability) were rated separately on hedonic scale
of 1 to9. Scores were defined as follows, 1 for extremely
poor, 2 for very poor, 3 for poor, 4 for fair above poor, 5 for
fair, 6 for good above fair, 7 for good, 8 for very good and 9
for excellent.
Determination of shelf life
Microbiological Analysis – Total Plate Count Method
(AOAC, 2005) [2] Microbiological analysis was done for
rasgulla samples which were kept at room temperature and
low temperature in air tight Cans for about more than 60 days
as well as after every 15 days bacterial and fungal count was
estimated of these samples.
Statistical analysis The data generated during the study was processed using
various statistical tests.
Data characteristics and Analysis of Variance:
The data characteristics such as Mean and Standard deviation
were determined. Data were subjected to analysis of variance
(ANOVA) using completely randomized design (CRD) and
least significant difference (LSD) at p ≤ 0.05 (or equivalently,
5%) by keeping in view the consequences of such an error,
using Statistica 7.1 software (Stat Soft, Tulsa, OK, USA)
expressed as means ± standard deviation
Results and Discussion
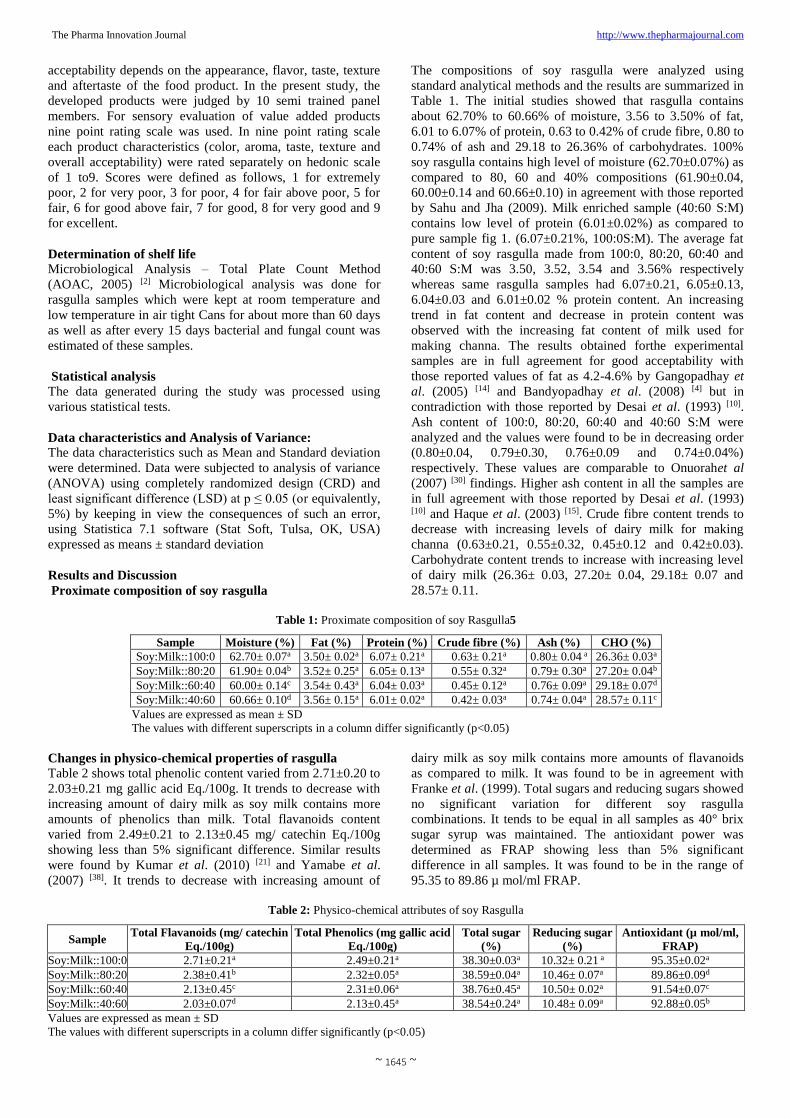
Proximate composition of soy rasgulla
The compositions of soy rasgulla were analyzed using
standard analytical methods and the results are summarized in
Table 1. The initial studies showed that rasgulla contains
about 62.70% to 60.66% of moisture, 3.56 to 3.50% of fat,
6.01 to 6.07% of protein, 0.63 to 0.42% of crude fibre, 0.80 to
0.74% of ash and 29.18 to 26.36% of carbohydrates. 100%
soy rasgulla contains high level of moisture (62.70±0.07%) as
compared to 80, 60 and 40% compositions (61.90±0.04,
60.00±0.14 and 60.66±0.10) in agreement with those reported
by Sahu and Jha (2009). Milk enriched sample (40:60 S:M)
contains low level of protein (6.01±0.02%) as compared to
pure sample fig 1. (6.07±0.21%, 100:0S:M). The average fat
content of soy rasgulla made from 100:0, 80:20, 60:40 and
40:60 S:M was 3.50, 3.52, 3.54 and 3.56% respectively
whereas same rasgulla samples had 6.07±0.21, 6.05±0.13,
6.04±0.03 and 6.01±0.02 % protein content. An increasing
trend in fat content and decrease in protein content was
observed with the increasing fat content of milk used for
making channa. The results obtained forthe experimental
samples are in full agreement for good acceptability with
those reported values of fat as 4.2-4.6% by Gangopadhay et
al. (2005) [14] and Bandyopadhay et al. (2008) [4] but in
contradiction with those reported by Desai et al. (1993) [10].
Ash content of 100:0, 80:20, 60:40 and 40:60 S:M were
analyzed and the values were found to be in decreasing order
(0.80±0.04, 0.79±0.30, 0.76±0.09 and 0.74±0.04%)
respectively. These values are comparable to Onuorahet al
(2007) [30] findings. Higher ash content in all the samples are
in full agreement with those reported by Desai et al. (1993) [10] and Haque et al. (2003) [15]. Crude fibre content trends to
decrease with increasing levels of dairy milk for making
channa (0.63±0.21, 0.55±0.32, 0.45±0.12 and 0.42±0.03).
Carbohydrate content trends to increase with increasing level
of dairy milk (26.36± 0.03, 27.20± 0.04, 29.18± 0.07 and
28.57± 0.11.
Table 1: Proximate composition of soy Rasgulla5
Sample Moisture (%) Fat (%) Protein (%) Crude fibre (%) Ash (%) CHO (%)
Soy:Milk::100:0 62.70± 0.07a 3.50± 0.02a 6.07± 0.21a 0.63± 0.21a 0.80± 0.04 a 26.36± 0.03a
Soy:Milk::80:20 61.90± 0.04b 3.52± 0.25a 6.05± 0.13a 0.55± 0.32a 0.79± 0.30a 27.20± 0.04b
Soy:Milk::60:40 60.00± 0.14c 3.54± 0.43a 6.04± 0.03a 0.45± 0.12a 0.76± 0.09a 29.18± 0.07d
Soy:Milk::40:60 60.66± 0.10d 3.56± 0.15a 6.01± 0.02a 0.42± 0.03a 0.74± 0.04a 28.57± 0.11c
Values are expressed as mean ± SD
The values with different superscripts in a column differ significantly (p<0.05)
Changes in physico-chemical properties of rasgulla
Table 2 shows total phenolic content varied from 2.71±0.20 to
2.03±0.21 mg gallic acid Eq./100g. It trends to decrease with
increasing amount of dairy milk as soy milk contains more
amounts of phenolics than milk. Total flavanoids content
varied from 2.49±0.21 to 2.13±0.45 mg/ catechin Eq./100g
showing less than 5% significant difference. Similar results
were found by Kumar et al. (2010) [21] and Yamabe et al.
(2007) [38]. It trends to decrease with increasing amount of
dairy milk as soy milk contains more amounts of flavanoids
as compared to milk. It was found to be in agreement with
Franke et al. (1999). Total sugars and reducing sugars showed
no significant variation for different soy rasgulla
combinations. It tends to be equal in all samples as 40° brix
sugar syrup was maintained. The antioxidant power was
determined as FRAP showing less than 5% significant
difference in all samples. It was found to be in the range of
95.35 to 89.86 µ mol/ml FRAP.
Table 2: Physico-chemical attributes of soy Rasgulla
Sample Total Flavanoids (mg/ catechin
Eq./100g)
Total Phenolics (mg gallic acid
Eq./100g)
Total sugar
(%)
Reducing sugar
(%)
Antioxidant (µ mol/ml,
FRAP)
Soy:Milk::100:0 2.71±0.21a 2.49±0.21a 38.30±0.03a 10.32± 0.21 a 95.35±0.02a
Soy:Milk::80:20 2.38±0.41b 2.32±0.05a 38.59±0.04a 10.46± 0.07a 89.86±0.09d
Soy:Milk::60:40 2.13±0.45c 2.31±0.06a 38.76±0.45a 10.50± 0.02a 91.54±0.07c
Soy:Milk::40:60 2.03±0.07d 2.13±0.45a 38.54±0.24a 10.48± 0.09a 92.88±0.05b
Values are expressed as mean ± SD
The values with different superscripts in a column differ significantly (p<0.05)
~ 1646 ~
The Pharma Innovation Journal http://www.thepharmajournal.com
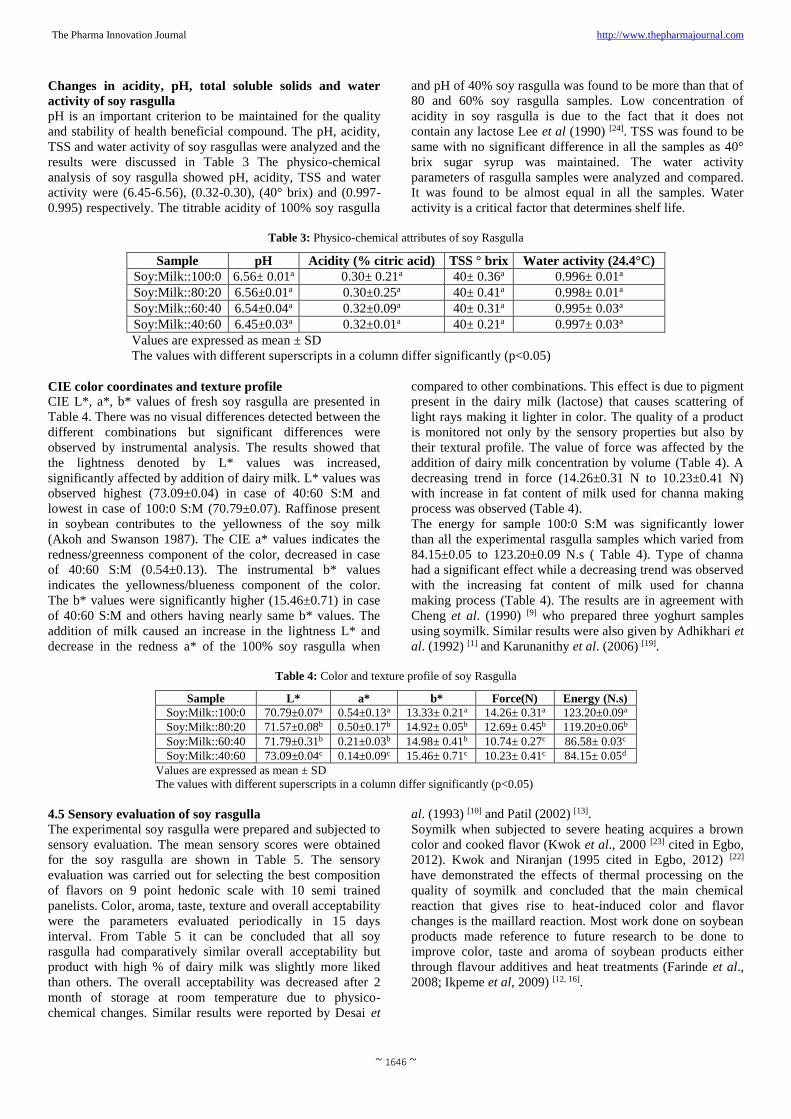
Changes in acidity, pH, total soluble solids and water
activity of soy rasgulla
pH is an important criterion to be maintained for the quality
and stability of health beneficial compound. The pH, acidity,
TSS and water activity of soy rasgullas were analyzed and the
results were discussed in Table 3 The physico-chemical
analysis of soy rasgulla showed pH, acidity, TSS and water
activity were (6.45-6.56), (0.32-0.30), (40° brix) and (0.997-
0.995) respectively. The titrable acidity of 100% soy rasgulla
and pH of 40% soy rasgulla was found to be more than that of
80 and 60% soy rasgulla samples. Low concentration of
acidity in soy rasgulla is due to the fact that it does not
contain any lactose Lee et al (1990) [24]. TSS was found to be
same with no significant difference in all the samples as 40°
brix sugar syrup was maintained. The water activity
parameters of rasgulla samples were analyzed and compared.
It was found to be almost equal in all the samples. Water
activity is a critical factor that determines shelf life.
Table 3: Physico-chemical attributes of soy Rasgulla
Sample pH Acidity (% citric acid) TSS ° brix Water activity (24.4°C)
Soy:Milk::100:0 6.56± 0.01a 0.30± 0.21a 40± 0.36a 0.996± 0.01a
Soy:Milk::80:20 6.56±0.01a 0.30±0.25a 40± 0.41a 0.998± 0.01a
Soy:Milk::60:40 6.54±0.04a 0.32±0.09a 40± 0.31a 0.995± 0.03a
Soy:Milk::40:60 6.45±0.03a 0.32±0.01a 40± 0.21a 0.997± 0.03a
Values are expressed as mean ± SD
The values with different superscripts in a column differ significantly (p<0.05)
CIE color coordinates and texture profile
CIE L*, a*, b* values of fresh soy rasgulla are presented in
Table 4. There was no visual differences detected between the
different combinations but significant differences were
observed by instrumental analysis. The results showed that
the lightness denoted by L* values was increased,
significantly affected by addition of dairy milk. L* values was
observed highest (73.09±0.04) in case of 40:60 S:M and
lowest in case of 100:0 S:M (70.79±0.07). Raffinose present
in soybean contributes to the yellowness of the soy milk
(Akoh and Swanson 1987). The CIE a* values indicates the
redness/greenness component of the color, decreased in case
of 40:60 S:M (0.54±0.13). The instrumental b* values
indicates the yellowness/blueness component of the color.
The b* values were significantly higher (15.46±0.71) in case
of 40:60 S:M and others having nearly same b* values. The
addition of milk caused an increase in the lightness L* and
decrease in the redness a* of the 100% soy rasgulla when
compared to other combinations. This effect is due to pigment
present in the dairy milk (lactose) that causes scattering of
light rays making it lighter in color. The quality of a product
is monitored not only by the sensory properties but also by
their textural profile. The value of force was affected by the
addition of dairy milk concentration by volume (Table 4). A
decreasing trend in force (14.26±0.31 N to 10.23±0.41 N)
with increase in fat content of milk used for channa making
process was observed (Table 4).
The energy for sample 100:0 S:M was significantly lower
than all the experimental rasgulla samples which varied from
84.15±0.05 to 123.20±0.09 N.s ( Table 4). Type of channa
had a significant effect while a decreasing trend was observed
with the increasing fat content of milk used for channa
making process (Table 4). The results are in agreement with
Cheng et al. (1990) [9] who prepared three yoghurt samples
using soymilk. Similar results were also given by Adhikhari et
al. (1992) [1] and Karunanithy et al. (2006) [19].
Table 4: Color and texture profile of soy Rasgulla
Sample L* a* b* Force(N) Energy (N.s)
Soy:Milk::100:0 70.79±0.07a 0.54±0.13a 13.33± 0.21a 14.26± 0.31a 123.20±0.09a
Soy:Milk::80:20 71.57±0.08b 0.50±0.17b 14.92± 0.05b 12.69± 0.45b 119.20±0.06b
Soy:Milk::60:40 71.79±0.31b 0.21±0.03b 14.98± 0.41b 10.74± 0.27c 86.58± 0.03c
Soy:Milk::40:60 73.09±0.04c 0.14±0.09c 15.46± 0.71c 10.23± 0.41c 84.15± 0.05d
Values are expressed as mean ± SD
The values with different superscripts in a column differ significantly (p<0.05)
4.5 Sensory evaluation of soy rasgulla The experimental soy rasgulla were prepared and subjected to
sensory evaluation. The mean sensory scores were obtained
for the soy rasgulla are shown in Table 5. The sensory
evaluation was carried out for selecting the best composition
of flavors on 9 point hedonic scale with 10 semi trained
panelists. Color, aroma, taste, texture and overall acceptability
were the parameters evaluated periodically in 15 days
interval. From Table 5 it can be concluded that all soy
rasgulla had comparatively similar overall acceptability but
product with high % of dairy milk was slightly more liked
than others. The overall acceptability was decreased after 2
month of storage at room temperature due to physico-
chemical changes. Similar results were reported by Desai et
al. (1993) [10] and Patil (2002) [13].
Soymilk when subjected to severe heating acquires a brown
color and cooked flavor (Kwok et al., 2000 [23] cited in Egbo,
2012). Kwok and Niranjan (1995 cited in Egbo, 2012) [22]
have demonstrated the effects of thermal processing on the
quality of soymilk and concluded that the main chemical
reaction that gives rise to heat-induced color and flavor
changes is the maillard reaction. Most work done on soybean
products made reference to future research to be done to
improve color, taste and aroma of soybean products either
through flavour additives and heat treatments (Farinde et al.,
2008; Ikpeme et al, 2009) [12, 16].
~ 1647 ~
The Pharma Innovation Journal http://www.thepharmajournal.com
Table 5: Sensory profile of soy Rasgulla
Sample Color Aroma Taste Texture OAA
Soy:Milk::100:0 6.0±0.04a 6.0±0.04a 7.0±0.29a 7.0±0.13a 7.0±0.39a
Soy:Milk::80:20 7.5±0.12 b 7.0±0.05b 7.5±0.09b 7.5±0.25b 7.5±0.17b
Soy:Milk::60:40 7.5±0.09 b 8.0±0.07c 8.0±0.18c 8.0±0.31c 8.0±0.05c
Soy:Milk::40:60 8.0±1.07c 8.5±0.01d 8.5±1.01d 8.0±0.41c 8.5±0.29d
Values are expressed as mean ± SD
The values with different superscripts in a column differ significantly (p<0.05)
(1 for extremely poor, 2 for very poor, 3 for poor, 4 for fair
above poor, 5 for fair, 6 for good above fair, 7 for good, 8 for
very good and 9 for excellent)
Sensory evaluation of rehydrated soy rasgulla Sugar syrup with 40° brix was prepared and rehydration was
done in hot condition. A significant effect on rasgulla was
observed due to the treatment given as observed in Table 6.
The dehydrated rasgulla samples when rehydrated were found
to be influenced significantly by dehydration treatment as it
causes a significant effect on all the sensory properties.
Soymilk when subjected to severe heating acquires a brown
color and cooked flavor (Kwok et al., 2000 cited in Egbo,
2012). Kwok and Niranjan (1995 cited in Egbo, 2012) have
demonstrated the effects of thermal processing on the quality
of soymilk and concluded that the main chemical reaction that
gives rise to heat-induced color and flavor changes is the
maillard reaction. Most work done on soybean products made
reference to future research to be done to improve colour,
taste and aroma of soybean products either through flavour
additives and heat treatments (Farinde et al., 2008; Ikpeme et
al, 2009) [12, 16].
Table 6: Sensory profile of rehydrated soy Rasgulla
Sample Color Aroma Taste Texture OAA
Soy:Milk::100:0 7.0±0.31a 6.0±0.03a 7.0±0.31a 6.5±0.17a 6.5±0.16a
Soy:Milk::80:20 7.0±0.59 a 7.0±0.05b 7.5±0.33b 7.0±0.07b 7.0±0.07b
Soy:Milk::60:40 7.5±1.31b 8.0±0.19d 8.0±0.57c 8.0±0.05d 8.0±0.15d
Soy:Milk::40:60 7.5±0.93b 8.0±0.01d 8.5±0.30d 8.5±0.15e 8.5±0.61e
Values are expressed as mean ± SD
The values with different superscripts in a column differ significantly (p<0.05)
(1 for extremely poor, 2 for very poor, 3 for poor, 4 for fair
above poor, 5 for fair, 6 for good above fair, 7 for good, 8 for
very good and 9 for excellent)
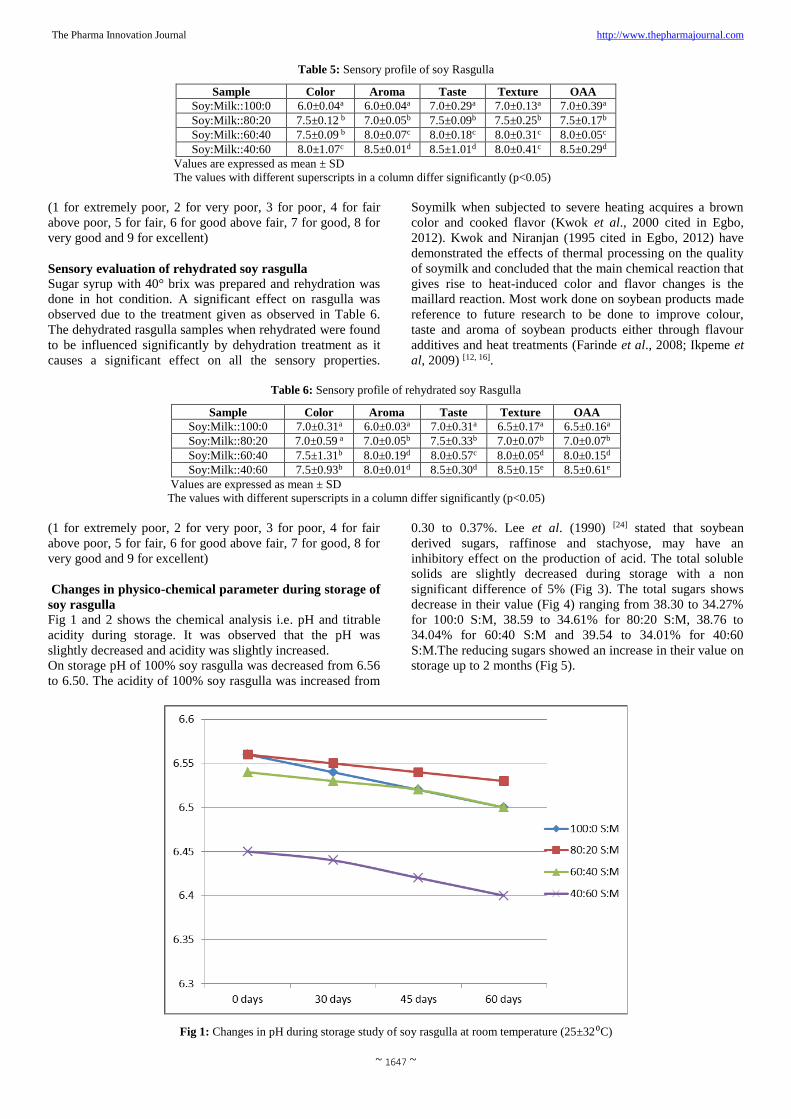
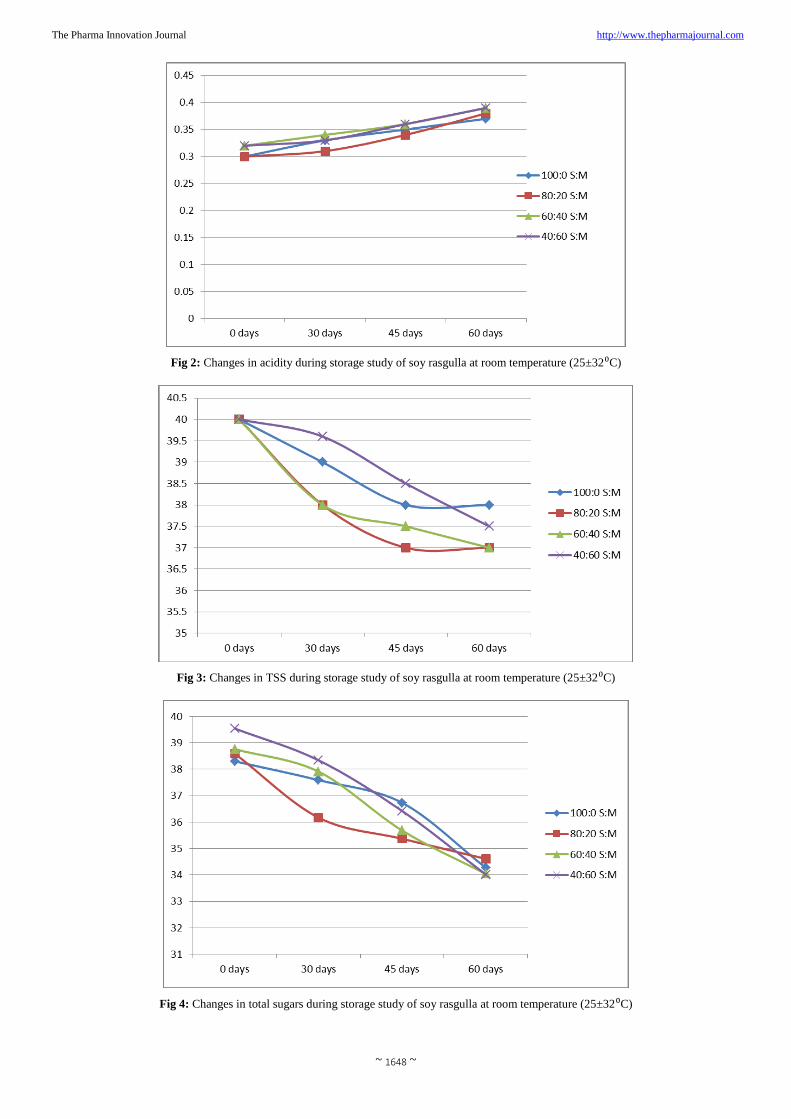
Changes in physico-chemical parameter during storage of
soy rasgulla Fig 1 and 2 shows the chemical analysis i.e. pH and titrable
acidity during storage. It was observed that the pH was
slightly decreased and acidity was slightly increased.
On storage pH of 100% soy rasgulla was decreased from 6.56
to 6.50. The acidity of 100% soy rasgulla was increased from
0.30 to 0.37%. Lee et al. (1990) [24] stated that soybean
derived sugars, raffinose and stachyose, may have an
inhibitory effect on the production of acid. The total soluble
solids are slightly decreased during storage with a non
significant difference of 5% (Fig 3). The total sugars shows
decrease in their value (Fig 4) ranging from 38.30 to 34.27%
for 100:0 S:M, 38.59 to 34.61% for 80:20 S:M, 38.76 to
34.04% for 60:40 S:M and 39.54 to 34.01% for 40:60
S:M.The reducing sugars showed an increase in their value on
storage up to 2 months (Fig 5).
Fig 1: Changes in pH during storage study of soy rasgulla at room temperature (25±32⁰C)
~ 1648 ~
The Pharma Innovation Journal http://www.thepharmajournal.com
Fig 2: Changes in acidity during storage study of soy rasgulla at room temperature (25±32⁰C)
Fig 3: Changes in TSS during storage study of soy rasgulla at room temperature (25±32⁰C)
Fig 4: Changes in total sugars during storage study of soy rasgulla at room temperature (25±32⁰C)
~ 1649 ~
The Pharma Innovation Journal http://www.thepharmajournal.com
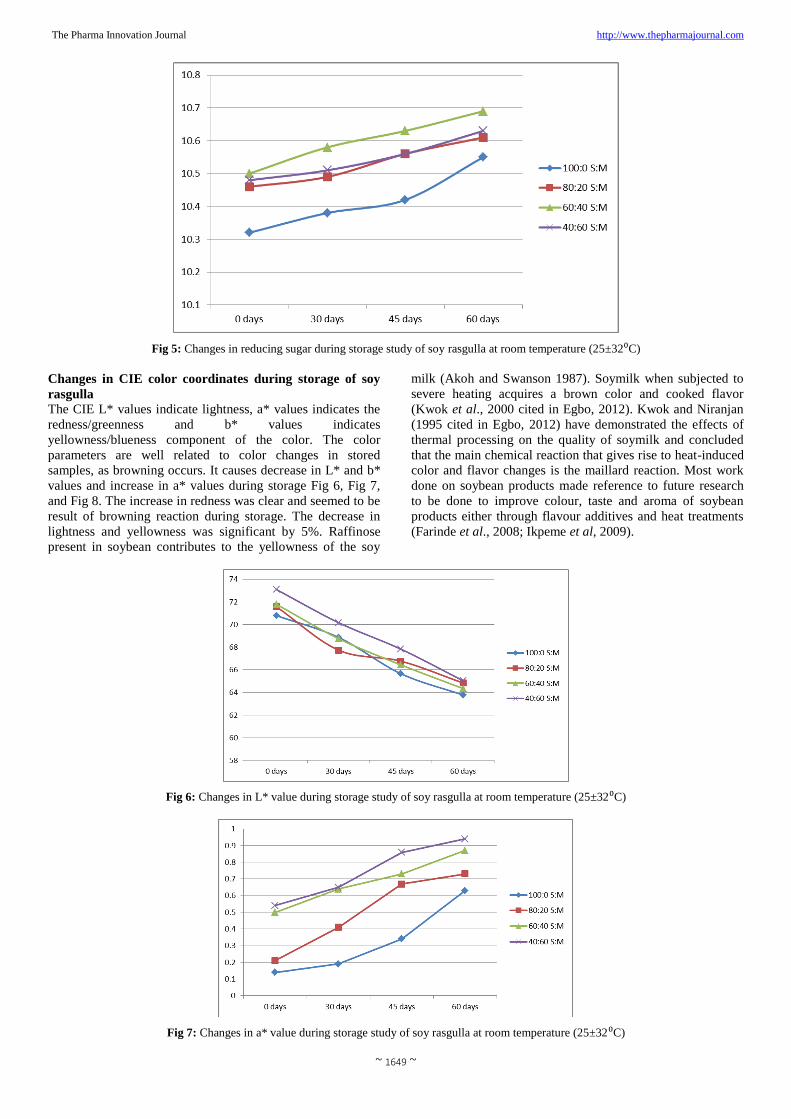
Fig 5: Changes in reducing sugar during storage study of soy rasgulla at room temperature (25±32⁰C)
Changes in CIE color coordinates during storage of soy
rasgulla
The CIE L* values indicate lightness, a* values indicates the
redness/greenness and b* values indicates
yellowness/blueness component of the color. The color
parameters are well related to color changes in stored
samples, as browning occurs. It causes decrease in L* and b*
values and increase in a* values during storage Fig 6, Fig 7,
and Fig 8. The increase in redness was clear and seemed to be
result of browning reaction during storage. The decrease in
lightness and yellowness was significant by 5%. Raffinose
present in soybean contributes to the yellowness of the soy
milk (Akoh and Swanson 1987). Soymilk when subjected to
severe heating acquires a brown color and cooked flavor
(Kwok et al., 2000 cited in Egbo, 2012). Kwok and Niranjan
(1995 cited in Egbo, 2012) have demonstrated the effects of
thermal processing on the quality of soymilk and concluded
that the main chemical reaction that gives rise to heat-induced
color and flavor changes is the maillard reaction. Most work
done on soybean products made reference to future research
to be done to improve colour, taste and aroma of soybean
products either through flavour additives and heat treatments
(Farinde et al., 2008; Ikpeme et al, 2009).
Fig 6: Changes in L* value during storage study of soy rasgulla at room temperature (25±32⁰C)
Fig 7: Changes in a* value during storage study of soy rasgulla at room temperature (25±32⁰C)
~ 1650 ~
The Pharma Innovation Journal http://www.thepharmajournal.com
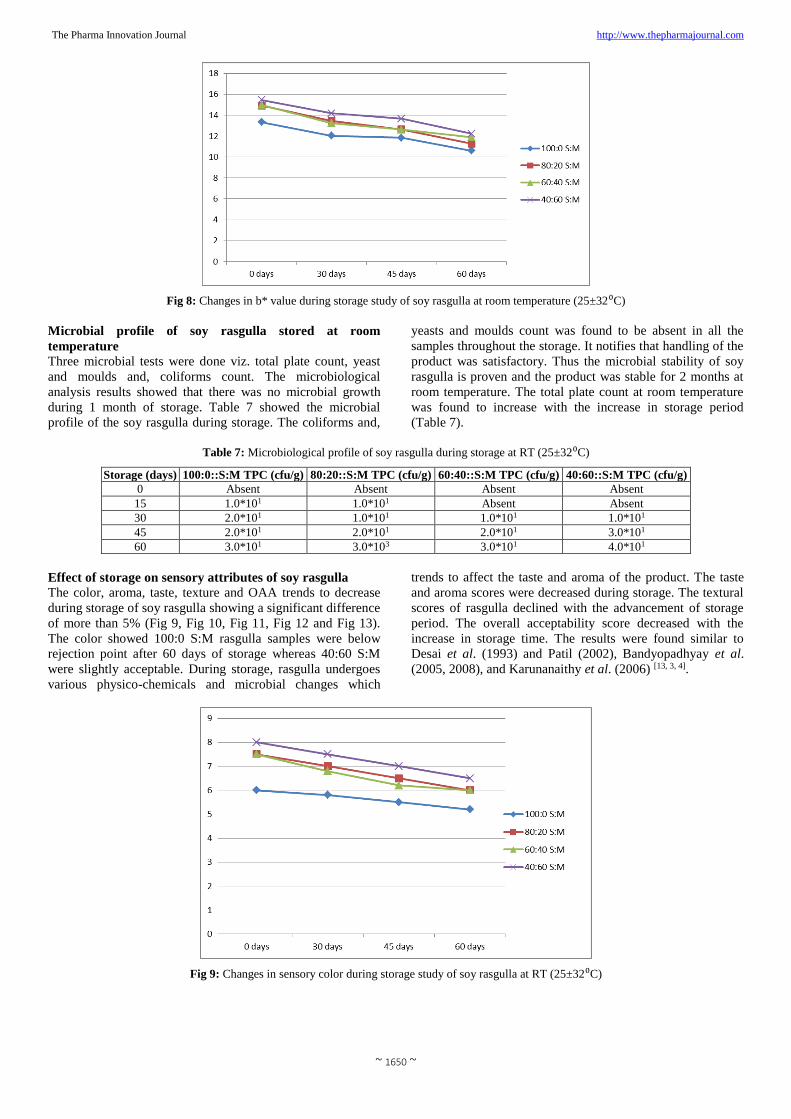
Fig 8: Changes in b* value during storage study of soy rasgulla at room temperature (25±32⁰C)
Microbial profile of soy rasgulla stored at room
temperature
Three microbial tests were done viz. total plate count, yeast
and moulds and, coliforms count. The microbiological
analysis results showed that there was no microbial growth
during 1 month of storage. Table 7 showed the microbial
profile of the soy rasgulla during storage. The coliforms and,
yeasts and moulds count was found to be absent in all the
samples throughout the storage. It notifies that handling of the
product was satisfactory. Thus the microbial stability of soy
rasgulla is proven and the product was stable for 2 months at
room temperature. The total plate count at room temperature
was found to increase with the increase in storage period
(Table 7).
Table 7: Microbiological profile of soy rasgulla during storage at RT (25±32⁰C)
Storage (days) 100:0::S:M TPC (cfu/g) 80:20::S:M TPC (cfu/g) 60:40::S:M TPC (cfu/g) 40:60::S:M TPC (cfu/g)
0 Absent Absent Absent Absent
15 1.0*101 1.0*101 Absent Absent
30 2.0*101 1.0*101 1.0*101 1.0*101
45 2.0*101 2.0*101 2.0*101 3.0*101
60 3.0*101 3.0*103 3.0*101 4.0*101
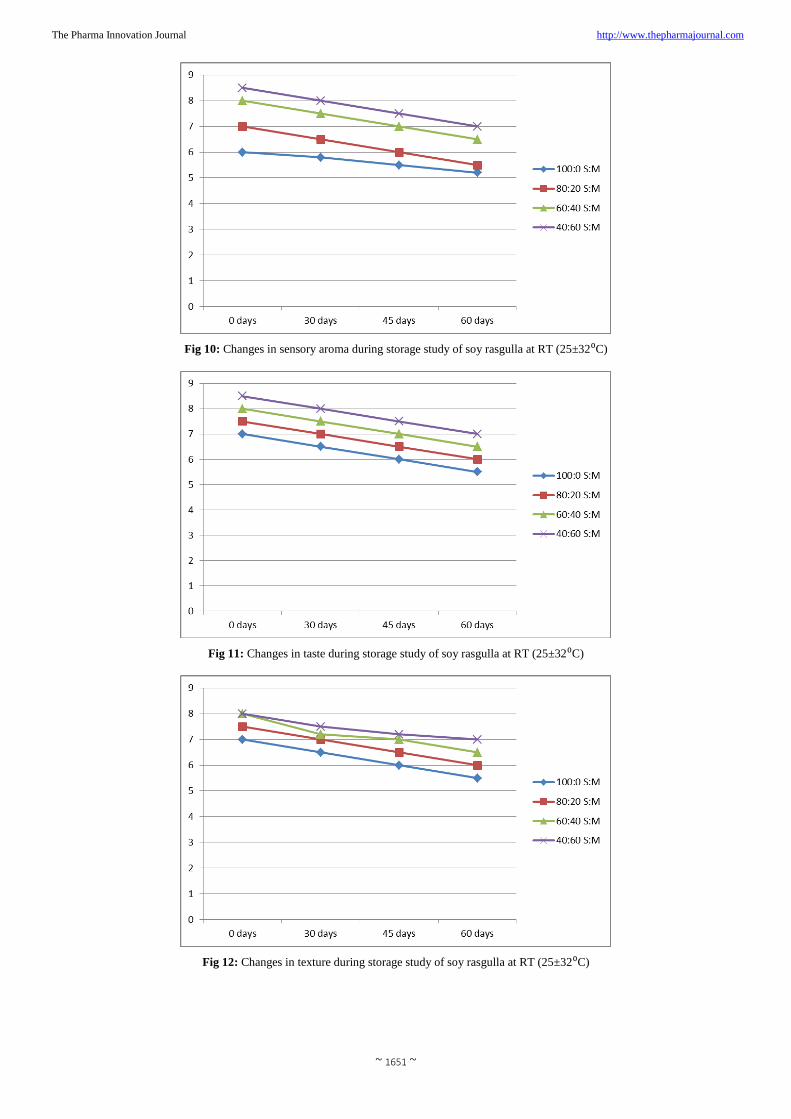
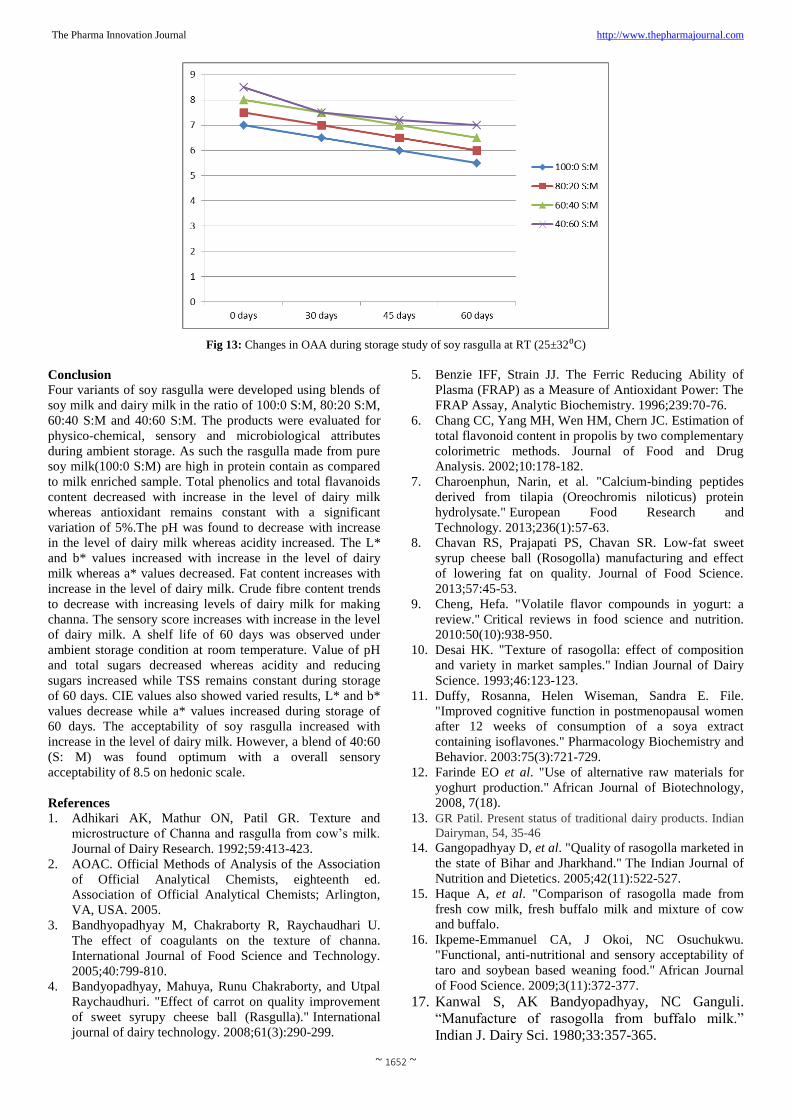
Effect of storage on sensory attributes of soy rasgulla
The color, aroma, taste, texture and OAA trends to decrease
during storage of soy rasgulla showing a significant difference
of more than 5% (Fig 9, Fig 10, Fig 11, Fig 12 and Fig 13).
The color showed 100:0 S:M rasgulla samples were below
rejection point after 60 days of storage whereas 40:60 S:M
were slightly acceptable. During storage, rasgulla undergoes
various physico-chemicals and microbial changes which
trends to affect the taste and aroma of the product. The taste
and aroma scores were decreased during storage. The textural
scores of rasgulla declined with the advancement of storage
period. The overall acceptability score decreased with the
increase in storage time. The results were found similar to
Desai et al. (1993) and Patil (2002), Bandyopadhyay et al.
(2005, 2008), and Karunanaithy et al. (2006) [13, 3, 4].
Fig 9: Changes in sensory color during storage study of soy rasgulla at RT (25±32⁰C)
~ 1651 ~
The Pharma Innovation Journal http://www.thepharmajournal.com
Fig 10: Changes in sensory aroma during storage study of soy rasgulla at RT (25±32⁰C)
Fig 11: Changes in taste during storage study of soy rasgulla at RT (25±32⁰C)
Fig 12: Changes in texture during storage study of soy rasgulla at RT (25±32⁰C)
~ 1652 ~
The Pharma Innovation Journal http://www.thepharmajournal.com
Fig 13: Changes in OAA during storage study of soy rasgulla at RT (25±32⁰C)
Conclusion Four variants of soy rasgulla were developed using blends of
soy milk and dairy milk in the ratio of 100:0 S:M, 80:20 S:M,
60:40 S:M and 40:60 S:M. The products were evaluated for
physico-chemical, sensory and microbiological attributes
during ambient storage. As such the rasgulla made from pure
soy milk(100:0 S:M) are high in protein contain as compared
to milk enriched sample. Total phenolics and total flavanoids
content decreased with increase in the level of dairy milk
whereas antioxidant remains constant with a significant
variation of 5%.The pH was found to decrease with increase
in the level of dairy milk whereas acidity increased. The L*
and b* values increased with increase in the level of dairy
milk whereas a* values decreased. Fat content increases with
increase in the level of dairy milk. Crude fibre content trends
to decrease with increasing levels of dairy milk for making
channa. The sensory score increases with increase in the level
of dairy milk. A shelf life of 60 days was observed under
ambient storage condition at room temperature. Value of pH
and total sugars decreased whereas acidity and reducing
sugars increased while TSS remains constant during storage
of 60 days. CIE values also showed varied results, L* and b*
values decrease while a* values increased during storage of
60 days. The acceptability of soy rasgulla increased with
increase in the level of dairy milk. However, a blend of 40:60
(S: M) was found optimum with a overall sensory
acceptability of 8.5 on hedonic scale.
References
1. Adhikari AK, Mathur ON, Patil GR. Texture and
microstructure of Channa and rasgulla from cow’s milk.
Journal of Dairy Research. 1992;59:413-423.
2. AOAC. Official Methods of Analysis of the Association
of Official Analytical Chemists, eighteenth ed.
Association of Official Analytical Chemists; Arlington,
VA, USA. 2005.
3. Bandhyopadhyay M, Chakraborty R, Raychaudhari U.
The effect of coagulants on the texture of channa.
International Journal of Food Science and Technology.
2005;40:799-810.
4. Bandyopadhyay, Mahuya, Runu Chakraborty, and Utpal
Raychaudhuri. "Effect of carrot on quality improvement
of sweet syrupy cheese ball (Rasgulla)." International
journal of dairy technology. 2008;61(3):290-299.
5. Benzie IFF, Strain JJ. The Ferric Reducing Ability of
Plasma (FRAP) as a Measure of Antioxidant Power: The
FRAP Assay, Analytic Biochemistry. 1996;239:70-76.
6. Chang CC, Yang MH, Wen HM, Chern JC. Estimation of
total flavonoid content in propolis by two complementary
colorimetric methods. Journal of Food and Drug
Analysis. 2002;10:178-182.
7. Charoenphun, Narin, et al. "Calcium-binding peptides
derived from tilapia (Oreochromis niloticus) protein
hydrolysate." European Food Research and
Technology. 2013;236(1):57-63.
8. Chavan RS, Prajapati PS, Chavan SR. Low-fat sweet
syrup cheese ball (Rosogolla) manufacturing and effect
of lowering fat on quality. Journal of Food Science.
2013;57:45-53.
9. Cheng, Hefa. "Volatile flavor compounds in yogurt: a
review." Critical reviews in food science and nutrition.
2010:50(10):938-950.
10. Desai HK. "Texture of rasogolla: effect of composition
and variety in market samples." Indian Journal of Dairy
Science. 1993;46:123-123.
11. Duffy, Rosanna, Helen Wiseman, Sandra E. File.
"Improved cognitive function in postmenopausal women
after 12 weeks of consumption of a soya extract
containing isoflavones." Pharmacology Biochemistry and
Behavior. 2003:75(3):721-729.
12. Farinde EO et al. "Use of alternative raw materials for
yoghurt production." African Journal of Biotechnology,
2008, 7(18).
13. GR Patil. Present status of traditional dairy products. Indian
Dairyman, 54, 35-46 14. Gangopadhyay D, et al. "Quality of rasogolla marketed in
the state of Bihar and Jharkhand." The Indian Journal of
Nutrition and Dietetics. 2005;42(11):522-527.
15. Haque A, et al. "Comparison of rasogolla made from
fresh cow milk, fresh buffalo milk and mixture of cow
and buffalo.
16. Ikpeme-Emmanuel CA, J Okoi, NC Osuchukwu.
"Functional, anti-nutritional and sensory acceptability of
taro and soybean based weaning food." African Journal
of Food Science. 2009;3(11):372-377.
17. Kanwal S, AK Bandyopadhyay, NC Ganguli.
“Manufacture of rasogolla from buffalo milk.”
Indian J. Dairy Sci. 1980;33:357-365.
~ 1653 ~
The Pharma Innovation Journal http://www.thepharmajournal.com
18. Karunanaithy C, Varadharaju N and Kaillapan R. Studies
on the development of the kneader and ball former for
channa in rasgulla production: Part III Quality parameters
of rasgulla. Journal of Food Engineering. 2007;80:966-
971.
19. Karunanithy CN, Varadharaju, K Thangavel. "A
comparative study on quality and textural parameters of
commercial and machine prepared rasogolla." Journal of
food science and technology-Mysore. 2006;43(5):493-
495.
20. Kaur C, Kapoor HC. Antioxidant in fruits and
vegetables-the Millennium’s health, International Journal
of Food Science and Technology. 2001;36:703-25.
21. Kumar V, Rani A, Dixit AK, Pratap D, Bhatnagar D. A
comparative assessment of total phenolic content, ferric
reducing-anti-oxidative power, free radical-scavenging
activity, vitamin C and isoflavones content in soybean
with varying seed coat colour,Food Research
International. 2010;43:323-328.
22. KWOK, KIN‐CHOR, Keshavan Niranjan. "Effect of
thermal processing on soymilk." International journal of
food science & technology. 1995;30(3):263-295.
23. Kwok, Kin‐Chor, Dov Basker, Keshavan Niranjan.
"Kinetics of sensory quality changes in soymilk during
thermal processing, by parametric and non‐parametric
data analyses." Journal of the Science of Food and
Agriculture. 2000;80(5):595-600.
24. Lee SY, CV Morr, A Seo. "Comparison of milk-based
and soymilk-based yogurt." Journal of Food
Science. 1990;55(2):532-536.
25. Lee, Sang Hwa, David B. Min. "Effects, quenching
mechanisms, and kinetics of carotenoids in chlorophyll-
sensitized photooxidation of soybean oil." Journal of
Agricultural and Food Chemistry. 1990;38(8):1630-1634.
26. Li, Shuhong, et al. "Soybean curd residue: composition,
utilization, and related limiting factors." International
Scholarly Research Notices, 2013.
27. Liu K. Soybeans: Chemistry, Technology and Utilization.
Chapter 4. I: Soymilk & II: Tofu. New York: Chapman
and Hall. 1997, p. 138-197.
28. Lv, Ying, et al. "Identification and characteristics of iron-
chelating peptides from soybean protein hydrolysates
using IMAC-Fe3+." Journal of agricultural and food
chemistry. 2009;57(11):4593-4597.
29. M Dubois, KA Gilles, JK Hamilton, PA Rebers, F Smith.
Colorimetric method for determination of sugars and
related substances, Anal. Chem. 1956;28:350-356.
30. Onuorah CE, AO Adejare, NS Uhiara. "Comparative
physico-chemical evaluation of soymilk and soya cake
produced by three different methods," 2007.
31. Peng Claudia Yu-Chen, et al. "Dietary soy protein
selectively reduces renal prostanoids and
cyclooxygenases in polycystic kidney
disease." Experimental biology and medicine.
2009;234(7):737-743.
32. Ranganna S. Handbook of analysis and quality control
for fruit and vegetable products and Ed., Tata Mc-Graw
Hill publishing company Ltd, New Delhi. 1999.
33. Rani Meenakshi, NS Verma. "Changes in organoleptic
quality during ripening of cheese made from cows and
soya milk blends, using microbial rennet." Food
chemistry. 1995;54(4):369-375.
34. Rao MS, et al. "Studies on preparation of chhana from
buffalo milk and its suitability for rasogolla
manufacture." Indian Journal of Dairy
Science. 1989;42(4):810-816.
35. Sahu JK, Das H. A continuous heat-acid coagulation unit
for continuous production of chhana. Assam Univ J Sci
Technol Phys Sci Technol. 2009;4:40–45.
36. Singleton, Vernon L, Joseph A Rossi. "Colorimetry of
total phenolics with phosphomolybdic-phosphotungstic
acid reagents." American journal of Enology and
Viticulture. 1965;16(3):144-158.
37. Tarafdar, Sharif Uddin, et al. "A comparative study on
the quality of Rasogolla made in laboratory and collected
from local markets of Mymensingh,
Bangladesh." Pakistan Journal of Nutrition. 2002;1(3):
156-160.
38. Yamabe Shigeo, et al. "Effect of soybean varieties on the
content and composition of isoflavone in rice-koji
miso." Food Chemistry. 2007;100(1):369-374.
39. Franke, Adrian A, et al. "Isoflavone levels in soy foods
consumed by multiethnic populations in Singapore and
Hawaii." Journal of agricultural and food chemistry.
1999, 977-986.
40. Yang Gong, et al. "Prospective cohort study of soy food
intake and colorectal cancer risk in women." The
American journal of clinical nutrition. 2009;89(2):577-
583.
41. Zhishen Jia, Tang Mengcheng, Wu Jianming. "The
determination of flavonoid contents in mulberry and their
scavenging effects on superoxide radicals." Food
chemistry. 1999;64(4):555-559.
42. Zimmermann Céline, et al. "Prevention of diabetes in
db/db mice by dietary soy is independent of isoflavone
levels." Endocrinology. 2012;153(11):5200-5211.
Related Documents