Network Protocols and Algorithms ISSN 1943-3581 2013, Vol. 5, No. 1 www.macrothink.org/npa 71 Development and Evaluation of Smart Grid Simulation System with Power Stabilization by EV Keiko Karaishi Department of Information Sciences, Ochanomizu University 2-1-1 Ohtsuka, Bunkyo-ku, Tokyo (Japan) Tel: +81-3-5978-5704 E-mail: [email protected] Masato Oguchi Department of Information Sciences, Ochanomizu University 2-1-1 Ohtsuka, Bunkyo-ku, Tokyo (Japan) Tel: +81-3-5978-5704 E-mail: [email protected] Received: March 1, 2013 Accepted: March 15, 2013 Published: March 31, 2013 DOI: 10.5296/npa.v5i1.3261 URL: http://dx.doi.org/10.5296/ npa.v5i1.3261 Abstract Recently, attention has been focused on whether the Smart Grid could work efficiently in an energy network. The subject of our study is the electric vehicle (EV), which has been proposed as a potential chargeable/dischargeable part of the power grid infrastructure. As energy is transferred between an EV and the power grid, it is possible to regulate energy on the entire grid via charging and discharging the EV battery. In the future, it may also be possible to stabilize energy within the system, using information technology control embedded in the network of the Smart Grid. This research is to construct the Smart Grid simulation system to evaluate power flow on such an environment. As a result of the evaluation, the proposed and developed system works to provide us means of a useful evaluation for various cases of the Smart Grid. Keywords: energy network, EV, simulation system, Smart Grid, Vehicle-to-Grid (V2G)

Welcome message from author
This document is posted to help you gain knowledge. Please leave a comment to let me know what you think about it! Share it to your friends and learn new things together.
Transcript

Network Protocols and Algorithms
ISSN 1943-3581
2013, Vol. 5, No. 1
www.macrothink.org/npa 71
Development and Evaluation of Smart Grid
Simulation System with Power Stabilization by EV
Keiko Karaishi
Department of Information Sciences, Ochanomizu University
2-1-1 Ohtsuka, Bunkyo-ku, Tokyo (Japan)
Tel: +81-3-5978-5704 E-mail: [email protected]
Masato Oguchi
Department of Information Sciences, Ochanomizu University
2-1-1 Ohtsuka, Bunkyo-ku, Tokyo (Japan)
Tel: +81-3-5978-5704 E-mail: [email protected]
Received: March 1, 2013 Accepted: March 15, 2013 Published: March 31, 2013
DOI: 10.5296/npa.v5i1.3261 URL: http://dx.doi.org/10.5296/ npa.v5i1.3261
Abstract
Recently, attention has been focused on whether the Smart Grid could work efficiently in an energy network. The subject of our study is the electric vehicle (EV), which has been proposed as a potential chargeable/dischargeable part of the power grid infrastructure. As energy is transferred between an EV and the power grid, it is possible to regulate energy on the entire grid via charging and discharging the EV battery. In the future, it may also be possible to stabilize energy within the system, using information technology control embedded in the network of the Smart Grid. This research is to construct the Smart Grid simulation system to evaluate power flow on such an environment. As a result of the evaluation, the proposed and developed system works to provide us means of a useful evaluation for various cases of the Smart Grid.
Keywords: energy network, EV, simulation system, Smart Grid, Vehicle-to-Grid (V2G)

Network Protocols and Algorithms
ISSN 1943-3581
2013, Vol. 5, No. 1
www.macrothink.org/npa 72
1. Introduction
Recently, the scarcity of natural resources and rapid increases in energy demands have
been raised as worldwide problems; thus, it has become necessary to promote renewable
energy generation as a means of energy conservation. As a result, power plants of renewable
energies draw attentions such as solar power, wind power, geothermal power, and so on. They
are expected not only from the viewpoint of energy demands but also environmental
consciousness. However, controlling output power for renewable energy generation is
difficult because energy output is subject to violent fluctuations, different from the traditional
power source like thermal power, hydroelectric power, and atomic power. To address this
issue, attention has been focused on the potential for Smart Grid to work efficiently in energy
networks.
While there are various definitions for Smart Grid depending on literatures, a typical idea
is to control the power grids by the information and communication technology (ICT) to
improve the efficiency of the power grids. It also includes power plants of renewable energies
to supplement the traditional power plants in many cases [1]. Although it is preferable to
include renewable energies from the viewpoint of energy demands problem, they cannot
provide a stable energy as mentioned above. Therefore, information gathered and analyzed
based on ICT is used to supply a stable energy in Smart Grid.
As another viewpoint of the energy demands and environmental consciousness, the
electric vehicle (EV) is also drawing attention recently. EV is closely related to the Smart
Grid. Each EV has a high-capacity battery, which is not only used as a vehicle but is also
treated as a power resource that can charge and discharge energy as needed. This energy
exchange is referred to as 'Vehicle-to-Grid' (V2G), which is expected to be used as a method
of stable energy supply in the Smart Grid.
However, V2G power grids are different from traditional power grids that deliver
electricity from power plants to users in a single direction. Power resources in V2G power
grids are widely distributed within a given area, and electric transmission is bidirectional. In
this case, meticulous control regulation to stabilize power flow is necessary, i.e., it is
necessary to monitor the electric potential of each point on the grid, to exchange information
through the network and to control the distribution of power sources. In such a case, the
Smart Grid is the best platform for gathering and analyzing the information.
In this study, a simulation system is developed as a method to evaluate power control
when EVs are connected to the Smart Grid as a power source. First, a power grid simulation
environment will be constructed, and the impact of EVs connected to the power grid in this
simulated environment will be evaluated. Specifically, we will connect many EVs to the
power grid environment, discharged the batteries and monitor the voltage fluctuations at each
point. Then, we will prepare some algorithms to determine which EV should be discharged,
and evaluate efficacy of electric power stabilization. According to the evaluation, As a result
of the evaluation, the proposed and developed system works to provide us means of a useful
evaluation for various cases of the Smart Grid.

Network Protocols and Algorithms
ISSN 1943-3581
2013, Vol. 5, No. 1
www.macrothink.org/npa 73
The remainder of this paper is organized as follows. Section 2 introduces an outline of
the Smart Grid and EV. Many previous researches have been already published about Smart
Grid and EV, so such references are introduced and our works are justified in this section also.
Section 3 summarizes the simulation system architecture constructed in this study. Section 4
describes a model of the distribution network and introduces the implementation of EVs and
a solar power plant in an experimental simulation system. Section 5 shows the results of the
simulation connecting EVs as a power source to a power grid. Section 6 presents a conclusion
and future directions for this research.
2. Background
2.1 Smart Grid
There is no clear definition of the 'Smart Grid'. In a broad sense, this term refers to the
electric power system that can coordinate and direct the network of electric power energy.
Features of this system include the ability to integrate a large amount of renewable energy, to
transmit electricity in both directions at the power grids and to manage information as well as
energy.
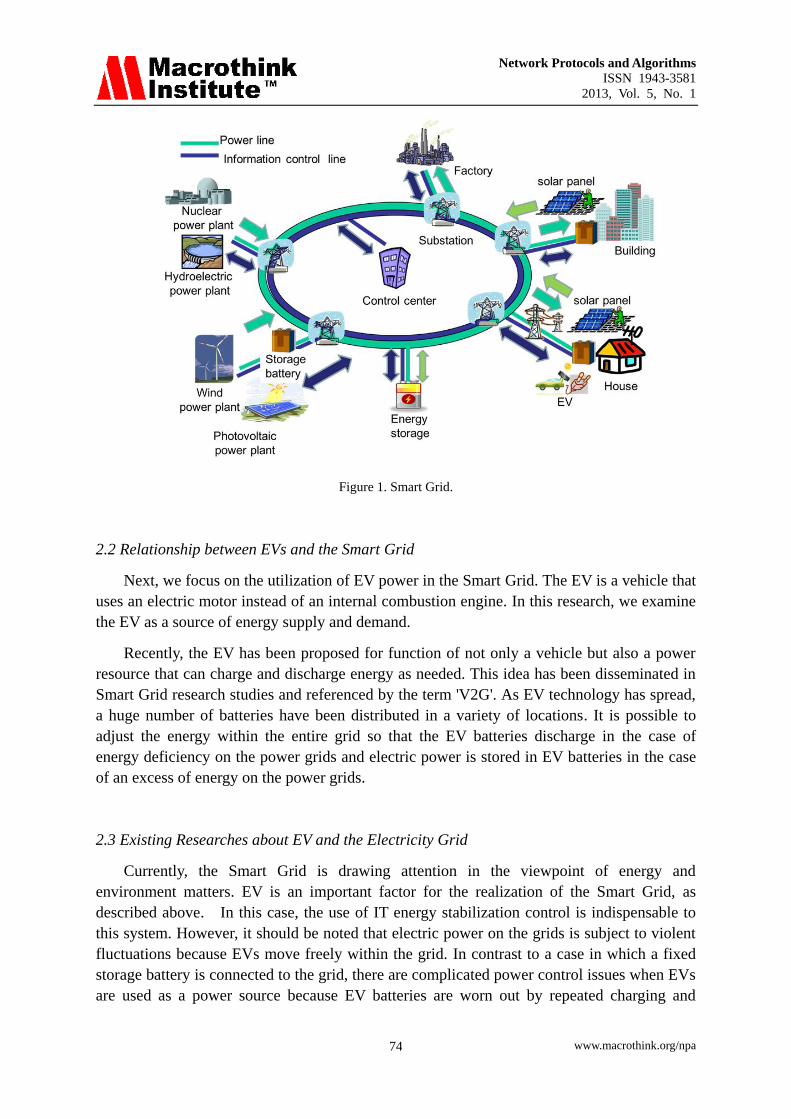
Figure 1 shows the schematic view of a Smart Grid. Figure 1 is a diagram constructed in
reference to official documents from the Ministry of Economy, Trade and Industry [1].
Electric power flow (green line) and information control (blue line) are both represented in
Figure 1. The Smart Grid includes a large wind power plant, a large solar power plant and
solar panels on each home and building, so that electric power can be transmitted
bi-directionally. This feature allows the power grids to accept abundant electric power.
However, there is a concern that power in the grids will become erratic. Thus, control using
IT, an important feature of the Smart Grid, is needed. The control center connects the power
grids and monitors the electric power status of each point on the grids through the network.
The control center enables electric power stabilization so that power generation is promoted
under conditions of energy scarcity, and electric power is stored in the storage facilities under
conditions of energy overabundance. As explained above, the Smart Grid is a technology that
stabilizes the complicated flow of electric power using IT control.
Network Protocols and Algorithms
ISSN 1943-3581
2013, Vol. 5, No. 1
www.macrothink.org/npa 74
Figure 1. Smart Grid.
2.2 Relationship between EVs and the Smart Grid
Next, we focus on the utilization of EV power in the Smart Grid. The EV is a vehicle that
uses an electric motor instead of an internal combustion engine. In this research, we examine
the EV as a source of energy supply and demand.
Recently, the EV has been proposed for function of not only a vehicle but also a power
resource that can charge and discharge energy as needed. This idea has been disseminated in
Smart Grid research studies and referenced by the term 'V2G'. As EV technology has spread,
a huge number of batteries have been distributed in a variety of locations. It is possible to
adjust the energy within the entire grid so that the EV batteries discharge in the case of
energy deficiency on the power grids and electric power is stored in EV batteries in the case
of an excess of energy on the power grids.
2.3 Existing Researches about EV and the Electricity Grid
Currently, the Smart Grid is drawing attention in the viewpoint of energy and
environment matters. EV is an important factor for the realization of the Smart Grid, as
described above. In this case, the use of IT energy stabilization control is indispensable to
this system. However, it should be noted that electric power on the grids is subject to violent
fluctuations because EVs move freely within the grid. In contrast to a case in which a fixed
storage battery is connected to the grid, there are complicated power control issues when EVs
are used as a power source because EV batteries are worn out by repeated charging and

Network Protocols and Algorithms
ISSN 1943-3581
2013, Vol. 5, No. 1
www.macrothink.org/npa 75
discharging cycles excessively.
There are existing researches about EV and electricity grid which have a numeric
simulation. One of them discusses about the communication method between grid and EV, in
which the media and protocols used in the communication among the elements of the Smart
Grid are evaluated [2]. Although this paper provides the evaluation result when EV is used,
which is the same with our works, it concentrates mainly on the communication system of the
Smart Grid itself.
Another paper discusses the optimization problem about power retail sales and an
electric power supply for EVs [3]. This describes mostly the discussion in the viewpoint of
business matters. How to realize the eco-system of EVs economically is also important
because this requires a new social infrastructure. However, the objective of the evaluation is
different from our research works.
The ideal arrangement method of a battery exchange station is discussed and evaluated in
[4]. There is an idea in which the battery of EV is exchanged rather than charged in the
station. In such a case, what we should consider about becomes a little changed; not only the
charge of electricity from the Smart Grid but also the cost of the battery. This is an interesting
viewpoint, which should be considered when this style of the EV usage becomes popular.
Another related work is the discussion of the resource that is easy to be affected on the
grid [5]. This evaluates the charge of EVs from the Smart Grid based on the lifestyle of
people. According to the simulation results, the resources on the Smart Grid should be
influenced intensively by the charge of EVs.
The impact of deployment of Plug-in Hybrid Electric Vehicles (PHEVs) on current
power distribution network is estimated and discussed in [6]. Supply/demand matching and
potential violations of statutory voltage limits, power quality and imbalance are clarified. The
impact of charging PHEVs on distribution Grid also evaluated in [7] in order to improve its
efficiency. [8] also discusses about the relationship between feeder losses, load factor, and
load variance in the context of coordinated PHEV charging. These evaluations assume
present electric Grid and investigate the impact of introduction of EVs to the Grid, different
from our works that assumes Smart Grid in the near future.
In [9], the potential impact of PHEVs charging on the Smart Grid is investigated. This
explores a simulation method that combines Multi-Agent Transport Simulation (MATSim)
and PHEV Management and Power System Simulation (PMPSS) so that higher resolution
electric demand data can be treated. Although more detailed condition for charging PEVs can
be clarified, V2G case is not discussed in this literature.
The basic principles of V2G communication interfaces are described in [10]. Protocol
mapping for this purpose is proposed in this work, and sample implementation is shown.
However, the performance of the system is not evaluated different from our research works.
Many literatures describes about the Smart Grid and/or EV using a numeric simulation.
However, it is difficult to verify how much influence they have to an actual electricity grid. It

Network Protocols and Algorithms
ISSN 1943-3581
2013, Vol. 5, No. 1
www.macrothink.org/npa 76
is necessary to analyze the voltage value and the power value at each point in detail.
In this paper, the effects of a solar power plant and EVs on power grids are examined via
simulations in which the power output of the solar power plant and number and position of
EVs discharging at a given time are varied.
3. System Architecture
This section summarizes the electric power system simulator "OpenDSS" used for this
system and the simulation system architecture constructed in this study.
3.1 OpenDSS
The constructed experimental environment was based on a simulation platform by Open
Distribution System Simulator (OpenDSS) [11]. OpenDSS can manage and analyze objects
(lines, buses, power plants, substations, regulators, capacitors, etc.) on the power network
constructed by user. Moreover, it is possible to set up the rated voltage, rated current, rated
power, rated load, a connection method of each object, and so on. We can set a time unit
(yearly, monthly, daily etc.) freely and observe power flow.
3.2 Constructed Smart Grid Simulation System
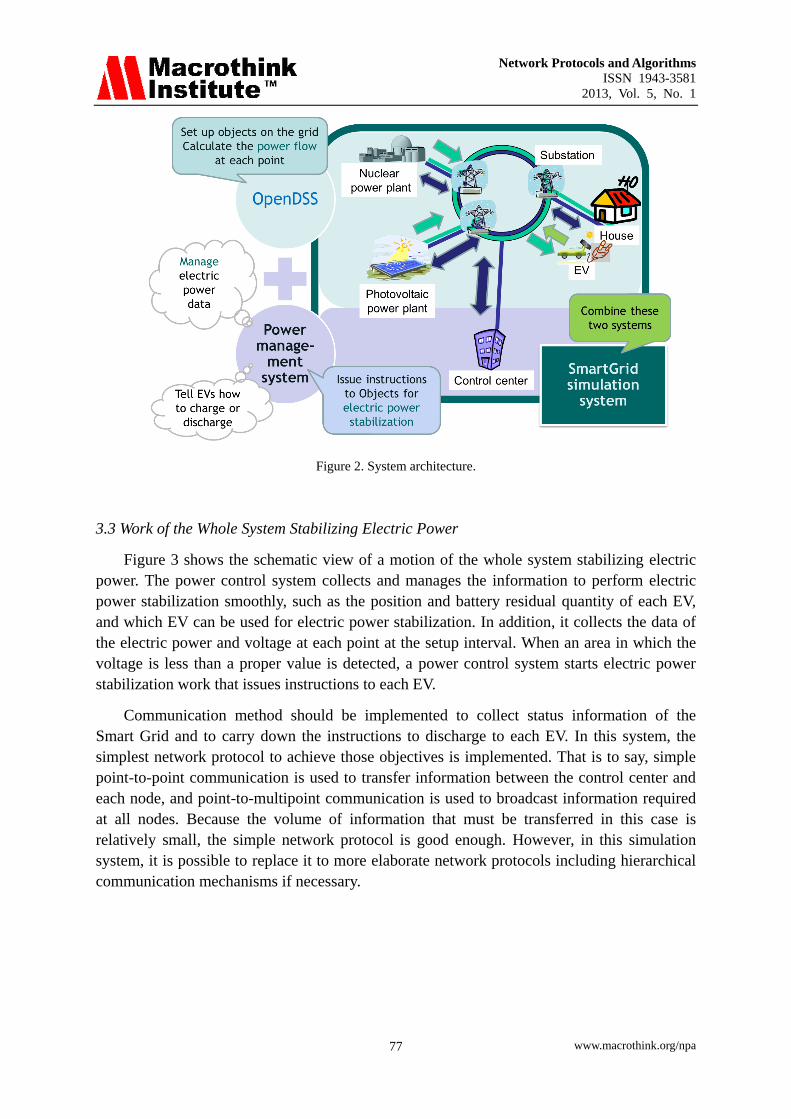
Figure 2 shows the schematic view of Smart Grid System architecture which was
constructed in this research work. First, we set up objects on electricity grids such as EVs and
a power plant on OpenDSS, and it calculates the power flow at each point. Next, we
constructed the power control system which issues instructions to Objects for electric power
stabilization at each point, such as management of data of electric power situation and the
method of electric discharge of EV. Finally, we combined these two systems, and the Smart
Grid simulation system is constructed.
Network Protocols and Algorithms
ISSN 1943-3581
2013, Vol. 5, No. 1
www.macrothink.org/npa 77
Figure 2. System architecture.
3.3 Work of the Whole System Stabilizing Electric Power
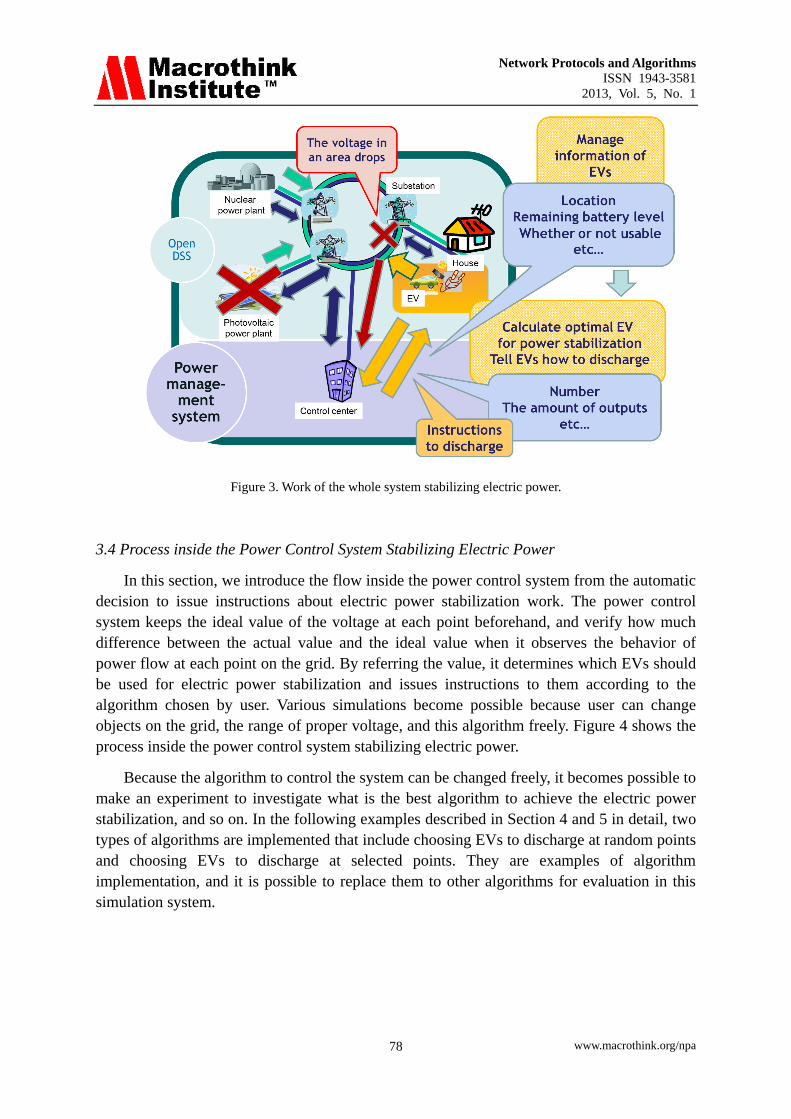
Figure 3 shows the schematic view of a motion of the whole system stabilizing electric
power. The power control system collects and manages the information to perform electric
power stabilization smoothly, such as the position and battery residual quantity of each EV,
and which EV can be used for electric power stabilization. In addition, it collects the data of
the electric power and voltage at each point at the setup interval. When an area in which the
voltage is less than a proper value is detected, a power control system starts electric power
stabilization work that issues instructions to each EV.
Communication method should be implemented to collect status information of the
Smart Grid and to carry down the instructions to discharge to each EV. In this system, the
simplest network protocol to achieve those objectives is implemented. That is to say, simple
point-to-point communication is used to transfer information between the control center and
each node, and point-to-multipoint communication is used to broadcast information required
at all nodes. Because the volume of information that must be transferred in this case is
relatively small, the simple network protocol is good enough. However, in this simulation
system, it is possible to replace it to more elaborate network protocols including hierarchical
communication mechanisms if necessary.
Network Protocols and Algorithms
ISSN 1943-3581
2013, Vol. 5, No. 1
www.macrothink.org/npa 78
Figure 3. Work of the whole system stabilizing electric power.
3.4 Process inside the Power Control System Stabilizing Electric Power
In this section, we introduce the flow inside the power control system from the automatic
decision to issue instructions about electric power stabilization work. The power control
system keeps the ideal value of the voltage at each point beforehand, and verify how much
difference between the actual value and the ideal value when it observes the behavior of
power flow at each point on the grid. By referring the value, it determines which EVs should
be used for electric power stabilization and issues instructions to them according to the
algorithm chosen by user. Various simulations become possible because user can change
objects on the grid, the range of proper voltage, and this algorithm freely. Figure 4 shows the
process inside the power control system stabilizing electric power.
Because the algorithm to control the system can be changed freely, it becomes possible to
make an experiment to investigate what is the best algorithm to achieve the electric power
stabilization, and so on. In the following examples described in Section 4 and 5 in detail, two
types of algorithms are implemented that include choosing EVs to discharge at random points
and choosing EVs to discharge at selected points. They are examples of algorithm
implementation, and it is possible to replace them to other algorithms for evaluation in this
simulation system.

Network Protocols and Algorithms
ISSN 1943-3581
2013, Vol. 5, No. 1
www.macrothink.org/npa 79
Figure 4. Process inside the power control system stabilizing electric power.
4. Experimental Description
In this chapter, we explain an element to be set up in advance in an experiment such as a
power grid model and a packaging method of a photovoltaic power plant and EV.
4.1 Power Grid Model
We experiment using a smart grid simulation system explained in Section 3. The
constructed experimental environment was based on a power grid model ‘8500-Node Test
Feeder’ (Figure 5) provided by IEEE Power & Energy Society (PES) [12]. This power grid
model has 8500 nodes distributed in approximately 10-15 km square. The grid computes
power flow based on the specified load. In this model, a voltage source (115 kV, 3,000 MVA)
with a three-phase electrical power system and the substations to transform from 115 kV to
120/240 V via 7.2 kV are connected to the power grid. The power transmission method of
each end node (120/240 V) is a split-phase electrical distribution system, and the load of each
end point is 0.005-93.73 kW. The entire grid has a 10,773 kW load, i.e., a load of
approximately 2,000 households.

Network Protocols and Algorithms
ISSN 1943-3581
2013, Vol. 5, No. 1
www.macrothink.org/npa 80
Figure 5. 8500-Node Test Feeder.
4.2 Experiment Environment
A solar power plant (2,400 kW) at one point in a 7.2 kV area was connected to the power
grid model introduced in Section 4.1.
Each 2,354 end point in a 120/240 V area has one household, and 50% of the total
number of households have a single EV attached. When the electric power on a grid
fluctuates abnormally, charging and discharging the EV battery connected to each household
stabilizes electric power within the entire grid. Each EV has 25 kWh battery charged fully
and each output power is 2 kW. Figure 6 shows the model described above.
Figure 6. Experimental system.
Network Protocols and Algorithms
ISSN 1943-3581
2013, Vol. 5, No. 1
www.macrothink.org/npa 81
4.3 Voltage Stabilization by Discharging EV
Prior to this experiment, the change in the number of available EVs as a function of time
was surveyed. In this experiment, only EVs connected to households that would not be used
as transportation were used as voltage stabilization sources. For simplicity, we assumed that
EVs are used for commuting mostly.
We determined the change in the approximate number of EVs as a function of time based
on [13] and [14]
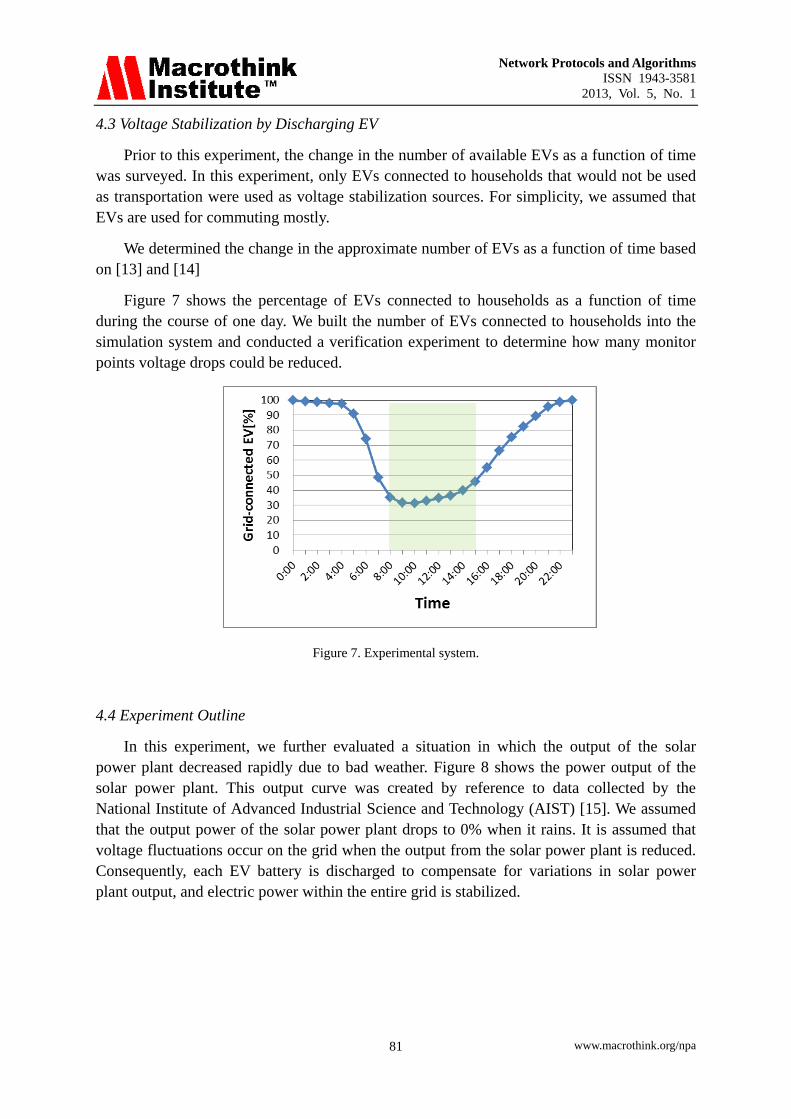
Figure 7 shows the percentage of EVs connected to households as a function of time
during the course of one day. We built the number of EVs connected to households into the
simulation system and conducted a verification experiment to determine how many monitor
points voltage drops could be reduced.
Figure 7. Experimental system.
4.4 Experiment Outline
In this experiment, we further evaluated a situation in which the output of the solar
power plant decreased rapidly due to bad weather. Figure 8 shows the power output of the
solar power plant. This output curve was created by reference to data collected by the
National Institute of Advanced Industrial Science and Technology (AIST) [15]. We assumed
that the output power of the solar power plant drops to 0% when it rains. It is assumed that
voltage fluctuations occur on the grid when the output from the solar power plant is reduced.
Consequently, each EV battery is discharged to compensate for variations in solar power
plant output, and electric power within the entire grid is stabilized.

Network Protocols and Algorithms
ISSN 1943-3581
2013, Vol. 5, No. 1
www.macrothink.org/npa 82
Figure 8. Output of the solar power plant.
In the monitor points at 1,177 substations transforming electric power from 7.2 kV to
120/240 V, we observed to verify voltage fluctuations in the entire power grid resulting from
the power output fluctuations at the solar power plant caused by changes in the weather
between 7:00 and 16:00. Furthermore, when the power management system judged that the
grid have lack of electric power, we evaluate how much a voltage difference would be
observed at each point with some electric power stabilization algorithms.
4.5 Voltage Stabilization Algorithm
We set up voltage at each point when the photovoltaic power plant outputs electric power
on fine weather as an ideal value to the power management system in advance. We assumed
that the voltage was within an adequate range if the voltage difference at each monitor point
was 5 V or less with reference to each voltage in the case of fine weather. This range was
determined based on the Regulations for Enforcement of the Telecommunications Business
Law.
In order to make experiments of the voltage stabilization by EV, we prepared two
patterns of algorithms which determine EV to discharge. First algorithm is discharging EVs at
the random point and second algorithm is discharging EVs near the point that voltage
difference is beyond the adequate value range. We verified how much a voltage difference
was observed at each point by changing the position of discharging EV and proved the
efficiency of the technique of electric power stabilization.
Figure 9 shows the adequate value range of voltage difference and the point of
discharging EV in case of testing second algorithm (discharging EVs near the point that
voltage difference is beyond the adequate value range). Each graph shows units of monitor
points observing voltage as the abscissa and units of the voltage difference [V] as the ordinate
axis. The area colored in orange shows the adequate range in which the voltage difference at
each monitor point is 5 V or less with reference to each voltage in the case of fine weather.

Network Protocols and Algorithms
ISSN 1943-3581
2013, Vol. 5, No. 1
www.macrothink.org/npa 83
Figure 9. The aptitude range of voltage and the points discharging EVs.
5. Experimental Result with the Constructed Simulation System
5.1 Voltage Variation on the Grid by the Output Difference of the Power Plant
In this section, the monitor points at 1,177 substations transforming electric power from
7.2 kV to 120/240 V were observed to verify voltage fluctuations present in the entire power
grid resulting from the power output fluctuations at the solar power plant caused by changes
in the weather. Figure 8 shows that each power output difference caused by changes in the
weather occurs between 7:00 and 16:00. The simulation system then calculated the voltage
difference at each point caused by changes in the weather over time. We verify how much
voltage differences arise by change of the weather, and compensates voltage difference by
discharging EV.
Figure 10 through Figure 13 show voltage difference at each point every 2 hours between
9:00 and 15:00. Table 1 shows the proportion of the number of points where the voltage
differences are identified within the adequate range.
Table 1. Proportion of the number of points within the adequate range [%].
Time 7:00 8:00 9:00 10:00 11:00 12:00 13:00 14:00 15:00 16:00
Within the normalvalue range
100.0 82.9 63.4 57.4 57.4 57.4 57.4 68.3 96.8 100.0

Network Protocols and Algorithms
ISSN 1943-3581
2013, Vol. 5, No. 1
www.macrothink.org/npa 84
Figure 10. Voltage difference (9:00). Figure 11. Voltage difference (11:00).
Figure 12. Voltage difference (13:00). Figure 13. Voltage difference (15:00).
Each graph shows units of 1,177 monitor points observing voltage as the abscissa and
units of the voltage difference [V] as the ordinate axis. The area colored in orange shows the
adequate range in which the voltage difference at each monitor point is 5 V or less with
reference to each voltage during the fine weather.
The voltage at each monitor point dropped to a lower value because the output power of
the solar power plant decreased to 0% during the bad weather. Between 8:00 and 15:00, the
voltage at some points should be raised to the adequate range. The number of deviated points
is increased around the noon particularly, as shown in Figure 11 and 12, compared with
morning and late afternoon cases shown in Figure 10 and 13. Therefore, discharging EV is
necessary for electric power stabilization of the entire grid between 8:00 and 15:00.
5.2 Voltage Variation in the Case of Discharging EVs at Random Points
In this section, we have a verified the reduction of dropped voltage on the entire grid
caused by changes in the weather shown in Section 5.1.
In this experiment, EVs were connected at random. The monitor points at 1,177
substations that transform electric power from 7.2 kV to 120/240 V were observed to verify
voltage fluctuations present in the entire power grid resulting from the power output
fluctuations at the solar power plant caused by changes in the weather. In this experiment, the
number of EV which can be used for electric power stabilization is changed according to the
data shown in Figure 7. All available EVs discharge. Figure 14 through Figure 17 show
Network Protocols and Algorithms
ISSN 1943-3581
2013, Vol. 5, No. 1
www.macrothink.org/npa 85
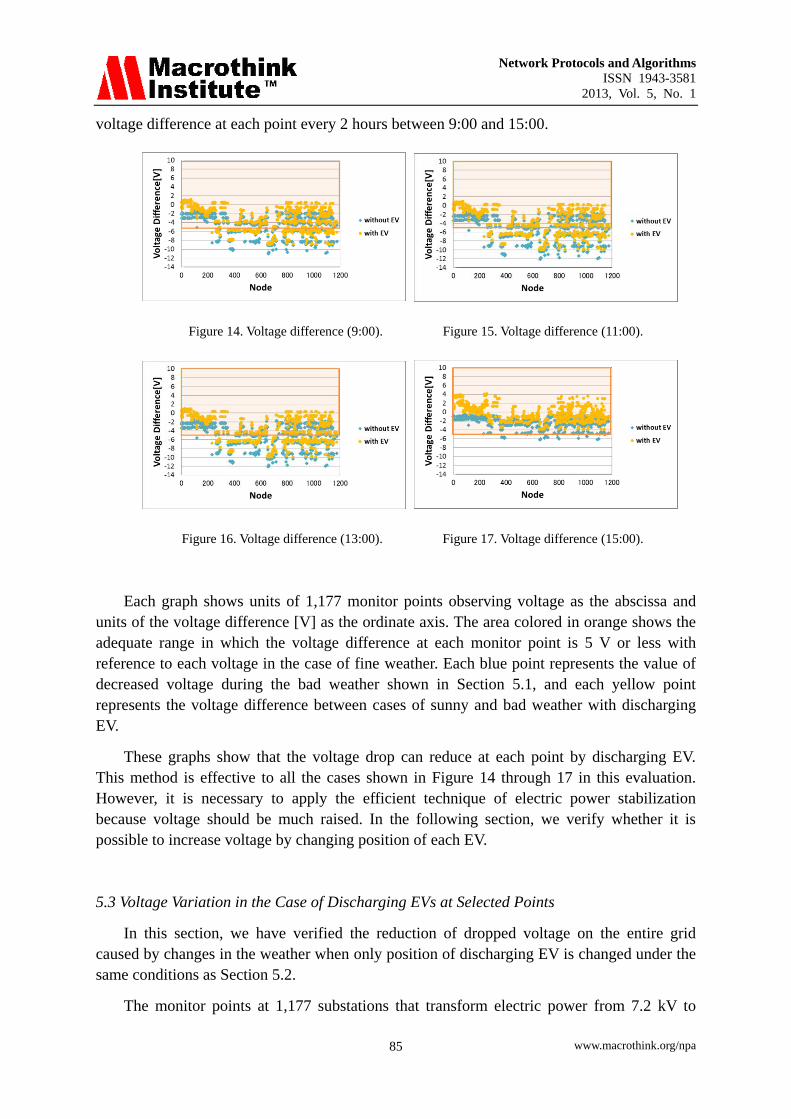
voltage difference at each point every 2 hours between 9:00 and 15:00.
Figure 14. Voltage difference (9:00). Figure 15. Voltage difference (11:00).
Figure 16. Voltage difference (13:00). Figure 17. Voltage difference (15:00).
Each graph shows units of 1,177 monitor points observing voltage as the abscissa and
units of the voltage difference [V] as the ordinate axis. The area colored in orange shows the
adequate range in which the voltage difference at each monitor point is 5 V or less with
reference to each voltage in the case of fine weather. Each blue point represents the value of
decreased voltage during the bad weather shown in Section 5.1, and each yellow point
represents the voltage difference between cases of sunny and bad weather with discharging
EV.
These graphs show that the voltage drop can reduce at each point by discharging EV.
This method is effective to all the cases shown in Figure 14 through 17 in this evaluation.
However, it is necessary to apply the efficient technique of electric power stabilization
because voltage should be much raised. In the following section, we verify whether it is
possible to increase voltage by changing position of each EV.
5.3 Voltage Variation in the Case of Discharging EVs at Selected Points
In this section, we have verified the reduction of dropped voltage on the entire grid
caused by changes in the weather when only position of discharging EV is changed under the
same conditions as Section 5.2.
The monitor points at 1,177 substations that transform electric power from 7.2 kV to

Network Protocols and Algorithms
ISSN 1943-3581
2013, Vol. 5, No. 1
www.macrothink.org/npa 86
120/240 V were observed to verify voltage fluctuations present in the entire power grid
resulting from the power output fluctuations at the solar power plant caused by changes in the
weather. Similarly, the number of EV which can be used for electric power stabilization is
changed according to the data shown in Figure 7. All available EVs discharge. In this
experiment, we chose algorithm that set up discharging EVs to the point where the voltage
difference is less than the adequate range shown in Section 5.1. Figure 18 through Figure 21
show voltage difference at each point every 2 hours between 9:00 and 15:00.
Figure 18. Voltage difference (9:00). Figure 19. Voltage difference (11:00).
Figure 20. Voltage difference (13:00). Figure 21. Voltage difference (15:00).
Each graph shows units of 1,177 monitor points observing voltage as the abscissa and
units of the voltage difference [V] as the ordinate axis. The area colored in orange shows the
adequate range in which the voltage difference at each monitor point is 5 V or less with
reference to each voltage in the case of fine weather. Each blue point represents the value of
decreased voltage during the bad weather shown in Section 5.1, and each yellow point
represents the voltage difference between cases of sunny and worsening weather with
discharging EV.
These graphs show that the voltage drop can reduce at each point including large voltage
difference area. Especially, the status is greatly improved in the cases of a large number of
deviations being observed without EV, as shown in Figure 18 and 20. Thus, we verified that
the voltage at each point can be efficiently raised by discharging EV targeting the point which
is less than the adequate range.

Network Protocols and Algorithms
ISSN 1943-3581
2013, Vol. 5, No. 1
www.macrothink.org/npa 87
5.4 Discussion
Table 2 shows the proportion of the number of monitor points at which the voltage
difference during the bad weather is within the adequate range for 3 cases.
Table 2. Proportion of points within the adequate range with and without EV [%].
This table shows proportion of points within the adequate range in the case without
discharging EV, the case with discharging EV at random point and the case with discharging
EV at point selected by chosen algorithm. Discharging EVs increase the proportion of the
number of points where the voltage difference is within the adequate range. In the case with
discharging EV at point selected by chosen algorithm, it is able to stabilize voltage at each
point efficiently by discharging EV at the point beyond the adequate range.
In addition, we verified the current at each point could also be stabilized by issuing
directions which reduce voltage difference. Table 3 shows the standard deviation derived
from the current difference at each point.
Table 3. Standard deviation derived from the current difference at each point.
In the case with discharging EV, standard deviation is smaller. This shows that electric
power was able to be stabilized because the current margin of increase at each point becomes
small.
We can verify the technique to stabilize electric power efficiently by using this
simulation system.
Time 8:00 9:00 10:00 11:00 12:00 13:00 14:00 15:00
Without EV 1.9 2.4 2.7 2.7 2.7 2.4 2.2 1.3With EV(select) 0.8 1.0 1.2 1.2 1.2 1.0 0.9 0.9
Network Protocols and Algorithms
ISSN 1943-3581
2013, Vol. 5, No. 1
www.macrothink.org/npa 88
6. Conclusion and Future Works
In this paper, we constructed a Smart Grid simulation system with a solar power plant
and EVs. We evaluated the effect of the solar power plant and EVs on the power grids by
changing the power output of the solar power plant and the number and position of
discharging EVs according to time. In addition we examined the efficient interaction of
electric energy between the EV batteries and power grid using the simulation. Our results
indicated that discharging EVs reduced the voltage drops observed on the entire grid that
were caused by weather-related changes.
In the case with discharging EV at point selected by chosen algorithm, it is able to
stabilize voltage at each point efficiently by discharging EV at the point beyond the adequate
range. In this paper, we prepared the algorithm that is discharging EVs near the point where
voltage difference is beyond the adequate value range. Then, we found this is more efficient
algorithm to stabilize electric power. We can verify the technique to stabilize electric power
efficiently by using this simulation system.
However, it seems that the other situation which was not considered in this system exists.
For example, a situation changes by various factors such as the load of the household
changed according to time. Moreover, we should explore various factors such as EV which
moves by short distance and for a short time and charging EV. The voltage on the grid will
change intricately due to add these factors into this system. For the future, we would like to
construct and verify the system nearer to real environment by adding a management
algorithm that can react quickly to the changing situation.
In the future, it may also be possible to stabilize energy within the system, using
information technology control embedded in the network of the Smart Grid.
Acknowledgement
The authors wish to thank Mr. Onur Altintas at the Toyota InfoTechnology Center and Dr.
Sekyung Han at the Institute of Industrial Science, the University of Tokyo, for conscientious
advice and help with this work.
References
[1] Ministry of Economy, Trade and Industry at: http://www.meti.go.jp/
[2] Jansen B., Binding C., Sundström O., Gantenbein D., "Architecture and Communication
of an Electric Vehicle Virtual Power Plant," In Proc. IEEE International Conference on
Smart Grid Communications (SmartGridComm 2010), pp149-154, Gaithersburg, MD,
USA, October 4-6, 2010. http://dx.doi.org/10.1109/SMARTGRID.2010.5622033
[3] Senart A., Kurth S., Le Roux G., "Assessment Framework of Plug-In Electric Vehicles
Strategies," In Proc. IEEE International Conference on Smart Grid Communications
(SmartGridComm 2010), pp155-160, Gaithersburg, MD, USA, October 4-6, 2010.

Network Protocols and Algorithms
ISSN 1943-3581
2013, Vol. 5, No. 1
www.macrothink.org/npa 89
http://dx.doi.org/10.1109/SMARTGRID.2010.5622036
[4] Feng Pan, Bent R., Berscheid A., Izraelevitz D., "Locating PHEV Exchange Stations in
V2G," In Proc. IEEE International Conference on Smart Grid Communications
(SmartGridComm 2010), pp173-178, Gaithersburg, MD, USA, October 4-6, 2010.
http://dx.doi.org/10.1109/SMARTGRID.2010.5622037
[5] Taylor J., Maitra A., Alexander M., Brooks D., Duvall M., "Evaluations of plug-in
electric vehicle distribution system impacts," In Proc. IEEE Power and Energy Society
General Meeting, pp1-6, Minneapolis, MN, USA, July 25-29, 2010.
http://dx.doi.org/10.1109/PES.2010.5589538
[6] Putrus, G. A., Suwanapingkarl, P., Johnston, D., Bentley, E. C., Narayana, M. "Impact of
electric vehicles on power distribution networks," In Proc. the 5th
IEEE Vehicle Power
and Propulsion Conference (VPPC'09), pp.827-831, Dearborn, MI, USA, September
7-10, 2009. http://dx.doi.org/10.1109/VPPC.2009.5289760
[7] Clement-Nyns, K, Haesen, E., Dreisen, J., "The Impact of Charging Plug-In Hybrid
Electric Vehicles on a Residential Distribution Grid," IEEE Transactions on Power
Systems, Vol.25, No.1, pp.371-380, February 2010.
http://dx.doi.org/10.1109/TPWRS.2009.2036481
[8] Sortomme, E., Hindi, M. M., MacPherson, S. J., Venkata, S. S., "Coordinated Charging
of Plug-In Hybrid Electric Vehicles to Minimize Distribution System Losses," IEEE
Transactions on Smart Grid, Vol.2, No.1, pp.198-205, March 2011.
http://dx.doi.org/10.1109/TSG.2010.2090913
[9] Waraich, R. A., et al., "Plug-in Hybrid Electric Vehicles and Smart Grid: Investigations
Based on a Micro-Simulation," Transportation Research Part C: Emerging Technologies,
Vol.28, pp.74-86, March 2013.
[10] , S., Schmitt, A., Winter, M., Heuer, J., "Interconnections and Communications
of Electric Vehicles and Smart Grids," In Proc. IEEE International Conference on Smart
Grid Communications (SmartGridComm 2010), pp161-166, Gaithersburg, MD, USA,
October 4-6, 2010. http://dx.doi.org/10.1109/SMARTGRID.2010.5622035
[11] OpenDSS at: http://sourceforge.net/projects/electricdss/
[12] IEEE PES at: http://www.ieee-pes.org/
[13] National Household Travel Survey at: http://nhts.ornl.gov/
[14] Federal Highway Administration at: http://www.fhwa.dot.gov/
[15] Agency of Industrial Science and Technology Research Center for Photovoltaic
Technologies at: http://unit.aist.go.jp/rcpvt/ci/index.html
Copyright Disclaimer
Copyright reserved by the author(s).
This article is an open-access article distributed under the terms and conditions of the
Creative Commons Attribution license (http://creativecommons.org/licenses/by/3.0/).
Related Documents


![[Smart Grid Market Research] South Korea: Smart Grid Revolution, Zpryme Smart Grid Insights, July 2011](https://static.cupdf.com/doc/110x72/5414026d8d7f727d698b47c7/smart-grid-market-research-south-korea-smart-grid-revolution-zpryme-smart-grid-insights-july-2011.jpg)


![[Smart Grid Market Research] Smart Grid Index: November 2012 - Zpryme Smart Grid Insights](https://static.cupdf.com/doc/110x72/541402018d7f728a698b47a5/smart-grid-market-research-smart-grid-index-november-2012-zpryme-smart-grid-insights.jpg)