DEVELOPMENT AND EVALUATION OF A CONTINUOUS COARSE (PM 10 - PM 2.5 ) PARTICLE MONITOR Chandan Misra, Michael D. Geller, Pranav Shah, Constantinos Sioutas * Civil and Environmental Engineering University of Southern California 3620 South Vermont Avenue Los Angeles, CA 90089 Paul A. Solomon U.S. EPA National Exposure Research Laboratory 944 East Harmon Avenue Las Vegas, NV 89119 Revised manuscript submitted for publication in the Journal of the Air & Waste Management Association June 2001 * Author to whom correspondence should be addressed

Welcome message from author
This document is posted to help you gain knowledge. Please leave a comment to let me know what you think about it! Share it to your friends and learn new things together.
Transcript
DEVELOPMENT AND EVALUATION OF A CONTINUOUS
COARSE (PM10 - PM2.5) PARTICLE MONITOR
Chandan Misra, Michael D. Geller, Pranav Shah, Constantinos Sioutas*
Civil and Environmental Engineering
University of Southern California
3620 South Vermont Avenue
Los Angeles, CA 90089
Paul A. Solomon
U.S. EPA
National Exposure Research Laboratory
944 East Harmon Avenue
Las Vegas, NV 89119
Revised manuscript submitted for publication in the Journal of the Air
& Waste Management Association
June 2001
* Author to whom correspondence should be addressed
ABSTRACT
In this paper, we describe the development and laboratory and field evaluation of a
continuous coarse (2.5 – 10 µm) particle mass (PM) monitor that can provide reliable
measurements of the coarse mass (CM) concentrations in time intervals as short as 5-10
minute. The operating principle of the monitor is based on enriching CM concentrations
by a factor of about 25 by means of a 2.5 µm cutpoint round nozzle virtual impactor,
while maintaining fine mass, i.e., mass of PM2.5 (FM) at ambient concentrations. The
aerosol mixture is subsequently drawn through a standard TEOM, the response of
which is dominated by the contributions of the CM, due to concentration enrichment.
Findings from the field study ascertain that a TEOM coupled with a PM10 inlet
followed by a 2.5 µm cutpoint round nozzle virtual impactor can be used successfully for
continuous CM concentration measurements. The average concentration-enriched CM
concentrations measured by the TEOM were approximately 26-27 times higher than
those measured by the time-integrated PM10 samplers (MOUDI and Partisol
sampler), and highly correlated. CM concentrations measured by the concentration-
enriched TEOM were independent of the ambient FM-to-CM concentration ratio, due
to the decrease in ambient coarse particle mass median diameter (MMD) with an
increasing FM-to-CM concentration ratio. Finally, our results illustrate one of the main
problems associated with the use of real impactors to sample particles at relative
humidity (RH) values lower than 40%. While PM10 concentrations obtained by means of
the MOUDI and Partisol were in excellent agreement, CM concentrations measured by
the MOUDI were low by 20%, while FM concentrations were high by a factor of 5,
together suggesting particle bounce at low RH.
2
IMPLICATIONS
Several researchers have raised the issue of the quality of CM concentrations data used in
PM exposure assessment and epidemiological studies. Poor CM precision could lead to
potential biases in exposure-health effect models that include both FM and CM exposure
variables, and make it more difficult to properly assess the spatial correlations of CM
over metropolitan areas. Since these issues may be important in evaluating the health
effects of CM relative to PM10 or PM2.5, it is desirable to have CM measurements that are
sufficiently precise to resolve the uncertainty surrounding existing PM studies that
include CM data. This paper describes the development and performance evaluation of a
CM monitor that can provide reliable measurements in time intervals as short as 5
minutes. The simplicity and reliability of this monitor makes it ideal for use in large
scale monitoring networks.
3
INTRODUCTION
Ambient particles in the size range 2.5 to 10 µm are referred to as coarse particles or
coarse mode (CM) aerosols. Coarse particles may consist of several potentially toxic
components, such as resuspended particulate matter from paved and unpaved roads,
industrial materials, brake linings, tire residues, trace metals, and bioaerosols. Since a
considerable fraction of these particles may deposit in the upper airways and to a lesser
extent into the lower airways, they may be responsible for the exacerbation of asthma.
Recent data from a small number of epidemiological studies indicate that, apart from--or
in addition to—the fine fraction (FM) of particulate matter (also called PM2.5), health
effects also may be closely associated with the CM fraction and sometimes even to a
larger extent than FM 1-3. In vitro studies with human monocytes show that cellular
toxicity and inflammation also may be associated with the CM and its biological
components 4-6.
Several researchers have raised the issue of the quality of CM concentrations data
used in PM exposure assessment and epidemiological studies7-9. These researchers state
that poor CM precision could lead to potential biases in exposure-health effect models
that include both FM and CM exposure variables, and make it more difficult to properly
assess the spatial correlations of CM over metropolitan areas. Since these issues may be
important in evaluating the health effects of CM relative to PM10 or PM2.5, it is desirable
to have CM measurements that are sufficiently precise to resolve the uncertainty
surrounding existing PM studies that include CM data.
According to the Federal Reference Method (FRM), current measurements of
both the PM10 and PM2.5 mass concentrations are based on gravimetric analysis of
4
particles collected on filters over a period of 24 hours (Federal Register 10). Gravimetric
analysis was selected because most of the particle data used for the epidemiological
studies investigating associations between mortality and morbidity outcomes and ambient
particle exposures are based on PM concentrations 11,12. Typically, a time-integrated
sample (e.g., over 24 hours) is collected on the filter, which is later equilibrated at
designated temperature and RH conditions, and subsequently weighed to determine the
mass of the deposited PM. Dividing by the amount of air sample yields the atmospheric
concentration. Since the values of atmospheric parameters influencing ambient particle
concentration, hence human exposure, such as the emission strengths of particle sources,
temperature, RH, wind direction and speed and, mixing height, fluctuate in time scales
that are substantially shorter than 24 hours, a 24-hour measurement may not reflect an
accurate representation of human exposure. Thus, more accurate, better quality data on
the physico-chemical characteristics of particles are needed to understand their
atmospheric properties and health effects.
Methods that are capable of providing continuous or near continuous
measurements (i.e. 1-hour average or less) are highly desirable because they can provide
accurate information on human exposure and atmospheric processes in short timer
intervals. Over the past decade, a significant number of state-of-the-art methods were
developed for continuous PM10 and PM2.5 mass concentration measurements. These
include the Tapered Element Oscillating Microbalance (TEOM 1400A; Rupprecht and
Patashnick, Albany NY), a host of nephelometers, such as the DataRAM (RAM-1,
MIE Inc., Billerica, MA), and the DUSTTRACT (Model 8520, TSI Inc., St. Paul, MN),
and the Continuous Ambient Mass Monitor13 (CAMM, Thermo Andersen, Smyrna,
5
GA). The latter method can only provide measurements of FM. Mass concentration
measurements using photometers or nephelometers are based on light scattering, and are
dependent on particle size and chemical composition 14, 15, 16 showed that variations in
particle size and chemical composition may introduce considerable errors in predicting
the response of nephelometers such as the DataRAM.
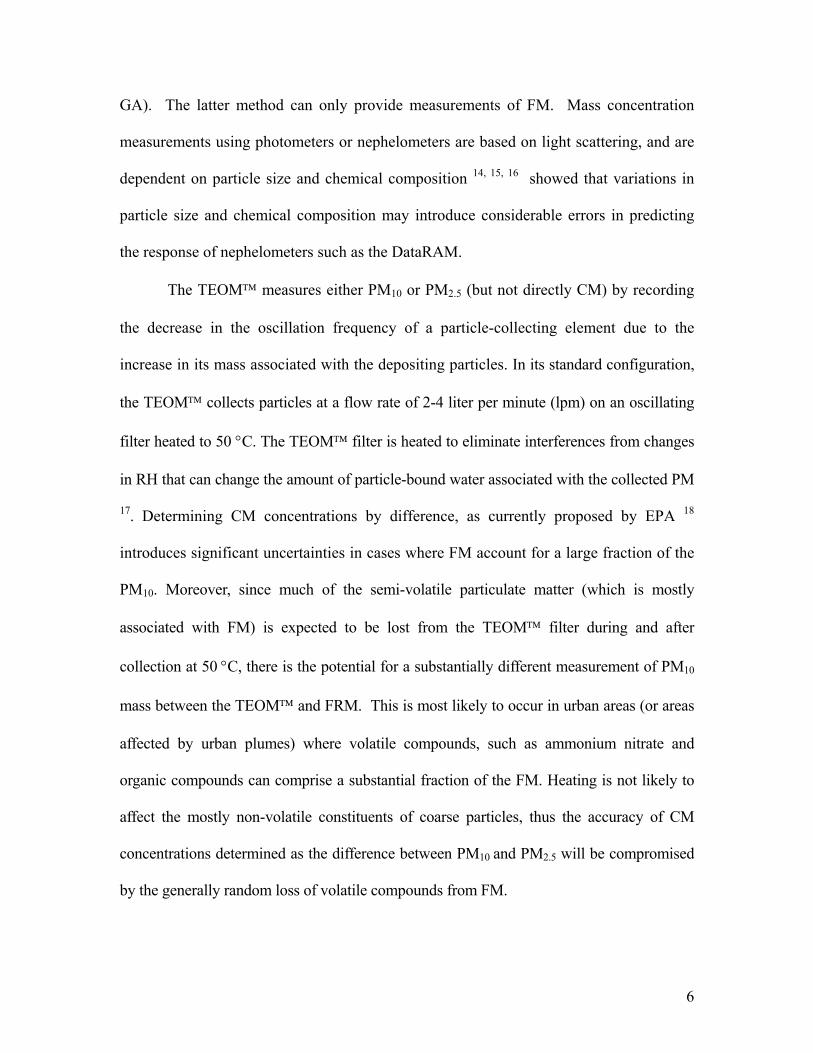
The TEOM measures either PM10 or PM2.5 (but not directly CM) by recording
the decrease in the oscillation frequency of a particle-collecting element due to the
increase in its mass associated with the depositing particles. In its standard configuration,
the TEOM collects particles at a flow rate of 2-4 liter per minute (lpm) on an oscillating
filter heated to 50 °C. The TEOM filter is heated to eliminate interferences from changes
in RH that can change the amount of particle-bound water associated with the collected PM
17. Determining CM concentrations by difference, as currently proposed by EPA 18
introduces significant uncertainties in cases where FM account for a large fraction of the
PM10. Moreover, since much of the semi-volatile particulate matter (which is mostly
associated with FM) is expected to be lost from the TEOM filter during and after
collection at 50 °C, there is the potential for a substantially different measurement of PM10
mass between the TEOM and FRM. This is most likely to occur in urban areas (or areas
affected by urban plumes) where volatile compounds, such as ammonium nitrate and
organic compounds can comprise a substantial fraction of the FM. Heating is not likely to
affect the mostly non-volatile constituents of coarse particles, thus the accuracy of CM
concentrations determined as the difference between PM10 and PM2.5 will be compromised
by the generally random loss of volatile compounds from FM.
6
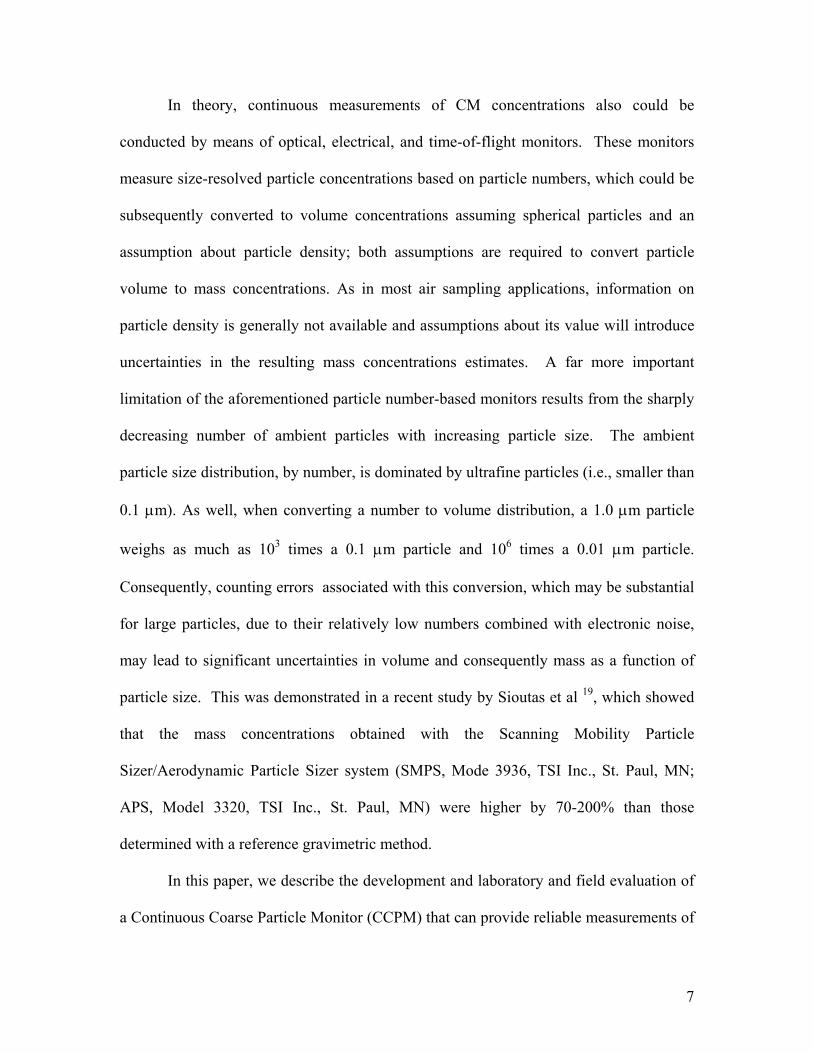
In theory, continuous measurements of CM concentrations also could be
conducted by means of optical, electrical, and time-of-flight monitors. These monitors
measure size-resolved particle concentrations based on particle numbers, which could be
subsequently converted to volume concentrations assuming spherical particles and an
assumption about particle density; both assumptions are required to convert particle
volume to mass concentrations. As in most air sampling applications, information on
particle density is generally not available and assumptions about its value will introduce
uncertainties in the resulting mass concentrations estimates. A far more important
limitation of the aforementioned particle number-based monitors results from the sharply
decreasing number of ambient particles with increasing particle size. The ambient
particle size distribution, by number, is dominated by ultrafine particles (i.e., smaller than
0.1 µm). As well, when converting a number to volume distribution, a 1.0 µm particle
weighs as much as 103 times a 0.1 µm particle and 106 times a 0.01 µm particle.
Consequently, counting errors associated with this conversion, which may be substantial
for large particles, due to their relatively low numbers combined with electronic noise,
may lead to significant uncertainties in volume and consequently mass as a function of
particle size. This was demonstrated in a recent study by Sioutas et al 19, which showed
that the mass concentrations obtained with the Scanning Mobility Particle
Sizer/Aerodynamic Particle Sizer system (SMPS, Mode 3936, TSI Inc., St. Paul, MN;
APS, Model 3320, TSI Inc., St. Paul, MN) were higher by 70-200% than those
determined with a reference gravimetric method.
In this paper, we describe the development and laboratory and field evaluation of
a Continuous Coarse Particle Monitor (CCPM) that can provide reliable measurements of
7
the CM concentrations in time intervals as short as 5-10 minute. The operating principle
of the monitor is based on enriching the CM concentrations by a factor of about 25 while
maintaining FM at ambient concentrations. The aerosol mixture is subsequently drawn
through a standard TEOM, the response of which is dominated by the contributions of
the CM due to concentration enrichment. This paper also presents a comparison between
the CM and FM concentrations obtained different time-integrated samplers (i.e., filters
and impactors), which was conducted during the field evaluation study of the CCPM.
METHODS
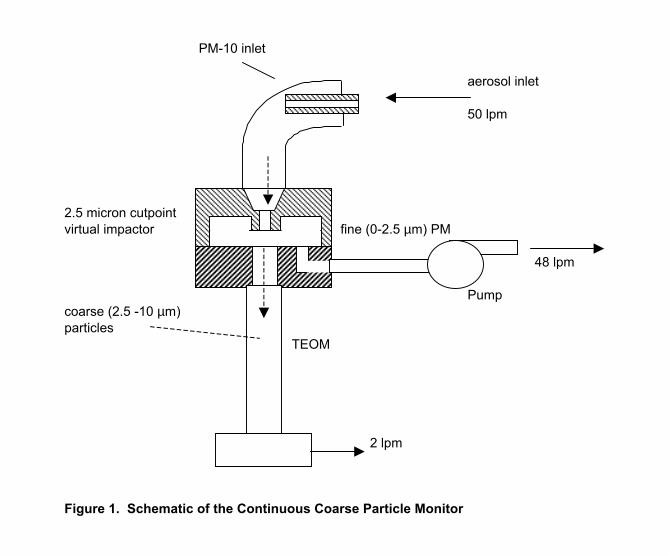
Description of the Continuous Coarse Particle Monitor
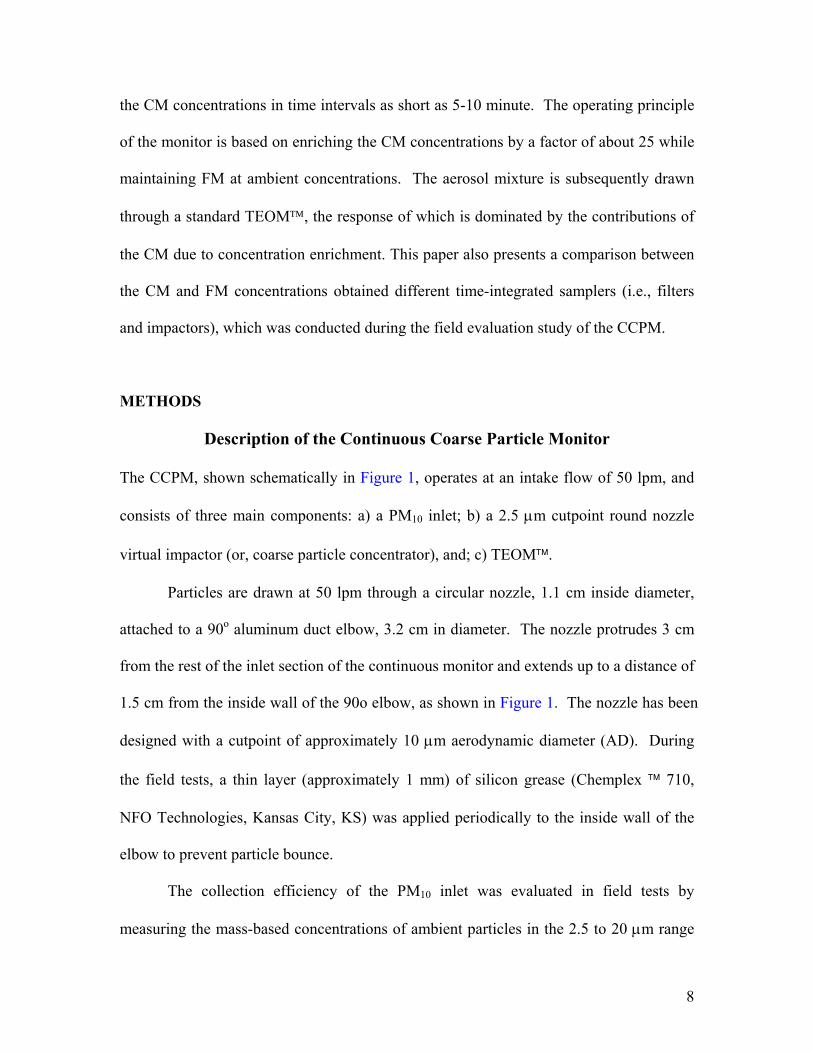
The CCPM, shown schematically in Figure 1, operates at an intake flow of 50 lpm, and
consists of three main components: a) a PM10 inlet; b) a 2.5 µm cutpoint round nozzle
virtual impactor (or, coarse particle concentrator), and; c) TEOM.
Particles are drawn at 50 lpm through a circular nozzle, 1.1 cm inside diameter,
attached to a 90o aluminum duct elbow, 3.2 cm in diameter. The nozzle protrudes 3 cm
from the rest of the inlet section of the continuous monitor and extends up to a distance of
1.5 cm from the inside wall of the 90o elbow, as shown in Figure 1. The nozzle has been
designed with a cutpoint of approximately 10 µm aerodynamic diameter (AD). During
the field tests, a thin layer (approximately 1 mm) of silicon grease (Chemplex 710,
NFO Technologies, Kansas City, KS) was applied periodically to the inside wall of the
elbow to prevent particle bounce.
The collection efficiency of the PM10 inlet was evaluated in field tests by
measuring the mass-based concentrations of ambient particles in the 2.5 to 20 µm range
8
by means of an APS. For these tests, the TEOM was disconnected from the virtual
impactor and the minor flow was drawn directly the APS. The sampling flow of the
APS is 5 lpm, thus higher than the minor flow of the CCPM (2 lpm). Since the
cutpoint of the PM10 inlet does not depend on the minor-to-total flow of the virtual
impactor but on the total aerosol flow entering the impactor-inlet, the major flow of the
virtual impactor was adjusted to 45 lpm in order to maintain the total flow entering the
PM10 inlet and virtual impactor at 50 lpm.
The concentration of particles in the 2.5 to 20 µm (enriched by a factor of
approximately 10) was obtained for a sampling period of 3 minutes. Subsequently, the
PM10 inlet was removed and the mass-based concentration of 2.5 to 20 µm particles was
obtained for a period of 3 minutes. The above test sequence was repeated five times.
Particle penetration through the PM10 inlet was determined for each size by dividing the
average concentration (based on five tests) obtained with the PM10 inlet connected to the
sampler to the concentration without the inlet. The wind speed (a crucial parameter in
for the performance evaluation of the inlet) was recorded during these experiments and
varied from 1 to 7 miles per hour (mph), which is a typical range for Los Angeles.
Particles smaller than 10 µm in AD are drawn through the virtual impactor, which
was designed to have a theoretical 50% cut point at about 2.5 µm for an intake flow rate
of 50 lpm. This is single-stage, round-jet nozzle virtual impactor with an acceleration
nozzle diameter of 0.37 cm and collection nozzle diameter of 0.56 cm. The distance
between the acceleration and collection nozzles is 0.7 cm.
The flow field in a virtual impactor is determined by the Reynolds number,
which, is defined as:
9
)1(ReµρWU
=
where U is the average jet velocity through the acceleration nozzle of the impactor, W is
the diameter of that nozzle, and µ and ρ are the dynamic viscosity and density of air,
respectively. The value of Re corresponding to the operating configuration of the virtual
impactor is 18,927. Coarse particles follow the minor (concentrated) flow, while
particles smaller than the cutpoint of the virtual impactor follow the major flow. The
minor flow in these experiments was set at 2 lpm to achieve a nominal enrichment factor
of 25. Concentrated CM, including a small fraction of FM (about 4%) are drawn through
the TEOM, whose flow was adjusted to 2 lpm. In its most common configuration, the
aerosol is heated to 50 °C before collection on the TEOM filter, which is attached to the
oscillating element. Our experiments were performed at sample temperatures of 50 oC
and 30 oC to determine whether differences in these temperatures would result in
significant differences in the response of the CCPM. While the standard configuration of
the TEOM is to operate it at 50 oC, due to loss of semi-volatile species at this
temperature, many TEOMs are being operated at 30 oC with a nafion dryer to remove
water vapor prior to the collection substrate. No nafion dryer was used in our
configuration. The remaining 48 lpm (major flow) through the virtual impactor is drawn
through a separate, lightweight, rotary vane pump (Gast, Model 1023, Gast Mfg. Corp.,
Benton Harbor, MI). The pressure drops across the major and minor flows of the virtual
impactor are 5.8 and 0.25 kPa, respectively.
10
Laboratory Evaluation of 2.5 µm Cutpoint Round Nozzle Virtual Impactor
The first series of experiments were conducted in the laboratory to investigate the
relationship between the concentration enrichment achieved by the 2.5 µm cutpoint round
nozzle virtual impactor as a function of particle size. Briefly, monodisperse aerosols in
the size range of 1 to 10 µm were generated by atomizing dilute aqueous suspensions of
fluorescent polystyrene latex particles (Polysciences Inc., Warrington, PA) with a
constant output nebulizer (HEART, VORTRAN Medical Technology, Inc.,
Sacramento, CA). The generated particles were mixed with dry room air in a 1-liter bottle
to remove the excess moisture . The dry aerosol was then drawn through a tube
containing ten Po-210 neutralizers that reduced particle charges prior to entering the
virtual impactor. For each of the monodisperse particles in the range of 1 to 5 µm, the
DataRAM was used to first measure the mass concentration of the generated aerosols
prior to entering the 90° elbow of virtual impactor. The DataRAM was subsequently
connected downstream of the minor flow of the virtual impactor to measure the mass
concentration of the aerosols after concentration enrichment. The measurements were
repeated at least three times, and the average concentration enrichment was determined as
a function of particle size. The contributions from background ambient concentrations
before and after the enrichment were recorded and subtracted from those of the input and
concentrated aerosols prior to determining the collection efficiencies at the given particle
size. It should be noted that indoor air levels were on the order of 7 – 15 µg.m-3, and
substantially smaller than those of the generated aerosols (prior to concentration
enrichment), which varied from 170 to about 500 µg.m-3. Therefore the contributions of
11
the indoor aerosol to the overall concentrations measured upstream of- and in the minor
flow of the virtual impactor were considered negligible.
Concentration enrichment for 5 to 10 µm particles was determined by comparing
the mass collected on a glass fiber filter (2 µm pore, Gelman Science, Ann Arbor, MI)
connected to the minor flow of the virtual impactor, and the mass of a similar glass fiber
filter in parallel to the test system to measure the concentration of the monodisperse
aerosol. The filter sampling in parallel was connected to a pump operating at 30 lpm. At
the end of each run, each glass fiber filter was placed in 5 ml of ethyl acetate to extract
the fluorescent dye from the collected particles. The quantities of the fluorescent dye in
the extraction solutions were measured by a Fluorescence Detector (FD-500, GTI,
Concord, MA) to determine particle concentration. Concentration enrichment for each
particle size was defined as the ratio of the concentration measured in the minor flow to
that of the aerosol immediately upstream of the virtual impactor inlet.
Field Study
Following the completion of the laboratory experiments, the performance of the CCPM
was evaluated in a field study which was part of the Los Angeles Supersite project at the
Rancho Los Amigos National Rehabilitation Center in Downey, CA. Situated near the
Los Angeles “Alameda corridor”, Downey has some of the highest inhalable PM10
concentrations in the US, very often exceeding the 24-hour National Ambient Air Quality
Standard for PM10 of 150 µg.m-3. The field experiments were performed during the
period of October to December 2000.
12
Concentrated CM were provided directly to the TEOM from the minor flow (2
lpm) of the 2.5 µm cutpoint round nozzle virtual impactor. Measurements of
concentration-enriched CM measured by the TEOM were compared to direct
measurements with a co-located Microorifice Uniform Deposit Impactor (MOUDI,
MSP Corp. Minneapolis, MN) and Dichotomous Partisol-Plus (Model 2025 Sequential
Air Sampler, Rupprecht and Patashnick Co. Inc., Albany, NY). The MOUDI sampled
at 30 lpm. Instead of using all available MOUDI stages , only those having cut-points
of 10 µm and 2.5 µm were used. Thus the first MOUDI stage (2.5-10 µm) was used as
a reference sampler for CM concentrations and the last stage (i.e., the after-filter) was
used to determine the ambient FM concentrations. Teflon filters with diameters of 4.7
and 3.7 cm (2 µm pore size, Gelman Science, Ann Arbor, MI) were used to collect CM
and FM in the two MOUDI stages, respectively.
The Partisol uses a PM10 inlet operating at 16.7 lpm to remove particles larger
than 10 µm in AD. The remaining PM10 aerosol is drawn through a virtual impactor, or,
“dichotomous splitter”, located after the inlet. Two separate flow controllers maintain the
CM at 1.67 lpm and the FM stream at 15 lpm. CM and FM are collected on two 4.7cm
Teflon filters, placed in the minor and major flows of the Partisol virtual impactor, which
are housed in reusable cassettes.
The Teflon filters of both MOUDI and Partisol samplers were pre- and post-
weighed using a Mettler Microbalance (MT5, Mettler-Toledo, Inc, Hightstown, NJ) after
24-hour equilibration under controlled humidity (35-40%) and temperature (22-24 oC).
The experiments were performed with simultaneous sampling from the TEOM
and the MOUDI and/or the Partisol. The sampling time varied from 90-minute to 210
13
minute depending on the ambient concentrations to allow sufficient mass to be collected
on the time-integrated samplers. The majority of the experiments were for sampling
periods of 120-minute. The volume concentration of ambient CM also was recorded in
15-minute intervals using an APS for a number of experiments. In addition, in selected
experiments, the time-weighed mass median diameter (MMD) of the ambient coarse
particles was determined by means of the APS. Temperature and RH data, for each
experiment were also measured continuously by the Partisol and recorded automatically
by the systems software. The mass concentration of the CCPM was determined both by
the 1- or 2-hour time integrated TEOM readings and by directly dividing the mass
deposited on the TEOM filter by the total air volume sampled. In all experiments, these
two concentrations differed by less than 5%. CM and FM concentrations of the
MOUDI were determined by dividing the total PM collected on the MOUDI
substrates by the total sampled air volume. The CM concentration of Partisol was
determined after dividing by the appropriate sample flow and subtracting 10% of FM
concentration from it, which corresponded to the ratio minor flow to the total flow of the
Partisoll virtual impactor.
RESULTS AND DISCUSSION
Evaluation of the PM10 Inlet
Particle penetration values through the PM10 are plotted as a function of AD in Figure 2.
The data plotted in this figure indicate that particle penetration is 90% or higher for
particles in the range of 2.5 to 8 µm. Penetration decreases sharply to about 50% at 10
µm and further to less than 10% for particles larger than 12 µm in AD. The sharpness of
14
the particle penetration curve of an impactor can be defined in terms of the geometric
standard deviation (σg), which is the square root of the ratio of the particle AD
corresponding to 16% penetration to that corresponding to 84 % penetration 20. Based on
this definition, the value of σg is approximately 1.2 (roughly the ratio of 11 µm / 8 µm)
for the PM10 inlet, thereby indicating reasonably sharp aerodynamic particle separation
characteristics.
Laboratory Evaluation of the 2.5 µm Cutpoint Round Nozzle Virtual Impactor
Figure 3 presents the concentration enrichment of the 2.5 µm cutpoint round nozzle
virtual impactor as a function of particle AD. The data in Figure 3 confirm the rise of the
enrichment factor as a function of particle AD. As seen from the figure, the enrichment
factor increases sharply up to its ideal value of 25, as predicted based upon the intake and
minor flow rates of 50 and 2 lpm, respectively. The plotted data correspond to the
averages of at least three experiments per particle size, whereas the error bars represent
the standard deviation in the enrichment values. The concentration enrichment factor
increases sharply from about 2 to 23 as particle AD increases from 2 to 3 µm. The
enrichment factor is practically the same for particles in the AD range of 3 to 9 µm. The
data shown in Figure 3 also indicate that the 50% cut point of the virtual impactor,
defined as the aerodynamic particle size at which the enrichment factor is half of its ideal
value (i.e. about 12.5) is approximately 2.4 µm. [The enrichment factor measured at 2.5
µm is about 15]. The overall high concentration efficiencies of 9 µm particles, proves that
there are no significant losses of these particles in the 90° elbow of the PM10 inlet. More
importantly, these tests imply that the size distribution of concentrated CM before
15
entering the TEOM is the same as that of the ambient air, since the concentration
enrichment factor does not depend on particle size—at least for particles larger than 2.5
µm in AD.
Field Evaluation of the Continuous Coarse Particle Monitor
The results of the field evaluation of the CCPM are shown in Figures 4 to 7 for
experiments performed at a TEOM temperature of 50 oC. Figure 4 shows the
comparison between the TEOM and MOUDI CM concentrations at 50 oC. As
indicated, the data are highly correlated (R2=0.88) with a slope of 25 and a near zero
intercept. The ratio of concentrations equal to 26.1 (± 3.6) also is close to the expected
value.. Figure 5 shows the comparison between the TEOM and Partisol CM
concentrations at 50 oC. Again, these datas are highly correlated (R2=0.88) with a slope
of 24 and a near zero intercept. The ratio of concentrations equal to 25.8 (± 4.1) also is
close to the expected value. It is worthwhile noting, that the TEOM concentrations are
not corrected for the contributions of the FM, which is present in the inlet stream. The
purpose of concentrating the CM by a factor of 25 is to eliminate the need for knowing a
priori the FM concentration. Ideally, the mass concentrations measured by the CCPM
are related to the actual ambient CM concentrations as follows:
CCPM = 25 CM + FM (2)
Thus a 1:1 FM-to-CM concentration ratio would result in the CCPM being 26 times
higher than the actual CM concentration.
16
17
An important implication of equation (2) is that unusually high (but not
impossible) FM-to-CM concentration ratios (i.e., 4 - 6) would lead to a positive bias (or
overestimation) of the CM concentration by the CCPM, if the concentrations are not
corrected to account for the contribution of FM. To investigate the effect of the FM-to-
CM concentration ratio on the response of the CCPM, the ratio of the concentration-
enriched TEOM-to-MOUDI and TEOM-to-Partisol concentrations were plotted
as a function of the FM-to-CM concentration ratio. The results, shown in Figure 6,
clearly indicate that the ratio of TEOM-to-MOUDI CM concentration and the ratio of
TEOM-to-Partisol CM concentration are, under the conditions of this experiment
independent of the ratio of ambient FM-to-CM concentrations. (R2= 0.0064). This
independence can be further explained by the data plotted in Figure 7, which shows the
decrease in the ambient MMD (determined by the APS) as the FM-to-CM concentration
ratio increases. There is a marked shift in MMD from 4.8 – 5 µm to 2.8 – 3 µm as the
ratio of FM-to-CM concentration increases from 1 to 5 respectively. The highest values
of FM-to-CM concentrations, ranging from about 3.5 to 4.6, were obtained on October 20
and 21, 2000. During these two days, stagnation conditions occurred in Downey, with
the average wind speed during the sampling periods being less than 1 miles per hour
(mph). 2-hour averaged FM concentrations measured by either the MOUDI or
Partisol™ during these two days ranged from 80 to 146 g.m-3. These conditions are
expected to result in high FM concentrations in locations such as Downey, which is
primarily impacted by vehicular emissions from nearby freeways, while the relatively
low CM concentrations may be explained by the lack of sufficient wind velocity to either
generate or transport coarse particles. As the virtual impactor-particle concentrator
preceding the TEOM has a 50% cutpoint at about 2.5 µm, particles in the 2.5 – 3 µm
AD range would be concentrated somewhat less efficiently than those larger than 3 µm.
For example, the laboratory evaluation of the 2.5 µm cutpoint virtual impactor (Figure 3)
indicated that 2.5 to 3 µm particles are concentrated by a factor ranging from 16 to 22,
compared to particles in the 3 – 10 µm range that are concentrated by a factor of 25. This
slightly uneven concentration enrichment, combined with the intrinsic relationship
between the coarse particle MMD and the FM-to-CM concentrations ratio, brings the
CCPM-to-CM concentration ratio closer to the range of 25-26, and thus, compensates for
the increase in the FM-to-CM concentration ratio. As a result, the CCPM can be used
efficiently for measuring the ambient CM concentrations even in cases where the ratio of
FM-to-CM concentration is unusually high.
The results of the field experiments conducted at a TEOM temperature at 30 oC
are presented in Figures 8 to 11. Similar to the 50 oC configuration, highly correlated data
(R2=0.85) are obtained for the comparison of the TEOM and Partisol CM
concentrations as shown in Figure 8. The ratio of concentrations is 27.4 (± 3.7), which is
slightly higher, but not statistically different (p=0.69) than that at 50 oC.
No comparisons between the CCPM and the MOUDI concentrations were
conducted for the 30 oC TEOM configuration, although MOUDI data were collected
concurrently to the continuous monitor and the Partisol. This is because the ambient
RH was unusually low (even by the standards of the generally arid climate of the Los
Angeles Basin), often below 20 to 30 %. As a result, while the comparison between
TEOM and Partisol CM concentrations is robust, the CM concentrations measured by
the MOUDI were low, resulting in unrealistically high ratios between the TEOM and
18
MOUDI CM concentrations. This is confirmed by plotting the CM concentration ratio
of Partisol-to-MOUDI vs RH, as shown in Figure 9. From the data plotted in Figure
9 there is a well-defined inverse relationship between this ratio and the RH. This ratio
achieves an ideal value of 1 as the RH reaches 45-50 %. For lower RH, this ratio
increases sharply and becomes as high as 5 when the RH reaches the 10 to 15% range. To
confirm that this phenomenon is related to particle bounce, which would be more
pronounced at lower RH, the ratio of FM concentration of Partisol-to-MOUDI vs RH
was plotted, as shown in Figure 10. The reverse trend is observed, with the ratio of the
FM concentration of the Partisol-to-MOUDI increasing from 0.2 to about 1, as the
RH increases from 10 to 50 %. Further, the total PM10 Partisol-to-MOUDI ratio was
0.99 (± 0.13) based on 30 field experiments, thereby suggesting that since both samplers
agreed well for PM10, the only difference is in the FM and CM concentrations
measurements, that is, CM concentration is low and FM concentration is high at low RH,
suggesting particle bounce. These field observations illustrate one of the main drawbacks
of impactors, and raises serious implications on the appropriateness of using impactors
with uncoated substrates to obtain the size distributions of aerosols under low (< 30%)
RH conditions.
Experiments at a TEOM temperature setting of 30 oC also showed
independence of the ratio of the TEOM-to-Partisol CM concentrations to the ambient
FM-to-CM concentration ratio (Figure 11). Data plotted in Figures 6 and 11 indicate that
the mass concentration ratio of the concentration-enriched TEOM to either the
MOUDI or Partisol is independent of the FM-to-CM concentration ratio over a range
of values extending from about 0.2 to 5, thereby covering a broad spectrum of ambient
19
sampling conditions, and thus, strengthening the applicability of the CCPM to other
locations and times of the year.
During these experiments, ambient PM data for a few selected runs were recorded
using an APS. Figure 12 shows the time series in CM concentrations measured by the
TEOM and the APS during one day of the field experiments. A particle density of 1.6
g/m3 was assumed in the APS data. The TEOM CM concentrations were converted
to ambient CM concentrations by dividing by 26. Direct comparison between the actual
concentrations measured by the two monitors cannot be made, since knowledge of the
real (as opposed to an assumed) density of ambient coarse particles is required in order to
convert the APS concentrations to actual mass concentrations. However, the data
plotted in Figure 12 clearly show that very good overall agreement is observed in the
time series of the CM concentrations obtained by means of the two samplers.
SUMMARY AND CONCLUSIONS
This paper describes the development and laboratory and field evaluation of a CCPM that
is based on enriching the CM concentrations by a factor of 25, while maintaining FM
concentration at ambient concentrations. The aerosol mixture is subsequently drawn
through a standard TEOM, the response of which is dominated by the contributions of
the CM due to enrichment of the coarse particles. The laboratory evaluation of the 2.5
µm cutpoint round nozzle virtual impactor confirms the rise in the enrichment factor as a
function of particle AD. The concentration enrichment factor increases sharply from
about 2 to about 25 as particle AD increases from 2 to 3 µm. The enrichment is the same,
with in the error of the measurement, for particles in the AD range of 3 to 9 µm.
20
Findings from the field study ascertain that the TEOM coupled with a 2.5 µm
virtual impactor can be used successfully for continuous CM concentration
measurements. The results indicate excellent correlation between the concentration-
enriched TEOM and time integrated samplers (MOUDI and Partisol), with the
average TEOM CM concentration being approximately 26-27 times higher than those
measured by the time-integrated samplers. No substantial differences in the response of
the concentration-enriched TEOM are observed between TEOM operating
temperatures of 30 and 50 °C. Results from the field experiments also show that the CM
concentrations measured by the concentration-enriched TEOM are independent of the
ambient FM-to-CM concentration ratio. This is due to the decrease in ambient coarse
particle MMD with increasing FM-to-CM concentration ratio, as might be expected,
since FM concentrations tend to increase and coarse particle loadings tend to decrease
during stagnation conditions. This also strengthens the applicability of the CCPM in
cases where the FM-to-CM concentration ratio is very high. Finally, our results illustrate
one of the main problems associated with the use of impactors to sample particles under
conditions of RH values lower than 40%. While PM10 concentrations obtained by means
of the MOUDI and Partisol are in excellent agreement, CM concentrations measured
by the MOUDI are as low as 20% compared to those measured by the Partisol, while
MOUDI FM concentrations were high by as much as a factor of 5, together suggesting
particle bounce at low RH.
21
ACKNOWLEDGEMENTS
This work was supported by the Southern California Particle Center and Supersite
(SCPCS), funded by the U.S. EPA under the STAR program through Grants # 53-4507-
0482 and 53-4507-7721 to USC. The U.S. Environmental Protection Agency through its
Office of Research and Development collaborated in this research and preparation of this
manuscript. The manuscript has been subjected to Agency review and approved for
publication. Mention of trade names or commercial products does not constitute an
endorsement or recommendation for use. Finally, a provisional patent application has
been filed to the United States Patent Office by the USC Office of Technology and
Licensing (USC File No. 3102).
DISCLAIMER
The U.S. Environmental Protection Agency through its Office of Research And Development collaborated in the research described here. It has been subjected to Agency review and approved for publication. Mention of trade names or commercial products does not constitute an endorsement or recommendation for use
REFERENCES
1. Ostro, B.D. “The association of air pollution and mortality: examining the case for
interference of organonitrates in the Los Angeles aerosol,” Atmos. Environ.. 1993,
25A, 2855-2861
2. Ostro, B.D.; Hurley, S.; Lipsett, M.J. “Air pollution and daily mortality in the
Coachella Valley, California; a study of PM10 dominated by coarse particles,”
Environ. Res. 1999, 81, 231-238
22
3. Mar T.; Norris G.; Koenig J.; Larson T. “Associations between air pollution and
mortality in Phoenix,” Environ.. Health Perspect.. 1999, 108, 347 -353.
4. Monn, C.; Becker, S. “Fine and coarse particles: Induction of cytokines in human
monocytes,” J. Aerosol. Sci. 1998, 29, 305-306.
5. Becker, S.; Soukup, J.M.; Gilmour, M.I.; Devlin, R.B. “Stimulation of human and
rat alveolar macrophages by urban air particulates: effects on oxidant radical
generation and cytokine production,” Toxicol. Appl. Pharmacol. 1996, 141, 637-
648.
6. Hornberg C.; Maciuleviciute L.; Seemayer N.H.; Kainka E. “Induction of sister
chromatid exchanges (SCE) in human tracheal epithelial cells by the fractions
PM10 and PM2.5 of airborne particulates,” Toxicology Letters. 1998, 96,97, 215-
220.
7. Lipfert, F.; Wyzga, R. “Uncertainties in identifying ‘responsible’ pollutants in
observational epidemiology studies,” J. Air & Waste Manage. Assoc.1995, 47,
517-523
8. Wilson, W., and Suh, H.H. "Fine particles and coarse particles: Concentration
relationships relevant to epidemiological studies," J. Air & Waste Manage. Assoc.
1997, 47, 1238-1249
9. White, W.H. “Statistical considerations in the interpretation of size-resolved
particulate mass data,” J. Air & Waste Manage. Assoc. 1998, 48, 454-458
10. Fed. Regist., July 18, 1997; 62 (138) 40 CFR, Part 50,
23
11. Dockery, D.W.; Speizer, F.E.; Stram, D.O.; Ware, J.H.; Spengler, J.D.; Ferris, B.J.
“Effects of inhalable particles on respiratory health of children,” Am. Rev. Respir.
Dis. 1989, 139, 587-594.
12. Pope, C.A., III; Bates, D.V.; Raizenne, M.E. “Health effects of particulate air
pollution: time for reassessment,” Environ. Health Perspect. 1995, 103, 472-480.
13. Babich, P.; Wang, P.Y.; Allen, G.A.; Sioutas, C.; Koutrakis, P. “Development
and evaluation of a continuous PM2.5 ambient mass monitor,” Aerosol Sci.
Technol. 1999, 32, 309-325
14. McMurry, P.H.; Zhang X.; Lee, Q.T. “Issues in aerosol measurement for optical
assessments,” Journal of Geophysical Research. 1996, 101 (19), 188-197
15. Sloane, C.S. “Optical properties of aerosols of mixed composition,” Atmos.
Environ. 1984, 18, 871-878
16. Sioutas, C.; Kim, S.; Chang, M.; Terrell, L.L.; Gong, H. “Field evaluation of a
modified DataRAM MIE scattering monitor for real-time PM2.5 mass
concentration measurements,” Atmos. Environ. 2000, 34, 4829-4838.
17. Allen, G.; Sioutas, C.; Koutrakis, P.; Reiss, R.; Lurmann, F.W.; Roberts, P.T.
“Evaluation of the TEOM method for the measurement of ambient particulate
mass in urban areas,” J. Air Waste Manage. Assoc. 1997, 47, 682-689
18. Wiener, R.; Bachmann, J.D. Coarse Particle Monitoring. Presented at the US
Environmental Protection Agency, Science Advisory Board, Clean Air Scientific
Advisory Committee, Technical Subcommittee on Fine Particle Monitoring
Meeting, April 18-19, 2000
24
19. Sioutas, C.; Abt., E.; Wolfson, J.M.; Koutrakis, P. “Effect of particle size on mass
concentration measurement by the Scanning Mobility Particle Sizer and the
Aerodynamic Particle Sizer,” J. Aerosol Sci. Technol.. 1999, 30:84-92.
20. Marple, V.A.; Willeke, K. In Fine Particles: Aerosol Generation, Measurement,
Sampling, and Analysis (Edited by B.Y.H. Liu); Academic press: New York,
1976
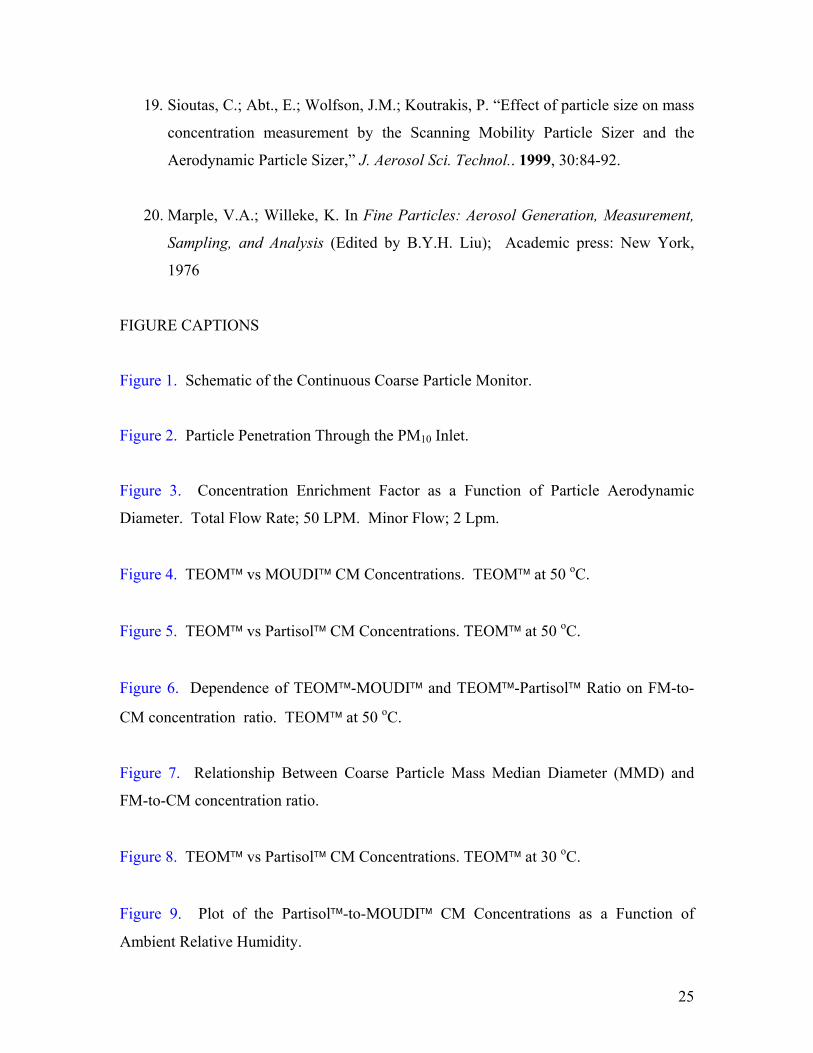
FIGURE CAPTIONS
Figure 1. Schematic of the Continuous Coarse Particle Monitor.
Figure 2. Particle Penetration Through the PM10 Inlet.
Figure 3. Concentration Enrichment Factor as a Function of Particle Aerodynamic
Diameter. Total Flow Rate; 50 LPM. Minor Flow; 2 Lpm.
Figure 4. TEOM vs MOUDI CM Concentrations. TEOM at 50 oC.
Figure 5. TEOM vs Partisol CM Concentrations. TEOM at 50 oC.
Figure 6. Dependence of TEOM-MOUDI and TEOM-Partisol Ratio on FM-to-
CM concentration ratio. TEOM at 50 oC.
Figure 7. Relationship Between Coarse Particle Mass Median Diameter (MMD) and
FM-to-CM concentration ratio.
Figure 8. TEOM vs Partisol CM Concentrations. TEOM at 30 oC.
Figure 9. Plot of the Partisol-to-MOUDI CM Concentrations as a Function of
Ambient Relative Humidity.
25
26
Figure 10. Plot of the Ratio of Partisol-to-MOUDI FM Concentrations as a Function
of Relative Humidity
Figure 11. Dependence of TEOM-Partisol Ratio on FM-to-CM concentration ratio.
TEOM at 30 oC.
Figure 12. Time-series of TEOM and APS CM Concentrations.
PM-10 inlet
aerosol inlet
50 lpm
2.5 micron cutpointvirtual impactor fine (0-2.5 µm) PM
48 lpm
Pumpcoarse (2.5 -10 µm)particles
TEOM
2 lpm
Figure 1. Schematic of the Continuous Coarse Particle Monitor
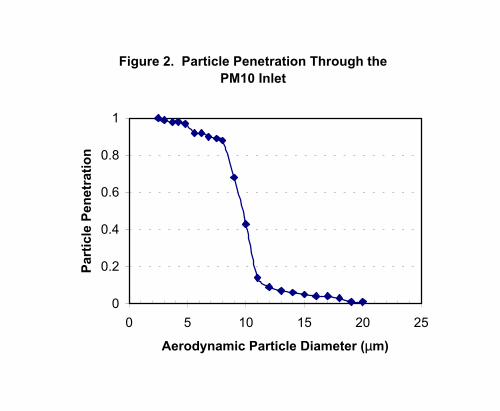
Figure 2. Particle Penetration Through the PM10 Inlet
0
0.2
0.4
0.6
0.8
1
0 5 10 15 20 25
Aerodynamic Particle Diameter (µm)
Part
icle
Pen
etra
tion
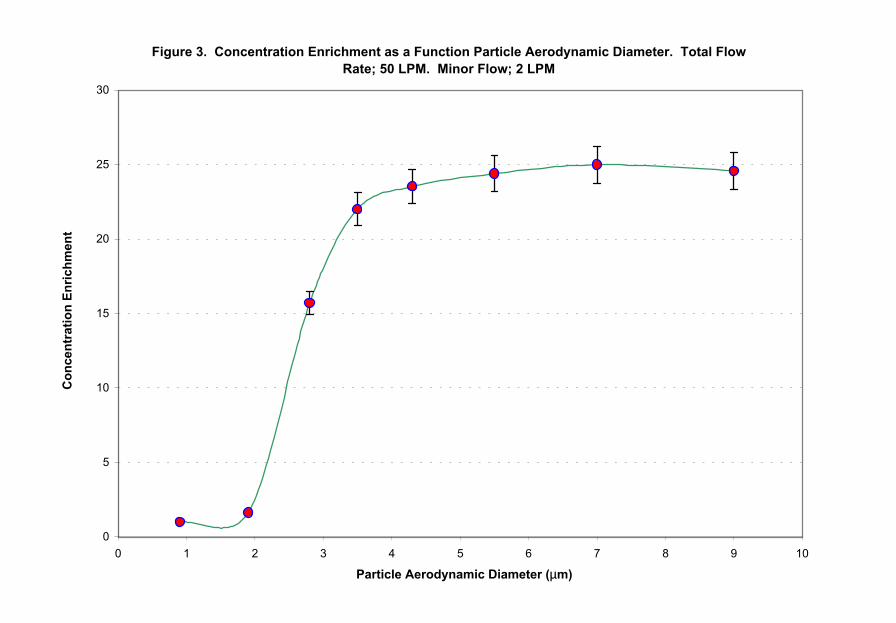
Figure 3. Concentration Enrichment as a Function Particle Aerodynamic Diameter. Total Flow Rate; 50 LPM. Minor Flow; 2 LPM
0
5
10
15
20
25
30
0 1 2 3 4 5 6 7 8 9 10
Particle Aerodynamic Diameter (µm)
Con
cent
ratio
n En
richm
ent
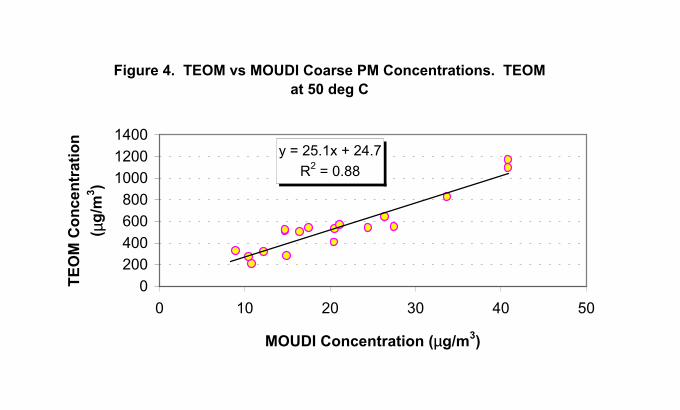
Figure 4. TEOM vs MOUDI Coarse PM Concentrations. TEOM at 50 deg C
y = 25.1x + 24.7R2 = 0.88
0200400600800
100012001400
0 10 20 30 40 50
MOUDI Concentration (µg/m3)
TEO
M C
once
ntra
tion
( µg/
m3 )
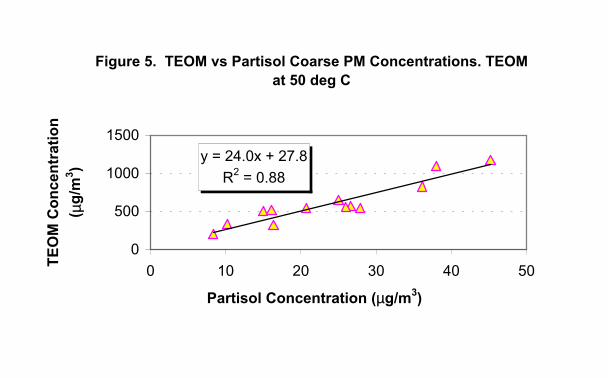
Figure 5. TEOM vs Partisol Coarse PM Concentrations. TEOM at 50 deg C
y = 24.0x + 27.8R2 = 0.88
0
500
1000
1500
0 10 20 30 40 50
Partisol Concentration (µg/m3)
TEO
M C
once
ntra
tion
( µg/
m3 )
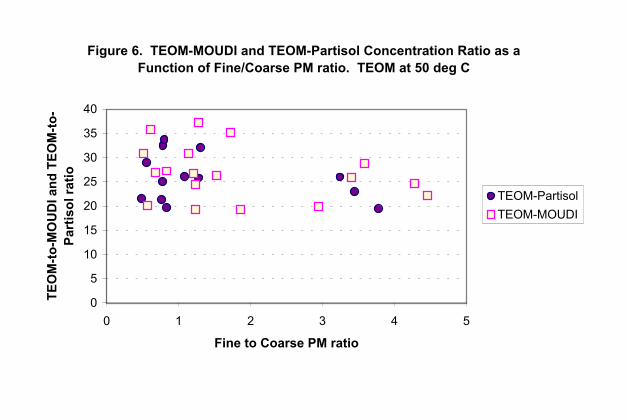
Figure 6. TEOM-MOUDI and TEOM-Partisol Concentration Ratio as a Function of Fine/Coarse PM ratio. TEOM at 50 deg C
0
5
10
15
20
25
30
35
40
0 1 2 3 4 5
Fine to Coarse PM ratio
TEO
M-to
-MO
UD
I and
TEO
M-to
-Pa
rtis
ol ra
tio
TEOM-PartisolTEOM-MOUDI
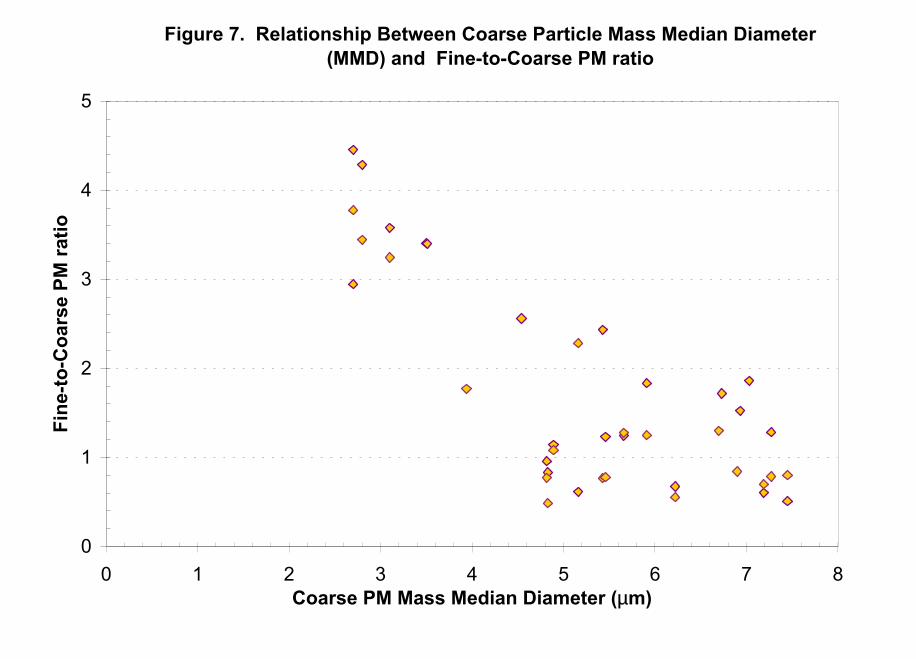
Figure 7. Relationship Between Coarse Particle Mass Median Diameter (MMD) and Fine-to-Coarse PM ratio
0
1
2
3
4
5
0 1 2 3 4 5 6 7 8Coarse PM Mass Median Diameter (µm)
Fine
-to-C
oars
e PM
ratio
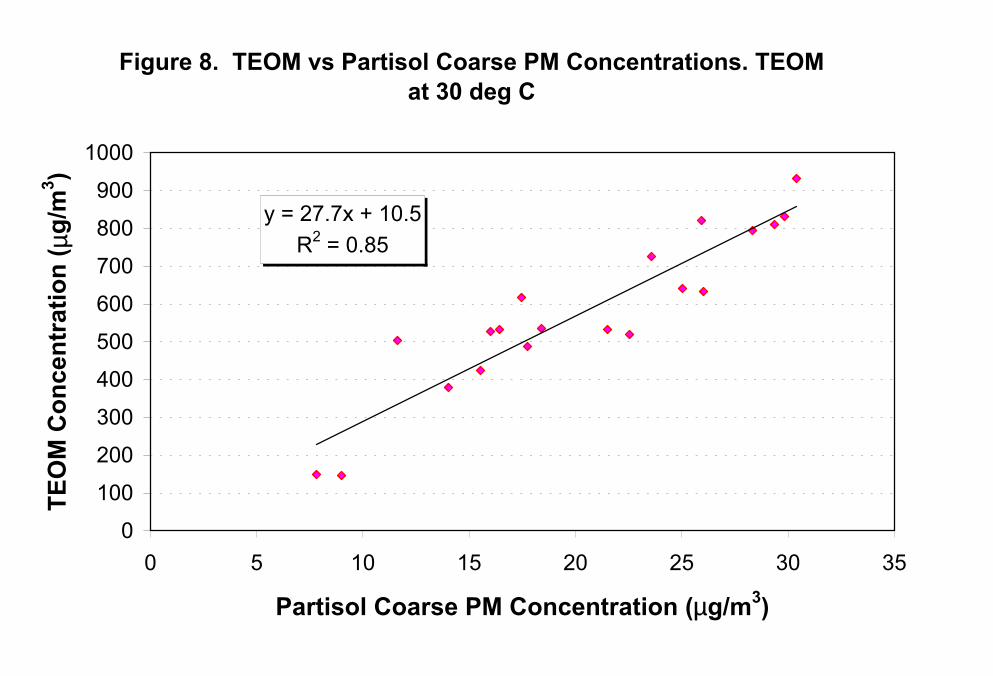
Figure 8. TEOM vs Partisol Coarse PM Concentrations. TEOM at 30 deg C
y = 27.7x + 10.5R2 = 0.85
0
100
200
300
400
500
600
700
800
900
1000
0 5 10 15 20 25 30 35
Partisol Coarse PM Concentration (µg/m3)
TEO
M C
once
ntra
tion
( µg/
m3 )
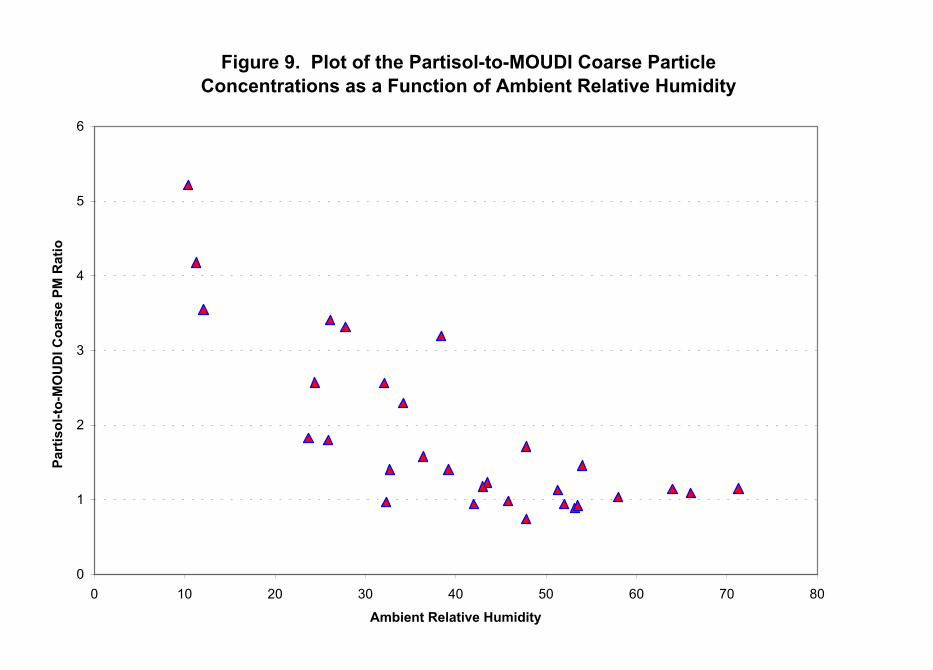
Figure 9. Plot of the Partisol-to-MOUDI Coarse Particle Concentrations as a Function of Ambient Relative Humidity
0
1
2
3
4
5
6
0 10 20 30 40 50 60 70 80
Ambient Relative Humidity
Part
isol
-to-M
OU
DI C
oars
e PM
Rat
io
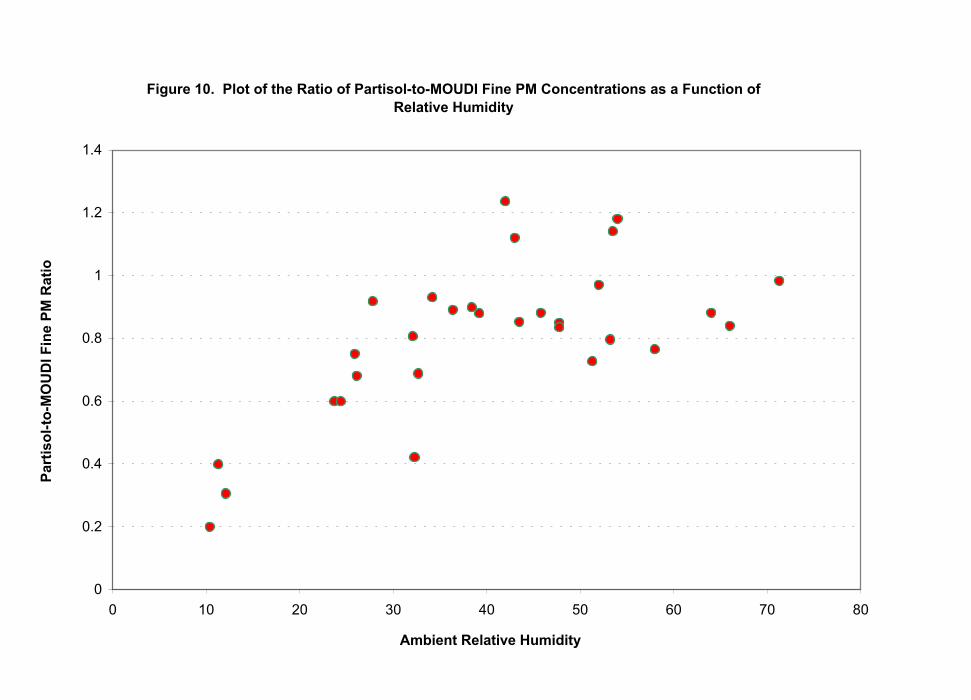
Figure 10. Plot of the Ratio of Partisol-to-MOUDI Fine PM Concentrations as a Function of Relative Humidity
0
0.2
0.4
0.6
0.8
1
1.2
1.4
0 10 20 30 40 50 60 70 80
Ambient Relative Humidity
Part
isol
-to-M
OU
DI F
ine
PM R
atio
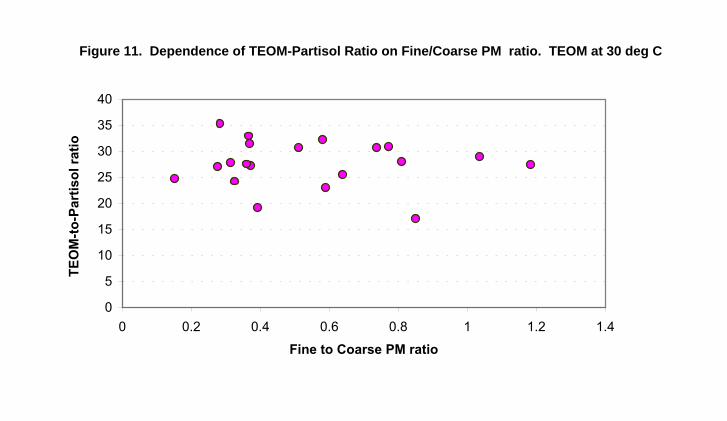
Figure 11. Dependence of TEOM-Partisol Ratio on Fine/Coarse PM ratio. TEOM at 30 deg C
0
5
10
15
20
25
30
35
40
0 0.2 0.4 0.6 0.8 1 1.2 1.4
Fine to Coarse PM ratio
TEO
M-to
-Par
tisol
ratio
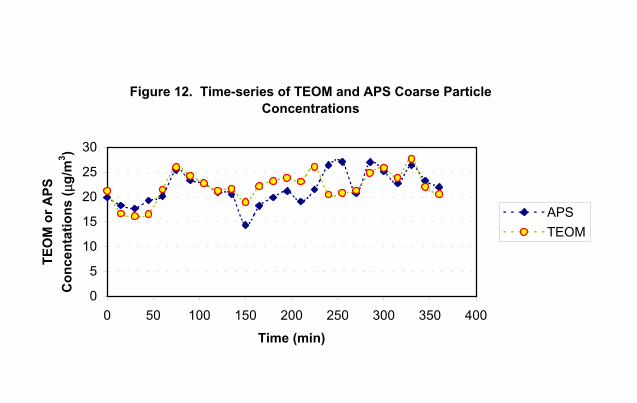
Figure 12. Time-series of TEOM and APS Coarse Particle Concentrations
0
5
10
15
20
25
30
0 50 100 150 200 250 300 350 400
Time (min)
TEO
M o
r APS
C
once
ntat
ions
( µg/
m3 )
APSTEOM
Related Documents