Development and characterization of immunogenic genetically engineered mouse models of pancreatic cancer By Laurens J. Lambert MSc, Medical Biology Radboud University, 2014 Submitted to the Department of Biology in Partial Fulfillment of the Requirements for the Degree of Doctor of Philosophy at the MASSACHUSETTS INSTITUTE OF TECHNOLOGY September 2020 © 2020 Massachusetts Institute of Technology. All rights reserved. Signature of Author………………………………………………………………………………. Laurens J. Lambert Department of Biology June 16, 2020 Certified by………..………………………………………………………………………………. Tyler Jacks David H. Koch Professor of Biology Investigator, Howard Hughes Medical Institute Thesis Supervisor Accepted by………………………………………………………………………………………. Stephen Bell Uncas and Helen Whitaker Professor of Biology Investigator, Howard Hughes Medical Institute Co-Director, Biology Graduate Committee

Welcome message from author
This document is posted to help you gain knowledge. Please leave a comment to let me know what you think about it! Share it to your friends and learn new things together.
Transcript

Development and characterization of immunogenic genetically engineered mouse models of pancreatic
cancer
By
Laurens J. Lambert
MSc, Medical Biology Radboud University, 2014
Submitted to the Department of Biology
in Partial Fulfillment of the Requirements for the Degree of
Doctor of Philosophy at the
MASSACHUSETTS INSTITUTE OF TECHNOLOGY
September 2020
© 2020 Massachusetts Institute of Technology. All rights reserved.
Signature of Author……………………………………………………………………………….
Laurens J. Lambert Department of Biology
June 16, 2020 Certified by………..……………………………………………………………………………….
Tyler Jacks David H. Koch Professor of Biology
Investigator, Howard Hughes Medical Institute Thesis Supervisor
Accepted by……………………………………………………………………………………….
Stephen Bell Uncas and Helen Whitaker Professor of Biology
Investigator, Howard Hughes Medical Institute Co-Director, Biology Graduate Committee

2

3
Development and characterization of immunogenic genetically engineered mouse models of pancreatic
cancer
By
Laurens J. Lambert
Submitted to the Department of Biology on June 16, 2020 in Partial Fulfillment of the Requirements for the Degree of Doctor of Philosophy in Biology
Abstract
Insights into mechanisms of immune escape have fueled the clinical success of immunotherapy in many cancers. However, pancreatic cancer has remained largely refractory to checkpoint immunotherapy. To uncover mechanisms of immune escape, we have characterized two preclinical models of immunogenic pancreatic ductal adenocarcinoma (PDAC). In order to dissect the endogenous antigen-specific T cell response in PDAC, lentivirus encoding the Cre recombinase and a tumor specific antigen (SIINFEKL, OVA257-264) was delivered to KrasLSL-G12D/+; Trp53flox/flox (KP) mice. We demonstrate that KP tumors show distinct antigenic outcomes: a subset of PDAC tumors undergoes clearance or editing by a robust antigen-specific CD8+ T cell response, while a fraction undergo immune escape.
Subsequently, we have developed an immunogenic pancreatic tumor organoid orthotopic transplant model. In this model, immunogenic pancreatic tumors manifest divergent tumor phenotypes; 40% of tumor organoids do not form tumors (“non-progressors”), whereas 50% of organoids form aggressive tumors despite maintaining antigen expression and a demonstrable T cell response (“progressors”). Additionally, a subset (10%) of tumors show an intermediate phenotype, possibly reflective of an immune equilibrium state. We have further phenotypically and transcriptionally characterized the CD8+ T cell response to understand immune escape in this model. Our analyses reveal unexpected T cell heterogeneity, and acquisition of T cell dysfunctionality. Therapeutic combinatorial targeting of co-inhibitory receptors identified on dysfunctional antigen-specific CD8+ T cells led to dramatic regression of aggressive pancreatic tumors. Finally, we demonstrate that human CD8+ T cells isolated from pancreatic tumors co-express co-inhibitory receptors, suggesting that T cell dysfunction may be operational in human disease.
This is the first demonstration of immunoediting in an autochthonous and organoid-based model of pancreatic cancer. Further characterization of these preclinical model systems will enable rational design of novel clinical immunotherapeutic strategies for treatment of this devastating disease. Thesis Advisor: Tyler Jacks Title: Professor of Biology

4
Curriculum vitae Laurens J. Lambert
Education 2014 - MASSACHUSETTS INSTITUTE OF TECHNOLOGY (CAMBRIDGE, MA, Present USA)
PhD, Department of Biology, The Jacks Lab 2009 - 2014 RADBOUD UNIVERSITY (NIJMEGEN, NETHERLANDS)
Bachelor of Science in Biology Master of Science in Medical Biology, Cum Laude
Professional Experience May 2015- The David Koch Institute for Integrative Cancer Research, MIT (Tyler Present Jacks Laboratory) PhD Student
§ Developed novel pancreatic cancer mouse models and characterized the T cell response in these models.
§ Discovered a therapeutic checkpoint combination with clinical § translatability. § Co-led a pancreas research team in the Jacks lab and coordinated
with internal and external collaborators (Koch Institute, DFCI). § Authored a chapter in a major textbook and submitted a manuscript
to Nature (under review).
Jan. 2020- MPM Capital (Cambridge, MA) Present Consultant
§ Supported key company-formation activities through the technical evaluation of scientific fields and identification of high priority development candidates.
§ Presented progress in weekly strategy meetings with the founding team at MPM Capital.
April 2019- Vida Ventures (Boston, MA) Dec. 2019 Fellow
§ Evaluated the scientific evidence, clinical paradigms, and commercial landscape to support 15+ investment decisions for the team at the Boston office.
§ Performed technical diligence on a Vida investment (Kinnate Biopharma, Series B closed Dec. 2019).

5
Fall 2018 Merrimack Pharmaceuticals (Cambridge, MA) Graduate Intern
§ Participated in the selective “Research Experience in Biopharma” course and interned at Merrimack Pharmaceuticals for the semester.
§ Assisted in target validation of the TNFRII preclinical immuno-oncology program (MM-401).
Scientific Publications Freed-Pastor W*, Lambert LJ*, Mercer K, Pattada N, Garcia A, Ely Z, Hwang W, Lin L, Eng G, Westcott P, Yilmaz O, Jacks T (2020). Immunogenic models of pancreatic adenocarcinoma reveal the therapeutic benefit of novel checkpoint combinations. Manuscript under review (Nature). *Co-authors Lambert LJ, Muzumdar MD, Rideout III WM, Jacks T (2017). Chapter 15: Harnessing the Mouse for Biomedical Research, in Basic Science Methods for Clinical Researchers, ed. Jalali M, Saldanha FYL and Jalali M, Academic Press Wefers C, Lambert LJ, Torensma R, Hato SV (2015). Cellular immunotherapy in ovarian cancer: Targeting the stem of recurrence. Gynecologic Oncology 137(2) Lambert LJ, Walker S, Feltham J, Lee HJ, Reik W, Houseley J (2013). Etoposide Induces Nuclear Re-Localisation of AID. PLoS ONE 8(12) Teaching & Leadership Experience Sep. 2018- Co-Director, Industry Initiative team Present MIT Biotech Group (MBG) Fall 2017 Teaching Assistant, Hallmarks of Cancer (7.45/7.85), MIT Fall 2015 Teaching Assistant, Introductory Biology (7.016), MIT Awards & Grants • Koch Institute Graduate Fellowship (2018) • Praecis Pharmaceuticals MIT Presidential Fellowship (2014) • Radboud University Excellence Grant (2012) • Erasmus Lifelong Learning Training Grant (2011)

6
Acknowledgments
I am extremely grateful for the past 6 years in the Jacks Lab. I have grown tremendously as a scientist, as a mentor, as an educator, and most of all as a person during my PhD. I firmly believe that the skills and life lessons instilled through my graduate training have prepared me well as I pursue the next chapter in my career. In the Jacks Lab, I have had the privilege to work alongside an amazing group of smart and passionate people. I have benefited so much from the experience and scientific knowledge shared, and the friendships formed along the way. Without the tireless dedication of many people in and outside the lab, support and advice from many colleagues, friends and loved ones, the work in this thesis would not have been possible. I have many people to thank… First and foremost, I would like to thank my thesis supervisor, Tyler, for letting me join the lab and for incredible mentorship during my graduate studies. From the early days in the lab, you have given me the freedom to pursue my interests in immunotherapy, trusted me to fail and succeed when I needed to, and through it all challenged me to think “two steps ahead”. I have also appreciated that you have always had my career at heart, and have allowed me to explore my interests in biotech while completing my PhD. Your leadership, thoughtfulness, rigor and generosity are truly inspiring to me, and are qualities I will strive for in the rest of my career. I would also like to thank my thesis committee members, Matt and Jackie. I have benefited tremendously from your scientific insights, guidance and mentorship during my time at MIT. It was always a pleasure to share the latest updates on my science with you during my committee meetings, and I will truly miss having these stimulating conversations moving forward. The classes I took as a TA in 7.45/7.85 Cancer Biology were one of the most memorable courses I took while at MIT-- thank you making them so fun and interactive, Matt. I would also like to thank Vijay Kuchroo for agreeing to be my external thesis defense member, and I look forward to discussing pancreatic tumor immunology with a true leader in the field. I would like to thank Will, for being an amazing collaborator and a great friend. Your incredible drive, intellect, and dedication has pushed our shared science to greater heights. Thank you for always being willing to do the crazy experiments, for challenging the status quo, and for your unrelenting excitement when making new discoveries. I will miss our comradery, wide-ranging discussions on anything pancreatic or immunology-related, and yes maybe even 4 am scRNA-seq harvests. Those were days... I would like to thank the Jacks Lab members who keep our lab running: Judy, Karen, Kate, Kim, and Margaret. Thank you for helping me with countless things during my time in the lab, and for your selfless efforts to make sure the lab is clean, continued to operate

7
smoothly and remained in stable financial waters. I really appreciate everything you have done. Thank you to Kim for your generosity, support, and friendship. Your dedication to the mouse colony and animal experiments over the last year(s) have made much of the work in this thesis possible. I particularly want to thank you for jumping in during the COVID-19 lockdown, which has allowed me to stay focused on completing my PhD. Thank you to two incredible technicians, Nimisha and Ana. I have really appreciated your patience, countless technical contributions, and commitment to this project. It has been rewarding to see you grow as scientists during your time in the lab, and I look forward to following your paths as you chart out on bright futures. Thank you to Zack for jumping into the deep with this pancreas project at full pace. I am incredibly grateful for your computational analyses that have pushed the science described here forward, and I am excited to see what you will achieve during your PhD. Thank you to all current and past graduate students in the lab, in particular Sheng Rong, Rodrigo, Amy, David, Leah, Ryan, Grissel and Amanda. After “ascending” to becoming the most senior graduate student in the lab, I have come to realize that much of the experience during a PhD in the Jacks Lab is universal. I have tremendously benefited from your advice, support, comradery and expertise at many points during the past 6 years. Thank you to all current and past postdoc students and staff in the lab, in particular Britt, Megan, Carla, Peter, Alex, Banu, Jason, Mandar, and Nik. Each one of you has helped me in a myriad of ways, be it through advice, sharing scientific insights and expertise, or even just perspectives on life—it has helped me grow as a person and allowed me to keep pushing the science forward. Thank you to all the current and past technicians in the lab, for your dedication and hard work. Your energy and excitement for science is a big part of what makes the culture in the Jacks lab so great. I especially want to thank Grace, Sophie, Demi, Michelle, Caterina, and Da-Yae—I appreciate your willingness to always help me out and your friendship. Thank you to the amazing MIT classmates I have been fortunate enough to call friends, in particular Santi, Nikola, Chris, Danny, Spencer, and Josh—for countless dinners, movies, parties, ski and hiking trips, being part of my wedding, and numerous other things! I know our friendship is bigger than a PhD, and that is incredibly special. To my sisters Willemijn and Nora, and my parents Hein and Jannie. Thank you for your unconditional love and support. You have always been there for when I needed it most and much of this work is inspired by the lessons you have taught me. I hope this thesis makes you proud.

8
Last, but most importantly, to the love of my life, Alexandra: Thank you for always believing in me, for always encouraging me to do and be my best. Thank you for your enduring patience and understanding as I spent many weekends and late nights in the lab. I could not have done this without your love and support all these years, and I am so excited to welcome our first addition to the family in August. Laurens Lambert June 2020

9
Table of Contents Abstract ........................................................................................................................... 3
Curriculum vitae ............................................................................................................. 4
Acknowledgments .......................................................................................................... 6
1. Introduction ........................................................................................................ 12
1.1. History of tumor immunology .................................................................................. 13
1.1.1. The early history of immunotherapy ..................................................................................... 13
1.1.2. Coley’s toxins and the beginning of tumor immunology ....................................................... 15
1.1.3. The dawn of tumor transplantation models .......................................................................... 18
1.1.4. Tumor antigens and the immunosurveillance hypothesis .................................................... 20
1.1.5. Cellular immunology comes of age ...................................................................................... 23
1.1.6. The beginning of a modern era in tumor immunology .......................................................... 25
1.2. The cancer immune response ................................................................................. 28
1.2.1 Tumor antigen release leads to the initiation of immune responses .................................... 29
1.2.2 Dendritic cells traffic to lymph node and interact with naïve T cells ..................................... 31
1.2.3 T cell priming triggers clonal expansion and effector cell differentiation .............................. 31
1.2.4 T cells use chemotactic cues to migrate to the tumor microenvironment ............................ 33
1.2.5 T cells infiltrate into the tumor microenvironment ................................................................. 34
1.2.6 Effector T cells recognize cancer cells through antigen presentation .................................. 35
1.3. Tumor-intrinsic mechanisms of immune escape ................................................... 37
1.3.1. Antigenicity is a critical determinant in immune escape ....................................................... 37
1.3.2. Immunoediting can mediate tumor immune escape ............................................................ 39
1.3.3. Oncogenic pathways drive T cell exclusion ......................................................................... 41
1.4. Tumor-extrinsic mechanisms of immune escape .................................................. 44
1.4.1. Endothelial cells ................................................................................................................... 44

10
1.4.2. Cancer-associated fibroblasts (CAFs).................................................................................. 45
1.4.3. Myeloid-derived suppressor cells (MDSCs) and tumor-associated macrophages (TAMs) .. 47
1.4.4. Tumor-associated macrophages (TAMs) ............................................................................. 48
1.4.5. T cell-intrinsic dysfunction .................................................................................................... 49
1.4.6. CD4+ T cells ......................................................................................................................... 56
1.4.7. Tumor microenvironments can exist in distinct inflammatory states .................................... 58
1.5. Pancreatic cancer ..................................................................................................... 59
1.5.1. The disease progression and the genetic basis of pancreatic adenocarcinoma .................. 61
1.5.2. The pancreatic tumor microenvironment .............................................................................. 64
1.5.3. Immunotherapy in pancreatic cancer ................................................................................... 70
1.6. Synopsis .................................................................................................................... 74
1.7. References ................................................................................................................. 77
2. TIGIT-based therapy induces potent anti-tumor responses in pancreatic
cancer .......................................................................................................................... 103
2.1 Abstract .................................................................................................................... 104
2.2 Main results ............................................................................................................. 105
2.2.1 Preclinical modeling of immunogenic pancreatic cancer ................................................... 105
2.2.2 Immune evasive pancreatic tumors retain antigen expression and presentation .............. 109
2.2.3 Multiple classes of antigen-specific CD8+ TILs within immune evasive pancreatic tumors 114
2.2.4 TIGIT-directed combination immunotherapy as a novel therapeutic approach in PDAC ... 119
2.3 Discussion ............................................................................................................... 122
2.4 Acknowledgements ................................................................................................ 123
2.5 Methods ................................................................................................................... 124
2.6 References ............................................................................................................... 144

11
3. Discussion ........................................................................................................ 161
3.1. Genetically engineered mouse models offer unique insights into tumor immunoediting
161
3.2. Outlook – the potential of autochthonous models and outstanding questions ............. 167
3.3. Organoid tumor immune escape may be mediated by tumor-extrinsic mechanisms of
immune evasion ................................................................................................................................ 169
3.4. Transcriptional profiling of the antigen-specific T cell compartment revealed
heterogenous effector states .......................................................................................................... 173
3.5. Outlook – The future of immunotherapy in pancreatic ductal adenocarcinoma through the
lens of genetically engineered mouse models .............................................................................. 175
3.6. References ............................................................................................................................ 177
Appendix I ................................................................................................................... 180
Abstract ............................................................................................................................... 181
Main text .............................................................................................................................. 181
Discussion ........................................................................................................................... 183
Methods ............................................................................................................................... 184
Acknowledgments .............................................................................................................. 188
References .......................................................................................................................... 189

12
1. Introduction
It is now widely appreciated that the immune system plays a critical role in
tumorigenesis, and is considered a “hallmark of cancer”1. Recent clinical successes with
therapeutic agents that modulate the immune system, rather than the tumor itself, have
truly revolutionized cancer treatment in recent years.
Given these clinical successes, it may come as a surprise that the tumor
immunology field is over a century old, and for most of its recent scientific history, has
been regarded with much skepticism. Prevailing dogma asserted that because cancers
arise from the body’s own tissues, the immune system is unable to detect these cells and
remains ignorant of the growing tumor. Beginning in the 1990s, this concept was slowly
overturned by revisions to concept of cancer immunosurveillance2, the identification of
human tumor antigens3, and the demonstration of immune checkpoint blockade efficacy
in tumor transplantation models4. These findings have sparked an enthusiasm for the
development of immunotherapeutic anti-cancer agents, which has led to regulatory
approval of the first generation of immune checkpoint inhibitors (ICIs). The durable clinical
remissions achieved with these therapies are arguably the most convincing evidence that
the immune system can be mobilized to elicit anti-tumor responses5.
While immunotherapies have made tremendous clinical impact on many different
types of cancer, pancreatic adenocarcinoma (PDAC) has remained largely treatment-
refractory. The overall five-year survival rate of metastatic PDAC, which constitutes the
majority of diagnosed pancreatic cancer cases, has not improved over the last decade.
Therefore, novel therapies to combat this devastating disease are urgently needed.
Genomic profiling has revealed that (a subset of) PDAC harbors high affinity

13
neoantigens6, suggesting that this cancer is not intrinsically resistant to anti-tumor T cell
responses. Therefore, a deeper understanding of the tumor-immune microenvironment is
necessary to dissect the mechanisms may limit the efficacy of immunotherapeutic
approaches.
This introductory chapter includes a historical overview of the field of tumor
immunology, and reviews our current understanding of the anti-tumor immune response.
Following this overview, the tumor-intrinsic and tumor-extrinsic mechanisms of
immunoevasion are described. This chapter concludes with a summary of our current
understanding of the genetic basis of pancreatic cancer, the role of the tumor
microenvironment in PDAC progression, and the ongoing clinical efforts focused on
harnessing immunotherapy for the treatment of pancreatic cancer.
1.1. History of tumor immunology
1.1.1. The early history of immunotherapy
The concept of utilizing the immune system to treat human disease, broadly
referred to as ‘immunotherapy’, dates back millennia. The Greek philosopher and
historian, Thucydides, first described a link between the survival of a disease, “the plague
of Athens”, and the acquisition of immunity in 430 BC7. However, it would take many
centuries for these observations to become actionable. During the 10th century, Chinese
doctors noticed that “ripe pus” from smallpox patients could be transferred to other
individuals on dried cotton tips, and that this sometimes conferred protection against the
disease8. A Chinese text from 1597 suggested the use of “powdered cow ice” for the
treatment of this deadly disease8.

14
The practice of these ‘variolation’ techniques (or inoculation) appears to have
arisen independently in China, India, and Africa before slowly spreading to Europe and
America. Lady Mary Wortley Montagu, wife of the British ambassador of the Ottoman
Empire has been widely credited for introducing this idea into Western civilizations.
Having witnessed the practice firsthand in Turkey, she had her son secretly variolated by
the Scottish physician Charles Maitland in 17168. When Maitland subsequently performed
a successful variolation on Montagu’s second child under the observation of prominent
Royal Society physicians, he was granted a medical license to perform a “clinical trial”.
For his variolation experiment in 1721, Maitland chose 6 condemned prisoners whom he
infected with smallpox pus. Much to his surprise, all individuals recovered from their
symptoms, and even had subsequent immunity when exposed to smallpox patients8.
That same year, the city of Boston (U.S.) was plagued with a smallpox epidemic;
nearly half of its 12,000 citizens developed the disease. Desperate to fight the spread of
smallpox, the physician Zabdiel Boylston, and Reverend Cotton Mather, variolated nearly
300 Bostonians, and compared the disease outcomes of these treated individuals against
the naturally infected patients9. In what is arguably one of the first examples of a rigorous
clinical statistical analysis, they were able to show that smallpox variolation dramatically
reduced subsequent disease mortality. However, the practice was vehemently opposed
by townsmen; at some point ‘anti-variolators’ went as far as bombing Mather’s house.
While certainly a progressive medical thinker in his time, Mather’s legacy is nowadays
mired in controversy due his written justifications of the Salem witch trials.
The success from this large-scale variolation campaign did not go unnoticed at the
time, and the practice became gradually commonplace across European nations and in

15
the U.S. throughout the 18th century. However, smallpox variolation was not without
complications, as these “vaccines” were frequently contaminated and could cause
syphilis. Moreover, (excessive) transfer of smallpox virus to nonimmunized individuals
would sometimes result in active infection, as opposed to the protective immune response
that the treatment was supposed to confer.
It would take until the turn of the 18th century before prophylactic vaccination
against smallpox became safer. Growing up in the county of Berkeley (England), the
physician Edward Jenner had heard stories about dairy milkmaids that were protected
against smallpox after suffering from the milder cowpox disease. He decided to
investigate these observations further, and in 1796 transferred cowpox from an infected
maid to an 8-year-old boy10. When he subsequently inoculated the boy with smallpox, no
disease developed. Buoyed by this finding, Jenner submitted a treatise to the Royal
Society, which was abruptly rejected. After adding a few more cases, Jenner published a
small booklet, in which he coined the practice of ‘vaccination’, derived from the cowpox-
causing Vaccinia virus10. This proved enough to convince a number of leading British
physicians, and as a result the procedure spread quickly throughout the country; it is
estimated that over 100,000 people were vaccinated by 18018. In 1840 the British
government officially banned the practice of variolation. However, it would take another
176 years before global incidence of smallpox was completely reduced to zero.
1.1.2. Coley’s toxins and the beginning of tumor immunology
The concept that human diseases could be prevented through prophylactic
vaccination undoubtedly laid the foundation for tumor immunology. Throughout the history
16
of medicine, individual cases of spontaneously regressing tumors have been reported,
often accompanied by seemingly unrelated infections11. During the late 19th century,
German physicians Wilhelm Busch and Friedrich Fehleisen independently noted a
connection between an opportunistic bacterial skin infection (erysipelas) and tumor
regression. Fehleisen identified the causative pathogen as the Gram-positive
Streptococcus pyogenes bacterium. These observations led both physicians to
experiment with the intentional induction of erysipelas in cancer patients, which reportedly
led to tumor shrinkage12. The practice, however, was not widely adopted by other
physicians at the time.
Frustrated by an inoperable case of head and neck sarcoma, a young American
surgeon, William Coley, took note of these cases in 1891 and decided to perform his own
experimentation in his cancer ward at the Memorial Hospital in New York. In a series of
treatments on 6 inoperable sarcoma and 4 carcinoma patients, Coley administered S.
pyogenes inoculations that he had received from Robert Koch’s laboratory in Germany.
The results were mixed: in 4 patients he was able to induce full erysipelas and observed
robust tumor regressions. However, the condition of 4 other patients only temporarily
improved, but they managed to achieve a fully developed infection. Worse yet, 2 patients
did develop erysipelas, and actually succumbed to a pathogenic attack instead13,14. This
led Coley to try combining heat-killed S. pyogenes with toxins from the Gram-negative
bacterium Serratia marcescens, thereby creating the first ever mixed bacterial vaccine
(MBV)13. Unbeknownst at the time, this combination of Gram-positive and Gram-negative
bacteria creates a potent immunostimulatory cocktail, and is now thought to induce the
release of multiple inflammatory cytokines, including interleukin-12 (IL-12)15.

17
Coley and colleagues at the Memorial Hospital in New York would go on to treat
nearly 1200 patients with these “Coley’s toxins” over the next 40 years; 270 patients
reportedly achieved long-term remissions with MBV, sometimes even lasting
decades13,16. Many of the best responding tumors included soft tissue sarcomas, although
responses in other tumor types were achieved as well16. These cases were carefully
documented by Helen Coley Nauts (William Coley’s daughter). In honor of her late father,
Nauts would establish the Cancer Research Institute (CRI) for advancement of tumor
immunology in 1953.
However, the widespread adoption of MBV outside of New York was hampered by
poor documentation of Coley’s practices and the limited potency of commercial
preparations13. Coley frequently changed how he produced MBV and would inject the
vaccines using various routes; many of these attempts were later shown to be
ineffective16. Furthermore, the scientific field of tumor immunology was still in its infancy
at the turn of the 20th century, and a mechanistic basis for the efficacy of Coley’s toxins
was lacking. As radiation therapy and chemotherapy, which promised similar remission
rates as MBV, became more popular for cancer treatment, Coley’s toxins fell out of favor.
Ironically, James Ewing, one of Coley’s staunchest opponents and his director at
Memorial Hospital, discovered a bone sarcoma (Ewing’s sarcoma) that could be
effectively treated Coley’s toxins17. While MBV is no longer used in the clinic today,
William Coley’s efforts undeniably set the practice of cancer immunotherapy in motion.
He is now recognized as one of the founding fathers of the field.

18
1.1.3. The dawn of tumor transplantation models
It was the German physician Paul Ehrlich who was the first to formulate the concept
that the human immune system is capable of recognizing and fighting off cancerous
cells18. In his work published in 1909, Ehrlich suggested that “aberrant cells arising during
fetal and post-fetal development” could remain latent due to the body’s “positive
mechanisms” 18. However, the scientific underpinnings of immunology at the time were
not advanced enough to experimentally validate his hypothesis, nor was a connection
made between Ehrlich’s theory and Coley’s toxins.
Instead, the nascent field of tumor immunology became fixated on understanding
immune responses through tumor transplantation studies. Experiments performed
around the turn of the 20th century by Loeb and Jensen showed that thyroid tumors
and spontaneous alveolar carcinomas could sometimes be transplanted within the
species they originated from, and that the growth of these transplants resulted directly
from the transferred cells19. These results argued against one of the influential theories
at that time, which stated that cancer was caused by an (unknown) etiologic agent and
was essentially a “transmissible disease”19. Loeb and a number of his contemporaries
then showed that tumor origin (“race”) was an important factor in determining the outcome
of tumor transplantation20. Over ten years later, Clarence Little and Ernest Tyzzer at
Harvard would revisit these studies by carefully examining the tumor transmissibility of
inbred strains. Their work led to the discovery of a genetic basis for tumor transplantation,
and importantly raised the question whether tumor transplant rejections were simply the
result of transferring between “genetically impure” mouse strains20–22.

19
This issue would continue to frustrate tumor immunologists throughout the 1920s
and 1930s22. In an expansive literature review, William Woglom gloomily concluded
that “it would be as difficult to reject the right ear and leave the left ear intact as it is to
immunize against cancer”23,24, a dogmatic belief that was shared by many geneticists
around the time.
It would take until 1936 before further progress on the genetic basis of tumor
transplantation was made. Through the ingenious use of human and rabbit antisera, Peter
Gorer discovered the presence of distinct blood groups in mice of different inbred
strains25. When Gorer transferred tumors originating from mice containing “blood group
II” were transferred to mice with “blood group I”, these recipients rapidly rejected the
tumor. This suggested to Gorer that the blood antigens were involved in mediating the
resistance to tumor rejection. George Snell, working at the Jackson Laboratory, had
similarly set out to pursue mapping of the genetic basis of tumor transplantation. As a
classically trained geneticist, Snell approached the problem by generating a series of
genetically identical mouse strains only differing in a single locus, so-called ‘congenic’
strains. Harnessing the antisera against “blood group II” on different congenic lines, Snell
and Gorer were able to map the genetic site of tumor transplantation to the
histocompatibility locus in 194825,26. In recognition of the “blood group II” serum that led
to its discovery, this locus became known as the histocompatibility locus II (H-2). As the
H-2 locus was shown to be the most critical determinant mediating tumor rejection, while
in in addition to being highly polymorphic in nature, it is referred to as the major
histocompatibility complex (MHC) in mice. In 1980, George Snell shared the Nobel Prize
20
with Baruj Benacerraf for the discovery of the H-2 locus; unfortunately, Peter Gorer had
passed away 19 years prior.
A final insight into tumor transplantation came from the work of the British scientist,
Peter Medawar, working in the separate field of transplantation immunology. Medawar
focused his efforts on elucidating the basis of allogeneic skin graft rejection (‘allografts’).
In seminal papers published in 1953 and 1956, Medawar and Bellingham described the
concept of ‘acquired tolerance’ by demonstrating that the immune system plays a
fundamental role in the rejection of allogeneic transplants27–29. Medawar’s work confirmed
the earlier hypothesis formulated by Macfarlane Burnet in 1948, that the immune system
(in Burnet’s theory “antibodies”) could acquire the ability to discriminate ‘self’ from ‘non-
self’ during development30. Both scientists would be awarded the Nobel Prize in 1960.
1.1.4. Tumor antigens and the immunosurveillance hypothesis
While the study of tumor transplantation models shaped much of the first 50 years
of tumor immunology, leading to the discovery of the MHC locus and immunological
tolerance, it did little to illuminate how the immune system could respond to tumors arising
in its own host. To study this question, immunologists increasingly turned to the chemical
carcinogen methylcholanthrene (MCA) to induce sporadic tumors in mice. In 1943 Polish
scientist Ludwig Gross was the first to demonstrate that an MCA-induced sarcoma line
from the inbred C3H strain was rejected by genetically identical C3H recipients31,
suggesting that the sarcoma contained antigens that could be recognized by the host’s
immune system. However, his work left open the possibility that the sarcomas had
acquired mutations during repeated transplantation. Edward Foley confirmed Gross’

21
observations in 1953 by demonstrating that methylcholanthrene-induced tumors were
antigenic upon direct transplantation in isogeneic animals32. Raymond Prehn and Joan
Main would further extend these results through the characterization of several
fibrosarcoma tumor lines that were rejected upon transplantation into isogenic strains33.
However, these studies were viewed with skepticism, as they could still be explained by
a lack of a genetically pure background between strains (‘residual heterozygosity’).
George Klein and colleagues would finally settle this debate by demonstrating that
autochthonous tumors (in addition to syngeneic tumors) could be rejected upon pre-
immunization of the hosts34.
Collectively, these studies raised the idea that the immune system is actively
involved in the elimination of cancerous cells arising in the body. This led Macfarlane
Burnet and Lewis Thomas to formulate their influential cancer immunosurveillance
hypotheses in the late 1950s, echoing Paul Ehrlich’s theory half a century earlier. Inspired
by the concept of immune tolerance, Burnet focused on his hypothesis on the
accumulation of “antigenic potentialities” (neoantigens) by cancer cells, which would be
sufficiently different from the own body to trigger immune responses that restrained
tumors from becoming clinically apparent35,36. Thomas’ early theory was more
evolutionary in nature, suggesting that multicellular organisms have developed
mechanisms to protect against transformed cells in order to maintain tissue homeostasis,
similar to the protection against foreign tissues (during allograft rejection)37,38.
Experimental validation for these hypotheses soon followed with demonstrations that
carcinogen-induced and oncoviral experimental models contained unique tumor

22
antigens39. However, evidence for the existence of human antigens was absent, and
whether these models accurately reflected human cancer remained unclear.
The field of tumor immunology would soon face a setback that would again cause
skepticism about the perceived ability of the immune system to ward off cancer cells. A
logical extension of the cancer immunosurveillance hypothesis was an absence of
immune function (‘immunodepression’) would result in higher incidence of tumor
formation. The development of athymic (Nu/Nu) mice in the late 1960s made it possible
to experimentally test this idea40,41, as these mice largely lacked mature T lymphocytes.
Working with these ‘nude’ mice at Memorial Sloan Kettering, Osias Stutman
demonstrated in the 1970s that MCA induction at birth did not lead to a statistically higher
number of sarcomas in Nu/Nu mice compared to their normal, heterozygous counterparts
(Nu/+)42,43. He concluded that his results did not support the immunosurveillance
hypothesis. Additionally, no evidence of increased susceptibility to spontaneous tumors
was found when 27 murine lines were systemically investigated by Harold Hewitt and
colleagues44. Indeed, even Foley, Prehn, and Main, in their landmark papers during the
1950s, had noted the differences between carcinogen-induced and spontaneous tumor
models32,33, raising doubts that the MCA-induced tumors were just an anomaly.
While these results certainly dampened the excitement around cancer
immunotherapies over the next decade, we now know that Stutman’s studies were flawed
by several technical factors unknown to him. While athymic mice have severely
compromised immune responses to infectious agents, some basal T cell functionality is
maintained45–47. Additionally, natural killer (NK) cells, developing normally in these mice,
can make significant contributions to anti-tumor immunity48–50. Finally, tumor induction

23
with MCA is highly efficient in the CBA/N strain (the only Nu/Nu model available to
Stutman), raising the possibility that early tumor induction simply overwhelmed an
immature immune system51. Indeed, later studies using mouse strains lacking T, B, and
NK cells (Rag2-/-; gc-/- mice), the interferon-g receptor (Ifngr1-/-) or the cytotoxicity-
mediating protein perforin (Prf1-/-) have shown elevated susceptibility to MCA-induced
tumorigenesis52–55. Thus, Stutman’s rejection of tumor immunity ultimately proved
premature; rather, genetic murine models as well as epidemiological observations of
elevated cancer incidence in immunocompromised humans have firmly cemented the
immune system’s role in cancer surveillance.
1.1.5. Cellular immunology comes of age
While tumor immunology remained focused on experimental models of cancer,
discoveries made in different immunological fields during the 1960s and 1970s would lay
the foundation for our modern understanding of the cellular components of the anti-tumor
response. Drawing upon Medawar’s concepts of transplant tolerance, James Gowans
and colleagues showed that thoracic duct lymphocytes (TDLs) were involved in the
initiation of alloreactive immune responses, although they could not distinguish cellular
from humoral responses56. Jacques Miller soon followed these results by demonstrating
that neonatal thymectomized mice were unable to reject their skin grafts, which suggested
that the thymus was the source of these reactive immune cells57,58. His results stood in
stark contrast to the widely held belief that the thymus was simply a vestigial organ where
lymphocyte would “go to die”. Additionally, Miller found that adult thymectomized mice
were unable to regenerate their lymphocytes upon total body irradiation or initiate immune

24
responses upon antigenic challenges with sheep erythrocytes, further solidifying the role
of the thymus in immunocompetence59–61. In a series of experiments using irradiated CBA
mice grafted with syngeneic thymi, TDLs, and allogeneic bone marrow, Mitchell and Miller
then unequivocally proved that thymus-derived lymphocytes (‘T cells’) were
immunologically distinct from bone marrow-derived lymphocytes (‘B cells’)62–65.
Subsequent use of different antisera helped to further distinguish these
lymphocytic cell types by their respective cell surface markers66,67, and led to the
subdivision of T cells into CD8+ (originally Ly-2, Ly-3) and CD4+ (Ly-4) cells68,69. The
development of monoclonal antibodies in 1975 by Kohler and Milstein70 would usher in a
new age where lymphocytes could be studied in increasingly greater detail, particularly
with the advent of flow cytometric methods71.
In an effort to dissect immune responses in vitro, Mishell and Dutton developed an
assay during the 1960s that mixed antigens with splenic lymphocytes, which led to the
realization that antibody formation required an additional cell type present in this
mixture72. Working with these cultures in 1973, Steinman and Cohn first described the
dendritic cell (DC) as the third cell type73,74. Steinman and colleagues would go on to
decipher much of the biology of DCs over the next decades75–78, and establish a critical
role for this antigen-presenting cell (APC) in the initiation of adaptive immune responses.
The structure of antibodies was uncovered in an influential set of studies during
the 1950s and 1960s79,80, setting the stage for the discovery of immunoglobulin (Ig)
rearrangement by Hozumi and Tonegawa81. By early 1980s it was well accepted that the
B cells used Ig molecules to recognize soluble antigen, however the nature of the T cell
receptor (TCR) and how T cells recognized antigens remained topics of debate82,83. The

25
latter was clarified by Zinkernagel and Doherty, who established that T cell recognition
was governed by the MHC molecule of the syngeneic host, a concept that became known
as ‘MHC restriction’84–86. Importantly, their results argued that a single TCR could
recognize both antigen and MHC—a model proven correct when the first MHC peptide
epitopes were uncovered87,88. The nature of the TCR was uncovered when Davis and
Mak isolated the first murine and human TCR chains89,90, before rapidly cloning of the
remaining TCR chains91–93. Collectively, these studies demonstrated that primary antigen
sensing receptors (the TCRa,b chains) were part of a larger transmembrane protein
complex that associated with g, d, and the two e, z polypeptide chains94,95.
Additional discoveries in cellular immunology made in the 1970s and 1980s
included with the discovery of interleukin-2 (IL-2)96, which allowed the sustained in vitro
culture of cytotoxic lymphocytes, and the generation of transgenic TCR mouse strains97.
Together, these advancements would form the basis for novel immunotherapeutic
strategies pioneered over the following decade, as the field of tumor immunology
regained its former momentum.
1.1.6. The beginning of a modern era in tumor immunology
While tumor immunologists still grappled with the implications of Stutman’s results
throughout the 1980s, Thierry Boon’s work offered a glimmer of hope for the field. In 1982,
Boon and van der Pel showed that vaccination with mutagenized leukemia clones could
induce the immune rejection of spontaneous tumors of the same origin98, which
suggested that these tumors, rather than lacking antigens, failed to stimulate strong
immune responses. These findings called the results obtained with experimental models
26
in the decades before into question, and raised the possibility that human tumors could
be antigenic as well. The Boon group would continue their focus on tumor antigens, which
culminated with the identification of the first human T cell antigen in 1991, encoded by the
MAGE-1 gene3. MAGE proteins are part of a diverse group of cancer-testis antigens
(CTAs), which are normally restricted to immunoprivileged reproductive organs, but
become aberrantly expressed in many tumor types99. In the immediate years following
the initial identification of MAGE-1, a wealth of other murine and human antigens were
characterized, including MAGE, BAGE, GAGE, RAGE (all CTAs), Tyrosine, gp100/pmel
17 (differentiation antigens), E7 (a viral antigen), HER2/Neu (an overexpression antigen),
CDK4, and b-catenin (neoantigens)100.
Further mechanistic insights into the relationship between the immune response
and cancer antigenicity were generated by Bob Schreiber and Lloyd Old. In a landmark
study published in 2001, Schreiber, Old and Shankaran carefully compared the re-
transplantation kinetics of MCA-induced sarcomas derived in the absence of an immune-
selective environment (Rag2-/- mice), or derived in an immunocompetent environment
(wild-type 129/SvEv mice)54. They were able to demonstrate that tumor immune escape
was intimately linked to the prior elimination of immunogenic cancer clones by T cells.
These experiments, together with data from genetic knockout mice that showed increased
susceptibility to cancer formation, and the experimental demonstration of an intermediate
state of “stasis” between the actions of immune cells and tumor emergence101, have led
to the definition of the ‘cancer immunoediting’ process. Cancer immunoediting is thought
to occur in three distinct phases: immune elimination, immune equilibrium, and finally
immune escape2,38.

27
The 1990s would also set the stage for much of the clinical excitement around
immune checkpoint inhibitors nearly two decades later. In a landmark study published in
1996, James Allison and Max Krummel demonstrated that the cytotoxic T-lymphocyte-
associated protein 4 (CTLA-4) was a negative regulator of T cell responses in murine
transplant models4. Just two years later, Tasuku Honjo and Hiroyuki Nishimura used a
genetic Pdcd-1 knockout mouse to elucidate the function of PD-1 in the maintenance of
peripheral tolerance102. The discovery of these two ‘immune checkpoints’ has had
enormous impact on the field. Research into the mechanisms of immune tumor detection,
tumor immune evasion and efficacy of novel immunotherapies is now truly flourishing.
Indeed, much of the biology described in the following sections of this introduction has
only been fairly recently elucidated; a testament to incredible pace of discovery in this
field.

28
1.2. The cancer immune response
The immune response to a growing tumor can be conceptualized as a multistep
iterative process, termed the “cancer-immunity cycle” by Chen and Mellman103. As will be
reviewed in detail below, this immunological sequence begins with the release of tumor
antigens, which trigger immune recognition and the mobilization of a T cell response. This
culminates in destruction of antigen-expressing cancer cells by effector T cells, which in
turn liberates additional antigens and thus amplifies the existing response (see Figure
1).
Figure 1: The various stages of the anti-tumor immune response visualized as a cycle. Source: Daniel S. Chen & Ira Mellman, Immunity (2013)

29
1.2.1 Tumor antigen release leads to the initiation of immune responses
The oncogenic transformation of normal cells is characterized by a number of
altered cellular processes, including uncontrolled proliferation, altered metabolism,
resistance to cell death and the acquisition of invasive motility1. Cancer cells often
experience genetic instability over the course of neoplastic growth, leading to the
acquisition of many single nucleotide variations (SNVs) and can even gain or lose whole
chromosomes104. While this instability may seem detrimental to individual cells, these
genomic alterations are thought to be beneficial to the bulk tumor by increasing clonal
heterogeneity, which enables rapid selection of the “fittest” clones. However, as a
consequence of mutagenic processes, cancer cells can also produce altered proteins that
contain neoepitopes with strong binding affinity to MHC molecules105. As these
‘neoantigens’ essentially represent foreign peptides when presented to the human
immune system, they are not subjected to immunological tolerance and can thus elicit a
strong T cell attack. Indeed, accumulating evidence over the past decade has implicated
neoantigens as a critical source for tumor-directed immune responses, both during
endogenous immune recognition106,107 as well as upon therapeutic modulation108–110.
Many neoantigens identified through the use of high-throughput screening and T cell
reactivity assays are contained in mutated proteins that are unlikely to fulfill oncogenic
roles. However, on rare occasion, driver mutations have been found to generate
neoepitopes capable of strongly binding HLA alleles (e.g. KRASG12D on HLA-C*08:02111
and TP53R175H on HLA-A*0201112). Targeting these driver neoantigens with
immunotherapy is attractive, as these mutations are often highly clonal and T cell
cytotoxicity can be precisely directed to cancer cells while sparing normal tissues.

30
Viral antigens constitute a different type of neoantigens and are foreign to the
immune system as well. For example, the E6/7 oncoproteins that drive cervical and
oropharyngeal carcinomas can mediate protective immunological responses in
therapeutic settings113,114.
Finally, aside from neoantigens, several other classes of tumor antigens are
present in many cancer types. These antigens are the result of aberrant re-expression of
early lineage proteins (differentiation antigens), endogenous DNA viruses (retrovirus
antigens), or the misexpression of proteins from immunoprivileged sites (cancer-testis
antigens)115. These antigens derive their immunogenicity from a partial or complete lack
of tolerance116.
It is clear that antigen release by tumor cells initiates the cancer-immunity cycle
(step 1, see Figure 1). Cellular stress (ER or oxidative stress) or therapeutic treatment
(chemotherapy or radiotherapy) can trigger a type of ‘immunogenic’ cell death (ICD) that
is distinct from apoptosis117,118. ICD results in the release of damage-associated
molecular patterns (DAMPs, e.g. calreticulin, ATP, and HMGB1) into the
microenvironment, which in turn induces phagocytotic activity and intracellular Toll-like
receptor signaling in responding innate immune cells119. This allows antigen-presenting
cells, such as dendritic cells (DCs), to capture and process tumor antigens, and undergo
maturation to upregulate co-stimulatory surface ligands (CD80, CD86, MHC class II)120.
Dendritic maturation is critical for productive T cell engagement, as the absence of co-
stimulation can lead to a T cell anergy and clonal deletion121. The inflammatory cues
innate cells receive are thus critically important in determining the outcome of this early
phase of cancer immunity.

31
1.2.2 Dendritic cells traffic to lymph node and interact with naïve T cells
DC maturation allows an APC to migrate to nearby lymph nodes, where they
encounter naïve T cells cycling through lymph nodes via the circulation (step 2, see
Figure 1). In the lymph node, the APC and T cells congregate in a discrete anatomical
location (the ‘T cell zone’) supported by a network of reticular cells122. Each T cell carries
a uniquely rearranged TCR capable of recognizing its ‘cognate’ antigen. It has been
estimated that the odds of a “match” between an APC and T cell are on the order of 1 in
105-106, based on the precursor frequency of naïve antigen-specific CD8+ T cells123.
Therefore, during this initial phase of antigen presentation, multiple T cells transiently
engage with the APC; their motility resembling an unguided, random walks124. Rapid T
cell scanning of the surface of APC increases the likelihood of successful T cell antigen
encounter. Once a T cell has found its cognate antigen, the search pattern changes to
more a directed movement124, and the process of T cell priming is initiated.
1.2.3 T cell priming triggers clonal expansion and effector cell differentiation
T cell recognition of cognate antigen leads to the formation of a stable
immunological synapse with the APC, known as ‘signal 1’ in T cell priming (step 3, see
Figure 1)125. The CD8 co-receptor is required to form a stable interaction with the MHC
class I for antigen binding, while the CD4 co-receptor forms a complex with MHC class II.
The immune synapse recruits the transmembrane phosphatase CD45 to the TCR protein
complex, setting an intracellular signal transduction pathway in motion. CD45 activity at
the synapse allows for the dephosphorylation of the basally active kinase Lck125, which in

32
turn phosphorylates the immunoreceptor tyrosine-based activation motif (ITAM) residues
on the TCR. The ITAMs are then are bound by ZAP70 kinase to initiate proximal TCR
signaling and activation of the MAPK, PI3K, and NFAT pathways125,126.
While the interaction between TCR and peptide-bound MHC molecules (pMHC) is
relatively low affinity (in the millimolar range), T cells are nonetheless exquisitely sensitive
to cognate antigen stimulation; even 1 pMHC molecule can trigger cytokine secretion127.
Although several models have been put forward to reconcile these seemingly paradoxical
findings, the mode by which the TCR transduces signals remains a topic of
debate125,128,129.
A second positive signal results from the interaction between co-stimulatory
receptors on the T cell surface and the ligands expressed on the APC (CD80, and CD86).
This ‘signal 2’ is required to achieve full activation of naïve T cells. The intracellular
pathways engaged upon co-stimulatory receptor ligation largely overlap with TCR
signaling, thereby reinforcing T cell activation, differentiation and acquisition of effector
function130. Co-stimulatory receptor expression is regulated in a complex spatiotemporal
manner; while certain receptors are found on naïve T cells (e.g. CD28, CD27), other
receptors are induced upon activation and impact differentiation and effector functionality
(e.g. OX40, HVEM)130.
To balance the activity of co-stimulatory receptors, co-inhibitory receptors also
become upregulated upon T cell activation131. These receptors provide critical feedback
inhibition by negatively impacting TCR signaling pathways. Co-inhibitory receptors are
thus thought to act as ‘immune checkpoints’ to restrain excessive T cell proliferation,
ensuring that T cell responses are inherently self-limited. Robust prolonged engagement

33
of T cell co-inhibition can render T cells dysfunctional, a state also termed ‘T cell
exhaustion’. This dysfunctional state will be further examined later in this chapter.
Following extended T cell priming and the engagement of proliferative, survival,
and cellular differentiation pathways, T cells undergo a period of rapid cell divisions
leading to clonal expansion. During clonal expansion, CD8+ T cells receive significant
cytokine support from CD4+ T cells through the secretion of interleukin 2 (IL-2), as well
as ‘licensed’ APCs. The majority of activated T cells ultimately acquire a terminal effector
cell state, characterized by an ability to produce cytotoxic molecules (granzymes, perforin,
FasL) to kill a pMHC-expressing target cell.
1.2.4 T cells use chemotactic cues to migrate to the tumor microenvironment
T cell migration through the body is not a passive process, but instead finely tuned
through the surface expression of cell-adhesion molecules and chemokine receptors. For
example, expression of CCR7 and CD62L endows naïve T cells with the ability to home
to lymphoid tissues132,133, where they can receive antigen stimulation. During the clonal
expansion phase of the CD8+ T cell response, a different homing profile is imprinted upon
terminally differentiated cytotoxic T lymphocytes (CTLs). CTLs downregulate CCR7 and
instead upregulate the chemokine receptor CXCR3, which allows re-entry into the
circulation and migration to the tumor site (step 4, in the cancer-immunity cycle, see
Figure 1)132. The canonical CXCR3 ligands CXCL9 and CXCL10 have been shown to
correlate with increased T cell infiltration in several tumor types134–136, indicating that
these chemokines also play a crucial role in guiding T cells to the tumor microenvironment
(TME). Although other chemokine axes (e.g. CCR5-CCL5 and CCR2-CCL2) have also

34
been implicated in T cell migration, genetic evidence suggests that CXCR3 is absolutely
required137.
1.2.5 T cells infiltrate into the tumor microenvironment
As T cells access tumors through the circulation, the endothelial cells (ECs) lining
blood vessels are critically important mediators of entry to the tumor microenvironment
(step 5, see Figure 1). The movement across endothelial cells (‘diapedesis’) is a
coordinated, multistep process, where T cells first initiate rolling movements across the
EC barrier, before arresting and adhering to ECs138,139. These cell-cell adhesions are
guided by the interactions of lymphocyte integrin receptors (LFA-1, Mac-1, and VLA-4)
with their respective endothelial ligands (ICAM-1, ICAM-2, and VCAM-1)138. Both T cells
and endothelial cells subsequently undergo extensive intracellular cytoskeletal
remodeling, which allows the extravasation of T cells through endothelial cell junctions
(‘paracellular migration’) or even directly through individual endothelial cells (‘transcellular
migration’)140,141.
Given the importance of chemotactic cues for proper immune cell homing to tumor
sites, it is perhaps not surprising that cancer cells frequently deregulate chemokine
expression132. By attracting immunosuppressive cell types such as myeloid-derived
suppressor cells (MDSCs) and T regulatory cells (Tregs) and avoiding anti-tumorigenic
effector T cells, cancer cells can shape the immune composition of the tumor
microenvironment. These “immunoevasive” strategies will be described in more detail
later in this chapter.

35
1.2.6 Effector T cells recognize cancer cells through antigen presentation
Upon successfully crossing the endothelial barrier, the positioning of T cells in the
tumor microenvironment depends on the presence of chemoattractive molecules
(‘chemokines’), stromal cells, and crucially, the extracellular matrix (ECM) (step 6, see
Figure 1).
The ECM has well-established roles in sustaining tumor proliferation, invasive
motility, maintenance of cancer stem cell niches, and drug resistance142. Although the
composition and “stiffness” of the ECM can vary considerably between different tumors,
components of the ECM include collagen, proteoglycans, laminin, and fibronectin143,144.
Both cancer cells, as well as cancer-associated fibroblasts (CAFs), are active contributors
to the ECM, which can make up 60 percent of the tumor mass by some estimates145. It
was shown that ECM density of lung tumors plays an important role in the T cell
localization: tumor islets that contained abundant ECM components, largely excluded T
cells146. The initial movement of CTLs through the TME is believed to be largely
random124,147. However, when effector T cells come in contact with tumor cells expressing
their cognate antigen, migration halts and long-lasting connections between the two cells
are formed147,148.
When cytotoxic T lymphocytes detect cognate antigens on a tumor, this triggers a
series of cell-surface and intracellular cytoskeletal changes in the effector cell (step 7,
see Figure 1). The first step involves the formation of an ‘immunological synapse’
between the CTL and the tumor cell, and tight clustering of TCR receptors (also referred
to as the ‘central supramolecular activation cluster’; cSMAC) with pMHC molecules on
cancer cells149. The synapse is reinforced by a peripheral ring of adhesion receptors

36
(LFA-1 and talin proteins; the ‘pSMAC’)149. The intracellular cytoskeletal network of the T
cell also undergoes dynamic rearrangement, leading to the positioning of the microtubule
organizing center (MTOC) near the cortex of the cSMAC150. This allows for directed
delivery of a “lethal hit” by the T cell, while preventing potential exposure of nearby cells
to cytotoxic molecules. CTLs appear to be capable of cooperating in the killing of target
cells and in some instances, can serially kill several target cells151.
Cytotoxic T cells employ two distinct mechanisms to kill their target cell. The Fas
and TNF-related apoptosis-inducing ligand (TRAIL) pathways mediate cytotoxicity
through the binding of complementary ‘death receptor’ ligands on the surface of target
cells152. In contrast, the granule exocytosis pathway relies on disruption of the target
plasma membrane by perforin molecules for intracellular delivery of toxic granzyme
molecules153,154. After intracellular release in the target cell, granzymes are capable of
triggering apoptotic cell death directly through proteolytic cleavage of the effector
caspases 3 and 7, and indirectly through the mitochondrial intrinsic pathway and
apoptosome formation153,154. The Fas and TRAIL pathway also converge on caspases 3
and 7 activation, but instead mediate signaling through the Fas-associated death domain
(FADD) adaptor and procaspase 8 proteins152,153.
This final step in the cancer immunity cycle thus involves the killing of cancer cells.
In the course of dying, cancer cells may release new tumor antigens in the TME. These
tumor antigens are required to initiate the next cancer immunity cycle, and may also
redirect T cell responses to different antigens, a process known as ‘epitope spreading’.
While the immune cycle described in detail in the previous sections is an idealized
example of an effective anti-tumor response, it nonetheless forms the basis of what most

37
cancer immunotherapies aim to achieve. However, cancer immunosurveillance appears
defective in most, if not all, cancer types. This dysfunction can be driven by both tumor-
intrinsic and tumor-extrinsic (microenvironmental) mechanisms, leading to tumor escape
from immune pressure, and ultimately, the clinical manifestation of a tumor. In the
sections below, several mechanisms that can suppress a productive anti-tumor response
will be reviewed.
1.3. Tumor-intrinsic mechanisms of immune escape
Robust evidence for extensive crosstalk between the immune system and human
tumors has only recently accumulated. Many aspects of tumorigenesis appear to be
shaped by selective immune pressure; and conversely, several tumor cell oncogenic
pathways impact and disrupt immune function. These ‘tumor-intrinsic’ (cell-autonomous)
mechanisms allow tumors to evade and escape detection of immune cells.
1.3.1. Antigenicity is a critical determinant in immune escape
Lack of tumor antigenicity was one of the earliest recognized mechanisms of
immune escape155. As initiation of an effector T cell response fundamentally requires the
presence of immunogenic peptides that are presented by APCs, a paucity or complete
lack of antigens would naturally not lead to a T cell response. Several pathways have
shown to be involved in driving a loss of tumor antigenicity, including loss of antigens,
and deregulation of the antigen presentation machinery (APM). Tumor antigenicity can
also be shaped by the immune response, which can lead to the escape of non-antigenic
‘immunoedited’ tumors.

38
As described in the previous section, many human antigens are simply the product
of ‘neutral’ mutations (leading to neoantigens), deregulated transcription (cancer-testis
antigens, differentiation antigens, endogenous retroviruses), or oncogenic viral etiology
(viral antigens). Therefore, cancer cells can often repress or genetically delete these
antigenic sequences without overtly affecting their cellular fitness. Indeed, many
experimental cancer models have documented the emergence of ‘antigen-loss variants’
that evaded immune control106,156–159. More recently, antigen loss has also been
documented in clinical settings; both treatment with TILs160, as well as chimeric antigen
receptor (CAR)-T cell therapy161–163 have led to patient relapses harboring antigen-
negative tumors.
The surface presentation of antigens on tumors, and indeed on all nucleated cells,
is a complex biological pathway involving peptide import into the ER by the TAP1/2
transporters, peptide loading on MHC-b2-microglobulin complexes, and the transport of
pMHCs to the plasma membrane164. At steady state, a cell will constantly present many
peptides resulting from protein turn-over in the cell; the vast majority of these will not
provoke an immune response. Exposure of the cell to IFN-g can lead to upregulation of
several components of the antigen presentation machinery (APM). Tumors have been
shown to frequently deregulate components of their APM, including downregulation of
HLA alleles through genomic hypermethylation165,166, acquisition of inactivating B2M
mutations167–169 and subsequent loss of heterozygosity of the β2m region on chromosome
15q21170, and genetic loss of TAP transporter proteins164,171,172. Similarly, mutations in
JAK/STAT transducers of the IFN-g pathway can dampen a cancer cell’s ability to present
antigens through HLA molecules169. Further evidence of the impact of selective,

39
endogenous immune pressure comes from longitudinal studies documenting B2M loss in
metastatic melanomas samples in the absence of immunotherapy173,174, and
computational analyses showing frequent subclonal and focal HLA loss of heterozygosity
in metastatic lung cancer sites175. Thus, frequent loss of antigen and wide-spread
deregulation of antigen presentation across many cancers demonstrates that lack of
tumor antigenicity is a major component in driving immune escape.
1.3.2. Immunoediting can mediate tumor immune escape
It is now well appreciated that structural alterations in antigenicity and the
presentation machinery of cancer cells can arise as a result of immune cell pressure
during the early phases of tumor growth. To explain how the immune system may target
and “sculpt” tumor cell antigenicity, the process of ‘immunoediting’ was defined by
Schreiber, Old, and Smyth. Immunoediting occurs through three distinct phases:
elimination, equilibrium, and escape (the three “E’s”)2,38.
During the elimination phase, innate and adaptive immune cells cooperate to
detect and kill antigenic tumors. One of the initiating factors of these anti-tumor responses
is the immunogenic cell death of tumor cells, leading to the release of antigens and
DAMPs119. Other factors, such as expression of stress-induced ligands that activate NK
cells, may play a role in recruiting additional immune cells, and promote a tumor
microenvironment that favors immune tumoricidal activity2,176. Direct evidence for the
existence of an elimination phase in human cancer has been difficult to obtain, and
instead has been drawn from different lines of correlative studies. First, the presence of
tumor infiltrating lymphocytes (TILs) is associated with favorable disease prognoses in

40
many cancer types, including breast cancer177,178, melanoma179–181, and colorectal
cancer182–184 (reviewed in refs. 185,186). Second, several retrospective studies have
demonstrated correlations between increased cancer susceptibility and the use of
immunosuppressive drugs in patients with organ transplants187–190 or HIV/AIDS191–193.
These associations suggest that the immune system at baseline is involved in elimination
of (pre-)malignant clones before these cancer cells can manifest as a clinical disease.
Finally, immune elimination has been inferred from the greater frequency of chemical-
induced tumors or spontaneous tumor penetrance in mice lacking key components of the
immune system (e.g. Rag2-/-, Prf1-/- (perforin), IFNGR1-/- (IFN-g receptor) and others,
as summarized in ref. 194).
The equilibrium phase is characterized by the continuous emergence of new tumor
clones and subsequent immune cell removal of particularly antigenic clones, thereby
gradually “sculpting” the immunogenicity of the tumor. Although the existence of a
clinically non-apparent, dormant tumor state has not been observed in human disease,
evidence from a number of experimental models suggests that the equilibrium phase can
persist for extended periods. For example, in a model of low-dose MCA-treatment, only
disruption of the immune system (through CD8+ T cell or IFN-g depletion) led to rapid
sarcoma formation, suggesting that cytotoxic T cells previously had controlled
tumorigenesis101. Although it is still largely unknown which factors dictate the equilibrium
state, the cytokine milieu in the TME195, and the balance between (anti-tumorigenic)
CTLs, NK cells and γδ T cells and (pro-tumorigenic) monocytic MDSCs are likely to be
important196.

41
The final phase of immunoediting, tumor escape, is initiated by the acquisition of
immunoevasive alterations that completely curtail an existing anti-tumor response and
allow for uncontrolled tumor growth. As described above, during the escape phase tumor
may be entirely devoid of antigenicity, have downregulated MHC molecules, or have
deregulated the antigen presentation pathway. Additionally, some tumors develop
resistance to T cell cytotoxicity through the upregulation of antiapoptotic molecules197,198
or mutate death receptors199,200. Alternatively, tumors can recruit immune-regulatory cells
through the secretion of chemokines to the tumor microenvironment to promote a state
of immunosuppression. These tumor-extrinsic mechanisms will be reviewed in detail in
the next section 1.4.
1.3.3. Oncogenic pathways drive T cell exclusion
In addition to deregulation of tumor antigenicity, tumor cells may also escape
immune pressure through the activation of oncogenic pathways that impact and disrupt
immune function.
One of the pathways is the Wnt-b-catenin signaling axis. Binding of the growth
factor Wnt activates an intracellular signal transduction cascade that triggers the
cytoplasmic release of the transcription factor b-catenin, and its subsequent translocation
to the nucleus to activate a host of genes involved in diverse biological functions, including
(cancer) stem cell renewal201. In a preclinical genetically engineered mouse model
(GEMM) of melanoma expressing constitutively active b-catenin (BrafV600E, Pten-/-,CAT-
STA mice), Wnt signaling repressed transcription of the Ccl4 chemokine gene, leading to
impaired recruitment of CD103+ dendritic cells into the TME202. As these cross-presenting

42
DCs are crucial for the initiation of adaptive immune responses120, T cells were actively
excluded from the tumor microenvironment202,203. This immunosuppressive axis does not
appear to operate solely in melanoma, as a number of other cancers with alterations in
the Wnt-b-catenin pathway have similarly revealed T cell exclusion phenotypes204.
The loss of the tumor suppressor PTEN can also mediate immunosuppressive
functions through the PI3K-AKT pathway. PI3K pathway alterations are among the most
frequently found alterations in human cancers, and impact a wide range of cellular
processes, including cellular proliferation, metabolism, and motility (invasion)205. In an
analysis of cutaneous melanoma samples collected in the Cancer Genome Atlas (TCGA)
database, PTEN deletions or loss-of-function mutations were associated with reduced T
cell number and function206. Mechanistically, immunosuppression through PTEN loss
appeared to be mediated through increased expression of VEGF (which can promote
endothelial barrier function, see 1.4.1) and reduced sensitivity to T cell cytotoxicity206.
In lung cancers, two oncogenic pathways have been identified that cooperate with
Kras-driven adenocarcinomas. Activation of the oncogene Myc leads to stromal
reprogramming through the tumor-derived cytokines CCL9 and IL-23, causing
macrophage influx into the TME and immune exclusion of T cells, B cells, and NK cells207.
Additionally, these macrophages appeared to be critically involved in mediation of an
angiogenic switch that sustained further adenocarcinoma development207. A second
oncogenic pathway involving STK11/LKB1, was examined in lung adenocarcinoma
patients treated with PD-1 blockade. Genetic alterations in STK11/LKB1 were significantly
associated with poorer progression-free survival (PFS) and overall survival (OS)208.
Furthermore, these alterations were enriched in PD-L1 negative patients with

43
intermediate or high mutational burden208, suggesting that loss of STK11/LKB1 may
operate as an immunosuppressive mechanism that distinct from PD-1-mediated
pathways. In lung GEMMs, genetic ablation of this pathway leads to increased neutrophil
recruitment through elevated IL-1a and IL-6 production209 and repression of the
cytoplasmic DNA-sensor STING210. LKB1 restoration leads to upregulation of PD-L1
expression on tumor organoids210. The therapeutic blockade of IL-6 significantly inhibits
tumor progression, and improved survival209. Interestingly, checkpoint blockade with
CTLA-4 or a combination of PD-1 and TIM-3 did not demonstrate any efficacy in this
model209, further suggesting that STK11/LKB1-mediated immunosuppression is a unique
mechanism of therapeutic resistance and immune escape.
A third oncogenic pathway that has received significant attention over the past few
years, involves the cyclin-dependent kinases 4 and 6 (CDK4/6). CDK4/6 are critical
regulators of cell-cycle progression: they cooperate with D-type cyclins to phosphorylate
Rb (pRB), thereby releasing E2F to trigger transition from G1 into the S-phase211. It was
shown recently that CDK4 promotes proteasomal degradation of PD-L1212. Additionally,
downstream pRB was shown to transcriptionally repress PD-L1 through NF-κB
signaling213. These studies suggest that restoration of CDK4/6 or Rb may promote tumor
immunity. Howver, in vivo pharmacological inhibition of CDK4/6 in breast carcinoma,
colorectal carcinoma and melanoma mouse models is associated with improved anti-
tumor immunity, rather than resistance214–217. These effects appear mediated through
tumor-intrinsic factors (increased antigen presentation and type III interferon signaling214)
as well effects on T cells (NFAT potentiation of T cell activation)215,216. An open question
is how increased PD-L1 expression impacts these therapeutic responses. The

44
paradoxical nature of these complex in vivo responses illustrates that there is undoubtedly
more to learn about the role of the CDK4/6-Rb pathway in tumor immune escape.
1.4. Tumor-extrinsic mechanisms of immune escape
Over the course of malignant progression, tumors modulate their surrounding
microenvironment extensively to create favorable conditions for oncogenic growth. A key
aspect of these adaptations involves the preferential recruitment of pro-tumorigenic
immune cell subsets, and suppression of anti-tumorigenic T cells and NK cells. In the next
sections, the different aspects of the tumor microenvironment intimately involved in the
creating immunosuppression will be described.
1.4.1. Endothelial cells
Cancer cells extensively modulate the surrounding blood vasculature to access
critical nutrient supplies that sustain rapid tumor proliferation218. Compared to healthy
tissue vasculature, tumor vessels exhibit several abnormal morphological features,
including erratic branching (“tortuous” vessels), loose endothelial lining, and sparse
coverage of pericytes that control vascular permeability219,220. Consequently, tumor
vessels are highly “leaky” and blood flow is irregular, contributing low-oxygen environment
(known as ‘hypoxia’). Hypoxia in turn drives the secretion of vascular endothelial growth
factor (VEGF) by tumor cells221 and cells in the TME222, which binds VEGF receptors on
nearby endothelial cells to stimulate “sprouting” of new blood vessels (‘neo-
angiogenesis’)223. As T cells critically depend on coordinated interactions with the

45
endothelial vasculature to facilitate T cell migration into the TME, these aberrant tumor
blood vessels may be more difficult to navigate for lymphocytes.
VEGF (and fibroblast growth factor) may also directly exert immunosuppressive
functions through the promotion of endothelial barrier function and upregulation of FasL.
VEGF leads to downregulation of ICAM-1/2, VCAM-1, and CD34 on endothelial cells224,
referred to as ‘anergic ECs’. EC anergy prevents the engagement of T cell integrin
adhesion receptors (LFA-1, Mac-1, and VLA-4) that participate in endothelial
extravasation138. VEGF can also upregulate the Fas ligand (FasL) on endothelial cells as
an additional mechanism to stave off anti-tumorigenic T cells225. Recent effector CD8+ T
cells may be particularly sensitive to endothelial FasL, as the death receptor Fas becomes
upregulated during T cell activation226. Certain tissues (for example, the eye) actively
exclude immune cells through FasL expression227, which has led to the suggestion that
tumor sites acquire a degree of “immune privilege”228.
The endothelial B receptor (ETBR) pathway has been implicated in suppressing T
cell adhesion to ECs as well229. ETBR expression was shown to be inversely correlated
with the presence of tumor-infiltrating lymphocytes (TILs) in ovarian carcinomas, while
pharmacological inhibition of ETBR led to improved T cell vessel adhesion138.
Tumors thus extensively impact T cell migration through aberrant vasculature and
promotion of endothelial barrier function.
1.4.2. Cancer-associated fibroblasts (CAFs)
Cancer-associated fibroblasts (CAFs) are abundant stromal cells in the tumor
microenvironment, and can even outnumber cancer cells in certain tumors. Their role in

46
supporting cancer progression is highly pleiotropic in nature, and includes enabling tumor
metabolic adaptation to hypoxia, facilitating cancer motility and invasion through
remodeling of the ECM, promoting therapy resistance, and suppressing immune
function230. As a result of continuous mechanical tissue disruption by growing cancer
cells, tissue repair responses are typically chronically activated in the tumor parenchyma
(cancers are a “wounds that never heal”). As a result, normal fibroblasts participating in
tissue repair of the tumor microenvironment irreversibly differentiate into CAFs in
response to chronic stimuli, which increases their migratory capacity and alters their
secretome230. Attempts at defining several subtypes of CAFs with specialized functions
have been made, however there is considerable heterogeneity based on their cellular
origin231,232. To add to this complexity, a number of fibroblast subtypes can perform
overlapping tumor-supportive functions.
Cancer-associated fibroblasts may exert both direct and indirect effects on the
surrounding immune cell infiltrate. CAFs are known to secrete a plethora of different
cytokines, chemokines, and pro-angiogenic factors that can have extensive effects on
nearby innate immune cell polarization and T cell function. A comprehensive description
of these factors is beyond the scope of this thesis, but is well summarized in a recent
review231. Instead, a few key CAF-secreted factors will be highlighted below.
CAFs are a major source of transforming growth factor b (TGF-b), which, aside
from context-dependent roles in cancer progression233, can suppress the effector function
of NK and T cells234,235, impair T cell memory responses236, and promote T cell
exclusion237–239. Additionally, TGF-b can promote CD4+ T cell transdifferentiation into T
regulatory cells240. TGF-b, and the CXCL12 chemokine can also recruit

47
immunosuppressive M2-polarized macrophages to the tumor microenvironment241–243,
and thereby indirectly impact T cell function. CAFs also secrete abundant IL-6, which can
impair dendritic cell maturation and antigen presentation capacity244,245, and skews
monocyte differentiation towards macrophage fates246. Finally, modulation of the ECM by
CAFs through the deposition of fibronectin, hyaluronic acid and collagens can lead to
poor T cell infiltration and stromal trapping, as well as enhance M2-polarized macrophage
migration into the TME146,247,248.
1.4.3. Myeloid-derived suppressor cells (MDSCs) and tumor-associated
macrophages (TAMs)
Myeloid-derived suppressor cells (MDSCs) are a heterogenous and highly plastic
population of bone marrow-derived myeloid precursor cells. At least two distinct types of
MDSCs exist in mice and humans: polymorphonuclear MDSCs (PMN-MDSCs), which are
more closely related to neutrophils, and monocytic MDSCs (M-MDSCs), which are related
to monocytes249. While both PMN-MDSCs and M-MDSCs are thought to mediate
immunosuppressive roles during immune responses, PMN-MDSCs are typically localized
to peripheral lymphoid organs, where they function to maintain immune tolerance249. In
contrast, M-MDSCs migrate to tumors, where they can further acquire tumor-associated
macrophage fates249. MDSCs are actively recruited by tumors through the secretion of a
number of chemokines, including CCL2, CXCL1, and CXCL12250–253. In the tumor
microenvironment MDSCs fulfill potent, but largely non-specific immunosuppressive
roles. Persistent inflammation and hypoxia in tumors induces the upregulation of arginine
1 (Arg1) and inducible nitric oxide synthase 2 (iNOS2) proteins, which leads to local L-

48
arginine depletion and inhibition of IL-2 signaling through nitric oxide249,254. Furthermore,
MDSCs can also deplete tryptophan levels through IDO1 expression255, can directly
upregulate PD-L1256, and recruit CCR5+ T regulatory cells through the release of CCL3
and CCL4257.
1.4.4. Tumor-associated macrophages (TAMs)
Macrophages are phagocytic cells that mediate key roles in the clearance of
infectious agents, and maintenance of tissue homeostasis258. In tumors, macrophages
are thought to derive from circulatory conventional monocytes or monocytic myeloid-
derived suppressor cells259. Macrophage fate is highly plastic, and context-dependent,
referred to as ‘polarization’. In describing the different roles of tumor-associated
macrophages (TAMs), a distinction between M1 (anti-tumorigenic) and M2 (pro-
tumorigenic) has historically been made. However, it is now appreciated that macrophage
polarization represents a spectrum260.
TAMs exert clear immunosuppressive roles in the primary tumor
microenvironment, and can promote metastatic tumor dissemination. Their recruitment is
mediated through chemokines (including CCL2 and CCL5), and cytokines (CSF-1 and
VEGF)259,261,262. CSF-1 plays a particularly important role in attracting and polarizing
TAMs to a “M-2-like” state262–264. TAMs promote tumor growth and immunosuppression
of effector T cell responses through a number of different pathways. TAM stimulation by
IL-4 and Wnt7b promotes an angiogenic switch through the release of VEGF, leading to
the de novo development of blood vasculature in tumors265–267. TAMs are also known to

49
directly aid extravasation of invasive mammary cancer cells into the circulation268, and
can remodel the ECM to further promote tumor migration269.
In addition to these tumor promoting functions, TAMs also exert a myriad of
immune-regulatory roles through direct and indirect inhibition of T cell and NK cell anti-
tumor responses. Direct mechanisms include expression of the nonclassical MHC class
I molecules (HLA-G) which functions to inhibit T cells and NK cells270,271, cell-surface
upregulation of PD-L1 and the alternate B7-H4 receptor272–276, and expression of the
TRAIL death receptor277. Indirect mechanisms include the depletion of L-arginine (through
Arg1)278–280, recruitment of T regulatory cells through CCL20 and CCL22281,282, and the
secretion IL-10 and TGF-b which may locally convert convention CD4+ into T regulatory
cells283,284.
1.4.5. T cell-intrinsic dysfunction
Upon cognate antigen stimulation in the lymph node by an APC, CD8+ and CD4+
T cells rapidly upregulate a number co-stimulatory (SRs) and co-inhibitory receptors
(IRs)130. As T cells must “pass” these co-inhibitory functions in order to acquire full effector
functionality, IRs are sometimes referred to as ‘immune checkpoints’. The spatiotemporal
relationship between SR and IR expression has been conceptualized as a “tidal wave”285.
In this model, a “wave” of signals triggered by SR engagement pulls naïve and recently
activated T cells into a proliferative state. The peak of the wave is balanced by the
opposing actions of SR and IR signals, before the wave recedes when the balance shifts
to inhibitory signals130,285. Therefore, T cell responses are inherently self-limited in nature
to control immune homeostasis. Furthermore, IR expression on CD4+ T regulatory cells

50
ensures that peripheral tolerance is maintained to restrain pathogenic host-directed
adaptive immunological responses. Indeed, mutation or deficiency of several co-inhibitory
receptors is associated with the development of murine and human autoimmune
disorders102,286–289.
It has long been appreciated that T cells fail to clear certain experimental viral
infections (e.g. lymphocytic choriomeningitis virus (LMCV) clone 13) and instead acquire
impairments in their effector, proliferative and memory-formation capacities290–293. This
distinct state has been defined as ‘T cell exhaustion’, and is thought to be driven by an
aberrant differentiation program in the context of pathogen persistence,
immunosuppressive cytokines, and lack of CD4+ T cell help294. Exhausted T cells in
chronic LMCV exhibit several characteristics, including the sustained transcriptional
upregulation of several IRs (Pcd-1, Ctla-4, Lag-3, 2b4, Gp49b, and others), defects in
cytokine production (IFN-g, TNF-a, IL-2), upregulation of chemokine genes (Ccl3, Ccl4,
Cxcl5), transcription factors (T-bet, Eomes, Blimp-1, and Tcf-1), and altered cellular
metabolism (bioenergetic deficiency)295. Epigenetic profiling of exhausted T cells has
reinforced the idea that these cells exhibit distinct differentiation from effector or memory
T cells296,297. Recently, the transcription factor Tox was identified as a key regulator of
this epigenetic program in chronic LCMV298–300 and a mouse model of cancer301.
As T cells experience persistent antigen load, they gradually become impaired in
several effector functions302. High proliferative capacity, IL-2 production and ex vivo
cytotoxicity are impaired first, before TNF-a production, and finally IFN-g production and
the ability to degranulate302. Severely exhausted T cells that have lost effector
functionality may get physically deleted from the host291–293. Although these progressive

51
impairments highlight that T cell responses can become highly dysfunctional, it is
important to note that T cell exhaustion is a crucial safeguard against rampant
pathological inflammatory reactions, and exhausted T cells are capable of maintaining
some control over the infection302,303. Furthermore, exhaustion is not irreversible, as T cell
functionality can be restored by a therapeutic blockade of PD-1-PD-L1 axis, which has
been shown to decrease systemic viral load304.
Several lines of evidence demonstrate that T cells acquire a dysfunctional program
in tumors that is analogous to T cell exhaustion. Tumor-specific T cells isolated from
multiple types of cancers upregulate multiple IRs, including PD-1, CTLA-4, LAG-3, and
TIM-3305–307. Furthermore, tumor-specific T cells are impaired in their ability to produce
cytokines (IFN-g, TNF-a) in multiple human tumors305–311. T cell proliferative capacity is
another functional attribute that appears to decrease as intratumoral T cells become more
dysfunctional, as early progenitor T cells exhibit more cell-cycle gene expression and Ki67
marker positivity than more dysfunctional T cells312.
Similar to T cell exhaustion, T cell tumor dysfunctionality is thought to be driven by
chronic antigen exposure, and may be acquired early during tumorigenesis313. However,
it is not a fixed state, and rather phenotypically heterogenous, as evidenced by several
reports over the past few years314–316. Several attempts at defining precursor states (“pre-
dysfunctional”, “transitional” or “progenitor exhausted” cells) have been made by the gene
expression patterns of unique genes (e.g. GZMK, TCF-7, IL7R, ZNF683 and others) and
the surface (co-)expression of different IRs (reviewed in 317). For example, pre-
dysfunctional T cells in a mouse model of melanoma are marked by Slamf6+TIM-3-TCF-
1+, and can give rise to Slamf6-TIM-3+TCF-1 dysfunctional T cells (but not vice versa)318.

52
The impact of a number of transcription factors on the T cell dysfunctional program
has also been extensively investigated in murine and human cancer. The pre-
dysfunctional responsive state appears maintained by Tcf-1318–320, while dysfunctionality
is driven by Tox301. A number of other transcription factors, such as Gata3, Blimp-
1/Prdm1, c-Maf, T-bet, and Eomes appear play roles in maintaining this state as well321–
323.
A more detailed review of the biology of the major co-inhibitory receptors is
provided in the sections that follow:
CTLA-4
Although the cytotoxic T-lymphocyte associated protein 4 (CTLA-4) was originally
thought to be a potentiator of T cell activity, research in the 1990s demonstrated that it
was a negative regulator4. The expression of CTLA-4 is driven the NFAT transcription
factor, which is activated by TCR and CD28 stimulation during T cell activation324. Upon
expression, CTLA-4 locates to the TCR proximal plasma membrane, where it is subject
to constitutive endocytosis. As a result ~90% of CTLA-4 is intracellular325. At the cell
surface, CTLA-4 has high affinity for the CD80 (B7.1) and CD86 (B7.2) molecules on
mature APCs326, and can form bivalent interfaces with both ligands, which allows it to
outcompete CD28 binding327,328. CTLA-4 may also exert cell-extrinsic negative regulation
through the trans-endocytosis of CD80 and CD86329,330. Through these actions, CTLA-4
counteracts CD28-mediated PI3K-AKT and RAS-MAPK signaling. Surprisingly, the
intracellular pathways downstream of CTLA-4 receptor engagement are not fully
elucidated (reviewed in 331); conflicting data exists on whether CTLA-4 can

53
dephosphorylate proximal TCR complex components, recruit of SHP2 through YVKM
sequence in the CTLA-4 cytoplasmic tail or directly inhibits PI3K-AKT pathway signaling.
It is clear however that CTLA-4 plays a critical role as a negative regulator during T cell
priming.
PD-1
Programmed cell death protein 1 (PD-1) principally functions to maintain peripheral
tolerance and restrain excessive inflammatory responses to preserve tissue homeostasis.
PD-1 is upregulated on activated effector CD8+ and CD4+ T cells332, and PD-1
expression is sustained in the context of chronic antigen exposure304. A number of
transcription factors (NFAT, FOXO1, T-Bet, and BLIMP-1) have been shown to regulate
PD-1 expression333. PD-1 interacts with the PD-L1 and PD-L2 molecules in peripheral
tissues. PD-L1 is widely expressed on both hematopoietic (T cells, B cells, macrophages,
DCs, and mast cells) and non-hematopoietic cells (e.g. tumor, endothelial, corneal
epithelial, placental syncytiotrophoblast, and pancreatic islet cells, as well as
keratinocytes and astrocytes)334. In contrast, PD-L2 expression is restricted to
macrophages, DCs, and mast cells. PD-L1 and (to a lesser degree) PD-L2 upregulation
can be induced by IFN-g signaling335,336. PD-1-PD-L1 signaling has inhibitory effects on
proximal TCR signaling components through the direct recruitment of the SHP2
phosphatase to the PD-1 cytoplasmic tail, and downregulates signaling outputs of CD28-
mediated pathways337. The latter may represent a central axis of co-inhibitory regulation
that is shared between CTLA-4 and PD-1338. Thus, PD-1 broadly acts to decrease T cell
54
activation, affecting cell survival, proliferation, and cytokine production as well as altering
the cellular metabolism of effector T cells333,339.
TIGIT
The T cell immunoglobulin and ITIM domain (TIGIT) is a relative recent addition to
the co-inhibitory receptor family, after being discovered on effector T cells, Tregs and NK
cells by several groups 340–343. TIGIT is expressed on effector and memory T cells, Tregs,
follicular T helper cells, and NK cells340–345. Tumor-specific T cells have been shown to
co-express TIGIT with PD-1, which is thought to mark a dysfunctional CD8+ subset346,347.
TIGIT binds two ligands, poliovirus receptor (PVR; CD155) and PVRL2 (CD122), although
its affinity for PVR is 100-fold higher affinity than PVRL2348. Crystal structures of the
TIGIT-PVR interaction have demonstrated that the complex exists in a tetrameric state,
with each surface protein contributing cis-homodimers349.
TIGIT (and the Tactile/CD96 receptor) functions in opposition of the co-stimulatory
receptor DNAM-1 (CD226), which also binds PVR, albeit with lower affinity than TIGIT350.
TIGIT may counteract DNAM-1 through several mechanisms. First, TIGIT is capable of
outcompeting DNAM-1 for PVR binding on the cell surface350, similarly to CTLA-4 and
CD28. Second, TIGIT may regulate DNAM-1 in cis by impairing homodimerization of this
receptor351 and can mediate signals in trans through the ITIM motif in the cytoplasmic tail
of PVR342. Finally, and perhaps most crucially, PVR binding leads to Grb2-SHIP2
sequestration to the cytoplasmic tail of TIGIT in NK cells, preventing downstream PI3K-
AKT, MAPK, NF-kB signaling348. TIGIT thus broadly impacts T cell activation, proliferation
and differentiation programs. However, TIGIT can also have positive roles, including the
55
promotion of cell survival through upregulation of IL-2R, IL-7R, and IL-15R and the anti-
apoptotic Bcl-xL protein344.
In addition to roles on effector T cells and NK cells, TIGIT also promotes the
functionality of T regulatory cells. The TIGIT gene is transcriptionally regulated by the
Treg-lineage defining transcription factor Foxp3352. TIGIT+ Tregs are more activated, as
indicated by increased Foxp3, CD25, CTLA-4, and Fgl2, which mediates suppression of
TH1 and TH17 responses345,353.
TIM-3
T cell immunoglobulin-3 (TIM-3) is a co-inhibitory receptor that is part of a larger
family of TIM proteins, which also encompasses TIM-1 and TIM-4. TIM-3 is expressed on
activated TH1 CD4+ T cells, effector CD8+ T cells, T regulatory cells, dendritic cells,
monocytes and NK cells. TIM-3 is upregulated on intratumoral T cells, where it is thought
to mark severely impaired effector T cells. Tumor-resident TIM-3+ Tregs are thought to
more immunosuppressive, and have increased expression of Foxp3, IL-10, granzymes,
and Perforin. Several TIM-3 ligands have been identified, including Galectin-9, Ceacam-
1, phosphatidyl serine (PtdSer), and HMGB1, although the latter two appear important for
interactions on TIM-3+ innate immune cells.
Similar to LAG-3 (see section below), TIM-3’s cytoplasmic domain does not
contain any canonical immunoreceptor tyrosine-based inhibitory motifs (ITIMs). Instead,
several evolutionary conserved tyrosine residues (Y256 and Y263) have been implicated
in recruiting Bat3 (in the absence of ligand) or Fyn (upon Galactin-9, CEACAM-1 binding).

56
Upon association with the cytoplasmic tail of TIM-3, Fyn recruits the Csk kinase, which,
through sequestration of Lck, can inhibit proximal TCR signaling.
LAG-3
Lymphocyte activation gene 3 (LAG-3) was discovered three decades ago354, and
encodes a co-inhibitory receptor expressed on activated CD8+ and CD4+ T cells, T
regulatory cells, NK cells354,355, murine plasmacytoid dendritic cells356, B cells357, and
even neurons358. LAG-3 expression on T regulatory cells is associated with an activated
phenotype, and LAG-3+ Tregs may play a role in T cell homeostasis355,359. LAG-3 is
capable of binding several ligands, including MHC class II molecules, galectin-3, LSECtin,
and a-synuclein358,360,361. As LAG-3 is structurally similar to the CD4 co-receptor362, the
interaction with MHC class II has been a major focus of investigation. The biophysical
nature of this interaction however still remains poorly defined. The recent identification of
fibrinogen-like protein 1 (FGL1) as a cognate ligand suggests that LAG-3 may have
functions in immune cells do not typically interact with MHC class II molecules363.
LAG-3 closely associates with CD3 chains, which is thought to drive inhibition of T
cell proliferation, cytokine production, and calcium flux364. However, as the cytoplasmic
tail of LAG-3 contains poorly characterized motifs355, LAG-3 downstream intracellular
signaling remains to be fully elucidated.
1.4.6. CD4+ T cells
CD4+ T cells are critically involved in orchestrating immune responses, and can
adopt many effector lineages upon antigen stimulation through MHC class II molecules.

57
In addition to stimulating antibody-production responses, CD4+ T cells can provide “help”
during effector CD8+ T cell differentiation, regulate macrophage polarization, maintain
tissue homeostasis and peripheral tolerance365. These effector functions are achieved by
cellular differentiation into distinct fates, including TH1, TH2, TH17, TFH, and T regulatory
cells fates. Each of these CD4+ “helper” lineages are further characterized by the
production of certain cytokines: TH1 CD4+ predominantly produce IFN-g, TNF-a, CCL2
and CCL3, TH2 produce IL-4, IL-5, and IL-13, TH17 produce IL-17A and IL17F, TFH
produce IL21, and Tregs produce IL-10, IL-35 and TGF-b366,367. While a number of TH
CD4+ T cells can exert anti-tumorigenic roles, these functions are highly context-
dependent (reviewed in 366).
T regulatory cells are critical mediators of peripheral tolerance, and function to
suppress excessive host-directed immune responses368. T regulatory cell lineage is
defined by the transcription factor forkhead box protein P3 (Foxp3). A role for Tregs in
peripheral tolerance further supported by mice strains carrying mutations in the Foxp3
gene (“scurfy” mice) that develop rapid, lethal autoimmune responses369. Tregs can play
a crucial roles at multiple stages of the anti-tumor immune response, notably during T cell
priming and during the effector response in peripheral tissues. During antigen
presentation in lymph nodes, Tregs can act as a “cytokine sink” by sequestering available
T cell growth factor (IL-2)370,371, and can suppress antigen stimulation through
upregulation of the co-inhibitory receptor CTLA-4372,373. Both tumors and macrophages
have been shown to actively recruit T regulatory cells to the TME through the secretion
of inflammatory cytokines CCL2, CCL21, and CCL22281,374,375. In the tumor tissue Tregs
can effectively suppress effector CD8+ T cell responses through direct inhibition or even

58
killing of CTLs (through perforin and granzymes)376, the production of T cell inhibitory
metabolites (adenosine)377,378, and the secretion of a number of immunoregulatory
cytokines (IL-10, IL-35 and TGF-b) that further dampen T cell activity379–382. Tumor-
infiltrating T regulatory cells have been shown to be “activated”, and upregulate a number
of IRs and SRs upon activation (PD-1, TIGIT, TIM-3, LAG-3, ICOS, and OX40)383. It has
been suggested that Treg activation is mediated by the (abundant) release of self-
antigens in the tumor microenvironment384, however the precise mechanisms remain to
be established.
1.4.7. Tumor microenvironments can exist in distinct inflammatory states
The previous sections illustrated that cancer cells, stromal cells and immune cells
collectively influence the inflammatory state of the tumor microenvironment. Based on
localization and density of lymphocytic infiltrates and presence of immune-associated
soluble factors, a distinction between ‘cold’ (non-T cell-inflamed), ‘altered’, and ‘hot’ (T-
cell inflamed) tumor microenvironments has been made385,386.
Non-T cell-inflamed tumors largely lack infiltrating T cells, but may still harbor
macrophages and vascular endothelial cells386. Defective T cell priming is thought to
underlie the absence of T cells in these cold tumors, however these priming defects
cannot be explained by a lack of tumor antigens (at least in the case of melanoma)386,387.
As described in 1.3.3, oncogenic alterations in Wnt/b-catenin or PTEN pathways may
promote a non-T cell-inflamed microenvironment. Patients with immunologically cold
tumors typically respond poorly to current approved immune checkpoint inhibitors385,

59
suggesting that fundamentally different strategies such as dendritic cell vaccination may
be required to initiate and enhance anti-tumor immune responses.
In altered (or immune excluded) tumor microenvironments, effector T cells are
confined to the invasive margins of the tumor bed. Several tumor-intrinsic and tumor-
extrinsic factors can promote T cell exclusion, including altered chemokine signaling,
presence of immunosuppressive innate immune cells, and stromal barriers (e.g. severe
hypoxia in the tumor core, an impenetrable ECM, or abnormal endothelial vessels)388–390.
Finally, in a hot tumor microenvironment, cytotoxic T cells are abundantly present,
and several soluble factors and cytokines (IFN-g, IDO1) indicate significant T cell
reactivity. However, persistent antigen load as well as the presence of immune-regulatory
subsets in the tumor microenvironment renders most of these effector T cells
dysfunctional. Dysfunctional T cells may express a number of co-inhibitory surface
markers, including CTLA-4, PD-1, TIGIT, TIM3, LAG-3, and CD39. These T cell
dysfunctional programs are driven by transcription factor such as TOX. Patients with
these hot tumor microenvironments are typically respond well to immune checkpoint
inhibitors, and are most likely to derive clinically durable benefit from these immune-based
therapies.
1.5. Pancreatic cancer
Pancreatic cancer is a deadly malignant disease in one of the body’s major
digestive organs. The pancreas has both exocrine functions (secretion of enzymes such
as trypsin, chymotrypsin, and lipase) and endocrine functions (regulation of glucose
homeostasis). These functions are carried out by specialized cells contained in the

60
pancreatic parenchyma. Acinar cells are the major producers of digestive enzymes, which
are released into tubular networks formed by ductal cells. Acinar cells constitute the bulk
of the pancreatic tissue (80%), while islets of Langerhans lay interspersed in the
parenchyma391. Islets contain several hormone-producing cell types, including a cells
(glucagon), b cells (insulin), d cells (somatostatin), e cells (ghrelin), and pancreatic
polypeptide (PP) cells. Accordingly, tumors arising from either the exocrine or endocrine
tissue have distinct classifications; pancreatic ductal adenocarcinomas (PDACs) are by
far the most common (exocrine) pancreatic tumors, while pancreatic neuroendocrine
tumors (pNETs) are relatively rare (endocrine) tumors (~7% of all pancreatic cancer
cases)392.
Pancreatic cancer accounts for an estimated 57,600 new cases in 2020 in the U.S.
alone, and for 47,050 deaths. It is the 10th most commonly diagnosed cancer, but the 4th
leading cause of cancer death392. Risk factors for pancreatic cancer include smoking
history, type 2 diabetes, obesity, and a family history of pancreatic cancer or chronic
pancreatitis392. BRCA1/2 germline mutation carriers also carry increased risk for
pancreatic cancer (4-7% of PDAC patients). In December 2019, the FDA approved a
PARP inhibitor (Olaparib/Lynparza) as maintenance therapy for BRCA1/2-mutant
metastatic PDAC393.
The 5-year overall survival (OS) rate (9%) remains dismal for PDAC. The standard
of care for local PDAC is surgical resection, often combined with adjuvant chemotherapy
or radiotherapy. Surgery currently provides the only curative benefit for this disease, with
5-year OS rates at 37%392,394. However, as the majority of PDAC patients are diagnosed
with locally advanced or distant metastatic disease, combination chemotherapy (either

61
FOLFIRINOX or nab-paclitaxel with gemcitabine) is the only treatment option395. While
combination chemotherapy regimens extends patient survival to 8.5-11.1 months, 5-year
OS rates are low (12% for regional disease, 3% for metastatic disease)392,396,397. These
sobering figures underline that novel therapies for the treatment of pancreatic cancer are
urgently needed.
1.5.1. The disease progression and the genetic basis of pancreatic
adenocarcinoma
Similar to other cancers arising in the gastrointestinal tract, pancreatic
adenocarcinoma is thought to progress through several tumor stages, characterized by
increasingly neoplastic and invasive growth. Pancreatic cancer is initiated by the
acquisition of oncogenic mutation(s) and loss of tumor suppressor genes in a founding
clone, before progressing to precursor lesions. The most common precursor lesions are
pancreatic intraepithelial neoplasias (PanINs), although other lesions have been defined
(mucinous cystic neoplasms (MCNs), and intraductal papillary mucinous neoplasms
(IPMNs))391,398. Several stages of PanINs (I-III) have been described, and are associated
with increasing neoplastic morphology and disruption of ductal architecture399.
Progression of PanIN to frank adenocarcinoma is demarcated by local invasion through
the ductal basement membrane into the surrounding tissue parenchyma. The final stage
in the development of PDAC is metastatic spread to distant tissues.
During the initiation phase, an oncogenic driver mutation transforms cells of the
exocrine pancreas. Although PDAC typically arises in the head of the pancreas, the exact
cell of origin remains a topic of debate. In fact, multiple lines of experimental evidence

62
have suggested that ductal, acinar and even endocrine cells can give rise to PDAC under
certain chronic inflammatory conditons400–402, suggesting that transformative event is
highly context-dependent. Acinar cells are thought to be the most permissive to oncogenic
transformation, and undergo an acinar-to-ductal metaplasia, possibly driven by extrinsic
inflammatory cues403–405.
Mathematical models based on mutational analyses of advanced-stage pancreatic
cancer patients have estimated that the founding somatically acquired mutation occurs
around a median of ~7.1 years (3.3-12.2 years) before the establishment of a PanIN
lesion, while development to adenocarcinoma occurs over a period of ~4.3 years (2.3-7.2
years)406. Thus, the acquisition of driver mutations is marked by a relatively long latent
period prior to becoming fixed in the population through cell division.
KRAS mutations are the initiating genetic event in PDAC, and indeed are highly
prevalent as the sole founding mutation in early PanIN lesions407. Genetic studies have
demonstrated that over 90% of PDAC contains activating KRAS mutations408. KRAS
mutations occur at several residues, with G12D being most prevalent (41% of KRAS-
mutated PDAC), followed by G12V (34%), G12R (16%), Q61H (3.9%) and other
alleles409. Pancreatic cancers can also acquire mutations in different Ras isoforms
(HRAS, NRAS) that may have isoform-specific intracellular signaling outputs410. An open
question is whether the wild-type KRAS allele plays a causal role in oncogenic
transformation409,411. One report documented the loss of heterozygosity of the wild-type
KRAS allele, suggesting that it may have tumor-suppressive functions412. However, other
studies have observed oncogenic roles for wild-type KRAS, NRAS or HRAS in KRAS-
mutated pancreatic cancer cell lines413,414. A second outstanding question that remains

63
to be answered is how KRAS mutations leads to the outgrowth of early lesions, as studies
from mouse models have suggestive that Kras by itself induces PanIN formation with
relatively long latency415,416. Indeed, retrospective autopsy studies have revealed that
PanIN frequency ranges from 18-28% in otherwise normal individuals417,418. The answer
for the development of early PanINs may lie in tumor-induced microenvironmental
changes, as Kras signaling can lead to GM-CSF production, and recruitment of
inflammatory IL-17+ CD4+ T cells419,420.
While KRAS mutations are acquired before the PanIN stages, a number of
additional genetic events occur during PanIN progression. Mutational studies by the
Cancer Genome Atlas (TCGA) of 150 surgically resected (mostly stage I-III) patient
samples revealed that TP53 (73%), SMAD4 (32%) and CDKN2A (30%) are the most
recurrently mutated genes in PDAC, and are frequently co-mutated with KRAS408. Loss
of these three tumor suppressors is well-established in the progression of PDAC
(reviewed in 391,421).
Genetically engineered mouse models such as LSL-KrasG12D/+; LSL-Trp53R172H/+;
Pdx-1-Cre (KPC) mouse have been crucial in evaluating the role of putative oncogenes
and tumor suppressor genes in PDAC progression422,423. In the KPC model, Cre-mediated
recombination of an oncogenic Kras allele and a dominant-negative point mutant Trp53
allele in pancreatic tissue progenitor cells leads to the development of multifocal
pancreatic lesions around 10 weeks after birth, and progression to frank adenocarcinoma
and distant metastatic disease. Careful examination of this mouse model has led to a
“genetic progression” model, where oncogenic Kras activation and telomere shortening
drives the initial development PanIN I lesions. The loss of CDKN2A occurs during the

64
transition to PanIN II lesions, while TP53, SMAD4 alterations that lead to PanIN III and
frank adenocarcinoma424. Whether a genetic basis for metastatic spread exists remains
an open question, as primary adenocarcinoma and metastatic samples have shown a
surprising high degree of overlap in somatic mutations425,426. Alternative hypotheses such
as an altered epigenetic landscape have been put forward427, but remain to be further
explored.
In addition to these top four recurrently mutated genes, PDAC samples also
contain many less frequently recurrent alterations (<10% of patients). These alterations
are associated with diverse biological pathways, such as Kras-MAPK, Wnt, Notch, and
TGF-b signaling, regulation of the cell cycle, transcriptional control by epigenetic
modifiers, and repair of DNA damage408,421.
1.5.2. The pancreatic tumor microenvironment
Over the course of histopathological disease progression, pancreatic tumors
interact extensively with their tumor microenvironment. The PDAC stroma milieu is
marked by desmoplasia (a dense fibrotic reaction), poor vascularization, and contains
distinct populations of stromal and immune cells. In aggregate, stromal components can
account for more than 90% of the total tumor volume428.
Cancer-associated fibroblasts
Pancreatic stellate cells (PSCs) are myofibroblast-lineage cells that compromise
the majority of the stromal compartment in PDAC. In the healthy pancreas, PSCs are
located basolateral to acini and in perivascular regions, where they are involved in vitamin
65
A homeostasis, amylase secretion and preservation of pancreatic tissue integrity429.
Under certain inflammatory and stress conditions, including in the pancreatic tumor
microenvironment, PSCs can become activated, leading to the upregulation of a-smooth
muscle actin (a-SMA) and fibroblast activation protein-a (FAP-a). Activated PSCs acquire
proliferative capacity, can produce growth factors that stimulate tumor proliferation and
invasive motility, and extensively modulate the ECM. PSC-derived ECM components,
such as collagen, generate the characteristic desmoplasia observed in PDAC430. In the
KPC GEMM it was shown that FAP-a+ fibroblasts mediate T cell exclusion through the
CXCL12 chemokine431. Depletion (or pharmacological inhibition) of FAP-a+ fibroblasts
restored the efficacy of immune checkpoint inhibitor therapy in this model431.
However, PSCs are not the only cancer-associated fibroblast population present
in PDAC. Rather, CAFs constitute a heterogenous group of cells that includes
mesenchymal stem cells, bone-marrow derived cells, and resident activated
fibroblasts432,433. Moreover, CAFs are highly plastic and are capable of transdifferentiating
into other cell types, such as chondrocytes, adipocytes, myocytes and endothelial cells,
which adds further complexity to delineating these populations432.
Although CAFs were initially suggested to have pro-tumorigenic roles in PDAC,
this view has been challenged more recently. Early Kras-mutant lesions secrete abundant
Hedgehog (Hh) ligands, which were shown to promote stroma differentiation, and
therapeutic resistance to gemcitabine434–436. Inhibition of Hh improved vascularization,
elevated drug concentrations in the tumor microenvironment and extended overall
survival of KPC mice435. However, the clinical results with Hh inhibitors were
disappointing, and even led to premature trial termination due to decreased survival in

66
the experimental arm (gemcitabine + IPI-926)437. Mechanistic studies with conditional Hh
gene knockout, as well as drug studies and CAF depletion studies in GEMMs of PDAC
have demonstrated that tumors acquire a more undifferentiated morphology under these
settings438,439, which may explain their increased aggressive tumor growth. Thus, CAFs
may have both tumor promoting functions through the induction of aberrant vasculature,
and tumor restraining functions through paracrine maintenance of cancer cell
differentiation. However, a number of questions remain to be addressed in this field432.
Tumor-associated macrophages
In addition to a heterogenous population of CAFs, the pancreatic stroma also
contains abundant innate and adaptive immune cells. Macrophages are one of the most
abundant immune cells in human PDAC, and are also highly prevalent in genetically
engineered mouse models. As described in section 1.4.4, macrophage differentiation is
a plastic process; the ‘polarization’ of a macrophage is highly dependent on inflammatory
factors in the microenvironment. In pancreatic cancers, tumor-associated macrophages
have been reported to acquire immunosuppressive markers such as CD86, CD206
(mannose receptor), and IL-10, which are typically associated with a “M2” fate440. A
number of different tumor-promoting functions have been attributed to TAMs in pancreatic
cancer, including driving early tumor cell differentiation (acinar-to-ductal metaplasia)441–
443, remodeling of the ECM441,443, and mediating resistance to gemcitabine444. Given the
tumor-promoting roles of TAMs, several studies have investigated the impact of
macrophage depletion. Inhibition of colony-stimulating factor 1 receptor (CSF-1R), which
is involved in macrophage migration and proliferation in peripheral tissues445, selectively
67
reduced M2 TAM numbers, reprogrammed macrophage polarization to a less T cell-
suppressive phenotype and enhanced immune checkpoint therapy in an orthotopic model
of pancreas cancer446. Similar therapeutic responses were observed in the KPC GEMM,
where CSF-1R reprogrammed macrophages to enhance local adaptive immune
responses, and extended overall survival of these mice264. Consistent with a role in
promoting tumor invasion, macrophage depletion in KPC mice with clodronate led to a
reduction in metastases447. Interestingly, pancreatic cancer cells are capable of recruiting
macrophages upon metastasis to the liver, which resulted in extensive stromal and fibrotic
responses in this distant site448. In human PDAC, the presence of CD68+ TAMs in human
PDAC is prognostic for an increased risk for metastasis440,449. However, absence of TAMs
can also lead to decreases in angiogenesis and T cell infiltration447, highlighting that TAMs
have pleiotropic functions in the TME. This is further illustrated by CD40 agonist
therapeutic responses in PDAC mice, which were shown to be macrophage-
dependent450.
Myeloid-derived suppressor cells and tumor-associated neutrophils
In addition to the tumor-promoting roles of TAMs, the PDAC TME is also infiltrated
by a number of other myeloid cell types, such as myeloid-derived suppressor cells
(MDSCs), and neutrophils. A number of studies have investigated the recruitment of these
innate cells to the PDAC TME through chemokine receptors or tumor-derived cytokines.
In the KPC and in an orthotopic pancreatic model, MDSC recruitment is mediated
through the secretion of granulocyte-macrophage colony-stimulating factor (GM-
CSF)451,452. GM-CSF induced the differentiation and proliferation of splenic precursors

68
into Gr1+CD11b+ cells, which were capable of suppressing T cell function in vitro452,453.
Abrogation of MDSC recruitment through knockdown of GM-CSF expression or
neutralization of GM-CSF reduced pancreatic tumor growth451,452, and was accompanied
by an increase in CD8+ T cell infiltration451.
The chemokine receptor CXCR2 is a critical regulator of MDSC and neutrophil
migration454,455. Genetic deletion of CXCR2 abrogated the seeding of liver metastases
and extended survival of KPC mice456. Similarly, CXCR2 inhibition in an orthotopic model
of PDAC reduced tumor burden by decreasing tumor-associated neutrophil infiltration into
the tumor microenvironment457. Combination therapy with FOLFIRINOX (the standard of
care for metastatic PDAC) led to improvements in the overall survival of KPC tumors, and
CCR2 blockade (abrogating TAM recruitment) further enhanced these therapeutic
effects457.
T cell infiltration
Several T cell subsets, including effector CD8+ T cells, conventional CD4+ T cells,
and T regulatory cells can infiltrate pancreatic tumors458. The presence of cytotoxic CD8+
and effector CD4+ tumor infiltrating T cells can be used to stratify patient outcomes458.
Analyses of TILs isolated from human PDAC samples (including CD8+ T cells and Tregs)
revealed expression of co-stimulatory and co-inhibitory receptors (CD137/4-1BB, PD-1,
LAG-3, TIM-3, and CD244)459 and CD45RO+460, suggesting that these T cells are
antigen-experienced and may be tumor-reactive.
Within the TME, T cells have been shown to predominantly localize to the tumor
stroma (a sign of immune exclusion), possibly caused by ECM-dysregulated chemokine

69
gradients459,461. Observations in PDAC GEMMs indicate that T cell tumor exclusion can
be mediated by CXCL12-expressing FAP+ fibroblasts431,462. Additionally, CD4+ TIL
recruitment may be regulated through Ly6Clow F4/80+ TAMs463. Depletion of TAMs, in
combination with CD40 agonists and gemcitabine, is capable of restoring CD4+ and
CD8+ T cell infiltration in KPC mice463.
Non-canonical gd CD4+ T cells play a pro-tumorigenic role through the secretion
of pro-inflammatory IL-17 cytokines, and suppression of adaptive immune responses.
Gamma delta T cells have been suggested to be the dominant T cells in human PDAC460.
PanIN initiation appears to be particularly dependent on these gd CD4+ T cells, as genetic
deletion of IL-17, Tcrd or gd T cell depletion led to delayed tumor kinetics in KC mice420,460.
Pancreatic gd T cells upregulated co-inhibitory ligands (PD-L1, and Galectin-9), which
could be therapeutically targeted to reduce growth of orthotopically transplanted KPC
tumors460.
Tregs can also contribute to IL-17 in the TME by acquiring a RORgt+Foxp3+
phenotype464. In human PDAC, Tregs are actively recruited to the TME and constitute a
significant fraction of the T cell infiltrate465. Knockdown of Ccl5 expression in a pancreatic
transplant model reduced the migration of CCR5+ Tregs into the TME, and slowed tumor
growth374. Similarly, depletion of Tregs (by anti-CD25 antibody therapy) in combination
with KrasG12D vaccination led to reduced PanIN formation, and extended overall survival
of KPC mice466.

70
1.5.3. Immunotherapy in pancreatic cancer
Combination chemotherapy for the treatment of metastatic pancreatic cancer
provides limited clinical benefit, and overall patient survival remains poor395. Therefore,
novel therapeutic agents for the treatment of pancreatic cancer are urgently needed.
Immune checkpoint inhibitors (ICIs) have revolutionized cancer therapy over the last
decade, demonstrating that targeting the immune system in cancer is safe and can lead
to durable, long-lasting anti-tumor responses5. Therefore, harnessing the immune system
in PDAC may improve therapeutic outcomes for patients with this devastating disease.
Antigenicity of PDAC
A critical question in harnessing the immune system for therapeutic use is whether
pancreatic tumors contain sufficient (neo)antigens that can elicit T cell responses.
Although pancreatic cancer has historically considered to be “antigenically poor” based
its relative low overall mutation burden467, recent studies have suggested that PDAC can
indeed harbor antigens6,468. An analysis of the TCGA, and International Cancer Genome
Consortium (ICGC) datasets has revealed that almost all patient samples contain
neoantigens (ranging from 4-4000 per sample)468. Among these, KRAS codon 12
mutations (G12D, and G12V) are the most frequently occurring. Therapeutic benefit with
KRASG12D-reactive adoptive T cell therapy in a patient carrying the (infrequent) HLA-
C*08:02 allele has been demonstrated469, suggesting that KRAS neoantigens could be
therapeutically exploited. A study of the neoantigen quality in rare long-term survivors
(median survival 6 years) revealed a median of 38 predicted neoantigens per tumor6. In
this patient cohort, the presence of CD8+ T cell infiltrate and higher neoantigen quantity
71
stratified patients with a better disease outcome6. Intriguingly, peripheral T cell reactivity
to PDAC neoepitopes and microbial epitopes was observed in patients with a high
neoantigen burden6, suggesting that structural resemblance between the two classes
(“microbial mimicry”) may drive the particular immunogenic nature of neoantigens in this
setting. At least a subset of pancreatic cancer patients thus harbor antigenic tumors that
are amenable to immunotherapeutic approaches.
Clinical landscape of immunotherapy in PDAC
The development of immune checkpoint inhibitors (ICIs) reached a milestone with
the approvals of an anti-CTLA-4 antibody (ipilimumab) in 2011, and an anti-PD-1 antibody
(pembrolizumab) in 2014. Since these initial approvals, several ICIs have been approved
for NSCLC, renal carcinoma, small cell lung cancer (SCLC), triple negative breast cancer,
MMR-deficient cancers, Hodgkin’s lymphoma, and other types of cancer470.
Unfortunately, these clinical successes have largely failed to translate to
pancreatic cancer to date. A number of different ICIs have been investigated as
monotherapy or combination therapy for the treatment of metastatic PDAC.
The sole clinical success to date was achieved with pembrolizumab in a clinical
“basket” trial enrolling a total of 86 patients with MMR-deficient cancers (colorectal,
endometrial, pancreatic, gastric, prostate and a number of other cancers). Although
PDAC patient numbers were small (n=8), 2 complete responses (CRs), 3 partial
responses (PRs), and 1 stable disease (SD) response were reported. On the basis of the
positive outcomes achieved in this trial, the FDA approved pembrolizumab for treatment
of MMR-deficient cancers in 2017471.

72
A combination chemoimmunotherapy approach has shown promise in an early
phase Ib study, although the data is not yet fully mature. In an interim report investigating
gemcitabine+ nab-paclitaxel + a CD40 agonist (APX005M) with or without nivolumab
(anti-PD-1), 14 out of 24 (58%) evaluable patients at the cut-off had achieved PRs, while
8 patients achieved disease stabilization472. Full results of this trial are highly anticipated.
Two clinical trials have investigated ICI monotherapy in MMR-proficient PDAC
patients. A phase II trial conducted in 2010 evaluated anti-CTLA-4 (ipilimumab), but did
not observe any responses in the 20 evaluable patients by standard RECIST criteria473.
However, two patients showed minor responses, and the best responder (30% tumor
regression), achieved ~9 months of clinical benefit473. A second phase I trial evaluated
the safety and tolerability of anti-PD-L1 (BMS-936559) in 14 advanced-stage pancreatic
cancer patients, but no objective responses were noted in the trial474.
Three clinical studies have investigated ICIs in combination with chemotherapy. A
phase I study investigating pembrolizumab plus chemotherapy (gemcitabine + nab-
paclitaxel for the PDAC arm) included 11 pancreatic cancer patients475. The study only
achieved modest efficacy signals, achieving 2 PRs, 6 SDs, 2 PDs in this cohort.
Unfortunately, nti-PD-1 did not seem to provide any additional clinical benefit in this
setting, as an 18% ORR is similar to gemcitabine + nab-paclitaxel combination therapy.
A similar conclusion was drawn from a phase I study investigating ipilimumab plus
gemcitabine476. In this trial, 3 patients (out of 21 patients) achieved a PR, while 7 patients
achieved SDs. The 14% ORR is in line with responses to gemcitabine alone. A third phase
I study combined anti-CTLA-4 (tremelimumab) plus gemcitabine, but also reported
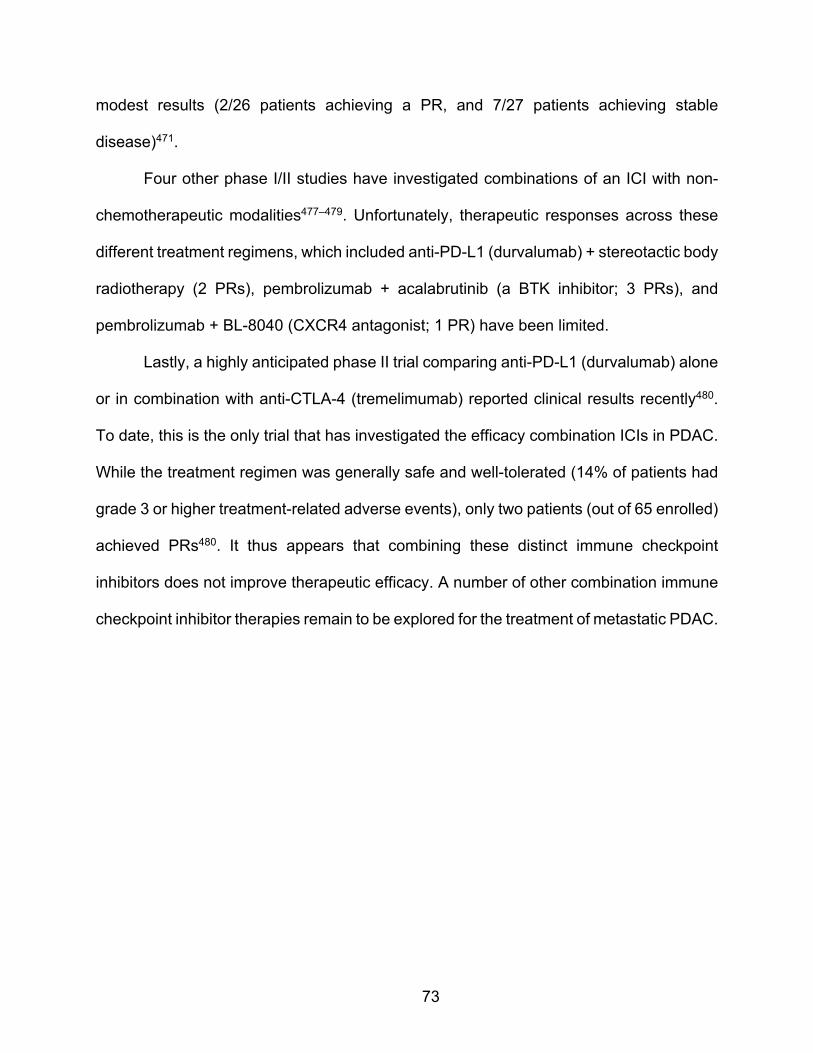
73
modest results (2/26 patients achieving a PR, and 7/27 patients achieving stable
disease)471.
Four other phase I/II studies have investigated combinations of an ICI with non-
chemotherapeutic modalities477–479. Unfortunately, therapeutic responses across these
different treatment regimens, which included anti-PD-L1 (durvalumab) + stereotactic body
radiotherapy (2 PRs), pembrolizumab + acalabrutinib (a BTK inhibitor; 3 PRs), and
pembrolizumab + BL-8040 (CXCR4 antagonist; 1 PR) have been limited.
Lastly, a highly anticipated phase II trial comparing anti-PD-L1 (durvalumab) alone
or in combination with anti-CTLA-4 (tremelimumab) reported clinical results recently480.
To date, this is the only trial that has investigated the efficacy combination ICIs in PDAC.
While the treatment regimen was generally safe and well-tolerated (14% of patients had
grade 3 or higher treatment-related adverse events), only two patients (out of 65 enrolled)
achieved PRs480. It thus appears that combining these distinct immune checkpoint
inhibitors does not improve therapeutic efficacy. A number of other combination immune
checkpoint inhibitor therapies remain to be explored for the treatment of metastatic PDAC.

74
1.6. Synopsis
Cancer immunology has a long and storied history. In this introductory chapter, the
roots of this field were traced back to clinical observations made by William Coley in the
late 1890s. However, the immunological concepts (e.g. vaccination) employed by Coley
date even further back to Edward Jenner, and the practice of variolation during the 18th
century. While the idea that the immune system is capable of recognizing the body’s own
cancerous cells has been challenged several times, notably in the late 1920s and the
1970s, these rejections have ultimately proved to be premature. Our understanding of the
process of immunosurveillance, as well as the cellular players involved in the anti-tumor
immune response, has enabled the clinical application of increasingly sophisticated
immunotherapeutic strategies.
The complex, multistep processes involved in the anti-tumor immune response
were described in detail in this introductory chapter. Tumor immune responses begin with
the release of tumor antigens, which are presented by specialized innate immune cells to
the adaptive immune arm in lymphoid tissues. This then triggers the clonal expansion and
migration of effector T cells to the tumor microenvironment, and culminates in the killing
of cancer cells and the release of new antigens. However, immune responses are often
thwarted by a number of tumor-intrinsic mechanisms and tumor-extrinsic factors, which
enable tumor proliferation to continue unchecked. Tumors may deregulate antigen
presentation, activate oncogenic pathways that lead to exclusion of T cells from the tumor
microenvironment, or simply suppress the expression of tumor antigens. The immune
system may also shape the tumor by selectively eliminating immunogenic cancer clones,

75
fueling immune escape of cancer cells that have evolved mechanisms of evading immune
cell recognition. Additionally, several immune and non-immune cells may be recruited to
the tumor microenvironment that further limit effective anti-tumor immune responses.
Finally, T cell proliferation and persistence is inherently self-limited, through the action of
immune co-inhibitory receptors that dampen T cell functionality. Indeed, much of the
recent clinical successes with immunotherapy has been achieved by counteracting the
inhibitory effects of these receptors expressed on T cells, rather than directly
therapeutically targeting the tumor.
While there much to celebrate about the widespread impact immunotherapy has
made on the clinical practice in many types of hematopoietic and epithelial cancers,
pancreatic cancer has largely remained refractory to current immune-based approaches.
Pancreatic cancer is driven by the acquisition of defined genetic alterations and
undergoes a histopathological progression culminating in invasive adenocarcinomas
capable of metastasizing to distant tissue sites. Over the course of pancreatic tumor
progression, pancreatic tumors recruit additional (non-)immune cells that contribute to a
desmoplastic, immunosuppressive tumor microenvironment.
The unique therapeutic challenge posed by pancreatic cancer is perhaps most
clearly illustrated by multiple immunotherapeutic approaches yet to make a clinical
impact. A key part of solving this challenge is translation of biological insights gained from
preclinical models to effective strategies to combat this devastating disease in the clinic.
Chapter 2 will describe the generation and development of two novel mouse
models of pancreatic ductal adenocarcinoma. Extensive characterization of these models
uncovered unexpected roles for immunoediting and T cell dysfunction in driving

76
immunoevasion in pancreatic cancer, and has revealed potentially clinically actionable
therapeutic strategies. Chapter 3 will discuss relevance of these results in the broader
context of the cancer immunology field, and concludes with a perspective on the promise
of immunotherapy in pancreatic cancer.

77
1.7. References
1. Hanahan, D. & Weinberg, R. A. Hallmarks of cancer: The next generation. Cell vol.
144 646–674 (2011). 2. Schreiber, R. D., Old, L. J. & Smyth, M. J. Cancer immunoediting: Integrating
immunity’s roles in cancer suppression and promotion. Science (80-. ). 331, 1565–1570 (2011).
3. Van Der Bruggen, P. et al. A gene encoding an antigen recognized by cytolytic T lymphocytes on a human melanoma. Science (80-. ). 254, 1643–1647 (1991).
4. Leach, D. R., Krummel, M. F. & Allison, J. P. Enhancement of antitumor immunity by CTLA-4 blockade. Science (80-. ). 271, 1734–1736 (1996).
5. Hamid, O. et al. Five-year survival outcomes for patients with advanced melanoma treated with pembrolizumab in KEYNOTE-001. Ann. Oncol. 30, 582–588 (2019).
6. Balachandran, V. P. et al. Identification of unique neoantigen qualities in long-term survivors of pancreatic cancer. Nature 551, S12–S16 (2017).
7. Piana, R. A Snapshot of Early Immunotherapy - The ASCO Post. https://www.ascopost.com/issues/october-25-2015/a-snapshot-of-early-immunotherapy/ (2015).
8. Gross, C. P. & Sepkowitz, K. A. The myth of the medical breakthrough: Smallpox, vaccination, and Jenner reconsidered. Int. J. Infect. Dis. 3, 54–60 (1998).
9. Best, M., Neuhauser, D. & Slavin, L. ‘Cotton Mather, you dog, dam you! I’l inoculate you with this; with a pox to you’: Smallpox inoculation, Boston, 1721. Quality and Safety in Health Care vol. 13 82–83 (2004).
10. Riedel, S. Edward Jenner and the History of Smallpox and Vaccination. Baylor Univ. Med. Cent. Proc. 18, 21–25 (2005).
11. Jessy, T. Immunity over inability: The spontaneous regression of cancer. J. Nat. Sci. Biol. Med. 2, 43–49 (2011).
12. Oiseth, S. J. & Aziz, M. S. Cancer immunotherapy: a brief review of the history, possibilities, and challenges ahead. J. Cancer Metastasis Treat. 3, 250 (2017).
13. Kienle, G. S. Fever in Cancer Treatment: Coley’s Therapy and Epidemiologic Observations. Glob. Adv. Heal. Med. 1, 92–100 (2012).
14. Coley, W. B. The Treatment of Malignant Tumors by Repeated Inoculations of Erysipelas: With a Report of Ten Original Cases. J. Am. Med. Assoc. XX, 615–616 (1893).
15. Tsung, K. & Norton, J. A. Lessons from Coley’s Toxin. Surg. Oncol. 15, 25–28 (2006).
16. Coley Nauts, H., Swift, W. E. & Coley, B. L. The Treatment of Malignant Tumors by Bacterial Toxins as Developed by the Late William B. Coley, M.D., Reviewed in the Light of Modern Research. Cancer Res. 6, 205–216 (1946).
17. McCarthy, E. F. The toxins of William B. Coley and the treatment of bone and soft-tissue sarcomas. Iowa Orthop. J. 26, 154–158 (2006).
18. Ehrlich, P. Ueber den jetzigen Stand der Karzinomforschung. Ned. Tijdschr. Geneeskd. vol. 5 273–290 (1909).

78
19. Triolo, V. A. Nineteenth Century Foundations of Cancer Research Origins of Experimental Research. Cancer Res. 24, 4–27 (1964).
20. Little, C. C. & Tyzzer, E. E. Further experimental studies on the inheritance of susceptibility to a Transplantable tumor, Carcinoma (J. W. A.) of the Japanese waltzing Mouse. J. Med. Res. 33, 393 (1916).
21. Roopenian, D., Young Choi, E. & Brown, A. The immunogenomics of minor histocompatibility antigens. Immunol. Rev. 190, 86–94 (2002).
22. Scott, O. C. A. Tumor Transplantation and Tumor Immunity: A Personal View. Cancer Res. 51, 757–763 (1991).
23. Woglom, W. H. Immunity to Transplantable Tumours. Cancer Rev. 4, 129–214 (1929).
24. Parish, C. R. Cancer immunotherapy: The past, the present and the future. Immunol. Cell Biol. 81, 106–113 (2003).
25. Thorsby, E. A short history of HLA. Tissue Antigens 74, 101–116 (2009). 26. Gorer, P. A., Lyman, S. & Snell, G. D. Studies on the genetic and antigenic basis
of tumour transplantation: Linkage between a histocom patibility gene and ‘ fused ’ in mice. Proc. R. Soc. B 499–505 (1948).
27. Billingham, R. E., Brent, L. & Medawar, P. B. ‘Actively acquired tolerance’ of foreign cells. Nature 172, 603–606 (1953).
28. Billingham, R. E., Brent, L. & Medawar, P. B. Quantitative Studies on Tissue Transplantation Immunity. III. Actively Acquired Tolerance. Philos. Trans. R. Soc. Lond. B. Biol. Sci. 239, 357–414 (1956).
29. Simpson, E. Medawar’s legacy to cellular immunology and clinical transplantation: a commentary on Billingham, Brent and Medawar (1956) ‘Quantitative studies on tissue transplantation immunity. III. Actively acquired tolerance’. Philos. Trans. R. Soc. B Biol. Sci. 370, 20140382 (2015).
30. Burnet, F. M. The Production of Antibodies. A Review and a Theoretical Discussion. (Macmillan & Co., 1941).
31. Gross, L. Intradermal Immunization of C3H Mice against a Sarcoma That Originated in an Animal of the Same Line. Cancer Res. 3, (1943).
32. Foley, E. J. Antigenic Properties of Methylcholanthrene-induced Tumors in Mice of the Strain of Origin. Cancer Res. 13, 835–837 (1953).
33. Prehn, R. T. & Main, J. M. Immunity to Methylcholanthrene-Induced Sarcomas. 18, 769–778 (1957).
34. Klein, G., Sjögren, H. O., Klein, E. & Hellstrom, K. E. Demonstration of Resistance against Methylcholanthrene-induced Sarcomas in the Primary Autochthonous Host. Cancer Res. 20, 1561–1572 (1960).
35. Burnet, M. Cancer - A Biological Approach. Br. Med. J. 841–847 (1957) doi:10.1136/bmj.1.5023.841.
36. Burnet, F. M. The Concept of Immunological Surveillance. in Progress in experimental tumor research. vol. 13 1–27 (Karger Publishers, 1970).
37. Thomas, L. Cellular and humoral aspects of the hypersensitive states. Cell. Humoral Asp. Hypersensitive States 529–532 (1959) doi:10.1111/j.0954-6820.1961.tb00220.x.
38. Dunn, G. P., Old, L. J. & Schreiber, R. D. The Three Es of Cancer Immunoediting. Annu. Rev. Immunol. 22, 329–360 (2004).

79
39. Old, L. J. & Boyse, E. A. Immunology of Experimental Tumors. Annu. Rev. Med. 15, 167–186 (1964).
40. Flanagan, S. P. ‘Nude’, a new hairless gene with pleiotropic effects in the mouse. Genet. Res. 8, 295–309 (1966).
41. Pantelouris, E. M. Absence of thymus in a mouse mutant. Nature vol. 217 370–371 (1968).
42. Stutman, O. Tumor development after 3-methylcholanthrene in immunologically deficient athymic-nude mice. Science (80-. ). 183, 534–536 (1974).
43. Stutman, O. Chemical carcinogenesis in nude mice: Comparison between nude mice from homozygous matings and heterozygous matings and effect of age and carcinogen dose. J. Natl. Cancer Inst. 62, 353–358 (1979).
44. Hewitt, H. B., Blake, E. R. & Walder, A. S. A critique of the evidence for active host defence against cancer, based on personal studies of 27 murine tumours of spontaneous origin. Br. J. Cancer 33, 241–259 (1976).
45. Hunig, T. T-cell function and specificity in athymic mice. Immunol. Today 4, 84–87 (1983).
46. Ikehara, S., Pahwa, R. N., Fernandes, G., Hansen, C. T. & Good, R. A. Functional T cells in athymic nude mice. Proc. Natl. Acad. Sci. U. S. A. 81, 886–888 (1984).
47. Maleckar, J. R. & Sherman, L. A. The composition of the T cell receptor repertoire in nude mice. J. Immunol. 138, 3873–3876 (1987).
48. Chiossone, L., Dumas, P. Y., Vienne, M. & Vivier, E. Natural killer cells and other innate lymphoid cells in cancer. Nature Reviews Immunology vol. 18 671–688 (2018).
49. Souza-Fonseca-Guimaraes, F., Cursons, J. & Huntington, N. D. The Emergence of Natural Killer Cells as a Major Target in Cancer Immunotherapy. Trends Immunol. 40, 142–158 (2019).
50. Shimasaki, N., Jain, A. & Campana, D. NK cells for cancer immunotherapy. Nat. Rev. Drug Discov. 19, 200–218 (2020).
51. Ward, J. P., Gubin, M. M., Schreiber, R. D. & States, U. Therapeutically Induced Immune Responses to Cancer. Adv Immunol. 1–40 (2016) doi:10.1016/bs.ai.2016.01.001.The.
52. Kaplan, D. H. et al. Demonstration of an interferon γ-dependent tumor surveillance system in immunocompetent mice. Proc. Natl. Acad. Sci. U. S. A. 95, 7556–7561 (1998).
53. Smyth, M. J. et al. Differential tumor surveillance by natural killer (NK) and NKT cells. J. Exp. Med. 191, 661–668 (2000).
54. Shankaran, V. et al. IFNγ, and lymphocytes prevent primary tumour development and shape tumour immunogenicity. Nature 410, 1107–1111 (2001).
55. Street, S. E. A., Cretney, E. & Smyth, M. J. Perforin and interferon-γ activities independently control tumor initiation, growth, and metastasis. Blood 97, 192–197 (2001).
56. Gowans, J. L., McGregor, D. D. & Cowen, Di. M. Initiation of immune responses by small lymphocytes. Nature 196, 651–655 (1962).
57. Miller, J. F. A. P. Immunological function of the thymus. Lancet 278, 748–749 (1961).
58. Miller, J. F. A. P. Effect of neonatal thymectomy on the immunological

80
responsiveness of the mouse. Proc. R. Soc. London. Ser. B. Biol. Sci. 156, 415–428 (1962).
59. Miller, J. F. A. P. Immunological Significance of the Non-Antigenicity of Synthetic. Nature 195, 1318–1319 (1962).
60. Miller, J. F. A. P., Doak, S. M. A. & Cross, A. M. Role of the Thymus in Recovery of the Immune Mechanism in the Irradiated Adult Mouse. Exp. Biol. Med. 112, 785–792 (1963).
61. Miller, J. F. A. P. Effect of Thymectomy in Adult MIce on Immunlogical Responsiveness. Nature 208, 1337–1338 (1965).
62. Mitchell, G. F. & Miller, J. F. Immunological activity of thymus and thoracic-duct lymphocytes. Proc. Natl. Acad. Sci. U. S. A. 59, 296–303 (1968).
63. Miller, J. F. & Mitchell, G. F. Cell to cell interaction in the immune response. I. Hemolysin-forming cells in neonatally thymectomized mice reconstituted with thymus or thoracic duct lymphocytes. J. Exp. Med. 128, 801–820 (1968).
64. Mitchell, G. F. & Miller, J. F. Cell to cell interaction in the immune response. II. The source of hemolysin-forming cells in irradiated mice given bone marrow and thymus or thoracic duct lymphocytes. J. Exp. Med. 128, 821–837 (1968).
65. Miller, J. F. A. P. & Sprent, J. Thymus-derived cells in mouse thoracic duct lymph. Nature 230, 267–271 (1971).
66. Boyse, E. A., Miyazawa, M., Aoki, T. & Old, L. J. Ly-A and Ly-B: two systems of lymphocyte isoantigens in the mouse. Proc. R. Soc. London. Ser. B. Biol. Sci. 170, 175–193 (1968).
67. Raff, M. C. Surface Antigenic Markers for Distinguishing T and B Lymphocytes in Mice. Transpl. Rev. 6, 52–80 (1971).
68. Kisielow, P. et al. Ly antigens as markers for functionally distinct subpopulations of thymus-derived lymphocytes of the mouse. Nature 253, 219–220 (1975).
69. Cantor, H. & Boyse, E. A. Functional subclasses of T lymphocytes bearing different Ly antigens. I. The generation of functionally distinct T cell subclasses is a differentiative process independent of antigen. J. Exp. Med. 141, 1376–1389 (1975).
70. Köhler, G. & Milstein, C. Continuous cultures of fused cells secreting antibody of predefined specificity. Nature 256, 495–497 (1975).
71. Herzenberg, L. A. et al. The history and future of the Fluorescence Activated Cell Sorter and flow cytometry: A view from Stanford. in Clinical Chemistry vol. 48 1819–1827 (2002).
72. Mishell, R. I. & Dutton, R. W. Immunization of dissociated spleen cell cultures from normal mice. J. Exp. Med. 126, 423–442 (1967).
73. Steinman, R. M. & Cohn, Z. A. Identification of a novel cell type in peripheral lymphoid organs of mice: I. Morphology, quantitation, tissue distribution. J. Exp. Med. 137, 1142–1162 (1973).
74. Steinman, R. M. & Cohn, Z. A. Identification of a novel cell type in peripheral lymphoid organs of mice: II. Functional properties in vitro. J. Exp. Med. 139, 380–397 (1974).
75. Nussenzweig, M. C., Steinman, R. M., Gutchinov, B. & Cohn, Z. A. Dendritic cells are accessory cells for the development of anti-trinitrophenyl cytotoxic T lymphocytes. J. Exp. Med. 152, 1070–1084 (1980).

81
76. Nussenzweig, M. C., Steinman, R. M., Witmer, M. D. & Gutchinov, B. A monoclonal antibody specific for mouse dendritic cells. Proc. Natl. Acad. Sci. U. S. A. 79, 161–165 (1982).
77. Steinman, R. M., Gutchinov, B., Witmer, M. D. & Nussenzweig, M. C. Dendritic cells are the principal stimulators of the primary mixed leukocyte reaction in mice. J. Exp. Med. 157, 613–627 (1983).
78. Lecture, N. & Nussenzweig, M. C. Ralph Steinman and the discovery of dendritic cells. (2011).
79. Porter, R. R. Chemical structure of γ-globulin and antibodies. Br. Med. Bull. 19, 197–201 (1963).
80. Cunningham, B. A., Pflumm, M. N., Rutishauser, U. & Edelman, G. M. Subgroups of amino acid sequences in the variable regions of immunoglobulin heavy chains. Proc. Natl. Acad. Sci. U. S. A. 64, 997–1003 (1969).
81. Hozumi, N. & Tonegawa, S. Evidence for somatic rearrangement of immunoglobulin genes coding for variable and constant regions. Proc. Natl. Acad. Sci. U. S. A. 73, 3628–3632 (1976).
82. Miller, J. F. A. P. & Sadelain, M. The journey from discoveries in fundamental immunology to cancer immunotherapy. Cancer Cell 27, 439–449 (2015).
83. van Epps, H. L. Rules of engagement: the discovery of MHC restriction. J. Exp. Med. 201, 665 (2005).
84. Zinkernagel, R. M. & Doherty, P. C. Restriction of in vitro T cell-mediated cytotoxicity in lymphocytic choriomeningitis within a syngeneic or semiallogeneic system. Nature 248, 701–702 (1974).
85. Doherty, P. C. & Zinkernagel, R. M. Enhanced immunological surveillance in mice heterozygous at the H-2 gene complex. Nature 256, 50–52 (1975).
86. Doherty, P. C. & Zinkernagel, R. M. A biological role for the major histocompability antigens. Lancet 305, 1406–1409 (1975).
87. Townsend, A. R. M. et al. The epitopes of influenza nucleoprotein recognized by cytotoxic T lymphocytes can be defined with short synthetic peptides. Cell 44, 959–968 (1986).
88. Bjorkman, P. J. et al. The foreign antigen binding site and T cell recognition regions of class I histocompatibility antigens. Nature 329, 512–518 (1987).
89. Hedrick, S. M., Cohen, D. I., Nielsen, E. A. & Davis, M. M. Isolation of cDNA clones encoding T cell-specific membrane-associated proteins. Nature 308, 149–153 (1984).
90. Yoshikai, Y. et al. Sequence and expression of transcripts of the human T-cell receptor β- chain genes. Nature 312, 521–524 (1984).
91. Chien, Y. H. et al. A third type of murine T-cell receptor gene. Nature 312, 31–35 (1984).
92. Saito, H. et al. A third rearranged and expressed gene in a clone of cytotoxic T lymphocytes. Nature 312, 36–40 (1984).
93. Yanagi, Y., Chan, A., Chin, B., Minden, M. & Mak, T. W. Analysis of cDNA clones specific for human T cells and the α and β chains of the T-cell receptor heterodimer from a human T-cell line. Proc. Natl. Acad. Sci. U. S. A. 82, 3430–3434 (1985).
94. Oettgen, H. C., Terhorst, C., Cantley, L. C. & Rosoff, P. M. Stimulation of the T3-T cell receptor complex induces a membrane-potential-sensitive calcium influx. Cell
82
40, 583–590 (1985). 95. Gold, D. P. et al. Isolation of cDNA clones encoding the 20K non-glycosylated
polypeptide chain of the human T-cell receptor/T3 complex. Nature 324, 702 (1986).
96. Morgan, D. A., Ruscetti, F. W. & Gallo, R. Selective in vitro growth of T lymphocytes from normal human bone marrows. Science (80-. ). 193, 1007–1008 (1976).
97. Dembić, Z. et al. Transfer of specificity by murine α and β T-cell receptor genes. Nature 320, 232–238 (1986).
98. Van Pel, A. & Boon, T. Protection against a nonimmunogenic mouse leukemia by an immunogenic variant obtained by mutagenesis. Proc. Natl. Acad. Sci. U. S. A. 79, 4718–4722 (1982).
99. Weon, J. L. & Potts, P. R. The MAGE protein family and cancer. Current Opinion in Cell Biology vol. 37 1–8 (2015).
100. Van Den Eynde, B. J. & Van Der Bruggen, P. T cell defined tumor antigens. Curr. Opin. Immunol. 9, 684–693 (1997).
101. Koebel, C. M. et al. Adaptive immunity maintains occult cancer in an equilibrium state. Nature 450, 903–907 (2007).
102. Nishimura, H., Minato, N., Nakano, T. & Honjo, T. Immunological studies on PD-1-deficient mice: implication of PD-1 as a negative regulator for B cell responses. International Immunology vol. 10 (1998).
103. Chen, D. S. & Mellman, I. Oncology meets immunology: The cancer-immunity cycle. Immunity 39, 1–10 (2013).
104. Lee, J.-K., Choi, Y.-L., Kwon, M. & Park, P. J. Mechanisms and Consequences of Cancer Genome Instability: Lessons from Genome Sequencing Studies. Annu. Rev. Pathol. Mech. Dis. 11, 283–312 (2016).
105. Schumacher, T. N., Scheper, W. & Kvistborg, P. Cancer Neoantigens. Annu. Rev. Immunol. 37, 173–200 (2019).
106. Matsushita, H. et al. Cancer exome analysis reveals a T-cell-dependent mechanism of cancer immunoediting. Nature 482, 400–404 (2012).
107. Linnemann, C. et al. High-throughput epitope discovery reveals frequent recognition of neo-antigens by CD4+ T cells in human melanoma. Nat. Med. 21, 81–85 (2015).
108. van Rooij, N. et al. Tumor Exome Analysis Reveals Neoantigen-Specific T-Cell Reactivity in an Ipilimumab-Responsive Melanoma. J. Clin. Oncol. 31, e439–e442 (2013).
109. Robbins, P. F. et al. Mining exomic sequencing data to identify mutated antigens recognized by adoptively transferred tumor-reactive T cells. Nat. Med. 19, 747–752 (2013).
110. Rizvi, N. A. et al. Mutational landscape determines sensitivity to PD-1 blockade in non-small cell lung cancer. Science (80-. ). 348, 124–128 (2015).
111. Tran, E. et al. T-Cell Transfer Therapy Targeting Mutant KRAS in Cancer. N. Engl. J. Med. 375, 2255–2262 (2016).
112. Lo, W. et al. Immunologic Recognition of a Shared p53 Mutated Neoantigen in a Patient with Metastatic Colorectal Cancer. (2019) doi:10.1158/2326-6066.CIR-18-0686.
113. Kenter, G. G. et al. Vaccination against HPV-16 oncoproteins for vulvar

83
intraepithelial neoplasia. N. Engl. J. Med. 361, 1838–1847 (2009). 114. Stevanović, S. et al. Complete regression of metastatic cervical cancer after
treatment with human papillomavirus-targeted tumor-infiltrating T cells. J. Clin. Oncol. 33, 1543–1550 (2015).
115. Kelderman, S. & Kvistborg, P. Tumor antigens in human cancer control. Biochim. Biophys. Acta - Rev. Cancer 1865, 83–89 (2016).
116. Gotter, J., Brors, B., Hergenhahn, M. & Kyewski, B. Medullary Epithelial Cells of the Human Thymus Express a Highly Diverse Selection of Tissue-specific Genes Colocalized in Chromosomal Clusters. J. Exp. Med. 199, 155–166 (2004).
117. Galluzzi, L., Buqué, A., Kepp, O., Zitvogel, L. & Kroemer, G. Immunogenic cell death in cancer and infectious disease. Nature Reviews Immunology vol. 17 97–111 (2017).
118. Galluzzi, L. et al. Molecular mechanisms of cell death: Recommendations of the Nomenclature Committee on Cell Death 2018. Cell Death and Differentiation vol. 25 486–541 (2018).
119. Kroemer, G., Galluzzi, L., Kepp, O. & Zitvogel, L. Immunogenic Cell Death in Cancer Therapy. Annu. Rev. Immunol. 31, 51–72 (2013).
120. Gardner, A. & Ruffell, B. Dendritic Cells and Cancer Immunity. Trends in Immunology vol. 37 855–865 (2016).
121. Domogalla, M. P., Rostan, P. V., Raker, V. K. & Steinbrink, K. Tolerance through education: How tolerogenic dendritic cells shape immunity. Frontiers in Immunology vol. 8 1764 (2017).
122. Kaldjian, E. P., Gretz, J. E., Anderson, A. O., Shi, Y. & Shaw, S. Spatial and molecular organization of lymph node T cell cortex: a labyrinthine cavity bounded by an epithelium-like monolayer of fibroblastic reticular cells anchored to basement membrane-like extracellular matrix. International Immunology vol. 13 (2001).
123. Blattman, J. N. et al. Estimating the precursor frequency of naive antigen-specific CD8 T cells. J. Exp. Med. 195, 657–664 (2002).
124. Krummel, M. F., Bartumeus, F. & Gérard, A. T cell migration, search strategies and mechanisms. Nature Reviews Immunology vol. 16 193–201 (2016).
125. Courtney, A. H., Lo, W. L. & Weiss, A. TCR Signaling: Mechanisms of Initiation and Propagation. Trends in Biochemical Sciences vol. 43 108–123 (2018).
126. Love, P. E. & Hayes, S. M. ITAM-mediated signaling by the T-cell antigen receptor. Cold Spring Harbor perspectives in biology vol. 2 a002485 (2010).
127. Huang, J. et al. A Single peptide-major histocompatibility complex ligand triggers digital cytokine secretion in CD4+ T Cells. Immunity 39, 846–857 (2013).
128. Mariuzza, R. A., Agnihotri, P. & Orban, J. The structural basis of T-cell receptor (TCR) activation: An enduring enigma. Journal of Biological Chemistry vol. 295 914–925 (2020).
129. Malissen, B. & Bongrand, P. Early T Cell Activation: Integrating Biochemical, Structural, and Biophysical Cues. Annu. Rev. Immunol. 33, 539–561 (2015).
130. Chen, L. & Flies, D. B. Molecular mechanisms of T cell co-stimulation and co-inhibition. Nature Reviews Immunology vol. 13 227–242 (2013).
131. Baumeister, S. H., Freeman, G. J., Dranoff, G. & Sharpe, A. H. Coinhibitory Pathways in Immunotherapy for Cancer. Annu. Rev. Immunol. 34, 539–573 (2016).
132. van der Woude, L. L., Gorris, M. A. J., Halilovic, A., Figdor, C. G. & de Vries, I. J.

84
M. Migrating into the Tumor: a Roadmap for T Cells. Trends in Cancer 3, 797–808 (2017).
133. Masopust, D. & Schenkel, J. M. The integration of T cell migration, differentiation and function. Nat. Rev. Immunol. 13, 309–320 (2013).
134. Harlin, H. et al. Chemokine expression in melanoma metastases associated with CD8 + T-CeII recruitment. Cancer Res. 69, 3077–3085 (2009).
135. Andersson, Å. et al. IL-7 Promotes CXCR3 Ligand-Dependent T Cell Antitumor Reactivity in Lung Cancer. J. Immunol. 182, 6951–6958 (2009).
136. Muthuswamy, R., Corman, J. M., Dahl, K., Chatta, G. S. & Kalinski, P. Functional reprogramming of human prostate cancer to promote local attraction of effector CD8+ T cells. Prostate 76, 1095–1105 (2016).
137. Mikucki, M. E. et al. Non-redundant requirement for CXCR3 signalling during tumoricidal T-cell trafficking across tumour vascular checkpoints. Nat. Commun. 6, 1–14 (2015).
138. Carman, C. V. & Martinelli, R. T lymphocyte-endothelial interactions: Emerging understanding of trafficking and antigen-specific immunity. Front. Immunol. 6, (2015).
139. Castermans, K. & Griffioen, A. W. Tumor blood vessels, a difficult hurdle for infiltrating leukocytes. Biochimica et Biophysica Acta - Reviews on Cancer vol. 1776 160–174 (2007).
140. Carman, C. V. & Springer, T. A. Trans-cellular migration: cell-cell contacts get intimate. Current Opinion in Cell Biology vol. 20 533–540 (2008).
141. Muller, W. A. Mechanisms of Leukocyte Transendothelial Migration. Annu. Rev. Pathol. Mech. Dis. 6, 323–344 (2011).
142. Leight, J. L., Drain, A. P. & Weaver, V. M. Extracellular Matrix Remodeling and Stiffening Modulate Tumor Phenotype and Treatment Response. Annu. Rev. Cancer Biol. 1, 313–334 (2017).
143. Walker, C., Mojares, E. & Del Río Hernández, A. Role of extracellular matrix in development and cancer progression. International Journal of Molecular Sciences vol. 19 (2018).
144. Naba, A. et al. The matrisome: In silico definition and in vivo characterization by proteomics of normal and tumor extracellular matrices. Mol. Cell. Proteomics 11, (2012).
145. Henke, E., Nandigama, R. & Ergün, S. Extracellular Matrix in the Tumor Microenvironment and Its Impact on Cancer Therapy. Frontiers in Molecular Biosciences vol. 6 (2020).
146. Salmon, H. et al. Matrix architecture defines the preferential localization and migration of T cells into the stroma of human lung tumors. J. Clin. Invest. 122, 899–910 (2012).
147. Mrass, P. et al. Random migration precedes stable target cell interactions of tumor-infiltrating T cells. J. Exp. Med. 203, 2749–2761 (2006).
148. Boissonnas, A., Fetler, L., Zeelenberg, I. S., Hugues, S. & Amigorena, S. In vivo imaging of cytotoxic T cell infiltration and elimination of a solid tumor. J. Exp. Med. 204, 345–356 (2007).
149. Dieckmann, N. M. G., Frazer, G. L., Asano, Y., Stinchcombe, J. C. & Griffiths, G. M. The cytotoxic T lymphocyte immune synapse at a glance. J. Cell Sci. 129, 2881–

85
2886 (2016). 150. Stinchcombe, J. C., Majorovits, E., Bossi, G., Fuller, S. & Griffiths, G. M.
Centrosome polarization delivers secretory granules to the immunological synapse. Nature 443, 462–465 (2006).
151. Halle, S. et al. In Vivo Killing Capacity of Cytotoxic T Cells Is Limited and Involves Dynamic Interactions and T Cell Cooperativity. Immunity 44, 233–245 (2016).
152. Strasser, A., Jost, P. J. & Nagata, S. The Many Roles of FAS Receptor Signaling in the Immune System. Immunity vol. 30 180–192 (2009).
153. Martínez-Lostao, L., Anel, A. & Pardo, J. How Do Cytotoxic Lymphocytes Kill Cancer Cells? Clin. Cancer Res. 21, 5047–5056 (2015).
154. Voskoboinik, I., Whisstock, J. C. & Trapani, J. A. Perforin and granzymes: Function, dysfunction and human pathology. Nature Reviews Immunology vol. 15 388–400 (2015).
155. Garrido, F. et al. Natural history of HLA expression during tumour development. Immunology Today vol. 14 491–499 (1993).
156. Ward, P. L., Koeppen, H. K., Hurteau, T., Rowley, D. A. & Schreiber, H. Major Histocompatibility Complex Class I and Unique Antigen Expression by Murine Tumors That Escaped from CD8+ T-Cell-dependent Surveillance. Cancer Res. 50, 3851–3858 (1990).
157. Khong, H. T. & Restifo, N. P. Natural selection of tumor variants in the generation of ‘tumor escape’ phenotypes. Nat. Immunol. 3, 999–1005 (2002).
158. Vasmel, W. L. E., Sijts, E. J. A. M., Leupers, C. J. M., Matthews, E. A. & Melief, C. J. M. Primary virus-induced lymphomas evade T cell immunity by failure to express viral antigens. J. Exp. Med. 169, 1233–1254 (1989).
159. Spiotto, M. T., Rowley, D. A. & Schreiber, H. Bystander elimination of antigen loss variants in established tumors. Nat. Med. 10, 294–298 (2004).
160. Yee, C. et al. Adoptive T cell therapy using antigen-specific CD8+ T cell clones for the treatment of patients with metastatic melanoma: In vivo persistence, migration, and antitumor effect of transferred T cells. Proc. Natl. Acad. Sci. U. S. A. 99, 16168–16173 (2002).
161. Sotillo, E. et al. Convergence of acquired mutations and alternative splicing of CD19 enables resistance to CART-19 immunotherapy. Cancer Discov. 5, 1282–1295 (2015).
162. Shalabi, H. et al. Sequential loss of tumor surface antigens following chimeric antigen receptor T-cell therapies in diffuse large B-cell lymphoma. Haematologica vol. 103 e215–e218 (2018).
163. O’Rourke, D. M. et al. A single dose of peripherally infused EGFRvIII-directed CAR T cells mediates antigen loss and induces adaptive resistance in patients with recurrent glioblastoma. Sci. Transl. Med. 9, (2017).
164. Leone, P. et al. MHC Class i Antigen Processing and Presenting Machinery: Organization, Function, and Defects in Tumor Cells. 105, (2013).
165. Campoli, M. & Ferrone, S. HLA antigen changes in malignant cells: Epigenetic mechanisms and biologic significance. Oncogene vol. 27 5869–5885 (2008).
166. Paulson, K. G. et al. Acquired cancer resistance to combination immunotherapy from transcriptional loss of class I HLA. Nat. Commun. 9, 1–10 (2018).
167. Gettinger, S. et al. Impaired HLA class I antigen processing and presentation as a

86
mechanism of acquired resistance to immune checkpoint inhibitors in lung cancer. Cancer Discov. 7, 1420–1435 (2017).
168. Bernal, M., Ruiz-Cabello, F., Concha, A., Paschen, A. & Garrido, F. Implication of the β2-microglobulin gene in the generation of tumor escape phenotypes. Cancer Immunology, Immunotherapy vol. 61 1359–1371 (2012).
169. Zaretsky, J. M. et al. Mutations Associated with Acquired Resistance to PD-1 Blockade in Melanoma. N. Engl. J. Med. 375, 819–829 (2016).
170. Maleno, I. et al. Frequent loss of heterozygosity in the β2-microglobulin region of chromosome 15 in primary human tumors. Immunogenetics 63, 65–71 (2011).
171. Kaklamanis, L. et al. Loss of major histocompatibility complex-encoded transporter associated with antigen presentation (TAP) in colorectal cancer. Am. J. Pathol. 145, 505–509 (1994).
172. Chen, H. L. et al. A functionally defective allele of TAP1 results in loss of MHC class I antigen presentation in a human lung cancer. Nat. Genet. 13, 210–213 (1996).
173. Sucker, A. et al. Genetic evolution of T-cell resistance in the course of melanoma progression. Clin. Cancer Res. 20, 6593–6604 (2014).
174. del Campo, A. B. et al. Immune escape of cancer cells with beta2-microglobulin loss over the course of metastatic melanoma. Int. J. Cancer 134, 102–113 (2014).
175. McGranahan, N. et al. Allele-Specific HLA Loss and Immune Escape in Lung Cancer Evolution. Cell 171, 1259-1271.e11 (2017).
176. Gonzalez, H., Hagerling, C. & Werb, Z. Roles of the immune system in cancer: From tumor initiation to metastatic progression. Genes and Development vol. 32 1267–1284 (2018).
177. Mahmoud, S. M. A. et al. Tumor-infiltrating CD8+ lymphocytes predict clinical outcome in breast cancer. J. Clin. Oncol. 29, 1949–1955 (2011).
178. Loi, S. et al. Tumor-infiltrating lymphocytes and prognosis: A pooled individual patient analysis of early-stage triple-negative breast cancers. J. Clin. Oncol. 37, 559–569 (2019).
179. Clemente, C. G. et al. Prognostic value of tumor infiltrating lymphocytes in the vertical growth phase of primary cutaneous melanoma. Cancer 77, 1303–1310 (1996).
180. van Houdt, I. S. et al. Favorable outcome in clinically stage II melanoma patients is associated with the presence of activated tumor infiltrating T-lymphocytes and preserved MHC class I antigen expression. Int. J. Cancer 123, 609–615 (2008).
181. Fu, Q. et al. Prognostic value of tumor-infiltrating lymphocytes in melanoma: a systematic review and meta-analysis. OncoImmunology vol. 8 (2019).
182. Ropponen, K. M., Eskelinen, M. J., Lipponen, P. K., Alhava, E. & Kosma, V. Prognostic value of tumour-infiltrating lymphocytes (TILs) in colorectal cancer. J. Pathol. 182, 318–324 (1997).
183. Naito, Y. et al. CD8+ T cells infiltrated within cancer cell nests as a prognostic factor in human colorectal cancer. Cancer Res. 58, 3491–3494 (1998).
184. Pagès, F. et al. Effector Memory T Cells, Early Metastasis, and Survival in Colorectal Cancer. N. Engl. J. Med. 353, 2654–2666 (2005).
185. Fridman, W. H., Pagès, F., Saut̀s-Fridman, C. & Galon, J. The immune contexture in human tumours: Impact on clinical outcome. Nature Reviews Cancer vol. 12 298–306 (2012).

87
186. Galon, J., Angell, H. K., Bedognetti, D. & Marincola, F. M. The Continuum of Cancer Immunosurveillance: Prognostic, Predictive, and Mechanistic Signatures. Immunity vol. 39 11–26 (2013).
187. Vajdic, C. M. et al. Cancer incidence before and after kidney transplantation. J. Am. Med. Assoc. 296, 2823–2831 (2006).
188. Moloney, F. J. et al. A population-based study of skin cancer incidence and prevalence in renal transplant recipients. Br. J. Dermatol. 154, 498–504 (2006).
189. Jiang, Y. et al. The Incidence of Cancer in a Population-Based Cohort of Canadian Heart Transplant Recipients. Am. J. Transplant. 10, 637–645 (2010).
190. Baccarani, U. et al. Comparison of de novo tumours after liver transplantation with incidence rates from Italian cancer registries. Dig. Liver Dis. 42, 55–60 (2010).
191. Silverberg, M. J. et al. HIV infection, immunodeficiency, viral replication, and the risk of cancer. Cancer Epidemiol. Biomarkers Prev. 20, 2551–2559 (2011).
192. Silverberg, M. J. et al. HiV infection Status, immunodeficiency, and the incidence of Non-Melanoma Skin cancer. 105, (2013).
193. Rubinstein, P. G., Aboulafia, D. M. & Zloza, A. Malignancies in HIV/AIDS: From epidemiology to therapeutic challenges. Aids 28, 453–465 (2014).
194. Vesely, M. D., Kershaw, M. H., Schreiber, R. D. & Smyth, M. J. Natural Innate and Adaptive Immunity to Cancer. Annu. Rev. Immunol. 29, 235–271 (2011).
195. Teng, M. W. L. et al. Opposing roles for IL-23 and IL-12 in maintaining occult cancer in an equilibrium state. Cancer Res. 72, 3987–3996 (2012).
196. Wu, X. et al. Immune microenvironment profiles of tumor immune equilibrium and immune escape states of mouse sarcoma. Cancer Lett. 340, 124–133 (2013).
197. Kataoka, T. et al. FLIP prevents apoptosis induced by death receptors but not by perforin/granzyme B, chemotherapeutic drugs, and gamma irradiation. J. Immunol. 161, 3936–42 (1998).
198. Hinz, S. et al. Bcl-X(L) protects pancreatic adenocarcinoma cells against CD95- and TRAIL-receptor-mediated apoptosis. Oncogene 19, 5477–5486 (2000).
199. Keane, M. M., Ettenberg, S. A., Lowrey, G. A., Russell, E. K. & Lipkowitz, S. Fas expression and function in normal and malignant breast cell lines. Cancer Res. 56, 4791–4798 (1996).
200. Takahashi, H. et al. FAS death domain deletions and cellular FADD-like interleukin 1β converting enzyme inhibitory protein (long) overexpression: Alternative mechanisms for deregulating the extrinsic apoptotic pathway in diffuse large B-cell lymphoma subtypes. Clin. Cancer Res. 12, 3265–3271 (2006).
201. Nusse, R. & Clevers, H. Wnt/β-Catenin Signaling, Disease, and Emerging Therapeutic Modalities. Cell vol. 169 985–999 (2017).
202. Spranger, S., Bao, R. & Gajewski, T. F. Melanoma-intrinsic β-catenin signalling prevents anti-tumour immunity. Nature 523, 231–235 (2015).
203. Spranger, S., Dai, D., Horton, B. & Gajewski, T. F. Tumor-Residing Batf3 Dendritic Cells Are Required for Effector T Cell Trafficking and Adoptive T Cell Therapy. Cancer Cell 31, 711-723.e4 (2017).
204. Luke, J. J., Bao, R., Sweis, R. F., Spranger, S. & Gajewski, T. F. WNT/b-catenin pathway activation correlates with immune exclusion across human cancers. Clin. Cancer Res. 25, 3074–3083 (2019).
205. Fruman, D. A. et al. The PI3K Pathway in Human Disease. Cell vol. 170 605–635

88
(2017). 206. Peng, W. et al. Loss of PTEN promotes resistance to T cell–mediated
immunotherapy. Cancer Discov. 6, 202–216 (2016). 207. Kortlever, R. M. et al. Myc Cooperates with Ras by Programming Inflammation and
Immune Suppression. Cell 171, 1301-1315.e14 (2017). 208. Skoulidis, F. et al. STK11/LKB1 mutations and PD-1 inhibitor resistance in KRAS-
mutant lung adenocarcinoma. Cancer Discov. 8, 822–835 (2018). 209. Koyama, S. et al. STK11/LKB1 deficiency promotes neutrophil recruitment and
proinflammatory cytokine production to suppress T-cell activity in the lung tumor microenvironment. Cancer Res. 76, 999–1008 (2016).
210. Kitajima, S. et al. Suppression of STING associated with lkb1 loss in KRAS-driven lung cancer. Cancer Discov. 9, 34–45 (2019).
211. Knudsen, E. S. & Witkiewicz, A. K. The Strange Case of CDK4/6 Inhibitors: Mechanisms, Resistance, and Combination Strategies. Trends in Cancer vol. 3 39–55 (2017).
212. Zhang, J. et al. Cyclin D-CDK4 kinase destabilizes PD-L1 via cullin 3-SPOP to control cancer immune surveillance. Nature 553, 91–95 (2018).
213. Jin, X. et al. Phosphorylated RB Promotes Cancer Immunity by Inhibiting NF-κB Activation and PD-L1 Expression. Mol. Cell 73, 22-35.e6 (2019).
214. Goel, S. et al. CDK4/6 inhibition triggers anti-tumour immunity. Nature 548, 471–475 (2017).
215. Schaer, D. A. et al. The CDK4/6 Inhibitor Abemaciclib Induces a T Cell Inflamed Tumor Microenvironment and Enhances the Efficacy of PD-L1 Checkpoint Blockade. Cell Rep. 22, 2978–2994 (2018).
216. Deng, J. et al. CDK4/6 inhibition augments antitumor immunity by enhancing T-cell activation. Cancer Discov. 8, 216–233 (2018).
217. Jerby-Arnon, L. et al. A Cancer Cell Program Promotes T Cell Exclusion and Resistance to Checkpoint Blockade. Cell 175, 984-997.e24 (2018).
218. Bergers, G. & Benjamin, L. E. Tumorigenesis and the angiogenic switch. Nature Reviews Cancer vol. 3 401–410 (2003).
219. Lanitis, E., Irving, M. & Coukos, G. Targeting the tumor vasculature to enhance T cell activity. Current Opinion in Immunology vol. 33 55–63 (2015).
220. Huang, Y. et al. Improving immune-vascular crosstalk for cancer immunotherapy. Nature Reviews Immunology vol. 18 195–203 (2018).
221. Krock, B. L., Skuli, N. & Simon, M. C. Hypoxia-Induced Angiogenesis: Good and Evil. Genes Cancer 2, 1117–1133 (2011).
222. De Palma, M., Biziato, D. & Petrova, T. V. Microenvironmental regulation of tumour angiogenesis. Nature Reviews Cancer vol. 17 457–474 (2017).
223. Potente, M., Gerhardt, H. & Carmeliet, P. Basic and therapeutic aspects of angiogenesis. Cell vol. 146 873–887 (2011).
224. Bellone, M. & Calcinotto, A. Ways to enhance lymphocyte trafficking into tumors and fitness of tumor infiltrating lymphocytes. Frontiers in Oncology vol. 3 SEP 231 (2013).
225. Motz, G. T. et al. Tumor endothelium FasL establishes a selective immune barrier promoting tolerance in tumors. Nat. Med. 20, 607–615 (2014).
226. Green, D. R., Droin, N. & Pinkoski, M. Activation-induced cell death in T cells.

89
Immunol. Rev. 193, 70–81 (2003). 227. Ferguson, T. A. & Griffith, T. S. A vision of cell death: Fas ligand and immune
privilege 10 years later. Immunol. Rev. 213, 228–238 (2006). 228. Joyce, J. A. & Fearon, D. T. T cell exclusion, immune privilege, and the tumor
microenvironment. Science (80-. ). 348, 74–80 (2015). 229. Kandalaft, L. E., Facciabene, A., Buckanovich, R. J. & Coukos, G. Endothelin B
Receptor, a New Target in Cancer Immune Therapy. (2009) doi:10.1158/1078-0432.CCR-08-0543.
230. Kalluri, R. The biology and function of fibroblasts in cancer. Nature Reviews Cancer vol. 16 582–598 (2016).
231. Liu, T. et al. Cancer-associated fibroblasts: An emerging target of anti-cancer immunotherapy. Journal of Hematology and Oncology vol. 12 86 (2019).
232. Lynch, M. D. & Watt, F. M. Fibroblast heterogeneity: implications for human disease. Journal of Clinical Investigation vol. 128 26–35 (2018).
233. David, C. J. & Massagué, J. Contextual determinants of TGFβ action in development, immunity and cancer. Nature Reviews Molecular Cell Biology vol. 19 419–435 (2018).
234. Donatelli, S. S. et al. TGF-β-inducible microRNA-183 silences tumor-associated natural killer cells. Proc. Natl. Acad. Sci. U. S. A. 111, 4203–4208 (2014).
235. Ahmadzadeh, M. & Rosenberg, S. A. TGF-β1 Attenuates the Acquisition and Expression of Effector Function by Tumor Antigen-Specific Human Memory CD8 T Cells. J. Immunol. 174, 5215–5223 (2005).
236. Broderick, L. & Bankert, R. B. Membrane-Associated TGF-β1 Inhibits Human Memory T Cell Signaling in Malignant and Nonmalignant Inflammatory Microenvironments. J. Immunol. 177, 3082–3088 (2006).
237. Chakravarthy, A., Khan, L., Bensler, N. P., Bose, P. & De Carvalho, D. D. TGF-β-associated extracellular matrix genes link cancer-associated fibroblasts to immune evasion and immunotherapy failure. Nat. Commun. 9, 1–10 (2018).
238. Mariathasan, S. et al. TGFβ attenuates tumour response to PD-L1 blockade by contributing to exclusion of T cells. Nature 554, 544–548 (2018).
239. Tauriello, D. V. F. et al. TGFβ drives immune evasion in genetically reconstituted colon cancer metastasis. Nature 554, 538–543 (2018).
240. Wan, Y. Y. & Flavell, R. A. ‘Yin-Yang’ functions of transforming growth factor-β and T regulatory cells in immune regulation. Immunol. Rev. 220, 199–213 (2007).
241. Byrne, S. N., Knox, M. C. & Halliday, G. M. TGFβ is responsible for skin tumour infiltration by macrophages enabling the tumours to escape immune destruction. Immunol. Cell Biol. 86, 92–97 (2008).
242. Takahashi, H. et al. Cancer-associated fibroblasts promote an immunosuppressive microenvironment through the induction and accumulation of protumoral macrophages. Oncotarget 8, 8633–8647 (2017).
243. Comito, G. et al. Cancer-associated fibroblasts and M2-polarized macrophages synergize during prostate carcinoma progression. Oncogene 33, 2423–2431 (2014).
244. Menetrier-Caux, C. et al. Inhibition of the Differentiation of Dendritic Cells From CD34+ Progenitors by Tumor Cells: Role of Interleukin-6 and Macrophage Colony-Stimulating Factor. Blood 92, 4778–4791 (1998).

90
245. Park, S.-J. et al. IL-6 Regulates In Vivo Dendritic Cell Differentiation through STAT3 Activation. J. Immunol. 173, 3844–3854 (2004).
246. Chomarat, P., Banchereau, J., Davoust, J. & Palucka, A. K. IL-6 switches the differentiation of monocytes from dendritic cells to macrophages. Nat. Immunol. 1, 510–514 (2000).
247. Alkasalias, T., Moyano-Galceran, L., Arsenian-Henriksson, M. & Lehti, K. Fibroblasts in the tumor microenvironment: Shield or spear? International Journal of Molecular Sciences vol. 19 (2018).
248. Acerbi, I. et al. Human breast cancer invasion and aggression correlates with ECM stiffening and immune cell infiltration. Integr. Biol. 7, 1120–1134 (2015).
249. Kumar, V., Patel, S., Tcyganov, E. & Gabrilovich, D. I. The Nature of Myeloid-Derived Suppressor Cells in the Tumor Microenvironment. Trends in Immunology vol. 37 208–220 (2016).
250. Connolly, M. K. et al. Distinct populations of metastases-enabling myeloid cells expand in the liver of mice harboring invasive and preinvasive intra-abdominal tumor. J. Leukoc. Biol. 87, 713–725 (2010).
251. Lesokhin, A. M. et al. Monocytic CCR2 + myeloid-derived suppressor cells promote immune escape by limiting activated CD8 T-cell infiltration into the tumor microenvironment. Cancer Res. 72, 876–886 (2012).
252. Huang, B. et al. CCL2/CCR2 pathway mediates recruitment of myeloid suppressor cells to cancers. Cancer Lett. 252, 86–92 (2007).
253. Obermajer, N., Muthuswamy, R., Odunsi, K., Edwards, R. P. & Kalinski, P. PGE 2-induced CXCL 12 production and CXCR4 expression controls the accumulation of human MDSCs in ovarian cancer environment. Cancer Res. 71, 7463–7470 (2011).
254. Bronte, V. & Zanovello, P. Regulation of immune responses by L-arginine metabolism. Nat. Rev. Immunol. 5, 641–654 (2005).
255. Yu, J. et al. Myeloid-Derived Suppressor Cells Suppress Antitumor Immune Responses through IDO Expression and Correlate with Lymph Node Metastasis in Patients with Breast Cancer. J. Immunol. 190, 3783–3797 (2013).
256. Noman, M. Z. et al. PD-L1 is a novel direct target of HIF-1α, and its blockade under hypoxia enhanced: MDSC-mediated T cell activation. J. Exp. Med. 211, 781–790 (2014).
257. Schlecker, E. et al. Tumor-Infiltrating Monocytic Myeloid-Derived Suppressor Cells Mediate CCR5-Dependent Recruitment of Regulatory T Cells Favoring Tumor Growth. J. Immunol. 189, 5602–5611 (2012).
258. Lavin, Y., Mortha, A., Rahman, A. & Merad, M. Regulation of macrophage development and function in peripheral tissues. Nature Reviews Immunology vol. 15 731–744 (2015).
259. Mantovani, A., Marchesi, F., Malesci, A., Laghi, L. & Allavena, P. Tumour-associated macrophages as treatment targets in oncology. Nat. Rev. Clin. Oncol. 14, 399–416 (2017).
260. Murray, P. J. Macrophage Polarization. Annu. Rev. Physiol. 79, 541–566 (2017). 261. Linde, N. et al. Vascular endothelial growth factor-induced skin carcinogenesis
depends on recruitment and alternative activation of macrophages. J. Pathol. 227, 17–28 (2012).
262. Chitu, V. & Stanley, E. R. Colony-stimulating factor-1 in immunity and inflammation.

91
Curr. Opin. Immunol. 18, 39–48 (2006). 263. Pyonteck, S. M. et al. CSF-1R inhibition alters macrophage polarization and blocks
glioma progression. Nat. Med. 19, 1264–1272 (2013). 264. Candido, J. B. et al. CSF1R+ Macrophages Sustain Pancreatic Tumor Growth
through T Cell Suppression and Maintenance of Key Gene Programs that Define the Squamous Subtype. Cell Rep. 23, 1448–1460 (2018).
265. Lin, E. Y. & Pollard, J. W. Tumor-associated macrophages press the angiogenic switch in breast cancer. Cancer Research vol. 67 5064–5066 (2007).
266. Yeo, E. J. et al. Myeloid wnt7b mediates the angiogenic switch and metastasis in breast cancer. Cancer Res. 74, 2962–2973 (2014).
267. De Palma, M. et al. Tie2 identifies a hematopoietic lineage of proangiogenic monocytes required for tumor vessel formation and a mesenchymal population of pericyte progenitors. Cancer Cell 8, 211–226 (2005).
268. Wyckoff, J. B. et al. Direct visualization of macrophage-assisted tumor cell intravasation in mammary tumors. Cancer Res. 67, 2649–2656 (2007).
269. Quail, D. F. & Joyce, J. A. Microenvironmental regulation of tumor progression and metastasis. Nature Medicine vol. 19 1423–1437 (2013).
270. Kren, L. et al. Production of immune-modulatory nonclassical molecules HLA-G and HLA-E by tumor infiltrating ameboid microglia/macrophages in glioblastomas: A role in innate immunity? J. Neuroimmunol. 220, 131–135 (2010).
271. Morandi, F. et al. Human neuroblastoma cells trigger an immunosuppressive program in monocytes by stimulating soluble HLA-G release. Cancer Res. 67, 6433–6441 (2007).
272. Kryczek, I. et al. B7-H4 expression identifies a novel suppressive macrophage population in human ovarian carcinoma. J. Exp. Med. 203, 871–881 (2006).
273. Kuang, D. M. et al. Activated monocytes in peritumoral stroma of hepatocellular carcinoma foster immune privilege and disease progression through PD-L1. J. Exp. Med. 206, 1327–1337 (2009).
274. Bloch, O. et al. Gliomas promote immunosuppression through induction of B7-H1 expression in tumor-associated macrophages. Clin. Cancer Res. 19, 3165–3175 (2013).
275. Doedens, A. L. et al. Macrophage expression of hypoxia-inducible factor-1α suppresses T-cell function and promotes tumor progression. Cancer Res. 70, 7465–7475 (2010).
276. Noman, M. Z. et al. PD-L1 is a novel direct target of HIF-1α, and its blockade under hypoxia enhanced: MDSC-mediated T cell activation. J. Exp. Med. 211, 781–790 (2014).
277. Liguori, M. et al. Functional TRAIL receptors in monocytes and tumor-associated macrophages: A possible targeting pathway in the tumor microenvironment. Oncotarget 7, 41662–41676 (2016).
278. Sharda, D. R. et al. Regulation of Macrophage Arginase Expression and Tumor Growth by the Ron Receptor Tyrosine Kinase. J. Immunol. 187, 2181–2192 (2011).
279. Rodriguez, P. C. et al. Arginase I production in the tumor microenvironment by mature myeloid cells inhibits T-cell receptor expression and antigen-specific T-cell responses. Cancer Res. 64, 5839–5849 (2004).
280. Rodriguez, P. C. et al. l-Arginine Consumption by Macrophages Modulates the
92
Expression of CD3ζ Chain in T Lymphocytes. J. Immunol. 171, 1232–1239 (2003). 281. Curiel, T. J. et al. Specific recruitment of regulatory T cells in ovarian carcinoma
fosters immune privilege and predicts reduced survival. Nat. Med. 10, 942–949 (2004).
282. Liu, J. et al. Tumor-Associated Macrophages Recruit CCR6+ Regulatory T Cells and Promote the Development of Colorectal Cancer via Enhancing CCL20 Production in Mice. PLoS One 6, e19495 (2011).
283. Adeegbe, D. O. & Nishikawa, H. Natural and induced T regulatory cells in cancer. Frontiers in Immunology vol. 4 190 (2013).
284. Denning, T. L., Wang, Y. C., Patel, S. R., Williams, I. R. & Pulendran, B. Lamina propria macrophages and dendritic cells differentially induce regulatory and interleukin 17-producing T cell responses. Nat. Immunol. 8, 1086–1094 (2007).
285. Zhu, Y., Yao, S. & Chen, L. Cell Surface Signaling Molecules in the Control of Immune Responses: A Tide Model. Immunity vol. 34 466–478 (2011).
286. Zhang, Q. & Vignali, D. A. A. Co-stimulatory and Co-inhibitory Pathways in Autoimmunity. Immunity vol. 44 1034–1051 (2016).
287. Tivol, E. A. et al. Loss of CTLA-4 leads to massive lymphoproliferation and fatal multiorgan tissue destruction, revealing a critical negative regulatory role of CTLA-4. Immunity 3, 541–547 (1995).
288. Waterhouse, P. et al. Lymphoproliferative disorders with early lethality in mice deficient in Ctla-4. Science (80-. ). 270, 985–988 (1995).
289. Nishimura, H., Nose, M., Hiai, H., Minato, N. & Honjo, T. Development of Lupus-like Autoimmune Diseases by Disruption of the PD-1 Gene Encoding an ITIM Motif-Carrying Immunoreceptor. Immunity vol. 11 (1999).
290. Moskophidis, D., Lechner, F., Pircher, H. & Zinkernagel, R. M. Virus persistence in acutely infected immunocompetent mice by exhaustion of antiviral cytotoxic effector T cells. Nature 362, 758–761 (1993).
291. Zajac, A. J. et al. Viral immune evasion due to persistence of activated T cells without effector function. J. Exp. Med. 188, 2205–2213 (1998).
292. Wherry, E. J., Blattman, J. N., Murali-Krishna, K., van der Most, R. & Ahmed, R. Viral Persistence Alters CD8 T-Cell Immunodominance and Tissue Distribution and Results in Distinct Stages of Functional Impairment. J. Virol. 77, 4911–4927 (2003).
293. Fuller, M. J. & Zajac, A. J. Ablation of CD8 and CD4 T Cell Responses by High Viral Loads. J. Immunol. 170, 477–486 (2003).
294. Swain, S. L., Mckinstry, K. K. & Strutt, T. M. The priming environment can vary Expanding roles for CD4 + T cells in immunity to viruses. (2012) doi:10.1038/nri3152.
295. Wherry, E. J. et al. Molecular Signature of CD8+ T Cell Exhaustion during Chronic Viral Infection. Immunity 27, 670–684 (2007).
296. Pauken, K. E. et al. Epigenetic stability of exhausted T cells limits durability of reinvigoration by PD-1 blockade. Science (80-. ). 354, 1160–1165 (2016).
297. Sen, D. R. et al. The epigenetic landscape of T cell exhaustion. Science (80-. ). 354, 1165–1169 (2016).
298. Yao, C. et al. Single-cell RNA-seq reveals TOX as a key regulator of CD8+ T cell persistence in chronic infection. Nat. Immunol. 20, 890–901 (2019).
299. Khan, O. et al. TOX transcriptionally and epigenetically programs CD8+ T cell
93
exhaustion. Nature 571, 211–218 (2019). 300. Alfei, F. et al. TOX reinforces the phenotype and longevity of exhausted T cells in
chronic viral infection. Nature 571, 265–269 (2019). 301. Scott, A. C. et al. TOX is a critical regulator of tumour-specific T cell differentiation.
Nature 571, 270–274 (2019). 302. Wherry, E. J. T cell exhaustion. Nature Immunology vol. 12 492–499 (2011). 303. Blank, C. U. et al. Defining ‘T cell exhaustion’. Nat. Rev. Immunol. 19, 665–674
(2019). 304. Barber, D. L. et al. Restoring function in exhausted CD8 T cells during chronic viral
infection. Nature 439, 682–687 (2006). 305. Ahmadzadeh, M. et al. Tumor antigen-specific CD8 T cells infiltrating the tumor
express high levels of PD-1 and are functionally impaired. Blood 114, 1537–1544 (2009).
306. Thommen, D. S. et al. Progression of lung cancer is associated with increased dysfunction of T cells defined by coexpression of multiple inhibitory receptors. Cancer Immunol. Res. 3, 1344–1354 (2015).
307. Baitsch, L. et al. Exhaustion of tumor-specific CD8 + T cells in metastases from melanoma patients. J. Clin. Invest. 121, 2350–2360 (2011).
308. Matsuzaki, J. et al. Tumor-infiltrating NY-ESO-1-specific CD8+ T cells are negatively regulated by LAG-3 and PD-1 in human ovarian cancer. Proc. Natl. Acad. Sci. U. S. A. 107, 7875–7880 (2010).
309. Lu, X. et al. Tumor antigen-specific CD8+ T cells are negatively regulated by PD-1 and Tim-3 in human gastric cancer. Cell. Immunol. 313, 43–51 (2017).
310. Li, J. et al. Tumor-infiltrating Tim-3+ T cells proliferate avidly except when PD-1 is co-expressed: Evidence for intracellular cross talk. Oncoimmunology 5, e1200778 (2016).
311. Zippelius, A. et al. Effector Function of Human Tumor-Specific CD8 T Cells in Melanoma Lesions: A State of Local Functional Tolerance. Cancer Res. 64, 2865–2873 (2004).
312. Li, H. et al. Dysfunctional CD8 T Cells Form a Proliferative, Dynamically Regulated Compartment within Human Melanoma. Cell 176, 775-789.e18 (2019).
313. Schietinger, A. et al. Tumor-Specific T Cell Dysfunction Is a Dynamic Antigen-Driven Differentiation Program Initiated Article Tumor-Specific T Cell Dysfunction Is a Dynamic Antigen-Driven Differentiation Program Initiated Early during Tumorigenesis. Immunity 1–13 (2016) doi:10.1016/j.immuni.2016.07.011.
314. Fehlings, M. et al. Checkpoint blockade immunotherapy reshapes the high-dimensional phenotypic heterogeneity of murine intratumoural neoantigen-specific CD8+ T cells. Nat. Commun. 8, 1–12 (2017).
315. Giraldo, N. A. et al. Tumor-infiltrating and peripheral blood T-cell immunophenotypes predict early relapse in localized clear cell renal cell carcinoma. Clin. Cancer Res. 23, 4416–4428 (2017).
316. Thommen, D. S. et al. A transcriptionally and functionally distinct pd-1 + cd8 + t cell pool with predictive potential in non-small-cell lung cancer treated with pd-1 blockade. Nat. Med. 24, 994–1004 (2018).
317. van der Leun, A. M., Thommen, D. S. & Schumacher, T. N. CD8+ T cell states in human cancer: insights from single-cell analysis. Nature Reviews Cancer vol. 20

94
218–232 (2020). 318. Miller, B. C. et al. Subsets of exhausted CD8+ T cells differentially mediate tumor
control and respond to checkpoint blockade. Nat. Immunol. 20, 326–336 (2019). 319. Kurtulus, S. et al. Checkpoint Blockade Immunotherapy Induces Dynamic Changes
in PD-1 − CD8 + Tumor-Infiltrating T Cells. Immunity 50, 181-194.e6 (2019). 320. Siddiqui, I. et al. Intratumoral Tcf1 + PD-1 + CD8 + T Cells with Stem-like Properties
Promote Tumor Control in Response to Vaccination and Checkpoint Blockade Immunotherapy. Immunity 50, 195-211.e10 (2019).
321. Singer, M. et al. A Distinct Gene Module for Dysfunction Uncoupled from Activation in Tumor-Infiltrating T Cells. Cell 166, 1500-1511.e9 (2016).
322. Chihara, N. et al. Induction and transcriptional regulation of the co-inhibitory gene module in T cells. Nature 558, 454–459 (2018).
323. Li, J., He, Y., Hao, J., Ni, L. & Dong, C. High Levels of Eomes Promote Exhaustion of Anti-tumor CD8+ T Cells. Front. Immunol. 9, 2981 (2018).
324. Gibson, H. M. et al. Induction of the CTLA-4 Gene in Human Lymphocytes Is Dependent on NFAT Binding the Proximal Promoter . J. Immunol. 179, 3831–3840 (2007).
325. Egen, J. G. & Allison, J. P. Cytotoxic T lymphocyte antigen-4 accumulation in the immunological synapse is regulated by TCR signal strength. Immunity 16, 23–35 (2002).
326. Linsley, P. S. et al. Coexpression and functional cooperation of CTLA-4 and CD28 on activated T lymphocytes. J. Exp. Med. 176, 1595–1604 (1992).
327. Stamper, C. C. et al. Crystal structure of the B7-1/CTLA-4 complex that inhibits human immune responses. Nature 410, 608–611 (2001).
328. Schwartz, J. C. D., Zhang, X., Fedorov, A. A., Nathenson, S. G. & Almo, S. C. Structural basis for co-stimulation by the human CTLA-4/B7-2 complex. Nature 410, 604–608 (2001).
329. Walker, L. S. K. & Sansom, D. M. The emerging role of CTLA4 as a cell-extrinsic regulator of T cell responses. Nature Reviews Immunology vol. 11 852–863 (2011).
330. Qureshi, O. S. et al. Trans-endocytosis of CD80 and CD86: A molecular basis for the cell-extrinsic function of CTLA-4. Science (80-. ). 332, 600–603 (2011).
331. Walker, L. S. K. & Sansom, D. M. Confusing signals: Recent progress in CTLA-4 biology. Trends in Immunology vol. 36 63–70 (2015).
332. Agata, Y. et al. Expression of the PD-1 antigen on the surface of stimulated mouse T and B lymphocytes. International Immunology vol. 8 https://academic.oup.com/intimm/article-abstract/8/5/765/693918 (1996).
333. Sharpe, A. H. & Pauken, K. E. The diverse functions of the PD1 inhibitory pathway. Nat. Rev. Immunol. 18, 153–167 (2018).
334. Sun, C., Mezzadra, R. & Schumacher, T. N. Regulation and Function of the PD-L1 Checkpoint. Immunity vol. 48 434–452 (2018).
335. Keir, M. E. et al. Tissue expression of PD-L1 mediates peripheral T cell tolerance. J. Exp. Med. 203, 883–895 (2006).
336. Latchman, Y. et al. PD-L2 is a second ligand for PD-1 and inhibits T cell activation. Nat. Immunol. 2, 261–268 (2001).
337. Wei, S. C., Duffy, C. R. & Allison, J. P. Fundamental mechanisms of immune checkpoint blockade therapy. Cancer Discovery vol. 8 1069–1086 (2018).

95
338. Walker, L. S. K. PD-1 and CTLA-4: Two checkpoints, one pathway? Sci. Immunol. 2, (2017).
339. Patsoukis, N. et al. PD-1 alters T-cell metabolic reprogramming by inhibiting glycolysis and promoting lipolysis and fatty acid oxidation. Nat. Commun. 6, (2015).
340. Boles, K. S. et al. A novel molecular interaction for the adhesion of follicular CD4 T cells to follicular DC. Eur. J. Immunol. 39, 695–703 (2009).
341. Stanietsky, N. et al. The interaction of TIGIT with PVR and PVRL2 inhibits human NK cell cytotoxicity. Proc. Natl. Acad. Sci. U. S. A. 106, 17858–17863 (2009).
342. Yu, X. et al. The surface protein TIGIT suppresses T cell activation by promoting the generation of mature immunoregulatory dendritic cells. Nat. Immunol. 10, 48–57 (2009).
343. Levin, S. D. et al. Vstm3 is a member of the CD28 family and an important modulator of T-cell function. Eur. J. Immunol. 41, 902–915 (2011).
344. Joller, N. et al. Cutting Edge: TIGIT Has T Cell-Intrinsic Inhibitory Functions. J. Immunol. 186, 1338–1342 (2011).
345. Joller, N. et al. Treg cells expressing the coinhibitory molecule TIGIT selectively inhibit proinflammatory Th1 and Th17 cell responses. Immunity 40, 569–581 (2014).
346. Chauvin, J. M. et al. TIGIT and PD-1 impair tumor antigen-specific CD8+ T cells in melanoma patients. J. Clin. Invest. 125, 2046–2058 (2015).
347. Kurtulus, S. et al. TIGIT predominantly regulates the immune response via regulatory T cells. J. Clin. Invest. 125, 4053–4062 (2015).
348. Anderson, A. C., Joller, N. & Kuchroo, V. K. Lag-3, Tim-3, and TIGIT: Co-inhibitory Receptors with Specialized Functions in Immune Regulation. Immunity vol. 44 989–1004 (2016).
349. Stengel, K. F. et al. Structure of TIGIT immunoreceptor bound to poliovirus receptor reveals a cell-cell adhesion and signaling mechanism that requires cis-trans receptor clustering. Proc. Natl. Acad. Sci. U. S. A. 109, 5399–5404 (2012).
350. Anderson, A. C., Joller, N. & Kuchroo, V. K. Lag-3, Tim-3, and TIGIT: Co-inhibitory Receptors with Specialized Functions in Immune Regulation. Immunity vol. 44 989–1004 (2016).
351. Johnston, R. J. et al. The Immunoreceptor TIGIT Regulates Antitumor and Antiviral CD8+ T Cell Effector Function. Cancer Cell 26, 923–937 (2014).
352. Zhang, Y. et al. Genome-wide DNA methylation analysis identifies hypomethylated genes regulated by FOXP3 in human regulatory T cells. Blood 122, 2823–2836 (2013).
353. Fuhrman, C. A. et al. Divergent Phenotypes of Human Regulatory T Cells Expressing the Receptors TIGIT and CD226. J. Immunol. 195, 145–155 (2015).
354. Triebel, F. et al. LAG-3, a novel lymphocyte activation gene closely related to CD4. J. Exp. Med. 171, 1393–1405 (1990).
355. Workman, C. J. & Vignali, D. A. A. Negative Regulation of T Cell Homeostasis by Lymphocyte Activation Gene-3 (CD223). J. Immunol. 174, 688–695 (2005).
356. Lino, A. C. et al. LAG-3 Inhibitory Receptor Expression Identifies Immunosuppressive Natural Regulatory Plasma Cells. Immunity 49, 120-133.e9 (2018).
357. Kisielow, M., Kisielow, J., Capoferri-Sollami, G. & Karjalainen, K. Expression of

96
lymphocyte activation gene 3 (LAG-3) on B cells is induced by T cells. Eur. J. Immunol. 35, 2081–2088 (2005).
358. Mao, X. et al. Pathological α-synuclein transmission initiated by binding lymphocyte-activation gene 3. Science (80-. ). 353, (2016).
359. Gagliani, N. et al. Coexpression of CD49b and LAG-3 identifies human and mouse T regulatory type 1 cells. Nat. Med. 19, 739–746 (2013).
360. Xu, F. et al. LSECtin expressed on melanoma cells promotes tumor progression by inhibiting antitumor T-cell responses. Cancer Res. 74, 3418–3428 (2014).
361. Kouo, T. et al. Galectin-3 shapes antitumor immune responses by suppressing CD8 T Cells via LAG-3 and Inhibiting Expansion of Plasmacytoid Dendritic Cells. Cancer Immunol. Res. 3, 412–423 (2015).
362. Huard, B., Prigent, P., Tournier, M., Bruniquel, D. & Triebel, F. CD4/major histocompatibility complex class II interaction analyzed with CD4- and lymphocyte activation gene-3 (LAG-3)-Ig fusion proteins. Eur. J. Immunol. 25, 2718–2721 (1995).
363. Wang, J. et al. Fibrinogen-like Protein 1 Is a Major Immune Inhibitory Ligand of LAG-3. Cell 176, 334-347.e12 (2019).
364. Hannier, S., Tournier, M., Bismuth, G. & Triebel, F. CD3/TCR Signaling Activation Gene-3 Molecules Inhibit CD3/TCR Complex-Associated Lymphocyte. J Immunol 161, 4058–4065 (1998).
365. Zhu, J., Yamane, H. & Paul, W. E. Differentiation of Effector CD4 T Cell Populations. Annu. Rev. Immunol. 28, 445–489 (2010).
366. Kim, H. J. & Cantor, H. CD4 T-cell subsets and tumor immunity: the helpful and the not-so-helpful. Cancer immunology research vol. 2 91–98 (2014).
367. Togashi, Y., Shitara, K. & Nishikawa, H. Regulatory T cells in cancer immunosuppression — implications for anticancer therapy. Nature Reviews Clinical Oncology vol. 16 356–371 (2019).
368. Wing, K. & Sakaguchi, S. Regulatory T cells exert checks and balances on self tolerance and autoimmunity. Nature Immunology vol. 11 7–13 (2010).
369. Brunkow, M. E. et al. Disruption of a new forkhead/winged-helix protein, scurfin, results in the fatal lymphoproliferative disorder of the scurfy mouse. Nat. Genet. 27, 68–73 (2001).
370. Takahashi, T. et al. Immunologic self-tolerance maintained by CD25 CD4 naturally anergic and suppressive T cells: induction of autoimmune disease by breaking their anergic/suppressive state. International Immunology vol. 10 (1998).
371. Thornton, A. M. & Shevach, E. M. CD4+CD25+ immunoregulatory T cells suppress polyclonal T cell activation in vitro by inhibiting interleukin 2 production. J. Exp. Med. 188, 287–296 (1998).
372. Perez, V. L. et al. Induction of peripheral T cell tolerance in vivo requires CTLA-4 engagement. Immunity 6, 411–417 (1997).
373. Wing, K. et al. CTLA-4 control over Foxp3+ regulatory T cell function. Science (80-. ). 322, 271–275 (2008).
374. Tan, M. C. B. et al. Disruption of CCR5-Dependent Homing of Regulatory T Cells Inhibits Tumor Growth in a Murine Model of Pancreatic Cancer. J. Immunol. 182, 1746–1755 (2009).
375. Shields, J. D., Kourtis, I. C., Tomei, A. A., Roberts, J. M. & Swartz, M. A. Induction

97
of lymphoidlike stroma and immune escape by tumors that express the chemokine CCL21. Science (80-. ). 328, 749–752 (2010).
376. Grossman, W. J. et al. Human T regulatory cells can use the perforin pathway to cause autologous target cell death. Immunity 21, 589–601 (2004).
377. Wilson, J. M. et al. The A 2B Adenosine Receptor Impairs the Maturation and Immunogenicity of Dendritic Cells . J. Immunol. 182, 4616–4623 (2009).
378. Deaglio, S. et al. Adenosine generation catalyzed by CD39 and CD73 expressed on regulatory T cells mediates immune suppression. J. Exp. Med. 204, 1257–1265 (2007).
379. Steinbrink, K., Wölfl, M., Jonuleit, H., Knop, J. & Enk, A. H. Induction of tolerance by IL-10-treated dendritic cells. J. Immunol. 159, 4772–80 (1997).
380. Collison, L. W. et al. The inhibitory cytokine IL-35 contributes to regulatory T-cell function. Nature 450, 566–569 (2007).
381. Turnis, M. E. et al. Interleukin-35 Limits Anti-Tumor Immunity. Immunity 44, 316–329 (2016).
382. Jarnicki, A. G., Lysaght, J., Todryk, S. & Mills, K. H. G. Suppression of Antitumor Immunity by IL-10 and TGF-β-Producing T Cells Infiltrating the Growing Tumor: Influence of Tumor Environment on the Induction of CD4 + and CD8 + Regulatory T Cells . J. Immunol. 177, 896–904 (2006).
383. De Simone, M. et al. Transcriptional Landscape of Human Tissue Lymphocytes Unveils Uniqueness of Tumor-Infiltrating T Regulatory Cells. Immunity 45, 1135–1147 (2016).
384. Nishikawa, H. et al. Definition of target antigens for naturally occurring CD4+ CD25+ regulatory T cells. J. Exp. Med. 201, 681–686 (2005).
385. Galon, J. & Bruni, D. Approaches to treat immune hot, altered and cold tumours with combination immunotherapies. Nature Reviews Drug Discovery vol. 18 197–218 (2019).
386. Gajewski, T. F. et al. Cancer immunotherapy targets based on understanding the t cell-inflamed versus non-t cell-inflamed tumor microenvironment. in Advances in Experimental Medicine and Biology vol. 1036 19–31 (Springer New York LLC, 2017).
387. Spranger, S. et al. Density of immunogenic antigens does not explain the presence or absence of the T-cell-inflamed tumor microenvironment in melanoma. Proc. Natl. Acad. Sci. U. S. A. 113, E7759–E7768 (2016).
388. Nagarsheth, N., Wicha, M. S. & Zou, W. Chemokines in the cancer microenvironment and their relevance in cancer immunotherapy. Nature Reviews Immunology vol. 17 559–572 (2017).
389. Turley, S. J., Cremasco, V. & Astarita, J. L. Immunological hallmarks of stromal cells in the tumour microenvironment. Nat. Rev. Immunol. 15, 669–682 (2015).
390. Bonaventura, P. et al. Cold tumors: A therapeutic challenge for immunotherapy. Frontiers in Immunology vol. 10 (2019).
391. Hezel, A. F., Kimmelman, A. C., Stanger, B. Z., Bardeesy, N. & DePinho, R. A. Genetics and biology of pancreatic ductal adenocarcinoma. Genes and Development vol. 20 1218–1249 (2006).
392. Siegel, R. L., Miller, K. D. & Jemal, A. Cancer statistics, 2020. CA. Cancer J. Clin. 70, 7–30 (2020).

98
393. Golan, T. et al. Maintenance Olaparib for Germline BRCA-Mutated Metastatic Pancreatic Cancer. N. Engl. J. Med. 381, 317–327 (2019).
394. Tesfaye, A. A., Philip, P. A. & Tesfaye, A. Adjuvant Treatment of Surgically Resectable Pancreatic Ductal Adenocarcinoma. Clinical Advances in Hematology & Oncology vol. 17 (2019).
395. Balsano, R., Tommasi, C. & Garajova, I. State of the art for metastatic pancreatic cancer treatment: Where are we now?*. Anticancer Research vol. 39 3405–3412 (2019).
396. Conroy, T. et al. FOLFIRINOX versus Gemcitabine for Metastatic Pancreatic Cancer. N. Engl. J. Med. 364, 1817–1825 (2011).
397. Von Hoff, D. D. et al. Increased Survival in Pancreatic Cancer with nab-Paclitaxel plus Gemcitabine. N. Engl. J. Med. 369, 1691–1703 (2013).
398. Smith, J. A., Singhi, A. D. & Maitra, A. Precursors to invasive pancreatic cancer. Gastrointest. Cancer Targets Ther. 2012, 19–27 (2012).
399. Hruban, R. H., Wilentz, R. E. & Kern, S. E. Genetic progression in the pancreatic ducts. American Journal of Pathology vol. 156 1821–1825 (2000).
400. Xu, Y., Liu, J., Nipper, M. & Wang, P. Ductal vs. acinar? Recent insights into identifying cell lineage of pancreatic ductal adenocarcinoma. Ann. Pancreat. Cancer 2, 11–11 (2019).
401. Fukuda, A. & Takaori, K. Genetics and biology of pancreatic cancer and its precursor lesions: lessons learned from human pathology and mouse models. Ann. Pancreat. Cancer 2, 1–23 (2019).
402. Friedlander, S. Y. G. et al. Context-Dependent Transformation of Adult Pancreatic Cells by Oncogenic K-Ras. Cancer Cell 16, 379–389 (2009).
403. Morris IV, J. P., Cano, D. A., Sekine, S., Wang, S. C. & Hebrok, M. β-catenin blocks Kras-dependent reprogramming of acini into pancreatic cancer precursor lesions in mice. J. Clin. Invest. 120, 508–520 (2010).
404. O, J.-P. D. La et al. Notch and Kras reprogram pancreatic acinar cells to ductal intraepithelial neoplasia. Proc. Natl. Acad. Sci. 105, 18907–18912 (2008).
405. Habbe, N. et al. Spontaneous induction of murine pancreatic intraepithelial neoplasia (mPanIN) by acinar cell targeting of oncogenic Kras in adult mice. Proc. Natl. Acad. Sci. U. S. A. 105, 18913–18918 (2008).
406. Makohon-Moore, A. P. et al. Precancerous neoplastic cells can move through the pancreatic ductal system. Nature 561, 201–205 (2018).
407. Kanda, M. et al. Presence of somatic mutations in most early-stage pancreatic intraepithelial neoplasia. Gastroenterology 142, 730-733.e9 (2012).
408. Raphael, B. J. et al. Integrated Genomic Characterization of Pancreatic Ductal Adenocarcinoma. Cancer Cell 32, 185-203.e13 (2017).
409. Waters, A. M. & Der, C. J. KRAS: The critical driver and therapeutic target for pancreatic cancer. Cold Spring Harb. Perspect. Med. 8, a031435 (2018).
410. Prior, I. A., Lewis, P. D. & Mattos, C. A comprehensive survey of ras mutations in cancer. Cancer Res. 72, 2457–2467 (2012).
411. Zhou, B., Der, C. J. & Cox, A. D. The role of wild type RAS isoforms in cancer. Seminars in Cell and Developmental Biology vol. 58 60–69 (2016).
412. Qiu, W. et al. Disruption of p16 and activation of kras in pancreas increase ductal adenocarcinoma formation and metastasis in vivo. Oncotarget 2, 862–873 (2011).

99
413. Lim, K. H., Ancrile, B. B., Kashatus, D. F. & Counter, C. M. Tumour maintenance is mediated by eNOS. Nature 452, 646–649 (2008).
414. Grabocka, E. et al. Wild-Type H- and N-Ras Promote Mutant K-Ras-Driven Tumorigenesis by Modulating the DNA Damage Response. Cancer Cell 25, 243–256 (2014).
415. Hingorani, S. R. et al. Preinvasive and invasive ductal pancreatic cancer and its early detection in the mouse. Cancer Cell 4, 437–450 (2003).
416. Notta, F., Hahn, S. A. & Real, F. X. A genetic roadmap of pancreatic cancer: Still evolving. Gut 66, 2170–2178 (2017).
417. Cubilla, A. L. & Fitzgerald, P. J. Morphological Lesions Associated with Human Primary Invasive Nonendocrine Pancreas Cancer. Cancer Res. 36, 2690–2698 (1976).
418. Andea, A., Sarkar, F. & Adsay, V. N. Clinicopathological Correlates of Pancreatic Intraepithelial Neoplasia: A Comparative Analysis of 82 Cases With and 152 Cases Without Pancreatic Ductal Adenocarcinoma. Mod. Pathol. 16, 996–1006 (2003).
419. Pylayeva-Gupta, Y., Lee, K. E., Hajdu, C. H., Miller, G. & Bar-Sagi, D. Oncogenic Kras-Induced GM-CSF Production Promotes the Development of Pancreatic Neoplasia. Cancer Cell 21, 836–847 (2012).
420. McAllister, F. et al. Oncogenic kras activates a hematopoietic-to-epithelial IL-17 signaling axis in preinvasive pancreatic neoplasia. Cancer Cell 25, 621–637 (2014).
421. Ying, H. et al. Genetics and biology of pancreatic ductal adenocarcinoma. Genes and Development vol. 30 355–385 (2016).
422. Hingorani, S. R. et al. Trp53R172H and KrasG12D cooperate to promote chromosomal instability and widely metastatic pancreatic ductal adenocarcinoma in mice. Cancer Cell 7, 469–483 (2005).
423. Westphalen, C. B. & Olive, K. P. Genetically engineered mouse models of pancreatic cancer. Cancer Journal (United States) vol. 18 502–510 (2012).
424. Rhim, A. D. & Stanger, B. Z. Molecular biology of pancreatic ductal adenocarcinoma progression: Aberrant activation of developmental pathways. in Progress in Molecular Biology and Translational Science vol. 97 41–78 (Elsevier B.V., 2010).
425. Yachida, S. et al. Distant metastasis occurs late during the genetic evolution of pancreatic cancer. Nature 467, 1114–1117 (2010).
426. Makohon-Moore, A. P. et al. Limited heterogeneity of known driver gene mutations among the metastases of individual patients with pancreatic cancer. Nat. Genet. 49, 358–366 (2017).
427. Roe, J. S. et al. Enhancer Reprogramming Promotes Pancreatic Cancer Metastasis. Cell 170, 875-888.e20 (2017).
428. Neesse, A. et al. Stromal biology and therapy in pancreatic cancer. Gut vol. 60 861–868 (2011).
429. Schnittert, J., Bansal, R. & Prakash, J. Targeting Pancreatic Stellate Cells in Cancer. Trends in Cancer vol. 5 128–142 (2019).
430. Mekapogu, A. R., Pothula, S. P., Pirola, R. C., Wilson, J. S. & Apte, M. V. Multifunctional role of pancreatic stellate cells in pancreatic cancer. Ann. Pancreat. Cancer 2, 10–10 (2019).
431. Feig, C. et al. Targeting CXCL12 from FAP-expressing carcinoma-associated

100
fibroblasts synergizes with anti-PD-L1 immunotherapy in pancreatic cancer. Proc. Natl. Acad. Sci. U. S. A. 110, 20212–20217 (2013).
432. Neesse, A. et al. Stromal biology and therapy in pancreatic cancer: Ready for clinical translation? Gut 68, 159–171 (2019).
433. Öhlund, D. et al. Distinct populations of inflammatory fibroblasts and myofibroblasts in pancreatic cancer. J. Exp. Med. 214, 579–596 (2017).
434. Bailey, J. M. et al. Sonic hedgehog promotes desmoplasia in pancreatic cancer. Clin. Cancer Res. 14, 5995–6004 (2008).
435. Olive, K. P. et al. Inhibition of Hedgehog signaling enhances delivery of chemotherapy in a mouse model of pancreatic cancer. Science (80-. ). 324, 1457–1461 (2009).
436. Yauch, R. L. et al. A paracrine requirement for hedgehog signalling in cancer. Nature 455, 406–410 (2008).
437. A Study Evaluating IPI-926 in Combination With Gemcitabine in Patients With Metastatic Pancreatic Cancer - Full Text View - ClinicalTrials.gov. https://clinicaltrials.gov/ct2/show/NCT01130142.
438. Özdemir, B. C. et al. Depletion of carcinoma-associated fibroblasts and fibrosis induces immunosuppression and accelerates pancreas cancer with reduced survival. Cancer Cell 25, 719–734 (2014).
439. Rhim, A. D. et al. Stromal elements act to restrain, rather than support, pancreatic ductal adenocarcinoma. Cancer Cell 25, 735–747 (2014).
440. Di Caro, G. et al. Dual prognostic significance of tumour-Associated macrophages in human pancreatic adenocarcinoma treated or untreated with chemotherapy. Gut 65, 1710–1720 (2015).
441. Liou, G. Y. et al. Mutant KRAS–induced expression of ICAM-1 in pancreatic acinar cells causes attraction of macrophages to expedite the formation of precancerous lesions. Cancer Discov. 5, 52–63 (2015).
442. Zhang, Y. et al. Myeloid cells are required for PD-1/PD-L1 checkpoint activation and the establishment of an immunosuppressive environment in pancreatic cancer. Gut 66, 124–136 (2017).
443. Liou, G. Y. et al. Macrophage-secreted cytokines drive pancreatic acinar-to-ductal metaplasia through NF-ΚB and MMPs. J. Cell Biol. 202, 563–577 (2013).
444. Weizman, N. et al. Macrophages mediate gemcitabine resistance of pancreatic adenocarcinoma by upregulating cytidine deaminase. Oncogene 33, 3812–3819 (2014).
445. Hume, D. A. & MacDonald, K. P. A. Therapeutic applications of macrophage colony-stimulating factor-1 (CSF-1) and antagonists of CSF-1 receptor (CSF-1R) signaling. Blood vol. 119 1810–1820 (2012).
446. Zhu, Y. et al. CSF1/CSF1R blockade reprograms tumor-infiltrating macrophages and improves response to T-cell checkpoint immunotherapy in pancreatic cancer models. Cancer Res. 74, 5057–5069 (2014).
447. Griesmann, H. et al. Pharmacological macrophage inhibition decreases metastasis formation in a genetic model of pancreatic cancer. Gut 66, 1278–1285 (2017).
448. Nielsen, S. R. et al. Macrophage-secreted granulin supports pancreatic cancer metastasis by inducing liver fibrosis. Nat. Cell Biol. 18, 549–560 (2016).
449. Kurahara, H. et al. Significance of M2-polarized tumor-associated macrophage in
101
pancreatic cancer. J. Surg. Res. 167, e211–e219 (2011). 450. Beatty, G. L. et al. CD40 agonists alter tumor stroma and show efficacy against
pancreatic carcinoma in mice and humans. Science (80-. ). 331, 1612–1616 (2011). 451. Pylayeva-Gupta, Y., Lee, K. E., Hajdu, C. H., Miller, G. & Bar-Sagi, D. Oncogenic
Kras-Induced GM-CSF Production Promotes the Development of Pancreatic Neoplasia. Cancer Cell 21, 836–847 (2012).
452. Bayne, L. J. et al. Tumor-Derived Granulocyte-Macrophage Colony-Stimulating Factor Regulates Myeloid Inflammation and T Cell Immunity in Pancreatic Cancer. Cancer Cell 21, 822–835 (2012).
453. Stromnes, I. M. et al. Targeted depletion of an MDSC subset unmasks pancreatic ductal adenocarcinoma to adaptive immunity. Gut 63, 1769–1781 (2014).
454. Highfill, S. L. et al. Disruption of CXCR2-mediated MDSC tumor trafficking enhances anti-PD1 efficacy. Sci. Transl. Med. 6, 237ra67-237ra67 (2014).
455. Eash, K. J., Greenbaum, A. M., Gopalan, P. K. & Link, D. C. CXCR2 and CXCR4 antagonistically regulate neutrophil trafficking from murine bone marrow. J. Clin. Invest. 120, 2423–2431 (2010).
456. Steele, C. W. et al. CXCR2 Inhibition Profoundly Suppresses Metastases and Augments Immunotherapy in Pancreatic Ductal Adenocarcinoma. Cancer Cell 29, 832–845 (2016).
457. Nywening, T. M. et al. Targeting both tumour-associated CXCR2+ neutrophils and CCR2+ macrophages disrupts myeloid recruitment and improves chemotherapeutic responses in pancreatic ductal adenocarcinoma. Gut 67, 1112–1123 (2018).
458. Carstens, J. L. et al. Spatial computation of intratumoral T cells correlates with survival of patients with pancreatic cancer. Nat. Commun. 8, (2017).
459. Stromnes, I. M., Hulbert, A., Pierce, R. H., Greenberg, P. D. & Hingorani, S. R. T-cell Localization, Activation, and Clonal Expansion in Human Pancreatic Ductal Adenocarcinoma. Cancer Immunol. Res. 5, 978–991 (2017).
460. Daley, D. et al. γδ T Cells Support Pancreatic Oncogenesis by Restraining αβ T Cell Activation. Cell 166, 1485-1499.e15 (2016).
461. Hartmann, N. et al. Prevailing role of contact guidance in intrastromal T-cell trapping in human pancreatic cancer. Clin. Cancer Res. 20, 3422–3433 (2014).
462. Ene-Obong, A. et al. Activated pancreatic stellate cells sequester CD8+ T cells to reduce their infiltration of the juxtatumoral compartment of pancreatic ductal adenocarcinoma. Gastroenterology 145, 1121–1132 (2013).
463. Beatty, G. L. et al. Exclusion of T Cells From Pancreatic Carcinomas in Mice Is Regulated by Ly6Clow F4/80+ Extratumoral Macrophages. Gastroenterology 149, 201–210 (2015).
464. Chellappa, S. et al. Regulatory T cells that co-express RORγt and FOXP3 are pro-inflammatory and immunosuppressive and expand in human pancreatic cancer. Oncoimmunology 5, (2016).
465. Liyanage, U. K. et al. Prevalence of Regulatory T Cells Is Increased in Peripheral Blood and Tumor Microenvironment of Patients with Pancreas or Breast Adenocarcinoma. J. Immunol. 169, 2756–2761 (2002).
466. Keenan, B. P. et al. A listeria vaccine and depletion of t-regulatory cells activate immunity against early stage pancreatic intraepithelial neoplasms and prolong

102
survival of mice. Gastroenterology 146, 1784 (2014). 467. Lawrence, M. S. et al. Mutational heterogeneity in cancer and the search for new
cancer-associated genes. Nature 499, 214–218 (2013). 468. Bailey, P. et al. Exploiting the neoantigen landscape for immunotherapy of
pancreatic ductal adenocarcinoma. Sci. Rep. 6, 1–8 (2016). 469. Tran, E. et al. T-Cell Transfer Therapy Targeting Mutant KRAS in Cancer. N. Engl.
J. Med. 375, 2255–2262 (2016). 470. Singh, S. et al. Immune checkpoint inhibitors: a promising anticancer therapy. Drug
Discovery Today vol. 25 223–229 (2020). 471. Aglietta, M. et al. A phase I dose escalation trial of tremelimumab (CP-675,206) in
combination with gemcitabine in chemotherapy-naive patients with metastatic pancreatic cancer. Ann. Oncol. (2014) doi:10.1093/annonc/mdu205.
472. O’Hara, M. H. et al. Abstract CT004: A Phase Ib study of CD40 agonistic monoclonal antibody APX005M together with gemcitabine (Gem) and nab-paclitaxel (NP) with or without nivolumab (Nivo) in untreated metastatic ductal pancreatic adenocarcinoma (PDAC) patients. in Cancer Research vol. 79 CT004–CT004 (American Association for Cancer Research (AACR), 2019).
473. Royal, R. E. et al. Phase 2 trial of single agent Ipilimumab (anti-CTLA-4) for locally advanced or metastatic pancreatic adenocarcinoma. J. Immunother. (Hagerstown, Md. 1997) 33, 828–833 (2010).
474. Brahmer, J. R. et al. Safety and activity of anti-PD-L1 antibody in patients with advanced cancer. N. Engl. J. Med. 366, 2455–2465 (2012).
475. Weiss, G. J. et al. A phase Ib study of pembrolizumab plus chemotherapy in patients with advanced cancer (PembroPlus). Br. J. Cancer 117, 33–40 (2017).
476. Kamath, S. D. et al. Ipilimumab and Gemcitabine for Advanced Pancreatic Cancer: A Phase Ib Study. Oncologist 25, e808–e815 (2020).
477. Overman, M. et al. Randomized phase II study of the Bruton tyrosine kinase inhibitor acalabrutinib, alone or with pembrolizumab in patients with advanced pancreatic cancer. J. Immunother. Cancer 8, (2020).
478. Bockorny, B. et al. BL-8040, a CXCR4 antagonist, in combination with pembrolizumab and chemotherapy for pancreatic cancer: the COMBAT trial. Nat. Med. 1–8 (2020) doi:10.1038/s41591-020-0880-x.
479. Xie, C. et al. Immune Checkpoint Blockade in Combination with Stereotactic Body Radiotherapy in Patients with Metastatic Pancreatic Ductal Adenocarcinoma. Clin. Cancer Res. 26, 2318–2326 (2020).
480. O’Reilly, E. M. et al. Durvalumab with or Without Tremelimumab for Patients with Metastatic Pancreatic Ductal Adenocarcinoma: A Phase 2 Randomized Clinical Trial. JAMA Oncol. 5, 1431–1438 (2019).

103
2. TIGIT-based therapy induces potent anti-tumor responses in pancreatic cancer
William A Freed-Pastor1,2‡, Laurens J Lambert1,3‡, Zackery A Ely1,3, Nimisha B Pattada1,
Kim L Mercer1,8, George Eng1,4, Ana P Garcia1, Arjun Bhutkar1, Jason M Schenkel1,5, Lin
Lin1, William M Rideout III1, Roderick T Bronson1, Peter MK Westcott1, William L
Hwang1,6,7, Toni Delorey7, Devan Phillips7, Omer H Yilmaz1,3,4, Aviv Regev1,3,7,8, Tyler
Jacks1,3,8*
1 David H. Koch Institute for Integrative Cancer Research, Massachusetts Institute of
Technology, Cambridge, MA 02139, USA
2 Department of Medical Oncology, Dana-Farber Cancer Institute, Boston, MA, USA
3 Department of Biology, Massachusetts Institute of Technology, Cambridge, MA 02139,
USA
4 Department of Pathology, Massachusetts General Hospital, Boston, MA 02114, USA
5 Department of Pathology, Brigham and Women’s Hospital, Boston, MA 02115, USA
6 Department of Radiation Oncology, Massachusetts General Hospital, Boston, MA
02114, USA
7 Broad Institute of MIT and Harvard, Cambridge, MA 02142, USA
8 Howard Hughes Medical Institute, Massachusetts Institute of Technology, Cambridge,
MA 02139, USA
*Corresponding author
‡These authors contributed equally to this work
Author contributions

104
W.F.P., L.J.L. and T.J. conceived of, designed and directed the study; W.F.P., L.J.L.,
N.B.P., A.P.G., K.L.M., performed all types of experiments reported in the study; Z.A.E.
conducted all scRNA-seq bioinformatic analyses. A.B. conducted TCGA bioinformatic
analyses. G.E., O.H.Y. provided patient samples and provided conceptual advice;
W.F.P., L.L., N.B.P. performed murine surgeries; G.E., R.T.B. provided pathology
expertise; W.F.P., A.P.G., W.M.R. conducted ESC targeting and chimera generation;
W.L.H., T.D., D.P. performed scRNA-seq. J.M.S., P.M.K.W., O.H.Y., A.R. and A.B.
provided conceptual advice; W.F.P., L.J.L. and T.J. wrote the manuscript with comments
from all authors.
2.1 Abstract
Pancreatic adenocarcinoma (PDAC) carries a dismal prognosis and remains largely
recalcitrant to immune checkpoint blockade1–3. Recent sequencing efforts have
demonstrated that the majority of human PDAC contains predicted high affinity
neoantigens4,5, despite harboring a relatively low mutational burden6. Human PDAC is
also characterized by CD8+ tumor-infiltrating lymphocytes (TILs) expressing multiple co-
inhibitory receptors, consistent with T cell dysfunction7. However, our understanding of
the full range of molecular and cellular mechanisms underlying immune evasion in PDAC
remains incomplete. Here we demonstrate, using two novel preclinical models of
neoantigen-expressing PDAC, that antigen-specific CD8+ TILs become progressively
dysfunctional and facilitate immune evasion in a distinct subset of tumors. Both
autochthonous and organoid-based approaches faithfully recapitulate immune editing
and/or clearance, consistent with prior studies4,8. However, in contrast to observations in

105
tumors derived from monolayer cell lines8, these models uncover a significant subset of
neoantigen-expressing pancreatic tumors that successfully evade immune clearance,
despite eliciting an antigen-specific immune response. Using multiparameter flow
cytometry and single-cell transcriptomic profiling, we observe multiple classes of CD8+
TILs with markers of dysfunction in murine PDAC, and identify analogous CD8+ TIL
populations in human PDAC. Additionally, we demonstrate that combinatorial targeting
of TIGIT/PD-1/CD40 can reinvigorate an effective anti-tumor immune response. This
detailed characterization of antigen-specific CD8+ TILs offers important insights into
immune evasion in PDAC, which may be leveraged for rational combination
immunotherapy to combat this devastating disease.
2.2 Main results
2.2.1 Preclinical modeling of immunogenic pancreatic cancer
To model the subset of PDAC patients with predicted high affinity neoantigens, we
adapted retrograde pancreatic duct delivery9 of lentiviruses that did or did not express a
defined neoantigen in conjunction with existing Cre/LoxP-regulated genetically
engineered mouse models (Figure 1a,b). Pancreatic tumors were induced in either
immune-competent KrasLSL-G12D/+;Trp53fl/fl (KP) or immune-deficient (KP + CD8a
depletion) mice using lentiviral vectors that expressed Cre recombinase alone (‘Cre’) or
Cre in addition to the T cell antigens (OVA257–264 [SIINFEKL] and OVA323–339) fused to the
carboxy terminus of mScarlet10 (‘mScarletSIIN’). Retrograde ductal instillation of Cre-
expressing lentivirus led to histologically confirmed pancreatic intraepithelial neoplasia
(PanIN)/PDAC formation in ~90% of immune-deficient or immune-competent animals by

106
9 weeks post-initiation (Extended Data Figure 1a). Similarly, 88% of immune-deficient
animals transduced with lentivirus expressing mScarletSIIN developed histologically
confirmed PanIN/PDAC by 9 weeks post-initiation (Extended Data Figure 1a).
Importantly, 100% of these tumor-bearing animals retained mScarlet positivity within
PanIN/PDAC lesions (Figure 1c,e and Extended Data Figure 1a,c). In contrast, less than
50% of immune-competent animals transduced with lentivirus expressing mScarletSIIN
developed PanIN/PDAC by 9 weeks post-initiation, suggesting that antigen-expressing
cells were cleared by CD8+ T cells during tumor development (Figure 1d,f and Extended
Data Figure 1a). Of those tumors that did ultimately develop in immune-competent
animals transduced with mScarletSIIN, 80% exhibited lack of tumor-associated mScarlet
fluorescence, as determined by both fluorescence stereomicroscopy and
immunohistochemical analysis (Figure 1d,f and Extended Data Figure 1c), highly
suggestive of immune editing. Of note, a subset (~10%) of immune-competent animals
transduced with mScarletSIIN developed macroscopic tumors that retained mScarlet
positivity, suggestive of immune evasion (Figure 1d,f and Extended Data Figure 1c). No
differences in tumor burden was observed in animals transduced with Cre or
mScarletSIIN lentivirus, with or without CD8a-depletion (Extended Data Figure 1b).
Delivery of mScarletSIIN induced a robust CD8+ T cell response that facilitated the
tracking and immunophenotyping of antigen-specific (CD44hiH-2Kb-SIINFEKL+ [hereafter
referred to as ‘CD44hiTetramer+’]) CD8+ T cells both peripherally and within the tumor
microenvironment (Figure 1g-i). Intriguingly, we observed that antigen-specific CD8+ TILs
isolated from ‘immune evasive’ tumors displayed co-expression of multiple co-inhibitory
receptors, suggestive of T cell dysfunction (CD44hiTetramer+PD1+TIGIT+ (Extended Data

107
Figure 1d). However, the rarity of these ‘immune evasive’ autochthonous tumors
precluded a more extensive analysis of T cell phenotypes in this model.
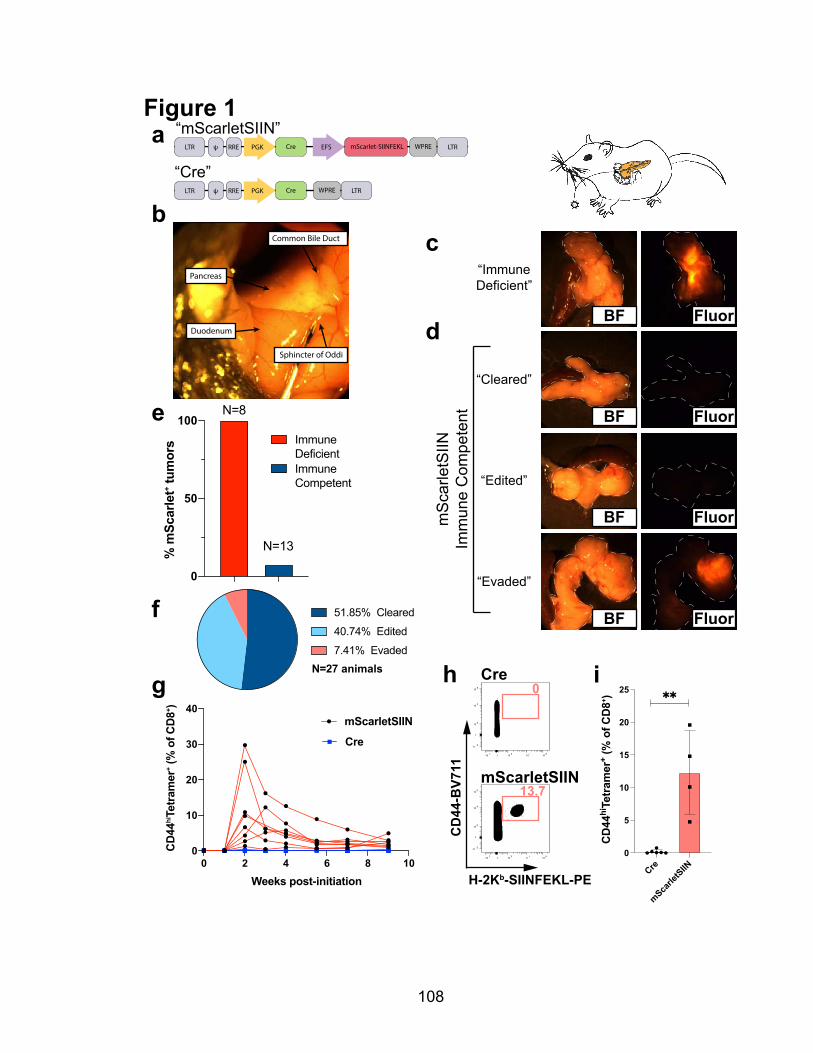
108
Figure 1
bc
g
aLTR mScarlet-SIINFEKL WPRE! RRE PGK LTRCre EFS
LTR ! RRE PGK WPRE LTRCre
“mScarletSIIN”
“Cre”
0
50
100
% m
Scar
let+ t
umor
s
N=8
N=13
Immune DeficientImmune Competent
Pancreas
Duodenum
Common Bile Duct
Sphincter of Oddi
d
e
N=27 animals
51.85% Cleared
40.74% Edited
7.41% Evaded
f
0 2 4 6 8 100
10
20
30
40
Weeks post-initiation
CD
44hiTe
tram
er+ (
% o
f CD
8+ )
mScarletSIIN
Cre
“ImmuneDeficient”
“Edited”
“Cleared”
“Evaded”
mS
carle
tSIIN
Imm
une
Com
pete
nt
Fluor
Fluor
Fluor
Fluor
BF
BF
BF
BF
Cre
mScarletSIIN
H-2Kb-SIINFEKL-PE
CD
44-B
V711
0-10 3 10 3 10 4 10 5
0
-10 3
10 3
10 4
10 5
0-10 3 10 3 10 4 10 5
0
-10 3
10 3
10 4
10 5
h0
13.7
i
Cre
mScarle
tSIIN
0
5
10
15
20
25
CD
44hi
Tetr
amer
+ (%
of C
D8+ )

109
2.2.2 Immune evasive pancreatic tumors retain antigen expression and presentation
As immune editing in cancer can occur through epigenetic silencing or genetic
deletion of the locus containing the neoantigen11, we developed a genetic approach in
which SIINFEKL, linked to mScarlet on a polycistronic transcript, was knocked into the
Hipp11 safe harbor locus12 using CRISPR/Cas9-assisted homology-directed repair
(HDR) (Figure 2a). Following PCR and Southern blot validation of correctly targeted KP
murine embryonic stem cell (mESC) clones (Extended Data Figure 2), we derived a
homozygous-targeted pancreatic organoid line from chimeric animals, which maintained
robust and uniform mScarletSIIN expression ex vivo (‘KP;H11-SIIN’) (Figure 2b and
Extended Data Figure 2). Consistent with our observations in autochthonous
immunogenic pancreatic cancer, orthotopic transplantation of genetically-defined
KP;H11-SIIN pancreatic organoids into immune-deficient recipients resulted in 100%
mScarlet-positive tumor formation after 8 weeks (Figure 2c). Conversely, orthotopic
transplantation into immune-competent recipients resulted in 40% immune clearance
(mScarlet-negative and histologically normal pancreas; termed ‘non-progressor’) and
50% immune evasion (mScarlet-positive macroscopic tumor; termed ‘progressor’).
However, we observed no incidence of macroscopic tumors that had lost antigen
Figure 1. Divergent tumor and antigenic outcomes in autochthonous immunogenic pancreatic cancer.a, Lentiviral vectors used to generate immunogenic (‘mScarletSIIN’) and control (‘Cre’) autochthonous PDAC. b, Retrograde pancreatic duct instillation of lentivirus. c, Brightfield (left) and fluorescence stereomicroscopic (right) images of representative 9-week tumors generated using mScarletSIIN in CD8_<depleted animals. d, Brightfield (left) and fluorescence stereomicroscopic (right) images of representative tumor and antigenic outcomes (“cleared”, “edited”, “evaded”) using mScarletSIIN in immune-competent animals. e, Percent of mScarlet-positive tumors as assessed by fluorescence stereo-microscopy at 9 weeks post-initiation (n=8 immune-deficient; n=13 immune-competent). f, Quantification of tumor and antigenic outcomes in mScarletSIIN immune-competent animals (n=27). g, Longitudinal tracking of antigen-specific (CD44hiTetramer+) CD8+ T cells in the peripheral blood of Cre (n=6) and mScarletSIIN (n=8) animals. h, Representative flow cytometric plots and i, quantification of CD44hiTe-tramer+ (gated on single cells/live/CD8+ lymphocytes) within early-stage (3 week) pancreatic lesions (scatter dot plots; mean +/- SD). Statistical analyses: i, two-sided Mann-Whitney test (** P<0.01).

110
expression, as assessed by stereomicroscopy, immunohistochemical staining and tumor-
derived organoid culture (Figure 2d-e, Extended Data Figure 3a,b and Extended Data
Figure 4a). In addition, we observed a subset (10%) of immune-competent recipients
that retained small areas of mScarlet-positivity in the absence of macroscopic tumor
formation (termed ‘intermediate’), potentially reflective of a state of immune equilibrium
(Figure 2d,e). In line with this hypothesis, we observed that progressor tumors were
significantly smaller than tumors that were never exposed to an immune selective
pressure (P<0.01, Mann-Whitney), potentially suggestive of a prior state of immune
equilibrium before ultimate immune escape (Figure 2f). We longitudinally tracked the
antigen-specific CD8+ T cell response in animals transplanted with either KP (no
neoantigen) or KP;H11-SIIN pancreatic organoids and demonstrate that only KP;H11-
SIIN recipients mount a SIINFEKL-specific CD8+ T cell response. Furthermore, the
magnitude and kinetics of the peripheral response (peaking at 3 weeks post-initiation) are
indistinguishable between non-progressor and progressor animals (P=n.s., Mann-
Whitney; Extended Data Figure 3c). Immunohistochemical and flow cytometric analyses
of late-stage progressor tumors revealed an ongoing CD8+ T cell response, with some
intratumoral areas displaying T cell exclusion and others with a high degree of infiltration
(Extended Data Figure 3a,d).
In order to characterize the potential mechanisms of immune escape employed by
progressor tumors, we re-derived pancreatic tumor organoids from both progressor and
immune-deficient animals for ex vivo characterization (Extended Data Figure 4). After
purifying the malignant compartment through Nutlin-3a selection (see Methods), we
performed flow cytometry to characterize surface expression of MHC Class I (H-2Kb, H-

111
2Db), MHC Class II and PD-L1 on tumor-derived organoids and assayed their
responsiveness to interferon-g stimulation. None of the progressor tumors exhibited loss
of antigen expression, H-2Kb MHC Class I expression or interferon-g sensitivity by this
assay (Figure 2g, Extended Data Figure 4a-d). To further establish that progressor tumor
cells retained full capacity to process and present the SIINFEKL neoantigen on their cell
surface, we established an organoid/CD8+ T cell co-culture system. Progressor or
immune-deficient tumor-derived organoids were co-embedded in a three-dimensional
extracellular matrix with activated ‘OT-I’ CD8+ T cells (transgenic for a TCR specific for
SIINFEKL in the context of H-2Kb)13. Both progressor and immune-deficient organoids
underwent T cell-dependent killing across multiple effector: target (E:T) ratios (Figure 2h
and Extended Data Figure 4e,f), further demonstrating that progressor tumors retain
antigen expression and antigen presentation capacity. Additionally, these results suggest
that progressor tumors might employ non-cell autonomous mechanisms to mediate
immune escape in vivo.
To characterize the tumor immune microenvironment of progressor tumors, we
performed multiparameter flow cytometric analysis of CD45+ immune cell subsets,
isolated directly from KP;H11-SIIN progressor tumors or KP tumors. In line with
observations from both human PDAC and the ‘KPC’ mouse model of PDAC14,15, we
observed a strong myeloid predominance (neutrophils/macrophages) and a paucity of
dendritic cells in both KP and KP;H11-SIIN tumors (Extended Data Figure 5). While there
was considerable inter-tumoral heterogeneity, no reproducible differences were found
between KP;H11-SIIN and KP tumors in terms of relative abundance of neutrophils
(CD11b+Ly6G+), macrophages (F4/80+CD64+), monocytes (CD1lb+Ly6C+), B cells

112
(CD19+MHCII+), dendritic cells (CD11c+MHCII+) or dendritic cell subsets (cDC1 [XCR1+]
or cDC2 [CD172a+]) (Extended Data Figure 5).

113
‘KP;H11-SIIN’
Figure 2a
e
Immune-deficient
Progressor (P)
Intermediate (I)
Non-progressor (N)
mScarlet WPRE BgH pASIINFEKL P2APGK ATG
Koza
k
Hipp11-5’-arm Hipp11-3’-arm
b
FluorBF
c f
h Immune-deficientProgressorNo T cells 5:1 10:1
BF
Fluor
BF
Fluor
BF
Fluor
FluorBF
Non-progressor (N)
Progressor (P)Immune-deficient
Intermediate (I)
d
50%40%
10%Progressor (P)Non-progressor (N)Intermediate (I)N=60 animals
g
H-2Kb-APC
Mod
e)Immune-deficient (-IFN)Immune-deficient (+IFN
)Progressor (-IFNProgressor (+IFN )
10 0 10 1 10 2 10 3 10 4
0
20
40
60
80
100
No T cells 5:1 10:1
0
200
400
600
800
1000
H2K
b gM
FI
ns
ns
0
500
1000
1500
2000
2500
Tum
or W
eigh
t (m
g)
*****

114
2.2.3 Multiple classes of antigen-specific CD8+ TILs within immune evasive pancreatic
tumors
To further elucidate potential mechanisms of immune evasion, we performed
single-cell transcriptomic profiling (scRNA-seq)16 on antigen-specific
(CD8+CD44hiTetramer+) TILs isolated from progressor tumors. After quality control
filtering (see Methods), we clustered 482 antigen-specific CD8+ TILs and computed
differential gene expression between four distinct clusters (Figure 3a and Extended Data
Figure 6b-e). Differential gene expression between transcriptomic clusters suggested
distinct cell states within the antigen-specific CD8+ T cell compartment (Figure 3b). The
largest cluster (cluster 0) was enriched for several genes associated with both CD8+ T
cell activation and/or exhaustion (Pdcd1, Havcr2, Lag3, Tox, Gzmb) (Figure 3d and
Extended Data Figure 6c). A smaller cluster (cluster 3) was enriched for hallmarks of
CD8+ T regulatory cells (Klra6, Klra7, Ly6c2) (Figure 3c and Extended Data Figure 6e),
previously described in both autoimmunity17,18 and cancer19. Two clusters (clusters 1 and
Figure 2. Orthotopic transplant of immunogenic organoids offers a robust platform to assess immune clearance and immune evasion in the same tissue and antigenic context.a, ‘Hipp11-mScarletSIIN’ genomic locus after CRISPR/Cas9-assisted homology-directed repair and Cre recombination. b, Brightfield (left) and fluorescent (right) images of KrasG12D/+;Trp53-/-; Hipp11mScarletSIIN (‘KP;H11-SIIN’) pancreatic organoids. Brightfield (left) and fluorescence stereomicroscopic (right) images of representative 8-week tumors following orthotopic transplantation of KP;H11-SIIN pancreatic organ-oids into c, immune-deficient (Rag2-/-) animals or d, immune-competent animals, depicting the range of tumor and antigenic outcomes in this context (‘progressor’, ‘intermediate’, ‘non-progressor’). e, Quantifi-cation of tumor and antigenic outcomes 8-9.5 weeks post-orthotopic transplantation of KP;H11-SIIN pancreatic organoids into immune-competent animals (n=60). f, Tumor/pancreas weights 8-9.5 weeks post-orthotopic transplantation of KP;H11-SIIN pancreatic organoids (n=5 Rag2-/-; n=24 ‘non-progressor’; n=6 ‘intermediate’, n=30 ‘progressor’; horizontal bars represent median). g, Flow cytometric profiling of surface MHC-I (H-2Kb) on tumor-derived pancreatic organoids from progressor (n=7) or immune-deficient (n=5) animals with or without interferon-a stimulation, representative histogram (left) or geometric mean fluorescence intensity (gMFI) scatter plots (mean +/- SD; right). h, Representative images of Day 5 tumor-derived pancreatic organoids from progressor or immune-deficient animals either in the absence (no T cells) or presence of pre-activated OT-I CD8+ T cells at 5:1 or 10:1 Effector:Target (E:T) ratios. Statistical analyses: f,g, two-sided Mann-Whitney test (n.s. P=non-signficant, ** P<0.01, *** P <0.001).
115
2) were enriched for markers of naïve/memory CD8+ T cells (Sell, Ccr7, Klf2, Tcf7),
potentially reflecting one or more aberrant memory-like cell states (Extended Data Figure
6d). To further characterize this data, we generated and plotted scores for gene modules
(see Methods) derived from CD8+ T cells in defined cell states from both acute and
chronic lymphocytic choriomeningitis virus (LCMV)20 and B16 melanoma19. Intriguingly,
cluster 0 was enriched for ‘T cell exhaustion’ as well as ‘chronic effector’ signatures,
previously identified in a viral model of T cell dysfunction20 (Figure 3e and Extended Data
Figure 7a-b). Likewise, the mixed ‘activation/dysfunction’ gene module previously
identified in B16 melanoma19 was overrepresented in cluster 0 (Extended Data Figure
7c). Additionally, clusters 1 and 2 expressed a transcriptional program with a high degree
of overlap with the ‘naïve/memory’ gene module from B16 melanoma19 (Extended Data
Figure 7c), but interestingly also shared overlap with an effector-biased module from
acute LMCV20 (‘AM13’; Extended Data Figure 7b), further suggestive of an aberrant
memory-like program. We then employed flow cytometric profiling to validate the
presence of these cell populations within antigen-specific CD8+ TILs. Consistent with the
hypothesis that most antigen-specific CD8+ TILs are dysfunctional within progressor
tumors, we observed a decrease in their proliferative capacity (marked by Ki67+)
(Extended Data Figure 8c). Both CD44hiTetramer+PD1+TIGIT+ and
CD44hiTetramer+Ly49+ populations were disproportionately represented in late-stage
progressor tumors compared to non-progressors (Figure 3g-i and Extended Data Figure
8a,b). As co-expression of co-inhibitory receptors is thought to distinguish a more
dysfunctional phenotype from activation21,22, we sought to examine antigen-specific CD8+
TILs from early-stage intermediate and progressor tumors (week 5). We observed

116
increased co-expression of PD1+TIGIT+, PD1+TIM3+, and PD1+LAG3+ in intermediate
and progressor tumors (Extended Data Figure 8a,b), suggesting that the acquisition of a
dysfunctional phenotype may occur early in tumor development22. In order to more deeply
characterize these antigen-specific CD8+ TILs, we employed Pathway and Gene Set
Overdispersion Analysis (PAGODA)23 to derive de novo gene set signatures from scRNA-
seq data. This identified three gene set signatures that overlaid clusters 1 and 2
(Pagoda30) and cluster 0 (Pagoda36, Pagoda45) (Figure 3f and Extended Data Figure
7e), further highlighting the heterogeneity within the antigen-specific CD8+ T cell
compartment in immune evasive tumors.
To determine if human PDAC harbors analogous classes of CD8+ T cells, we took
two parallel approaches. First, we isolated and performed flow cytometry on CD8+ TILs
from freshly resected pancreatic adenocarcinoma specimens. Of the 13 specimens
tested, 9 had sufficient (>200) CD8+ TILs for further immunophenotyping. In line with
previous reports7, we demonstrate that the majority (64-96%) of CD8+ TILs are antigen-
experienced (CD45RO+TCF1lo) and are similarly enriched for co-expression of multiple
co-inhibitory receptors (PD1+TIGIT+, PD1+LAG3+, and PD1+TIM3+), suggestive of a state
of T cell dysfunctionality in the tumor microenvironment (Extended Data Figure 9a-c).
Next, we explored the prognostic value of our de novo gene signatures in the
human pancreatic cancer (PAAD) cohort from the Cancer Genome Atlas
(TCGA)24. Individual patient tumors were stratified according to their bulk RNA-seq gene
expression correlation with Pagoda30, Pagoda36, and Pagoda45 gene modules. We
observed no prognostic impact of Pagoda30 (data not shown), whereas high-scoring
patients (upper quartile, n=44), whose gene expression profiles correlated with either

117
Pagoda36 or Pagoda45, exhibited significantly worse survival compared to patients
whose gene expression profiles were least correlated with the respective signatures
(lower quartile, n=44) (Figure 3j and Extended Data Figure 9d). Furthermore, we utilized
TCGA gene expression data to elucidate transcriptomic signatures that distinguish high-
versus low-scoring patient cohorts and to query co-inhibitory receptor expression in
relation to our de novo gene signatures. As Pagoda36 is defined by expression of genes
canonically associated with T cell exhaustion, it is perhaps not surprising that we
observed a strong correlation of multiple co-inhibitory receptors with the Pagoda36
signature (Extended Data Figure 9e). Interestingly, TIGIT expression in human PDAC
was the most highly correlated co-inhibitory receptor to both Pagoda45 and Pagoda36
transcriptomic signatures (Figure 3k and Extended Data Figure 9e), suggesting that
TIGIT may represent a critical immune checkpoint in human
PDAC.

118
Figure 3a
c
d
e
f
0 3
1
2
ï�
0
�
4
ï� 0UMAP_1
80$3
B�
ï�
ï�
0
�
4
ï� 0UMAP_1
80$3
B�
1.4���1.61.71.8
Klra6
ï�
ï�
0
�
4
ï� 0UMAP_1
80$3
B�
���1.41.61.8���
Klra7
ï�
ï�
0
�
4
ï� 0UMAP_1
80$3
B�
����0.10������������
CM1(LCMV Exhaustion)
g h i
0
20
40
60
CD
44hiTe
tram
er+
(% o
f CD
8+ )
ns
ï�
ï�
0
�
4
ï� 0UMAP_1
80$3
B�
����0.10����
CM2(LCMV chronic effector)
GzmkGzmbMafCcl3Ccl4Havcr2Il10Bcl2a1bBcl2a1dAnxa2Nr4a2Rgs16Bhlhe40Ctla4PtmsLag3Pdcd1ToxCasp3Ier5l
AC163354.1Tcrg-C2Gm156Fgl2Cxcr6Serpina3gKlrk1Klre1Klrc2Klrc1Lgals1AhnakS100a4S100a6Lgals3Ctla2aCcl5IfngRgs1Id2
Non-progressor (N) Progressor (P)
j
0.0
���
0.4
0.6
0.8
1.0 High (n=44)
Low (n=44)S� ��������
1 � 3 4 �
Years
Surv
ival
frac
tion
Pagoda45 (TCGA)
0
10
20
30
40
PD1+ T
IGIT
+ (%
of C
D44
hiTe
tram
er+ )
0
2
4
6
8
10
Ly49
+ (%
of C
D44
hiTe
tram
er+ )
|Sig
natu
re z
_sco
re|
Log2FC
Pagoda45 (TCGA)kTIGIT
ï�
ï�
0
�
4
ï� 0UMAP_1
80$3
B�
0.1���0.30.4���
Pagoda 36
ï�
ï�
0
�
4
ï� 0UMAP_1
80$3
B�
���0.40.6
Pagoda 45
b 0 1 � 3
Xcl1Clec2iGzmm
Gas7Ms4a4c
Yes1F2rl1
Slc11a2Rbpms
Klra9Samd3Ly6c2
1700025G04RikKlra6Klra7
Cd79bTmem108
Ccr9Il6ra
Treml2Art2bActn1IghmDtx1
Ramp1Pdk1Ssh2Lef1
Nsg2Csrnp1
Gm20186Klf2
Ppp1r15aSocs1Zfp36
MaffSatb1
FosSell
Ccr7Tdrp
Fam241aSbno2Igfbp4Dapl1Socs3AhnakKlrk1PtmsCcl3Litaf
GzmkNr4a2
Bcl2a1dCcl5
Klrc1Fasl
GzmbLgals3Rgs16
Bhlhe40Ccl4Lag3
Pdcd1S100a6S100a4
ï�
ï�
0
1
�
Expression
ï�
ï�
0
�
4
ï� 0UMAP_1
80$3
B�
1.6������
Pdcd1
ï�
ï�
0
�
4
ï� 0UMAP_1
80$3
B�
1.6������
Tox
Figure 3. Distinct classes of antigen-specific CD8+ TILs isolated from immune evasive PDAC.a, UMAP projection of scRNA-seq of CD8+CD44hiTetramer+ TILs from progressor tumors. b, Heatmap of differentially expressed genes between clusters with selected genes highlighted. UMAP projections of the gene expression for c, Klra6 (Ly49F), Klra7 (Ly49G2). d, Pdcd1 (PD-1), Tox (Tox). e, UMAP projections of the gene module expression for “LCMV T cell exhaustion” (CM1) and “LCMV T cell chronic effector” (CM2). f, Heatmap and UMAP projections of the expression for Pagoda signatures (Pagoda36, Pago-da45). g, CD8+ TIL analysis of late-stage (week 9.5) non-progressor or progressor animals. h, CD44hiTe-tramer+Ly49F/G2+ CD8+ TILs i, CD44hiTetramer+PD1+TIGIT+ CD8+ TILs in late-stage (week 9.5) non-pro-gressor or progressor animals (g-i, gated on single/lymphocytes/CD45+,live, all three scatter plots show-ing mean +/- SD). j, Kaplan-Meier survival analysis of upper (“High”, red) and lower (“Low”, blue) quartile TCGA PAAD patients (n=44 each) stratified by expression correlation with the murine-derived Pagoda45 gene signature. k, All genes ranked by absolute z-score in the human TCGA PAAD gene signature between most and least Pagoda45-correlated cohorts (y-axis) compared to the magnitude of their fold change (x-axis, log2 fold change (Log2FC) of most/least-correlated cohort expression). Selected co-in-hibitory receptors highly upregulated in most-correlated tumors are highlighted in red. Statistical analyses: g-i, two-sided Mann-Whitney test (n.s. P=non-significant, ** P<0.01), j, log-rank test (P=0.00925).

119
2.2.4 TIGIT-directed combination immunotherapy as a novel therapeutic approach in
PDAC
While CTLA-4 and/or PD-L1 inhibition have failed to show clinical benefit in human
PDAC1–3, recent reports have highlighted the clinical promise of combining anti-PD-1
antibodies with CD40 agonistic antibodies and cytotoxic chemotherapy25. In order to
rationally guide possible combination immunotherapies in PDAC, we queried protein
expression of the canonical ligands for co-inhibitory receptors (PD-L1 [PD-1], Galectin 9
[TIM3], CD155/PVR [TIGIT])26, using human PDAC tissue microarrays27,28. Consistent
with prior reports29, we observed little to no expression of PD-L1 in human PDAC,
whereas both Galectin 9 and CD155/PVR were expressed at “high/medium” levels on
40% and 50% of tumors, respectively (Figure 4a,b).
Given the elevated expression of CD155 in human PDAC and the strong
correlation of TIGIT gene expression with Pagoda36 and Pagoda45, we evaluated TIGIT-
directed combination immunotherapy as a novel therapeutic approach for PDAC.
Following orthotopic transplantation of KP;H11-SIIN pancreatic organoids into immune-
competent animals and confirmation of tumor establishment and progression (at 6 weeks
post-initiation), animals were randomized by baseline tumor volume to an isotype control
arm or one of five therapeutic arms (anti-PD-1, anti-TIGIT, anti-PD-1 + CD40 agonist,
anti-TIGIT + CD40 agonist, anti-TIGIT + anti-PD-1 + CD40 agonist) for treatment over 4
weeks (Figure 4c). As expected, isotype control-treated tumors grew unabated (Figure
4d,e), as assessed by serial high-resolution ultrasound imaging. Consistent with clinical
observations, anti-PD-1 monotherapy had no appreciable impact on tumor progression
(0% objective response rate [ORR]) (Figure 4d,f). Similarly, both anti-TIGIT monotherapy
120
(0% ORR) and anti-TIGIT + CD40 agonist (9% ORR) demonstrated minimal clinical
efficacy (Figure 4d,g,i). In line with the early clinical promise of anti-PD-1 + CD40 agonist
antibodies observed in clinical trials25, we observed an 18% ORR with anti-PD-1 + CD40
agonist therapy (Figure 4d,h). Excitingly, in triple therapy-treated animals (anti-TIGIT +
anti-PD-1 + CD40 agonist), we observed an increase in objective response and disease
control rates (40% ORR, 70% DCR) with 20% durable complete responses (CR) (Figure
4d,j). Notably, all therapeutic arms were well tolerated as assessed by body status and
weight (Extended Data Figure 10). After completion of the predefined treatment period,
many initial responders rapidly progressed. However, complete responders remained
durable following therapy discontinuation [ongoing CRs >12 weeks after stopping therapy
at the time of data cut-off] (Extended Data Figure 10). This implies that continuous
therapy may be required for all but complete responders to achieve durable benefit.
Because all three of these targets have therapeutic monoclonal antibodies in clinical
development or are already approved for clinical use, anti-TIGIT+anti-PD-1+CD40
agonist combination immunotherapy may represent a promising approach for rapid
clinical evaluation.
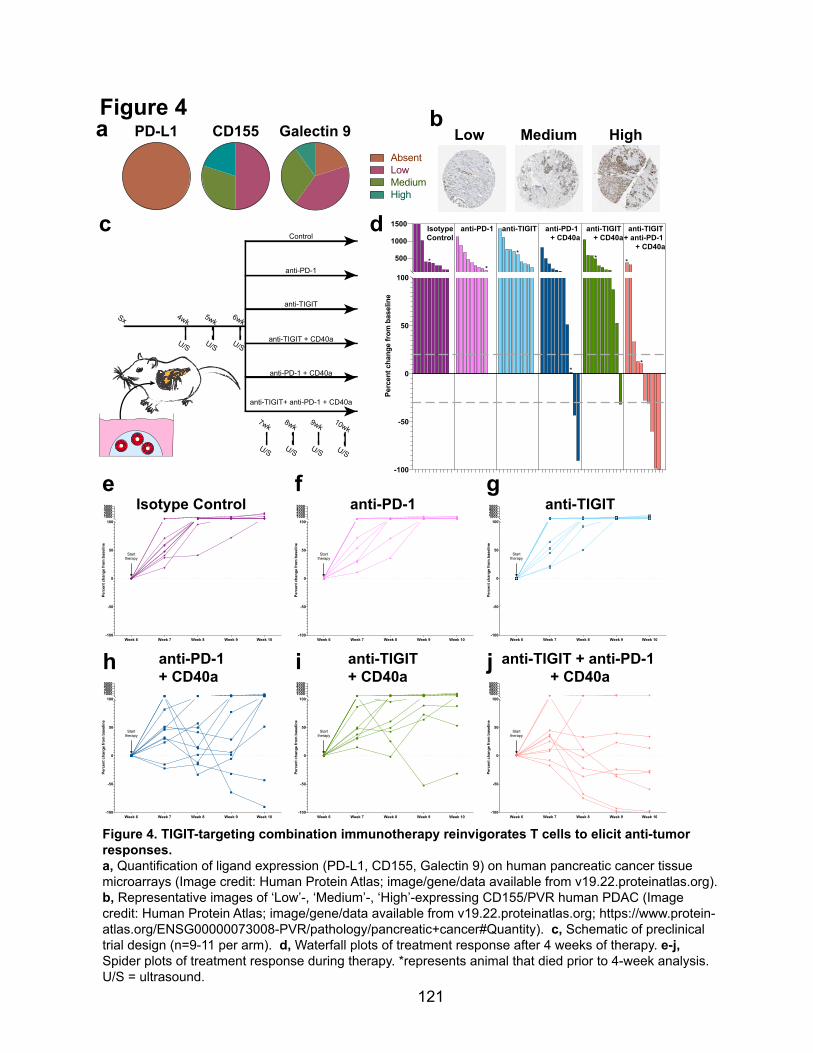
121
Figure 4
c
e
Control
U/S
4wk
U/S
5wk
U/S
6wkSx
U/S
7wk
U/S
8wk
U/S
9wk
U/S
10wk
anti-PD-1
anti-TIGIT
anti-TIGIT+ anti-PD-1 + CD40a
anti-PD-1 + CD40a
anti-TIGIT + CD40a
f
d
-100
-50
0
50
100
500
1000
1500
Perc
ent c
hang
e fr
om b
asel
ine
*
*
*
*
***
anti-TIGIT + anti-PD-1
+ CD40a
anti-TIGIT + CD40a
anti-PD-1 + CD40a
anti-TIGIT anti-PD-1 IsotypeControl
gIsotype Control
anti-PD-1 + CD40a
Week 6 Week 7 Week 8 Week 9 Week 10-100
-50
0
50
10010002000300040005000
Perc
ent c
hang
e fr
om b
asel
ine
Start therapy
Week 6 Week 7 Week 8 Week 9 Week 10-100
-50
0
50
10010002000300040005000
Perc
ent c
hang
e fr
om b
asel
ine
Start therapy
Week 6 Week 7 Week 8 Week 9 Week 10-100
-50
0
50
10010002000300040005000
Perc
ent c
hang
e fr
om b
asel
ine
Start therapy
Week 6 Week 7 Week 8 Week 9 Week 10-100
-50
0
50
10010002000300040005000
Perc
ent c
hang
e fr
om b
asel
ine
Start therapy
anti-TIGIT + CD40a
anti-PD-1
anti-TIGIT + anti-PD-1 + CD40a
Week 6 Week 7 Week 8 Week 9 Week 10-100
-50
0
50
10010002000300040005000
Perc
ent c
hang
e fr
om b
asel
ine
Start therapy
Week 6 Week 7 Week 8 Week 9 Week 10-100
-50
0
50
10010002000300040005000
Perc
ent c
hang
e fr
om b
asel
ine
Start therapy
anti-TIGIT
h i j
CD155AbsentLowMediumHigh
PD-L1 Galectin 9a bLow Medium High
Figure 4. TIGIT-targeting combination immunotherapy reinvigorates T cells to elicit anti-tumor responses.a, Quantification of ligand expression (PD-L1, CD155, Galectin 9) on human pancreatic cancer tissue microarrays (Image credit: Human Protein Atlas; image/gene/data available from v19.22.proteinatlas.org). b, Representative images of ‘Low’-, ‘Medium’-, ‘High’-expressing CD155/PVR human PDAC (Image credit: Human Protein Atlas; image/gene/data available from v19.22.proteinatlas.org; https://www.protein-atlas.org/ENSG00000073008-PVR/pathology/pancreatic+cancer#Quantity). c, Schematic of preclinical trial design (n=9-11 per arm). d, Waterfall plots of treatment response after 4 weeks of therapy. e-j, Spider plots of treatment response during therapy. *represents animal that died prior to 4-week analysis. U/S = ultrasound.
122
2.3 Discussion
While pancreatic tumorigenesis is initiated by genetic events, the tumor immune
microenvironment plays an instrumental role in shaping tumor progression. Our present
study using two orthogonal preclinical models of neoantigen-expressing pancreatic
cancer reveals that PDAC undergoes all three phases of immunosurveillance30. Notably,
this stands in contrast to a recent report using an antigen-expressing PDAC model that
lacks detectable immune editing/clearance and paradoxically displays accelerated tumor
progression as a consequence of antigen expression15. Future studies will be needed to
address the potential role of model-specific differences in these results. Importantly, our
data reveal that a subset of pancreatic cancer evades immune clearance despite
continued expression of a high affinity neoantigen, and furthermore suggest that immune
evasion in pancreatic cancer can be non-cell autonomous. Additionally, using high-
resolution profiling, we uncovered multiple subsets of antigen-specific CD8+ TILs within
immune-evasive tumors. This highlights an underappreciated heterogeneity within the
antigen-specific TIL compartment, including cells in an exhausted state, chronic-effector
state, memory-like state, and a state reminiscent of CD8+ T regulatory cells well-
described in autoimmunity17.
Immune modulation has emerged as a promising therapeutic strategy for
numerous tumor types. However, it is likely that tissue of origin, histologic subtype and/or
genetic alterations might dictate disparate mechanisms of immune evasion31,32. Here we
uncover a unique dependency on the TIGIT/CD155 axis, when targeted in conjunction
with PD-1+CD40, for continued immune evasion in PDAC. As CD155/PVR has been
reported to be upregulated by oncogenic KRAS33, it is tempting to speculate that the
123
TIGIT/CD155 axis might represent a critical immune checkpoint in additional KRAS-
driven tumors. While our data implicates additional immune checkpoints for preclinical
evaluation, combinatorial targeting of TIGIT/PD-1/CD40 represents a promising approach
for rapid clinical translation.
2.4 Acknowledgements
We thank the entire Jacks laboratory with specific thanks to N. Sacks, A. Jaeger,
M. Burger and D. Canner for helpful discussions and technical assistance. We thank K.
Yee, J. Teixeira, K. Anderson, M. Magendantz for administrative support. This work was
supported by the Howard Hughes Medical Institute, NCI Cancer Center Support Grant
P30-CA1405, the Lustgarten Foundation Pancreatic Cancer Research Laboratory at MIT,
DFHCC SPORE in Gastrointestinal Cancer Career Enhancement Award (W.F.P.), the
Stand Up To Cancer-Lustgarten Foundation Pancreatic Cancer Interception Translational
Cancer Research Grant (Grant Number: SU2C-AACR-DT25-17, W.F.P, T.J.) and the
Stand Up To Cancer Golden Arrow Early Career Scientist Award (GA-6182, W.F.P.).
Stand Up To Cancer is a program of the Entertainment Industry Foundation. Research
grants are administered by the American Association for Cancer Research, the scientific
partner of SU2C. We thank the Koch Institute Swanson Biotechnology Center for
technical support, specifically the Flow Cytometry, Histology, Preclinical Modeling,
Imaging & Testing and Integrative Genomics & Bioinformatics core facilities.

124
2.5 Methods
Mice
All animal studies described in this study were approved by the MIT Institutional Animal
Care and Use Committee. All animals were maintained on a pure C57BL/6J genetic
background. Generation of KrasLSL-G12D/+ and p53flox/flox mice has previously been
described34,35. OT-I TCR transgenic mice have been previously described13.
Lentiviral constructs
“Lenti-PGK-Cre” and “Lenti-PGK-Cre-EFS-mScarletSIIN” were generated using gBlocks
(IDT) and Gibson assembly36. Detailed cloning strategies and primer sequences are
available on request. All vectors with detailed maps and sequences will be deposited into
Addgene.
Molecular cloning of targeting vector and CRISPR/Cas9-assisted targeting of
H11;SIIN
The “H11-mScarletSIIN” targeting vector was generated using gBlocks (IDT) and Gibson
assembly36. “U6-sgfiller-eCas9-T2A-BlastR” was generated using Gibson assembly. In
order to insert sgRNAs, the vector was digested with FastDigest Esp3I (Thermo Fisher)
and ligated with BsmBI-compatible annealed oligonucleotides. sgRNAs were designed
using Benchling37, which was also used to predict potential off-target sites. All vectors
with detailed maps and sequences will be deposited into Addgene.
mESC line generation

125
“KP*1”, a C57BL/6J KrasLSL-G12D/+; Trp53flox/flox (KP) murine embryonic stem cell line, was
generated by crossing a hormone-primed C57BL/6J Trp53flox/flox female with a C57BL/6J
KrasLSL-G12D/+; Trp53flox/flox male. At 3.5 days post-coitum, blastocysts were flushed from
the uterus, isolated, and cultured on a mouse embryonic fibroblast (MEF) feeder layer in
ESC media+LIF+2i [Knockout DMEM (Gibco), 15% FBS (Hyclone), 1% NEAA (Sigma-
Aldrich), 2 mM Glutamine (Gibco), 0.1 mM β-mercaptoethanol (Sigma-Aldrich) 50 IU
Penicillin, 50 IU Streptomycin, 1000 U/mL LIF (Amsbio), 3 µM CHIR99021 (AbMole), 1
µM PD0325901(AbMole)]. After 5-7 days in culture the outgrown inner cell mass was
isolated, trypsinized and re-plated on a fresh MEF layer. ES cell lines were genotyped for
KrasLSL-G12D/+; Trp53flox/flox, and Zfy (Y-chromosome specific). Primer sequences available
upon request. ES cell lines were tested for pluripotency by injection into host blastocysts
from albino mice to generate chimeric mice.
ESC targeting
Briefly, DNA mixes (1:1 mix of “U6-H11sg-eCas9-T2A-BlastR”: “H11-mScarletSIIN”
targeting vector) were ethanol precipitated prior to DNA (1 µg) transfection of
approximately 3*105 KP*1 mESCs in a gelatin-coated 24-well plate using Lipofectamine
2000 (Thermo Fisher) according to the manufacturer instructions. mESCs were selected
with Blasticidin (6 µg/mL) for 2 days, starting 36 hr post-transfection before low-density
replating on MEF feeder lines in the absence of Blasticidin. Large mESC colonies were
manually picked using a stereomicroscope, expanded and evaluated for correct
integration using PCR with primers spanning both 5’ and 3’ homology arms (primer
sequences available on request). Correct clones by PCR evaluation were evaluated

126
using Southern blot analysis. Briefly, genomic DNA was digested with NsiI-HF (NEB)
overnight. Digestions were electrophoresed on 0.7% agarose gels and blotted to
Amersham Hybond XL nylon membranes (GE Healthcare). Samples were probed with
32P-labeled “H11 5’ external”, “H11 3’ external” and “internal” probes applied in Church
buffer38 (annotated in Extended Data Figure 2; probe sequences available on request).
Correctly targeted clones were injected into albino C57BL/6J
blastocysts. Chimerism was assessed by coat color. Pancreatic organoids were isolated
from chimeric animals and “donor” organoids were purified from the host pancreas using
72 hr of puromycin (6 µg/mL) selection (leveraging the presence of the puromycin
resistance gene within the LSL cassette upstream of KRASG12D)34.
Lentiviral production/titering
Lentiviral plasmids and packaging vectors were prepared by using endo-free maxiprep
kits (QIAGEN). Lentiviruses were produced by co-transfection of HEK-293 cells with
lentiviral constructs plus packaging vectors: PsPax2 (psPAX2 was a gift from Didier Trono
(Addgene plasmid # 12260 ; http://n2t.net/addgene:12260 ; RRID:Addgene_12260) and
Pmd2.G (pMD2.G was a gift from Didier Trono (Addgene plasmid # 12259 ;
http://n2t.net/addgene:12259 ; RRID:Addgene_12259). Viral supernatant was harvested
48 and 72 hr post-transfection, filtered through a 0.45 μm filter, and concentrated by
ultracentrifugation (25,000 rpm for 2 hr at 4°C). Concentrated virus was resuspended in
Opti-MEM (Gibco) and lentiviral aliquots were frozen and stored at -80°C. Lentiviruses
were titered in Green-Go cells as previously described39.
127
Retrograde pancreatic duct delivery
Retrograde pancreatic duct instillation of lentivirus has been previously described9. We
adapted this technique in a number of ways. Briefly, the ventral abdomen was depilated
(using clippers or Nair) 1-2 days prior to surgery. Animals were anesthetized with
Isofluorane and the surgical area was disinfected with alternating Betadine/Isopropyl
alcohol. A small skin incision was made in the anterior abdomen (~2-3 cm midline incision
extending caudally from the xiphoid process). A subsequent incision was made through
the linea alba and incision edges were secured in place with a Colibri retractor. The
remainder of the procedure was conducted under a Nikon stereomicroscope. A
moistened (with sterile 0.9% saline) sterile cotton swab was used to gently move the left
lobe of the liver cranially towards the diaphragm. A second moistened sterile cotton swab
was used to gently reposition the colon/small intestine into the right lower abdominal
quadrant, until the duodenum was visualized. The duodenum was similarly gently
repositioned (still in the abdominal cavity) using moistened cotton swabs until the
pancreas, common bile duct and sphincter of Oddi were well visualized (Figure 1b). The
common bile duct and cystic duct were gently separated from the portal vein and hepatic
artery using blunt dissection with Moria forceps. A microclip was placed on the cystic duct
to prevent influx of the viral particles into the liver or gallbladder, forcing the viral vector
retrograde through the pancreatic duct. To infuse the viral vector, the common bile duct
was cannulated with a 30G needle at the level of the sphincter of Oddi. Virus (150 µL)
was injected over the course of 30 sec. Gently pressure was applied at the sphincter of
Oddi upon needle exit. Subsequently, the microclip and Colibri retractor were removed.
The peritoneum was closed using running 4-0 Vicryl sutures. The cutis and fascia were

128
closed using simple interrupted 4-0 Vicryl sutures. The entire procedure was conducted
on a circulating warm water heating blanket to prevent intra-operative hypothermia. All
mice received pre-operative analgesia with Buprenorpine-SR and post-operative
subcutaneous warmed 0.9% normal saline and were followed post-operatively for any
signs of discomfort or distress.
For retrograde pancreatic ductal instillation, male mice (aged 3-6 weeks) and
female mice (aged 3-8 weeks) were transduced with 250K TU (transducing units, see
viral titering) in serum-free media (Opti-MEM; Gibco).
For experiments involving CD8a depletion, animals were dosed with CD8a-
depleting antibody (BioXCell, Clone 2.43, 200 µg/mouse, dosed i.p every 3-4 days)
beginning one day prior to surgery.
Organoid generation and characterization
Pancreatic organoid isolation and propagation has been previously described40. Briefly,
for genetically-defined pancreatic organoids, pancreata were manually dissected from
genetically engineered mice of the desired genotype. Pancreata were then manually
minced with razor blades and dissociated in pancreas digestion buffer [1x PBS, 125 U/mL
collagenase IV (Worthington)] for 20 min at 37oC. Cell suspensions were filtered through
70 µm filters, washed with 1x PBS and centrifuged with slow deceleration. Cell pellets
were resuspended in 100% growth-factor reduced Matrigel (Corning) and solidified at
37oC. Cells were subsequently cultured in organoid complete media (minor modifications
from previously described formulations40, see details below) and monitored for organoid
outgrowth. Organoids were passaged with TrypLE Express (Life Technologies) for at

129
least 4 passages to purify the ductal component prior to Cre recombinase-mediated
recombination. For recombination, organoids were spinfected with adenoviral (Ad-CMV-
Cre; University of Iowa Viral Vector Core Facility) at a MOI >100 to ensure 100%
recombination. All organoids were genotyped both prior to and following Ad-CMV-Cre to
ensure proper recombination.
Tumor-derived pancreatic organoids were isolated following the same procedure
as above with the exception of 30 min in pancreas digestion buffer. Tumor-derived
organoids were passaged at least four times prior to experimental manipulation to remove
contaminating cell types. P53 deficient organoids were selected via resistance to Nutlin-
3a (10 µM, Sigma-Aldrich). Pancreatic organoids were maintained in culture for <20
passages.
Pancreatic Organoid Complete Media
The media for pancreatic organoids was formulated based on L-WRN cell conditioned
media (L-WRN CM)41. Briefly, L-WRN CM was generated by collecting 8 days of
supernatant from the L-WRN cells, grown in Advanced DMEM/F12 (Gibco) supplemented
with 20% fetal bovine serum (Hyclone), 2 mM GlutaMAX, 100 units/mL of penicillin, 100
µg/mL of streptomycin, and 0.25 µg/mL amphotericin. L-WRN CM was diluted 1:1 in
Advanced DMEM/F12 (Gibco) and supplemented with additional RSPO-1 conditioned
media (10% v/v), generated using Cultrex HA-R-Spondin1-Fc 293T Cells. The following
molecules were also added to the growth media: B27 (Gibco), 1 μM N-acetylcysteine
(Sigma-Aldrich), 10 μM nicotinamide (Sigma-Aldrich), 50 ng/mL EGF (Novus Biologicals),
500 nM A83-01 (Cayman Chemical), 10 μM SB202190 (Cayman Chemical), and 500 nM

130
PGE2 (Cayman Chemical). Wnt activity of the conditioned media was assessed and
normalized between batches via luciferase reporter activity of TCF/LEF activation (Enzo
Leading Light Wnt reporter cell line).
T cell culture
OT-I splenocytes were harvested from C57BL/6J OT-I;Rag2-/- transgenic mice, and
spleens were mashed through 70 µm filters. Red blood cells were lysed with ACK buffer
for 2 min before cell suspension neutralization with PBS and pelleted for plating.
Splenocytes were counted and adjusted to 1*106 cells/mL in T cell medium [RPMI 1640
(Corning) supplemented with 10% heat-inactivated FBS, 20 mM HEPES (Gibco), 1 mM
Sodium Pyruvate (Thermo Fisher), 2 mM L-Glutamine (Gibco), 50 µM β-mercaptoethanol
(Gibco), 1x NEAA (Sigma), 0.5x Pen/Strep (Gibco) with 10 ng/mL hIL-2 (Peprotech) and
1 µM SIINFEKL peptide (Anaspec)]. Splenocytes were activated for 24 hr at 37°C in a
tissue culture incubator, before manual CD8a+ isolation according to the manufacturer
instructions (Milteny Biotec). OT-I T cells were subsequently expanded 4-6 days in T cell
medium with 10 ng/mL hIL-2 prior to organoid co-culture.
Organoid + CD8+ T cell co-culture and imaging
Pancreatic organoids (day 5-7 in culture) were dissociated using TrypLE Express (Life
Technologies) and single cell suspensions were generated by vigorous resuspension.
Activated OT-I CD8+ T cells (see above) and organoid cell numbers were determined by
manual hemocytometer cell counting, and T cells:organoids were mixed at defined
effector:target ratios. Matrigel was then added (5 µL per well in 96w plates for Incucyte

131
live cell imaging; 20-50 uL per well for culture in 24-48w plates; final 85% Matrigel) before
solidification at 37°C. Cells were cultured in complete organoid medium supplemented
with 10 ng/mL hIL-2 (Peprotech). Incucyte images of co-cultures were acquired every 4
hr (BF/RFP channels) for 6-11 days for Incucyte live cell imaging or imaged at Day 5-7
for larger cultures.
Orthotopic transplantation
Orthotopic transplantation of organoids was performed with minor modifications to
previously reported protocols for orthotopic transplantation of pancreatic monolayer cell
lines42. Briefly, animals were anesthetized using Isofluorane, the left subcostal region
was depilated (using clippers or Nair) and the surgical area was disinfected with
alternating Betadine/Isopropyl alcohol. A small (~2 cm) skin incision was made in the left
subcostal area and the spleen was visualized through the peritoneum. A small incision
(~2 cm) was made through the peritoneum overlying the spleen and the spleen and
pancreas were exteriorized using ring forceps. A 30G needle was inserted into the
pancreatic parenchyma parallel to the main pancreatic artery and 100 µL (containing
1.25*105 organoid cells in 50% PBS + 50% Matrigel) was injected into the pancreatic
parenchyma. Successful injection was visualized by formation of a fluid-filled region
within the pancreatic parenchyma without leakage. The pancreas/spleen were gently
internalized, and the peritoneal and skin layers were sutured independently using 4-0
Vicryl sutures. All mice received pre-operative analgesia with Buprenorpine-SR and were
followed post-operatively for any signs of discomfort or distress. Organoid/Matrigel mixes

132
were kept on ice throughout the entirety of the procedure to prevent solidification prior to
injection.
For orthotopic transplantation, syngeneic mice (aged 4-10 weeks) were transplanted.
Male pancreatic organoids were only transplanted back into male recipients.
Small rodent ultrasound
Quantification of murine pancreatic tumors by high resolution ultrasound has been
previously described43. Briefly, animals were anesthetized using Isoflurane and the lateral
and ventral abdominal areas were depilated using Nair. Sterile 0.9% saline (1 mL) was
administered by i.p. injection prior to imaging to improve visualization of the pancreas.
Animals were imaged using the Vevo3100/LAZRX ultrasound and photoacoustic imaging
system (Fujifilm-Visualsonics). Animals were placed on the imaging platform in the supine
position and a layer of ultrasound gel was applied over the entirety of the abdominal area.
The ultrasound transducer (VisualSonics 550S) was placed on the abdomen orthogonal
to the plane of the imaging platform. Landmark organs, such as the kidney, spleen, and
liver, were identified in order to define the area of the pancreas. The transducer was set
at the scanning midpoint of the normal pancreas or pancreatic tumor and a 3D image of
10-20 mm, depending on tumor size, at a Z- slice thickness of 0.04 mm. Three-
dimensional (3D) images were uploaded to the Vevo Lab Software. The volumetric
analysis function was used to define the tumor border at various Z-slices through the
entirety of the tumor and derive the final calculated tumor volume.
Preclinical trial

133
For preclinical trials, age and sex-matched recipient C57BL/6J mice were purchased from
The Jackson Laboratory (JAX). Orthotopic transplantation was performed as described
above. Mice were monitored for tumor development at 4, 5, 6 weeks post-initiation using
high-resolution ultrasound (as described above) to confirm tumor establishment and
interval growth. Animals with established tumors (baseline 10-220 mm3 by 6 weeks post-
initiation) were randomized by tumor burden within 24 hr of baseline imaging to either
control or experimental treatment arms. Researchers performing health checks,
ultrasound imaging and interpretation were blinded to cohort allocation. Isotype (control)
arm consisted of 200 µg/mouse Rat IgG2a (BioXCell; Clone 2A3) + 100 µg/mouse Mouse
IgG1 (BioXCell; Clone MOPC-21). Experimental arms consisted of anti-PD144 (BioXCell;
Clone 29F.1A12; Rat IgG2a; 200 µg/mouse, dosed i.p. every 2-3 days), anti-TIGIT45
(Absolute Antibody; Clone 1B4; Mouse IgG1; 100 µg/mouse, dosed i.p. every 2-3 days),
CD40 agonist46 (BioXCell; Clone FGK4.5/FGK45; Rat IgG2a; 100 µg/mouse, dosed i.p.
once every 4 weeks) monotherapy or combination therapy as described in the text.
Animals were treated for 4 weeks and weekly weights and ultrasound imaging was
performed as described.
Tissue and blood collection for flow cytometry of murine PDAC
Pancreatic tumor-bearing animals were euthanized by cervical dislocation, prior to whole
organ dissection (pancreas, spleen), tumor imaging and collection in RPMI 1640
supplemented with 1% heat-inactivated FBS. Pancreas tumors were finely minced with
scissors in MACS C tubes (Miltenyi Biotec), and digested for 30 min at 37°C with gentle
agitation in 5 mL digestion buffer [1x HBSS (Gibco), 1 mM HEPES (Gibco), 1% heat-

134
inactivated FBS, 125 U/mL collagenase IV (Worthington), 40 U/mL DNaseI, grade II
(Roche)]. Pancreas tumors were processed on a gentleMACS Octo Dissociator using the
“m_spleen_04” program. Digestion buffer was neutralized with 5 mL heat-inactivated
FBS, washed with PBS, and filtered through 70 µm filters. Single cell suspensions were
pelleted at 1500 rpm with slow deceleration, and transferred to 96-well round-bottom
plates for flow cytometric staining.
Spleen samples were mashed through 70 µm filters, collected in RPMI 1640
supplemented with 1% heat-inactivated FBS and pelleted. Red blood cells were lysed
with ACK buffer for 2 min before cell suspension neutralization with PBS, pelleted for
plating and transferred to 96-well round-bottom plates for flow cytometric staining.
Peripheral blood (100-200 µL) for longitudinal tracking of T cells or prior to
euthanasia was collected by retroorbital bleeding and added to 4% sodium citrate (50 µL)
to prevent clotting. Red blood cells were lysed in two rounds with ACK buffer for 2 min
before cell suspension neutralization with PBS. Single cell suspensions were transferred
to 96-well round-bottom plates for flow cytometric staining.
Tissue processing for flow cytometry of human PDAC
Freshly resected human pancreatic adenocarcinoma specimens were transferred in
RPMI 1640 on ice to the laboratory. Pancreas tumors were finely minced with scissors in
MACS C tubes, and processed as described above for murine PDAC. Human PBMCs
from IRB-consented healthy individuals (StemCell) were thawed, washed with PBS and
immediately stained for flow cytometry. All studies using human specimens were
135
approved by the Massachusetts General Hospital Institutional Review Board and
conducted according to the principles expressed in the Declaration of Helsinki.
Processing for flow cytometry of pancreatic organoids
Pancreatic organoids were grown as described above. Prior to isolation, organoids were
treated with interferon-gamma (10 ng/mL; PeproTech) for 48-72 hr prior to analysis.
Organoids were dissociated using TrypLE (10 min to minimize cleavage of surface
proteins) washed with PBS, and filtered through 70 µm filters. Single cell suspensions
were pelleted at 2000 rpm and transferred to 96-well round-bottom plates for flow
cytometric staining.
Antibodies and flow cytometry
Fluorochrome-conjugated antibodies directed against the following mouse antigens were
used for analysis by flow cytometry: CD4-Alexa Fluor 647 (RM4-5, 1:400, BioLegend);
CD4-BUV737 (RM4-5, 1:400, BD Biosciences); CD8a-BUV395 (53-6.7, 1:400, BD
Biosciences); CD8a-BV421 (53-6.7, 1:400, BioLegend); CD8a-BV785 (53-6.7, 1:400,
BioLegend); CD11b-BV605 (M1/70, 1:200, BioLegend); CD11b-PE-Cy7 (M1/70, 1:1400,
BioLegend); CD11c-PE-Cy7 (N418, 1:400, Invitrogen); CD19-BUV395 (1D3, 1:200, BD
Biosciences); CD44-BV605 (IM7, 1:400, BioLegend); CD44-BV711 (IM7, 1:200,
BioLegend); CD44-FITC (IM7, 1:200, Invitrogen); CD45-APC (30-F11, 1:400, Invitrogen);
CD45-BV786 (30-F11, 1:400, BioLegend); CD64-BV421 (X54-5/7.1, 1:200, BioLegend);
CD172a-FITC (P84, 1:400, BioLegend); EpCam-PE-Cy7 (G8.8, 1:200, BioLegend);
F4/80-APC (BM8, 1:200, BioLegend); H-2Db-FITC (28-14-8, 1:400, Invitrogen); H-2Kb-

136
APC (AF6-88.5, 1:400, BioLegend); LAG3-FITC (C9B7W, 1:200, Invitrogen); Ly-6C-
PerCP-Cy5.5 (HK1.4, 1:200, BioLegend); Ly-6G-Alexa Fluor 700 (1A8, 1:400,
BioLegend); Ly49F-BV421 (HBF-719, 1:100, BD Biosciences); Ly49G2-FITC (4D11,
1:100, Invitrogen); MHC-II (I/A-I/E)-BV711 (M5/114.15.2, 1:600, BioLegend); PD-1-
BV510 (29F.1A12, 1:400, BioLegend); PD-L1-BV421 (10F.9G2,1:100, BioLegend);
TIGIT-PerCP-Cy5.5 (GIGD7, 1:200, Invitrogen); TIM3-BV605 (RMT3-23, 1:200,
BioLegend); XCR1-PE (ZET, 1:400, BioLegend). For H-2Kb-SIINFEKL tetramer staining,
monomer was purchased from the NIH Tetramer Core Facility and tetramerized with
Streptavidin-PE in-house.
The following fluorochrome-conjugated antibodies against human surface
antigens were used (all 1:40): CD3-BUV805 (UCHT1, BD Biosciences); CD8-BUV737
(SK1, BD Biosciences); CD45RO-BUV395 (UCHL1, BD Biosciences); LAG3-PE/Dazzle
594 (11C3C65, BioLegend); PD-1-BV510 (EH12.1, BD Biosciences); TIGIT-PE-Cy7
(MBSA43, Invitrogen); TIM3-BV711 (7D3, BD Biosciences).
Prior to surface staining, cell pellets were resuspended in Live/Dead dye (Ghost
Dye Red 780, Tonbo Biosciences or Zombie Aqua Fixable Viability Dye, BioLegend)
diluted 1:1000 in PBS on ice for 20 min in the dark. Surface staining was performed on
cells in PBS with 1% heat-inactivated FBS on ice for 30 min in the dark. Cell pellets were
fixed overnight in 1x fixation buffer (eBioscience), prior to permeabilization and
intracellular staining for 1 hr in the dark at RT with the following antibodies: anti-human
FoxP3-Alexa Fluor 700 (PCH101, 1:20, Invitrogen); Ki-67-Alexa Fluor 700 (B56, 1:200,
BD Biosciences), Ki-67-BV786 (B56, 1:100, BD Biosciences); TCF-1-Alexa Fluor 647
(C63D9, 1:250, Cell Signaling Technologies). Samples were acquired on BD LSR II or
137
LSR Fortessa machines, cell sorting was performed on a BD Aria IIIu. FACS data was
analyzed using Flowjo v10 software (BD).
For flow cytometric immunophenotyping, samples with less than 100 CD8+ cells or
less than 50 CD44hiTetramer+ cells within a given cell population were not considered for
further sub-setting of these populations.
Immunohistochemistry and pathology review
Isolated pancreas and spleen tissues were preserved overnight in zinc formalin fixative,
transferred to 70% EtOH and processed for paraffin embedding. Four (4) µm paraffin
sections were cut for Hematoxylin & Eosin staining and IHC. For IHC, upon dewaxing,
antigen retrieval was performed in a 10 mM citrate buffer (pH 6) for 5 min at 125°C. Slides
were cooled to room temperature and washed with TBS + 0.1% Tween-20 (Sigma-
Aldrich). Slides were incubated with Endogenous Peroxidase Block (Dako) for 30 min and
blocked with normal horse serum (Vector Labs) for 1 hr. Slides were incubated with
primary antibody [rabbit anti-RFP (Rockland, 1:400), rat anti-CK19 (Troma-III, DSHB,
1:200)] overnight at 4°C and with the corresponding anti-species HRP-conjugated
secondary antibody (Vector Labs) for 30 min at RT. Slides were developed with DAB
Peroxidase Substrate Kit (Vector Labs).
For CD8a and CD4 co-staining, slides were dewaxed, and antigen retrieval was
performed in 10 mM citrate buffer (pH 6). Slides were blocked with Bloxall Endogenous
Peroxidase and Alkaline Phosphatase Block and normal horse serum (all Vector Labs).
Slides were incubated with primary rabbit anti-CD8a antibody (Abcam EPR21769,
1:1000) overnight at 4°C and with secondary Alkaline phosphatase anti-Rabbit IgG for 30

138
min at RT. Slides were then developed with Vector Black Alkaline phosphatase substrate
(Vector Labs) and blocked again with Bloxall and normal horse serum. Slides were
incubated with primary rabbit anti-CD4 (Abcam EPR19514, 1:400) for 3 hr at RT and
secondary HRP conjugated anti-Rabbit antibody for 30 min. Slides were developed with
HRP Vina Green Chromogen (Biocare Medical). All histologic diagnoses were confirmed
with a pathologist (R.T.B.) specialized in rodent pathology.
Single-cell RNA sequencing
Sorted cells were washed three times in 1x PBS (calcium and magnesium free) containing
0.04% w/v BSA, and then quantified and titrated to a final concentration of approximately
300 cells/µL. Using the Chromium Single Cell 3’ Solution (v3) according to manufacturer’s
instructions, approximately 2000-5000 cells were partitioned into Gel Beads in Emulsion
(GEMs) with cell lysis and barcoded reverse transcription of mRNA into cDNA, followed
by amplification, enzymatic fragmentation, 5’ adaptor ligation and unique sample index
attachment. The recovery rate was ~800 cells per sample after filtering for quality control.
Sample libraries were sequenced on the HiSeq X Version 2.5 (Illumina) with the following
read configuration: Read1 28 cycles, Read2 96 cycles, Index read 8 cycles.
Single-cell RNA sequencing analysis
Data processing, cell clustering, and differential expression analysis
Raw sequencing data were processed using Cell Ranger, version 3.0.2, and sequencing
reads were aligned to the mm10 reference mouse transcriptome (version 3.0.0). After
processing, including filtering barcodes with less than 500 UMIs or those with more than

139
10% of reads matching the mitochondrial genome, Cell Ranger reported 545 cell-
associated barcodes and detected 15,065 genes. Cells lacking expression of Cd3e and
Cd8a were discarded. After this, low-quality cells with less than 100 detected genes were
filtered out, and cells exceeding the 97th percentile for number of detected genes were
excluded to remove probable doublets. The resulting matrix used for downstream
analyses was defined by 482 cells and 15,065 genes.
Data normalization and scaling, variable feature selection, cell clustering, and
differential gene expression analysis was performed using Seurat, version 3.1.447. Data
were normalized by total expression per cell and scaled using a factor of 10,000 and log
transformed (natural scale). The top 2,000 variable genes were selected using Seurat’s
default “vst” method. The expression of these genes was then scaled and centered, and
these genes were then used for all downstream analysis. Principal component analysis
(PCA) was then performed for dimensionality reduction, and the first 30 principal
components were selected using the elbow method heuristic as guidance.
A k-nearest neighbor graph (KNN, k=20) was constructed in PC space using the top 30
principal components. Four clusters were detected using the Louvain method of
community detection (default parameters and resolution = 0.54)48. Data was visualized
using the Uniform Manifold Approximation and Projection (UMAP) algorithm implemented
in Seurat49,50. Default parameters were used, with the following exceptions: the method
parameter (“umap-learn”) and the metric parameter (“correlation”). Differential gene
expression between clusters was assessed using the default Wilcoxon Rank Sum test.
Gene Module Analysis

140
Seurat’s AddModuleScore function (control parameter = 8) was used to calculate gene
module scores for all cells. For this analysis, gene sets were derived from previously
published gene modules. For datasets providing human gene modules, a custom R script
was generated to retrieve corresponding mouse orthologs from Ensembl with the biomaRt
package (version 2.42.0)51,52. A Ly49+CD8+ T cell module score was also derived from
bulk RNA-seq data18 available on the Gene Expression Omnibus (GEO; accession
number: GSE130975). For these data, the raw count matrix was downloaded and
processed using DESeq253, version 1.26.0. Specifically, differential gene expression was
evaluated between the Ly49+CD8+ (n = 3 replicates) and the Ly49-CD8+ (n = 3 replicates)
conditions. The top 126 differentially expressed genes with log2 fold change > 3 (all with
adjusted P << 0.01) were selected for the Ly49+CD8+ gene module. The cells in our
scRNA-seq dataset were then scored for this module using the method described above.
To derive de novo gene modules from our scRNA-seq dataset, the Pathway and
Gene Set Overdispersion Analysis (PAGODA)23 framework from the SCDE package
(version 2.14.0) was used. The analysis was performed starting with the raw counts for
the same 482 cells that remained after filtering in the previous analysis. The knn error
model was fit using min.count.threshold = 2 and k = ncol(cd/4), where “cd” represented
the matrix after clean.counts was performed with default parameters. Gene expression
magnitudes were then normalized with trim = 3/ncol(cd) and max.adj.var=5. De novo
gene modules were then determined using trim = 7.1/ncol(varinfo$mat) and n.clusters =
50 and otherwise default parameters for the pagoda.gene.clusters function. The top three
de novo gene sets (modules 30, 36, and 45) with the highest over-dispersion Z score
(adjusted for multiple hypotheses) that best distinguished the cellular subpopulations
141
defined by SCDE were selected, and all cells were scored for these modules in Seurat as
described above.
TCGA analysis
Human Pancreatic Adenocarcinoma gene expression analysis
Gene expression profiles for human Pancreatic Adenocarcinoma (PAAD) patient primary
tumors (n=178) were obtained from the TCGA repository24 (tcga-data.nci.nih.gov/tcga).
De novo murine gene sets (Pagoda36 and Pagoda45) identified by PAGODA23
(described above) were used to score these human gene expression profiles of individual
tumors using ssGSEA54. Mouse gene symbols were translated to human orthologs using
homology information from the Mouse Genome Informatics database (MGI,
informatics.jax.org). Tumors were stratified based on standardized ssGSEA scores (z-
scores). Tumors with the most correlated (high scoring cohort, z > 1.5) and least
correlated (low scoring cohort, z < -1.5) expression profiles were selected for
unsupervised transcriptomic analysis. A high-resolution signature discovery approach
(Independent Component Analysis, ICA55) was employed to analyze the transcriptomes
of these high and low-scoring cohorts to characterize changes in gene expression
profiles, as described previously56–58. Briefly, this unsupervised blind source separation
technique was used on this discrete count-based expression dataset to elucidate
statistically independent and biologically relevant signatures. ICA is a signal processing
and multivariate data analysis technique in the category of unsupervised matrix
factorization methods55. The R implementation of the core JADE algorithm (Joint
Approximate Diagonalization of Eigenmatrices)59–61 was used. Statistical significance of
142
signatures distinguishing the two human patient cohorts was assessed using the Mann-
Whitney-Wilcoxon test (alpha = 0.05) and the top human gene signature corresponding
to each Pagoda module was selected (p=3.1e-07 for Pagoda36; p=0.00023 for
Pagoda45). Each of these human PAAD signatures identifies up- and down-regulated
genes between the high- and low-scoring patient cohorts where patients were stratified
by ssGSEA scores derived using the corresponding Pagoda geneset. A volcano plot was
used to illustrate the magnitude of fold-change (X-axis) versus the human signature score
(Y-axis) for all genes. All signature analyses were conducted in the R Statistical
Programming language (www.r-project.org).
Human clinical data analysis
Human PAAD RNA-seq gene expression profiles of primary tumors (n=178) and relevant
clinical data were obtained from TCGA. Genes with the highest adjusted variance (score
> 2) per Pagoda murine expression module (Pagoda36: 17 genes, Pagoda45: 21 genes)
were selected as driver genes and translated to human symbols using homology
information from MGI (informatics.jax.org). Human gene expression profiles were scored
using ssGSEA for each of these driver genesets, as described above. Patients were
stratified based on standardized ssGSEA scores and Kaplan-Meier survival analyses
were conducted to compare high-scoring patients (top quartile, n=44) with low-scoring
patients (bottom quartile, n=44) and significance was assessed using the log-rank test.
Survival analyses were conducted using the survival package in R. The log-rank test was
used in the ‘survdiff’ call to assess the difference between Kaplan-Meier estimates of
survival.

143
Statistical Analyses
All graphs and statistical analyses were generated with GraphPad Prism 8 or in R as
described above. The following statistical tests were used in this study: (1) Two-sided
Mann-Whitney test was performed in GraphPad Prism 8. (2) Log-rank test was performed
as described above in R.

144
2.6 References
1. Royal, R. E. et al. Phase 2 trial of single agent Ipilimumab (anti-CTLA-4) for locally
advanced or metastatic pancreatic adenocarcinoma. J. Immunother. (Hagerstown,
Md. 1997) 33, 828–833 (2010).
2. Brahmer, J. R. et al. Safety and activity of anti-PD-L1 antibody in patients with
advanced cancer. N. Engl. J. Med. 366, 2455–2465 (2012).
3. O’Reilly, E. M. et al. Durvalumab with or Without Tremelimumab for Patients with
Metastatic Pancreatic Ductal Adenocarcinoma: A Phase 2 Randomized Clinical
Trial. JAMA Oncol. 5, 1431–1438 (2019).
4. Balachandran, V. P. et al. Identification of unique neoantigen qualities in long-term
survivors of pancreatic cancer. Nature 551, S12–S16 (2017).
5. Bailey, P. et al. Exploiting the neoantigen landscape for immunotherapy of
pancreatic ductal adenocarcinoma. Sci. Rep. 6, 1–8 (2016).
6. Lawrence, M. S. et al. Mutational heterogeneity in cancer and the search for new
cancer-associated genes. Nature 499, 214–218 (2013).
7. Stromnes, I. M., Hulbert, A., Pierce, R. H., Greenberg, P. D. & Hingorani, S. R. T-
cell Localization, Activation, and Clonal Expansion in Human Pancreatic Ductal
Adenocarcinoma. Cancer Immunol. Res. 5, 978–991 (2017).
8. Evans, R. A. et al. Lack of immunoediting in murine pancreatic cancer reversed
with neoantigen. JCI insight 1, (2016).
9. Chiou, S. H. et al. Pancreatic cancer modeling using retrograde viral vector delivery
and in vivo CRISPR/Cas9-mediated somatic genome editing. Genes Dev. 29,
1576–1585 (2015).
145
10. Bindels, D. S. et al. MScarlet: A bright monomeric red fluorescent protein for cellular
imaging. Nat. Methods 14, 53–56 (2016).
11. DuPage, M., Mazumdar, C., Schmidt, L. M., Cheung, A. F. & Jacks, T. Expression
of tumour-specific antigens underlies cancer immunoediting. Nature 482, 405–409
(2012).
12. Hippenmeyer, S. et al. Genetic mosaic dissection of Lis1 and Ndel1 in neuronal
migration. Neuron 68, 695–709 (2010).
13. Hogquist, K. A. et al. T cell receptor antagonist peptides induce positive selection.
Cell 76, 17–27 (1994).
14. Zhu, Y. et al. Tissue-Resident Macrophages in Pancreatic Ductal Adenocarcinoma
Originate from Embryonic Hematopoiesis and Promote Tumor Progression.
Immunity 47, 323-338.e6 (2017).
15. Hegde, S. et al. Dendritic Cell Paucity Leads to Dysfunctional Immune Surveillance
in Pancreatic Cancer. Cancer Cell 37, 289-307.e9 (2020).
16. Zheng, G. X. Y. et al. Massively parallel digital transcriptional profiling of single
cells. Nat. Commun. 8, 1–12 (2017).
17. Kim, H. J. et al. CD8+ T regulatory cells express the Ly49 class I MHC receptor and
are defective in autoimmune prone B6-Yaa mice. Proc. Natl. Acad. Sci. U. S. A.
108, 2010–2015 (2011).
18. Saligrama, N. et al. Opposing T cell responses in experimental autoimmune
encephalomyelitis. Nature 572, 481–487 (2019).
19. Singer, M. et al. A Distinct Gene Module for Dysfunction Uncoupled from Activation
in Tumor-Infiltrating T Cells. Cell 166, 1500-1511.e9 (2016).

146
20. Doering, T. A. et al. Network Analysis Reveals Centrally Connected Genes and
Pathways Involved in CD8+ T Cell Exhaustion versus Memory. Immunity 37, 1130–
1144 (2012).
21. Chihara, N. et al. Induction and transcriptional regulation of the co-inhibitory gene
module in T cells. Nature 558, 454–459 (2018).
22. Schietinger, A. et al. Tumor-Specific T Cell Dysfunction Is a Dynamic Antigen-
Driven Differentiation Program Initiated Early during Tumorigenesis. Immunity 45,
389–401 (2016).
23. Fan, J. et al. Characterizing transcriptional heterogeneity through pathway and
gene set overdispersion analysis. Nat. Methods 13, 241–244 (2016).
24. Raphael, B. J. et al. Integrated Genomic Characterization of Pancreatic Ductal
Adenocarcinoma. Cancer Cell 32, 185-203.e13 (2017).
25. Vonderheide, R. H. CD40 Agonist Antibodies in Cancer Immunotherapy. Annu.
Rev. Med. 71, 47–58 (2020).
26. Anderson, A. C., Joller, N. & Kuchroo, V. K. Lag-3, Tim-3, and TIGIT: Co-inhibitory
Receptors with Specialized Functions in Immune Regulation. Immunity vol. 44 989–
1004 (2016).
27. Uhlen, M. et al. A pathology atlas of the human cancer transcriptome. Science (80-
. ). 357, (2017).
28. Uhlen, M. et al. Tissue-based map of the human proteome. Science (80-. ). 347,
1260419–1260419 (2015).
29. Yarchoan, M. et al. PD-L1 expression and tumor mutational burden are
independent biomarkers in most cancers. JCI Insight 4, (2019).
147
30. Dunn, G. P., Old, L. J. & Schreiber, R. D. The Three Es of Cancer Immunoediting.
Annu. Rev. Immunol. 22, 329–360 (2004).
31. Johnson, B. A., Yarchoan, M., Lee, V., Laheru, D. A. & Jaffee, E. M. Strategies for
Increasing Pancreatic Tumor Immunogenicity. Clin. Cancer Res. An Off. J. Am.
Assoc. Cancer Res. 23, 1656–1669 (2017).
32. Wellenstein, M. D. & de Visser, K. E. Cancer-Cell-Intrinsic Mechanisms Shaping
the Tumor Immune Landscape. Immunity vol. 48 399–416 (2018).
33. Ikeda, W. et al. Tage4/nectin-like molecule-5 heterophilically trans-interacts with
cell adhesion molecule nectin-3 and enhances cell migration. J. Biol. Chem. 278,
28167–28172 (2003).
34. Jackson, E. L. et al. Analysis of lung tumor initiation and progression using
conditional expression of oncogenic K-ras. Genes Dev. 15, 3243–3248 (2001).
35. Marino, S., Vooijs, M., Van Der Gulden, H., Jonkers, J. & Berns, A. Induction of
medulloblastomas in p53-null mutant mice by somatic inactivation of Rb in the
external granular layer cells of the cerebellum. Genes Dev. 14, 994–1004 (2000).
36. Gibson, D. G. et al. Enzymatic assembly of DNA molecules up to several hundred
kilobases. Nat. Methods 6, 343–345 (2009).
37. Benchling [Biology Software]. (2019). Retrieved from https://benchling.com.
38. Church, G. M. & Gilbert, W. Genomic sequencing. Proc. Natl. Acad. Sci. U. S. A.
81, 1991–1995 (1984).
39. Sánchez-Rivera, F. J. et al. Rapid modelling of cooperating genetic events in
cancer through somatic genome editing. Nature 516, 428–431 (2014).
40. Boj, S. F. et al. Organoid models of human and mouse ductal pancreatic cancer.

148
Cell 160, 324–338 (2015).
41. VanDussen, K. L., Sonnek, N. M. & Stappenbeck, T. S. L-WRN conditioned
medium for gastrointestinal epithelial stem cell culture shows replicable batch-to-
batch activity levels across multiple research teams. Stem Cell Res. 37, 101430
(2019).
42. Kim, M. P. et al. Generation of orthotopic and heterotopic human pancreatic cancer
xenografts in immunodeficient mice. Nat. Protoc. 4, 1670–1680 (2009).
43. Sastra, S. A. & Olive, K. P. Quantification of Murine Pancreatic Tumors by High
Resolution Ultrasound. Methods Mol. Biol. 980, (2013).
44. Liang, S. C. et al. Regulation of PD-1, PD-L1, and PD-L2 expression during normal
and autoimmune responses. Eur. J. Immunol. 33, 2706–2716 (2003).
45. Dixon, K. O. et al. Functional Anti-TIGIT Antibodies Regulate Development of
Autoimmunity and Antitumor Immunity. J. Immunol. (Baltimore, Md. 1950) 200,
3000–3007 (2018).
46. Rolink, A., Melchers, F. & Andersson, J. The SCID but not the RAG-2 gene product
is required for Sμ-Sε heavy chain class switching. Immunity 5, 319–330 (1996).
47. Butler, A., Hoffman, P., Smibert, P., Papalexi, E. & Satija, R. Integrating single-cell
transcriptomic data across different conditions, technologies, and species. Nat.
Biotechnol. 36, 411–420 (2018).
48. De Meo, P., Ferrara, E., Fiumara, G. & Provetti, A. Generalized Louvain method for
community detection in large networks. in International Conference on Intelligent
Systems Design and Applications, ISDA 88–93 (2011).
doi:10.1109/ISDA.2011.6121636.

149
49. Mcinnes, L., Healy, J., Saul, N. & Großberger, L. UMAP: Uniform Manifold
Approximation and Projection Software • Review • Repository • Archive. (2018)
doi:10.21105/joss.00861.
50. Becht, E. et al. Dimensionality reduction for visualizing single-cell data using UMAP.
Nat. Biotechnol. 37, 38–47 (2019).
51. Durinck, S., Spellman, P. T., Birney, E. & Huber, W. Mapping identifiers for the
integration of genomic datasets with the R/ Bioconductor package biomaRt. Nat.
Protoc. 4, 1184–1191 (2009).
52. Durinck, S. et al. BioMart and Bioconductor: a powerful link between biological
databases and microarray data analysis. Bioinformatics 21, 3439–40 (2005).
53. Love, M. I., Huber, W. & Anders, S. Moderated estimation of fold change and
dispersion for RNA-seq data with DESeq2. Genome Biol. 15, 550 (2014).
54. Barbie, D. A. et al. Systematic RNA interference reveals that oncogenic KRAS-
driven cancers require TBK1. Nature 462, 108–112 (2009).
55. Hyvärinen, A. & Oja, E. Independent component analysis: Algorithms and
applications. Neural Networks 13, 411–430 (2000).
56. Muzumdar, M. D. et al. Survival of pancreatic cancer cells lacking KRAS function.
Nat. Commun. 8, 1–19 (2017).
57. Li, C. M. C. et al. Foxa2 and Cdx2 cooperate with Nkx2-1 to inhibit lung
adenocarcinoma metastasis. Genes Dev. 29, 1850–1862 (2015).
58. Romero, R. et al. Keap1 loss promotes Kras-driven lung cancer and results in
dependence on glutaminolysis. Nat. Med. 23, 1362–1368 (2017).
59. Rutledge, D. N. & Jouan-Rimbaud Bouveresse, D. Independent Components
150
Analysis with the JADE algorithm. TrAC - Trends in Analytical Chemistry vol. 50
22–32 (2013).
60. Biton, A. et al. Independent Component Analysis Uncovers the Landscape of the
Bladder Tumor Transcriptome and Reveals Insights into Luminal and Basal
Subtypes. Cell Rep. 9, 1235–1245 (2014).
61. Miettinen, J., Nordhausen, K. & Taskinen, S. Blind source separation based on joint
diagonalization in R: The packages JADE and BSSasymp. J. Stat. Softw. 76, 1–31
(2017).

151
Extended Data Figure 1
b
a
Total=10
Cre
Total=9
Cre(+CD8_ depletion)
Total=12
mScarlet-SIIN
% PanIN% PDAC
% Normal
Total=9
mScarlet-SIIN(+CD8_ depletion)
Immune Deficient
Immune Edited
A
800um 50um
H&E
800um 50um
CK19
800um 50um
RFP
800um 50um
CD8/CD4
A
A
A
Immune Evaded
A
800um 50um
H&E
800um 50um
CK19
800um 50um
RFP
800um 50um
CD8/CD4
A
A
A
Immune Cleared
A
800um 50um
H&E
800um 50um
CK19
800um 50um
RFP
800um 50um
CD8/CD4
A
A
A
c d
e
A
800um 50um
H&E
800um 50um
CK19
A
800um 50um
RFP
800um 50um
CD8/CD4
A
A
Extended Data Figure 1a, Quantification of histologic breakdown of control (Cre) or immunogenic (mScarletSIIN) autochthonous animals, with or without CD8_ depletion, at 9 weeks post-initiation (n=9-12 animals per condition). All histologic diagnoses were confirmed by a pathologist specializing in rodent pathology (R.T.B.). b-e, Hematoxylin and eosin (H&E) and immunohistochemical staining for cytokeratin 19 (CK19), mScarlet (RFP), CD8_ (CD8) and/or CD4 (CD4) on representative images for b, immune-edited c, immune-evaded d, immune-cleared e, immune-deficient animals.

152
Extended Data Figure 2
e
d
f
14-A
214
-A3
14-A
414
-A5
14-A
714
-A8
14-A
914
-B1
14-B
214
-B8
14-B
914
-B10
14-B
11
14-B
12
14-C
114
-C2
14-C
314
-C7
14-C
814
-C9
14-C
10
14-C
11
14-D
11
14-D
12
mScarlet WPRE BgH pASIINFEKL P2APGK ATG
Koza
kHipp11-5’-arm Hipp11-3’-arm
NsiI
sgRNA target sequence
NsiI
cHipp11-5’-arm Hipp11-3’-arm
H11-WTNsiI
NsiIH11 3’ ext probe
H11 3’ ext probe
H11 3’ ext probe
mScarletSIINFEKL P2A
H11.1sgRNAU6 EFSsca!old BlastReCas9 T2
A
b
23.1
9.4
6.5
4.3
23.1
9.4
6.5
4.3
Knock-in
Knock-in
Wild-type
g23.1
9.4
6.5
4.3
Knock-in
Wild-type
H11 5’ ext probe
H11 5’ ext probe
H11 5’ ext probe
Puromycin Cre
‘KP;H11-SIIN’Chimeric organoids
KrasLSL-G12D/+;Trp53FL/FL;
Hipp11LSL-SIIN/LSL-SIIN
Chimeric:KrasLSL-G12D/+;Trp53FL/FL;
Hipp11LSL-SIIN/LSL-SIIN
a
Extended Data Figure 2a, Experimental schematic depicting chimera generation, isolation of organoids, purification of mESC-derived organoids and Cre-mediated recombination of alleles. Schematics of b, “U6-sgRNA-EFS-eCas9-P2A-Blast” c, Hipp11 wild-type genomic locus, d, extended H11-SIIN genomic locus (with southern blot probes annotated) following successful knock-in and recombina-tion. Southern blot validation of NsiI digested genomic DNA from mESC clones using e, internal probe, f, 3’ external probe, g, 5’ external probe (probes depicted graphically next to each blot). Highlighted in red is the clone ‘14-C2’ which was a homozygous targeted clone used to generate ‘KP;H11-SIIN’ genetically-defined pancreatic organoids.

153
Extended Data Figure 3H&E
800um
CK19
800um
800um
800um
50um
50um
50um
50um
50um
50um
50um
50um
B
C
A
50um
50um
50um
50um
RFP
CD8/CD4
B
C
A
B
C
A
B
C
A
A
800um 50um
H&E
800um 50um
CK19
800um 50um
RFP
800um 50um
CD8/CD4
A
A
A
a
b A c
A: “High” B: “Med” C: “Low”
d
KP
SIIN (N
)
SIIN (P
)0
2
4
6
CD
44hi
Tetra
mer
+ (%
of C
D8+ )
ns
Week 5
Week 8
0
10
20
30
CD
8+
(% o
f liv
e, C
D45
+ )
Extended Data Figure 3Hematoxylin and eosin (H&E) and immunohistochemical staining for cytokeratin 19 (CK19), mScarlet (RFP), CD8_ (CD8) and/or CD4 (CD4) on representative images for a, progressor with high-magnification images for representative areas of “high”, “medium” (“med”) or “low” CD8+ T cell infiltration or b, immune-deficient animals. c, Flow cytometric assessment of CD44hiTetramer+CD8+ T cells during peak response in peripheral blood at 3 weeks post-initiation (scatter plots showing mean +/- SD). d, Flow cytometric analysis of CD8+ T lymphocytes (% of live, CD45+) in progressor tumors at 5 and 8 weeks post-initiation (scatter plots showing mean +/-SD). Statistical analyses: c,d, two-sided Mann-Whitney test (** P < 0.01).

154
Extended Data Figure 4ba c
e
No T cells
5:1
10:1
No T cells
5:1
10:1
E:T ratiof
d
)Immune-Deficient (-IFN )Immune-Deficient (+IFN )Progressor (-IFN Progressor (+IFN )
Pro
gres
sor 1
Pro
gres
sor 2
Imm
une-
defic
ient
1Im
mun
e-de
ficie
nt 2
0
50
100
mSc
arle
t+ (%
of E
pCam
+ liv
e ce
lls)
ns ns
ns
ns
0
200
400
600
800
1000
PD-L
1 gM
FI
ns
ns
0
500
1000
1500
2000
H-2
Db
gMFI
ns
0
500
1000
1500
2000
MH
C c
lass
II g
MFI
Extended Data Figure 4Flow cytometric assessment of a, mScarlet-positivity b, MHC-I (H-2Db) c, MHC-II (I-A/I-E) and d, PD-L1 surface expression on pancreatic tumor-derived organoids from progressor (n=7) or immune deficient (n=5) animals (all four scatter plots showing mean +/- SD). e-f, Representative images of Day 5 pancreat-ic tumor-derived organoids from progressor or immune-deficient animals either in the absence (no T cells) or presence of pre-activated OT-I CD8+ T cells at 5:1 or 10:1 E:T ratios. Statistical analyses: a-d, two-sid-ed Mann-Whitney test (n.s. P=non-significant, * P < 0.05,** P < 0.01,*** P < 0.001).

155
a
0 10 4 10 5
0
-10 3
10 3
10 4
10 5
b
0 50K 100K 150K 200K 250K
0
50K
100K
150K
200K
250K
FSC-A
SSC
-A
MHCII-BUV711 Ly6C-PerCP-Cy5.5
CD
11b-
BU
V605
XCR1-PE
CD
172a
-FIT
C
MHCII-BUV711
CD
11c-
PE-C
y7
0 50K 100K 150K 200K 250K
0
50K
100K
150K
200K
250K
FSC-A
FSC
-H
0 50K 100K 150K 200K 250K
0
50K
100K
150K
200K
250K
SSC-A
SSC
-H
0-10 3 10 3 10 4 10 5
0
-10 3
10 3
10 4
10 5
CD45-BUV786
Live
/Dea
d-A
qua
Ly6G-Alexa Fluor 700
CD
11b-
BU
V605
0-10 3 10 3 10 4 10 5
0
-10 3
10 3
10 4
10 5
0-10 3 10 3 10 4 10 5
0
-10 3
10 3
10 4
10 5
0-10 3 10 3 10 4 10 5
0
-10 3
10 3
10 4
10 5
F4/8
0-A
PC
CD64-BV421
0-10 3 10 3 10 4 10 5
0
-10 3
10 3
10 4
10 5
Extended Data Figure 5
86.0
11.3
52.9
29.7
16.958.914.3
84.4
5.32
CD
19-B
UV3
95
14.0
SIIN (Progressor) [N=7]KP [N=4]
Neutro
phils
Macro
phages
B cells
Monocytes DCs
cDC1
cDC2
0
20
40
60
80
100
% o
f CD
45+
ns
ns
ns
ns
DCscD
C1cD
C20.0
0.5
1.0
1.5
2.0
2.5
% o
f CD
45+
nsns
ns
0-10 3 10 3 10 4 10 5
0
-10 3
10 3
10 4
10 5
38.6
34.9
Extended Data Figure 5a, Gating strategy and b, Flow cytometric quantification of innate and adaptive (non-T cell) CD45+ immune populations from KP (n=4) and KP;H11-SIIN progressor tumors (n=7) (scatter plots showing mean +/- SD). Statistical analyses: b, two-sided Mann-Whitney test (n.s., P = non-significant).

156
Extended Data Figure 6a
b
ï�
ï�
0
�
�
ï� 0UMAP_1
80$3
B�
������������
Cd3e
ï�
ï�
0
�
�
ï� 0UMAP_1
80$3
B�
1.761.80����1.88
Cd4
ï�
ï�
0
�
�
ï� 0UMAP_1
80$3
B�
��������������������
Cd8a
c
ï�
ï�
0
�
�
ï� 0UMAP_1
80$3
B�
��������������������
Lag3
ï�
ï�
0
�
�
ï� 0UMAP_1
80$3
B�
����������������
Tcf7
ï�
ï�
0
�
�
ï� 0UMAP_1
80$3
B�
����������������
Ly6c2
ï�
ï�
0
�
�
ï� 0UMAP_1
80$3
B�
������
Tigit
ï�
ï�
0
�
�
ï� 0UMAP_1
80$3
B�
���������
Havcr2
ï�
ï�
0
�
�
ï� 0UMAP_1
80$3
B�
���1.61.8���
Itgae
ï�
ï�
0
�
�
ï� 0UMAP_1
80$3
B�
���������
Gzmb
ï�
ï�
0
�
�
ï� 0UMAP_1
80$3
B�
������������
Klra9
0.0
���
1.0
���
0 1 � 3Identity
Expr
essi
on L
evel
01�3
Klra6
0.0
���
1.0
���
���
0 1 � 3Identity
Expr
essi
on L
evel
01�3
Klra7
0
1
�
3
0 1 � 3Identity
Expr
essi
on L
evel
01�3
Ly6c2
0
1
�
3
0 1 � 3Identity
Expr
essi
on L
evel
01�3
Tox
0
1
�
0 1 � 3Identity
Expr
essi
on L
evel
01�3
Havcr2
0
1
�
3
0 1 � 3Identity
Expr
essi
on L
evel
01�3
Lag3
0
1
�
3
0 1 � 3Identity
Expr
essi
on L
evel
01�3
Pdcd1
d
eï�
ï�
0
�
�
ï� 0UMAP_1
80$3
B�
1.3���1.71.9
Cd44
ï�
ï�
0
�
�
ï� 0UMAP_1
80$3
B�
��������������������
Ccr7
ï�
ï�
0
�
�
ï� 0UMAP_1
80$3
B�
������������������������
Klf2
ï�
ï�
0
�
�
ï� 0UMAP_1
80$3
B�
����������������
Sell
0
1
�
0 1 � 3Identity
Expr
essi
on L
evel
01�3
Tigit
��. ���. ���. ���. ���.
0
��.
���.
���.
���.
���.
FSC-A
FSC
-H
��. ���. ���. ���. ���.
0
��.
���.
���.
���.
���.
FSC-ASS
C-A
0-10 3 10 3 10 � 10 �
0
��.
���.
���.
���.
���.
Live/Dead-APC-Cy7
FSC
-H
0-10 3 10 3 10 �
0
-10 3
10 3
10 �
10 �
CD11b-PE-Cy7
CD
8a-B
V421
0-10 3 10 3 10 � 10 �
0
-10 3
10 3
10 �
10 �
CD4-Alexa Fluor647
CD
8a-B
V421
0 10 3 10 �
0
-10 �
10 �
10 3
10 �
H-2Kb-SIINFEKL-PE
CD
44-F
ITC
6.65
0
1
�
0 1 � 3Identity
Expr
essi
on L
evel
01�3
Gzmb
Extended Data Figure 6a, Sorting strategy for CD44hiTetramer+ CD8+ TILs from progressor tumors for scRNA-Seq analysis. UMAP projections of the gene expression for b, quality controls: Cd3e (CD3), Cd8a (CD8_), Cd4 (CD4). c, UMAP projections of the gene expression (top) and violin plots (bottom) for selected genes associated with cluster 0: Lag3 (LAG3), Tigit (TIGIT), Havcr2 (TIM3), Pdcd1 (PD-1), Tox (TOX), Gzmb (Granzyme B). d, UMAP projections of the gene expression for selected genes associated with clusters 1,2,3: Tcf7 (TCF1), Sell (CD62L), Cd44 (CD44), Ccr7 (CCR7), Klf2 (KLF2), Itgae (CD103). e, UMAP projections of the gene expression and violin plots for selected genes associated with cluster 3: Ly6c2 (Ly6c), Klra9 (Ly49I), Klra6 (Ly49F), Klra7 (Ly49G2).

157
Extended Data Figure 7a
b
c
ï�
ï�
0
�
�
ï� 0UMAP_1
80$3
B�
����0.10��������
CM3
ï�
ï�
0
�
�
ï� 0UMAP_1
80$3
B�
0.1���0.3������
CM4
ï�
ï�
0
�
�
ï� 0UMAP_1
80$3
B�
���������������0.100�����
CM5
ï�
ï�
0
�
�
ï� 0UMAP_1
80$3
B�
����0.08����0.16
CM6
ï�
ï�
0
�
�
ï� 0UMAP_1
80$3
B�
0.1���0.3���
AM1
ï�
ï�
0
�
�
ï� 0UMAP_1
80$3
B�
����0.08����0.16
AM2
ï�
ï�
0
�
�
ï� 0UMAP_1
80$3
B�
������0.6
AM3
ï�
ï�
0
�
�
ï� 0UMAP_1
80$3
B�
���0.3
AM4
ï�
ï�
0
�
�
ï� 0UMAP_1
80$3
B�
0.1���
AM5
ï�
ï�
0
�
�
ï� 0UMAP_1
80$3
B�
0.1���0.3������
AM6
ï�
ï�
0
�
�
ï� 0UMAP_1
80$3
B�
0.1���0.3������
AM7
ï�
ï�
0
�
�
ï� 0UMAP_1
80$3
B�
0.1���0.3������
AM8
ï�
ï�
0
�
�
ï� 0UMAP_1
80$3
B�
����0.10����
AM9
ï�
ï�
0
�
�
ï� 0UMAP_1
80$3
B�
0.1���
AM10
ï�
ï�
0
�
�
ï� 0UMAP_1
80$3
B�
0.1���0.3
AM11
ï�
ï�
0
�
�
ï� 0UMAP_1
80$3
B�
����0.10��������
AM12
ï�
ï�
0
�
�
ï� 0UMAP_1
80$3
B�
0.1���0.3���
AM13
ï�
ï�
0
�
�
ï� 0UMAP_1
80$3
B�
����0.10����
Activation
ï�
ï�
0
�
�
ï� 0UMAP_1
80$3
B�
����0.10����
Dysfunction
ï�
ï�
0
�
�
ï� 0UMAP_1
80$3
B�
0.1���0.3
Activation/Dysfunction
ï�
ï�
0
�
�
ï� 0UMAP_1
80$3
B�
����0.10������������
Naive/Memoryd
Gm14085Id3Satb1SellLef1Ccr7Tcf7IghmDapl1Igfbp4Nsg2Il6raGpr146S1pr1Klf2Socs3EmbLy6c2Gm43698Ifngr2
e
ï�
ï�
0
�
�
ï� 0UMAP_1
80$3
B�
0.1���0.3������
Pagoda 30
ï�
ï�
0
�
�
ï� 0UMAP_1
80$3
B�
0.1���0.3
Ly49+
Extended Data Figure 7UMAP projections of the gene module expression for all remaining modules from a, chronic LCMV20, b, acute LCMV20, c, B16 melanoma19, d, Ly49+ 18. e, Heatmap and UMAP projection of the gene signature expression of Pagoda30.

158
Extended Data Figure 8
bWeek 5
Week 8
Non-progressor (N)Intermediate (I)Progressor (P)
Non-progressor (N)Progressor (P)
a
LAG3-FITC
PD1-
BV5
10
Ki67-Alexa Fluor 700
PD1-
BV5
10
TIGIT-PerCP-Cy5.5
PD1-
BV5
10
TIM3-BV605
PD1-
BV5
10
FSC-A
FSC
-H
FSC-ASS
C-A
Live/Dead-APC-Cy7
CD
45-B
UV7
86
CD4-BUV737
CD
8a-B
UV3
95
CD
44-B
V711
H-2Kb-SIINFEKL-PE
0 50K 100K 150K 200K 250K
0
50K
100K
150K
200K
250K
0 50K 100K 150K 200K 250K
0
50K
100K
150K
200K
250K
0-10 3 10 3 10 4 10 5
0
-10 3
10 3
10 4
10 5
0-10 3 10 3 10 4 10 5
0
-10 3
10 3
10 4
10 5
3.89
6.50
0-10 3 10 3 10 4 10 5
0
-10 3
10 3
10 4
10 5 24.2
0-10 3 10 3 10 4 10 5
0
-10 3
10 3
10 4
10 5 35.6
10 1 10 2 10 3 10 4 10 5
0
-10 3
10 3
10 4
10 5 80.6
0-10 3 10 3 10 4 10 5
0
-10 3
10 3
10 4
10 5 30.1
0-10 3 10 3 10 4 10 5
0
-10 3
10 3
10 4
10 5 30.3
Week 5
Week 8
0
20
40
60
Ki6
7+
(% o
f CD
44hiTe
tram
er+ )
0
20
40
60
80
CD
44hi
Tetra
mer
+
(% o
f CD
8+ )
ns
nsns
0
20
40
60
PD-1
+ LA
G-3
+
(% o
f CD
44hi
Tetra
mer
+ )
ns
ns
0
20
40
60
80
100
PD-1
+ TIM
-3+
(% o
f CD
44hi
Tetra
mer
+ )
nsns
0
20
40
60
PD-1
+ TIG
IT+
(% o
f CD
44hi
Tetra
mer
+ )
ns
ns
0
20
40
60
PD-1
+ TIG
IT+
(% o
f CD
44hi
Tetra
mer
+ )
0
20
40
60
80
PD-1
+ TIM
-3+
(% o
f CD
44hi
Tetra
mer
+ )
0
20
40
60
80
100
PD-1
+ LA
G-3
+
(% o
f CD
44hi
Tetra
mer
+ )
0
20
40
60
80
CD
44hi
Tetra
mer
+
(% o
f CD
8+ )
ns
Extended Data Figure 8a, Gating strategy for immunophenotyping of CD44hiTetramer+ CD8+ TILs b, Week 5 (top) and week 8 (bottom) analysis of CD44hiTetramer+ CD8+ TILs from orthotopically transplanted KP;H11-SIIN pancreatic organoids (gated as illustrated in a). c, Ki67+ population of CD44hiTetramer+ CD8+ TILs from progressor tumors at defined times following tumor initiation (scatter plot showing mean +/- SD). Statistical analyses: b,c, two-sided Mann-Whitney test (n.s., P=non-significant, * P <0.05, ** P < 0.01).
c

159
0 50K 100K 150K 200K 250K
0
50K
100K
150K
200K
250K
0 50K 100K 150K 200K 250K
0
50K
100K
150K
200K
250K
0-10 3 10 3 10 4 10 5
0
-10 3
10 3
10 4
10 5
0-10 3 10 3 10 4 10 5
0
-10 3
10 3
10 4
10 5
Live/Dead-APC-Cy7
CD
3-B
UV8
05
SSC-A
SSC
-H
FSC-H
FSC
-A
Live/Dead-APC-Cy7
CD
8-B
UV7
37
Extended Data Figure 9a
b
0 10 3 10 4
0
10 3
10 4
CD45RO-BUV395
TCF1
-Ale
xa F
luor
647
c
0.0
0.2
0.4
0.6
0.8
1.0 High (n=44)
Low (n=44)p = 0.02340
1 2 3 4 5
Years
Surv
ival
frac
tion
Pagoda36 (TCGA)
|Sig
natu
re z
_sco
re|
Log2FC
Pagoda36 (TCGA)d
78.8
TIGIT
PDAC
Healthy PBMCs
0-10 2 10 2 10 3 10 5
0
-10 1
10 1
10 2
10 3
10 4 17.8
0-10 3 10 3 10 4 10 5
0
-10 2
10 2
10 3
10 4
10 5 21.9
0-10 2 10 2 10 3 10 4
0
-10 1
10 1
10 2
10 3
10 4 14.4
0-10 3 10 3 10 4 10 5
0
-10 1
10 1
10 2
10 3
10 4 14.2
TIM3-BV711
TIG
IT-P
E-C
y7
TIM3-BV711
PD1-
BV5
10
LAG3-PE-TxRed
PD1-
BV5
10
TIGIT-PE-Cy7
PD1-
BV5
10
ePD1+ TIG
IT+
PD1+ LAG3+
PD1+ TIM3+
TIGIT
+ TIM3+
0
20
40
60
80
100
% o
f CD
8+
0
20
40
60
80
100
CD
45R
O+ T
CF1
lo (%
of C
D8+ )
Extended Data Figure 9a, Gating strategy for immunophenotyping of CD8+ TILs from human PDAC resections b, Quantification of co-inhibitory receptor co-expression on CD8+ T cells from healthy peripheral blood mononuclear cells (PBMCs) or human PDAC resection (gated as illustrated in a; scatter plots showing mean +/- SD). c, Quantification of antigen-experienced (CD45RO+TCF1lo) CD8+ TILs (scatter plots showing mean +/- SD). d, Kaplan-Meier survival analysis of upper (“High”, red) and lower (“Low”, blue) quartile TCGA PAAD patients (n=44 each) stratified by expression correlation with the murine-derived Pagoda36 gene signa-ture. e, All genes ranked by their absolute z-score in the human TCGA PAAD gene signature between most and least Pagoda36-correlated cohorts (y-axis) compared to the magnitude of their fold change (x-axis, log2 fold change (Log2FC) of most/least-correlated cohort expression). Selected co-inhibitory receptors highly upregulated in most-correlated tumors are highlighted in red. Statistical analyses: b,c, two-sided Mann-Whitney test (** P <0.01, *** P <0.001). d, log-rank test (p = 0.0234)

160
Extended Data Figure 10
Week 7 Week 8 Week 9 Week 10 Week 11 Week 12-30
-20
-10
0
10
20
30
Mou
se W
eigh
t (%
of b
asel
ine)
-30
-20
-10
0
10
20
30
Mou
se W
eigh
t (%
of b
asel
ine)
-30
-20
-10
0
10
20
30
Mou
se W
eigh
t (%
of b
asel
ine)
-30
-20
-10
0
10
20
30
Mou
se W
eigh
t (%
of b
asel
ine)
-30
-20
-10
0
10
20
30
Mou
se W
eigh
t (%
of b
asel
ine)
-30
-20
-10
0
10
20
30
Mou
se W
eigh
t (%
of b
asel
ine)
g h iIsotype Control
anti-PD-1 + CD40a
anti-TIGIT + CD40a
anti-PD-1
anti-TIGIT + anti-PD-1 + CD40a
anti-TIGIT
j k l
Week 6 Week 7 Week 8 Week 9 Week 10 Week 11 Week 12-100
-50
0
50
10010002000300040005000
Perc
ent c
hang
e fr
om b
asel
ine
Start therapy
Stop therapy
Week 6 Week 7 Week 8 Week 9 Week 10 Week 11 Week 12-100
-50
0
50
10010002000300040005000
Perc
ent c
hang
e fr
om b
asel
ine
Start therapy
Stop therapy
Week 6 Week 7 Week 8 Week 9 Week 10 Week 11 Week 12-100
-50
0
50
10010002000300040005000
Perc
ent c
hang
e fr
om b
asel
ine
Start therapy
Stop therapy
Week 6 Week 7 Week 8 Week 9 Week 10 Week 11 Week 12-100
-50
0
50
10010002000300040005000
Perc
ent c
hang
e fr
om b
asel
ine
Start therapy
Stop therapy
Week 6 Week 7 Week 8 Week 9 Week 10 Week 11 Week 12-100
-50
0
50
10010002000300040005000
Perc
ent c
hang
e fr
om b
asel
ine
Start therapy
Stop therapy
Week 6 Week 7 Week 8 Week 9 Week 10 Week 11 Week 12-100
-50
0
50
10010002000300040005000
Perc
ent c
hang
e fr
om b
asel
ine
Start therapy
Stop therapy
a b cIsotype Control
anti-PD-1 + CD40a
anti-TIGIT + CD40a
anti-PD-1
anti-TIGIT + anti-PD-1 + CD40a
anti-TIGIT
d e f
Extended spider plots
Mouse weights
Week 7 Week 8 Week 9 Week 10 Week 11 Week 12 Week 7 Week 8 Week 9 Week 10 Week 11 Week 12 Week 7 Week 8 Week 9 Week 10 Week 11 Week 12
Week 7 Week 8 Week 9 Week 10 Week 11 Week 12Week 7 Week 8 Week 9 Week 10 Week 11 Week 12
Extended Data Figure 10a-f, Longitudinal tracking during and following therapy by small rodent ultrasound imaging with therapy start/stop times indicated (spider plot through week 10 opacified; data depicted in Figure 4e-j). g-l, Mouse weights during and following therapy.

161
3. Discussion
The work presented in this thesis has focused on gaining a deeper understanding
of the dynamics between the immune system and pancreatic tumor progression. I have
described the development of two novel, orthogonal mouse models of pancreatic cancer:
an “immunogenic” KrasG12D/+; Tp53fl/fl-driven autochthonous GEMM where lentiviral
instillation in the pancreatic duct induces neoantigen expression of the SIINFEKL antigen,
and a KrasG12D; Tp53fl/f organoid-based transplantation model stably expressing the
SIINFEKL antigen from the H11 genetic locus. Both models faithfully recapitulate disease
progression from early pancreatic intraepithelial neoplastic (PanIN) lesions to malignant
pancreatic ductal adenocarcinoma (PDAC), and distant metastatic disease. These mouse
models were leveraged to longitudinally characterize the T cell response in the tumor
microenvironment, as well as uncover an immunosuppressive axis that promotes tumor
immune escape in PDAC. In the next sections, I will discuss the implications of these
findings for our understanding of immunoediting, T cell dysfunction, and the clinical
translatability of novel combination immunotherapies.
3.1. Genetically engineered mouse models offer unique insights into tumor
immunoediting
Seminal work from Bob Schreiber and colleagues over the last two decades has
led to the definition of the ‘cancer immunoediting’ process1,2. During cancer
immunoediting, tumor-immune interactions undergo three phases: elimination,
equilibrium, and escape. The immune system recognizes and eliminates antigenic tumor
cells early in neoplastic growth. If the immune response is unable to completely eradicate

162
malignant cells from the body, the immune response enters a state of equilibrium with the
(dormant) tumor, where constant selective immune pressure can drive adaptive
processes in the tumor. As a result, tumors may lose antigenicity or establish
immunoevasive mechanisms, which ultimately allows immune escape.
Work from our laboratory has deepened the understanding of the cancer
immunoediting process by extending these findings from murine transplant models to
autochthonous models. Consistent with the results in MCA-induced sarcoma models
reported by Schreiber and others, autochthonous SIINFEKL-expressing sarcoma tumors
undergo extensive immunoediting by T cells3. Immunoediting of these tumors leads to
delayed emergence of antigen-negative tumors. In contrast, autochthonous SIINFEKL-
expressing tumors arising in different tissue context, the lung, are capable of evading a
strong immune response while maintaining antigenicity4. As the genetic drivers and
antigens are identical in these models, this suggests that tissue origin and
microenvironment play an instrumental role in shaping anti-tumor immunity. Indeed,
detailed characterization of the tumor microenvironment has revealed a tumor-promoting
role for the microbiome through gd T cells5, and a role for T regulatory cells in restraining
anti-tumor T cell responses to lung adenocarcinomas6,7. Additionally, immune responses
in lung tumors can be potentially be restimulated through the engagement of NK cells8.
As the KPC GEMM does not allow investigation of tumor-specific T cell responses
in the pancreatic microenvironment, we adapted an elegant surgical technique developed
by Monte Winslow (a former postdoc in our laboratory) and colleagues at Stanford to
initiate autochthonous KrasG12D/+, Tp53fl/fl (“KP”) pancreatic tumors with a defined model
neoantigen (SIINFEKL)9.

163
To our knowledge, this is the first demonstration that autochthonous pancreatic
tumors are immunoedited by the CD8+ T cell response. Furthermore, our work
demonstrates that a subset of autochthonous tumors is capable of evading a robust
tumor-specific T cell response while maintaining antigenicity. These results are consistent
with observations in murine sarcoma transplant and autochthonous tumor models, where
antigen loss precedes the clonal outgrowth of tumors3,10,11.
It should also be noted that a different immunogenic GEMM of pancreatic cancer
was recently published by the DeNardo group12. While their model used a similar genetic
background as the present study, importantly Cre-expression is controlled of the
pancreas-specific p48 locus and the ovalbumin-IRES-GFP model antigens are under
tetracycline-inducible control of the Rosa26 locus (denoted as “KPC-OG”). Interestingly,
OG antigen expression accelerated PDAC progression through pro-inflammatory,
pathogenic CD4+ (TH17) T cell responses. In contrast to the results reported here, Hegde
et al. found no evidence for immunoediting in their model, and late-stage PDAC tumors
maintained GFP12. A number of factors could account for the differing results observed.
First, KPC-OG drives the expression of full-length ovalbumin, while in the present study
a truncated ovalbumin sequence encompassing SIINFEKL was used. Full-length
ovalbumin contains a MHC II-restricted epitope (e.g. OVA323-339)13, which may explain the
pathogenic CD4+ T cell response in KPC-OG mice. It would be interesting to test if the
immunoediting observed in our autochthonous tumor is influenced by a CD4+ T cell
response. Second, while Hegde et al. position their germline encoded OG antigen as a
true neoantigen (i.e. not subjected to thymic tolerance), they use a vaccination and
transplantation approach to argue that SIINFEKL-specific T cell responses are unaffected

164
in KPC-OG. However, prior results from our laboratory have demonstrated that it is
possible to “break” tolerance against germline, self-antigen (R26LSL-LSIY/+) through tumor
vaccination14, which raises the possibility that the OG antigen may be partially tolerized
(and therefore leads to the thymic deletion of high-affinity SIINFEKL-specific CD8 T cells).
A critical test of this concept is assessing whether Ovalbumin-IRES-GFP expression can
be detected in the thymus, and crossing KPC-OG with transgenic TCR-recognizing
SIINFEKL (“OT-I”) mice15; a decrease of peripheral OT-I T cells in the latter experiment
would demonstrate that thymic tolerance is operational. Lastly, it may be helpful to
investigate these model-specific differences by crossing the OG allele into the
autochthonous model described here, as this may lead to new insights how nature of
antigen influences tumor progression.
A model for immunoediting during pancreatic tumorigenesis
The kinetics and peak expansion of the antigen-specific T cell compartment
suggest that immunoediting in SIINFEKL-expressing autochthonous tumors may occur
relatively early during tumor development. At three weeks post-initiation, pancreatic
lesions are unlikely to have progressed to adenocarcinomas and T-cell mediated
immunoediting may thus be a feature of the PanIN stage. The observed lack of tumor
burden differences between unedited (CD8-depleted) tumors and edited tumors further
suggests that early immunoediting may have minimal effects on the progression of PanIN
to adenocarcinoma.
These results suggest a model where rapid immune pressure after oncogenic
transformation forces tumor evolution down divergent paths (Figure 1a).
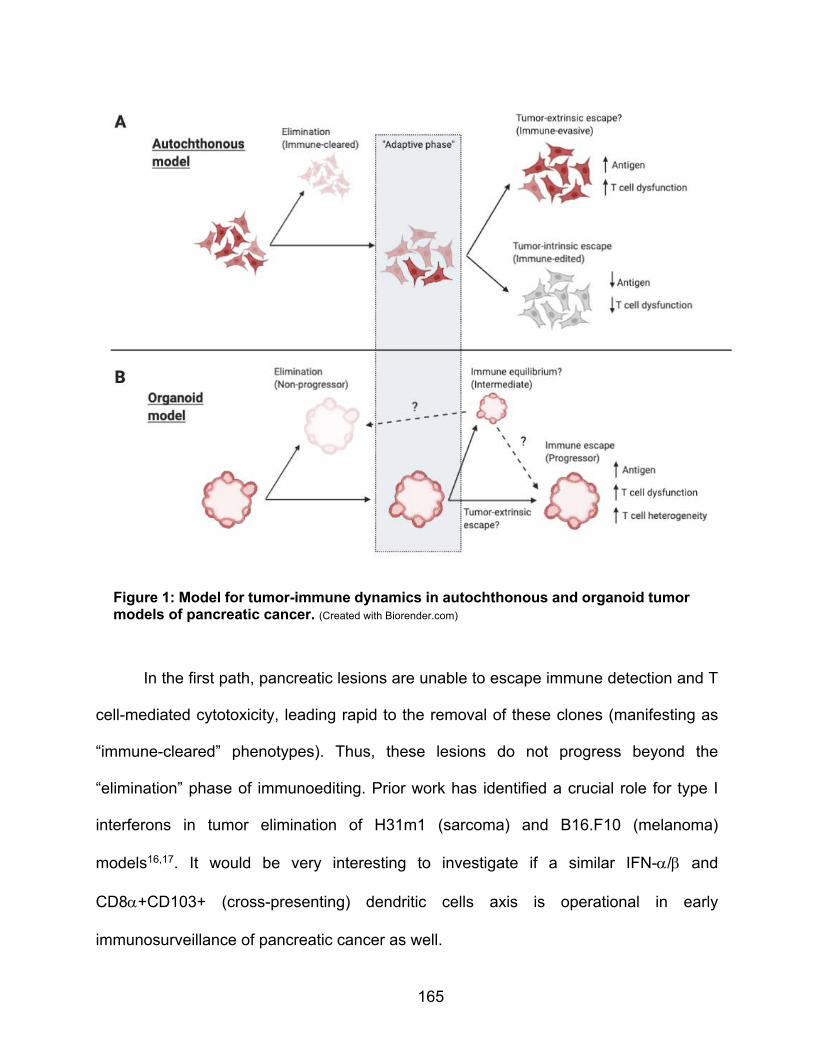
165
In the first path, pancreatic lesions are unable to escape immune detection and T
cell-mediated cytotoxicity, leading rapid to the removal of these clones (manifesting as
“immune-cleared” phenotypes). Thus, these lesions do not progress beyond the
“elimination” phase of immunoediting. Prior work has identified a crucial role for type I
interferons in tumor elimination of H31m1 (sarcoma) and B16.F10 (melanoma)
models16,17. It would be very interesting to investigate if a similar IFN-a/b and
CD8a+CD103+ (cross-presenting) dendritic cells axis is operational in early
immunosurveillance of pancreatic cancer as well.
Figure 1: Model for tumor-immune dynamics in autochthonous and organoid tumor models of pancreatic cancer. (Created with Biorender.com)
166
In the second path of the model, tumors are able to adapt to immune pressure,
leading to further branching in tumor evolution. The majority of these tumors adapt by
deregulation of antigen expression (manifesting as “immune-edited”), which then allows
them to rapidly escape immune detection. An open question is the molecular mechanism
that leads to antigen downregulation. Two mechanisms to explain the loss of tumor
antigenicity could be envisioned. First, low SIINFEKL-expressing cancer cell clones may
become selected and preferentially establish tumors. Lentiviral constructs can integrate
in many regions of the genome18, which creates a population of initiating cancer cells with
varying expression levels of antigen expression. Certain “hypoimmunogenic” clones may
then subsequently evade immune detection and establish tumors lesions. Second, cancer
cells may actively repress antigen expression, which also allows for the formation of
immunoedited tumors. Although this needs to be experimentally validated, treatment of
immunoedited sarcoma lines with 5-aza-2’-deoxycytidine (a DNA methylation inhibitor)
was capable of restoring antigen expression3. Antigen loss could thus be mediated
through the active epigenetic silencing of the lentiviral integration locus.
A subset of immune-adapting tumors is unable to deregulate antigen expression,
and instead develops distinct (and possibly tumor-extrinsic) mechanisms to escape
immune responses. Although the relative rarity of these immunoevasive tumors precluded
us from mechanistically defining immune escape, immunophenotyping of one tumor
revealed that antigen-specific CD8+ T cells were marked by the co-expression of co-
inhibitory receptors, suggesting that these TILs may become dysfunctional in the tumor.
T cell dysfunction is thought to be driven by chronic antigen exposure in the TME19. While
it is possible that tumor escape in this setting involves a dysfunctional T cell response, it

167
remains to be determined whether direct tumor-CD8+ T cell interactions or additional
immunosuppressive cells in the microenvironment play causal roles in mediating tumor
immune escape.
3.2. Outlook – the potential of autochthonous models and outstanding
questions
The results obtained with the autochthonous GEMM described in this thesis
highlight a number of key strengths of autochthonous tumor models. These models can
be leveraged to study many biological aspects of tumor progression that may be lacking
in other cancer model systems, for example in xenograft or cell line transplantation
models. By initiating oncogenic transformation in single (or a focal number of) cells,
autochthonous tumors faithfully model the entire histopathological disease progression
from pancreatic intraepithelial neoplasias (PanIN) to locally invasive pancreatic ductal
adenocarcinoma (PDAC), and even distant metastatic disease (in advanced-stage
tumors). This offers an opportunity to interrogate the impact and role of oncogenic
pathways on both primary tumor progression as well as metastatic spread, and indeed
this work is ongoing in our laboratory. In contrast, xenograft or transplantation models rely
on a single (bolus) injection of fully transformed cancer cells, which may only accurately
model biological aspects of end-stage disease. Autochthonous models also allow for the
investigation of the endogenous interactions between a developing tumor and the
immune cells recruited to the tumor microenvironment. The autochthonous GEMM
developed here closely recapitulated the characteristics of the human pancreatic tumor
microenvironment, including dense stromal-rich areas with poor vasculature, and

168
extensive tissue fibrosis. While the present data has focused exclusively on the role of
CD8+ T cells in immunoediting, this model is well-suited to explore the impact of other
immune cells on tumor progression.
An outstanding question is the role of CD4+ T cells and NK cells during
immunoediting responses in pancreatic tumors. Results in CD8-depleted SIINFEKL-
expressing autochthonous tumors show that, while antigen expression is maintained, the
majority of these “tumors” are histologically still in PanINs stages. In contrast, the vast
majority of (non-SIINFEKL expressing) Cre tumors were adenocarcinomas, suggesting a
tumor delay in SIINFEKL-expressing tumors, even in absence of CD8+ T cells. It is
possible that CD4+ T cells through the skewing of T cell response or by acquisition of
effector functions20, or alternatively, NK cells contribute to tumor control in these
autochthonous tumors21. Combined CD8+CD4 or CD8+NK depletion may offer additional
insights and possibly reveal a degree of functional redundancy between these immune
cell types.
This immunogenic autochthonous model may also enable more extensive,
phenotypic characterization of the antigen-specific T cell response. In contrast to the
autochthonous KrasG12D/+; Trp53R172H/+; Pdx-1-Cre (“KPC”) model developed in 200522,
tumors can be initiated in the adult murine pancreas and model antigens can be
introduced at will. The immunobiology of KPC tumors has been extensively investigated23,
including detailed characterization of the CD8+ T cell infiltrate. Indeed, therapeutic effects
achieved with treatment regimens involving combination chemoimmunotherapy in KPC
mice suggest that CD8+ T cell responses are involved in this model24. However, the
nature of antigens recognized by T cells in these models are unknown, thus precluding

169
further study of antigen-specific T cell response. In contrast, our autochthonous model
enables facile longitudinal tracking of the antigen-specific T cell response. This has
allowed both investigation of the early kinetics of the SIINFEKL-reactive T cell response,
as well as detailed profiling of tumor-responding T cells. This system is easily adapted to
accommodate different antigens or to explore the effect of a polyclonal population of
neoantigens. These questions are important to consider as human PDAC is likely to
harbor neoantigens with varying MHC I affinity25,26.
3.3. Organoid tumor immune escape may be mediated by tumor-extrinsic
mechanisms of immune evasion
The “immunogenic” tumor organoid system described in this thesis enabled more
rapid elucidation of mechanisms of tumor immune escape, while still facilitating
longitudinal tracking of the tumor-specific CD8+ T cell response. Transplantation of these
organoids in syngeneic, immunocompetent C57BL/6J mice unexpectedly gave rise to two
divergent antigenic phenotypes that were termed “progressor” and “non-progressor”, and
a third intermediary state (Figure 1b). Below, I will discuss a number of implications that
these results have on our understanding of immunoediting and immunoevasion of PDAC
tumors.
Lack of antigen downregulation in tumor organoids

170
While autochthonous tumors are capable of escaping immune clearance through
the loss of antigen expression, this mechanism does not appear to operate in tumor
organoids. It is possible that the homozygous integration of the SIINFEKL allele into the
H11 locus poses an increased barrier to rapid downregulation of antigen expression, as
this “safe harbor” locus is known to drive relatively stable gene expression across murine
tissue types27. Additionally, homozygous integration of the allele may further safeguard
against loss of heterozygosity of antigen presentation, which has been observed at the
HLA locus (e.g. in human NSCLC)28.
Possible immune equilibrium state in intermediate tumor organoids
As the burden of intermediate tumors was indistinguishable from normal, “non-
progressed” pancreatic tumor tissues, it is possible that these tumors were captured in a
state of immune equilibrium. While many aspects of immune equilibrium biology remain
unexplored29, experimental evidence indicates that equilibrium is associated with a
quiescent cellular state, decreased reduced proliferation (Ki67), and increased apoptotic
markers (TUNEL+ staining)30. Importantly, these dormant lesions are infiltrated by T cells,
B220+ cells and macrophages30, suggesting that local immune activity controls these
lesions. This is further functionally supported by studies demonstrating that removal of
immune pressure (CD8 and CD4 depletion, or IFN-g neutralization) leads to rapid tumor
outgrowth30. It would be interesting to explore if intermediate tumors are similarly
restrained by (antigen-specific) T cell responses. Additionally, the presence of a FACS-
sortable cellular marker (mScarlet) may allow for extensive transcriptional profiling of this

171
tumor phenotype, and establish whether these lesions are undergoing regression or
active immune escape.
Pancreatic tumors may escape immune elimination through T cell dysfunction
Our results argue that progressor tumors did not escape immune elimination
through the loss of antigenicity, deregulation of antigen presentation or the IFN-g pathway,
which are established clinical resistance mechanisms to immune checkpoint inhibitor
therapy31. Furthermore, tumor-derived progressor organoids did not develop intrinsic
apoptotic resistance to T cell-mediated cytotoxicity32,33, and in fact, were rapidly killed by
antigen-specific CD8+ T cells in coculture assays.
Instead, antigen-specific activated CD8+ T cells upregulated multiple co-inhibitory
receptors and progressively lost proliferative capacity in progressor tumors. Moreover,
tumor-specific CD8+ T cells acquired transcriptional programs that shared extensive
overlap with published gene expression signatures derived from exhausted T cells in
chronic LMCV34 and dysfunctional intratumoral T cells in B16 melanoma35. Collectively,
the data suggest that antigen-specific T cells become progressively dysfunctional over
the course of pancreatic tumor progression.
A number of follow-up experiments would further strengthen the conclusion that
tumor-specific CD8+ T cells become dysfunctional in organoid tumors. Dysfunctional T
cells have impaired effector function (IFN-g, TNF-a, IL-2 production) and degranulation
capacity (CD107a surface marker positivity)36; and indeed, experimental assessment of
T cell functionality in progressor tumors is in progress. A lack of proliferative capacity and
in vivo persistence characteristic for dysfunctional CD8+ T cells can be validated by

172
adoptive transfer of antigen-specific TILs into congenically marked naïve hosts and
challenging these naïve hosts with SIINFEKL-expressing tumors. This approach has
recently been used to demonstrate that progenitor dysfunctional intratumoral CD8+ T
cells are more persistent than terminal dysfunctional intratumoral CD8+ T cells37.
Additionally, it would be interesting to compare in vivo persistence and tumor control of
dysfunctional CD8+ T cells isolated at different stages of PDAC progression to establish
whether TILs become progressively dysfunctional.
Collectively, the maintenance of tumor antigen and the acquisition of T cell
dysfunctionality suggests that tumor organoid persistence drives SIINFEKL-specific T cell
progressive dysfunctionality, and ultimately, a failure to control tumor growth.
An open question is whether tumor antigen persistence directly drives T cell
dysfunction, or whether additional (immune) cells in the tumor microenvironment may
impair anti-tumor T cell responses. The former model would be in line with a previous
report from Schietinger et al., utilizing a tamoxifen-inducible, autochthonous liver cancer
model that expresses SV40 large T antigen (Tag) as a self-antigen19. Pre-malignant
lesions in these autochthonous liver tumors rapidly induced a fixed, hyporesponsive state
in Tag-specific CD8+ T cells that was maintained by persistent antigen exposure. It would
be interesting to compare the transcriptional profiles of early CD8+ effector T cells in our
organoid tumor model with the core dysfunctional program that was elucidated in the
SV40-expressing liver model to test whether any core gene signatures are shared,
regardless of tumor tissue localization and antigen specificity.

173
Although no obvious differences in the innate immune composition were found,
our current data do not conclusively rule out the involvement of innate immune, stromal
or T regulatory cells in driving T cell dysfunctionality during organoid tumor immune
escape. In particular, TIGIT+ regulatory T cells have been shown to be more activated,
and suppressive cells than TIGIT- regulatory T cells in murine B16.F10 and MC38
models38. Furthermore, genetic loss of TIGIT on Tregs, but not on CD8+ T cells, delayed
B16.F10 tumor growth38, suggesting that Tregs actively regulated anti-tumor immunity in
the melanoma model. It will be worthwhile to further immunophenotype immune cell
populations in progressor tumor lesions (potentially with a focus on TIGIT) to understand
their relative contribution to CD8+ T cell dysfunctionality, and tumor immune escape.
Elegant genetic knockout approaches as described by Kurtulus et al., may also further be
applied in the organoid model to dissect the contribution of different immune cells to the
efficacy observed with anti-TIGIT therapy. Collectively, these approaches may elucidate
into how T cell function is governed by the composition of the tumor microenvironment.
3.4. Transcriptional profiling of the antigen-specific T cell compartment revealed
heterogenous effector states
Unexpectedly, we observed considerable transcriptional heterogeneity in the anti-
tumor T cell response, despite the uniform expression of a high-affinity MHC class I
neoantigen (10 nM for H-2Kb)39 and the progressive outgrowth of tumors. Protein
expression of Pdcd-1 (PD-1), Hacvr-3 (TIM-3), and Lag-3 genes (cluster 0 markers), and
Klra6 (Ly49F) and Klra7 (Ly49G) (cluster 3 markers) was experimentally validated by flow

174
cytometry, indicating that phenotypically distinct CD8+ T cell populations are present in
the tumor microenvironment.
Computational analyses (PAGODA, and gene signature mapping) revealed more
intracluster heterogeneity in the exhausted T cell population, as both exhaustion and
chronic effector signatures mapped to the same cluster in our dataset. These data raise
the idea that this population may reflect a “spectrum” of T cell functionality in the tumor
microenvironment. It is possible that chronic effector T cells may still exert (some) degree
of tumor control, while more exhausted T cells have acquired a more terminal,
dysfunctional cellular fate. It would be interesting to leverage adoptive transfer and tumor
challenge experiments described above to further dissect the functionality and in vivo
persistence of these potentially distinct cell populations.
Additionally, our scRNA-sequencing dataset also revealed the presence of a
uniquely marked cluster (3) by the Ly49 cell-surface receptors. Ly49 proteins (and their
human homologs, killer inhibitory receptors) have established roles in NK licensing40.
Recently, a population of regulatory CD8+ T cells has been described in a murine
experimental model of multiple sclerosis41. Interestingly, these Ly49+CD8+ T cells were
antigen-specific, and suppressed CD4+ T cells in vitro through perforin-mediated killing41.
However, antigen-specific Ly49+CD8+ T cells have not been reported in tumor models.
It would therefore be very interesting to further establish the functional relevance of this
population of Ly49+CD8+ T cells through adoptive transfer of co-mixed antigen-specific
T cells (effector CD8+ T cells + Ly49+CD8+ T cells) and through in vitro T cell co-culture
assays.

175
3.5. Outlook – The future of immunotherapy in pancreatic ductal
adenocarcinoma through the lens of genetically engineered mouse models
Although pancreatic cancer has long been regarded as “immunologically silent”,
recent advances in our understanding of this complex disease have overturned that
dogma. Computational analyses of PDAC antigenicity have revealed that pancreatic
tumors indeed carry antigens that may be recognized by the human immune system25,26.
This is also supported by histological and flow cytometric studies demonstrating the
presence of activated, dysfunctional tumor-infiltrating lymphocytes in human PDAC42,
including the characterization presented in this thesis. Furthermore, at least a subset of
PDAC (MMR-deficient) patients can already derive clinical benefit from currently
approved immunotherapies43, demonstrating that this disease is not inherently resistant
to immune-targeted therapies. Lastly, exceptional long-term survivors of PDAC appear to
carry a unique set of high quality neoantigens capable of stimulating robust, clonal T cell
responses26, suggesting at least a subset of patients harbor highly tumor-reactive T cells.
Unfortunately, despite the widespread clinical efficacy of immune checkpoint
inhibitors in many solid and hematopoietic cancers, MMR-proficient pancreatic ductal
adenocarcinoma has largely remained refractory to immune checkpoint monotherapy and
combination immune therapy. This is certainly not due to a lack of clinical effort in the
field; as described in the introduction of this thesis, numerous combinations of
immunomodulatory therapeutics have been investigated for the treatment of metastatic
PDAC.
A theme that emerges from this thesis is that further clinical development can be
driven by novel biological insights made in murine mouse models of cancer. To this end,

176
we have developed and characterized novel immunogenic genetically engineered mouse
models of PDAC. Although many facets of the anti-tumor T cell response in these models
remain to be explored, our preclinical studies reinforce that the biology of the pancreatic
tumor microenvironment can guide rational design of novel immunotherapeutic
strategies. A deeper understanding of the immunoevasive mechanisms employed by
tumors will enable application of clinical strategies with increased sophistication. I am
hopeful that armed with these biological insights, we can improve the lives of pancreatic
cancer with curative immunotherapies.

177
3.6. References
1. Dunn, G. P., Old, L. J. & Schreiber, R. D. The Three Es of Cancer Immunoediting. Annu. Rev. Immunol. 22, 329–360 (2004).
2. Schreiber, R. D., Old, L. J. & Smyth, M. J. Cancer immunoediting: Integrating immunity’s roles in cancer suppression and promotion. Science (80-. ). 331, 1565–1570 (2011).
3. DuPage, M., Mazumdar, C., Schmidt, L. M., Cheung, A. F. & Jacks, T. Expression of tumour-specific antigens underlies cancer immunoediting. Nature 482, 405–409 (2012).
4. DuPage, M. et al. Endogenous T cell responses to antigens expressed in lung adenocarcinomas delay malignant tumor progression. Cancer Cell 19, 72–85 (2011).
5. Jin, C. et al. Commensal Microbiota Promote Lung Cancer Development via γδ T Cells. Cell 176, 998-1013.e16 (2019).
6. Joshi, N. S. et al. Regulatory T Cells in Tumor-Associated Tertiary Lymphoid Structures Suppress Anti-tumor T Cell Responses. Immunity 1–12 (2015) doi:10.1016/j.immuni.2015.08.006.
7. Li, A. et al. IL-33 Signaling Alters Regulatory T Cell Diversity in Support of Tumor Development. Cell Rep. 29, 2998-3008.e8 (2019).
8. Schmidt, L. et al. Enhanced adaptive immune responses in lung adenocarcinoma through natural killer cell stimulation. doi:10.1073/pnas.1904253116.
9. Chiou, S. H. et al. Pancreatic cancer modeling using retrograde viral vector delivery and in vivo CRISPR/Cas9-mediated somatic genome editing. Genes Dev. 29, 1576–1585 (2015).
10. Shankaran, V. et al. IFNγ, and lymphocytes prevent primary tumour development and shape tumour immunogenicity. Nature 410, 1107–1111 (2001).
11. Matsushita, H. et al. Cancer exome analysis reveals a T-cell-dependent mechanism of cancer immunoediting. Nature 482, 400–404 (2012).
12. Hegde, S. et al. Dendritic Cell Paucity Leads to Dysfunctional Immune Surveillance in Pancreatic Cancer. Cancer Cell 37, 289-307.e9 (2020).
13. Mcfarland, B. J., Sant, A. J., Lybrand, T. P. & Beeson, C. Ovalbumin(323-339) Peptide Binds to the Major Histocompatibility Complex Class II I-A d Protein Using Two Functionally Distinct Registers †. (1999) doi:10.1021/bi991393l.
14. Cheung, A. F., DuPage, M. J. P., Dong, H. K., Chen, J. & Jacks, T. Regulated expression of a tumor-associated antigen reveals multiple levels of T-cell tolerance in a mouse model of lung cancer. Cancer Res. 68, 9459–9468 (2008).
15. Hogquist, K. A. et al. T cell receptor antagonist peptides induce positive selection. Cell 76, 17–27 (1994).
16. Fuertes, M. B. et al. Host type I IFN signals are required for antitumor CD8+ T cell responses through CD8α+ dendritic cells. J. Exp. Med. 208, 2005–2016 (2011).
17. Diamond, M. S. et al. Type I interferon is selectively required by dendritic cells for immune rejection of tumors. J. Exp. Med. 208, 1989–2003 (2011).
18. Lewinski, M. K. et al. Retroviral DNA integration: Viral and cellular determinants of
178
target-site selection. PLoS Pathog. 2, 0611–0622 (2006). 19. Schietinger, A. et al. Tumor-Specific T Cell Dysfunction Is a Dynamic Antigen-
Driven Differentiation Program Initiated Early during Tumorigenesis. Immunity 45, 389–401 (2016).
20. Juno, J. A. et al. Cytotoxic CD4 T cells-friend or foe during viral infection? Frontiers in Immunology vol. 8 (2017).
21. Böttcher, J. P. et al. NK Cells Stimulate Recruitment of cDC1 into the Tumor Microenvironment Promoting Cancer Immune Control. Cell 172, 1022-1037.e14 (2018).
22. Hingorani, S. R. et al. Trp53R172H and KrasG12D cooperate to promote chromosomal instability and widely metastatic pancreatic ductal adenocarcinoma in mice. Cancer Cell 7, 469–483 (2005).
23. Lee, J. W., Komar, C. A., Bengsch, F., Graham, K. & Beatty, G. L. Genetically engineered mouse models of pancreatic cancer: The KPC model (LSL-KrasG12D/+;LSL-Trp53R172H/+;Pdx-1-Cre), its variants, and their application in immuno-oncology drug discovery. Curr. Protoc. Pharmacol. 2016, 14.39.1-14.39.20 (2016).
24. Byrne, K. T. & Vonderheide, R. H. CD40 Stimulation Obviates Innate Sensors and Drives T Cell Immunity in Cancer. Cell Rep. 15, 2719–2732 (2016).
25. Bailey, P. et al. Exploiting the neoantigen landscape for immunotherapy of pancreatic ductal adenocarcinoma. Sci. Rep. 6, 1–8 (2016).
26. Balachandran, V. P. et al. Identification of unique neoantigen qualities in long-term survivors of pancreatic cancer. Nature 551, S12–S16 (2017).
27. Tasic, B. et al. Site-specific integrase-mediated transgenesis in mice via pronuclear injection. Proc. Natl. Acad. Sci. U. S. A. 108, 7902–7907 (2011).
28. McGranahan, N. et al. Allele-Specific HLA Loss and Immune Escape in Lung Cancer Evolution. Cell 171, 1259-1271.e11 (2017).
29. Teng, M. W. L., Swann, J. B., Koebel, C. M., Schreiber, R. D. & Smyth, M. J. Immune-mediated dormancy: an equilibrium with cancer. J. Leukoc. Biol. 84, 988–993 (2008).
30. Koebel, C. M. et al. Adaptive immunity maintains occult cancer in an equilibrium state. Nature 450, 903–907 (2007).
31. Kalbasi, A. & Ribas, A. Tumour-intrinsic resistance to immune checkpoint blockade. Nat. Rev. Immunol. 20, 25–39 (2020).
32. Kataoka, T. et al. FLIP prevents apoptosis induced by death receptors but not by perforin/granzyme B, chemotherapeutic drugs, and gamma irradiation. J. Immunol. 161, 3936–42 (1998).
33. Hinz, S. et al. Bcl-X(L) protects pancreatic adenocarcinoma cells against CD95- and TRAIL-receptor-mediated apoptosis. Oncogene 19, 5477–5486 (2000).
34. Doering, T. A. et al. Network Analysis Reveals Centrally Connected Genes and Pathways Involved in CD8+ T Cell Exhaustion versus Memory. Immunity 37, 1130–1144 (2012).
35. Singer, M. et al. A Distinct Gene Module for Dysfunction Uncoupled from Activation in Tumor-Infiltrating T Cells. Cell 166, 1500-1511.e9 (2016).
36. Wherry, E. J. T cell exhaustion. Nature Immunology vol. 12 492–499 (2011). 37. Miller, B. C. et al. Subsets of exhausted CD8+ T cells differentially mediate tumor

179
control and respond to checkpoint blockade. Nat. Immunol. 20, 326–336 (2019). 38. Kurtulus, S. et al. TIGIT predominantly regulates the immune response via
regulatory T cells. J. Clin. Invest. 125, 4053–4062 (2015). 39. Karandikar, S. H. et al. Identification of epitopes in ovalbumin that provide insights
for cancer neoepitopes. JCI Insight 4, (2019). 40. Rahim, M. M. A. et al. Ly49 receptors: Innate and adaptive immune paradigms.
Frontiers in Immunology vol. 5 145 (2014). 41. Saligrama, N. et al. Opposing T cell responses in experimental autoimmune
encephalomyelitis. Nature 572, 481–487 (2019). 42. Stromnes, I. M., Hulbert, A., Pierce, R. H., Greenberg, P. D. & Hingorani, S. R. T-
cell Localization, Activation, and Clonal Expansion in Human Pancreatic Ductal Adenocarcinoma. Cancer Immunol. Res. 5, 978–991 (2017).
43. Le, D. T. et al. Evaluation of ipilimumab in combination with allogeneic pancreatic tumor cells transfected with a GM-CSF gene in previously treated pancreatic cancer. J. Immunother. 36, 382–389 (2013).

180
Appendix I
Progressor tumors are sensitive to adoptive cell therapy
Laurens J Lambert1,2‡, William A Freed-Pastor1,3‡, Tyler Jacks1,2,4*
1 David H. Koch Institute for Integrative Cancer Research, Massachusetts Institute of
Technology, Cambridge, MA 02139, USA
2 Department of Biology, Massachusetts Institute of Technology, Cambridge, MA 02139,
USA
3 Department of Medical Oncology, Dana-Farber Cancer Institute, Boston, MA, USA
2 Department of Biology, Massachusetts Institute of Technology, Cambridge, MA 02139,
USA
4 Howard Hughes Medical Institute, Massachusetts Institute of Technology, Cambridge,
MA 02139, USA
*Corresponding author
‡These authors contributed equally to this work
Author contributions
L.J.L., W.F.P., and T.J. conceived of, designed and directed the study; L.J.L., W.F.P.
performed all types of experiments reported in the study; L.J.L. wrote this appendix.

181
Abstract
Over the past decade, cancer immunotherapies have achieved durable responses
in many types of solid and hematological tumors. However, mismatch-proficient
pancreatic ductal adenocarcinoma (PDAC) has remained largely refractory to immune-
based therapeutic approaches1–3. In a previous study, we described the development of
a neoantigen-expressing organoid-based preclinical model to investigate the molecular
and cellular mechanisms that drive immune evasion in PDAC (Freed-Pastor, Lambert et
al., unpublished). Here we demonstrate that this preclinical organoid system remains
sensitive to adoptive T cell therapy. These findings position this model system as a
preclinical platform to further investigate T cell-centric approaches for the treatment of
PDAC.
Main text
To further characterize the sensitivity of a previously described neoantigen-
expressing organoid-based pancreatic adenocarcinoma (PDAC) system (Freed-Pastor,
Lambert et al., unpublished) to adoptive cell therapy, the following approach was taken.
KrasLSL-G12D/+;Trp53fl/fl;H11mScarletSIIN (KP; H11-SIN) pancreatic organoids were first
orthotopically transplanted into immune-competent mice and tumor growth was
monitored by small rodent ultrasound. Tumors that demonstrated increase in volume
over two successive ultrasound scans at week 4 and 5 post-transplantation were then
subjected to adoptive cell therapy treatment. Tumor-bearing mice were randomized to
either control treatment (PBS; n=5), or treatment with pre-activated with transgenic TCR-
recognizing SIINFEKL (“OT-I”) T cells4 at varying doses (0.4*106 T cells (n=4); 2*106 T
182
cells (n=4); or 10*106 T cells (n=7)). As expected, progressor tumors in the control
treatment arm continued to grow unabated (Appendix Figure 1a). In the treatment arm,
progressor tumors treated with low dose or intermediate doses of OT-I largely continued
to grow, albeit at a slower rate compared to control progressor tumors. Strikingly, high
dose OT-I treatment led to robust tumor regression in the majority of animals (6/7; ~86%).
Consistent with these observations, tumor antigen expression was maintained in control
and low- and intermediate-dose progressor tumors, while only a minority of progressor
tumors had demonstrable tumor antigen expression in the high-dose OT-I treatment arm
(3/7; ~43%; Appendix Figure 1b,c). Together, these results suggest that a sufficiently
robust anti-tumor T cell response can effectively control tumor growth.

183
Discussion
Adoptive cell therapy (ACT) has shown tremendous clinical promise in
hematological malignancies5–7. While a number of clinical studies have investigated ACT
in pancreatic cancer8–12, clinical responses have been limited. Our observations that
adoptively transferred T cells elicit robust pancreatic tumor regressions in a dose-
dependent manner are therefore notable, particularly since the endogenous T cell
response is incapable of controlling tumor growth. These results suggest that immune
evasion in pancreatic tumors may be overcome with sufficiently robust T cell priming and
expansion. Furthermore, the model system described here presents a unique opportunity
a
c
Control (PBS)
Fluor
BF Fluor
BF FluorOT-I (0.4e6)
OT-I (2e6)BF Fluor
OT-I (10e6)BF Fluor
b
-100
-50
0
50
100
50010001500
Day 14 post-adoptive cell therapy
% C
hang
e ov
er b
asel
ine
Tumor volumeControl (PBS)
OT-I (0.4e6)
OT-I (2e6)
OT-I (10e6)
0
50
100
Day 14 post-adoptive cell therapy
% m
Scar
let+
tum
ors
Tumor antigen expressionN=5 N=4N=4
N=7
Control (PBS)
OT-I (0.4e6)
OT-I (2e6)
OT-I (10e6)
Appendix Figure 1: Adoptive cell transfer (ACT) of pre-activated OT-I CD8+ T cells leads to rapid tumor regression in previously progressing tumors. a, Waterfall plots of treatmentresponse assessed by rodent ultrasound after transfer of preactivated OT-I CD8+ T cells(T cell dose in brackets). b, Representative images of brightfield (left) and fluorescent (right) imagesof KrasG12D/+; Trp53-/-; Hipp11mScarletSIIN (‘KP;H11-SIIN’) pancreatic tumor organoids at 2 weeks post-ACT.c, Tumor antigen expression as assessed by mScarlet fluorescence upon necropsy.
184
to dissect the molecular and cellular mechanisms that limit the efficacy of ACT in PDAC.
Leveraging these insights will be crucial for the development of novel, potent T-cell centric
therapeutic strategies.
Methods
Mice
All animal studies described in this study were approved by the MIT Institutional Animal
Care and Use Committee. All animals were maintained on a pure C57BL/6J genetic
background. OT-I TCR transgenic mice have been previously described4.
Progressor organoid generation and characterization
The generation of the parental KrasLSL-G12D/+;Trp53fl/fl;H11mScarletSIIN (KP; H11-SIIN)
pancreatic organoid line has been previously described (Freed-Pastor, Lambert et al.,
unpublished). Briefly, progressor pancreatic organoids were isolated by manually
dissecting pancreata from mice with established KP;H11-SIIN tumors. Pancreata were
manually minced with razor blades and dissociated in pancreas digestion buffer [1x PBS,
125 U/mL collagenase IV (Worthington)] for 30 min at 37oC. Cell suspensions were
filtered through 70 µm filters, washed with 1x PBS and centrifuged with slow deceleration.
Cell pellets were resuspended in 100% growth-factor reduced Matrigel (Corning) and
solidified at 37oC. Cells were subsequently cultured in organoid complete media (minor
modifications from previously described formulations13 see details below) and monitored
for organoid outgrowth. Organoids were passaged with TrypLE Express (Life
Technologies) for at least 4 passages to remove contaminating cell types. P53 deficient

185
organoids were selected via resistance to Nutlin-3a (10 µM, Sigma-Aldrich). Pancreatic
organoids were maintained in culture for <20 passages before orthotopic transplantation
into C57BL6/J mice.
Pancreatic Organoid Complete Media
The media for pancreatic organoids was formulated based on L-WRN cell conditioned
media (L-WRN CM)14. Briefly, L-WRN CM was generated by collecting 8 days of
supernatant from the L-WRN cells, grown in Advanced DMEM/F12 (Gibco) supplemented
with 20% fetal bovine serum (Hyclone), 2 mM GlutaMAX, 100 units/mL of penicillin, 100
µg/mL of streptomycin, and 0.25 µg/mL amphotericin. L-WRN CM was diluted 1:1 in
Advanced DMEM/F12 (Gibco) and supplemented with additional RSPO-1 conditioned
media (10% v/v), generated using Cultrex HA-R-Spondin1-Fc 293T Cells. The following
molecules were also added to the growth media: B27 (Gibco), 1 μM N-acetylcysteine
(Sigma-Aldrich), 10 μM nicotinamide (Sigma-Aldrich), 50 ng/mL EGF (Novus Biologicals),
500 nM A83-01 (Cayman Chemical), 10 μM SB202190 (Cayman Chemical), and 500 nM
PGE2 (Cayman Chemical). Wnt activity of the conditioned media was assessed and
normalized between batches via luciferase reporter activity of TCF/LEF activation (Enzo
Leading Light Wnt reporter cell line).
Orthotopic transplantation
Orthotopic transplantation of organoids was performed with minor modifications to
previously reported protocols for orthotopic transplantation of pancreatic monolayer cell
lines15. Briefly, animals were anesthetized using Isofluorane, the left subcostal region

186
was depilated (using clippers or Nair) and the surgical area was disinfected with
alternating Betadine/Isopropyl alcohol. A small (~2 cm) skin incision was made in the left
subcostal area and the spleen was visualized through the peritoneum. A small incision
(~2 cm) was made through the peritoneum overlying the spleen and the spleen and
pancreas were exteriorized using ring forceps. A 30G needle was inserted into the
pancreatic parenchyma parallel to the main pancreatic artery and 100 µL (containing
1.25*105 organoid cells in 50% PBS + 50% Matrigel) was injected into the pancreatic
parenchyma. Successful injection was visualized by formation of a fluid-filled region
within the pancreatic parenchyma without leakage. The pancreas/spleen were gently
internalized, and the peritoneal and skin layers were sutured independently using 4-0
Vicryl sutures. All mice received pre-operative analgesia with Buprenorpine-SR and were
followed post-operatively for any signs of discomfort or distress. Organoid/Matrigel mixes
were kept on ice throughout the entirety of the procedure to prevent solidification prior to
injection.
For orthotopic transplantation, syngeneic mice (aged 4-10 weeks) were transplanted.
Male pancreatic organoids were only transplanted back into male recipients.
T cell culture and transfer
OT-I splenocytes were harvested from C57BL/6J OT-I;Rag2-/- transgenic mice, and
spleens were mashed through 70 µm filters. Red blood cells were lysed with ACK buffer
for 2 min before cell suspension neutralization with PBS and pelleted for plating.
Splenocytes were counted and adjusted to 1*106 cells/mL in T cell medium [RPMI 1640
(Corning) supplemented with 10% heat-inactivated FBS, 20 mM HEPES (Gibco), 1 mM

187
Sodium Pyruvate (Thermo Fisher), 2 mM L-Glutamine (Gibco), 50 µM β-mercaptoethanol
(Gibco), 1x NEAA (Sigma), 0.5x Pen/Strep (Gibco) with 10 ng/mL hIL-2 (Peprotech) and
1 µM SIINFEKL peptide (Anaspec)]. Splenocytes were activated for 24 hr at 37°C in a
tissue culture incubator, before manual CD8a+ isolation according to the manufacturer
instructions (Milteny Biotec). OT-I T cells were subsequently expanded 4-6 days in T cell
medium with 10 ng/mL hIL-2 prior to organoid co-culture before adoptive T cell transfer
at varying dose of T cells (0.4*106, 2*106 or 10*106 T cells).
Small rodent ultrasound
Quantification of murine pancreatic tumors by high resolution ultrasound has been
previously described16. Briefly, animals were anesthetized using Isoflurane and the lateral
and ventral abdominal areas were depilated using Nair. Sterile 0.9% saline (1 mL) was
administered by intraperitoneal injection prior to imaging to improve visualization of the
pancreas. Animals were imaged using the Vevo3100/LAZRX ultrasound and
photoacoustic imaging system (Fujifilm-Visualsonics). Animals were placed on the
imaging platform in the supine position and a layer of ultrasound gel was applied over the
entirety of the abdominal area. The ultrasound transducer (VisualSonics 550S) was
placed on the abdomen orthogonal to the plane of the imaging platform. Landmark
organs, such as the kidney, spleen, and liver, were identified in order to define the area
of the pancreas. The transducer was set at the scanning midpoint of the normal pancreas
or pancreatic tumor and a 3D image of 10-20 mm, depending on tumor size, at a Z- slice
thickness of 0.04 mm. Three-dimensional (3D) images were uploaded to the Vevo Lab

188
Software. The volumetric analysis function was used to define the tumor border at various
Z-slices through the entirety of the tumor and derive the final calculated tumor volume.
Statistical Analyses
All graphs and statistical analyses were generated with GraphPad Prism 8. The two-
sided Mann-Whitney test was performed in GraphPad Prism
Acknowledgments
We thank the entire Jacks laboratory for helpful discussions. We thank K. Yee, J.
Teixeira, K. Anderson, M. Magendantz for administrative support. This work was
supported by the Howard Hughes Medical Institute, NCI Cancer Center Support Grant
P30-CA1405, the Lustgarten Foundation Pancreatic Cancer Research Laboratory at MIT,
DFHCC SPORE in Gastrointestinal Cancer Career Enhancement Award (W.F.P.), the
Stand Up To Cancer-Lustgarten Foundation Pancreatic Cancer Interception Translational
Cancer Research Grant (Grant Number: SU2C-AACR-DT25-17, W.F.P, T.J.) and the
Stand Up To Cancer Golden Arrow Early Career Scientist Award (GA-6182, W.F.P.).
Stand Up To Cancer is a program of the Entertainment Industry Foundation. Research
grants are administered by the American Association for Cancer Research, the scientific
partner of SU2C. We thank the Koch Institute Swanson Biotechnology Center for
technical support, specifically the Flow Cytometry, Histology, Preclinical Modeling,
Imaging & Testing and Integrative Genomics & Bioinformatics core facilities.

189
References
1. Royal, R. E. et al. Phase 2 trial of single agent Ipilimumab (anti-CTLA-4) for locally
advanced or metastatic pancreatic adenocarcinoma. J. Immunother. (Hagerstown,
Md. 1997) 33, 828–833 (2010).
2. Brahmer, J. R. et al. Safety and activity of anti-PD-L1 antibody in patients with
advanced cancer. N. Engl. J. Med. 366, 2455–2465 (2012).
3. O’Reilly, E. M. et al. Durvalumab with or Without Tremelimumab for Patients with
Metastatic Pancreatic Ductal Adenocarcinoma: A Phase 2 Randomized Clinical
Trial. JAMA Oncol. 5, 1431–1438 (2019).
4. Hogquist, K. A. et al. T cell receptor antagonist peptides induce positive selection.
Cell 76, 17–27 (1994).
5. Maude, S. L. et al. Tisagenlecleucel in children and young adults with B-cell
lymphoblastic leukemia. N. Engl. J. Med. 378, 439–448 (2018).
6. Neelapu, S. S. et al. Axicabtagene ciloleucel CAR T-cell therapy in refractory large
B-Cell lymphoma. N. Engl. J. Med. 377, 2531–2544 (2017).
7. Wang, M. et al. KTE-X19 CAR T-Cell therapy in relapsed or refractory mantle-cell
lymphoma. N. Engl. J. Med. (2020) doi:10.1056/NEJMoa1914347.
8. Thistlethwaite, F. C. et al. The clinical efficacy of first-generation carcinoembryonic
antigen (CEACAM5)-specific CAR T cells is limited by poor persistence and
transient pre-conditioning-dependent respiratory toxicity. Cancer Immunol.
Immunother. 66, 1425–1436 (2017).
9. Smaglo, B. G. et al. A phase I trial targeting advanced or metastatic pancreatic
cancer using a combination of standard chemotherapy and adoptively transferred

190
nonengineered, multiantigen specific T cells in the first-line setting (TACTOPS). J.
Clin. Oncol. 38, 4622–4622 (2020).
10. Beatty, G. L. et al. Activity of Mesothelin-Specific Chimeric Antigen Receptor T Cells
Against Pancreatic Carcinoma Metastases in a Phase 1 Trial. Gastroenterology
155, 29–32 (2018).
11. Beatty, G. L. et al. Mesothelin-specific chimeric antigen receptor mRNA-engineered
T cells induce anti-tumor activity in solid malignancies. Cancer Immunol. Res. 2,
112–120 (2014).
12. Haas, A. R. et al. Phase I Study of Lentiviral-Transduced Chimeric Antigen
Receptor-Modified T Cells Recognizing Mesothelin in Advanced Solid Cancers.
Mol. Ther. 27, 1919–1929 (2019).
13. Boj, S. F. et al. Organoid models of human and mouse ductal pancreatic cancer.
Cell 160, 324–338 (2015).
14. VanDussen, K. L., Sonnek, N. M. & Stappenbeck, T. S. L-WRN conditioned
medium for gastrointestinal epithelial stem cell culture shows replicable batch-to-
batch activity levels across multiple research teams. Stem Cell Res. 37, 101430
(2019).
15. Kim, M. P. et al. Generation of orthotopic and heterotopic human pancreatic cancer
xenografts in immunodeficient mice. Nat. Protoc. 4, 1670–1680 (2009).
16. Sastra, S. A. & Olive, K. P. Quantification of Murine Pancreatic Tumors by High
Resolution Ultrasound. Methods Mol. Biol. 980, (2013).

191
Related Documents


