Development and application of glyco-analytical tools for biotechnology A thesis submitted to the University of Manchester for the degree of Doctor of Philosophy in the Faculty of Science and Engineering. 2017 Michel Riese School of Chemistry

Welcome message from author
This document is posted to help you gain knowledge. Please leave a comment to let me know what you think about it! Share it to your friends and learn new things together.
Transcript
Development and application of
glyco-analytical tools
for biotechnology
A thesis submitted to the
University of Manchester
for the degree of
Doctor of Philosophy
in the
Faculty of Science and Engineering.
2017
Michel Riese
School of Chemistry
2
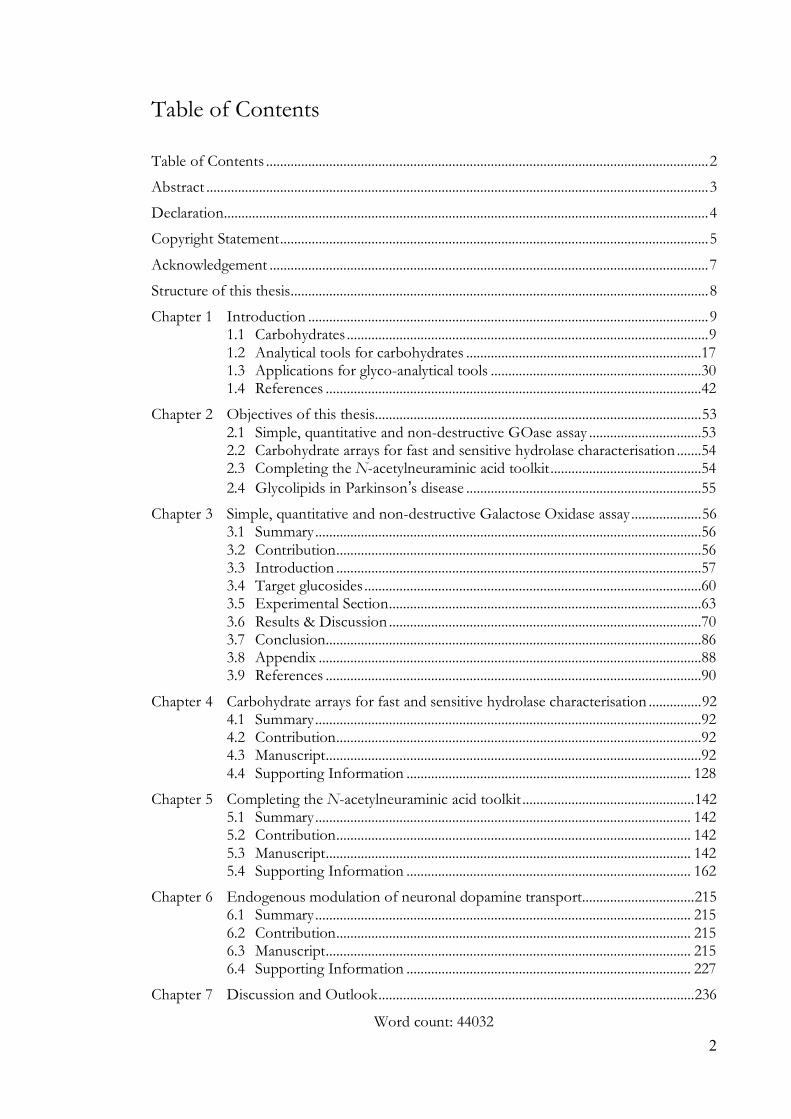
Table of Contents
Table of Contents .............................................................................................................................. 2
Abstract ............................................................................................................................................... 3
Declaration .......................................................................................................................................... 4
Copyright Statement .......................................................................................................................... 5
Acknowledgement ............................................................................................................................. 7
Structure of this thesis ....................................................................................................................... 8
Chapter 1 Introduction .................................................................................................................. 9 1.1 Carbohydrates ....................................................................................................... 9 1.2 Analytical tools for carbohydrates ...................................................................17 1.3 Applications for glyco-analytical tools ............................................................30 1.4 References ...........................................................................................................42
Chapter 2 Objectives of this thesis............................................................................................. 53 2.1 Simple, quantitative and non-destructive GOase assay ................................53 2.2 Carbohydrate arrays for fast and sensitive hydrolase characterisation .......54 2.3 Completing the N-acetylneuraminic acid toolkit ...........................................54 2.4 Glycolipids in Parkinson’s disease ...................................................................55
Chapter 3 Simple, quantitative and non-destructive Galactose Oxidase assay .................... 56 3.1 Summary ..............................................................................................................56 3.2 Contribution ........................................................................................................56 3.3 Introduction ........................................................................................................57 3.4 Target glucosides ................................................................................................60 3.5 Experimental Section .........................................................................................63 3.6 Results & Discussion .........................................................................................70 3.7 Conclusion ...........................................................................................................86 3.8 Appendix .............................................................................................................88 3.9 References ...........................................................................................................90
Chapter 4 Carbohydrate arrays for fast and sensitive hydrolase characterisation ............... 92 4.1 Summary ..............................................................................................................92 4.2 Contribution ........................................................................................................92 4.3 Manuscript ...........................................................................................................92 4.4 Supporting Information ................................................................................. 128
Chapter 5 Completing the N-acetylneuraminic acid toolkit ................................................. 142 5.1 Summary ........................................................................................................... 142 5.2 Contribution ..................................................................................................... 142 5.3 Manuscript ........................................................................................................ 142 5.4 Supporting Information ................................................................................. 162
Chapter 6 Endogenous modulation of neuronal dopamine transport ................................ 215 6.1 Summary ........................................................................................................... 215 6.2 Contribution ..................................................................................................... 215 6.3 Manuscript ........................................................................................................ 215 6.4 Supporting Information ................................................................................. 227
Chapter 7 Discussion and Outlook .......................................................................................... 236
Word count: 44032
3
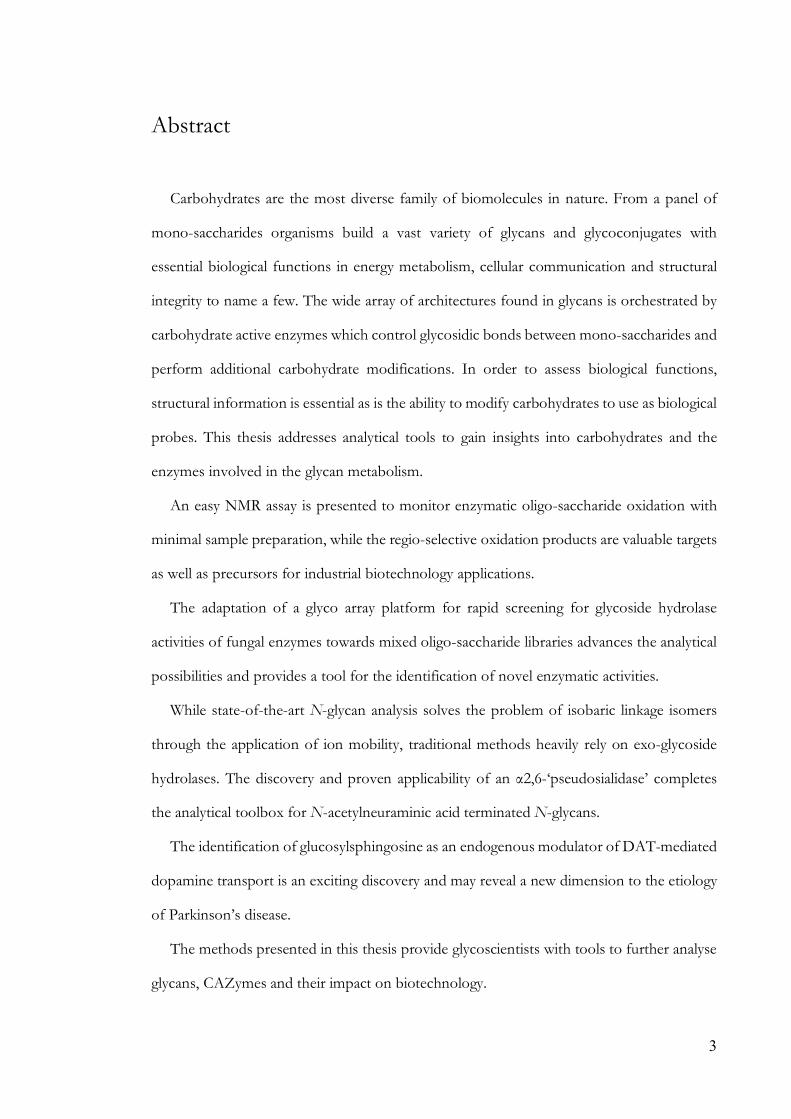
Abstract
Carbohydrates are the most diverse family of biomolecules in nature. From a panel of
mono-saccharides organisms build a vast variety of glycans and glycoconjugates with
essential biological functions in energy metabolism, cellular communication and structural
integrity to name a few. The wide array of architectures found in glycans is orchestrated by
carbohydrate active enzymes which control glycosidic bonds between mono-saccharides and
perform additional carbohydrate modifications. In order to assess biological functions,
structural information is essential as is the ability to modify carbohydrates to use as biological
probes. This thesis addresses analytical tools to gain insights into carbohydrates and the
enzymes involved in the glycan metabolism.
An easy NMR assay is presented to monitor enzymatic oligo-saccharide oxidation with
minimal sample preparation, while the regio-selective oxidation products are valuable targets
as well as precursors for industrial biotechnology applications.
The adaptation of a glyco array platform for rapid screening for glycoside hydrolase
activities of fungal enzymes towards mixed oligo-saccharide libraries advances the analytical
possibilities and provides a tool for the identification of novel enzymatic activities.
While state-of-the-art N-glycan analysis solves the problem of isobaric linkage isomers
through the application of ion mobility, traditional methods heavily rely on exo-glycoside
hydrolases. The discovery and proven applicability of an α2,6-‘pseudosialidase’ completes
the analytical toolbox for N-acetylneuraminic acid terminated N-glycans.
The identification of glucosylsphingosine as an endogenous modulator of DAT-mediated
dopamine transport is an exciting discovery and may reveal a new dimension to the etiology
of Parkinson’s disease.
The methods presented in this thesis provide glycoscientists with tools to further analyse
glycans, CAZymes and their impact on biotechnology.

4
Declaration
No portion of the work referred to in the thesis has been submitted in support of an
application for another degree or qualification of this or any other university or other institute
of learning.
5
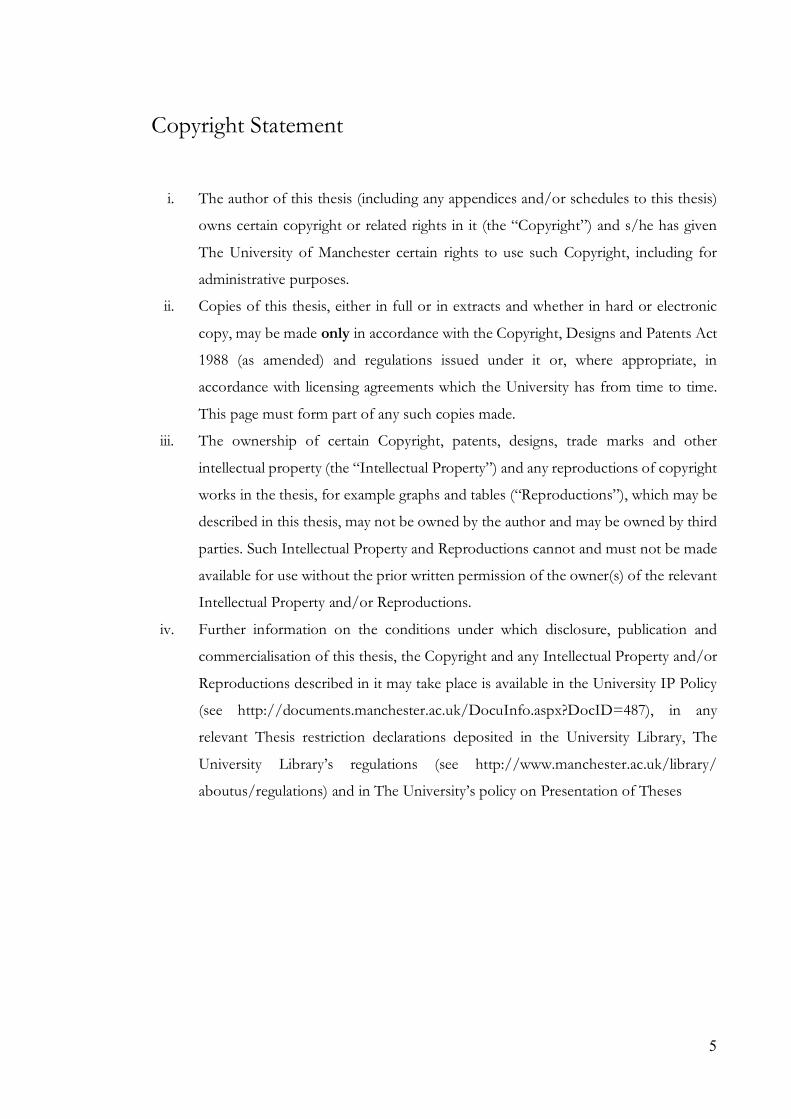
Copyright Statement
i. The author of this thesis (including any appendices and/or schedules to this thesis)
owns certain copyright or related rights in it (the “Copyright”) and s/he has given
The University of Manchester certain rights to use such Copyright, including for
administrative purposes.
ii. Copies of this thesis, either in full or in extracts and whether in hard or electronic
copy, may be made only in accordance with the Copyright, Designs and Patents Act
1988 (as amended) and regulations issued under it or, where appropriate, in
accordance with licensing agreements which the University has from time to time.
This page must form part of any such copies made.
iii. The ownership of certain Copyright, patents, designs, trade marks and other
intellectual property (the “Intellectual Property”) and any reproductions of copyright
works in the thesis, for example graphs and tables (“Reproductions”), which may be
described in this thesis, may not be owned by the author and may be owned by third
parties. Such Intellectual Property and Reproductions cannot and must not be made
available for use without the prior written permission of the owner(s) of the relevant
Intellectual Property and/or Reproductions.
iv. Further information on the conditions under which disclosure, publication and
commercialisation of this thesis, the Copyright and any Intellectual Property and/or
Reproductions described in it may take place is available in the University IP Policy
(see http://documents.manchester.ac.uk/DocuInfo.aspx?DocID=487), in any
relevant Thesis restriction declarations deposited in the University Library, The
University Library’s regulations (see http://www.manchester.ac.uk/library/
aboutus/regulations) and in The University’s policy on Presentation of Theses

6
Für Kai.
7
Acknowledgement
First and foremost, I would like to thank Professor Sabine L. Flitsch for taking me on as
a student and offering constant motivation and supervision throughout the project. Sabine’s
enabling and supportive guidance allowed me to pursue a variety of ideas.
I would also like to thank all members of the Turner-Flitsch lab - past and current - for
their help, scientific input and enjoyable working environment as well as their introduction
into the ‘Mancunian’ life style: Anthony, Niki, Shahed, Rachel, Matthew, Juan, Jack, Sasha,
Sarah, Will, Paula, Mark, Ian, Hannah, Peter, Isobel, Emma, Sarah, Liz, Chris, Chris, Chantel,
Susanne, Fabio, Lorna, James, Scott, Lucy, Bas, Cesar, Jolanda, Declan, Syed, Mirja, Paul,
Steph, Antonio, Jason, Kun and everybody whom I haven’t mentioned. I have made many
friends amongst you for which I am grateful. A special thanks to Matthew, Rachel and Mark
who remotely ensured I’d make it through to submission day.
In times like these, my gratitude extends to the European Commission for funding
‘TINTIN’ (Grant No. 266025) within the Marie Skłodowska-Curie Actions programme.
International networks like these enable scientific and cultural achievements and provide
excellent training opportunities. After all, I almost learned Spanish thanks to: Natalie, Aoife,
Teodora, Yasmina, Jesús, Carmen, Gerard, María, Nicolò, Moussa, Csaba, Lois, Cécile and
Gavin.
I would like to thank my family Undine & Heiko, Kai and Karin & Gerd for unconditional
support as well as fuelling my curiosity for decades.
A particularly big “Thank you!” to Antje who joined me for my ‘British adventure’ and
keeps on inspiring me with an unbelievable amount of support and love. I wouldn’t have
succeeded without you.
Thank you everyone!
8
Structure of this thesis
This thesis in presented in ‘Journal Format’. Chapters 1 and 2 provide an overall
introduction to the field of carbohydrates and carbohydrate active enzymes and describe
analytical challenges. Chapter 3 is presented in a classic format while Chapters 4, 5 and 6 are
presented in manuscript format. Chapter 4 has been published in Scientific Reports 7, Article
number: 43117 (2017) doi:10.1038/srep43117 on the 21st February 2017. Chapter 5 has been
submitted to ‘Glycobiology’ and accepted on the 20th December 2017. Chapter 6 has been
prepared in ‘Nature Letter’ format with an anticipated submission in 2018. Chapter 7
summarises the thesis’ achievements and compares them to current literature.
9
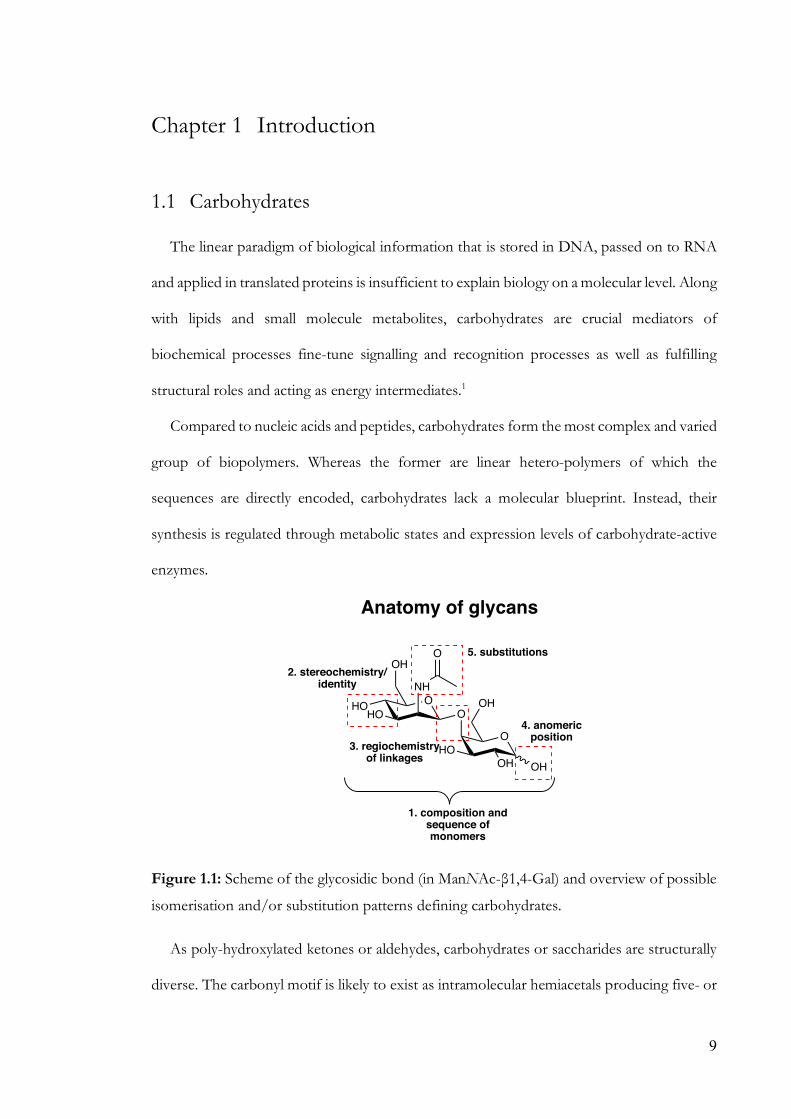
Chapter 1 Introduction
1.1 Carbohydrates
The linear paradigm of biological information that is stored in DNA, passed on to RNA
and applied in translated proteins is insufficient to explain biology on a molecular level. Along
with lipids and small molecule metabolites, carbohydrates are crucial mediators of
biochemical processes fine-tune signalling and recognition processes as well as fulfilling
structural roles and acting as energy intermediates.1
Compared to nucleic acids and peptides, carbohydrates form the most complex and varied
group of biopolymers. Whereas the former are linear hetero-polymers of which the
sequences are directly encoded, carbohydrates lack a molecular blueprint. Instead, their
synthesis is regulated through metabolic states and expression levels of carbohydrate-active
enzymes.
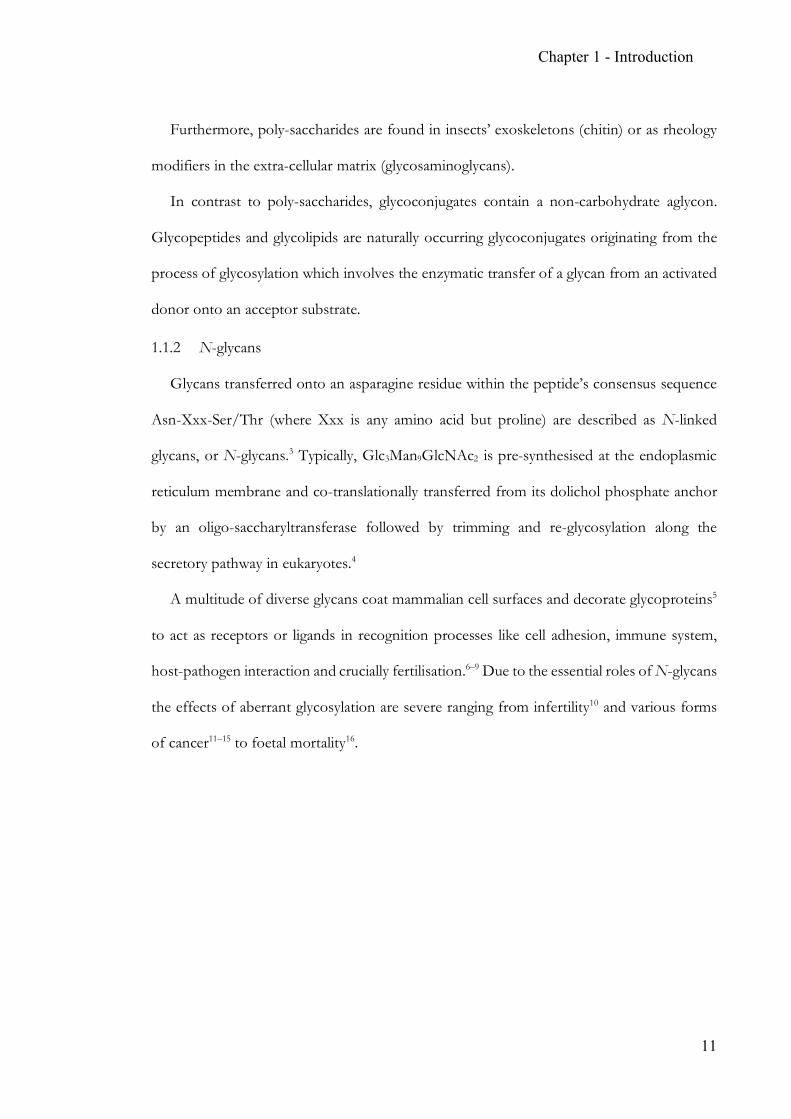
Figure 1.1: Scheme of the glycosidic bond (in ManNAc-β1,4-Gal) and overview of possible
isomerisation and/or substitution patterns defining carbohydrates.
As poly-hydroxylated ketones or aldehydes, carbohydrates or saccharides are structurally
diverse. The carbonyl motif is likely to exist as intramolecular hemiacetals producing five- or
OO
O
HOHO
OH
HOOH
OH
OH
4. anomericposition
3. regiochemistryof linkages
2. stereochemistry/identity
1. composition andsequence ofmonomers
Anatomy of glycans
NH
O 5. substitutions
Chapter 1 - Introduction
10
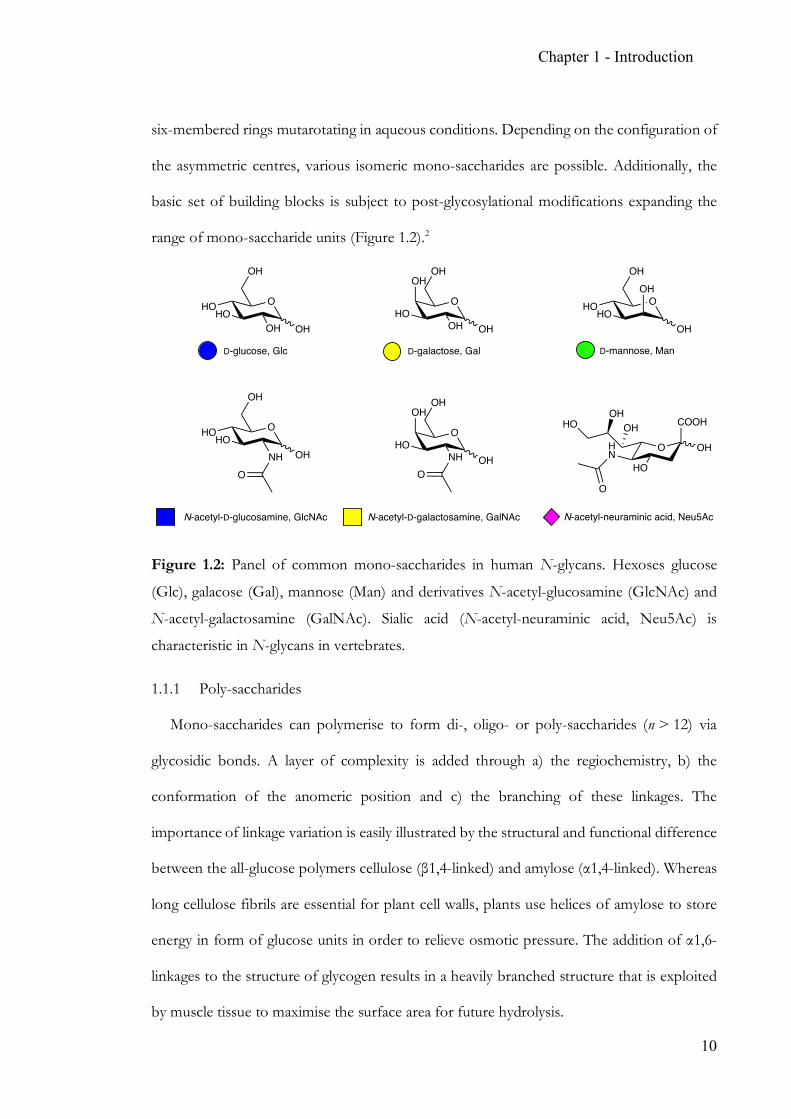
six-membered rings mutarotating in aqueous conditions. Depending on the configuration of
the asymmetric centres, various isomeric mono-saccharides are possible. Additionally, the
basic set of building blocks is subject to post-glycosylational modifications expanding the
range of mono-saccharide units (Figure 1.2).2
Figure 1.2: Panel of common mono-saccharides in human N-glycans. Hexoses glucose
(Glc), galacose (Gal), mannose (Man) and derivatives N-acetyl-glucosamine (GlcNAc) and
N-acetyl-galactosamine (GalNAc). Sialic acid (N-acetyl-neuraminic acid, Neu5Ac) is
characteristic in N-glycans in vertebrates.
1.1.1 Poly-saccharides
Mono-saccharides can polymerise to form di-, oligo- or poly-saccharides (n > 12) via
glycosidic bonds. A layer of complexity is added through a) the regiochemistry, b) the
conformation of the anomeric position and c) the branching of these linkages. The
importance of linkage variation is easily illustrated by the structural and functional difference
between the all-glucose polymers cellulose (β1,4-linked) and amylose (α1,4-linked). Whereas
long cellulose fibrils are essential for plant cell walls, plants use helices of amylose to store
energy in form of glucose units in order to relieve osmotic pressure. The addition of α1,6-
linkages to the structure of glycogen results in a heavily branched structure that is exploited
by muscle tissue to maximise the surface area for future hydrolysis.
O
OH
O
HOHO
HOOH
OH
OH
OH
OHOHO
OH
OH
OHOHO
OH OH
OH OH
NHO
OHOH
OHO
NH
OH
OHO
O
COOH
OH
HO
HN
HOOH
OH
O
D-glucose, Glc D-galactose, Gal D-mannose, Man
N-acetyl-D-glucosamine, GlcNAc N-acetyl-D-galactosamine, GalNAc N-acetyl-neuraminic acid, Neu5Ac
Chapter 1 - Introduction
11
Furthermore, poly-saccharides are found in insects’ exoskeletons (chitin) or as rheology
modifiers in the extra-cellular matrix (glycosaminoglycans).
In contrast to poly-saccharides, glycoconjugates contain a non-carbohydrate aglycon.
Glycopeptides and glycolipids are naturally occurring glycoconjugates originating from the
process of glycosylation which involves the enzymatic transfer of a glycan from an activated
donor onto an acceptor substrate.
1.1.2 N-glycans
Glycans transferred onto an asparagine residue within the peptide’s consensus sequence
Asn-Xxx-Ser/Thr (where Xxx is any amino acid but proline) are described as N-linked
glycans, or N-glycans.3 Typically, Glc3Man9GlcNAc2 is pre-synthesised at the endoplasmic
reticulum membrane and co-translationally transferred from its dolichol phosphate anchor
by an oligo-saccharyltransferase followed by trimming and re-glycosylation along the
secretory pathway in eukaryotes.4
A multitude of diverse glycans coat mammalian cell surfaces and decorate glycoproteins5
to act as receptors or ligands in recognition processes like cell adhesion, immune system,
host-pathogen interaction and crucially fertilisation.6–9 Due to the essential roles of N-glycans
the effects of aberrant glycosylation are severe ranging from infertility10 and various forms
of cancer11–15 to foetal mortality16.
Chapter 1 - Introduction
12
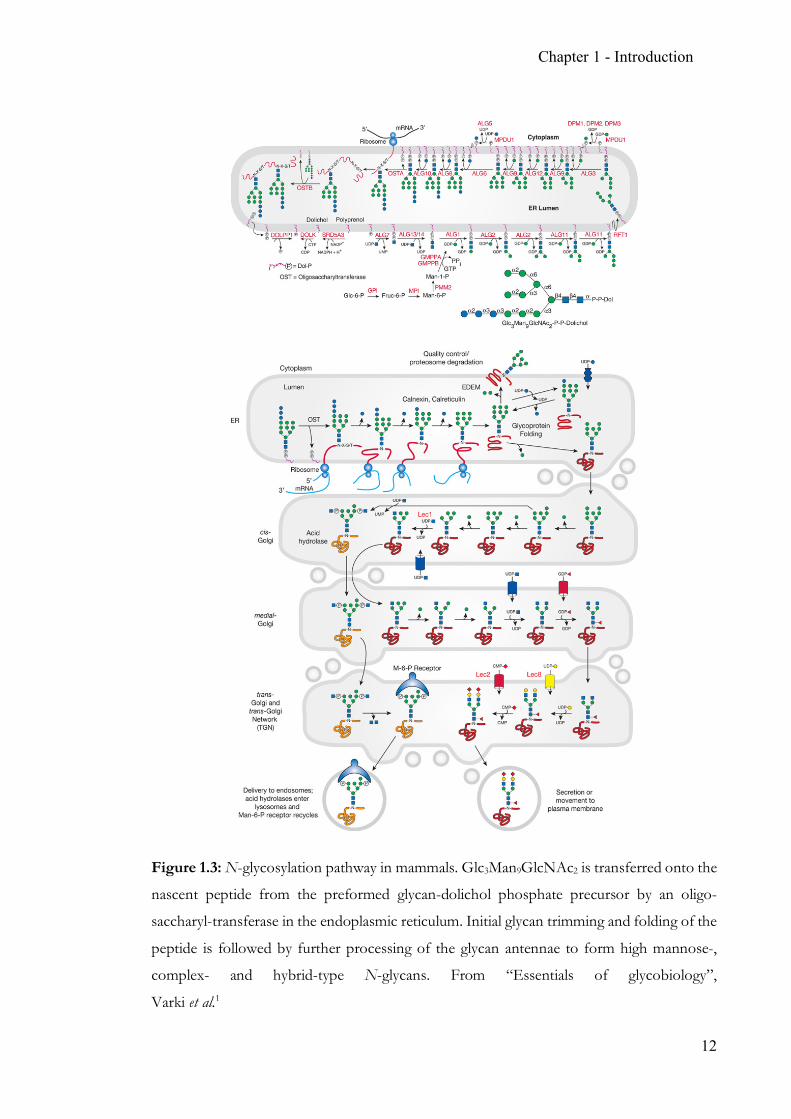
Figure 1.3: N-glycosylation pathway in mammals. Glc3Man9GlcNAc2 is transferred onto the
nascent peptide from the preformed glycan-dolichol phosphate precursor by an oligo-
saccharyl-transferase in the endoplasmic reticulum. Initial glycan trimming and folding of the
peptide is followed by further processing of the glycan antennae to form high mannose-,
complex- and hybrid-type N-glycans. From “Essentials of glycobiology”,
Varki et al.1
Chapter 1 - Introduction
13
1.1.3 Glycolipids
Glycoconjugates with lipid linked to carbohydrates are described as glycolipids. The
subgroup of glycosphingolipids (GSL) is of great importance in vertebrate biology and shares
the characteristic amino alcohol sphingosine aglycon. Closely related to these are
glycocerolipids which are glycosphingolipids linked to a fatty acid via an amide bond.
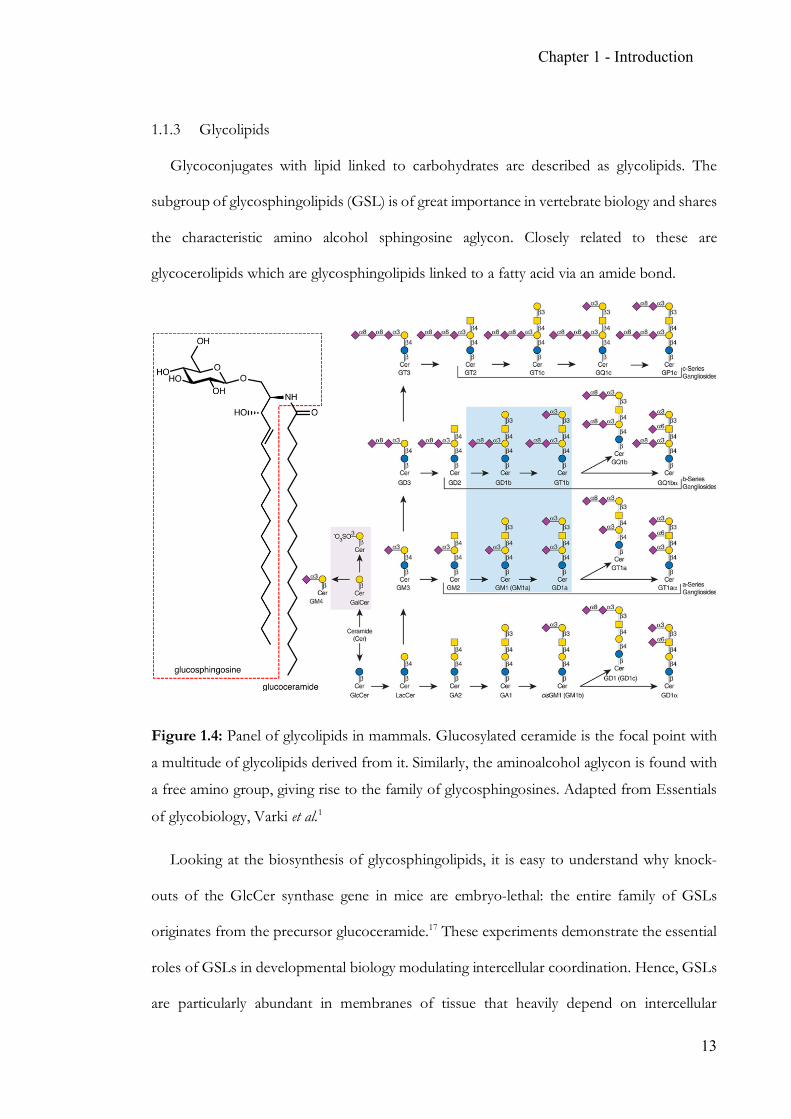
Figure 1.4: Panel of glycolipids in mammals. Glucosylated ceramide is the focal point with
a multitude of glycolipids derived from it. Similarly, the aminoalcohol aglycon is found with
a free amino group, giving rise to the family of glycosphingosines. Adapted from Essentials
of glycobiology, Varki et al.1
Looking at the biosynthesis of glycosphingolipids, it is easy to understand why knock-
outs of the GlcCer synthase gene in mice are embryo-lethal: the entire family of GSLs
originates from the precursor glucoceramide.17 These experiments demonstrate the essential
roles of GSLs in developmental biology modulating intercellular coordination. Hence, GSLs
are particularly abundant in membranes of tissue that heavily depend on intercellular
Chapter 1 - Introduction
14
communication, especially myelin sheets in the brain.18 As part of ‘lipid rafts’ in plasma
membranes, GSLs interact with pathogens19 and endogenous glycoproteins20 as well as
laterally with membrane-associated receptors to modulate signalling.21,22
While the GlcCer synthase knock-out genotype is embryo-lethal, the knock-out of
β-glucocerebrosidase, which catalyses the reverse reaction, is not. Because of the essential
role of glycolipids in the embryonic development of membrane-rich organs, the effects of
an anabolic enzyme deficiency emerge earlier compared to the effects of pathologic variants
of catabolic enzymes resulting in substrate accumulation causing sphingolipidoses, a subclass
of lysosomal storage disorders. The associated phenotype shows severe consequences,
especially mental effects due to the involvement of the central nervous system (see section
1.3.3 for glycolipids in Parkinson’s disease). The family of sphingolipidoses display diverse
phenotypes but are usually caused by a single-gene disorder.
1.1.4 CAZymes
The various groups of carbohydrates are structurally diverse and the resulting complex
structures fulfil crucial tasks in biology. Meticulous control over the biosynthesis of glycans
is essential to ensure correct function. Simple mono-saccharides are part of the energy
metabolism and therefore a significant proportion is consumed by catabolic processes.
Meanwhile, resulting energy equivalents are spent on the enzymatic synthesis of sugar
nucleotides, which serve as building block for highly-regulated anabolic processes.
Carbohydrate active enzymes (CAZymes) are employed by organisms to perform
individual steps in the process of glycan synthesis. The two main classes of CAZymes are
a) glycosyltransferases (GT, with over 380,000 members identified) and b) glycoside
hydrolases (GH, with over 500,000 members)a,23.
a Number of entries in “Carbohydrate Active Enzymes database”, http://www.cazy.org/, December 2017
Chapter 1 - Introduction
15
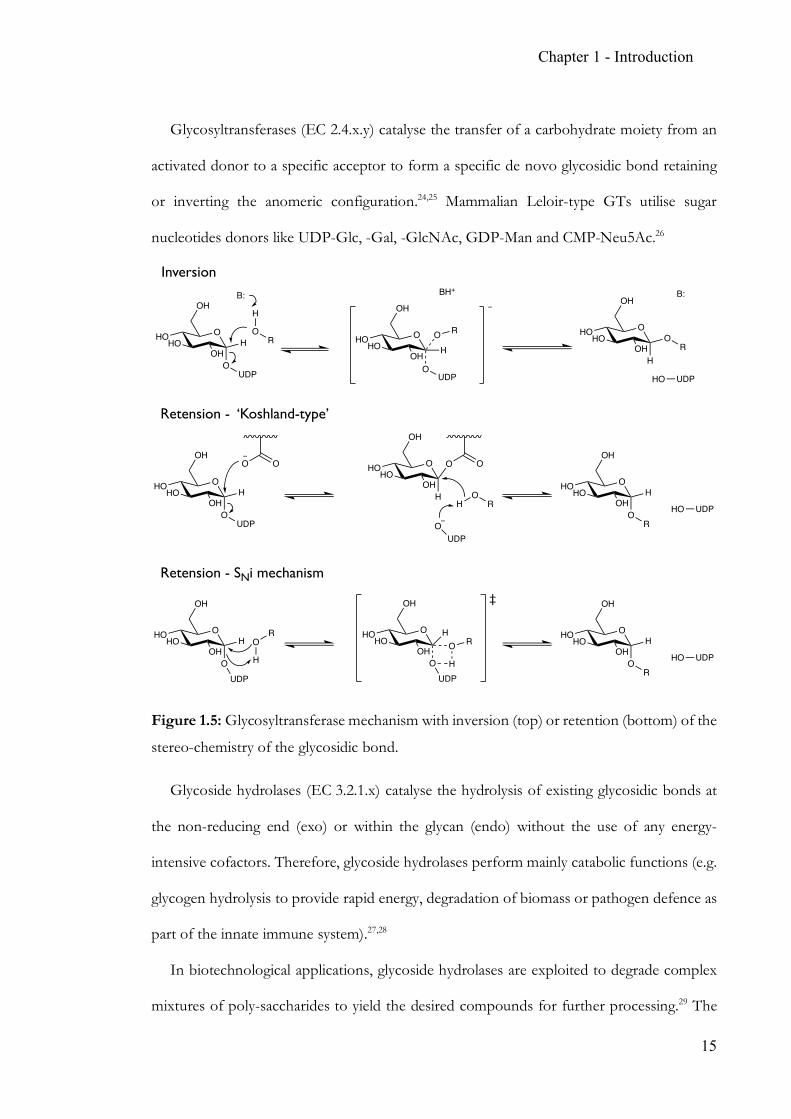
Glycosyltransferases (EC 2.4.x.y) catalyse the transfer of a carbohydrate moiety from an
activated donor to a specific acceptor to form a specific de novo glycosidic bond retaining
or inverting the anomeric configuration.24,25 Mammalian Leloir-type GTs utilise sugar
nucleotides donors like UDP-Glc, -Gal, -GlcNAc, GDP-Man and CMP-Neu5Ac.26
Figure 1.5: Glycosyltransferase mechanism with inversion (top) or retention (bottom) of the
stereo-chemistry of the glycosidic bond.
Glycoside hydrolases (EC 3.2.1.x) catalyse the hydrolysis of existing glycosidic bonds at
the non-reducing end (exo) or within the glycan (endo) without the use of any energy-
intensive cofactors. Therefore, glycoside hydrolases perform mainly catabolic functions (e.g.
glycogen hydrolysis to provide rapid energy, degradation of biomass or pathogen defence as
part of the innate immune system).27,28
In biotechnological applications, glycoside hydrolases are exploited to degrade complex
mixtures of poly-saccharides to yield the desired compounds for further processing.29 The
OHOHO
OH
OH
OUDP
OHOHO
OH
OH
OUDP
RO
H
H
H
OHOHO
OH
OH
OUDP
ROH
B: BH+
OHOHO
OH
OH
H
UDP
OR
B:
OHOHO
OH
OH
OUDP
H
O
OHOHO
OH
OH
HO UDP
H
HO
OR
Inversion
Retension - ‘Koshland-type’
OHOHO
OH
OH
OUDP
H
H
OR OHO
HOOH
OH
OUDP
H
H
O ROHO
HOOH
OH
HO UDP
H
OR
OO O
HO
R
‡
Retension - SNi mechanism
Chapter 1 - Introduction
16
main benefit of using enzymatic degradation over acid hydrolysis is the preservation of the
mono-saccharides generated from the hydrolysis which can be broken down in harsh acidic
conditions.30 For cellulose degradation in particular a more integrated approach to hydrolysis
is required due to the presence of lignin. Fungal genome sequencing revealed numerous
putative CAZymes which require biochemical characterisation to fully address the
biotechnological challenges.
Glycoside hydrolases also mediate biological signalling as well: Co- and post-translational
N-glycan trimming performed in the endoplasmic reticulum is GH-dependent and crucially
influences the residence time of the glycopeptide within the organelle to ensure correct
folding before migrating to the Golgi apparatus for further processing.
Another example of signalling involvement is the glycolipid homeostasis. As described
above, glycosphingolipids in particular form an essential part of the organism’s
communication. Therefore, the sequential and fine-tuned hydrolysis of glycolipids is
performed by a panel of exo-glycoside hydrolases to “switch off” signals conveyed through
the presence of these glycosylated lipids.
Chapter 1 - Introduction
17
1.2 Analytical tools for carbohydrates
Given the complex nature and vast structural variety amongst glycans, analytical tools are
essential in the discovery of structure-function relationships. Routinely, glycans are subjected
to nuclear magnetic resonance spectroscopy (NMR), mass spectrometry (MS), glycan arrays
and liquid chromatography (LC) separation (following glycosidase treatment).
1.2.1 Carbohydrate nuclear magnetic resonance spectroscopy
Nuclear magnetic resonance (NMR) spectroscopy is a powerful analytical tool based on
the magnetic moment of nuclei in magnetic fields. Any nucleus with a spin quantum number
I > 0 possesses a magnetic moment (µ) proportional to the gyromagnetic ratio (γ) with µ = γI
and can therefore be detected by NMR spectroscopy. Therefore, nuclei with spin quantum
numbers I = ½ like 1H, 13C and 15N are especially important for probing carbohydrates and
other biomolecules. With a high natural abundance, 1H (99.98%) is the most sensitive
nucleus whereas 13C (1.11%) and 15N (0.37%) are far less abundant and require extended
acquisition time or isotopic labelling of the sample.
Changes in the individual chemical environment of a nucleus can affect its resonance
frequency through electronic shielding as observable through NMR experiments. Compared
to known standards the characteristic variation in chemical shifts allows for structural
elucidation of mono-, oligo-, and poly-saccharides as well as glycoconjugates.
Primary structural analysis of saccharides by NMR spectroscopy is performed in several
ways.31,32 Characteristic proton signals outside the bulk region (3-4 ppm) can act as
‘structural-reporter groups’.33 In particular, anomeric protons are found in the range of 4.5-
5.5 ppm which simplifies assignment. Integration of these resonances is a good starting point
to assess the number of mono-saccharides present. Information on the anomeric
configuration of 4C1 D-pyranoses can be extracted from the vicinal coupling constant
between H-1 and H-2 (axial-axial ~7 Hz, equatorial-axial ~4 Hz, axial-equatorial and
Chapter 1 - Introduction
18
equatorial-equatorial <2 Hz)34, as well as the H-1 resonance with the α-anomer shifted
downfield compared to the β-anomer. Sialic acids which lack an anomeric proton may be
assessed via alternative signals (e.g. H-4 for Neu5Ac). The addition of non-carbohydrate
substituents (e.g. OMe, OAc, OSO3) can be identified by the characteristic downfield shifts
for protons (~0.2-0.5 ppm).35
Based on this information, databases36,37 provide access to composition, linkages,
sequence and structural motifs. In addition to 1H-NMR, 13C and 15N spectra can provide
useful information. Where the signal dispersion in the 13C channel is preferable compared to
1H, 15N is especially useful for amino- and N-acetylated saccharides. The first 2D-NMR
spectra of glucose were published in the 1980’s laying the foundation for structural studies
on complex carbohydrates to succeed.38
1.2.2 Mass spectrometry of carbohydrates
Mass spectrometry (MS) is a very versatile group of methodologies ultimately determining
the mass-to-charge (m/z) ratio of an analyte. The process can be separated into two sub-
processes: 1) ionisation and 2) mass analysis (separation and detection).
Carbohydrates, especially oligo- and poly-saccharides, are structurally complex as
described earlier. For MS to provide the desired structural information careful consideration
of the experimental setup is essential.
1.2.2.1 Ionisation
Analytes have to be ionised to determine the mass-to-charge ratio. Common glycans
ionise in positive mode with the addition of a small cation (e.g. H+, Li+, Na+, etc.), whereas
inherently charged species (e.g. phosphoglycolipids in negative mode) may ionise readily.39
In order to retain the structural properties of the analyte particular attention has to be
paid to the ionisation conditions. Oligo- or poly-saccharides are likely to fragment in source
causing glycosidic bonds to break. The loss of structural information can be detrimental to
Chapter 1 - Introduction
19
the analytical value. Terminal sialic acids in particular are prone to dissociate from their
aglycon under harsh conditions.40
Amongst common ionisation techniques soft methods with a low chance of in-source
fragmentation can be distinguished from hard methods known to heavily fragment sample
materials. In carbohydrate applications, the two most commonly used techniques are
electrospray ionisation (ESI) and matrix-assisted laser desorption ionisation (MALDI).
ESI is an attractive method for the ionisation of biomolecules41,42 because it is unlikely to
cause fragmentation, can be used at atmospheric pressure and can be set up in a liquid
chromatography workflow providing on-line ESI-MS data. Additionally, sample quantities
required are low due to flow rates between nL/min to µL/min. To ensure optimal ionisation
efficiency, desalting prior to analysis is essential.
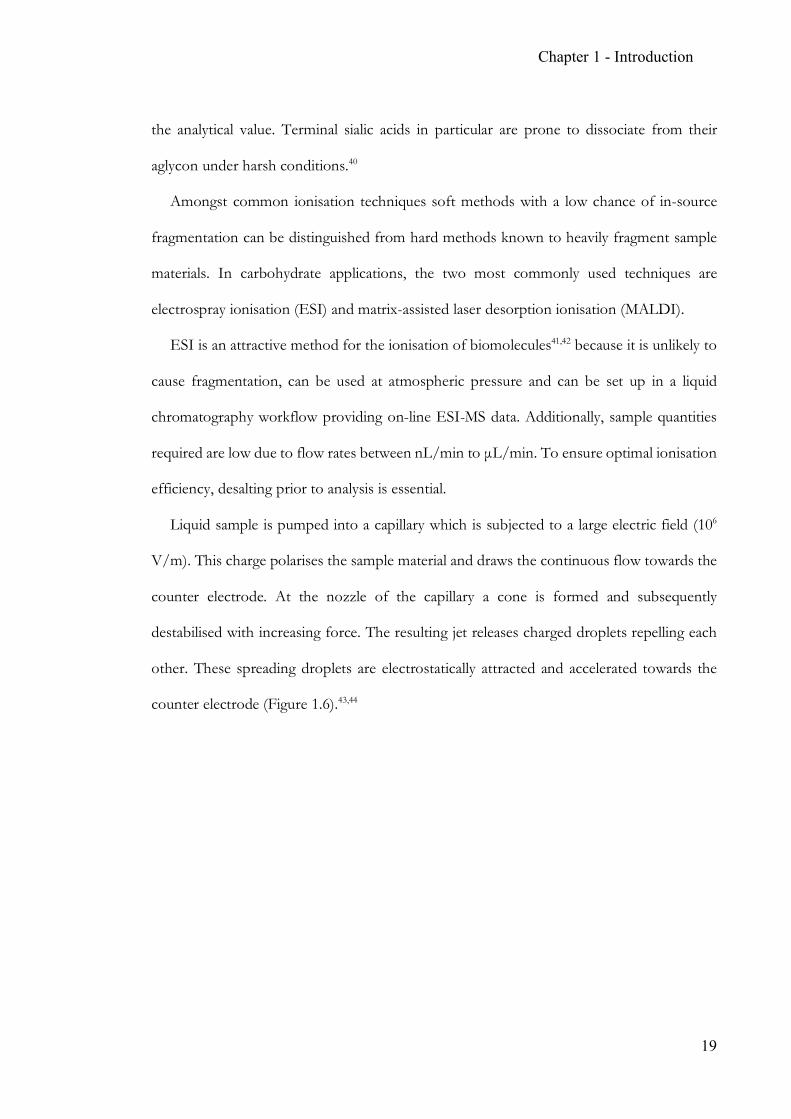
Liquid sample is pumped into a capillary which is subjected to a large electric field (106
V/m). This charge polarises the sample material and draws the continuous flow towards the
counter electrode. At the nozzle of the capillary a cone is formed and subsequently
destabilised with increasing force. The resulting jet releases charged droplets repelling each
other. These spreading droplets are electrostatically attracted and accelerated towards the
counter electrode (Figure 1.6).43,44
Chapter 1 - Introduction
20
Figure 1.6: Schematic depiction of the electrospray ionisation (ESI). Analyte is pumped
through a capillary with a voltage applied, forming charged droplets. Solvent is displaced
(according to the (a) ion evaporation model or (b) charge residue model) and charged analyte
travels to the mass analyser. Adapted from Konermann et al.45
During the travel phase, the charged droplets start to shrink due to evaporation to a point
of destabilisation caused by repulsive Coulomb forces. Fission causes the droplets to shrink
even further ultimately releasing de-solvated ions according to unclear mechanisms.
According to the ion evaporation model46 (IEM, Figure 1.6 a) which is prevalent for small
molecules like glycans, analyte ions are ejected from a critically charged droplet, whereas
larger molecules (e.g. proteins) are believed to ionise according to the charge residue model47
(CRM, Figure 1.6 b). Here, the analyte is left with the droplet’s charge following solvent
evaporation producing multiply charged species.
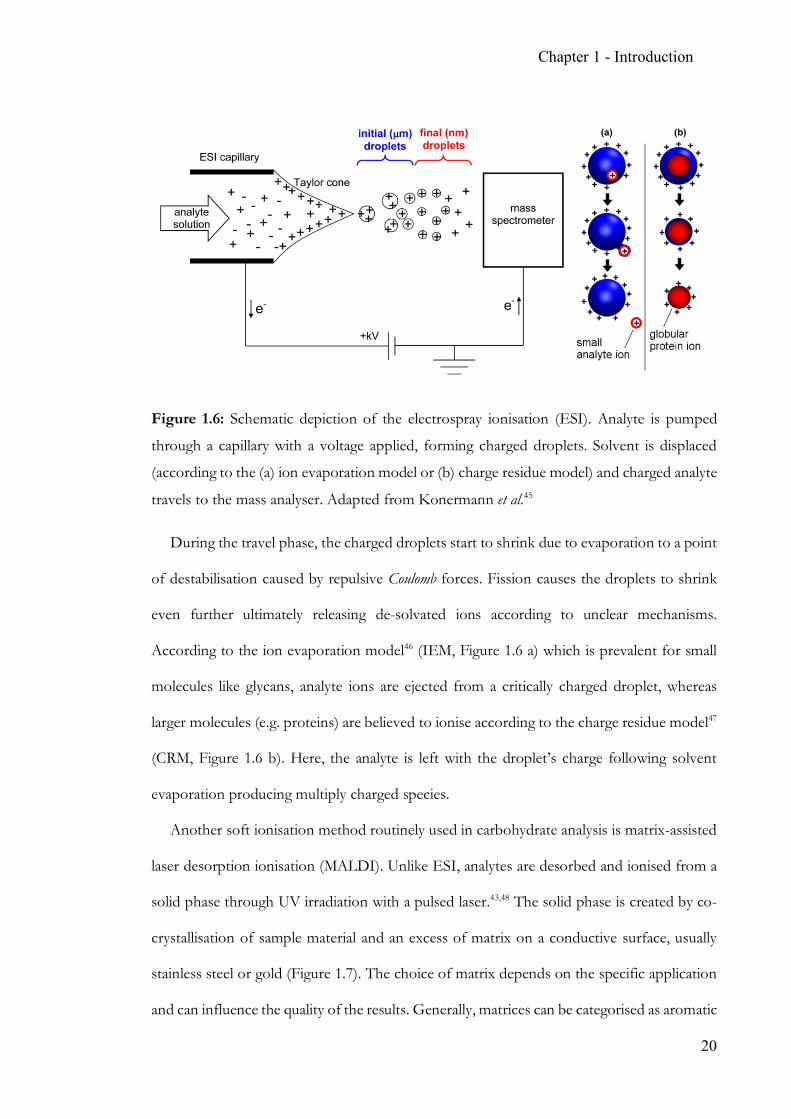
Another soft ionisation method routinely used in carbohydrate analysis is matrix-assisted
laser desorption ionisation (MALDI). Unlike ESI, analytes are desorbed and ionised from a
solid phase through UV irradiation with a pulsed laser.43,48 The solid phase is created by co-
crystallisation of sample material and an excess of matrix on a conductive surface, usually
stainless steel or gold (Figure 1.7). The choice of matrix depends on the specific application
and can influence the quality of the results. Generally, matrices can be categorised as aromatic
Chapter 1 - Introduction
21
organic acids (e.g. 2,5-dihydroxybenzoic acid as ‘all-round matrix’, α-cyano-4-hydroxy-
cinnaminic acid for peptides or 2,4,6-trihydroxyacetophenone for glycans). These
compounds fulfil two objectives providing a source or sink of protons based on the
polarisation of the instrument and secondly absorbing and distributing the UV radiation
emitted by the laser.49
Figure 1.7: Schematic depicting a MALDI source. Analyte (red) is co-crystallised with an
excess of matrix (grey).
Following in vacuo irradiation, the photo-ionised matrix desorbs and expands rapidly
transitioning into the gas phase accompanied by analyte molecules.43 For the analyte
ionisation two models have been proposed: according to the ‘Lucky Survivors’ theory,
charged analytes are preformed prior to crystallisation which ultimately survive sublimation.
Alternatively, secondary collision between charged matrix and analyte in the gas phase are
suggested to transfer ionisation.48,50 Due to the abundance of matrix (fragment) ions the
resolution of analytes below m/z of 500 is poor and often lost in background noise.
Chapter 1 - Introduction
22
1.2.2.2 Mass analyser
In order to determine m/z values of the generated analyte ions, mass analysers are
connected in-line to ion sources. Frequently ESI sources producing a constant stream of
analytes are paired with quadrupole mass analysers (QMS), whereas gated MALDI sources
work well with time-of-flight (ToF) analysers.
The central element in quadrupoles are four electrodes arranged in parallel at the vertices
of a square, with opposing rods connected to the same direct current (DC) polarity. This
potential is overlaid with a potential in an alternating radio frequency (RF). This setup allows
for ions travelling through to be focussed or deflected and subsequently discharged. Based
on mass and charge state, ions are more or less likely to be focussed by a particular pair of
electrodes.51 By altering the DC and RF parameters, stable trajectories for specific m/z
species are formed allowing ranges of ions to be scanned. Especially the scanning speed and
overall compact build render quadrupole mass analysers a popular choice in LC-MS systems.
In ToF mass analysers, ions are accelerated by an electrical potential (V) and travel
through a vacuum of given length (L). The time-of-flight is inversely proportional to the
velocity, which can be expressed as
𝑇𝑂𝐹 = 𝐿 ∙ '𝑚
2𝑧𝑒𝑉
with the mass (m) and charge (z) of the analyte and the charge of an electron (e). Therefore,
ions with smaller m/z reach the detector first.43 To compensate for slight differences in
kinetic energy, reflectron mirrors can be used to re-focus species with identical m/z values
and hereby increase the resolution of the mass analyser at the expense of sensitivity.52
Following separation according to their respective mass-to-charge ratio, ions hit the mass
detector. Electron multipliers or microchannel plate detectors are commonly used to detect
analyte ions exploiting the principle of secondary emission, where an incoming particle
Chapter 1 - Introduction
23
induces the emission of secondary particles from a suitable material. Stacking these elements
can lead to a cascading effect which results in electronic amplification of the initial signal.
While ESI-QMS is often very convenient as biological carbohydrate samples are dissolved
in aqueous solution, its salt tolerance is comparably low. Additional sample preparation (i.e.
desalting) is required. However, an LC-MS setup with an in-line ESI-Quad can be employed
as a form of sample preparation, but with limitations regarding the high-throughput potential
of the methodology.
MALDI-ToF is popular due to its versatility in sample requirements and low in-source
fragmentation. Very small amounts of solid or analyte solution can be analysed following co-
crystallisation with matrix which is rapid. While this ionisation technique is more salt tolerant,
MALDI is limited to analytes of approximately m/z > 500 as a result of the abundance of
matrix-derived ions.
Neither of the two methods described bears the potential to fully characterise
carbohydrates. Due to the high degree of isomerisation amongst mono-saccharides, m/z
values alone can be insufficient for the precise assignment of glycan structures with various
linkage positions and configurations (i.e. α1,6- vs. β1,4-linked) or even isobaric mono-
saccharide components (Glc vs. Man).
1.2.2.3 Ion mobility
Recently, ion mobility spectrometry has gained popularity in the glyco-analytical
community as is can be used in conjunction with mass spectrometry (IM-MS) and is able to
provide additional information on isobaric carbohydrates. The application of IM-MS adds a
new dimension to the field. Analytes are separated based on their size and shape, specifically
their rotationally averaged cross section area to charge ratio (Ω/z), with the collision cross-
section (CCS) Ω calculated from the drift time.53
Chapter 1 - Introduction
24
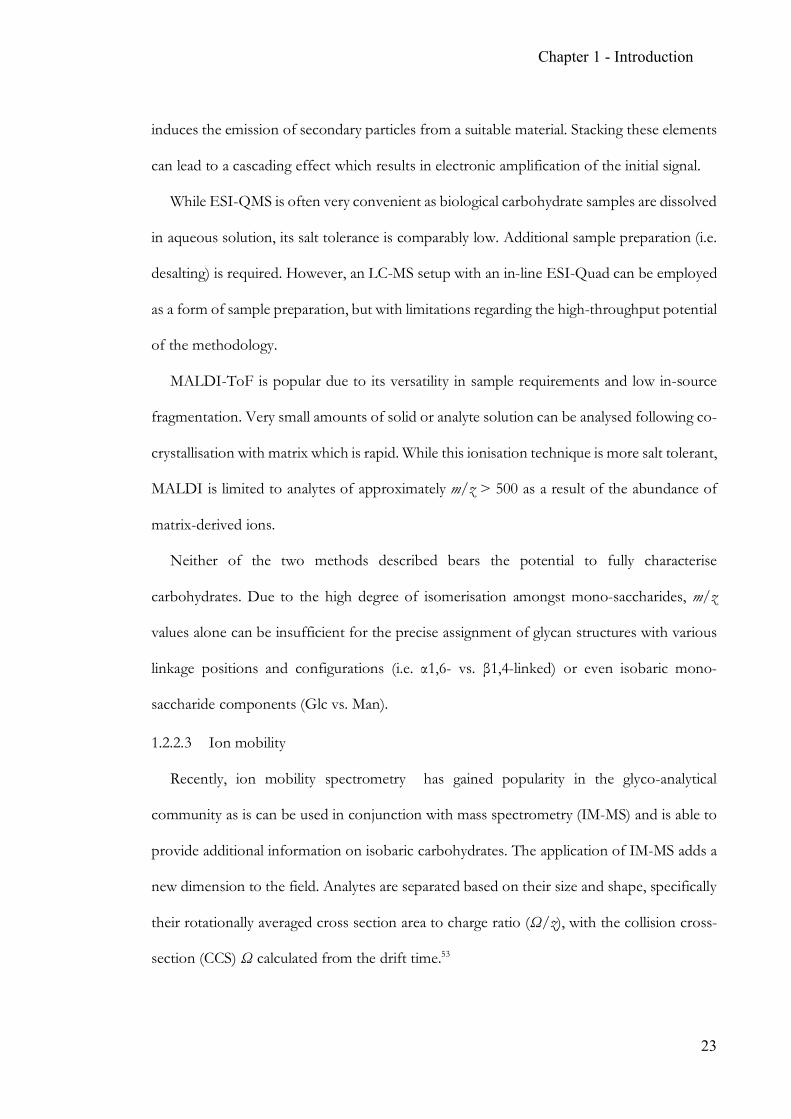
This thesis focusses on travelling-wave IMS (TWIMS), where a stacked ring ion guide
(SRIG) consists of ring electrodes through which a symmetric potential wave propagates
continuously. While the direct current applied to the ring electrodes focusses the ions
laterally, analyte ions are propelled through the device by ‘surfing’ the potential wave in case
of higher-mobility species and therefore arriving earlier. Lower mobility ions tend to ‘roll
over’ and reside inside the drift cell for longer (Figure 1.8).54
Figure 1.8: Schematic mechanism of travelling wave ion mobility spectrometry. Analytes
interact with a travelling wave are separated based on their mobility (blue - low, red - high).55
Based on calibration experiments under stable conditions in the drift cell, the CCS can be
calculated. However, for the purpose of (e.g. isobaric) separation, TWIMS can be used
without calibration in-line as IM-MS.
With the help of ion mobility separation of known saccharide libraries, it is now possible
to determine glycan structures in unprecedented detail based on mass as well as
morphology.56,57 This key methodology elevated the discipline of structural carbohydrate
analysis to a new level. The discrimination between isobaric mono-saccharide species as well
Chapter 1 - Introduction
25
as linkage conformers is accessible through the mobility separation of characteristic
fragments. However, current limitations exist with regards to the availability of glycan
standards and instrumentation, as well as the throughput of the techniques.
1.2.3 Glycan arrays
While the structural assignment of glycans is a critical element, further biochemical
characterisation is required to understand their biological function entirely. This
characterisation depends on the specific carbohydrate but might involve its biosynthetic
route, degradation pathway, or identification of interaction partners from complex mixtures
in varying conditions like temperature or pH. With numerous biological functions still to be
assigned, functional glycan analysis faces several challenges:
First of all, to analyse the number of experiments required to determine the various factors
involved a high-throughput format with little sample use is beneficial.58 Obtaining pure
carbohydrates from biological sources is challenging due to the microheterogeneity of
glycans. Therefore, miniaturisation is important due to sample quantity constraints.
With regards to glycan-binding, multivalency effects are notoriously difficult to mimic in
solution, which is why an immobilised setup can result in a more accurate testing
environment. If combined with a conductive surface, ligand immobilisation can be exploited
as a platform for MALDI-ToF MS. Traditional approaches like isothermal calorimetry,
surface plasmon resonance or enzyme-linked lectin assays depend on difficult to obtain
quantities of analyte and lack high-throughput capabilities.59 Finally, carbohydrate binding is
greatly influenced by clustering effects which are often disregarded in the aforementioned
methods.60
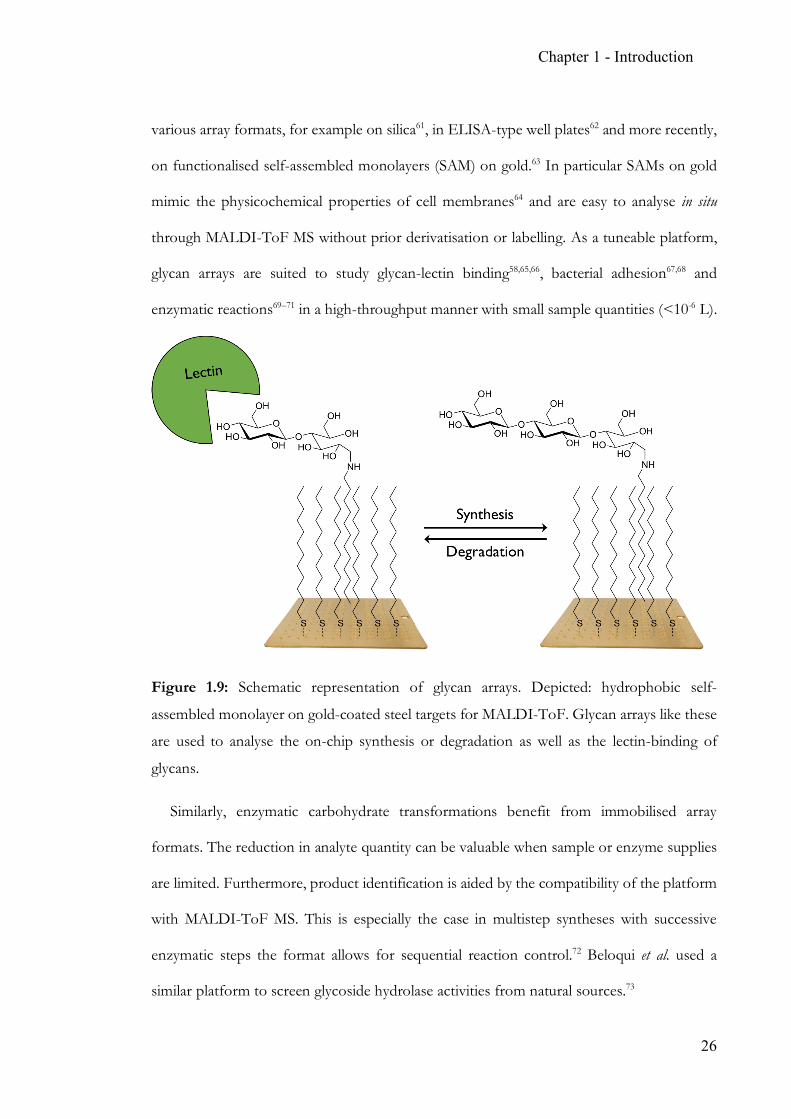
These challenges can be overcome with carbohydrate (micro-)arrays, alternatively known
as glycan arrays, which consist of a number of immobilised substrates on a solid support
allowing for control over spatial distribution.59 Glycoconjugates have been presented in
Chapter 1 - Introduction
26
various array formats, for example on silica61, in ELISA-type well plates62 and more recently,
on functionalised self-assembled monolayers (SAM) on gold.63 In particular SAMs on gold
mimic the physicochemical properties of cell membranes64 and are easy to analyse in situ
through MALDI-ToF MS without prior derivatisation or labelling. As a tuneable platform,
glycan arrays are suited to study glycan-lectin binding58,65,66, bacterial adhesion67,68 and
enzymatic reactions69–71 in a high-throughput manner with small sample quantities (<10-6 L).
Figure 1.9: Schematic representation of glycan arrays. Depicted: hydrophobic self-
assembled monolayer on gold-coated steel targets for MALDI-ToF. Glycan arrays like these
are used to analyse the on-chip synthesis or degradation as well as the lectin-binding of
glycans.
Similarly, enzymatic carbohydrate transformations benefit from immobilised array
formats. The reduction in analyte quantity can be valuable when sample or enzyme supplies
are limited. Furthermore, product identification is aided by the compatibility of the platform
with MALDI-ToF MS. This is especially the case in multistep syntheses with successive
enzymatic steps the format allows for sequential reaction control.72 Beloqui et al. used a
similar platform to screen glycoside hydrolase activities from natural sources.73
Chapter 1 - Introduction
27
1.2.4 Liquid chromatography of carbohydrates
In addition to the above mentioned analytical tools, liquid chromatography (LC) is applied
as separation methodology to further increase the analytical resolution.74–78 The underlying
principal is based on differing affinities between analytes and stationary phase. Poorly
retained analytes travel faster in the mobile phase due to higher solubility and consequently
elute faster than well-retained compounds. Two column materials are commonly used for
glycan analysis applications (Figure 1.10).
C18 reversed-phase (RP) columns are used to separate hydrophilic carbohydrates which
require derivatisation to increase hydrophobicity and improve separation. This step is
combined with the introduction of chromophores to utilise spectroscopic detection,
traditionally, by reductive amination of the aldehyde moiety with aniline derivatives.79,80
The introduction of hydrophilic interaction chromatography (HILIC) with polar
stationary and less-polar, organic mobile phases (acetonitrile) in combination with ultra-
performance liquid chromatography (UPLC/UHPLC) gives access to rapid baseline-
separation of underivatised glycans.81,82 An increasingly polar gradient allows for the elution
of hydrophilic carbohydrates. With eluents dissolved in comparably high organic solvents
which evaporate readily, subsequent in-line ESI-MS is simplified making HILIC separation
a popular choice. The recent arrival of Water’s commercial GlycoWorks system integrates
enzymatic N-glycan release, labelling and separation.12,83
Chapter 1 - Introduction
28
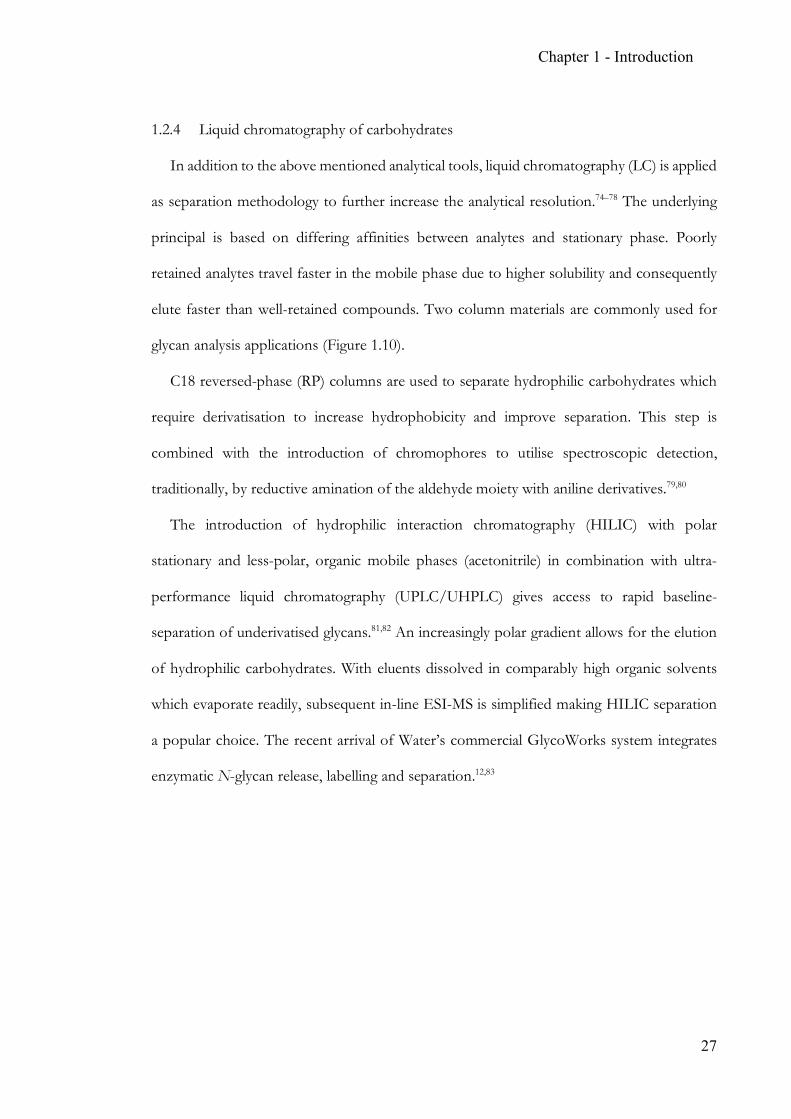
Figure 1.10: Column materials commonly used in glyco-specific applications. Reverse phase
(RP) requires derivatisation to improve separation. Hydrophilic interaction chromatography
(HILIC) is preferred as analytes elute in high organic solvents, improving ESI compatibility.
Usually, elution is detected by spectroscopic systems (if chromophores are present) or in-
line mass spectrometers. Subsequent analyte identification is achieved by comparison to
known (external) standards aided by databases containing compound chromatograms and
spectra (e.g. GlycoBase).77,78 To ensure globally standardised experimental parameters,
retention times are referenced to dextran polymer ladders as ‘glucose units’ (GU).84
LC-MS analysis is applicable in structure confirmation experiments, where known
glycosylation patters are compared to previous chromatograms of similar samples.
Quantification of glycoforms of patterns of heterogeneously glycosylated samples is not
feasible with techniques described earlier. For de novo structure identification, more detailed
analysis is required to resolve larger glycans in particular. The impact on retention times
caused by single linkage isomers for example is minimal and therefore requires an elaborate
separation to achieve resolution. Additional glycosidase treatment can improve the
experimental elucidation dramatically and has been the gold standard in structural
identification.
SiO
OCH3
SiO
OO
O NH
OR
15O
RP column material
HILIC column material
Chapter 1 - Introduction
29
1.2.5 Docking
For some applications, the tools described so far are not sufficient to answer biological
questions due to solubility limitations, especially within cell biology where lipid bilayer
membranes are more complex than just two-dimensional matrices. Amphiphilic glycolipids
are integral parts of these subcellular structures which makes their functional assessment
even more challenging as the majority of biochemical assays have been developed for
aqueous systems.
With significant advances in computational power and databases filled with three-
dimensional structures, molecular docking is currently more feasible and has become a useful
tool in life sciences. Molecular docking experiments predict orientation, location and
subsequently affinity between interacting molecules simulating molecular recognition in silico.
Typically, small molecule ligands with various degrees of freedom are docked to predicted
binding sites in rigid target proteins within a force field. Possible ligand orientations are
iterated and intermolecular complexes between the rigid target and the ligand conformers
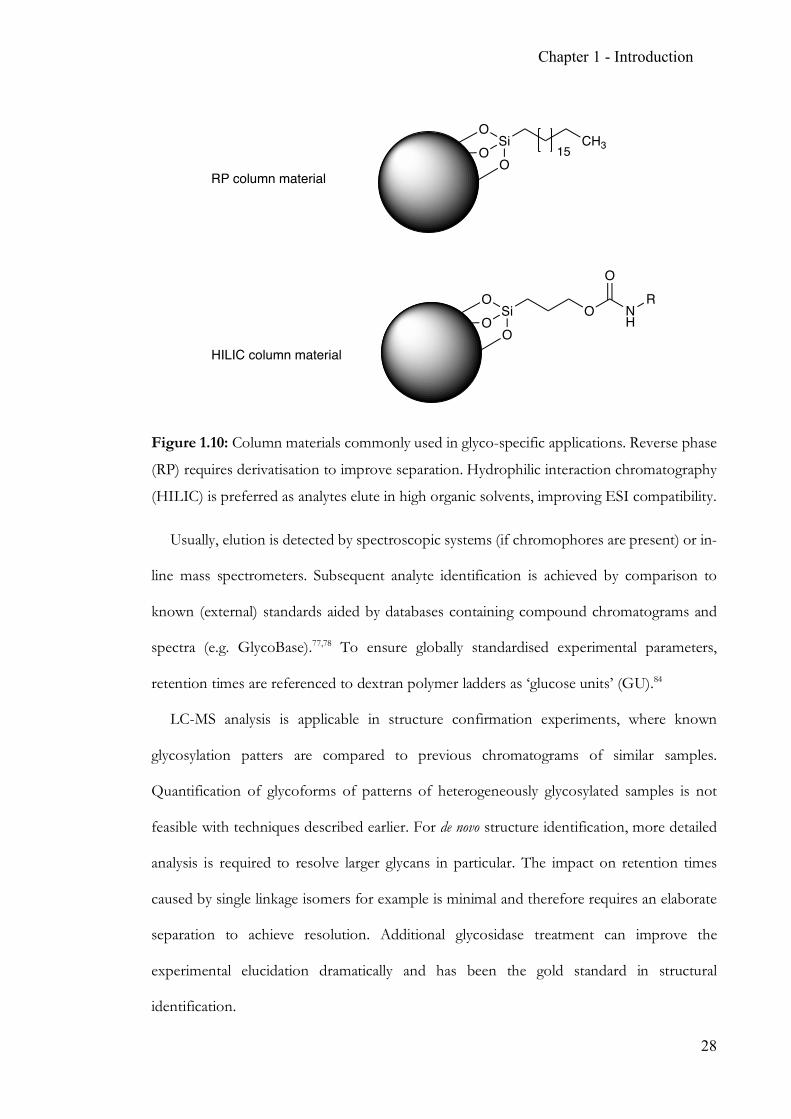
are evaluated by a scoring function similar to this85:
∆𝐺/012013 = ∆𝐺526 + ∆𝐺898: + ∆𝐺;/<12 + ∆𝐺28=<95 + ∆𝐺><?=
Based on repulsive and electrostatic forces, hydrogen bonding, desolvation energy and
torsional entropy the binding energy is calculated. Docking compound libraries or families
of ligand poses and comparison of the scoring results is a suitable method to understand the
molecular architecture of the interaction. Traditionally, molecular docking results find wide
application in pharmaceutical drug discovery where virtual screening can support the
identification of lead compounds.86 Few examples can be found where molecular docking
approaches provide insights into the biology of amphiphilic glycolipids.87,88 However,
molecular docking cannot replace biochemical characterisation of molecular interactions and
will remain supportive tool.
Chapter 1 - Introduction
30
1.3 Applications for glyco-analytical tools
1.3.1 Industrial biotechnology
One of the first successful examples of industrial biotechnology involving carbohydrates
was the process of anaerobic alcoholic fermentation turning glucose into carbon dioxide and
the valuable commodity ethanol. To this day, these whole cell catalysts are of importance in
the food and drink industry.
Lately, traditional chemical synthesis, especially in the fine chemicals and pharmaceutical
industry, has been combined with or replaced by biocatalytic processes.89 The success of
biocatalysis can be explained by two main reasons: Firstly, biocatalysis is able to accomplish
multiple challenging chemical steps at once and secondly, it is able to replace toxic heavy
metal catalysts for aqueous reactions at ambient temperatures to advance “green chemistry”.
Enzymes act as (bio-)catalysts to provide easy access to several classes of chiral
compounds like optically pure amines. Particularly challenging regio-, stereo- or chemo-
selectivity is achievable due to the nature of enzymes. Their complex three-dimensional
structure consisting of chiral L-amino acids results in precise targeting of substrates and
inherent stereo-selectivity.
Beyond the natural enzymes with limited substrate promiscuity “enzyme engineering”
broadens the possibilities. Optimising the biocatalyst’s amino acid sequence by means of
molecular biology gives rise to a wider range of tailored enzymes with desirable compound
specificities and improved activities for substrates of interest.90,91
Additionally, enzyme-catalysed reactions can be more sustainable and environmentally
friendly. Proteins are biocompatible and biodegradable, work in ambient aqueous conditions
and with the potential for improved economy. These benefits can solve common problems
like organic solvent or heavy metal catalyst usage as well as high energy costs.92
Chapter 1 - Introduction
31
As mentioned before, carbohydrate chemistry is governed by stereo- and regio-selective
chemistry which is orchestrated by CAZymes in nature. The industrial exploitation of
carbohydrates as feed stocks, materials and pharmaceuticals requires glyco-analytical tools in
order to characterise properties and profile activities. The aforementioned (CAZymes,
section 1.1.4) specific hydrolysis of plant-derived poly-saccharides is a suitable example: The
generation of higher-value compounds for poly-saccharides requires characterisation of the
biocatalysts as well as the products generated.
1.3.2 Pharmaceutical quality control
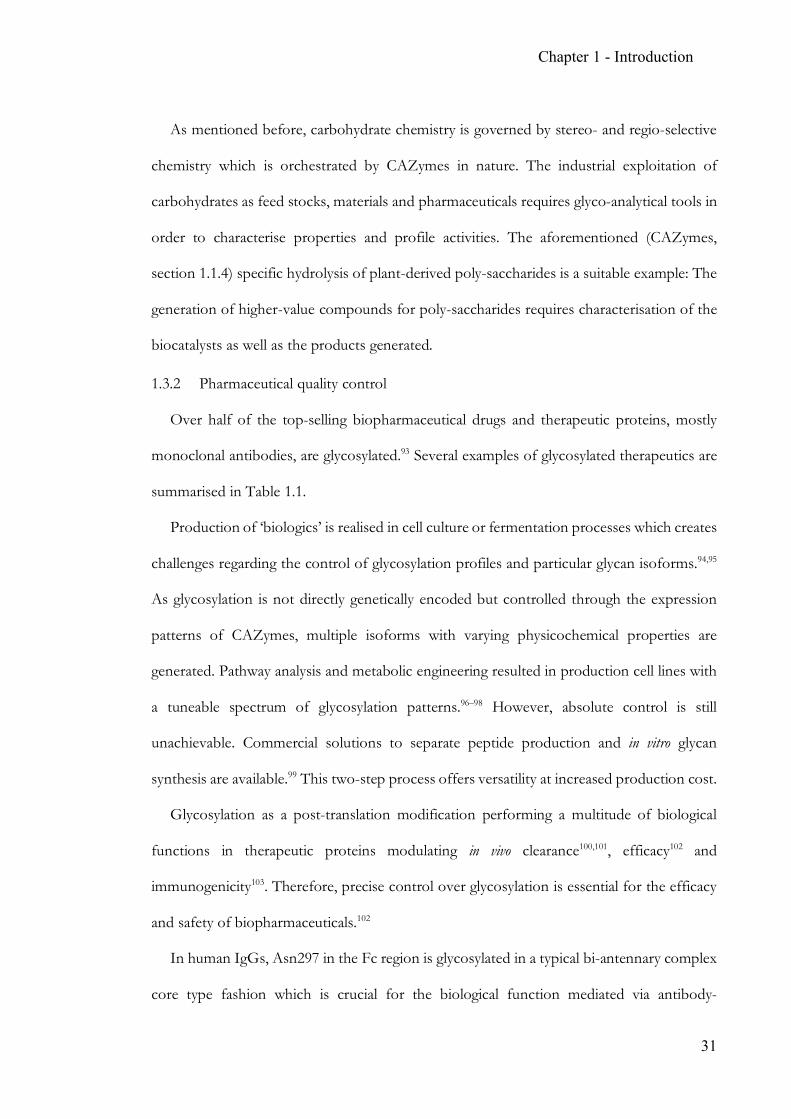
Over half of the top-selling biopharmaceutical drugs and therapeutic proteins, mostly
monoclonal antibodies, are glycosylated.93 Several examples of glycosylated therapeutics are
summarised in Table 1.1.
Production of ‘biologics’ is realised in cell culture or fermentation processes which creates
challenges regarding the control of glycosylation profiles and particular glycan isoforms.94,95
As glycosylation is not directly genetically encoded but controlled through the expression
patterns of CAZymes, multiple isoforms with varying physicochemical properties are
generated. Pathway analysis and metabolic engineering resulted in production cell lines with
a tuneable spectrum of glycosylation patterns.96–98 However, absolute control is still
unachievable. Commercial solutions to separate peptide production and in vitro glycan
synthesis are available.99 This two-step process offers versatility at increased production cost.
Glycosylation as a post-translation modification performing a multitude of biological
functions in therapeutic proteins modulating in vivo clearance100,101, efficacy102 and
immunogenicity103. Therefore, precise control over glycosylation is essential for the efficacy
and safety of biopharmaceuticals.102
In human IgGs, Asn297 in the Fc region is glycosylated in a typical bi-antennary complex
core type fashion which is crucial for the biological function mediated via antibody-
Chapter 1 - Introduction
32
dependent cellular cytotoxicity (ADCC) and complement-dependent cytotoxicity (CDC).
Hence, precise control over glycosylation profiles are vital for the safety and efficacy of
therapeutic IgGs.104
Intravenous immunoglobulin samples for example contain approximately 19% (mono-
and di-)sialylated glycoforms. α2,6-sialylation is predominant in humans, whereas Chinese
hamster ovary cells produce α2,3-sialylated recombinant IgGs.105 In murine myeloma cells,
terminal sialylation is found to contain non-human Neu5Gc instead of Neu5Ac, which is
potentially immunogenic in humans as 85% of the healthy population express anti-Neu5Gc
antibodies.106,107
The therapeutic IgG Cetuximab contains 30% α1,3-galactosylated glycans with led to
cases of anaphylactic reactions in the US due to anti-α1,3-Gal antibodies in patients receiving
Cetuximab treatment.103
In conclusion, the control during production as well as the analysis of glycoforms during
development and quality control are crucial for economic and clinical safety aspects. In order
to orchestrate the multitude of glycan profiles precise tools for analysis and glycan
engineering are required. This includes optimised production hosts, as well as highly-specific
(exo-)glycosidases together with LC-MS systems.
Chapter 1 - Introduction
33
Table 1.1: Panel of selected glycosylated therapeutic proteins approved for clinical
application. Excerpt from Solá et al.102
Non-proprietary name Name (Company) Indication Glycans Production Alpha 1-antitrypsin Prolastin®
(Talecris Biotherapeutics)
Treatment of congenital α1AT deficiency with
emphysema
3 N-Linked Tissue fractionation
(human placenta)
Antithrombin III Atryn® (Ovation
Pharmaceutics)
Prevention of peri-operative and peri-
partum thromboelitic events
4 N-Linked Milk fractionation (transgenic
goats) C1-esterase-inhibitor Cinryze®
(CSL) Treatment of
hereditary angioedema 6 N-Linked 7 O-Linked
Plasma fractionation
(human) Darbopoetin alfa ARANESP®
(Amgen) Treatment of anemia
associated with chronic renal failure
5 N-Linked 1 O-Linked
CHO cells
Epoetin multiple Treatment of anemia associated with chronic
renal failure (CRF)
3 N-Linked 1 O-Linked
CHO cells
Eptacog alfa (CF VIIa) NovoSeven® (Novo Nordisk)
Treatment of spontaneous and
surgical bleedings in haemophilia A and B
2 N-Linked 2 O-Linked
BHK cells
Fibrinogen Haemocomplettan® (CSL)
Haemorrhagic diatheses in hypo-,
dys-, or afibrinogenaemia
5 N-Linked Plasma fractionation
(human)
Idursulfase Elaprase® (Shire)
Treatment of Mucopolysaccharidosis
I
8 N-Linked Human cells
Insulin multiple Treatment of diabetes multiple multiple Interferon beta-1a Rebif®
(Pfizer) Treatment of multiple
sclerosis 1 N-Linked CHO cells
Urokinase alfa Abbokinase® (ImaRx
Therapeutics)
Treatment of acute massive pulmonary
emboli
1 N-Linked 1 O-Linked
HK cells
Chapter 1 - Introduction
34
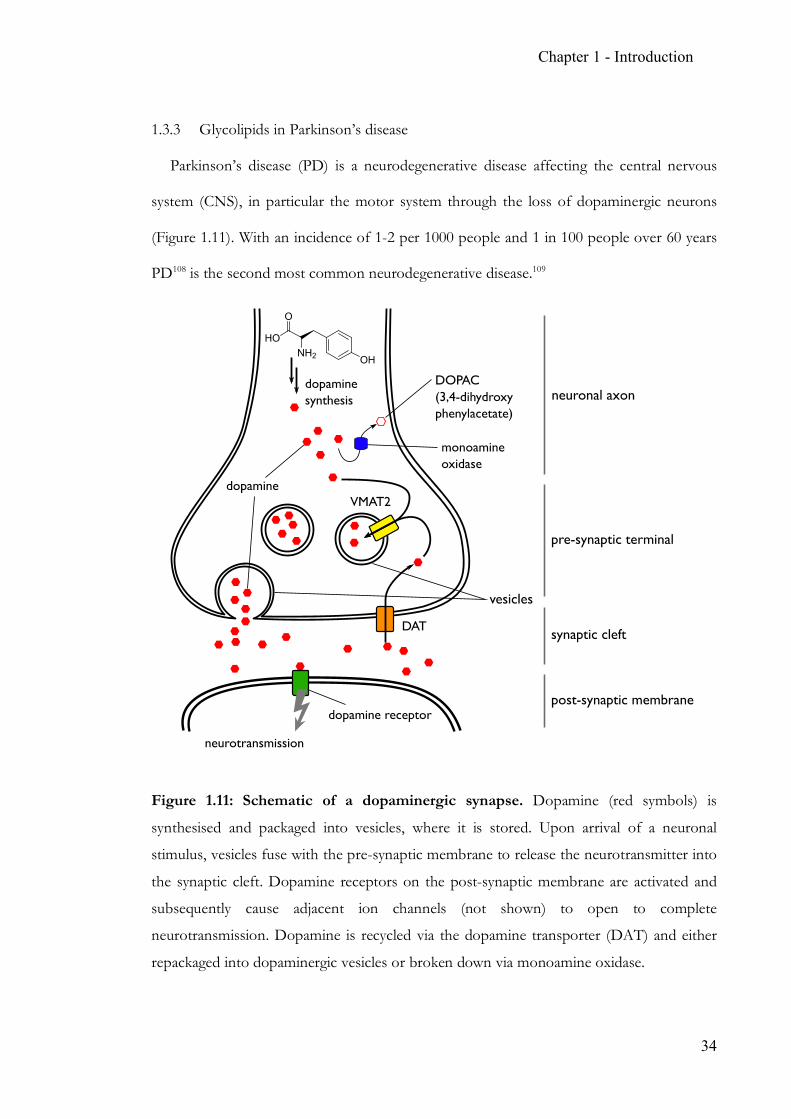
1.3.3 Glycolipids in Parkinson’s disease
Parkinson’s disease (PD) is a neurodegenerative disease affecting the central nervous
system (CNS), in particular the motor system through the loss of dopaminergic neurons
(Figure 1.11). With an incidence of 1-2 per 1000 people and 1 in 100 people over 60 years
PD108 is the second most common neurodegenerative disease.109
Figure 1.11: Schematic of a dopaminergic synapse. Dopamine (red symbols) is
synthesised and packaged into vesicles, where it is stored. Upon arrival of a neuronal
stimulus, vesicles fuse with the pre-synaptic membrane to release the neurotransmitter into
the synaptic cleft. Dopamine receptors on the post-synaptic membrane are activated and
subsequently cause adjacent ion channels (not shown) to open to complete
neurotransmission. Dopamine is recycled via the dopamine transporter (DAT) and either
repackaged into dopaminergic vesicles or broken down via monoamine oxidase.
Chapter 1 - Introduction
35
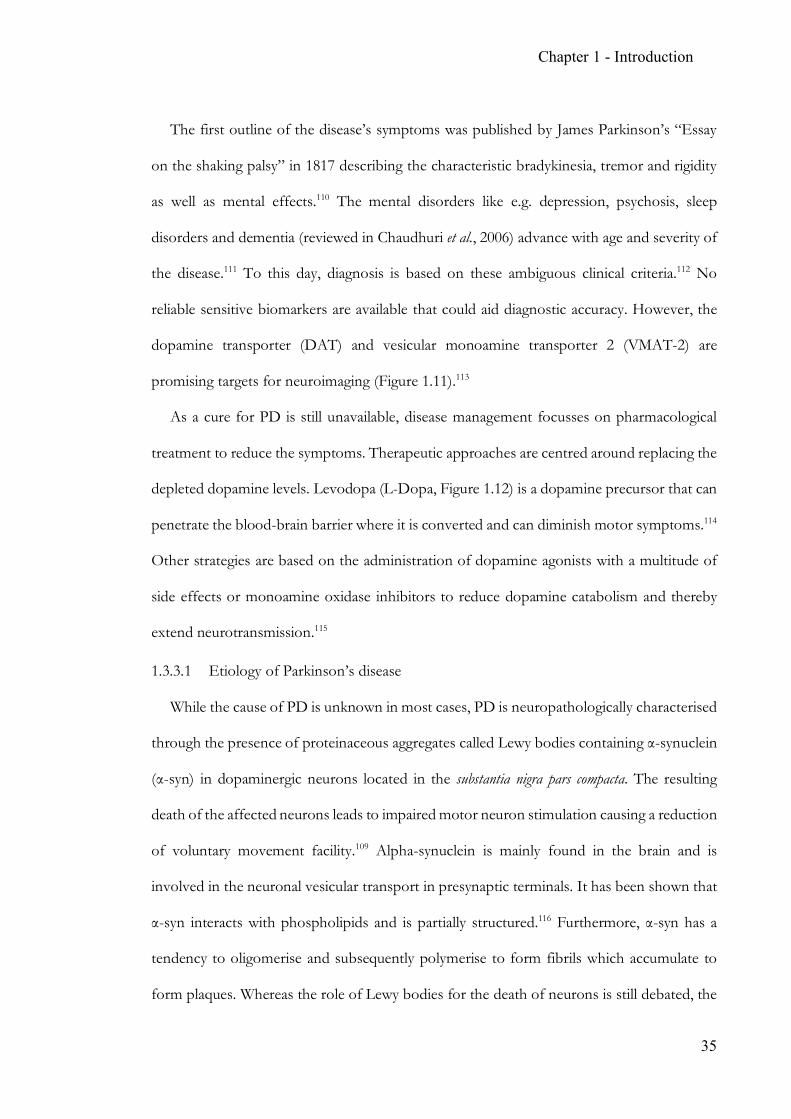
The first outline of the disease’s symptoms was published by James Parkinson’s “Essay
on the shaking palsy” in 1817 describing the characteristic bradykinesia, tremor and rigidity
as well as mental effects.110 The mental disorders like e.g. depression, psychosis, sleep
disorders and dementia (reviewed in Chaudhuri et al., 2006) advance with age and severity of
the disease.111 To this day, diagnosis is based on these ambiguous clinical criteria.112 No
reliable sensitive biomarkers are available that could aid diagnostic accuracy. However, the
dopamine transporter (DAT) and vesicular monoamine transporter 2 (VMAT-2) are
promising targets for neuroimaging (Figure 1.11).113
As a cure for PD is still unavailable, disease management focusses on pharmacological
treatment to reduce the symptoms. Therapeutic approaches are centred around replacing the
depleted dopamine levels. Levodopa (L-Dopa, Figure 1.12) is a dopamine precursor that can
penetrate the blood-brain barrier where it is converted and can diminish motor symptoms.114
Other strategies are based on the administration of dopamine agonists with a multitude of
side effects or monoamine oxidase inhibitors to reduce dopamine catabolism and thereby
extend neurotransmission.115
1.3.3.1 Etiology of Parkinson’s disease
While the cause of PD is unknown in most cases, PD is neuropathologically characterised
through the presence of proteinaceous aggregates called Lewy bodies containing α-synuclein
(α-syn) in dopaminergic neurons located in the substantia nigra pars compacta. The resulting
death of the affected neurons leads to impaired motor neuron stimulation causing a reduction
of voluntary movement facility.109 Alpha-synuclein is mainly found in the brain and is
involved in the neuronal vesicular transport in presynaptic terminals. It has been shown that
α-syn interacts with phospholipids and is partially structured.116 Furthermore, α-syn has a
tendency to oligomerise and subsequently polymerise to form fibrils which accumulate to
form plaques. Whereas the role of Lewy bodies for the death of neurons is still debated, the
Chapter 1 - Introduction
36
removal of α-syn through aggregation does affect the neurons capability to traffic dopamine
efficiently causing neurodegeneration.117
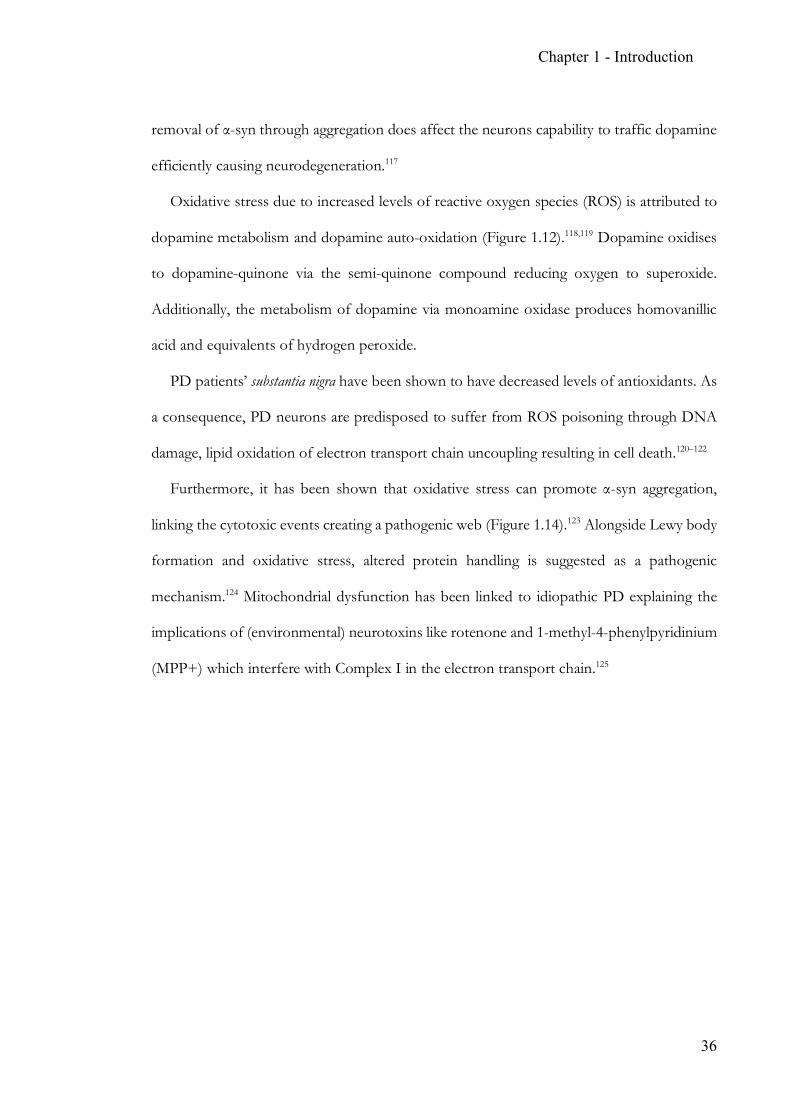
Oxidative stress due to increased levels of reactive oxygen species (ROS) is attributed to
dopamine metabolism and dopamine auto-oxidation (Figure 1.12).118,119 Dopamine oxidises
to dopamine-quinone via the semi-quinone compound reducing oxygen to superoxide.
Additionally, the metabolism of dopamine via monoamine oxidase produces homovanillic
acid and equivalents of hydrogen peroxide.
PD patients’ substantia nigra have been shown to have decreased levels of antioxidants. As
a consequence, PD neurons are predisposed to suffer from ROS poisoning through DNA
damage, lipid oxidation of electron transport chain uncoupling resulting in cell death.120–122
Furthermore, it has been shown that oxidative stress can promote α-syn aggregation,
linking the cytotoxic events creating a pathogenic web (Figure 1.14).123 Alongside Lewy body
formation and oxidative stress, altered protein handling is suggested as a pathogenic
mechanism.124 Mitochondrial dysfunction has been linked to idiopathic PD explaining the
implications of (environmental) neurotoxins like rotenone and 1-methyl-4-phenylpyridinium
(MPP+) which interfere with Complex I in the electron transport chain.125
Chapter 1 - Introduction
37
Figure 1.12: Dopamine metabolism. Tyrosine is hydroxylated to L-Dopa by the tyrosine
hydroxylase (TH), before the rate-limiting decarboxylation via amino acid decarboxylase
(AADC) gives dopamine. Dopamine is broken down into homovanillic acid (HVA) via a
cascade of monoamine oxidase (MAO), aldehyde dehydrogenase and catechol-O-methyl
transferase (COMT) releasing hydrogen peroxide. In the presence of oxygen, dopamine can
auto-oxidase to the quinone producing superoxide. DOPAC: 3,4-dihydroxyphenylacetic
acid, 3-MT: 3-methoxyl-tyrosine.
HO
O
OHNH2
HO
O
OHNH2
HO
HO
HO NH2
HO
HO O
HO
MeO NH2
HO
MeO O
O
O NH2
HO
O NH2
MAO
MAO
COMT
COMT
TH
AADC
O2
O2 O2
O2
O2
H2O2
O2
H2O2
tyrosine
L-Dopa
dopamine
3-MT
OH
OH
DOPAC
dopamine-semiquinone
dopamine-quinone
HVA
Chapter 1 - Introduction
38
1.3.3.2 Risk factors
The most prominent risk factor for PD is age. Age impacts cellular physiology in many
ways: oxidative stress increases, decreased lysosomal capability and progressive decline of
glucocerebrosidase to mention only a few.126,127 Decreased ROS tolerance is important, as the
disturbed dopamine metabolism puts aged neurons under additional stress. Decreased
neuronal lysosomal capacity, causing a direct loss of normal proteolytic activity, leads to an
inability to clear α-syn aggregates.
Reports of a predisposition of cocaine users to PD is based on the drug’s affinity for the
dopamine transporter. Blocking DAT-mediated re-uptake of the neurotransmitter depletes
presynaptic cytosolic dopamine and extends signal duration. Additionally, remaining
dopamine, as well as cocaine are metabolised producing neurotoxic ROS in the process.128,129
Amongst genetic risk factors, pathogenic mutations in the SNAC gene have been
identified to increase α-syn’s tendency to oligomerise.130,131 SNAC-associated forms of PD
show a decreased response to levodopa therapy and generally earlier onset of the disease.109
A significant discovery is the correlation between heterozygous mutations in the GBA1
gene found in Gaucher’s disease and PD.132 GBA encodes the lysosomal
β-glucocerebrosidase (GCase) which cleaves the glycosidic bond in glucocereboside and –
sphingosine (Figure 1.13). However, the precise contribution of GCase to the pathology of
PD remains elusive.
1.3.3.3 Etiology of Gaucher’s disease
Gaucher’s disease (GD) is a lysosomal storage disorder (LSD) associated with the lack of
GCase activity, which in turn leads to the accumulation to glycolipids. The activity reduction
can be the result of missense mutations in the GBA1 gene of which approximately 200
variants are known.133 GD severity differs depending on the degree of functional depletion
caused by the respective mutation. Clinically, three types of GD have been established: GD
Chapter 1 - Introduction
39
type 1 is the most common from without CNS involvement. Symptoms range from
asymptomatic to early-onset of splenomegaly and hepatomegaly in childhood. Type 2 GD
describes the acute neuronopathic form which is lethal in childhood due to severe symptoms
including neurological impairment. GD with neurological involvement but late-onset is
described as type 3. Symptoms like seizures and dementia manifest in adolescence and
patient’s life expectancy lies between 30 and 40 years.133
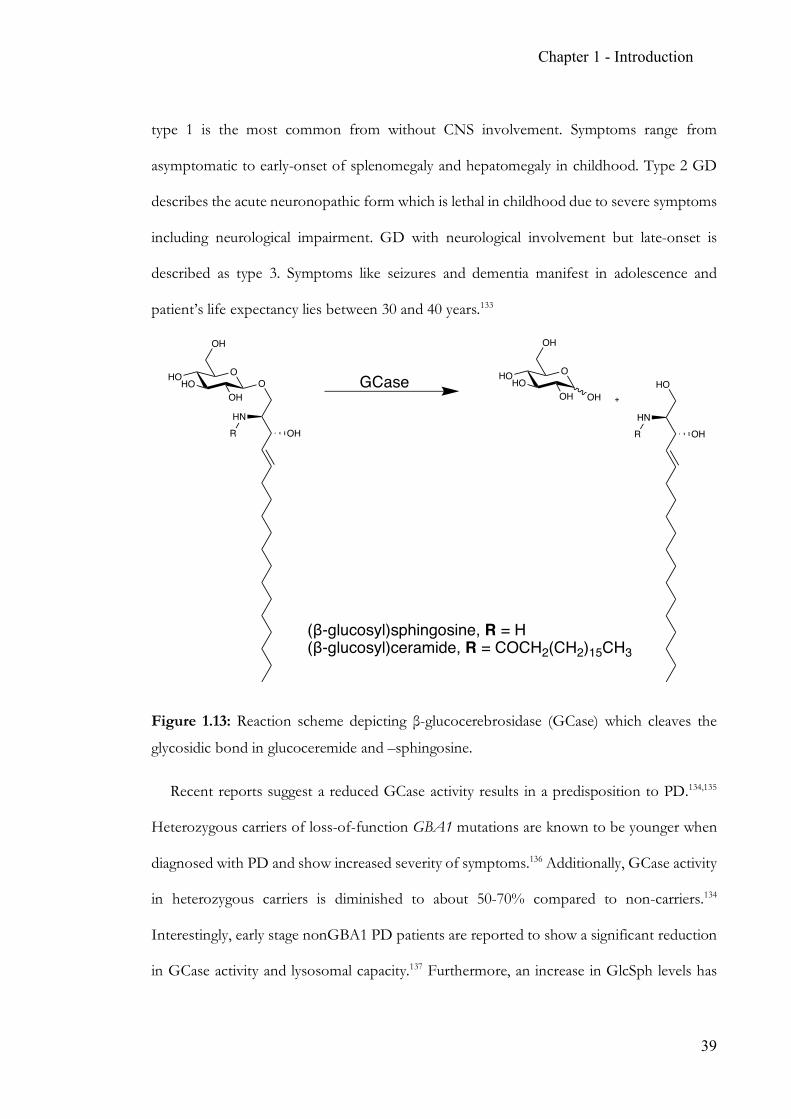
Figure 1.13: Reaction scheme depicting β-glucocerebrosidase (GCase) which cleaves the
glycosidic bond in glucoceremide and –sphingosine.
Recent reports suggest a reduced GCase activity results in a predisposition to PD.134,135
Heterozygous carriers of loss-of-function GBA1 mutations are known to be younger when
diagnosed with PD and show increased severity of symptoms.136 Additionally, GCase activity
in heterozygous carriers is diminished to about 50-70% compared to non-carriers.134
Interestingly, early stage nonGBA1 PD patients are reported to show a significant reduction
in GCase activity and lysosomal capacity.137 Furthermore, an increase in GlcSph levels has
OHOHO
OHO
OH
HN
OHOHO
OH OH
OH
HN
HOGCase
(β-glucosyl)sphingosine, R = H(β-glucosyl)ceramide, R = COCH2(CH2)15CH3
OHR OHR
Chapter 1 - Introduction
40
been shown in nonGBA1 PD patients and even in healthy individuals above the age of
sixty.127
Until enzyme replacement therapies (ERT) became available in 1991, care of GD was
restricted to symptomatic treatment. Today, treatment options are diverse: ERT offers relief
through the application of recombinant GCase resulting in decreased GlcCer/GlcSph levels.
Substrate reduction therapy (SRT) aims at inhibiting the ceramide glucosyltransferase and
thereby reducing the rate of GlcCer anabolism. With the rise of ERT, SRT application was
limited to patients with mild conditions. In an attempt to rescue residual activity of
improperly folded GCase in vivo, small molecule chaperons have been considered. The cough
medicine ‘ambroxol’ showed significant recovery rates in a clinical study with GD patients.138
With the multitude of GCase variants occurring, the identification of suitable compounds is
challenging but may provide a valuable addition to the therapeutic spectrum.139
Lysosomal storage disorders pose a serious threat to post-mitotic neurons as the
lysosomal function is reduced. The particularly extensive metabolic activity and high
membrane turnover in synapses explains their vulnerability. As a consequence of lysosomal
deficiency and resulting defects in axonal transport, synapses fail to transmit neuronal stimuli
resulting in “physiological death”, rather than cell death.140 Despite type 1 GD’s classification
as non-neuronopathic, this form is often associated with PD.134
Mazzulli et al. discovered a pathogenic positive feedback loop in which reduced GCase
activity causes lysosomal stress resulting in a decreased α-syn turnover. The resulting
oligomers and fibrils put even more stress on the lysosomal capacity leading to impaired
autophagy which results in an increase in cytosolic α-syn and eventually α-syn oligomers. The
presence of these pathogenic oligomers inhibits endoplasmic trafficking of the
LIMP2/GCase complex to the Golgi apparatus and ultimately to the lysosome.141,142
Chapter 1 - Introduction
41
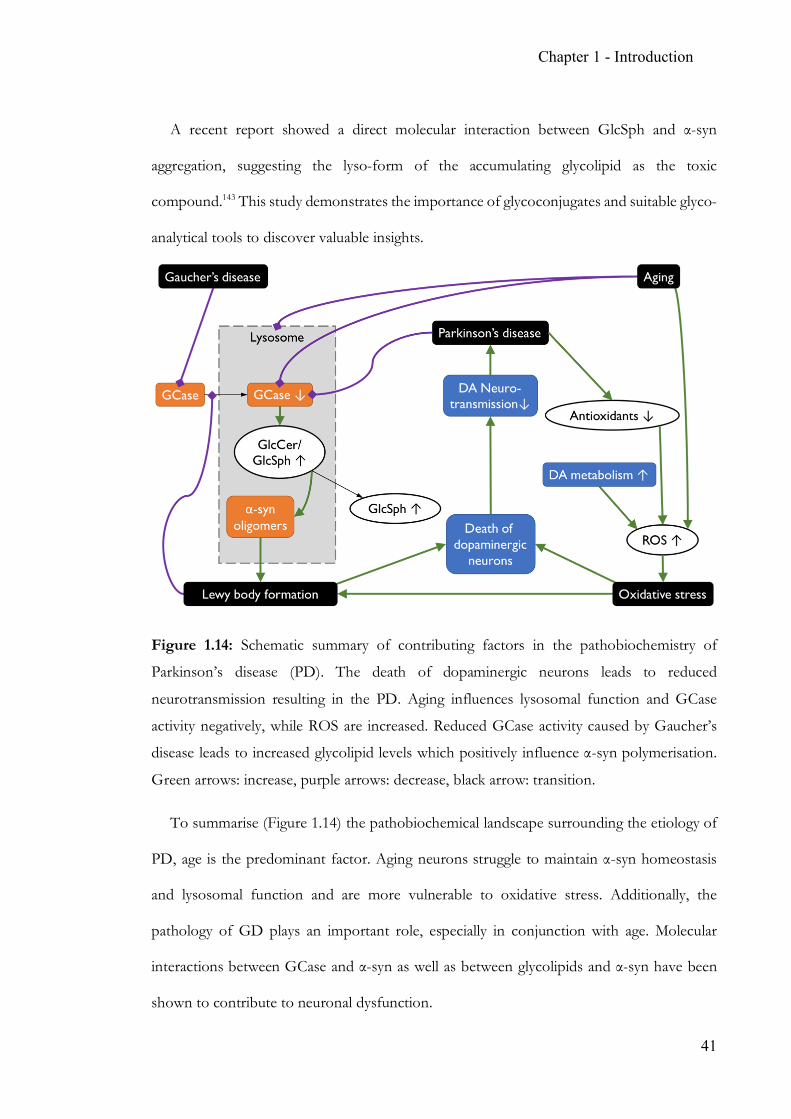
A recent report showed a direct molecular interaction between GlcSph and α-syn
aggregation, suggesting the lyso-form of the accumulating glycolipid as the toxic
compound.143 This study demonstrates the importance of glycoconjugates and suitable glyco-
analytical tools to discover valuable insights.
Figure 1.14: Schematic summary of contributing factors in the pathobiochemistry of
Parkinson’s disease (PD). The death of dopaminergic neurons leads to reduced
neurotransmission resulting in the PD. Aging influences lysosomal function and GCase
activity negatively, while ROS are increased. Reduced GCase activity caused by Gaucher’s
disease leads to increased glycolipid levels which positively influence α-syn polymerisation.
Green arrows: increase, purple arrows: decrease, black arrow: transition.
To summarise (Figure 1.14) the pathobiochemical landscape surrounding the etiology of
PD, age is the predominant factor. Aging neurons struggle to maintain α-syn homeostasis
and lysosomal function and are more vulnerable to oxidative stress. Additionally, the
pathology of GD plays an important role, especially in conjunction with age. Molecular
interactions between GCase and α-syn as well as between glycolipids and α-syn have been
shown to contribute to neuronal dysfunction.
Chapter 1 - Introduction
42
1.4 References
1. Varki, A., Cummings, R. D. & Esko, J. D. Essentials of Glycobiology, 3rd edition. (Cold
Spring Harbor Laboratory Press, 2017).
2. Yu, H. & Chen, X. Carbohydrate post-glycosylational modifications. Org. Biomol.
Chem. 5, 865–872 (2007).
3. Spiro, R. G. Protein glycosylation: nature, distribution, enzymatic formation, and
disease implications of glycopeptide bonds. Glycobiology 12, 43R–56R (2002).
4. Dell, A., Galadari, A., Sastre, F. & Hitchen, P. Similarities and differences in the
glycosylation mechanisms in prokaryotes and eukaryotes. International Journal of
Microbiology 2010, 1–14 (2010).
5. Apweiler, R., Hermjakob, H. & Sharon, N. On the frequency of protein glycosylation,
as deduced from analysis of the SWISS-PROT database. Biochim. Biophys. Acta - Gen.
Subj. 1473, 4–8 (1999).
6. Maverakis, E. et al. Glycans in the immune system and The Altered Glycan Theory of
Autoimmunity: A critical review. J. Autoimmun. 57, 1–13 (2015).
7. Sperandio, M., Gleissner, C. A. & Ley, K. Glycosylation in immune cell trafficking.
Immunological Reviews 230, 97–113 (2009).
8. Morris, H. R. et al. Gender-specific glycosylation of human glycodelin affects its
contraceptive activity. J. Biol. Chem. 271, 32159–32167 (1996).
9. Schröter, S., Osterhoff, C., McArdle, W. & Ivell, R. The glycocalyx of the sperm
surface. in Human Reproduction Update 5, 302–313 (1999).
10. Fukuda, M. N. & Akama, T. O. In vivo role of α-mannosidase IIx: Ineffective
spermatogenesis resulting from targeted disruption of the Man2a2 in the mouse.
Biochimica et Biophysica Acta - General Subjects 1573, 382–387 (2002).
11. Paszek, M. J. et al. The cancer glycocalyx mechanically primes integrin-mediated
growth and survival. Nature 511, 319–325 (2014).
12. Bones, J., Mittermayr, S., O’Donoghue, N., Guttman, A. & Rudd, P. M. Ultra
Performance Liquid Chromatographic Profiling of Serum N -Glycans for Fast and
Efficient Identification of Cancer Associated Alterations in Glycosylation. Anal. Chem.
82, 10208–10215 (2010).
13. Chen, Y.-T. et al. Identification of novel tumor markers for oral squamous cell
carcinoma using glycoproteomic analysis. Clin. Chim. Acta 420, 45–53 (2013).
Chapter 1 - Introduction
43
14. Lauc, G. et al. Loci Associated with N-Glycosylation of Human Immunoglobulin G
Show Pleiotropy with Autoimmune Diseases and Haematological Cancers. PLoS
Genet. 9, (2013).
15. Bull, C. et al. Targeting Aberrant Sialylation in Cancer Cells Using a Fluorinated Sialic
Acid Analog Impairs Adhesion, Migration, and In Vivo Tumor Growth. Mol. Cancer
Ther. 12, 1935–1946 (2013).
16. Wurm, D., Löffler, G., Lindinger, A. & Gortner, L. Congenital disorders of
glycosylation type Ia as a cause of mirror syndrome. J. Perinatol. 27, 802–804 (2007).
17. Yamashita, T., Wada, R. & Proia, R. L. Early developmental expression of the gene
encoding glucosylceramide synthase, the enzyme controlling the first committed step
of glycosphingolipid synthesis. Biochim. Biophys. Acta - Gen. Subj. 1573, 236–240 (2002).
18. Yu, R. K., Tsai, Y. T. & Ariga, T. Functional roles of gangliosides in
Neurodevelopment: An overview of recent advances. Neurochemical Research 37, 1230–
1244 (2012).
19. Schengrund, C. L. ‘Multivalent’ saccharides: Development of new approaches for
inhibiting the effects of glycosphingolipid-binding pathogens. Biochemical Pharmacology
65, 699–707 (2003).
20. Schnaar, R. L. Brain gangliosides in axon-myelin stability and axon regeneration.
FEBS Letters 584, 1741–1747 (2010).
21. Yoon, S.-J., Nakayama, K., Hikita, T., Handa, K. & Hakomori, S. Epidermal growth
factor receptor tyrosine kinase is modulated by GM3 interaction with N-linked
GlcNAc termini of the receptor. Proc. Natl. Acad. Sci. U. S. A. 103, 18987–18991
(2006).
22. Inokuchi, J. I. GM3 and diabetes. Glycoconjugate Journal 31, 193–197 (2014).
23. Lombard, V., Golaconda Ramulu, H., Drula, E., Coutinho, P. M. & Henrissat, B. The
carbohydrate-active enzymes database (CAZy) in 2013. Nucleic Acids Res. 42, (2014).
24. Sinnott, M. L. Catalytic Mechanisms of Enzymic Glycosyl Transfer. Chem. Rev. 90,
1171–1202 (1990).
25. Zhang, R., Yip, V. L. Y., Withers, S. G. & Columbia, B. Mechanisms of enzymatic
glycosyl transfer. Compr. Nat. Prod. II Chem. Biol. 385–422 (2010).
26. Leloir, L. F. & Cardini, C. E. Biosynthesis of glycogen from uridine diphosphate
glucose. J. Am. Chem. Soc. 79, 6340–6341 (1957).
27. Ghose, T. K. Measurement of cellulase activities. Pure Appl. Chem. 59, (1987).
Chapter 1 - Introduction
44
28. Johnson, L. N. The early history of lysozyme. Nature Structural Biology 5, 942–944
(1998).
29. Chundawat, S. P. S., Beckham, G. T., Himmel, M. E. & Dale, B. E. Deconstruction
of Lignocellulosic Biomass to Fuels and Chemicals. Annu. Rev. Chem. Biomol. Eng. 2,
121–45 (2011).
30. Carvalho, D. M. & Colodette, J. L. Comparative study of acid hydrolysis of lignin and
polysaccharides in biomasses. BioResources 12, 6907–6923 (2017).
31. Barb, A. W. & Prestegard, J. H. NMR analysis demonstrates immunoglobulin G N-
glycans are accessible and dynamic. Nat. Chem. Biol. 7, 147–153 (2011).
32. Lundborg, M. & Widmalm, G. Structural analysis of glycans by NMR chemical shift
prediction. Anal. Chem. 83, 1514–1517 (2011).
33. Vliegenthart, J. F. G., Dorland, L. & van Halbeek, H. High-resolution, 1H-Nuclear
magnetic resonance spectroscopy as a tool in the structural analysis of carbohydrates
related to glycoproteins. Adv. Carbohydr. Chem. Biochem. 41, 209–374 (1983).
34. Jansson, P.-E., Kenne, L. & Widmalm, G. Casper—a computerised approach to
structure determination of polysaccharides using information from n.m.r.
spectroscopy and simple chemical analyses. Carbohydr. Res. 168, 67–77 (1987).
35. van Halbeek, H. in (eds. Grant, D. M. & Harris, R. K.) 1107–1137 (John Wiley &
Sons Ltd, 1996).
36. van Kuik, J. A., Hard, K. & Vliegenthart, J. F. A 1H NMR database computer program
for the analysis of the primary structure of complex carbohydrates. Carbohydr. Res. 235,
53–68 (1992).
37. Doubet, S., Bock, K., Smith, D., Darvill, A. & Albersheim, P. The complex
carbohydrate structure database. Trends Biochem. Sci. 14, 475–477 (1989).
38. Curatolo, W., Neuringer, L. J., Ruben, D. & Haberkorn, R. Two-dimensional J-
resolved 1H-nuclear magnetic resonance spectroscopy of α,β-d-glucose at 500 MHz.
Carbohydr. Res. 112, 297–300 (1983).
39. Cancilla, M. T., Penn, S. G., Carroll, J. A. & Lebrilla, C. B. Coordination of Alkali
Metals to Oligosaccharides Dictates Fragmentation Behavior in Matrix Assisted Laser
Desorption Ionization / Fourier Transform Mass Spectrometry. J. Am. Chem. Soc. 118,
6736–6745 (1996).
Chapter 1 - Introduction
45
40. Hunnam, V. et al. Ionization and fragmentation of neutral and acidic
glycosphingolipids with a Q-TOF mass spectrometer fitted with a MALDI ion source.
J. Am. Soc. Mass Spectrom. 12, 1220–1225 (2001).
41. Fenn, J. B., Mann, M., Meng, C. K., Wong, S. F. & Whitehouse, C. M. Electrospray
ionization for mass spectrometry of large biomolecules. Science (80-. ). 246, 64–71
(1989).
42. Yamashita, M. & Fenn, J. B. Electrospray ion source. Another variation on the free-
jet theme. J. Phys. Chem. 88, 4451–4459 (1984).
43. Watson, J. T. & Sparkman, O. D. Introduction to Mass Spectrometry. Introduction to Mass
Spectrometry: Instrumentation, Applications and Strategies for Data Interpretation: Fourth Edition
(John Wiley & Sons, Ltd, 2007).
44. Kebarle, P. & Verkcerk, U. H. Electrospray: From Ions in solution to Ions in the gas
phase, what we know now. Mass Spectrom. Rev. 28, 898–917 (2009).
45. Konermann, L., Ahadi, E., Rodriguez, A. D. & Vahidi, S. Unraveling the mechanism
of electrospray ionization. Anal. Chem. 85, 2–9 (2013).
46. Iribarne, J. V. On the evaporation of small ions from charged droplets. J. Chem. Phys.
64, 2287 (1976).
47. Fernandez De La Mora, J. Electrospray ionization of large multiply charged species
proceeds via Dole’s charged residue mechanism. Anal. Chim. Acta 406, 93–104 (2000).
48. Karas, M., Glückmann, M. & Schäfer, J. Ionization in matrix-assisted laser
desorption/ionization: Singly charged molecular ions are the lucky survivors. J. Mass
Spectrom. 35, 1–12 (2000).
49. El-Aneed, A., Cohen, A. & Banoub, J. Mass spectrometry, review of the basics:
Electrospray, MALDI, and commonly used mass analyzers. Applied Spectroscopy Reviews
44, 210–230 (2009).
50. Knochenmuss, R. Ion formation mechanisms in UV-MALDI. Analyst 131, 966 (2006).
51. Miller, P. E. & Denton, M. B. The quadrupole mass filter: Basic operating concepts.
J. Chem. Educ. 63, 617 (1986).
52. Wiley, W. C. & McLaren, I. H. Time-of-flight mass spectrometer with improved
resolution. Rev. Sci. Instrum. 26, 1150–1157 (1955).
53. Mason, E. A. & Schamp, H. W. Mobility of Gaseous Ions in Weak Electric Fields.
Ann. Phys. 4, 233–270 (1958).

Chapter 1 - Introduction
46
54. Giles, K. et al. Applications of a travelling wave-based radio-frequency-only stacked
ring ion guide. Rapid Commun. Mass Spectrom. 18, 2401–2414 (2004).
55. Shvartsburg, A. A. & Smith, R. D. Fundamentals of traveling wave ion mobility
spectrometry. Anal. Chem. 80, 9689–9699 (2008).
56. Both, P. et al. Discrimination of epimeric glycans and glycopeptides using IM-MS and
its potential for carbohydrate sequencing. Nat. Chem. 6, 65–74 (2013).
57. Hofmann, J., Hahm, H. S., Seeberger, P. H. & Pagel, K. Identification of carbohydrate
anomers using ion mobility–mass spectrometry. Nature (2015).
58. Blixt, O. et al. Printed covalent glycan array for ligand profiling of diverse glycan
binding proteins. Proc. Natl. Acad. Sci. U. S. A. 101, 17033–17038 (2004).
59. Oyelaran, O. & Gildersleeve, J. C. Glycan arrays: recent advances and future
challenges. Current Opinion in Chemical Biology 13, 406–413 (2009).
60. Lundquist, J. J. & Toone, E. J. The cluster glycoside effect. Chem. Rev. 102, 555–578
(2002).
61. Tang, P. W., Gool, H. C., Hardy, M., Lee, Y. C. & Felzi, T. Novel approach to the
study of the antigenicities and receptor functions of carbohydrate chains of
glycoproteins. Biochem. Biophys. Res. Commun. 132, 474–480 (1985).
62. Roy, R. Syntheses and some applications of chemically defined multivalent
glycoconjugates. Current Opinion in Structural Biology 6, 692–702 (1996).
63. Gray, C. J. et al. Label-Free Discovery Array Platform for the Characterization of
Glycan Binding Proteins and Glycoproteins. Anal. Chem. 89, 4444–4451 (2017).
64. Love, J. C., Estroff, L. A., Kriebel, J. K., Nuzzo, R. G. & Whitesides, G. M. Self-
assembled monolayers of thiolates on metals as a form of nanotechnology. Chemical
Reviews 105, 1103–1169 (2005).
65. Kuno, A. et al. Evanescent-field fluorescence-assisted lectin microarray: A new
strategy for glycan profiling. Nat. Methods 2, 851–856 (2005).
66. Pilobello, K. T., Krishnamoorthy, L., Slawek, D. & Mahal, L. K. Development of a
lectin microarray for the rapid analysis of protein glycopatterns. ChemBioChem 6, 985–
989 (2005).
67. Qian, X. et al. Arrays of self-assembled monolayers for studying inhibition of bacterial
adhesion. Anal. Chem. 74, 1805–1810 (2002).
68. Bundy, J. & Fenselau, C. Lectin-based affinity capture for MALDI-MS analysis of
bacteria. Anal. Chem. 71, 1460–1463 (1999).
Chapter 1 - Introduction
47
69. Sanchez-Ruiz, A., Serna, S., Ruiz, N., Martin-Lomas, M. & Reichardt, N. C. MALDI-
TOF mass spectrometric analysis of enzyme activity and lectin trapping on an array
of N-glycans. Angew. Chemie - Int. Ed. 50, 1801–1804 (2011).
70. Serna, S., Yan, S., Martin-Lomas, M., Wilson, I. B. H. & Reichardt, N. C.
Fucosyltransferases as synthetic tools: Glycan array based substrate selection and core
fucosylation of synthetic N-glycans. J. Am. Chem. Soc. 133, 16495–16502 (2011).
71. Blixt, O. et al. Glycan microarrays for screening sialyltransferase specificities. Glycoconj.
J. 25, 59–68 (2008).
72. Šardzík, R. et al. Chemoenzymatic synthesis of O-mannosylpeptides in solution and
on solid phase. J. Am. Chem. Soc. 134, 4521–4 (2012).
73. Beloqui, A., Sanchez-Ruiz, A., Martin-Lomas, M. & Reichardt, N.-C. A surface-based
mass spectrometry method for screening glycosidase specificity in environmental
samples. Chem. Commun. 48, 1701–1703 (2012).
74. Rudd, P. M. et al. Oligosaccharide sequencing technology. Nature 388, 205–207 (1997).
75. Lareau, N. M., May, J. C. & McLean, J. A. Non-derivatized glycan analysis by reverse
phase liquid chromatography and ion mobility-mass spectrometry. Analyst 140, 3335–
3338 (2015).
76. Vanderschaeghe, D., Festjens, N., Delanghe, J. & Callewaert, N. Glycome profiling
using modern glycomics technology: Technical aspects and applications. Biological
Chemistry 391, 149–161 (2010).
77. Campbell, M. P., Royle, L., Radcliffe, C. M., Dwek, R. A. & Rudd, P. M. GlycoBase
and autoGU: Tools for HPLC-based glycan analysis. Bioinformatics 24, 1214–1216
(2008).
78. Royle, L. et al. HPLC-based analysis of serum N-glycans on a 96-well plate platform
with dedicated database software. Anal. Biochem. 376, 1–12 (2008).
79. Bigge, J. C. et al. Nonselective and Efficient Fluorescent Labeling of Glycans Using 2-
Amino Benzamide and Anthranilic Acid. Anal. Biochem. 230, 229–238 (1995).
80. Hase, S. Pyridylamination as a means of analyzing complex sugar chains. Proc. Jpn.
Acad. Ser. B. Phys. Biol. Sci. 86, 378–390 (2010).
81. Buszewski, B. & Noga, S. Hydrophilic interaction liquid chromatography (HILIC)-a
powerful separation technique. Anal Bioanal Chem 402, 231–247 (2012).
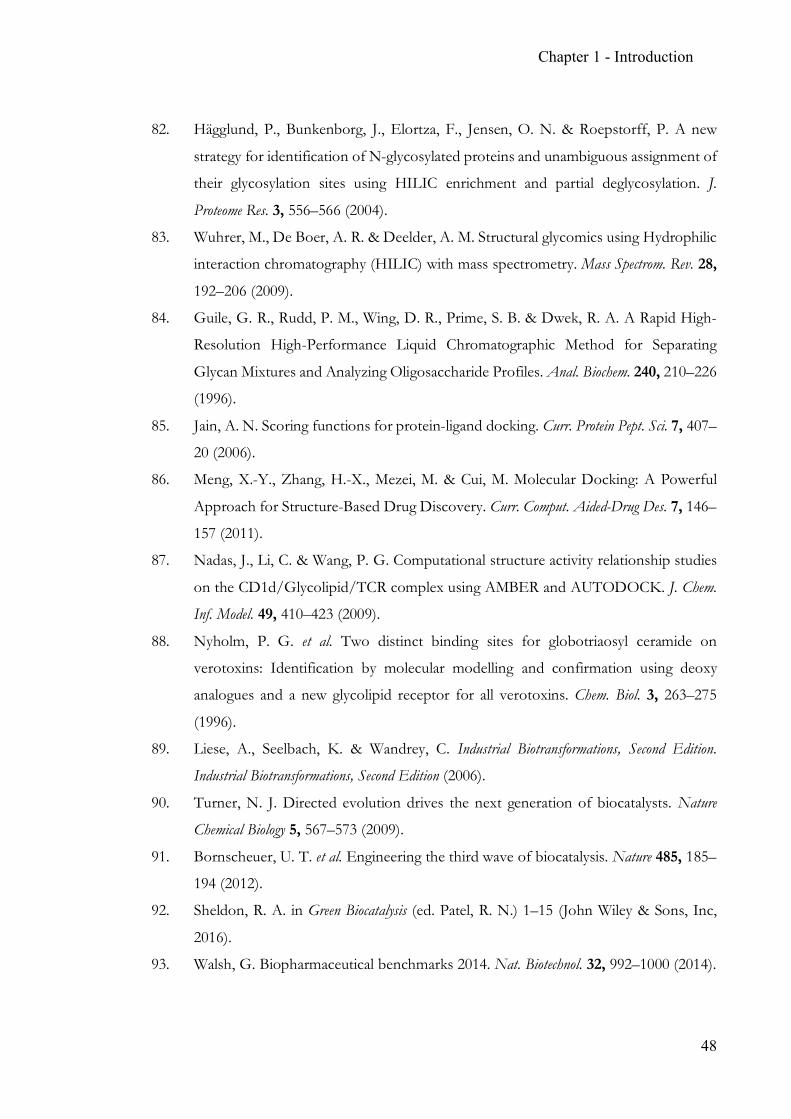
Chapter 1 - Introduction
48
82. Hägglund, P., Bunkenborg, J., Elortza, F., Jensen, O. N. & Roepstorff, P. A new
strategy for identification of N-glycosylated proteins and unambiguous assignment of
their glycosylation sites using HILIC enrichment and partial deglycosylation. J.
Proteome Res. 3, 556–566 (2004).
83. Wuhrer, M., De Boer, A. R. & Deelder, A. M. Structural glycomics using Hydrophilic
interaction chromatography (HILIC) with mass spectrometry. Mass Spectrom. Rev. 28,
192–206 (2009).
84. Guile, G. R., Rudd, P. M., Wing, D. R., Prime, S. B. & Dwek, R. A. A Rapid High-
Resolution High-Performance Liquid Chromatographic Method for Separating
Glycan Mixtures and Analyzing Oligosaccharide Profiles. Anal. Biochem. 240, 210–226
(1996).
85. Jain, A. N. Scoring functions for protein-ligand docking. Curr. Protein Pept. Sci. 7, 407–
20 (2006).
86. Meng, X.-Y., Zhang, H.-X., Mezei, M. & Cui, M. Molecular Docking: A Powerful
Approach for Structure-Based Drug Discovery. Curr. Comput. Aided-Drug Des. 7, 146–
157 (2011).
87. Nadas, J., Li, C. & Wang, P. G. Computational structure activity relationship studies
on the CD1d/Glycolipid/TCR complex using AMBER and AUTODOCK. J. Chem.
Inf. Model. 49, 410–423 (2009).
88. Nyholm, P. G. et al. Two distinct binding sites for globotriaosyl ceramide on
verotoxins: Identification by molecular modelling and confirmation using deoxy
analogues and a new glycolipid receptor for all verotoxins. Chem. Biol. 3, 263–275
(1996).
89. Liese, A., Seelbach, K. & Wandrey, C. Industrial Biotransformations, Second Edition.
Industrial Biotransformations, Second Edition (2006).
90. Turner, N. J. Directed evolution drives the next generation of biocatalysts. Nature
Chemical Biology 5, 567–573 (2009).
91. Bornscheuer, U. T. et al. Engineering the third wave of biocatalysis. Nature 485, 185–
194 (2012).
92. Sheldon, R. A. in Green Biocatalysis (ed. Patel, R. N.) 1–15 (John Wiley & Sons, Inc,
2016).
93. Walsh, G. Biopharmaceutical benchmarks 2014. Nat. Biotechnol. 32, 992–1000 (2014).
Chapter 1 - Introduction
49
94. Hossler, P., Khattak, S. F. & Li, Z. J. Optimal and consistent protein glycosylation in
mammalian cell culture. Glycobiology 19, 936–949 (2009).
95. Higgins, E. Carbohydrate analysis throughout the development of a protein
therapeutic. Glycoconjugate Journal 27, 211–225 (2010).
96. Hossler, P., Mulukutla, B. C. & Hu, W. S. Systems analysis of N-glycan processing in
mammalian cells. PLoS One 2, (2007).
97. Baik, J. Y. et al. Metabolic engineering of Chinese hamster ovary cells: Towards a
bioengineered heparin. Metab. Eng. 14, 81–90 (2012).
98. Del Val, I. J., Polizzi, K. M. & Kontoravdi, C. A theoretical estimate for nucleotide
sugar demand towards Chinese Hamster Ovary cellular glycosylation. Sci. Rep. 6,
(2016).
99. Thomann, M. et al. In vitro glycoengineering of IgG1 and its effect on Fc receptor
binding and ADCC activity. PLoS One 10, (2015).
100. Sinclair, A. M. Erythropoiesis stimulating agents: Approaches to modulate activity.
Biologics: Targets and Therapy 7, 161–174 (2013).
101. Yang, W. H. et al. An intrinsic mechanism of secreted protein aging and turnover. Proc.
Natl. Acad. Sci. 112, 13657–13662 (2015).
102. Solá, R. J. & Griebenow, K. Glycosylation of Therapeutic Proteins: An Effective
Strategy to Optimiza Efficacy. BioDrugs 24, 9–21 (2011).
103. Chung, C. H. et al. Cetuximab-Induced Anaphylaxis and IgE Specific for Galactose-
α-1,3-Galactose. N. Engl. J. Med. 358, 1109–1117 (2008).
104. Mimura, Y. et al. Glycosylation engineering of therapeutic IgG antibodies: challenges
for the safety, functionality and efficacy. Protein Cell 1–16 (2017).
105. Takeuchi, M. et al. Comparative study of the asparagine-linked sugar chains of human
erythropoietins purified from urine and the culture medium of recombinant Chinese
hamster ovary cells. J. Biol. Chem. 263, 3657–3663 (1988).
106. Zhu, A. & Hurst, R. Anti-N-glycolylneuraminic acid antibodies identified in healthy
human serum. Xenotransplantation 9, 376–381 (2002).
107. Tangvoranuntakul, P. et al. Human uptake and incorporation of an immunogenic
nonhuman dietary sialic acid. Proc. Natl. Acad. Sci. 100, 12045–12050 (2003).
108. de Lau, L. M. & Breteler, M. M. Epidemiology of Parkinson’s disease. Lancet Neurol.
5, 525–535 (2006).
Chapter 1 - Introduction
50
109. Tysnes, O. B. & Storstein, A. Epidemiology of Parkinson’s disease. Journal of Neural
Transmission 124, 901–905 (2017).
110. Parkinson, J. Neuropsychiatry Classics: An essay on the Shaking Palsy. J.
Neuropsychiatry Clin. Neurosci. 14, 223–236 (2002).
111. Chaudhuri, K. R., Healy, D. G. & Schapira, A. H. Non-motor symptoms of
Parkinson’s disease: diagnosis and management. Lancet Neurol. 5, 235–245 (2006).
112. Jankovic, J. Parkinson’s disease: clinical features and diagnosis. J. Neurol. Neurosurg.
Psychiatry 79, 368–76 (2008).
113. Wang, J., Hoekstra, J. G., Zuo, C., Cook, T. J. & Zhang, J. Biomarkers of Parkinson’s
disease: current status and future perspectives. Drug Discov. Today 18, 155–62 (2013).
114. Hunter, K. R., Shaw, K. M., Laurence, D. R. & Stern, G. M. Sustained levodopa
therapy in parkinsonism. Lancet (London, England) 2, 929–31 (1973).
115. Schapira, A. H. V. Progress in neuroprotection in Parkinson’s disease. European Journal
of Neurology 15, 5–13 (2008).
116. Uversky, V. N. Neuropathology, biochemistry, and biophysics of a-synuclein
aggregation. J. Neurochem. 103, 17–37 (2007).
117. Schulz-Schaeffer, W. J. The synaptic pathology of alpha-synuclein aggregation in
dementia with Lewy bodies, Parkinson’s disease and Parkinson’s disease dementia.
Acta Neuropathol. 120, 131–143 (2010).
118. Spina, M. B. & Cohen, G. Dopamine turnover and glutathione oxidation: implications
for Parkinson disease. Proc. Natl. Acad. Sci. U. S. A. 86, 1398–400 (1989).
119. Asanuma, M., Miyazaki, I. & Ogawa, N. Dopamine- or L-DOPA-induced
neurotoxicity: The role of dopamine quinone formation and tyrosinase in a model of
Parkinson’s disease. Neurotox. Res. 5, 165–176 (2003).
120. Zhang, J. et al. Parkinson’s Disease Is Associated with Oxidative Damage to
Cytoplasmic DNA and RNA in Substantia Nigra Neurons. Am. J. Pathol. 154, 1423–
1429 (1999).
121. Napolitano, A., Manini, P. & D’Ischia, M. Oxidation Chemistry of Catecholamines
and Neuronal Degeneration: An Update. Curr. Med. Chem. 18, 1832–1845 (2011).
122. Halliwell, B. Oxidative stress and neurodegeneration: Where are we now? Journal of
Neurochemistry 97, 1634–1658 (2006).
123. Hashimoto, M. et al. Oxidative stress induces amyloid-like aggregate formation of
NACP/α-synuclein in vitro. Neuroreport 10, 717–721 (1999).
Chapter 1 - Introduction
51
124. Schapira, A. H. et al. Perspectives on recent advances in the understanding and
treatment of Parkinson’s disease. European Journal of Neurology 16, 1090–1099 (2009).
125. Schapira, A. H. V et al. Mitochondria in the etiology and pathogenesis of parkinson’s
disease. Ann. Neurol. 44, S89–S98 (1998).
126. Carmona-Gutierrez, D., Hughes, A. L., Madeo, F. & Ruckenstuhl, C. The crucial
impact of lysosomes in aging and longevity. Ageing Research Reviews 32, 2–12 (2016).
127. Rocha, E. M. et al. Progressive decline of glucocerebrosidase in aging and Parkinson’s
disease. Ann. Clin. Transl. Neurol. 2, 433–438 (2015).
128. Dackis, C. A. & Gold, M. S. New concepts in cocaine addiction: The dopamine
depletion hypothesis. Neurosci. Biobehav. Rev. 9, 469–477 (1985).
129. Lloyd, S. A., Faherty, C. J. & Smeyne, R. J. Adult and in utero exposure to cocaine
alters sensitivity to the parkinsonian toxin 1-methyl-4-phenyl-1,2,3,6-
tetrahydropyridine. Neuroscience 137, 905–913 (2006).
130. Zarranz, J. J. et al. The new mutation, E46K, of alpha-synuclein causes Parkinson and
Lewy body dementia. Ann. Neurol. 55, 164–73 (2004).
131. Appel-Cresswell, S. et al. Alpha-synuclein p.H50Q, a novel pathogenic mutation for
Parkinson’s disease. Mov. Disord. 28, 811–813 (2013).
132. Aharon-Peretz, J., Rosenbaum, H. & Gershoni-Baruch, R. Mutations in the
glucocerebrosidase gene and Parkinson’s disease in Ashkenazi Jews. N. Engl. J. Med.
351, 1972–7 (2004).
133. Jmoudiak, M. & Futerman, A. H. Gaucher disease: pathological mechanisms and
modern management. Br. J. Haematol. 129, 178–88 (2005).
134. Sidransky, E. et al. Multicenter Analysis of Glucocerebrosidase Mutations in
Parkinson’s Disease. N. Engl. J. Med. 361, 1651–1661 (2009).
135. Bras, J. et al. Complete screening for glucocerebrosidase mutations in Parkinson
disease patients from Portugal. Neurobiol. Aging 30, 1515–1517 (2009).
136. Neumann, J. et al. Glucocerebrosidase mutations in clinical and pathologically proven
Parkinson’s disease. Brain 132, 1783–1794 (2009).
137. Murphy, K. E. et al. Reduced glucocerebrosidase is associated with increased -
synuclein in sporadic Parkinson’s disease. Brain 137, 834–848 (2014).
138. Narita, A. et al. Ambroxol chaperone therapy for neuronopathic Gaucher disease: A
pilot study. Ann. Clin. Transl. Neurol. 3, 200–215 (2016).
Chapter 1 - Introduction
52
139. Mistry, P. K. et al. Gaucher disease: Progress and ongoing challenges. Molecular Genetics
and Metabolism 120, 8–21 (2017).
140. Cantuti-Castelvetri, L. & Bongarzone, E. R. Synaptic failure: The achilles tendon of
sphingolipidoses. J. Neurosci. Res. 94, 1031–1036 (2016).
141. Mazzulli, J. R. et al. Gaucher disease glucocerebrosidase and α-synuclein form a
bidirectional pathogenic loop in synucleinopathies. Cell 146, 37–52 (2011).
142. Mazzulli, J. R., Zunke, F., Isacson, O., Studer, L. & Krainc, D. alpha-Synuclein-
induced lysosomal dysfunction occurs through disruptions in protein trafficking in
human midbrain synucleinopathy models. Proc Natl Acad Sci U S A (2016).
143. Taguchi, Y. V. et al. Glucosylsphingosine Promotes α-Synuclein Pathology in Mutant
GBA-Associated Parkinson’s Disease. J. Neurosci. 37, 9617–9631 (2017).
53
Chapter 2 Objectives of this thesis
This thesis aims to provide enhanced analytical tools to study carbohydrates and their
functional biology as well as their application in biotechnology. In particular, three specific
biotechnological objectives are addressed as described in Chapters 3, 4 and 5, while a novel
perspective on down-stream effects of CAZyme dysfunction within neurotoxcicity is
presented in chapter six.
2.1 Simple, quantitative and non-destructive GOase assay
Galactose Oxidase (GOase; EC 1.1.3.9) is an oxygen-dependent single copper enzyme
that oxidises the primary hydroxyl group in terminal carbohydrates. It has applications
ranging from glycan labelling to synthetic carbohydrate chemistry.
Previously, a glucoside-specific variant GOase F2 has been developed through means of
directed evolution by Rannes et al.b However, soluble expression of the enzyme in E. coli is
low-yielding and reaction monitoring requires either an enzymatic cascade reaction to detect
hydrogen peroxide production or time-consuming HPLC analysis which additionally
requires either derivatisation or non-quantitative mass spectrometry.
Chapter 3 describes the development of a simple 1H-NMR screen to provide structural
information on the regiospecific oxidation of mono- and oligo-saccharides. Signal intensity
of characteristic protons can be quantitative and the experimental set-up, unlike mass
spectrometry, allows for material recovery. A route to industrially relevant oxidation
protocols is presented utilising model compounds.
b Rannes, J. B.; Ioannou, A.; Willies, S. C.; Grogan, G.; Behrens, C.; Flitsch, S. L.; Turner, N. J.
J. Am. Chem. Soc. 2011, 133 (22), 8436–8439.
Chapter 2 - Objectives
54
2.2 Carbohydrate arrays for fast and sensitive hydrolase
characterisation
Industrial biotechnology that relies on sustainable feed stocks is limited by the availability
of well-characterised hydrolytic enzymes that degrade plant-based lignocellulose to simpler
carbohydrates. Sequencing of microbial genome sequencing has revealed numerous putative
carbohydrate active enzymes (CAZymes). However, biochemical characterisation of these
enzymes is key to their successful implementation in industrial processes. In order to rapidly
gain an understanding of the substrate scope of candidate enzymes, fast and sensitive high-
throughput methods are required.
The manuscript in Chapter 4 describes the development and application of carbohydrate
arrays coupled with MALDI-ToF MS to profile CAZyme activities from Aspergillus niger
towards specific libraries of oligo-saccharides from commercial and natural sources on mixed
glycan arrays.
2.3 Completing the N-acetylneuraminic acid toolkit
The group of complex glycoconjugates in human biology consists of not only glycolipids
(see Chapter 5) but also peptidoglycans and proteoglycans (e.g. extracellular matrix),
glycosides (e.g. glycogen or DNA) and glycoproteins (N-glycosylation). Structurally, this
group is very diverse with different monomers as well as regio- and stereo-chemical
variations of individual linkages. In order to a) analyse and b) manipulate this challenging
chemistry, dedicated CAZymes with specific activities are required to complement traditional
analytical tools. Unfortunately, the portfolio of available specific glycosidases is incomplete.
In humans the N-glycans, regioisomers α2,6- or α2,3-sialic acid (Neu5Ac) linked to
galactosides are found to convey distinct information. Hence, the sialylation state of glycans
especially in therapy is of great importance.
Chapter 2 - Objectives
55
The manuscript presented in Chapter 5 addresses the gap in the toolbox of Neu5Ac active
enzymes by adding a highly specific α2,6-selective ‘pseudosialidase’ and show-cases its
applicability in glycan-engineering setups.
2.4 Glycolipids in Parkinson’s disease
The pathology of Parkinson’s disease (PD), responsible for the rapid death of
dopaminergic neurons, is not fully understood and a cure remains elusive. Currently, L-Dopa
treatment is the best option for patients but only acts to reduce severity of the symptoms.
Furthermore, an early diagnosis of PD is essential for successful therapy.
While many biomarker studies have been completed, neurologists still rely on symptom-
based diagnosis. Sufferers of Gaucher’s disease (GD) have a predisposition towards early-
onset PD. GD affects the lysosomal enzyme β-glucosylcerebrosidase (GCase) resulting in
the accumulation of glycolipids. The empirical connection between the two pathologies has
been the subject of numerous academic studies mainly focussing on the interaction between
GCase, reduced lysosomal activity and α-synuclein fibril formation.
In Chapter 6 the correlation between glycolipids and dopamine homeostasis in PD is
analysed from a new perspective and a mechanism is proposed to further elucidate the
pathobiochemistry.
56
Chapter 3 Simple, quantitative and non-destructive
Galactose Oxidase assay
3.1 Summary
Galactose oxidase is a potent tool in synthetic carbohydrate chemistry because of its
unique ability to regio-selectively introduce versatile carbonyl motifs into carbohydrates. The
expression of the glucoside-adapted F2 variant has been improved and specific oxidations
of target compounds were monitored by NMR. The industrial applicability was demonstrated
using scale-up oxidations of lactose.
The work presented in this chapter is in progress and prepared for submission to
ChemBioChem. See Chapter 7 for planned future experiments supporting the relevance of
this work.
3.2 Contribution
Drs Peter Both & Susanne Herter performed codon optimisation and sub-cloning, SH
established expression and purification methodology, MR expressed and purified protein for
the experiments presented, MR designed and performed analytical experiments, SH helped
with data interpretation, target molecules were suggested by MR and discussed with BASF
SE, Germany as industrial partner. MR wrote the manuscript.
Chapter 3 - Galactose Oxidase
57
3.3 Introduction
Galactose Oxidase (GOase; EC 1.1.3.9) is an oxygen-dependent single copper enzyme
secreted by various fungi and was discovered in Fusarium sp. formerly known as Polyporus
circinatus and Gibberella zeae.1 It catalyses the oxidation of primary alcohols (RCH2OH),
especially hexoses, to aldehydes converting molecular oxygen to hydrogen peroxide. Its
unusual mechanism caused it to be studied intensively.2
RCH2OH+O2→RCHO+H2O2
The redox chemistry performed by Galactose Oxidase (GOase) is facilitated by a well-
described copper(II)-tyrosyl radical. This radical is based on the post- translational formation
of a tyrosinate ligand consisting of a tyrosine residue (Y272) covalently linked to a nearby
cysteine (C228).3 Tryptophan (W290) stabilises this unusual radical within the active site. The
self-processing formation of this redox cofactor requires only the apoprotein, copper and
oxygen.4,5
The copper ion in the active site (Figure 3.1) is coordinated by four amino acid side chains:
tyrosine (Y495), the tyrosyl radical (Y272/C228) and two histidines (H496 and H581) as well
as water in the inactive state or the substrate during binding respectively.6
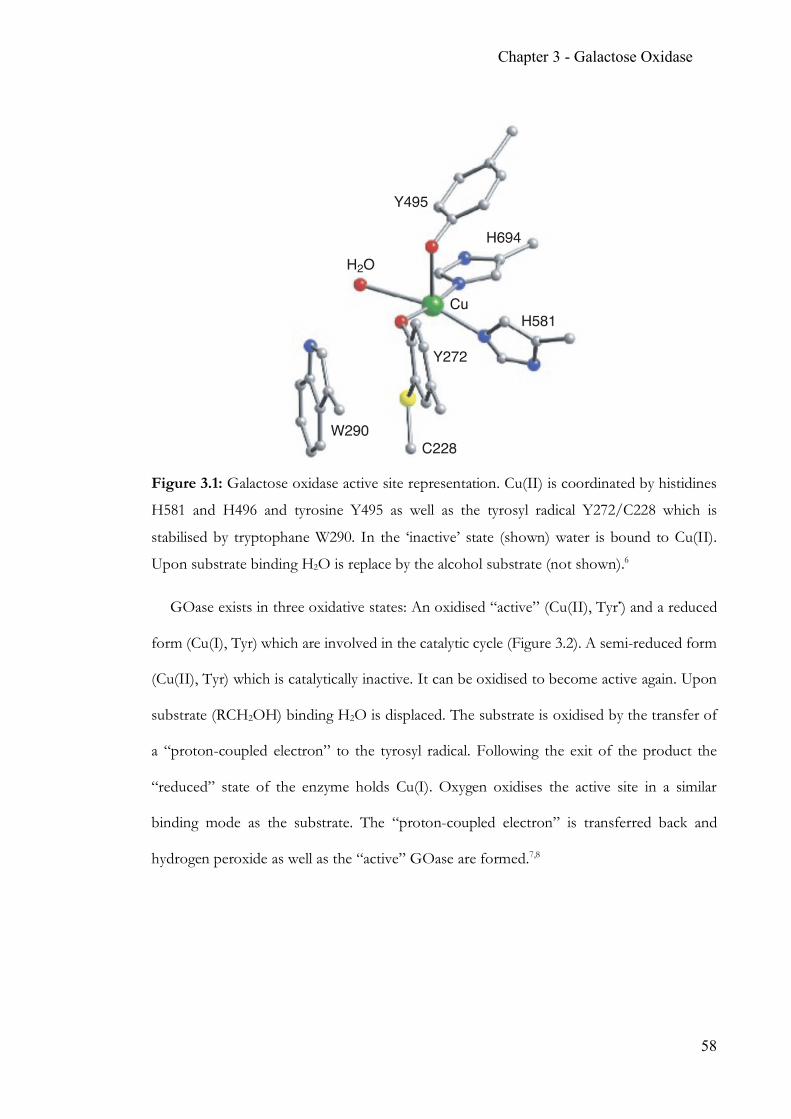
Chapter 3 - Galactose Oxidase
58
Figure 3.1: Galactose oxidase active site representation. Cu(II) is coordinated by histidines
H581 and H496 and tyrosine Y495 as well as the tyrosyl radical Y272/C228 which is
stabilised by tryptophane W290. In the ‘inactive’ state (shown) water is bound to Cu(II).
Upon substrate binding H2O is replace by the alcohol substrate (not shown).6
GOase exists in three oxidative states: An oxidised “active” (Cu(II), Tyr•) and a reduced
form (Cu(I), Tyr) which are involved in the catalytic cycle (Figure 3.2). A semi-reduced form
(Cu(II), Tyr) which is catalytically inactive. It can be oxidised to become active again. Upon
substrate (RCH2OH) binding H2O is displaced. The substrate is oxidised by the transfer of
a “proton-coupled electron” to the tyrosyl radical. Following the exit of the product the
“reduced” state of the enzyme holds Cu(I). Oxygen oxidises the active site in a similar
binding mode as the substrate. The “proton-coupled electron” is transferred back and
hydrogen peroxide as well as the “active” GOase are formed.7,8
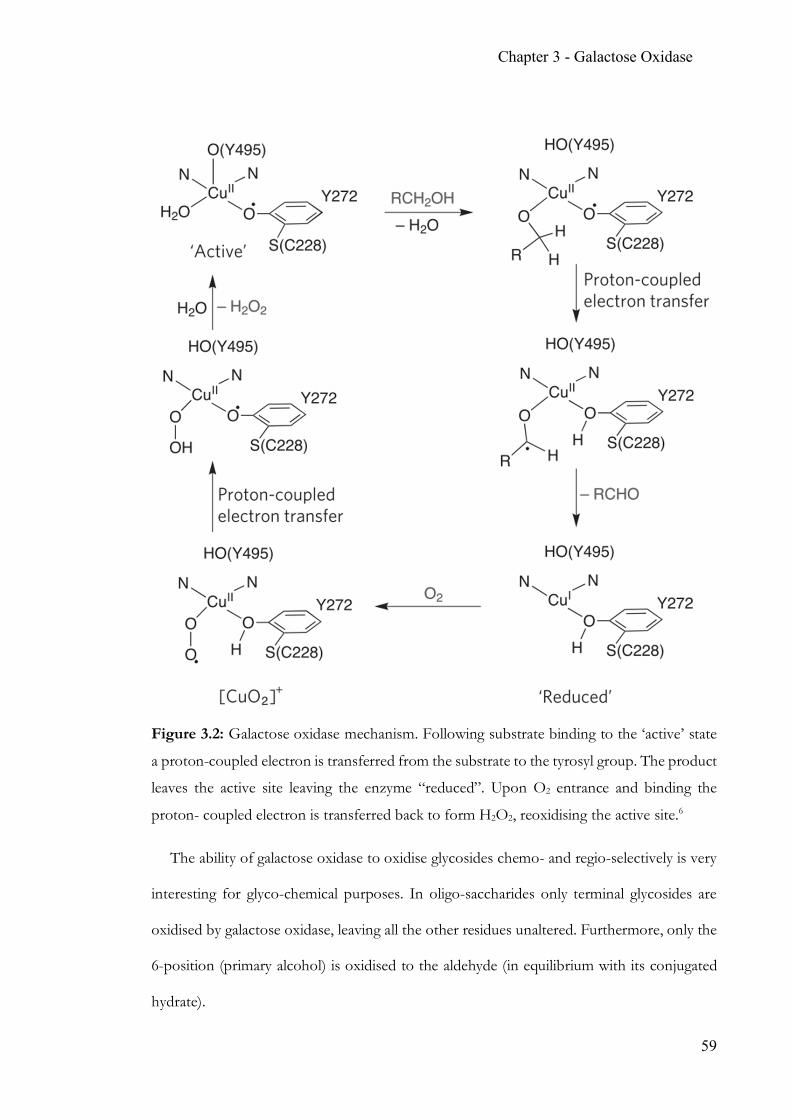
Chapter 3 - Galactose Oxidase
59
Figure 3.2: Galactose oxidase mechanism. Following substrate binding to the ‘active’ state
a proton-coupled electron is transferred from the substrate to the tyrosyl group. The product
leaves the active site leaving the enzyme “reduced”. Upon O2 entrance and binding the
proton- coupled electron is transferred back to form H2O2, reoxidising the active site.6
The ability of galactose oxidase to oxidise glycosides chemo- and regio-selectively is very
interesting for glyco-chemical purposes. In oligo-saccharides only terminal glycosides are
oxidised by galactose oxidase, leaving all the other residues unaltered. Furthermore, only the
6-position (primary alcohol) is oxidised to the aldehyde (in equilibrium with its conjugated
hydrate).
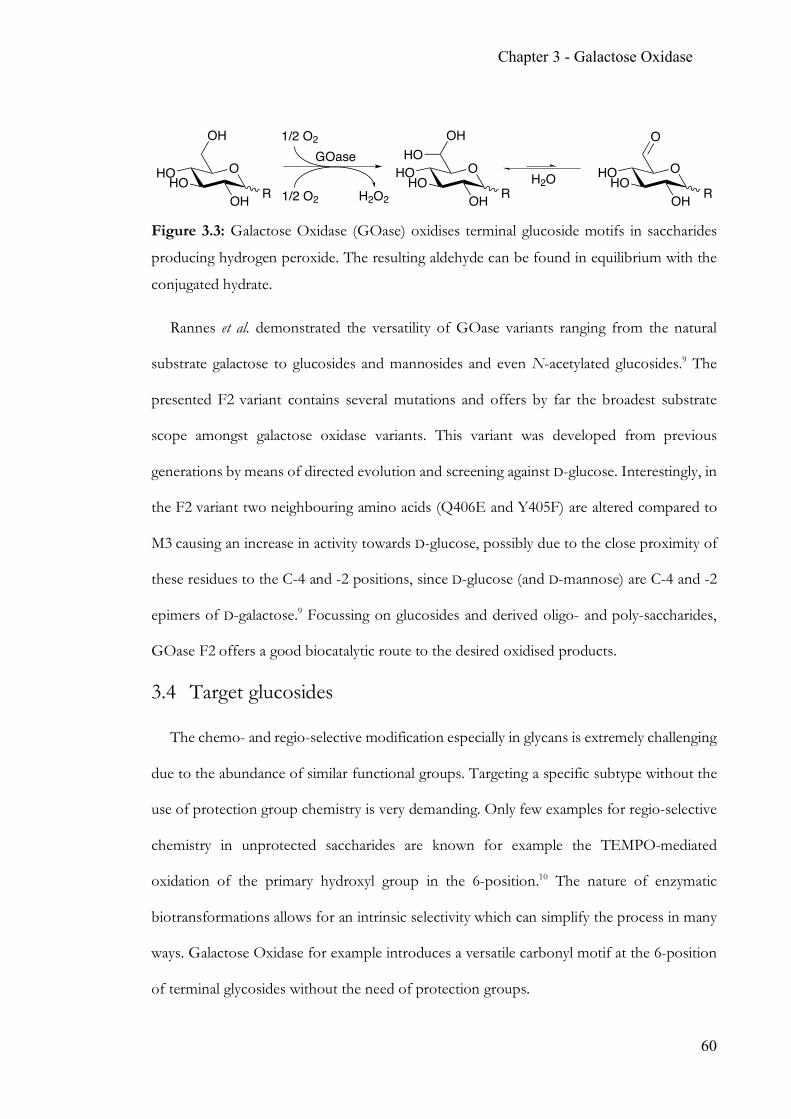
Chapter 3 - Galactose Oxidase
60
Figure 3.3: Galactose Oxidase (GOase) oxidises terminal glucoside motifs in saccharides
producing hydrogen peroxide. The resulting aldehyde can be found in equilibrium with the
conjugated hydrate.
Rannes et al. demonstrated the versatility of GOase variants ranging from the natural
substrate galactose to glucosides and mannosides and even N-acetylated glucosides.9 The
presented F2 variant contains several mutations and offers by far the broadest substrate
scope amongst galactose oxidase variants. This variant was developed from previous
generations by means of directed evolution and screening against D-glucose. Interestingly, in
the F2 variant two neighbouring amino acids (Q406E and Y405F) are altered compared to
M3 causing an increase in activity towards D-glucose, possibly due to the close proximity of
these residues to the C-4 and -2 positions, since D-glucose (and D-mannose) are C-4 and -2
epimers of D-galactose.9 Focussing on glucosides and derived oligo- and poly-saccharides,
GOase F2 offers a good biocatalytic route to the desired oxidised products.
3.4 Target glucosides
The chemo- and regio-selective modification especially in glycans is extremely challenging
due to the abundance of similar functional groups. Targeting a specific subtype without the
use of protection group chemistry is very demanding. Only few examples for regio-selective
chemistry in unprotected saccharides are known for example the TEMPO-mediated
oxidation of the primary hydroxyl group in the 6-position.10 The nature of enzymatic
biotransformations allows for an intrinsic selectivity which can simplify the process in many
ways. Galactose Oxidase for example introduces a versatile carbonyl motif at the 6-position
of terminal glycosides without the need of protection groups.
O
OH R
OH
HOHO
O
OH R
OH
HOHO
1/2 O2 H2O2
1/2 O2
GOase HOO
OH RHO
HO
O
H2O
Chapter 3 - Galactose Oxidase
61
From an industrial perspective, glucosides are much more interesting than galactosides
because of their natural abundance. Glucose and especially glucosides make up vast
percentages of biomass in forms of starch and cellulose. These glucose polymers mainly
consist of α1,4- (in amylose) and β1,4-linked (in cellulose) glucose units. Whereas cellulose’s
natural properties provide plants with structure, starch (amylose and α1,6-branched
amylopectin) is their energy reservoir in form of polymerised glucose to relieve osmotic
pressure.
The physicochemical properties of cellulose (especially the low solubility in water) make
it a very demanding compound to work with. Besides, cellulose is found in plant cell walls
along with lignin, which would require further separation. However, amylose is much more
accessible because of its increased water solubility and therefore an anticipated substrate to
subject to enzymatic oxidation.
BASF as an industrial partner is especially interested in the chemical functionalisation of
starch (i.e. amylose). The targeted oxidation of hydroxyl groups to carbonyl groups would
allow for a) the modification of physical properties (e.g. viscosity) and b) further
functionalisation including cross linking linear amylose fibrils with diamines for example.
To study the effects of alpha- and beta-linkages in glucosidic polymers and the influence
of oligo-/polymer length during the oxidation mediated by galactose oxidase a panel of
substrates (Figure 3.4) containing D-galactose (1) and D-glucose (4) as well as their 1-O-
methylated compounds (2, 3, 5 and 6) has been identified. Furthermore, glucosidic oligo-
saccharides in alpha (maltose 10, maltotriose 11) and beta-linkage (cellobiose 12, cellotriose
13) were included. Additionally, raffinose (7), lactose (8) and sucrose (9) round up the panel
with lactose being of special industrial interest as well.
Lactose accumulates in significant amounts in various industrial dairy processes and is
cheaply available. Consequently, it was identified as an interesting target by BASF. The
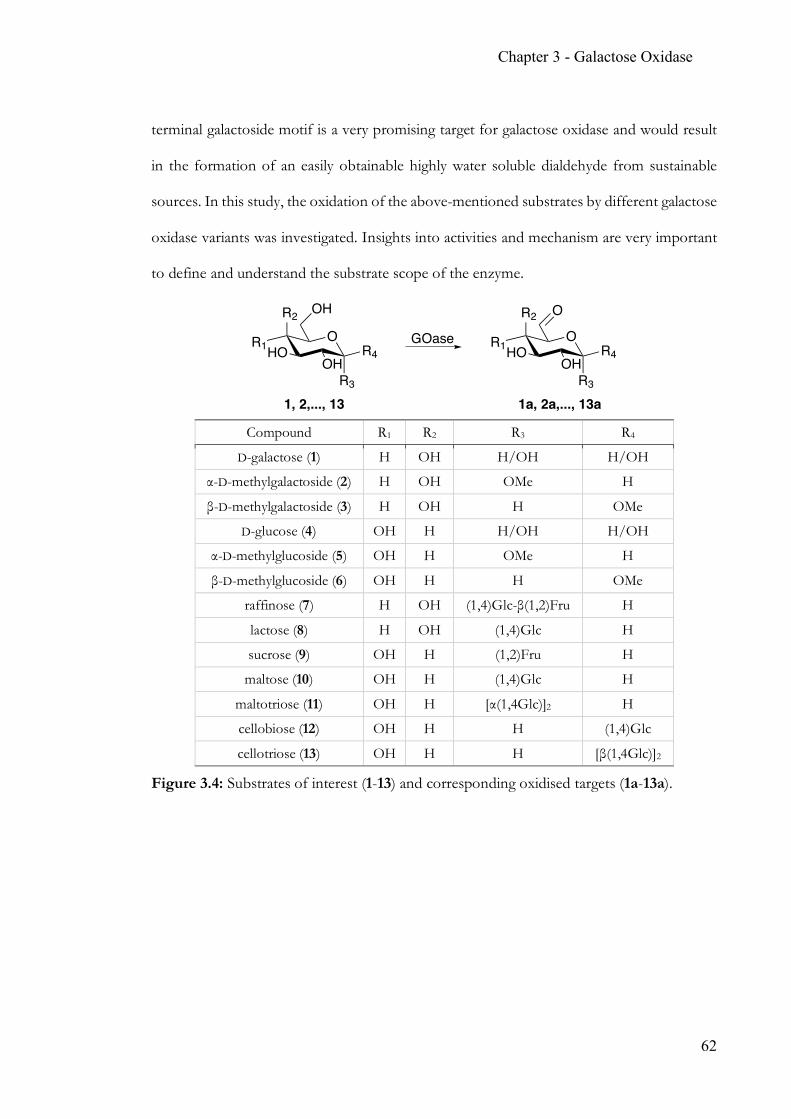
Chapter 3 - Galactose Oxidase
62
terminal galactoside motif is a very promising target for galactose oxidase and would result
in the formation of an easily obtainable highly water soluble dialdehyde from sustainable
sources. In this study, the oxidation of the above-mentioned substrates by different galactose
oxidase variants was investigated. Insights into activities and mechanism are very important
to define and understand the substrate scope of the enzyme.
Compound R1 R2 R3 R4
D-galactose (1) H OH H/OH H/OH
α-D-methylgalactoside (2) H OH OMe H
β-D-methylgalactoside (3) H OH H OMe
D-glucose (4) OH H H/OH H/OH
α-D-methylglucoside (5) OH H OMe H
β-D-methylglucoside (6) OH H H OMe
raffinose (7) H OH (1,4)Glc-β(1,2)Fru H
lactose (8) H OH (1,4)Glc H
sucrose (9) OH H (1,2)Fru H
maltose (10) OH H (1,4)Glc H
maltotriose (11) OH H [α(1,4Glc)]2 H
cellobiose (12) OH H H (1,4)Glc
cellotriose (13) OH H H [β(1,4Glc)]2
Figure 3.4: Substrates of interest (1-13) and corresponding oxidised targets (1a-13a).
OR1HO
R2
R3
R4OH
OH
OR1HO
R2
R3
R4OH
O
1, 2,..., 13 1a, 2a,..., 13a
GOase
Chapter 3 - Galactose Oxidase
63
3.5 Experimental Section
3.5.1 Materials
- Sodium phosphate buffer (NaPi), 100 mM, pH 7.4
- Sodium phosphate buffer, 50 mM, pH 8.0, NaCl 300 mM
- Sodium phosphate buffer, 50 mM, pH 8.0, NaCl 300 mM, desthiobiotin 5 mM
- Horseradish Peroxidase, stock 75 U/mL, final 33.75 U/mL, Sigma Aldrich
- Catalase from bovine liver, stock 330 U/mL, final 165 U/mL, Sigma Aldrich
- ABTS, stock 0.4 mg/mL, stock 0.18 mg/mL, Sigma Aldrich
- D2O, Sigma Aldrich
- all saccharides, Sigma Aldrich
3.5.2 Sub-cloning and expression
The GOase F2 gene was sub-cloned into a pET30a vector. For plasmid production, the
vector is transformed into E. coli XL-1 blue super-competent cells (Agilent Technologies)
using materials and methods described in the supplier’s manual. A single colony of E. coli
XL-1 blue cells containing plasmid GOase F2 is picked from overnight plates and used to
inoculate 5 mL LB medium supplemented with 1 µL of kanamycin per mL (30 mg mL-1
stock solution). The biomass of one 5 mL overnight culture is used for subsequent plasmid
extraction according to materials and methods described for the QUIAGEN plasmid mini
kit.
For enzyme production, the vector is transformed into One Shot E. coli BL21 StarTM
(DE3) cells. A single colony of E. coli BL21 StarTM (DE3) cells containing plasmid GOase
F2 is picked from overnight plates and used to inoculate 5 mL LB medium supplemented
with 1 µL of kanamycin/mL (30 mg mL-1 stock solution). 500 µL of the overnight starter
culture is used to inoculate 250 mL of an auto induction medium (8ZY-4LAC) as described
Chapter 3 - Galactose Oxidase
64
by Deacon & McPherson16 and supplemented with 250 µL of kanamycin (30 mg mL-1 stock
solution) in a 2 L baffled flask. Cells are grown at 26°C and 250 rpm for 60 h.
Protein purification was carried out according to Deacon & McPherson.16 Cells were
disrupted using Triton-X 100 lysis buffer followed by centrifugation of the lysate at 20.000
rpm for 30 min at 4°C and subsequent dialysis of the crude extract into 50 mM NaPi buffer
(300 mM NaCl, pH 8.0) for 12 h at 4°C. Protein purification was accomplished using Strep-
Tag-II columns (5 mL capacity) eluting with a 5 mM desthiobiotin NaPi buffer (300 mM
NaCl, pH 8.0).
Following purification, the protein samples were dialysed into 50 mM sodium phosphate
buffer (pH 7.4) for 24 h at 4°C. In this step copper-sulfate was added to the dialysis buffer
to accomplish the copper-loading of the protein. After copper-loading, the protein samples
were dialysed into copper-free 50 mM sodium phosphate buffer (pH 7.4) over night at 4°C
and subsequently concentrated to desired concentrations.
Under the described conditions the protein does not elute as a sharp peak, but in a rather
broad manner (Figure 3.5). Following purification, the yield of GOase F2 ranges between
50 mg to 60 mg per 250 mL of culture. For the quantification of protein yielded after
expression the BCA Protein Assay KIT by Thermo Fisher Scientific Inc. was used according
to manufacture’s instructions.
Chapter 3 - Galactose Oxidase
65
Figure 3.5: SDS-PAGE of fractions obtained during the protein purification of GOase F2
(approx. 68.5 kDa) using a Strep-Tag-II column.
3.5.3 Biotransformations
3.5.3.1 Glycoside oxidation
The reaction mixture was set up in a 2 mL reaction tube as follows: Stock solutions of
substrates (α-D-methylgalactoside (2), β-D-methylgalactoside (3), α-D-methylglucoside (5), β-
D-methyl-glucoside (6), maltose (10), maltotriose (11), cellobiose (12) and cellotriose (13))
were made up with water. The solution was then vortexed for 10 min to saturate with
atmospheric O2, and 50 µL were added to the reaction. HRP and catalase were added to the
reaction from a 10 mg/mL stock solution. Purified GOase F2 variant was added to the
reaction (see Table 3.1). The reaction was then left for 24 h at 30°C in an orbital shaker at
1000 rpm. Subsequent work up included spinning down of insoluble particles, filtration
through filter tips and freeze-drying over night before dissolving the samples in D2O prior
to NMR experiments.
Chapter 3 - Galactose Oxidase
66
Table 3.1: Components for the biotransformation reactions.
component stock solution volume (µL) final concentration
GOase F2 4.0 mg/mL 50 1.00 mg/mL
HRP 10 mg/mL 21.8 1.09 mg/mL
catalase 10 mg/mL 2.20 0.11 mg/mL
substrate 1040 mM 50.0 260 mM
buffer 100 mM ad 200
3.5.3.2 Lactose oxidation
The reaction mixture was set up in a 2 mL reaction tube as follows: A stock solution of
D-lactose (8) was made up in water. The solution was then vortexed for 10 min prior to
adding to the reaction to saturate with atmospheric O2. Catalase (with and without HRP) was
added to the reaction from a 10 mg/mL stock solution. Dialysed GOase wt (BASF) was
added to the reaction (see Table 3.2). The reaction was then left for 24 h at 30°C in an orbital
shaker at 1000 rpm. Subsequent work up included spinning down of insoluble particles,
filtration and freeze-drying over night before dissolving the samples in D2O prior to NMR
experiments.
Chapter 3 - Galactose Oxidase
67
Table 3.2: Components for the biotransformation reactions.
component stock solution volume (µL) final concentration
GOase F2 20.0 mg/mL 25.0 1.00 mg/mL
HRP 10 mg/mL 55.0 1.1 mg/mL
catalase 10 mg/mL 5.00 0.1 mg/mL
substrate 400 mM 31.25, 62.5, 125 and 250 25, 50, 100 and 200 mM
buffer 100 mM ad 500
GOase F2 20.0 mg/mL 50.0 1.00 mg/mL
HRP - - -
catalase 10 mg/mL 2.20 1.0 mg/mL
substrate 400 mM 31.25, 62.5, 125 and 250 25, 50, 100 and 200 mM
buffer 100 mM ad 500
3.5.3.3 Lactose oxidation – scale-up
The reaction mixture was set up in a 500 mL baffled shake flask as follows: A stock
solution of D-lactose (8) was made up in water. The solution was then vortexed for 10 min
prior to adding to the reaction to saturate with atmospheric O2. Catalase was added to the
reaction from a 10 mg/mL stock solution. Dialysed GOase wt (BASF) was added to the
reaction (see Table 3.3). The reaction was then left for 48 h at 30°C in a shaking incubator
at 250 rpm. Subsequent work up included spinning down of insoluble particles, filtration and
freeze-drying over night before dissolving the samples in D2O prior to NMR experiments.
Table 3.3: Components for the biotransformation scale-up reactions.
component stock solution volume (µL) final concentration
GOase F2 20 mg/mL 10 and 40 1 and 8 mg/mL
catalase 10 mg/mL 10 0.1 mg/mL
substrate 400 mM 25 and 50 100 and 200 mM
H2O ad 100
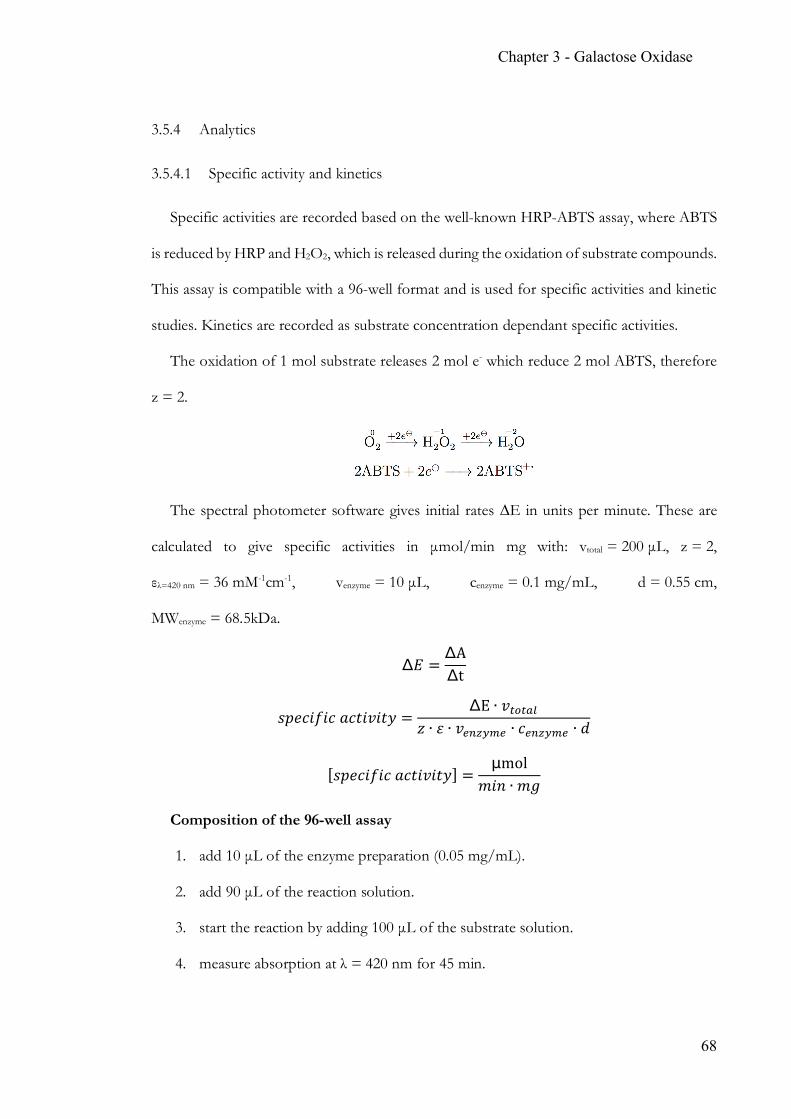
Chapter 3 - Galactose Oxidase
68
3.5.4 Analytics
3.5.4.1 Specific activity and kinetics
Specific activities are recorded based on the well-known HRP-ABTS assay, where ABTS
is reduced by HRP and H2O2, which is released during the oxidation of substrate compounds.
This assay is compatible with a 96-well format and is used for specific activities and kinetic
studies. Kinetics are recorded as substrate concentration dependant specific activities.
The oxidation of 1 mol substrate releases 2 mol e- which reduce 2 mol ABTS, therefore
z = 2.
The spectral photometer software gives initial rates ∆E in units per minute. These are
calculated to give specific activities in µmol/min mg with: vtotal = 200 µL, z = 2,
ελ=420 nm = 36 mM-1cm-1, venzyme = 10 µL, cenzyme = 0.1 mg/mL, d = 0.55 cm,
MWenzyme = 68.5kDa.
Δ𝐸 =ΔAΔt
𝑠𝑝𝑒𝑐𝑖𝑓𝑖𝑐𝑎𝑐𝑡𝑖𝑣𝑖𝑡𝑦 =ΔE ∙ 𝑣><>Q9
𝑧 ∙ 𝜀 ∙ 𝑣81STU8 ∙ 𝑐81STU8 ∙ 𝑑
[𝑠𝑝𝑒𝑐𝑖𝑓𝑖𝑐𝑎𝑐𝑡𝑖𝑣𝑖𝑡𝑦] =μmol
𝑚𝑖𝑛 ∙ 𝑚𝑔
Composition of the 96-well assay
1. add 10 µL of the enzyme preparation (0.05 mg/mL).
2. add 90 µL of the reaction solution.
3. start the reaction by adding 100 µL of the substrate solution.
4. measure absorption at λ = 420 nm for 45 min.
Chapter 3 - Galactose Oxidase
69
5. determine the slope (∆OD · min-1) of the initial linear region of the plotted graph
(absorption vs. time).
Plotting the absorption against the time and subsequent determination of the initial slopes
gives the specific activities for GOase variants and substrates according to the equation
above.
3.5.4.2 NMR spectroscopy
NMR experiments were carried out for the starting materials (2, 3, 5, 6, 8, 10, 11, 12 and
13) and the crude reaction mixtures of (2a, 3a, 5a, 6a, 8a, 10a, 11a, 12a and 13a). The starting
material (30 mg) was added to an NMR tube and dissolved in D2O. Crude reaction mixtures
were centrifuged, filtered and frozen with liquid nitrogen for 5 min. Following freeze-drying
for >5 h the samples were dissolved in 500 µL D2O and then transferred into a Wilmad
NMR tube 5 mm (Sigma-Aldrich). D2O was added to reach the desired volume. Spectra were
recorded at 400 MHz and 20°C.
Chapter 3 - Galactose Oxidase
70
3.6 Results & Discussion
3.6.1 GOase F2 oxidises various glucosides
3.6.1.1 Specific activities
To test the activity of galactose oxidase (GOase) wild-type enzyme versus the optimised
F2 variant specific activities were obtained using a coupled, doubly-indirect horseradish
peroxidase-ABTS (HRP-ABTS) assay.9 The in situ generated H2O2 is turned over to H2O and
ABTS is oxidised to its colourful intermediate radical (see Figure 3.7). The change in
absorption at λ = 420 nm is measured spectrophotometrically.
To re-evaluate the substrate scope of the GOase F2 variant and to benchmark the enzyme
further experiments with mono- and oligo-saccharides (listed in Figure 3.4) were performed.
As a comparison GOase wild-type enzyme provided by BASF was investigated. The
determination of specific activities is a characterising tool in case kinetic measurements are
not obtainable. Table 3.4 summarises the specific activities for GOase (wt and F2) for a panel
of mono- and oligo-saccharides.
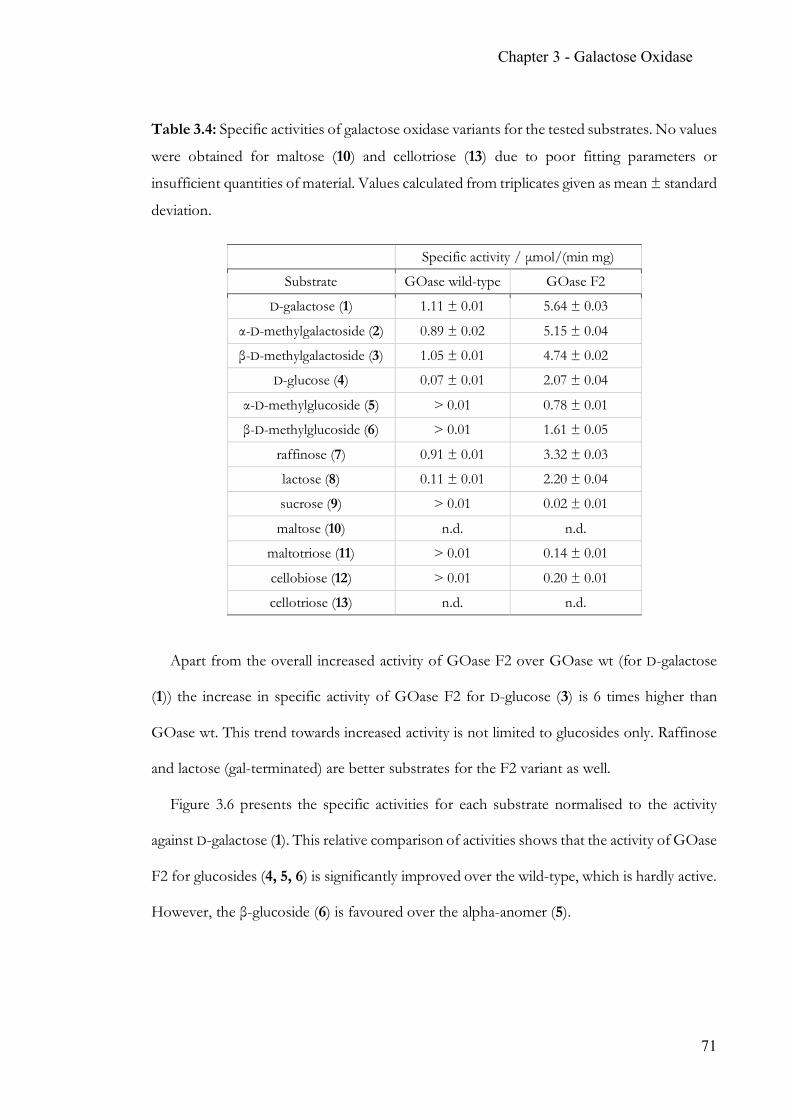
Chapter 3 - Galactose Oxidase
71
Table 3.4: Specific activities of galactose oxidase variants for the tested substrates. No values
were obtained for maltose (10) and cellotriose (13) due to poor fitting parameters or
insufficient quantities of material. Values calculated from triplicates given as mean ± standard
deviation.
Specific activity / µmol/(min mg)
Substrate GOase wild-type GOase F2
D-galactose (1) 1.11 ± 0.01 5.64 ± 0.03
α-D-methylgalactoside (2) 0.89 ± 0.02 5.15 ± 0.04
β-D-methylgalactoside (3) 1.05 ± 0.01 4.74 ± 0.02
D-glucose (4) 0.07 ± 0.01 2.07 ± 0.04
α-D-methylglucoside (5) > 0.01 0.78 ± 0.01
β-D-methylglucoside (6) > 0.01 1.61 ± 0.05
raffinose (7) 0.91 ± 0.01 3.32 ± 0.03
lactose (8) 0.11 ± 0.01 2.20 ± 0.04
sucrose (9) > 0.01 0.02 ± 0.01
maltose (10) n.d. n.d.
maltotriose (11) > 0.01 0.14 ± 0.01
cellobiose (12) > 0.01 0.20 ± 0.01
cellotriose (13) n.d. n.d.
Apart from the overall increased activity of GOase F2 over GOase wt (for D-galactose
(1)) the increase in specific activity of GOase F2 for D-glucose (3) is 6 times higher than
GOase wt. This trend towards increased activity is not limited to glucosides only. Raffinose
and lactose (gal-terminated) are better substrates for the F2 variant as well.
Figure 3.6 presents the specific activities for each substrate normalised to the activity
against D-galactose (1). This relative comparison of activities shows that the activity of GOase
F2 for glucosides (4, 5, 6) is significantly improved over the wild-type, which is hardly active.
However, the β-glucoside (6) is favoured over the alpha-anomer (5).
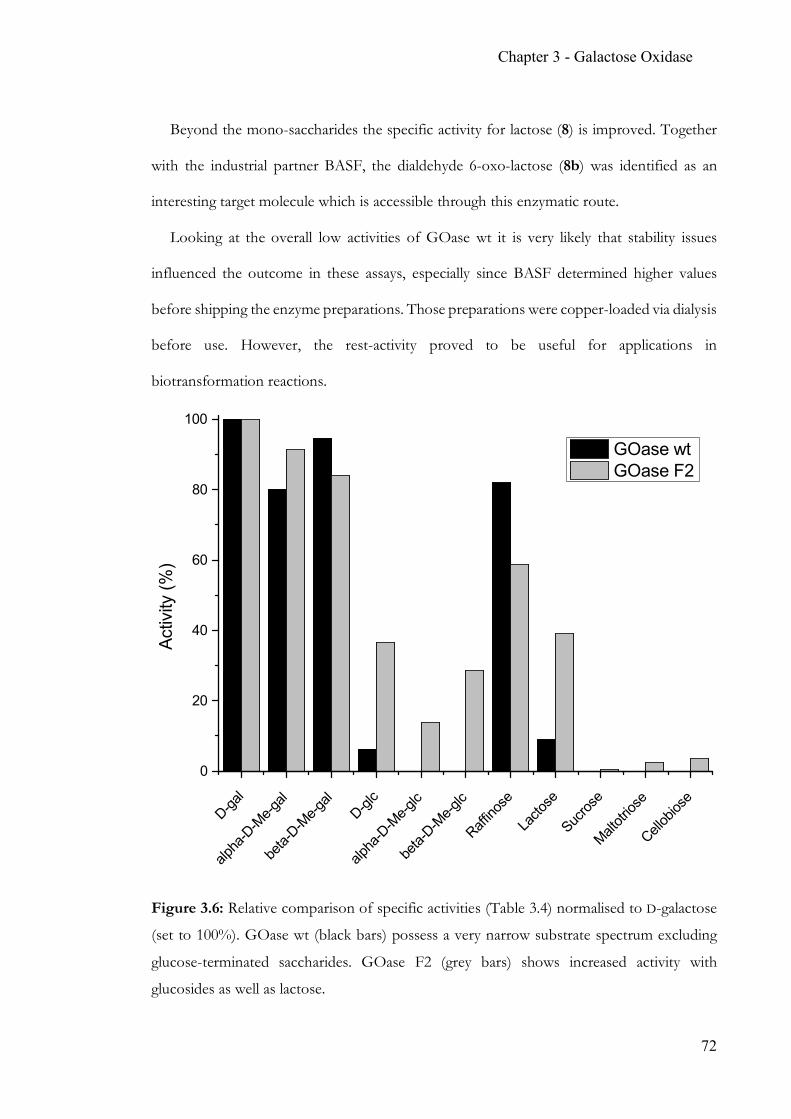
Chapter 3 - Galactose Oxidase
72
Beyond the mono-saccharides the specific activity for lactose (8) is improved. Together
with the industrial partner BASF, the dialdehyde 6-oxo-lactose (8b) was identified as an
interesting target molecule which is accessible through this enzymatic route.
Looking at the overall low activities of GOase wt it is very likely that stability issues
influenced the outcome in these assays, especially since BASF determined higher values
before shipping the enzyme preparations. Those preparations were copper-loaded via dialysis
before use. However, the rest-activity proved to be useful for applications in
biotransformation reactions.
Figure 3.6: Relative comparison of specific activities (Table 3.4) normalised to D-galactose
(set to 100%). GOase wt (black bars) possess a very narrow substrate spectrum excluding
glucose-terminated saccharides. GOase F2 (grey bars) shows increased activity with
glucosides as well as lactose.
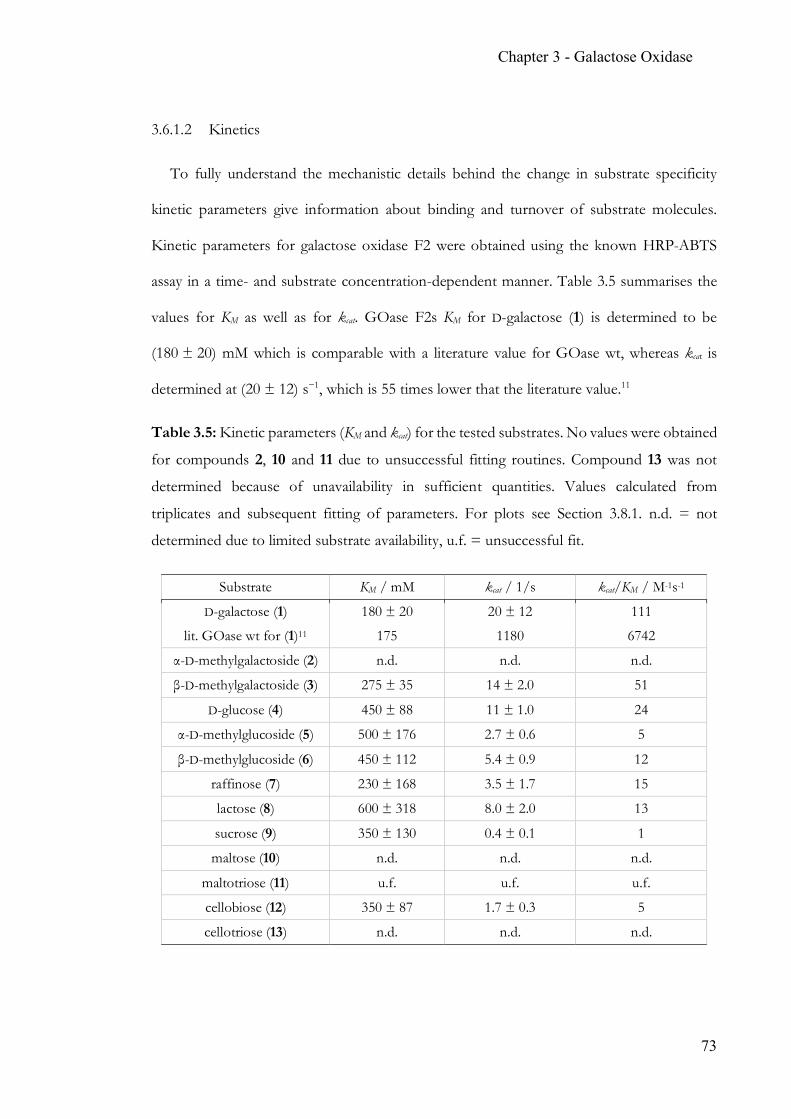
Chapter 3 - Galactose Oxidase
73
3.6.1.2 Kinetics
To fully understand the mechanistic details behind the change in substrate specificity
kinetic parameters give information about binding and turnover of substrate molecules.
Kinetic parameters for galactose oxidase F2 were obtained using the known HRP-ABTS
assay in a time- and substrate concentration-dependent manner. Table 3.5 summarises the
values for KM as well as for kcat. GOase F2s KM for D-galactose (1) is determined to be
(180 ± 20) mM which is comparable with a literature value for GOase wt, whereas kcat is
determined at (20 ± 12) s−1, which is 55 times lower that the literature value.11
Table 3.5: Kinetic parameters (KM and kcat) for the tested substrates. No values were obtained
for compounds 2, 10 and 11 due to unsuccessful fitting routines. Compound 13 was not
determined because of unavailability in sufficient quantities. Values calculated from
triplicates and subsequent fitting of parameters. For plots see Section 3.8.1. n.d. = not
determined due to limited substrate availability, u.f. = unsuccessful fit.
Substrate KM / mM kcat / 1/s kcat/KM / M-1s-1
D-galactose (1) 180 ± 20 20 ± 12 111
lit. GOase wt for (1)11 175 1180 6742
α-D-methylgalactoside (2) n.d. n.d. n.d.
β-D-methylgalactoside (3) 275 ± 35 14 ± 2.0 51
D-glucose (4) 450 ± 88 11 ± 1.0 24
α-D-methylglucoside (5) 500 ± 176 2.7 ± 0.6 5
β-D-methylglucoside (6) 450 ± 112 5.4 ± 0.9 12
raffinose (7) 230 ± 168 3.5 ± 1.7 15
lactose (8) 600 ± 318 8.0 ± 2.0 13
sucrose (9) 350 ± 130 0.4 ± 0.1 1
maltose (10) n.d. n.d. n.d.
maltotriose (11) u.f. u.f. u.f.
cellobiose (12) 350 ± 87 1.7 ± 0.3 5
cellotriose (13) n.d. n.d. n.d.
Chapter 3 - Galactose Oxidase
74
The KM values are determined to be in the high mM rage with large errors. Since the KM
gives the substrate concentration at which half vmax is reached, > KM · 2 should be the highest
concentration in the substrate range while recording kinetic data. Unfortunately, most of the
substrates are not soluble in molar concentrations. Therefore, vmax is not determined with
enough certainty because the Michaelis-Menten curve does not reach saturation.
Subsequently the quality of KM is poor as well. All values (KM and kcat) are obtained from a
software based fitting routine. In the cases of 2, 10 and 11 the fitting of the raw data resulted
in no values for KM and kcat at all.
Additionally, the obtained raw data before fitting from three independent measurements
varies significantly. The used HRP-ABTS assay seems to be highly sensitive. Generally, the
stability of the chromophore (ABTS•+) is pH dependent and can be over-oxidised to be
colourless (Figure 3.7).
However, despite the high errors of the obtained values, looking at kcat/KM as a
measurement for the quality of a biocatalyst, it is notable that the β-glucoside (6) is favoured
over the α-glucoside (5). Similarly, lactose (8) has a high KM, nevertheless the kcat/KM is
comparable to the methylglucosides.
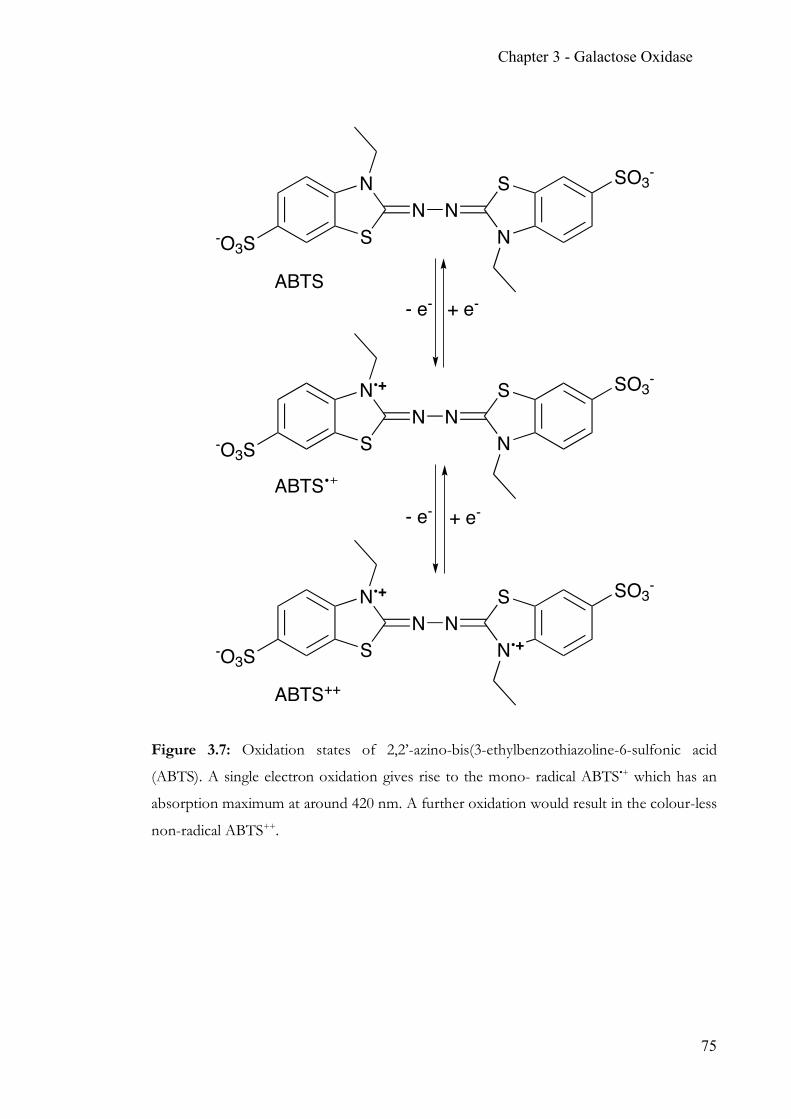
Chapter 3 - Galactose Oxidase
75
Figure 3.7: Oxidation states of 2,2’-azino-bis(3-ethylbenzothiazoline-6-sulfonic acid
(ABTS). A single electron oxidation gives rise to the mono- radical ABTS•+ which has an
absorption maximum at around 420 nm. A further oxidation would result in the colour-less
non-radical ABTS++.
S
NN N
N
S
-O3S
SO3-
S
N•+N N
N
S
-O3S
SO3-
S
N•+N N
N•+
S
-O3S
SO3-
ABTS
ABTS
ABTS++
- e-
- e-
+ e-
+ e-
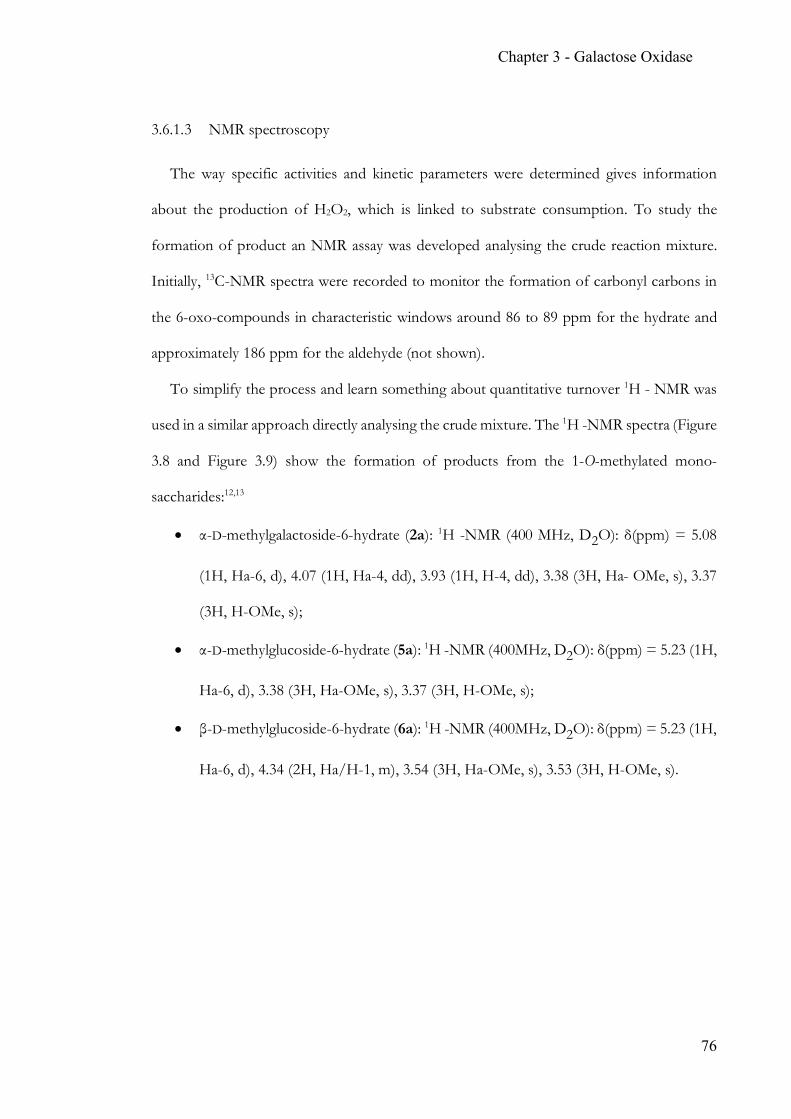
Chapter 3 - Galactose Oxidase
76
3.6.1.3 NMR spectroscopy
The way specific activities and kinetic parameters were determined gives information
about the production of H2O2, which is linked to substrate consumption. To study the
formation of product an NMR assay was developed analysing the crude reaction mixture.
Initially, 13C-NMR spectra were recorded to monitor the formation of carbonyl carbons in
the 6-oxo-compounds in characteristic windows around 86 to 89 ppm for the hydrate and
approximately 186 ppm for the aldehyde (not shown).
To simplify the process and learn something about quantitative turnover 1H - NMR was
used in a similar approach directly analysing the crude mixture. The 1H -NMR spectra (Figure
3.8 and Figure 3.9) show the formation of products from the 1-O-methylated mono-
saccharides:12,13
• α-D-methylgalactoside-6-hydrate (2a): 1H -NMR (400 MHz, D2O): δ(ppm) = 5.08
(1H, Ha-6, d), 4.07 (1H, Ha-4, dd), 3.93 (1H, H-4, dd), 3.38 (3H, Ha- OMe, s), 3.37
(3H, H-OMe, s);
• α-D-methylglucoside-6-hydrate (5a): 1H -NMR (400MHz, D2O): δ(ppm) = 5.23 (1H,
Ha-6, d), 3.38 (3H, Ha-OMe, s), 3.37 (3H, H-OMe, s);
• β-D-methylglucoside-6-hydrate (6a): 1H -NMR (400MHz, D2O): δ(ppm) = 5.23 (1H,
Ha-6, d), 4.34 (2H, Ha/H-1, m), 3.54 (3H, Ha-OMe, s), 3.53 (3H, H-OMe, s).
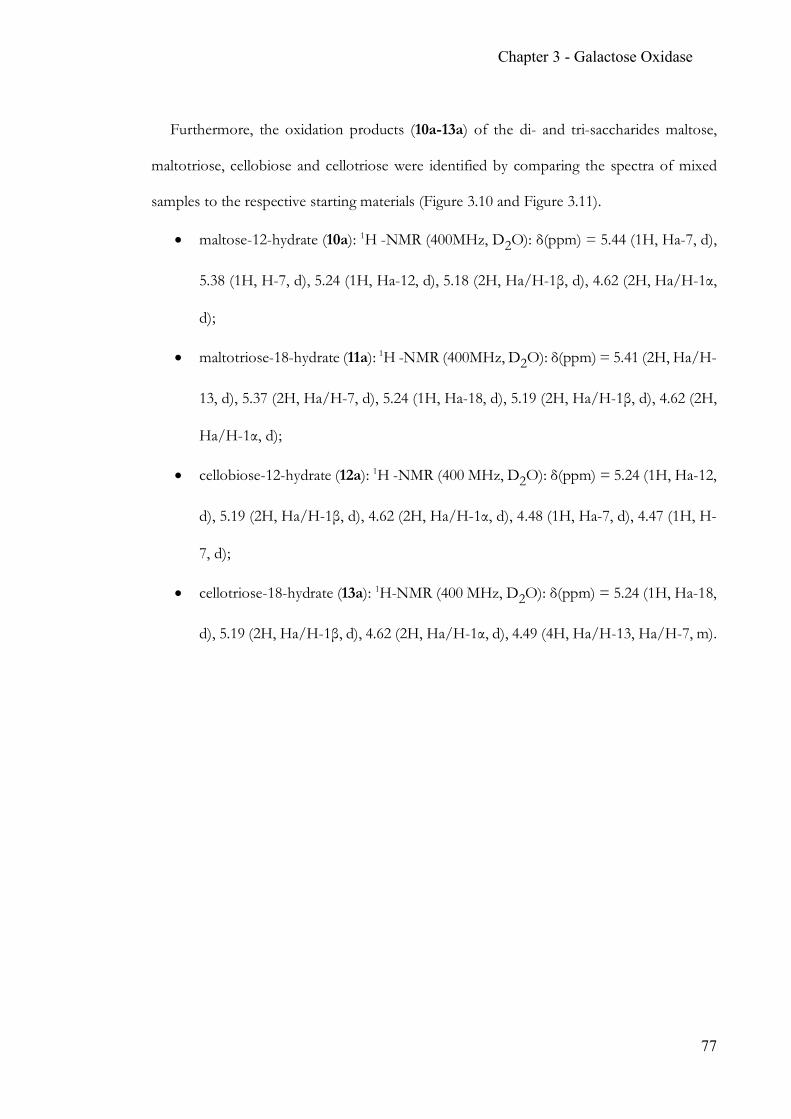
Chapter 3 - Galactose Oxidase
77
Furthermore, the oxidation products (10a-13a) of the di- and tri-saccharides maltose,
maltotriose, cellobiose and cellotriose were identified by comparing the spectra of mixed
samples to the respective starting materials (Figure 3.10 and Figure 3.11).
• maltose-12-hydrate (10a): 1H -NMR (400MHz, D2O): δ(ppm) = 5.44 (1H, Ha-7, d),
5.38 (1H, H-7, d), 5.24 (1H, Ha-12, d), 5.18 (2H, Ha/H-1β, d), 4.62 (2H, Ha/H-1α,
d);
• maltotriose-18-hydrate (11a): 1H -NMR (400MHz, D2O): δ(ppm) = 5.41 (2H, Ha/H-
13, d), 5.37 (2H, Ha/H-7, d), 5.24 (1H, Ha-18, d), 5.19 (2H, Ha/H-1β, d), 4.62 (2H,
Ha/H-1α, d);
• cellobiose-12-hydrate (12a): 1H -NMR (400 MHz, D2O): δ(ppm) = 5.24 (1H, Ha-12,
d), 5.19 (2H, Ha/H-1β, d), 4.62 (2H, Ha/H-1α, d), 4.48 (1H, Ha-7, d), 4.47 (1H, H-
7, d);
• cellotriose-18-hydrate (13a): 1H-NMR (400 MHz, D2O): δ(ppm) = 5.24 (1H, Ha-18,
d), 5.19 (2H, Ha/H-1β, d), 4.62 (2H, Ha/H-1α, d), 4.49 (4H, Ha/H-13, Ha/H-7, m).
Chapter 3 - Galactose Oxidase
78
Figure 3.8: 1H-NMR spectra of crude reactions oxidising methylated galactosides using
GOase F2. (a) Spectrum of crude mix containing 2 and 2a. Estimated yield by OMe signals:
37%. (b) Spectrum of crude mix containing 3 and 3a. Estimated yield by H/H’-4 signals:
20%.
3.33.43.53.63.73.83.94.04.14.24.34.44.54.64.74.84.95.05.1f1 (ppm)
5.0
2.9
1.6
1.0
1.0
O
OH
OH
H
OH
OH
OH H
H
O
CH3
alpha-D-methylgalactoside-6 hydrate (2a)
3.33.43.53.63.73.83.94.04.14.24.34.44.54.64.74.84.95.05.1f1 (ppm)
15.0
4.3
1.0
0.6
2.0
0.6
1.9
1.3
O
OH
OH
H
OH
OH
OH H
HO
CH3
beta-D-methylgalactoside-6 hydrate (3a)
Chapter 3 - Galactose Oxidase
79
Figure 3.9: 1H-NMR spectra of crude reactions oxidising methylated glucosides using
GOase F2. (a) Spectrum of crude mix containing 5 and 5a. Estimated yield by OMe signals:
60%. (b) Spectrum of crude mix containing 6 and 6a. Estimated yield by OMe signals: 40%.
3.13.23.33.43.53.63.73.83.94.04.14.24.34.44.54.64.74.84.95.05.15.2f1 (ppm)
2.1
3.1
1.0
O
OH
H
H
OH
OH
OH H
OH
O
CH3
alpha-D-methylglucoside-6 hydrate (5a)
3.13.23.33.43.53.63.73.83.94.04.14.24.34.44.54.64.74.84.95.05.15.2f1 (ppm)
4.4
2.9
1.6
1.5
2.5
1.0
O
OH
H
H
OH
OH
OH H
OHO
CH3
beta-D-methylglucoside-6 hydrate (6a)
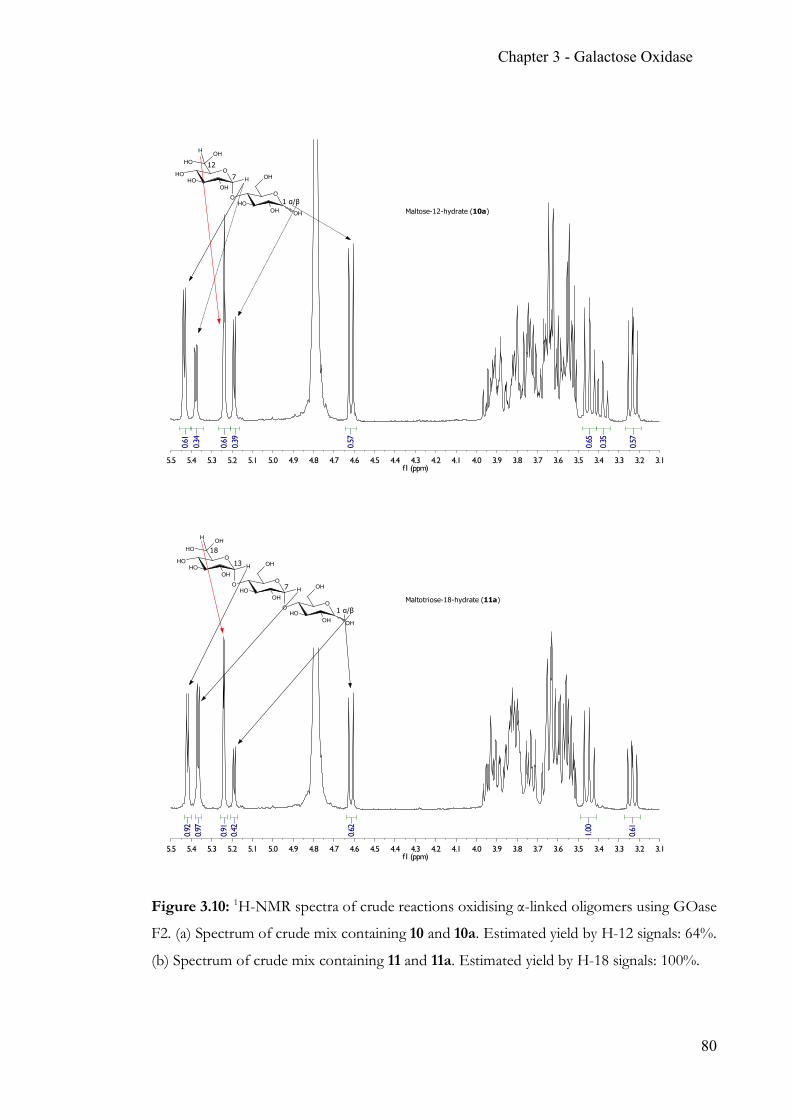
Chapter 3 - Galactose Oxidase
80
Figure 3.10: 1H-NMR spectra of crude reactions oxidising α-linked oligomers using GOase
F2. (a) Spectrum of crude mix containing 10 and 10a. Estimated yield by H-12 signals: 64%.
(b) Spectrum of crude mix containing 11 and 11a. Estimated yield by H-18 signals: 100%.
3.13.23.33.43.53.63.73.83.94.04.14.24.34.44.54.64.74.84.95.05.15.25.35.45.5f1 (ppm)
0.57
0.35
0.65
0.57
0.39
0.61
0.34
0.61
1 α/β
OOH
OH
O
OH
OH
O
OH
OHOH
OHH
OH
H
7
12
Maltose-12-hydrate (10a)
3.13.23.33.43.53.63.73.83.94.04.14.24.34.44.54.64.74.84.95.05.15.25.35.45.5f1 (ppm)
0.61
1.00
0.62
0.42
0.91
0.97
0.92
OOH
OH
O
OH
OH
O
OH
O
OH
OHH
O
OH
OHOH
OHH
OH
H
1 α/β
7
13
18
Maltotriose-18-hydrate (11a)
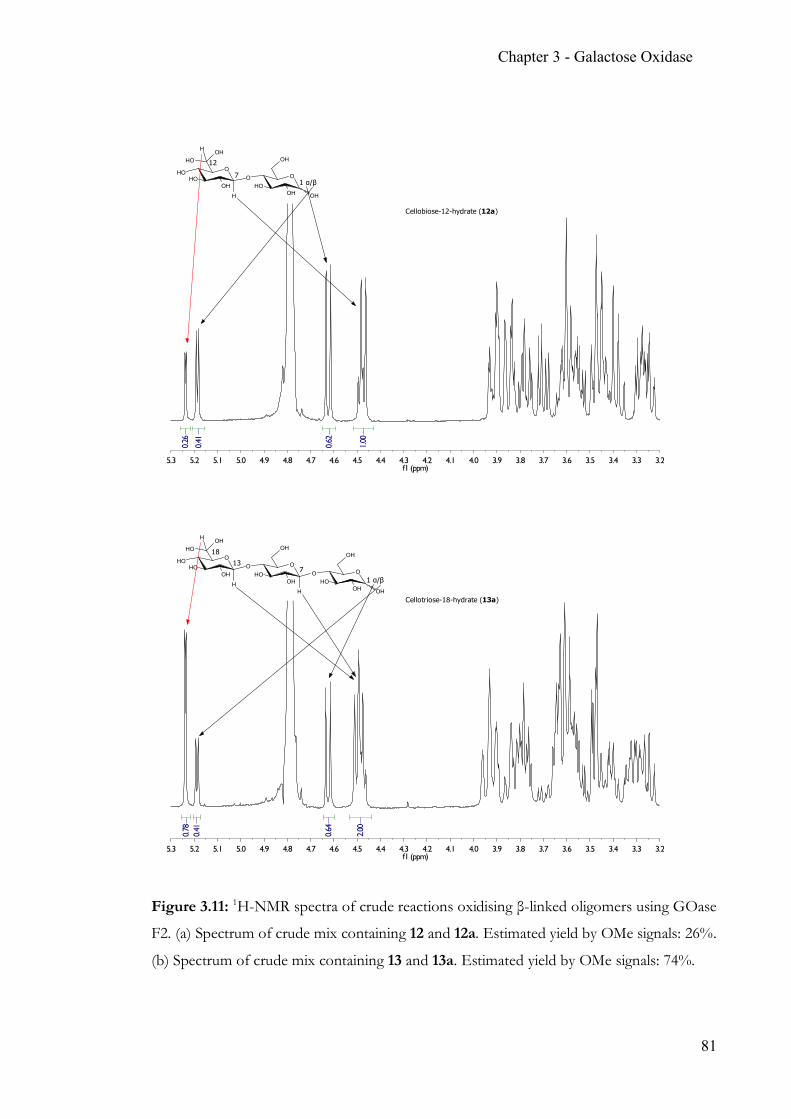
Chapter 3 - Galactose Oxidase
81
Figure 3.11: 1H-NMR spectra of crude reactions oxidising β-linked oligomers using GOase
F2. (a) Spectrum of crude mix containing 12 and 12a. Estimated yield by OMe signals: 26%.
(b) Spectrum of crude mix containing 13 and 13a. Estimated yield by OMe signals: 74%.
3.23.33.43.53.63.73.83.94.04.14.24.34.44.54.64.74.84.95.05.15.25.3f1 (ppm)
1.00
0.62
0.41
0.26
OOH
OH
H
OH
OH
O O
OH
OHOH
OHOH
H
1 α/β 7
12
Cellobiose-12-hydrate (12a)
3.23.33.43.53.63.73.83.94.04.14.24.34.44.54.64.74.84.95.05.15.25.3f1 (ppm)
2.00
0.64
0.41
0.78
OOH
OH
H
OH
OH
O O
OH
OH
OHOH
H
O O
OH
OHOH
OH
H
1 α/β
713
18
Cellotriose-18-hydrate (13a)
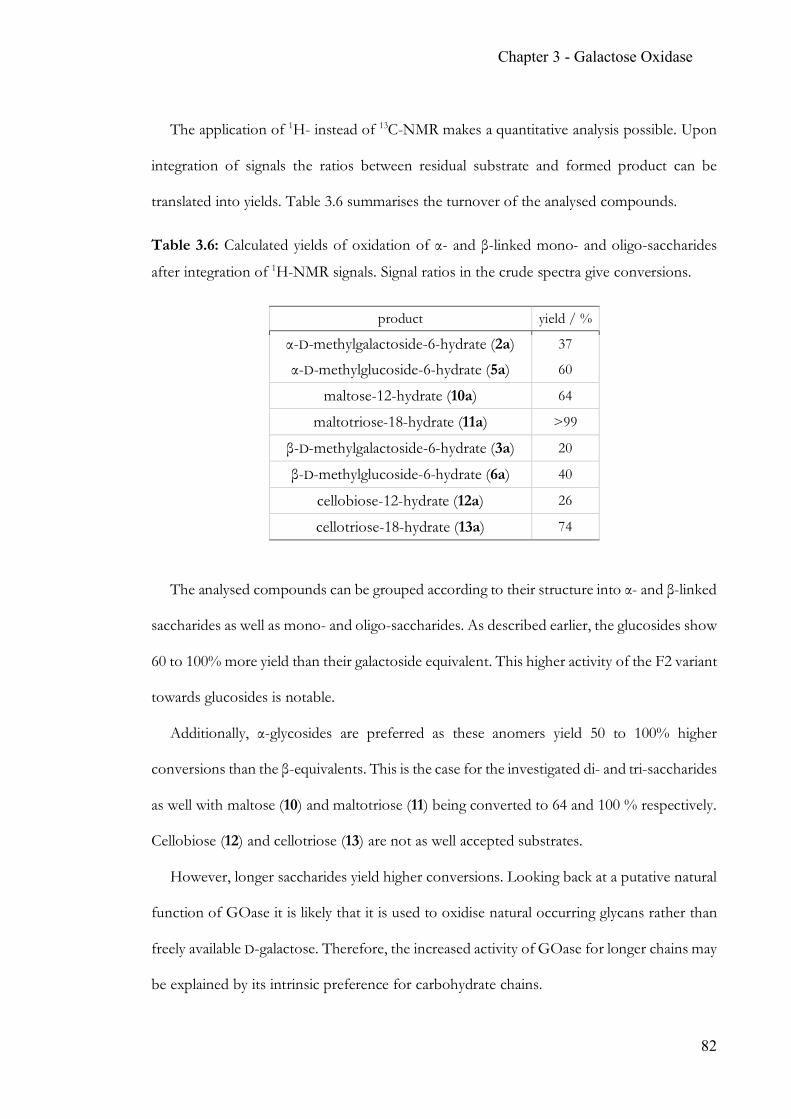
Chapter 3 - Galactose Oxidase
82
The application of 1H- instead of 13C-NMR makes a quantitative analysis possible. Upon
integration of signals the ratios between residual substrate and formed product can be
translated into yields. Table 3.6 summarises the turnover of the analysed compounds.
Table 3.6: Calculated yields of oxidation of α- and β-linked mono- and oligo-saccharides
after integration of 1H-NMR signals. Signal ratios in the crude spectra give conversions.
product yield / %
α-D-methylgalactoside-6-hydrate (2a) 37
α-D-methylglucoside-6-hydrate (5a) 60
maltose-12-hydrate (10a) 64
maltotriose-18-hydrate (11a) >99
β-D-methylgalactoside-6-hydrate (3a) 20
β-D-methylglucoside-6-hydrate (6a) 40
cellobiose-12-hydrate (12a) 26
cellotriose-18-hydrate (13a) 74
The analysed compounds can be grouped according to their structure into α- and β-linked
saccharides as well as mono- and oligo-saccharides. As described earlier, the glucosides show
60 to 100% more yield than their galactoside equivalent. This higher activity of the F2 variant
towards glucosides is notable.
Additionally, α-glycosides are preferred as these anomers yield 50 to 100% higher
conversions than the β-equivalents. This is the case for the investigated di- and tri-saccharides
as well with maltose (10) and maltotriose (11) being converted to 64 and 100 % respectively.
Cellobiose (12) and cellotriose (13) are not as well accepted substrates.
However, longer saccharides yield higher conversions. Looking back at a putative natural
function of GOase it is likely that it is used to oxidise natural occurring glycans rather than
freely available D-galactose. Therefore, the increased activity of GOase for longer chains may
be explained by its intrinsic preference for carbohydrate chains.
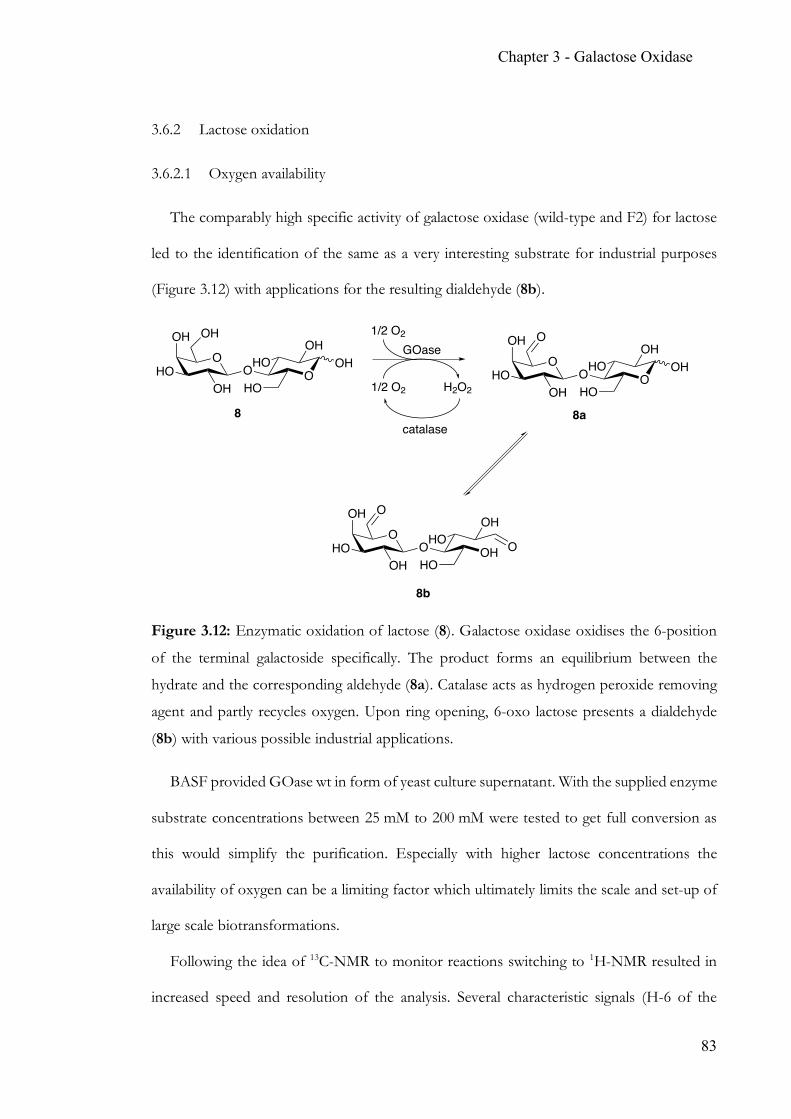
Chapter 3 - Galactose Oxidase
83
3.6.2 Lactose oxidation
3.6.2.1 Oxygen availability
The comparably high specific activity of galactose oxidase (wild-type and F2) for lactose
led to the identification of the same as a very interesting substrate for industrial purposes
(Figure 3.12) with applications for the resulting dialdehyde (8b).
Figure 3.12: Enzymatic oxidation of lactose (8). Galactose oxidase oxidises the 6-position
of the terminal galactoside specifically. The product forms an equilibrium between the
hydrate and the corresponding aldehyde (8a). Catalase acts as hydrogen peroxide removing
agent and partly recycles oxygen. Upon ring opening, 6-oxo lactose presents a dialdehyde
(8b) with various possible industrial applications.
BASF provided GOase wt in form of yeast culture supernatant. With the supplied enzyme
substrate concentrations between 25 mM to 200 mM were tested to get full conversion as
this would simplify the purification. Especially with higher lactose concentrations the
availability of oxygen can be a limiting factor which ultimately limits the scale and set-up of
large scale biotransformations.
Following the idea of 13C-NMR to monitor reactions switching to 1H-NMR resulted in
increased speed and resolution of the analysis. Several characteristic signals (H-6 of the
O
OH
OHOH
HO1/2 O2 H2O2
1/2 O2
GOase
8
O OHO
OH
HO
OH O
OH
OH
HO O OHO
OH
HO
OH
O
O
OH
OH
HO O OHHO
OH
HOO
catalase8a
8b
O
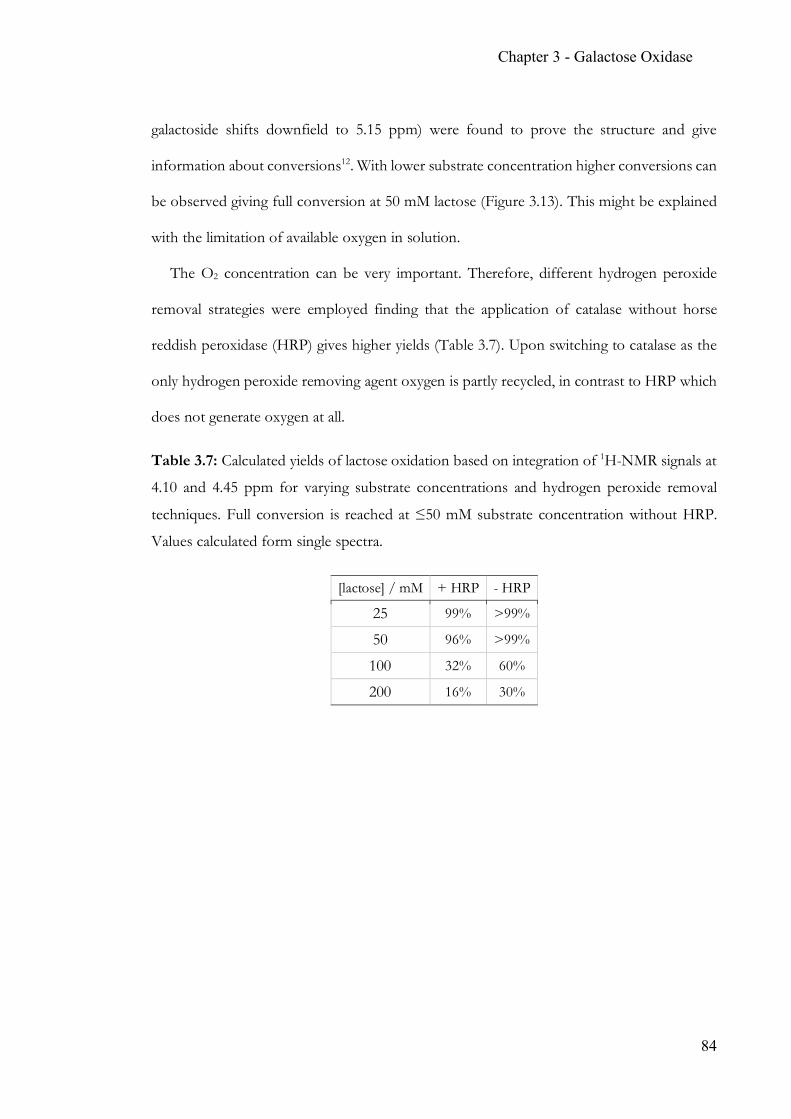
Chapter 3 - Galactose Oxidase
84
galactoside shifts downfield to 5.15 ppm) were found to prove the structure and give
information about conversions12. With lower substrate concentration higher conversions can
be observed giving full conversion at 50 mM lactose (Figure 3.13). This might be explained
with the limitation of available oxygen in solution.
The O2 concentration can be very important. Therefore, different hydrogen peroxide
removal strategies were employed finding that the application of catalase without horse
reddish peroxidase (HRP) gives higher yields (Table 3.7). Upon switching to catalase as the
only hydrogen peroxide removing agent oxygen is partly recycled, in contrast to HRP which
does not generate oxygen at all.
Table 3.7: Calculated yields of lactose oxidation based on integration of 1H-NMR signals at
4.10 and 4.45 ppm for varying substrate concentrations and hydrogen peroxide removal
techniques. Full conversion is reached at ≤50 mM substrate concentration without HRP.
Values calculated form single spectra.
[lactose] / mM + HRP - HRP
25 99% >99%
50 96% >99%
100 32% 60%
200 16% 30%
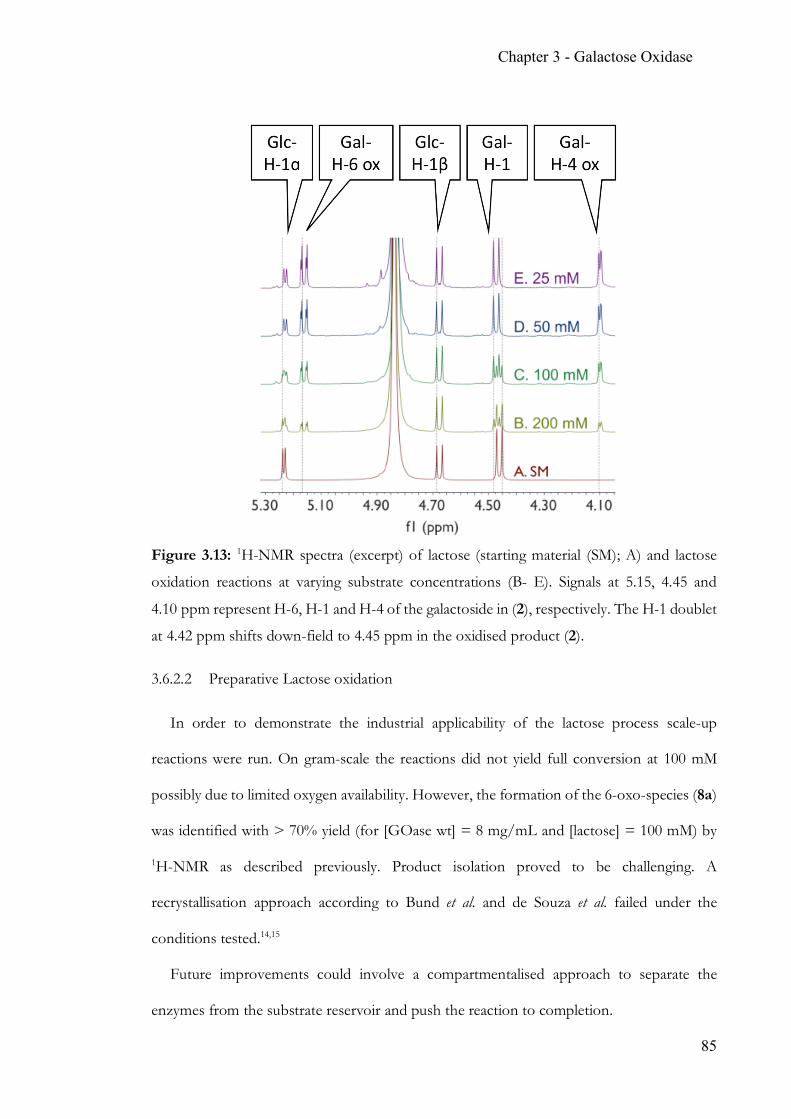
Chapter 3 - Galactose Oxidase
85
Figure 3.13: 1H-NMR spectra (excerpt) of lactose (starting material (SM); A) and lactose
oxidation reactions at varying substrate concentrations (B- E). Signals at 5.15, 4.45 and
4.10 ppm represent H-6, H-1 and H-4 of the galactoside in (2), respectively. The H-1 doublet
at 4.42 ppm shifts down-field to 4.45 ppm in the oxidised product (2).
3.6.2.2 Preparative Lactose oxidation
In order to demonstrate the industrial applicability of the lactose process scale-up
reactions were run. On gram-scale the reactions did not yield full conversion at 100 mM
possibly due to limited oxygen availability. However, the formation of the 6-oxo-species (8a)
was identified with > 70% yield (for [GOase wt] = 8 mg/mL and [lactose] = 100 mM) by
1H-NMR as described previously. Product isolation proved to be challenging. A
recrystallisation approach according to Bund et al. and de Souza et al. failed under the
conditions tested.14,15
Future improvements could involve a compartmentalised approach to separate the
enzymes from the substrate reservoir and push the reaction to completion.
Chapter 3 - Galactose Oxidase
86
3.7 Conclusion
The goal of this study was the evaluation the substrate scope of galactose oxidase (GOase)
amongst possible saccharides of interest. Specific activities and kinetic parameters showed,
that the GOase F2 variant is a potent candidate to oxidise the target glucosides, as well as
lactose.
The sensitive ABTS-assay lead to specific activities and kinetic parameters with big error
bars. Nevertheless, the extracted KM in the high millimolar range revealed the problem of
limited solubility of the substrates. Furthermore β-glucosides appeared to be the better
substrates with higher KM/kcat.
The NMR studies showed that GOase F2 does turn over glucosides to a higher degree
that galactosides. Beyond the known mono-saccharide substrates, the versatility of GOase
F2 has been demonstrated oxidising di- and even tri-saccharides with increasing efficiency.
The NMR experiments also revealed a tendency towards α-glucosides being preferred.
Looking back at the kinetic data though, it is possible, that β-glucosides are too good
substrates which leads to H2O2 poisoning the active site of the enzyme and ultimately to
inactivity. In contrast, the α-anomers might be slower substrates and therefore the enzyme
lasts longer to lead to higher conversion.
The H2O2 removal strategy is crucial. For the tested substrates catalase without HRP
seems to work fine. Catalase partly recycles oxygen which enhances the conversion.
Additionally, it has been found that for other GOase substrates little amounts of HRP in the
reaction mixture can reactivate GOase active site which is likely to work for lower substrate
concentrations or lower oxygen requirements.
Since GOase exclusively oxidises terminal glycosides the configuration of the glycosidic
bond might be of importance possibly interfering with the binding site. Consequently α- and

Chapter 3 - Galactose Oxidase
87
β-anomers bind differently which could influence the distance between 6-OH and the Cu-
tyrosyl radical leading to poor reaction efficiency.
Generally speaking, these findings suggest that GOase F2 is a valid candidate for the
industrial oxidation of lactose and glucosidic oligomers in α-configuration similar to amylose.
Chapter 3 - Galactose Oxidase
88
3.8 Appendix
3.8.1 Supporting information to Section 3.6.1.2 (Michaelis-Menten plots GOase kinetics)
Specific activities were determined for a range of substrate concentrations ensuring the
overall substrate consumption never exceeded 20 %. Three independent measurements were
performed, averages calculated, and standard deviations calculated. Specific activities were
plotted against the respective substrate concentration to yield Michaelis-Menten plots. Fitting
to a model was achieved using Origin 9.0.
𝑦 =𝑉UQ^ ∙ 𝑥𝐾a + 𝑥
Values for Vmax were used to calculate kcat . Errors values were retrieved through the
fitting routine.
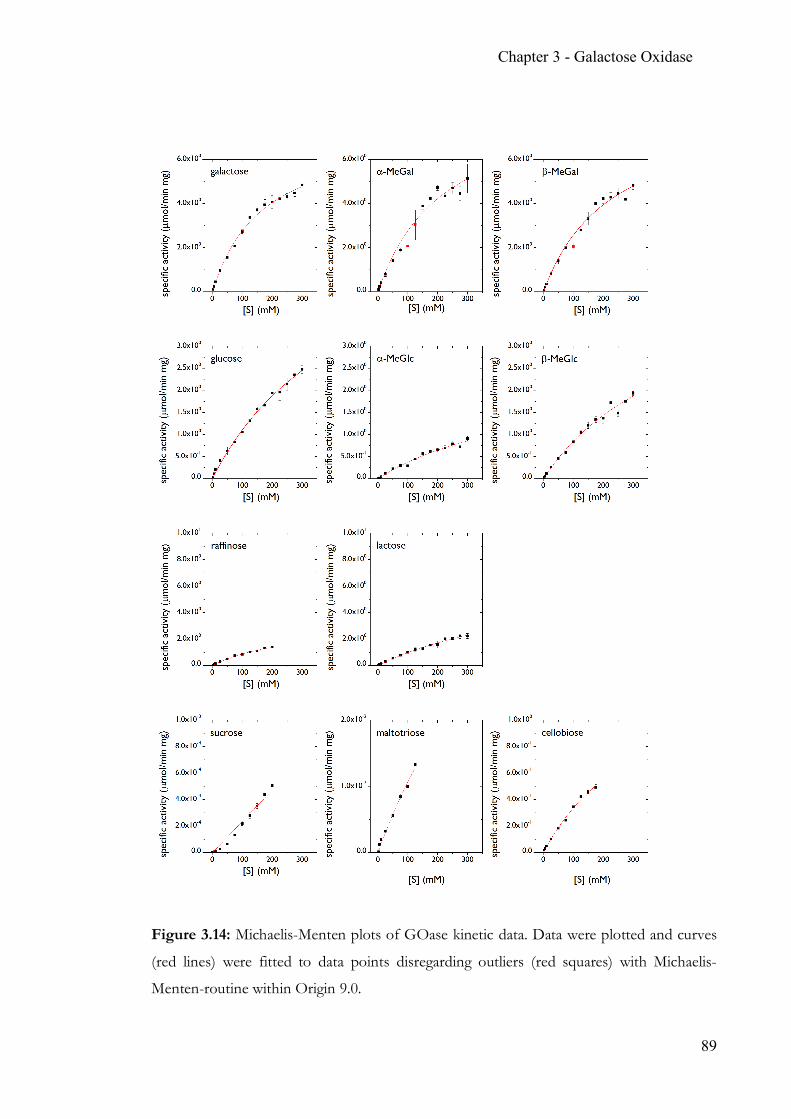
Chapter 3 - Galactose Oxidase
89
Figure 3.14: Michaelis-Menten plots of GOase kinetic data. Data were plotted and curves
(red lines) were fitted to data points disregarding outliers (red squares) with Michaelis-
Menten-routine within Origin 9.0.
Chapter 3 - Galactose Oxidase
90
3.9 References
[1] G Avigad, D Amaral, C Asensio, and B L Horecker. The D-galactose oxidase of
Polyporus circinatus. J. Biol. Chem., 237:2736–43, 1962.
[2] J W Whittaker. The radical chemistry of galactose oxidase. Arch. Biochem. Biophys.,
433(1):227–39, 2005.
[3] N Ito, S E Phillips, C Stevens, Z B Ogel, M J McPherson, J N Keen, K D Yadav, and
P F Knowles. Novel thioether bond revealed by a 1.7 A crystal structure of galactose
oxidase. Nature, 350(6313):87–90, 1991.
[4] M S Rogers, A J Baron, M J McPherson, P F Knowles, and D M Dooley. Galactose
Oxidase Pro-Sequence Cleavage and Cofactor Assembly Are Self-Processing
Reactions. J. Am. Chem. Soc., 122(5):990–991, 2000.
[5] M S Rogers, R Hurtado-Guerrero, S J Firbank, M A Halcrow, D M Dooley, S E V
Phillips, P F Knowles, and M J McPherson. Cross-link formation of the cysteine 228-
tyrosine 272 catalytic cofactor of galactose oxidase does not require dioxygen.
Biochemistry, 47(39):10428–39, 2008.
[6] L Que and W B Tolman. Biologically inspired oxidation catalysis. Nature,
455(7211):333–340, 2008.
[7] C D Borman, C G Saysell, C Wright, and A G Sykes. Mechanistic studies on the single
copper tyrosyl-radical containing enzyme galactose oxidase. Pure Appl. Chem.,
70(4):897–902, 1998.
[8] J W Whittaker. Free radical catalysis by galactose oxidase. Chem. Rev., 103(6):2347–63,
2003.
[9] J B Rannes, A Ioannou, S C Willies, G Grogan, C Behrens, S L Flitsch, and N J Turner.
Glycoprotein labeling using engineered variants of galactose oxidase obtained by
directed evolution. J. Am. Chem. Soc., 133(22):8436–8439, 2011.
[10] N J Davis and S L Flitsch. Selective oxidation of monosaccharide derivatives to uronic
acids. Tetrahedron Lett., 34(7):1181–1184, 1993.
[11] L D Kwiatkowski, M Adelman, R Pennelly, and D J Kosman. Kinetic mechanism of
the Cu(II) enzyme galactose oxidase. J. Inorg. Biochem., 14(3):209–22, 1981.
Chapter 3 - Galactose Oxidase
91
[12] V Bonnet, R Duval, and C Rabiller. Oxidation of galactose and derivatives catalysed
by galactose oxidase: structure and complete assignments of the NMR spectra of the
main product. J. Mol. Catal. B Enzym., 24-25:9–16, 2003.
[13] S Singh, S Nambiar, R A Porter, T L Sander, K G Taylor, and R J Doyle. Dialdosides-
(1,5) of glucose and galactose: synthesis, reactivity, and conformation. J. Org. Chem.,
54(10):2300–2307, 1989.
[14] R K Bund and A B Pandit. Rapid lactose recovery from buffalo whey by use of ‘anti-
solvent, ethanol’. J. Food Eng., 82(3):333–341, 2007.
[15] R Rosa de Souza, R Bergamasco, S Claúdio da Costa, X Feng, S H Bernardo Faria, and
M Luiz Gimenes. Recovery and purification of lactose from whey. Chem. Eng. Process.
Process Intensif., 49(11):1137–1143, 2010.
[16] S E Deacon and M J McPherson. Enhanced expression and purification of fungal
galactose oxidase in Escherichia coli and use for analysis of a saturation mutagenesis
library. Chembiochem, 12:593–601, 2011.
92
Chapter 4 Carbohydrate arrays for fast and sensitive
hydrolase characterisation
4.1 Summary
Following the enzymatic oxidation of oligo-saccharides in solution monitored by NMR,
the next step was developing a screening platform to characterised fungal glycoside
hydrolases and their activity towards plant derived oligo- and poly-saccharides. A
hydrophobic SAM platform coupled with an adapted reductive amination strategy forms the
basis for a rapid MALDI-ToF assay.
4.2 Contribution
JvM designed the overall study. ALD performed NMR experiments JvM performed
biological experiments. As part of this thesis MR established the SAM formation
methodology (based on suggestions by Dr A. Ruiz-Sanchez). MR and BT performed
reductive aminations (CJG advised). MR, JvM and BT performed MALDI-ToF experiment.
JvM, BT and MR analysed data was. All authors wrote the manuscript.
4.3 Manuscript
This manuscript is published in Scientific Reports 7, Article number: 43117 (2017)
doi:10.1038/srep43117.
Chapter 4 - Carbohydrate arrays
93
Application of carbohydrate arrays coupled with mass
spectrometry to detect activity of plant-polysaccharide
degradative enzymes from the fungus Aspergillus niger
Jolanda M van Munster1*, Baptiste Thomas2, Michel Riese2, Adrienne L Davis3, Christopher
J Gray2, David B Archer1, Sabine L Flitsch2
1 Fungal Biology and Genetics, School of Life Sciences, University of Nottingham, University
Park, Nottingham NG7 2RD, UK 2 Chemical Biology, Manchester Institute for Biotechnology, University of Manchester, 131
Princess Street, Manchester M1 7DN, United Kingdom 3 School of Chemistry, University of Nottingham, University Park, Nottingham NG7 2RD,
UK
Email addresses: [email protected],
[email protected], [email protected],
[email protected], [email protected],
[email protected], [email protected]
* Corresponding author
Dr J.M. van Munster, Manchester Institute for Biotechnology, University of Manchester,
131 Princess Street, Manchester M1 7DN, United Kingdom,
Chapter 4 - Carbohydrate arrays
94
Abstract
Renewables-based biotechnology depends on enzymes to degrade plant lignocellulose to
simple sugars that are converted to fuels or high-value products. Identification and
characterization of such lignocellulose degradative enzymes could be fast-tracked by
availability of an enzyme activity measurement method that is fast, label-free, uses minimal
resources and allows direct identification of generated products.
We developed such a method by applying carbohydrate arrays coupled with MALDI-ToF
mass spectrometry to identify reaction products of carbohydrate active enzymes (CAZymes)
of the filamentous fungus Aspergillus niger. We describe the production and characterization
of plant poly-saccharide-derived oligo-saccharides and their attachment to hydrophobic self-
assembling monolayers on a gold target. We verify effectiveness of this array for detecting
exo- and endo-acting glycoside hydrolase activity using commercial enzymes, and
demonstrate how this platform is suitable for detection of enzyme activity in relevant
biological samples, the culture filtrate of A. niger grown on wheat straw.
In conclusion, this versatile method is broadly applicable in screening and characterisation
of activity of CAZymes, such as fungal enzymes for plant lignocellulose degradation with
relevance to biotechnological applications as biofuel production, the food and animal feed
industry.
Introduction
The availability of well-characterised, affordable and efficient carbohydrate active
enzymes (CAZymes) that are capable of modifying or degrading plant-derived carbohydrates
underpins the food and feed industries as well as renewables-based biotechnology. Of
particular interest are enzymes capable of degrading complex lignocellulose, generating
simple sugars from which biochemicals and second generation biofuels can be produced.
This transformation would benefit from more efficient and cheaper enzyme mixtures,
Chapter 4 - Carbohydrate arrays
95
enabled by the discovery of enzymes with improved stability, novel or improved catalytic
mechanisms or other helper proteins that contribute to synergistic substrate degradation1,2.
Genome sequencing of many microbes with high lignocellulose degradative capacity has
resulted in the discovery of many potential valuable CAZymes, (available in the CAZy
database3), but their biochemical characterization is lagging behind4. Furthermore, detailed
understanding of the regulation behind gene expression and protein secretion in fungal
enzyme production strains could optimize the industrial enzyme production process5,6.
The fungus Aspergillus niger is extensively used as an industrial producer of organic acids
and enzymes7. The genome of this fungus encodes a large set of CAZymes for the
degradation of plant poly-saccharides8, and these genes are expressed in response to
cultivation on lignocellulosic substrates that are of relevance as feedstock for biofuel
production, such as wheat straw, willow and sugar cane bagasse9-11. Despite the abundance
of research on A. niger CAZymes, the biochemical characterisation of many of these enzymes
is incomplete. This lack of knowledge on enzyme specificities, in particular substrate and
product range, prevents a complete understanding of the enzymatic machinery responsible
for the degradation of lignocellulose. Methods for rapid, sensitive detection and
characterisation of enzyme activity on plant-derived substrates are therefore an essential tool.
However, key challenges are posed by a trade-off between method throughput and derived
information content, and the limited availability of characterised complex substrates.
Carbohydrate arrays are eminently suited to resolve the key challenges associated with
characterising CAZyme activity, namely simultaneous screening of multiple reactions and
conditions on minimal amounts of substrates. Carbohydrate arrays, including those carrying
plant-based oligo-saccharides,12,13 have been successfully used to screen for enzyme activities
as well as binding specificities of antibodies and carbohydrate binding proteins (for recent
reviews see14-16). These arrays offer high analytical resolution as the complex structural
features of the poly-saccharides are separated in sub-structures. However, a limitation of
Chapter 4 - Carbohydrate arrays
96
many arrays is their reliance on labelled substrates, binding domains or antibodies to aid
visualisation. The coupling of carbohydrate arrays with MALDI-ToF MS enables sensitive,
rapid and label-free visualisation of enzymatic products directly at the array surface and can
also allow for structural features to be ascertained through tandem MS17. Recently,
carbohydrate arrays coupled with MS have been applied to determine the substrate specificity
of carbohydrate binding modules and to detect and identify exo-glycosidase enzyme
activities, active on terminal residues of the attached carbohydrates13,14, as well as limited
endo-acting activity on short oligo-saccharides18.
Here, we expanded on this work by generating MALDI-ToF MS compatible carbohydrate
arrays with plant-derived oligo-saccharides, including those with a high degree of
polymerisation (DP), and applying them to detect and identify substrates and products of
both endo- and exo- acting fungal CAZymes, including a proof of principle application
towards detection of activity of lignocellulose-active CAZymes enzymes secreted by A. niger.
From plant poly-saccharides we produced, isolated and characterized oligo-saccharides with
a high DP. We use these, as well as commercially available oligo-saccharides, to generate a
carbohydrate array on a hydrophobic self-assembling monolayer (SAM) of alkanethiols
coating the gold surface of a MALDI-ToF target (Figure 4.1). We show that this system can
be used to detect both endo- and exo-acting enzyme activity and we apply the arrays to detect
substrate changes caused by activity of CAZymes of A. niger.
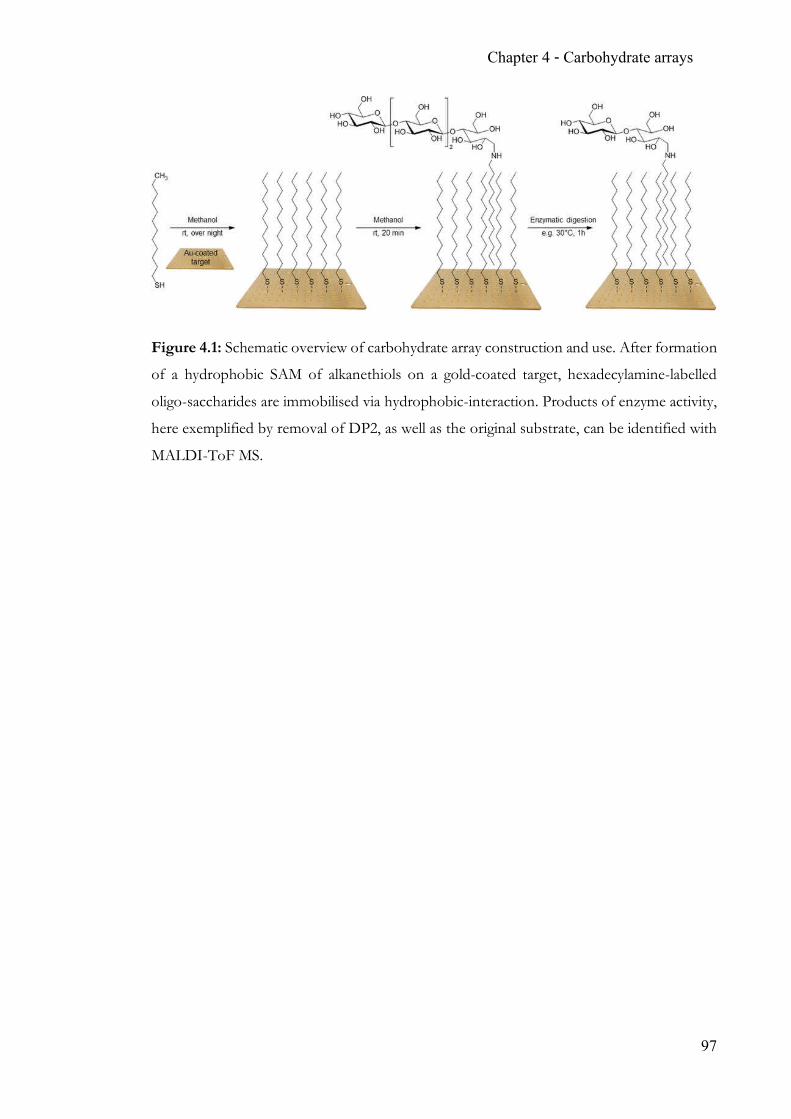
Chapter 4 - Carbohydrate arrays
97
Figure 4.1: Schematic overview of carbohydrate array construction and use. After formation
of a hydrophobic SAM of alkanethiols on a gold-coated target, hexadecylamine-labelled
oligo-saccharides are immobilised via hydrophobic-interaction. Products of enzyme activity,
here exemplified by removal of DP2, as well as the original substrate, can be identified with
MALDI-ToF MS.
Chapter 4 - Carbohydrate arrays
98
Methods
Fungal strains and growth conditions.
The fungus Aspergillus niger strain AB4.119 was grown on potato dextrose agar slopes at
28°C until spores were produced. All AB4.1 cultures were supplemented with 10 mM uridine.
Spores were harvested with 0.1 % (v/v) Tween 20 and liquid cultures of 100 mL aspergillus
minimal medium (AMM)9 with 1 % glucose were inoculated with 106 spores mL-1 and
incubated at 28°C, 150 RPM for 48 h. Mycelium was harvested using Miracloth, washed with
AMM without carbon source, and 1.5 g (wet weight) was transferred to cultures of 100 mL
AMM with 1 % (w/v) ball milled wheat straw and incubated for 24 h at 28°C, 150 rpm.
Preparation and composition of the straw has been described previously9. Mycelium and
culture filtrate were separated by filtration through Miracloth, the culture filtrate was
concentrated 20-fold using Vivaspin 20 columns with a 10 kDa Mw cut-off and frozen until
further analysis.
Chapter 4 - Carbohydrate arrays
99
Gene expression analysis.
Fungal mycelium was disrupted by grinding it in liquid nitrogen using a mortar and pestle.
RNA was isolated using Trizol (Invitrogen), followed by clean-up and DNAse treatment
using the NucleoSpin RNA purification kit (Macherey-Nagel). Absence of genomic DNA
was verified by PCR. cDNA was synthesized using SuperScript 3 reverse transcriptase
(Invitrogen) using 0.5 µg total RNA and oligo(dT) primer. To measure expression of cbhA,
cbhB, xynB and actA, qRT-PCR was performed on an Applied Biosystems 7500 Fast Real-
Time PCR system in a 10 µl total volume with 2 µl 4x diluted cDNA, 0.2 µM of each primer
(Supplementary Table S1) and 5 µl FAST SYBR-Green Master Mix (Applied Biosystems).
qRT-PCRs were performed with a 95°C 20 s initial denaturation, followed by 40 cycles of
95°C for 3 s and 60°C for 30 s, with all measurements in technical duplicate. Production of
a single product was verified using a melt-curve. Gene expression levels were calculated from
a genomic DNA standard curve, and corrected for expression of the reference gene20 actA.
Values are given as mean standard error of biological triplicate experiments.
Protein analysis.
Proteins in fungal culture filtrate were separated on 4-20% Tris-glycine Novex SDS-
PAGE gels (Invitrogen) and visualized with silver staining21. For protein identification,
proteins were precipitated by adding 5 mL trichloroacetic acid to 20 mL culture filtrate,
incubating for 1 h at 4°C and spinning at 16060 g for 10 min. Pellets were washed twice with
200 µL acetone, loaded onto a 10% SDS-PAGE gel and electrophoresis performed until the
dye front had moved approximately 1 cm into the separating gel. Each gel lane was then cut
into a single slice, on which in-gel tryptic digestion was performed using a DigestPro
automated digestion unit (Intavis Ltd).
Peptides were analysed generally as described by22 with the following exceptions: an
Acclaim PepMap C18 nano-trap column (Thermo Scientific) was used for injection. Peptides
were resolved with a 7 segment gradient ( 1-6 % solvent B over 1 min, 6-15 % B over 58
Chapter 4 - Carbohydrate arrays
100
min, 15-32 % B over 58 min, 32-40 % B over 5 min, 40-90 % B over 1 min, held at 90 % B
for 6 min and then reduced to 1 % B over 1 min), Tandem mass spectra were acquired in
the mass range m/z 300 to 2000, followed by MS/MS for the top twenty multiply charged
ions. Data were processed with Proteome Discoverer software v1.4 (Thermo Scientific),
searched against the A. niger SwissProt database (downloaded 23-03-16) using the SEQUEST
algorithm, with a 10 ppm peptide precursor tolerance and a maximum of 1 missed cleavage,
and peptide data was filtered to meet a false discovery rate of 1 % while retaining only
proteins identified by ≥ 2 unique peptides. The mass spectrometry proteomics data were
deposited in the PRIDE repository with dataset identifiers PXD005699 and
10.6019/PXD005699.
Isolation of hemicellulose and production of oligo-saccharides.
The hemicellulose fraction of wheat straw was isolated generally as described elsewhere23.
Briefly, 3 % (w/v) wheat straw was suspended in 0.5 M KOH at 40°C for 2.5 h, after which
the suspension was filtered through Miracloth and neutralized with 6 M acetic acid. Polymers
were precipitated by adding 3 volumes of ethanol and incubation at 4°C for ≥ 1 h. Precipitate
was collected by centrifugation, washed with 70% (v/v) ethanol and lyophilized, resulting in
the recovery of 2.4 g hemicellulose enriched fraction from 16 g of wheat straw.
Oligo-saccharides were generated by hydrolysis of 100 mg hemicellulose aliquots in 2 mL
0.5 M H2SO4 for 10 min at 100°C, after which samples were cooled and neutralized with
sodium carbonate. Water-soluble material was collected and lyophilized. The material (0.7 g)
was dissolved in 10 mM ammonium bicarbonate, rid of particles by centrifugation, and
separated on size on a Bio-Gel P4 fine (Biorad) column with a diameter of 0.9 cm and length
of 70 cm. The column was equilibrated and run in 10 mM ammonium bicarbonate at 12 mL
h-1 using a peristaltic pump, and elution fractions of 3 mL were collected for 5 hours.
Wheat arabinoxylan (Medium viscosity, Megazyme) was hydrolysed to generate oligo-
saccharides using Thermomyces lanuginosus endo-xylanase (X2753, Sigma Aldrich). A 1 % (w/v)
Chapter 4 - Carbohydrate arrays
101
solution of arabinoxylan in boiling water was prepared, and cooled to 60°C. Xylanase (8 mg
mL-1 suspension in sodium citrate buffer pH 6) was added as 200 µL per g arabinoxylan and
incubated for 30 min at 60°C. The suspension was boiled for 5 min to stop enzyme activity,
cooled and lyophilized. Recovered soluble material (1 g) was dissolved in 4 mL 10 mM
ammonium bicarbonate and separated on the Bio-Gel column as described above.
Characterization of oligo-saccharides.
Fractions containing oligo-saccharides were analysed by TLC, MALDI-ToF-MS and
NMR. TLC was performed by separating samples on TLC silica 60 plates with aluminium
backing (Merck), and a liquid phase of butanol: ethanol: water in 5:5:3 ratio (v/v).
Carbohydrates were visualized by dipping the plate in orcinol solution (250 mg orcinol
(Sigma) in 95 mL ethanol, 5 mL H2SO4) and heating the plate to 100°C. Samples were
prepared for MALDI-ToF by co-crystalizing them with a 5% 2,5-dihydroxybenzoic acid
(DHB) matrix solution in methanol. MALDI-ToF MS was performed using the Bruker
Ultraflex 3 in positive mode.
Selected samples were exchanged with deuterium oxide and analysed by NMR.
Measurements were made on a Bruker AV(III)500 NMR spectrometer using a dual 1H/13C
helium-cooled cryoprobe operating with a sample temperature of 298 K. Spectra were
approximately referenced in the 1H dimension using the deuterium lock (equivalent to setting
the HDO peak = 4.75 ppm). Accurate referencing was achieved by setting the easily
identifiable reducing end α-xylose resonance equal to 5.184 ppm. This procedure gives
chemical shifts directly equivalent to those referenced relative to internal acetone at
(d=2.225 ppm) as given in24. The 13C chemical shifts were measured relative to external DSS
(4,4-dimethyl-4-silapentane-1-sulfonic acid) set to -1.6 ppm and thus are indicative only.
1H NMR spectra were recorded with 30 degree pulses, a data acquisition time of 3.17 s
and a relaxation delay of 1 s. The spectral width was 20.6 ppm. Data were zero-filled and
multiplied by an exponential window function with lb = 0.3 Hz prior to Fourier
Chapter 4 - Carbohydrate arrays
102
transformation. Spectra were baseline corrected and integrated using the standard routine in
the Bruker TOPSPIN software (no lineshape fitting was attempted).
HSQC spectra were acquired phase sensitive in echo/anti-echo mode in a 1k x 256 data
matrix using the Bruker pulse program hsqcetgpsisp2.2 which utilises double inept transfer.
13C decoupling was applied during acquisition. Prior to Fourier transformation, data points
in the F1 dimension were doubled using linear prediction (64 coefficients), the data matrix
was zero-filled to 2k x 1k real data points. A cosine-squared window function was applied to
the data.
TOCSY spectra were acquired phase sensitive in echo/anti-echo mode in a 2k x 512 data
matrix using the Bruker pulse program dipsi2etgpsi which utilises the DIPSI 2 sequence for
mixing. The mixing time was set to 15 ms to observe direct correlations or 80 ms to observe
coupling networks. Prior to Fourier transformation, data points in the F1 dimension were
doubled using linear prediction, the data matrix was zero-filled to 4k x 1k real data points. A
cosine-squared window function was applied to the data.
Preparation of carbohydrate arrays.
Maltose (Sigma-Aldrich), cellotetraose, cellohexaose and xylohexaose (Megazyme) were
coupled to hexadecylamine via reductive amination; 1-5 mg carbohydrate with
hexadecylamine (2 : 1 molar ratio), 1 M sodium cyanoborohydride in 1 mL of 90% (v/v)
DMSO, 10% (v/v) acetic acid and incubated overnight at 70°C. Reactions were diluted with
methanol before use.
Reductive amination of non-commercial oligo-saccharides (hemicellulose fractions H5,
H6, H7, H9 and arabinoxylan fractions AX10, AX11, AX12, AX15) was performed
according to an alternative method based on the work of Gildersleeve et al.25. Briefly, oligo-
saccharides (0.4 mg) were dissolved in a mixture of sodium borate buffer (31 µL of a 400
mM solution, pH 8.5) and sodium sulfate buffer (21 µL of a 3 M solution, 50°C), then
hexadecylamine (12 µL from 6.43 mg of hexadecylamine in 3 mL of methanol) and sodium
Chapter 4 - Carbohydrate arrays
103
cyanoborohydride (1.77 mg) were added. The reaction was allowed to warm at 56°C.
Labelling of the oligo-saccharides could be visualised by application of 1 µL of α-cyano-4-
hydroxycinnamic acid (CHCA) (20 mg mL-1 in a mixture of 50% (v/v) acetonitrile and 50 %
(v/v) water containing 0.1 % of trifluoroacetic acid (TFA)) followed by MALDI-ToF MS.
After 8 h, the reaction mixture was cooled at room temperature, diluted in water/methanol
(2 mL, typically in a 4:1 ratio) and stored at room temperature.
Gold-coated MALDI target plates (AB Sciex Ltd (AB plates)) were cleaned with a mixture
of 30% (v/v) hydrogen peroxide and 70 % (v/v) sulphuric acid for 20 min, rinsed extensively
with water, followed by methanol and dried under a stream of nitrogen. Then, the plates
were incubated overnight in 1-undecanethiol (37.5 µL in 20 mL of methanol) forming a
hydrophobic SAM. Plates were washed with methanol, dried under a stream of nitrogen, and
1 µL of hexadecylamine labelled oligo-saccharides, diluted to 0.2 mg mL-1 in water:methanol
(4:1, vol/vol), were spotted on each well. After incubation for 20 min in a sealed container,
plates were washed twice with water. MALDI-ToF MS confirmed immobilization after
application of 1 µL of DHB (15 mg mL-1 in a mixture of 50% (v/v) acetonitrile and 50 %
(v/v) water containing 0.1% of TFA) directly on the gold plate.
Enzyme reactions on carbohydrate arrays.
Reaction conditions for commercial enzymes were designed for incomplete substrate
degradation, thus allowing identification of both substrates and products in one mass
spectrum. β-glucosidase from almond (49290, Sigma-Aldrich) was prepared as 1 mg mL-1 (≥
6 U mL-1) in water, then 2 µL was spotted on the carbohydrate array and the plate was
incubated for 30 min at 37°C in a sealed container. Endo-xylanase from Thermomyces
lanuginosus (X2753, Sigma Aldrich) was prepared as 5 ng mL-1 (≥ 10 mU mL-1), mixed 1:1 with
100 mM citric acid-sodium phosphate buffer (pH 8), then 2 µL was spotted on the
carbohydrate array and the plate was incubated for 10 min at 30°C in a sealed container.
Measurements to determine the minimal enzyme amount that can reliably be detected were
Chapter 4 - Carbohydrate arrays
104
performed with a dilution range of xylanase, incubated at pH 6 for 2 h at 30°C. Culture
filtrates from A. niger grown on wheat straw (1-fold or 20-fold concentrated) were mixed 1:1
with 100 mM citric acid-sodium phosphate buffer (pH 4), then 2 µL were spotted on the
carbohydrate array and the plate was incubated for 2 h at 30°C in a sealed container. After
incubation, the plates were dipped into distilled water and shaken gently for 1 min, and then
dried under a stream of nitrogen. Reaction products were identified with MALDI-ToF MS
and MS-MS on a Ultraflex II TOF/TOF, using 2’, 4’,6’-trihydroxyacetophenone
monohydrate (THAP) (10 mg mL-1 in acetone) or DHB (15 mg mL-1 in a mixture of 50%
(v/v) acetonitrile and 50% (v/v) water containing 0.1% of TFA) as matrix.
Mass spectrometric analysis of arrays.
Gold AB plates were loaded into the instrument using the MTB AB adapter (Bruker).
MALDI-ToF mass spectra (1500 shots/spectrum) were recorded on a Bruker Ultraflex II
instrument with a Smartbeam I laser in positive reflector ion mode. The instrument was
calibrated between m/z 700-3500 using a solution of peptide calibration mix II (Bruker
Daltonics, Bremen). Data were analysed and normalised using FlexAnalysis version 3.0
(Bruker).
Results
Hydrolytic enzymes secreted by A. niger grown on wheat straw.
The fungus A. niger produces a range of plant poly-saccharide degradative enzymes in
response to lignocellulose. The fungus was cultivated in liquid cultures containing glucose in
order to obtain biomass, and resulting mycelium was washed and transferred for 24 h to
liquid cultures containing ball milled wheat straw. These cultivation conditions have
previously been found to highly induce a large number of genes that encode (putative) plant
poly-saccharide active enzymes9. qRT-PCR showed that such genes were induced as
transcript levels of the cellobiohydrolases encoding genes cbhA, cbhB and the xylanase
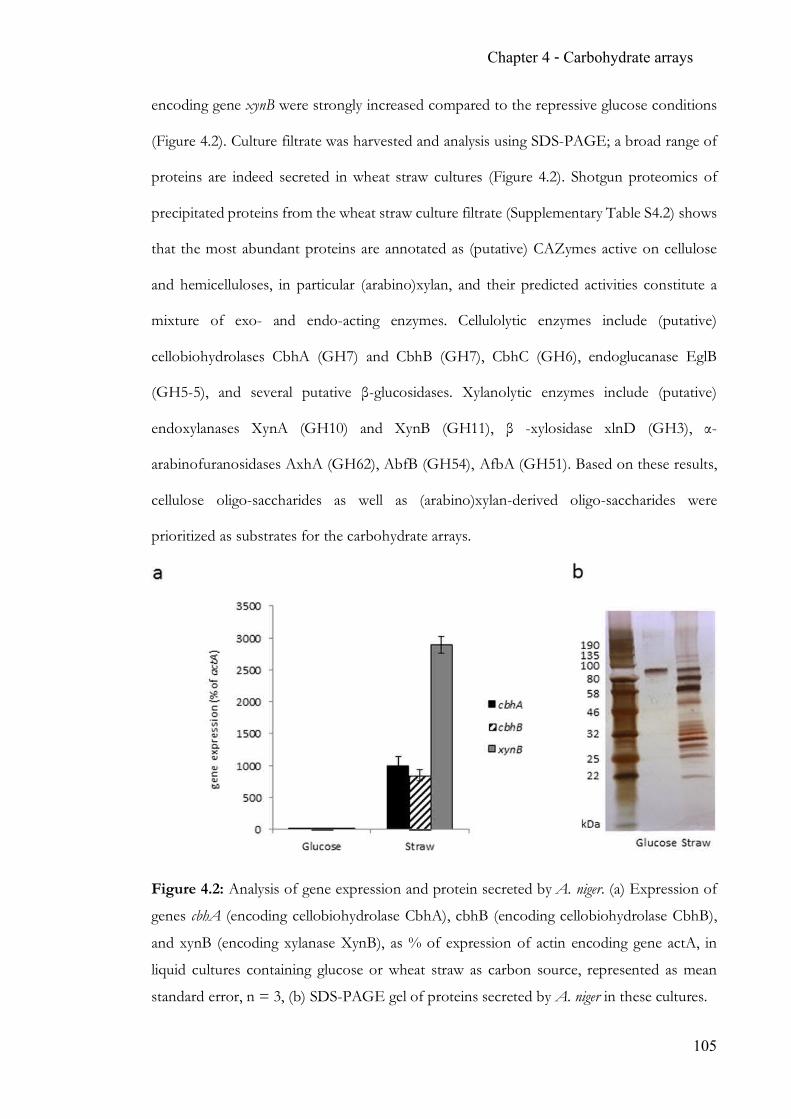
Chapter 4 - Carbohydrate arrays
105
encoding gene xynB were strongly increased compared to the repressive glucose conditions
(Figure 4.2). Culture filtrate was harvested and analysis using SDS-PAGE; a broad range of
proteins are indeed secreted in wheat straw cultures (Figure 4.2). Shotgun proteomics of
precipitated proteins from the wheat straw culture filtrate (Supplementary Table S4.2) shows
that the most abundant proteins are annotated as (putative) CAZymes active on cellulose
and hemicelluloses, in particular (arabino)xylan, and their predicted activities constitute a
mixture of exo- and endo-acting enzymes. Cellulolytic enzymes include (putative)
cellobiohydrolases CbhA (GH7) and CbhB (GH7), CbhC (GH6), endoglucanase EglB
(GH5-5), and several putative β-glucosidases. Xylanolytic enzymes include (putative)
endoxylanases XynA (GH10) and XynB (GH11), β -xylosidase xlnD (GH3), α-
arabinofuranosidases AxhA (GH62), AbfB (GH54), AfbA (GH51). Based on these results,
cellulose oligo-saccharides as well as (arabino)xylan-derived oligo-saccharides were
prioritized as substrates for the carbohydrate arrays.
Figure 4.2: Analysis of gene expression and protein secreted by A. niger. (a) Expression of
genes cbhA (encoding cellobiohydrolase CbhA), cbhB (encoding cellobiohydrolase CbhB),
and xynB (encoding xylanase XynB), as % of expression of actin encoding gene actA, in
liquid cultures containing glucose or wheat straw as carbon source, represented as mean
standard error, n = 3, (b) SDS-PAGE gel of proteins secreted by A. niger in these cultures.
Chapter 4 - Carbohydrate arrays
106
Production of oligo-saccharides.
To obtain broad structural variety, (arabino)xylan oligo-saccharides were generated from
multiple sources. The xylan-rich hemicellulose fraction isolated from wheat straw was
digested using mild acid hydrolysis, whereas commercially obtained wheat arabinoxylan was
enzymatically hydrolysed. The obtained oligo-saccharide mixtures (referred to as fractions
Hn and AXn respectively, where n indicates the fraction number) were subjected to size
exclusion chromatography to remove monomers and low molecular weight oligo-
saccharides, as well as the remaining poly-saccharide. Separation and visualisation of the
soluble hemicellulose-derived hydrolysis products (H) on TLC, (Supplementary Figure
S4.1a), showed a range of oligo-saccharides as well as monomers. MALDI-ToF MS indicated
a series of pentose-oligo-saccharides with a degree of polymerisation (DP) of up to at least
15 (Supplementary Figure S4.1). TLC analysis of arabinoxylan derived oligo-saccharides
(AX)(Supplementary Figure S4.1b) showed generation of an oligo-saccharide series, and
MALDI-ToF MS identified masses consistent with pentose oligo-saccharides with a range
of DPs from 5 to well over 20 (Supplementary Figure S4.1). Oligo-saccharide fractions were
selected that contained mainly oligo-saccharides with a DP of 5-15 (fractions H5-H9) and 5-
20 (fractions AX10-AX15).
The identity and structure of obtained oligo-saccharides was further analysed with
NMR. Analysis of fraction H8 showed that it contained, as main component, a linear
β-(1,4)-Xylp oligo-saccharides with an average DP of ~ 7, as derived from chemical
shifts observed in the 1H-1H TOCSY NMR spectrum of fraction H8 (Supplementary
Table S4.3). The 1D 1H NMR and 2D 1H-13C HSQC NMR chemical shifts
(Supplementary Table S4.4) of fractions H6, H7, H8 also corresponded with oligo-
saccharides with a linear β-1,4-Xylp backbone. Based on chemical shifts reported for similar
structures26, the oligo-saccharides contained 4-O-methyl-glucuronic acid (MeGlcAp) and
Chapter 4 - Carbohydrate arrays
107
glucuronic acid (GlcAp) decorations (Figure 4.3). The H-fractions varied in backbone DP
and number of decorations. Integration of the 1D 1H NMR signals (Supplementary Table
S4.4) indicated that the oligo-saccharides have an average backbone DP of 10.4, 8.3 and 7.9
for H6, H7 and H8 respectively, with an average of 1.1, 0.8 and 0.6 decorations per oligo-
saccharide.
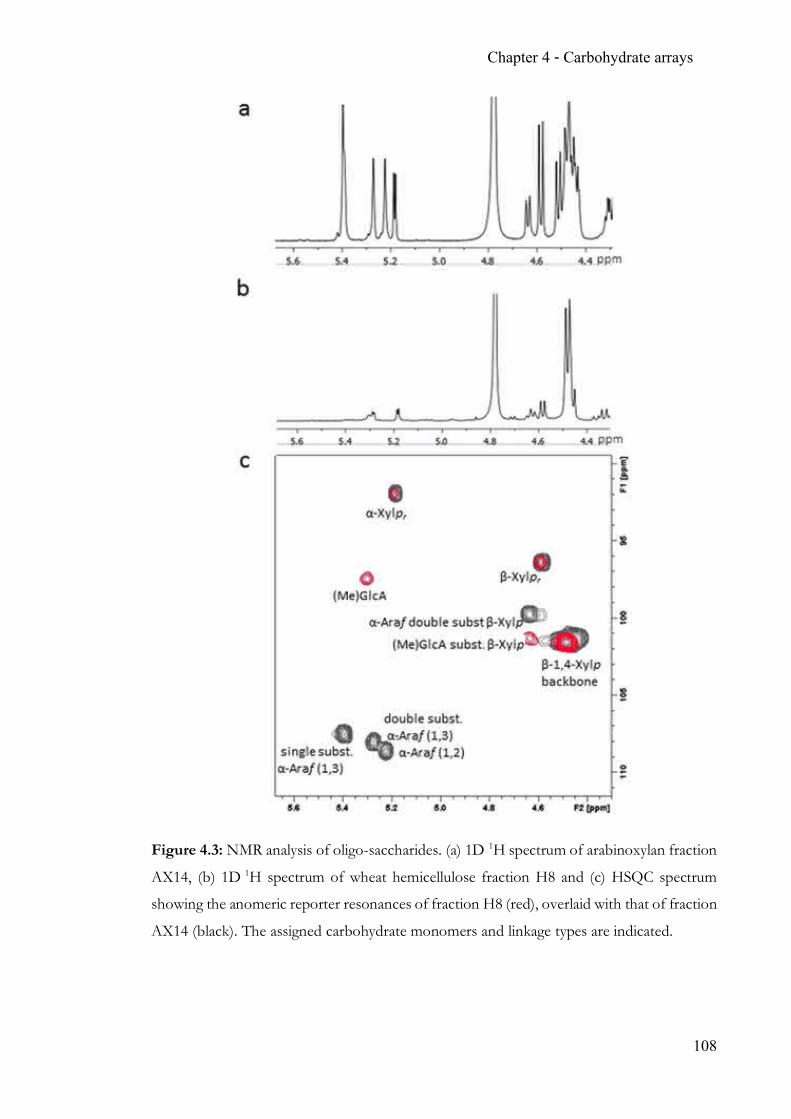
Chapter 4 - Carbohydrate arrays
108
Figure 4.3: NMR analysis of oligo-saccharides. (a) 1D 1H spectrum of arabinoxylan fraction
AX14, (b) 1D 1H spectrum of wheat hemicellulose fraction H8 and (c) HSQC spectrum
showing the anomeric reporter resonances of fraction H8 (red), overlaid with that of fraction
AX14 (black). The assigned carbohydrate monomers and linkage types are indicated.
Chapter 4 - Carbohydrate arrays
109
1D 1H NMR and 2D 1H-13C HSQC NMR chemical shifts of fractions AX14 and AX15,
reported in Supplementary Table S4.4, indicated that these samples also contain oligo-
saccharides with a linear β-1,4-Xylp backbone (Figure 4.3). No (Me)GlcAp decorations were
observed, but the oligo-saccharides contained one or more xylose residues with a single or
double α-Araf substitutions, as indicated by comparison of chemical shifts with those
reported for similar structures27. Integration of the 1D 1H NMR signals indicated that the
oligo-saccharides have an average xylose backbone DP of 4.9 and 4.3 for AX14 and AX15
respectively. The ratio of oligo-saccharides with single and double α-Araf substitutions
differed slightly between fraction AX14 and AX15. On average, AX14 had 0.9 single or 0.4
double Araf substituted xylose residues respectively and AX15 had 0.7 single or 0.3 double
Araf substituted xylose residues.
Carbohydrate array production.
A hydrophobic self-assembling monolayer (SAM) on a gold plate was used as a scaffold
for the immobilization of various labelled carbohydrates via hydrophobic interaction. A small
library of oligo-saccharides activated for attachment to the hydrophobic SAM was generated,
by linking glycans covalently to a hydrophobic hexadecylamine tail using reductive amination.
Using a classical method with 90% (v/v) DMSO, 10% (v/v) acetic acid28, commercially
obtained cellotetraose, cellohexaose and xylohexaose were readily attached to
hexadecylamine. However, as this procedure failed with isolated oligo-saccharides from
fraction AX (AX10, AX11, AX12, AX15) or fraction H (H5, H6, H7, H9), we developed an
alternative method, largely inspired by the work of Gildersleeve et al.25, that successfully
labelled oligo-saccharides, as identified with MALDI-ToF MS. The unlabelled oligo-
saccharides were observed using DHB or THAP as matrix, while the labelled oligo-
saccharides can be analysed solely with CHCA. Carbohydrates labelled with hexadecylamine
were immobilized on a gold plate that was functionalized with a hydrophobic SAM of 1-
undecanethiol. After incubation, the plate was washed with water to remove non-
Chapter 4 - Carbohydrate arrays
110
immobilised carbohydrates, as well as the NaBH3CN from the reductive amination step,
which may interfere with MS measurements and enzymatic activity.
All DP oligo-saccharide fragments were retained upon labelling of AX and H fractions
(Supplementary Figure S4.2). Some discrepancies in relative intensity are observed between
unlabelled and labelled (for example DP6 is relatively more intense in the labelled fraction
AX10). This may be the result of alterations in the ionisation efficiency of the two systems,
differences in solubility as well as preferential labelling of certain oligo-saccharides depending
on their degree of polymerization and the presence of substitutions25,29-32. The signal intensity
ratios between peaks during reductive amination reactions with an excess of hexadecylamine
(Supplementary Table S4.6, procedure a vs b), indicated that preferential labelling contributed
to the observed effect, as over time low DP oligo-saccharides were initially labelled while the
final signal intensity ratios were more in agreement with the unlabelled oligo-saccharides.
Influence of degradation of high DP oligo-saccharides was excluded as no increase in signals
corresponding to DP1-4 are observed after labelling and monitoring of the reductive
amination reaction of fraction AX10 for up to 3 days showed that the signal intensity ratios
between peaks were stable from 4 h up 3 days (Supplementary Table S4.6, procedure a).
Conveniently, after immobilization onto the SAM, both low and high DP labelled oligo-
saccharides can still be measured by MS, albeit for high DP oligo-saccharides with a much
reduced signal (Supplementary Figure S4.2). This may be a result of a reduced ionisation
efficiency for these non-covalently immobilised systems, or preferential attachment of low
DP oligo-saccharides. However, we show here that higher DP oligo-saccharides are
successfully immobilized on this array platform, with products of well over DP10 detected
in H9 and AX10 fractions with considerable signal intensity. Furthermore, comparison of
peak ratios of oligo-saccharides on arrays generated on separate days showed that interday
reproducibility was excellent, with a variation in peak ratios below 4% relative standard
deviation (Supplementary Table S4.6).
Chapter 4 - Carbohydrate arrays
111
To estimate the surface capacity to bind labelled oligo-saccharide and the effect of oligo-
saccharide concentration, oligo-saccharides were applied on the plate in a range of
concentrations from 3.1 mg mL-1 to 0.2 mg mL-1 in water:methanol (4:1, v/v). Regardless of
the dilution, the spectra obtained were similar in all respects, suggesting that a 0.2 mg mL-1
concentration is sufficient for efficient reproducible array formation. This allows for 5000
assays per mg carbohydrate and equals application of 0.1-0.2 nmol carbohydrate.
The successful attachment of a range of commercial oligo-saccharides as well as oligo-
saccharides in AX- and H-fractions shows that not only oligo-saccharides with a low DP can
be attached, but also linear and decorated oligo-saccharides of considerably higher DP. Such
longer oligo-saccharides (mainly DP7-DP10 range) are rarely available commercially, and
often not tested for carbohydrate array platforms18,33. However, these substrates are essential
for adequate detection and characterisation of endo-acting enzymes since these enzymes
often have extensive substrate binding clefts in which multiple binding sites contribute to
substrate and product specificity34.
Carbohydrate arrays are suitable to detect enzyme activity.
In order to establish whether these carbohydrate arrays can be used as a method for the
detection and identification of products resulting from enzyme activity, carbohydrate arrays
were incubated with exo- and endo-acting enzymes and, after washing to remove sample and
non-attached degradation products, reaction products were identified by MALDI-ToF MS.
Exo-acting activity of β-glucosidase cleaves terminal glucose residues from cellulose oligo-
saccharides. Incubation of β-glucosidase on cellotetraose on carbohydrate arrays resulted, as
expected, in a reaction product with masses corresponding to hexadecylamide-labeled
cellotriose (Figure 4.4). Endoxylanase from Thermomyces lanuginosus acting on xylohexaose
containing carbohydrate arrays resulted in products with masses corresponding to
hexadecylamide labelled xylopentaose, xylotetraose and xylotriose (Figure 4.4). The
minimum xylanase enzyme concentration resulting in activity that could reliably be detected
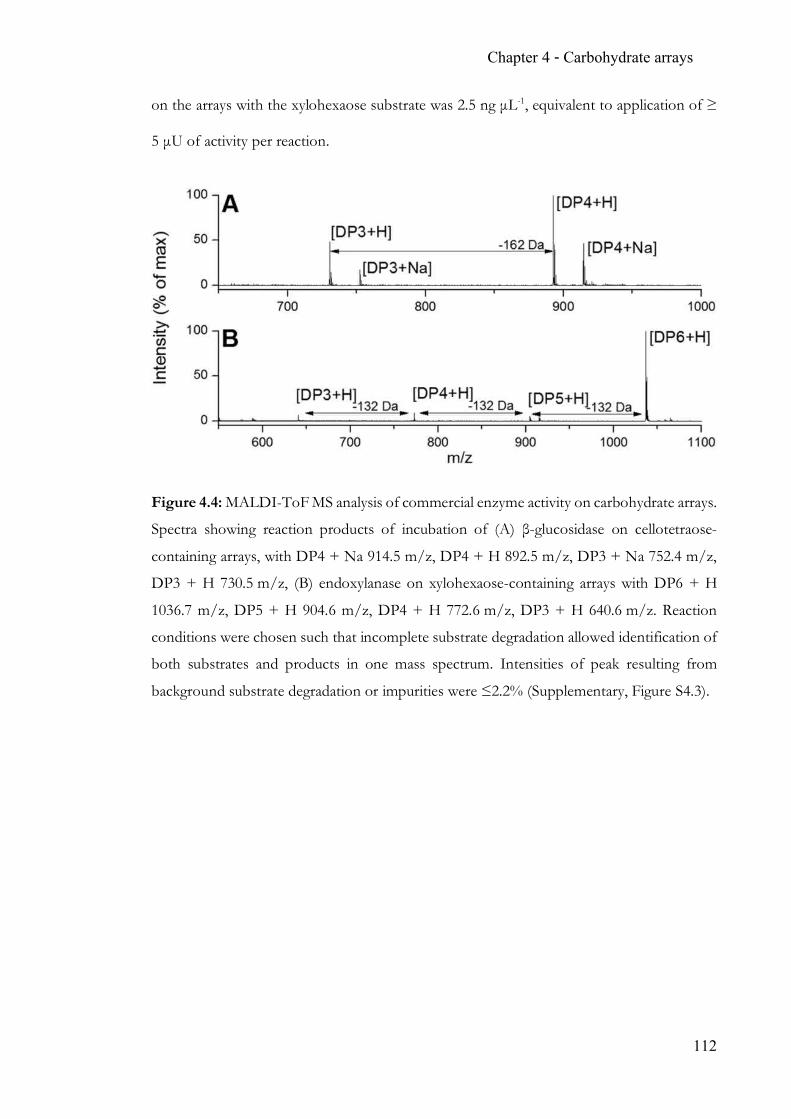
Chapter 4 - Carbohydrate arrays
112
on the arrays with the xylohexaose substrate was 2.5 ng µL-1, equivalent to application of ≥
5 µU of activity per reaction.
Figure 4.4: MALDI-ToF MS analysis of commercial enzyme activity on carbohydrate arrays.
Spectra showing reaction products of incubation of (A) β-glucosidase on cellotetraose-
containing arrays, with DP4 + Na 914.5 m/z, DP4 + H 892.5 m/z, DP3 + Na 752.4 m/z,
DP3 + H 730.5 m/z, (B) endoxylanase on xylohexaose-containing arrays with DP6 + H
1036.7 m/z, DP5 + H 904.6 m/z, DP4 + H 772.6 m/z, DP3 + H 640.6 m/z. Reaction
conditions were chosen such that incomplete substrate degradation allowed identification of
both substrates and products in one mass spectrum. Intensities of peak resulting from
background substrate degradation or impurities were ≤2.2% (Supplementary, Figure S4.3).
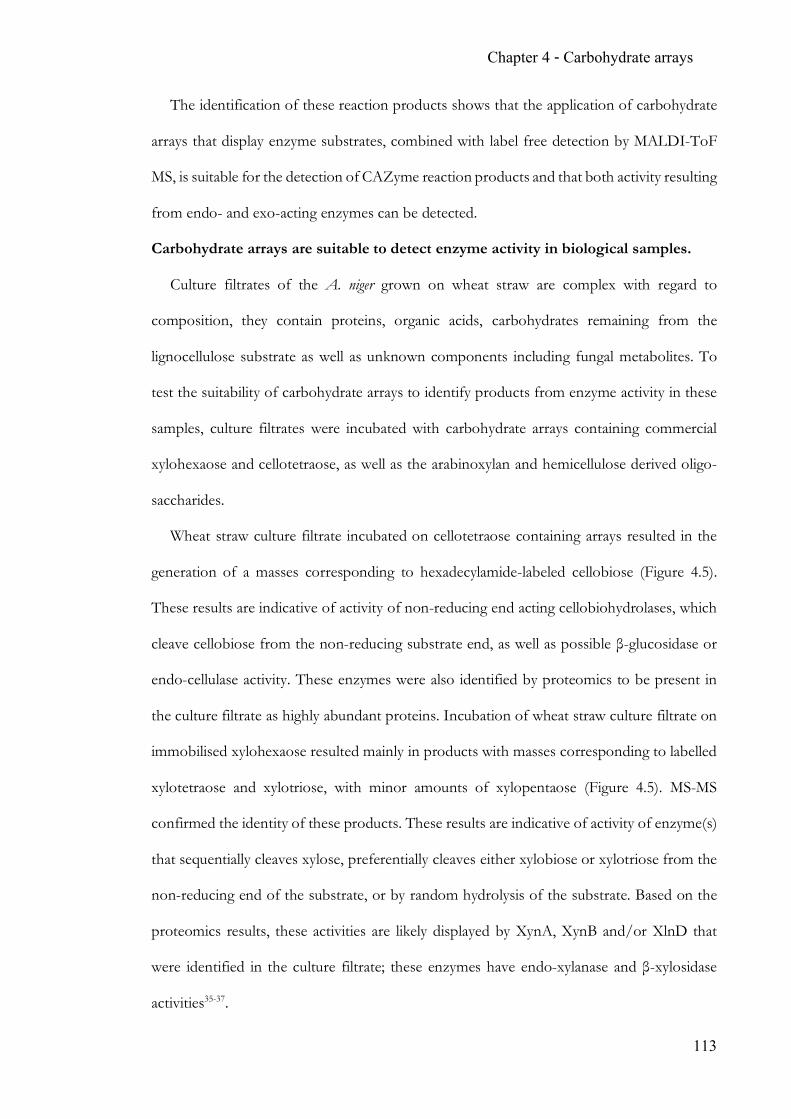
Chapter 4 - Carbohydrate arrays
113
The identification of these reaction products shows that the application of carbohydrate
arrays that display enzyme substrates, combined with label free detection by MALDI-ToF
MS, is suitable for the detection of CAZyme reaction products and that both activity resulting
from endo- and exo-acting enzymes can be detected.
Carbohydrate arrays are suitable to detect enzyme activity in biological samples.
Culture filtrates of the A. niger grown on wheat straw are complex with regard to
composition, they contain proteins, organic acids, carbohydrates remaining from the
lignocellulose substrate as well as unknown components including fungal metabolites. To
test the suitability of carbohydrate arrays to identify products from enzyme activity in these
samples, culture filtrates were incubated with carbohydrate arrays containing commercial
xylohexaose and cellotetraose, as well as the arabinoxylan and hemicellulose derived oligo-
saccharides.
Wheat straw culture filtrate incubated on cellotetraose containing arrays resulted in the
generation of a masses corresponding to hexadecylamide-labeled cellobiose (Figure 4.5).
These results are indicative of activity of non-reducing end acting cellobiohydrolases, which
cleave cellobiose from the non-reducing substrate end, as well as possible β-glucosidase or
endo-cellulase activity. These enzymes were also identified by proteomics to be present in
the culture filtrate as highly abundant proteins. Incubation of wheat straw culture filtrate on
immobilised xylohexaose resulted mainly in products with masses corresponding to labelled
xylotetraose and xylotriose, with minor amounts of xylopentaose (Figure 4.5). MS-MS
confirmed the identity of these products. These results are indicative of activity of enzyme(s)
that sequentially cleaves xylose, preferentially cleaves either xylobiose or xylotriose from the
non-reducing end of the substrate, or by random hydrolysis of the substrate. Based on the
proteomics results, these activities are likely displayed by XynA, XynB and/or XlnD that
were identified in the culture filtrate; these enzymes have endo-xylanase and β-xylosidase
activities35-37.
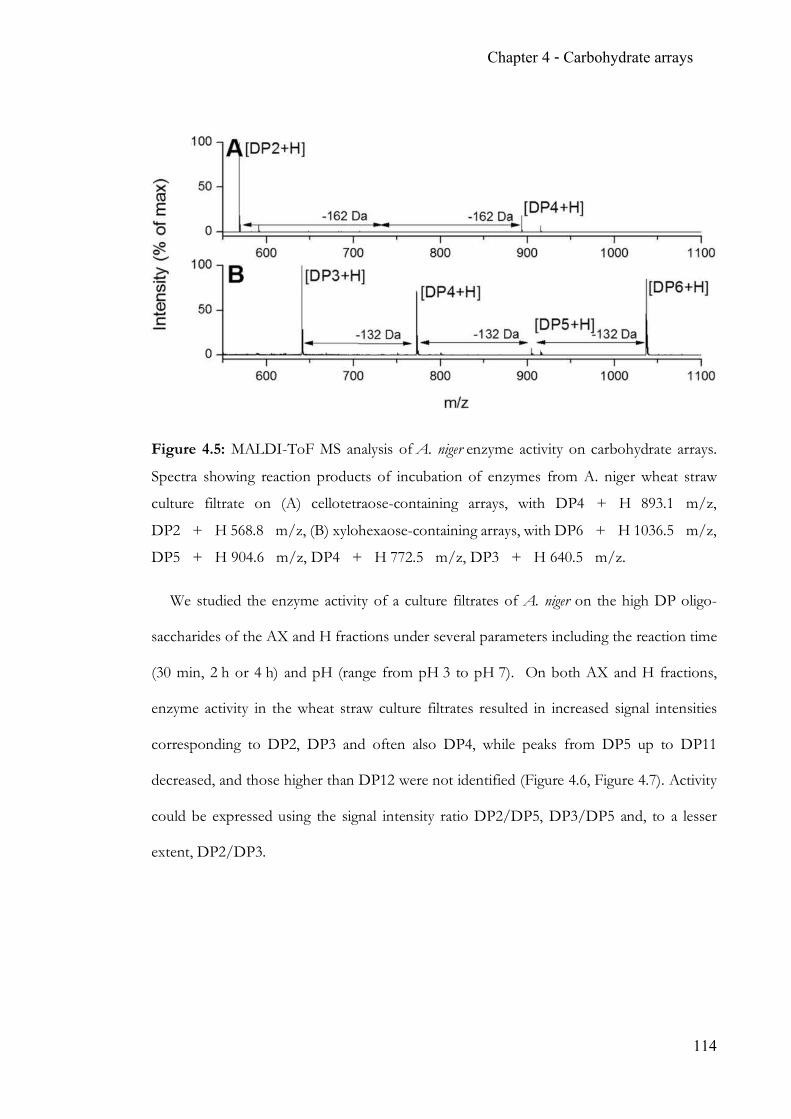
Chapter 4 - Carbohydrate arrays
114
Figure 4.5: MALDI-ToF MS analysis of A. niger enzyme activity on carbohydrate arrays.
Spectra showing reaction products of incubation of enzymes from A. niger wheat straw
culture filtrate on (A) cellotetraose-containing arrays, with DP4 + H 893.1 m/z,
DP2 + H 568.8 m/z, (B) xylohexaose-containing arrays, with DP6 + H 1036.5 m/z,
DP5 + H 904.6 m/z, DP4 + H 772.5 m/z, DP3 + H 640.5 m/z.
We studied the enzyme activity of a culture filtrates of A. niger on the high DP oligo-
saccharides of the AX and H fractions under several parameters including the reaction time
(30 min, 2 h or 4 h) and pH (range from pH 3 to pH 7). On both AX and H fractions,
enzyme activity in the wheat straw culture filtrates resulted in increased signal intensities
corresponding to DP2, DP3 and often also DP4, while peaks from DP5 up to DP11
decreased, and those higher than DP12 were not identified (Figure 4.6, Figure 4.7). Activity
could be expressed using the signal intensity ratio DP2/DP5, DP3/DP5 and, to a lesser
extent, DP2/DP3.
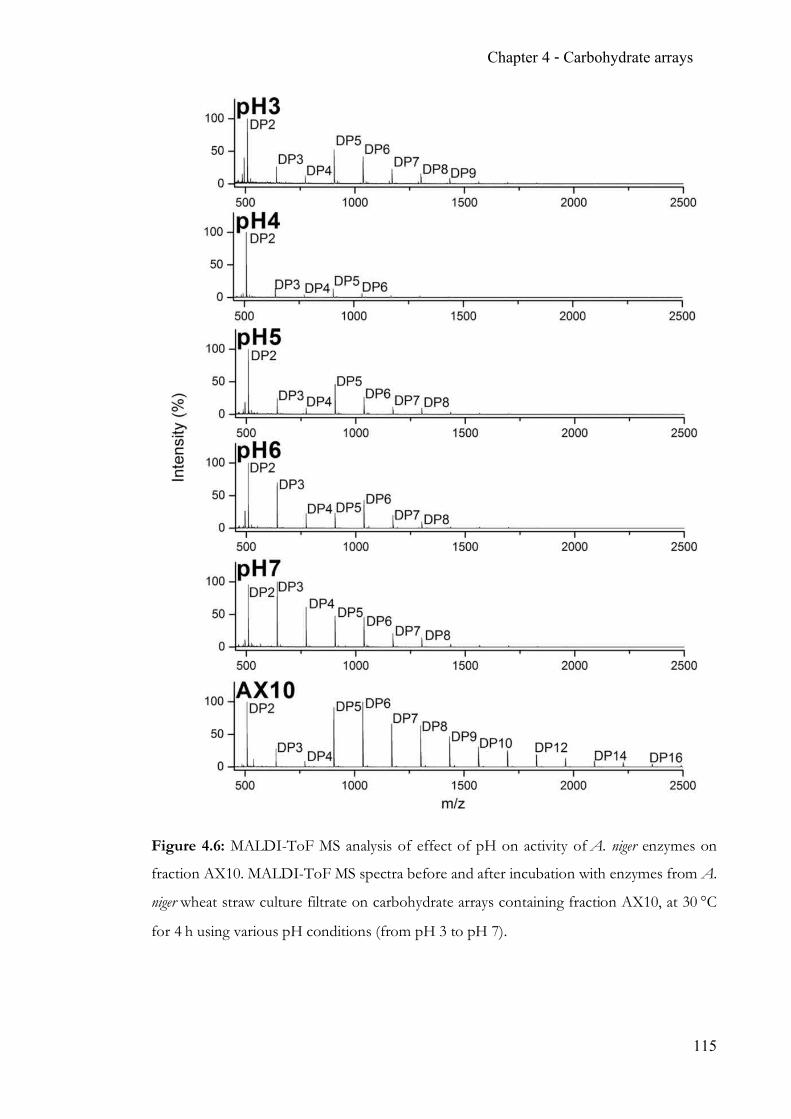
Chapter 4 - Carbohydrate arrays
115
Figure 4.6: MALDI-ToF MS analysis of effect of pH on activity of A. niger enzymes on
fraction AX10. MALDI-ToF MS spectra before and after incubation with enzymes from A.
niger wheat straw culture filtrate on carbohydrate arrays containing fraction AX10, at 30 °C
for 4 h using various pH conditions (from pH 3 to pH 7).
Chapter 4 - Carbohydrate arrays
116
Figure 4.7: MALDI-ToF MS analysis of effect of pH on activity of A. niger enzymes on
fraction H7. Maldi-ToF MS spectra before and after incubation with enzymes from A.
niger wheat straw culture filtrate on carbohydrate arrays containing fraction H7, at 30 °C for
4 h using various pH conditions (from pH 3 to pH 7).
During incubation of the culture filtrates of A. niger at pH 4 and 30°C, variation of the
time of incubation from 0 h to 2 h to 4 h indicated that the longer reaction time decreased
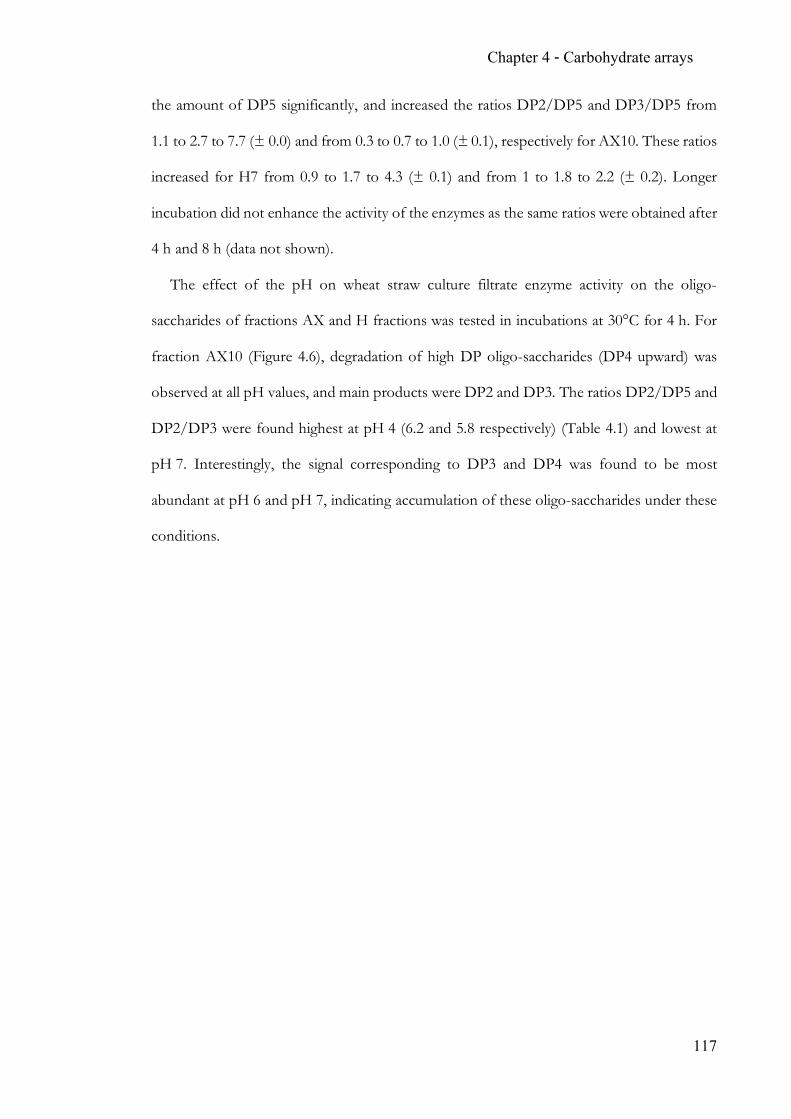
Chapter 4 - Carbohydrate arrays
117
the amount of DP5 significantly, and increased the ratios DP2/DP5 and DP3/DP5 from
1.1 to 2.7 to 7.7 (± 0.0) and from 0.3 to 0.7 to 1.0 (± 0.1), respectively for AX10. These ratios
increased for H7 from 0.9 to 1.7 to 4.3 (± 0.1) and from 1 to 1.8 to 2.2 (± 0.2). Longer
incubation did not enhance the activity of the enzymes as the same ratios were obtained after
4 h and 8 h (data not shown).
The effect of the pH on wheat straw culture filtrate enzyme activity on the oligo-
saccharides of fractions AX and H fractions was tested in incubations at 30°C for 4 h. For
fraction AX10 (Figure 4.6), degradation of high DP oligo-saccharides (DP4 upward) was
observed at all pH values, and main products were DP2 and DP3. The ratios DP2/DP5 and
DP2/DP3 were found highest at pH 4 (6.2 and 5.8 respectively) (Table 4.1) and lowest at
pH 7. Interestingly, the signal corresponding to DP3 and DP4 was found to be most
abundant at pH 6 and pH 7, indicating accumulation of these oligo-saccharides under these
conditions.
Chapter 4 - Carbohydrate arrays
118
Table 4.1: Ratio of the intensities of signal calculated for DP2/DP5, DP3/DP5, DP2/DP3
concerning fractions AX10 and H7 after incubation with A. niger enzymes at 30°C for 4 h
using various pH conditions (from pH 3 to pH 7). Values are given as mean ± standard
deviation, n=2.
DP2/DP5 DP3/DP5 DP2/DP3
AX10 H7 AX10 H7 AX10 H7 pH 3 2.2 ± 0.1 3.2 ± 0.0 0.5 ± 0.0 3.4 ± 0.3 4.3 ± 0.1 0.9 ± 0.0 pH 4 7.7 ± 0.0 4.4 ± 0.1 1.0 ± 0.1 2.4 ± 0.2 7.8 ± 0.1 1.8 ± 0.1 pH 5 2.2 ± 0.1 2.1 ± 0.0 0.5 ± 0.0 1.7 ± 0.1 4.3 ± 0.1 1.2 ± 0.1 pH 6 4.6 ± 0.1 2.7 ± 0.0 1.4 ± 0.1 4.9 ± 0.0 3.2 ± 0.1 0.5 ± 0.0 pH 7 2.1 ± 0.1 1.9 ± 0.1 2.1 ± 0.0 4.2 ± 0.1 1.1 ± 0.1 0.5 ± 0.1
No enzyme (starting material) 1.1 ± 0.0 0.7 ± 0.3 0.3 ± 0.0 0.8 ± 0.2 3.4 ± 0.1 0.8 ± 0.1
Regarding activity of the enzymes on fraction H7 (Fig. 7), the DP2 to DP3 product ratio
was >1 solely at pH 4 and pH 5 (Table 4.1). In addition, as described for the fraction AX10,
the DP2 to DP3 ratio was lower at pH 6 and pH 7 (0.5) than for the starting oligo-saccharide
(0.8), reflecting an accumulation of tri-saccharide.
A. niger seemed able to degrade the higher DP oligo-saccharides and produce low DP
oligo-saccharides both in acid and in neutral condition (from pH 3 to pH 7) in both AX and
H oligo-saccharide fractions. However, pH dependent activity was observed since the
enzyme mixture was less active at pH 6-7, resulting in an accumulation of tri-saccharide
(DP3) and tetra-saccharide (DP4). These results have clearly indicated that the overall
optimum pH for this mixture of enzymes on these substrates, using our platform, was at
pH 4.
Chapter 4 - Carbohydrate arrays
119
Discussion
Through this study, we have confirmed that the carbohydrate microarray-based
technology combined with MALDI-ToF MS is a powerful strategy for the assessment of
enzyme activity in many simultaneous experiments using small amounts of valuable
carbohydrates. Linear as well as decorated oligo-saccharides, with both low and high DP, can
be efficiently immobilised on the arrays, after which their enzymatic degradation can be
monitored by MALDI-ToF MS.
Both covalent and non-covalent attachment of carbohydrates on arrays has been
described15-17. Some of these platforms require chemical modification via several synthetic
steps to generate carbohydrates suitable for attachment, which is readily performed with
monomers but less straight forward for oligo-saccharides. To enable the generation of arrays
with a range of oligo-saccharides, which are generally available in small quantities, we selected
an attachment strategy that requires minimal synthetic modification; the attachment of a
hydrophobic anchor via reductive amination, which can immobilise the attached
carbohydrate on a hydrophobic SAM. A relatively short hydrophobic anchor (C12)
immobilised poorly in our hands during initial test, while longer (C18, double C16) anchors,
as described18, provided effective immobilisation, resulting in the employment of the C16
hexadecylamine immobilisation anchor described here.
Reductive amination of oligo-saccharide has been widely used in the past for several
applications including conjugation of carbohydrate to proteins or other scaffolds in order to
produce molecules of pharmaceutical utility, as well as derivatization of biological sugars
affording better detection and analysis by liquid chromatography and/or mass
spectrometry38. The procedure generally employed for reductive amination of free oligo-
saccharide was described by Roy et al39 in 1984, using sugar in the presence of NaBH3CN
and aqueous sodium borate buffer for 24 h at 37-50°C. The alternative protocol developed
Chapter 4 - Carbohydrate arrays
120
by the group of Gildersleeve25 is rather similar, except for the use of salt additives such as
sodium sulfate. The authors have suggested that high salt concentrations could make the
removal of water molecule easier, and hence, might favour formation of the imine. We
explored the role of the sodium sulfate buffer by performing reductive amination with or
without this salt additives; the presence of sodium sulfate buffer accelerates the rate of the
reaction.
Purification of labelled oligo-saccharides, which is time consuming and leads to a loss of
material, can be avoidable following our approach. As an example, with solely 0.4 mg of
oligo-saccharide starting material, we could perform up to 2000 array experiments. However,
without such purification no estimate can be obtained of the yield of the labelling reaction,
making it impossible to compare yield between different oligo-saccharide fractions.
However, by comparing the signal intensity obtained during the MS analysis for each
compound in the AX and H fractions over time, we showed that oligo-saccharides with a
low DP were labelled more effectively than those with the highest DP, which seems to be
remedied by addition of amine.
The identification of reaction products from degradation of plant-biomass derived oligo-
saccharides in complex samples as these fungal culture filtrates, as well of that of commercial
enzyme preparations, shows that the hydrophobic carbohydrate array coupled with MS was
a platform that was well suited for measurement of such enzyme activities. The enzyme
activities that were detected using the linear commercial oligo-saccharides confirmed that the
platform is suitable for detection of both exo- and endo-acting enzymes. Analysing enzyme
activity on a single substrate, as performed here, gives a good indication of the presence or
absence of degradative activities. It however has limited value in deriving a mechanism of
action for an enzyme because the activity of a single enzyme during substrate degradation
can result in multiple products: to study the substrate/product profile of a single enzyme in
Chapter 4 - Carbohydrate arrays
121
detail, separate incubations of the enzyme with a set of defined substrates of different lengths
will be required.
For example, β-glucosidase hydrolyses the terminal residue of cellulose oligo-saccharides,
and degradation of substrate cellotetraose can thus theoretically result in cellotriose, and after
another hydrolysis event on the same molecule, also in cellobiose. We did not observe the
formation of cellobiose under our reaction conditions, which – besides steric effects - may
point towards cellotetraose being the minimum length substrate for this particular enzyme,
or, more likely may reflect a higher turnover rate for cellotetraose vs cellotriose. Similarly,
different fits of substrates in the active cleft of the endo-acting enzyme may result in a range
of different products, which may or may not be degraded further dependent on the minimum
substrate length required by the enzyme and any differences in kinetics that it displays for
these different substrates. This explains the range of products resulting from endo-xylanase
activity observed in this study.
Using mixtures of such plant derived oligo-saccharides with high DP, i.e. AX and H
fractions we demonstrated that the optimum conditions required to observe an activity of
the culture filtrates of A. niger on arabinoxylan or xylan oligo-saccharides was an incubation
at pH 4 for 4 h at 30°C. At higher pH, accumulation of DP3 and DP4 oligo-saccharides was
observed. For the oligo-saccharides from the AX fractions, this could be due to reduced
activity of α-arabinofuranosidases such as AbfB and AxhA that removes the arabinose
decorations from the xylose backbone. However, since the same phenomenon was also
observed for the H-fraction oligo-saccharides, it is more likely due to a reduction in an exo-
acting β-xylosidase that degrades the xylose backbone of DP4 and DP3 to DP2. The
proteomics results indicated that such an enzyme, XlnD, was indeed present in the culture
filtrates of A. niger grown on wheat straw.
Some divergence existed of the activity of A. niger enzymes in the culture filtrate when
degrading oligo-saccharides in the H7 and AX10 fractions; the latter seems to be a better
Chapter 4 - Carbohydrate arrays
122
substrate for the enzyme mixture as the reduction in maximum observed DP was much
greater for AX (from DP20 to DP9) than for H (from DP14 to DP11). It is surprising that
the AX fraction seems to be degraded more efficiently, since the structure is more complex
(i.e. decorated with arabinose) compared to H (linear xylose series). However, the complex
structure also means that a higher number of enzymes that are all highly abundant present in
the culture filtrate can act on the oligo-saccharide; not only the XynA GH10 and XynB
GH11 endo-xylanases but also the arabinofuranosidases AfbB and AxhA. Furthermore,
GH10 xylanases as XynA - which is the most abundant protein identified in the culture
filtrate - are reported to more efficiently degrade arabinose-decorated xylose oligo-saccharide
compared to undecorated oligo-saccharides34, thus possibly contributing to quicker turnover
of AX than H oligo-saccharide series. Alternatively, steric interference may contribute to the
observed differences in degradation between the H and AX fractions, as close proximity of
substrate molecules on the SAM may limit their availability to enzymatic modification or
degradation. This underlines the need to immobilise a minimal amount of substrate on the
SAM to limit such interferences.
No signal corresponding to DP1 was observed in all the conditions assayed, probably
because the reductive amination yielded an unnatural ring-opened product, which could be
not recognized as a substrate by the enzyme and led to an accumulation of DP2. This also
suggested that A. niger enzymes need a closed-ring hemiacetal mono-saccharide as backbone
in order to be active.
In conclusion, we reported on the production of a carbohydrate array with plant polymer-
derived oligo-saccharides, and its application to detect activity of carbohydrate active
enzymes in commercial preparations as well as biological samples. To our knowledge, this is
the first report describing the use of a carbohydrate array with high DP oligo-saccharide
substrates in combination with MALDI-ToF MS. By using mass spectrometry instead of
labelled antibodies in combination with the arrays, we made a significant advancement in
Chapter 4 - Carbohydrate arrays
123
detection of the substrate alterations that result from enzyme activities. This opens up the
possibility of distinguishing different enzyme activities, such as exo- or endo-active enzymes,
based on their product profiles. It also offers the opportunity to detect and distinguish
between enzyme activities with different mechanisms to hydrolyse the substrate, such as
LMPOs, lyases and endo-acting hydrolyses, as well as potential new mechanisms. This
platform could form a basis for on-chip identification of complex enzyme products in
combination with a recently developed carbohydrate sequencing method based on ion
mobility-mass spectrometry (IM-MS)40-42.39
References
[1] Klein-Marcuschamer, D., Oleskowicz-Popiel, P., Simmons, B. A. & Blanch, H. W. The
challenge of enzyme cost in the production of lignocellulosic biofuels. Biotechnol Bioeng
109, 1083-1087 (2012).
[2] Chundawat, S. P., Beckham, G. T., Himmel, M. E. & Dale, B. E. Deconstruction of
lignocellulosic biomass to fuels and chemicals. Annu Rev Chem Biomol Eng 2, 121-145
(2011).
[3] Lombard, V., Golaconda Ramulu, H., Drula, E., Coutinho, P. M. & Henrissat, B. The
carbohydrate-active enzymes database (CAZy) in 2013. Nucleic Acids Res 42, D490-495
(2014).
[4] Gilbert, H. J. The biochemistry and structural biology of plant cell wall deconstruction.
Plant Physiol 153, 444-455 (2010).
[5] Kubicek, C. P., Mikus, M., Schuster, A., Schmoll, M. & Seiboth, B. Metabolic
engineering strategies for the improvement of cellulase production by Hypocrea jecorina.
Biotechnol Biofuels 2, 19 (2009).
[6] Znameroski, E. A. et al. Induction of lignocellulose-degrading enzymes in Neurospora
crassa by cellodextrins. Proc Natl Acad Sci U S A 109, 6012-6017 (2012).
[7] Ward, O. P., Qin, W. M., Dhanjoon, J., Ye, J. & Singh, A. Physiology and
Biotechnology of Aspergillus. Adv Appl Microbiol 58C, 1-75 (2005).
[8] Andersen, M. R., Giese, M., de Vries, R. P. & Nielsen, J. Mapping the polysaccharide
degradation potential of Aspergillus niger. BMC Genomics 13, 313 (2012).
Chapter 4 - Carbohydrate arrays
124
[9] Delmas, S. et al. Uncovering the genome-wide transcriptional responses of the
filamentous fungus Aspergillus niger to lignocellulose using RNA sequencing. PLoS
Genet. 8, e1002875 (2012).
[10] Pullan, S. et al. RNA-sequencing reveals the complexities of the transcriptional
response to lignocellulosic biofuel substrates in Aspergillus niger. Fungal Biol Biotechnol 1,
3 (2014).
[11] de Souza, W. R. et al. Transcriptome analysis of Aspergillus niger grown on sugarcane
bagasse. Biotechnol Biofuels 4, 40 (2011).
[12] Pedersen, H. L. et al. Versatile high resolution oligosaccharide microarrays for plant
glycobiology and cell wall research. J Biol Chem 287, 39429-39438 (2012).
[13] Agger, J. W. et al. Discovery of LPMO activity on hemicelluloses shows the importance
of oxidative processes in plant cell wall degradation. Proc Natl Acad Sci U S A 111, 6287-
6292 (2014).
[14] Rillahan, C. D. & Paulson, J. C. Glycan microarrays for decoding the glycome. Annu
Rev Biochem 80, 797-823 (2011).
[15] Park, S., Gildersleeve, J. C., Blixt, O. & Shin, I. Carbohydrate microarrays. Chem Soc
Rev 42, 4310-4326 (2013).
[16] Donczo, B., Kerekgyarto, J., Szurmai, Z. & Guttman, A. Glycan microarrays: new
angles and new strategies. Analyst 139, 2650-2657 (2014).
[17] Gray, C. J., Weissenborn, M. J., Eyers, C. E. & Flitsch, S. L. Enzymatic reactions on
immobilised substrates. Chem Soc Rev 42, 6378-6405 (2013).
[18] Beloqui, A., Sanchez-Ruiz, A., Martin-Lomas, M. & Reichardt, N. C. A surface-based
mass spectrometry method for screening glycosidase specificity in environmental
samples. Chem Commun (Camb) 48, 1701-1703 (2012).
[19] van Hartingsveldt, W., Mattern, I. E., van Zeijl, C. M., Pouwels, P. H. & van den
Hondel, C. A. Development of a homologous transformation system for Aspergillus
niger based on the pyrG gene. Mol Gen Genet 206, 71-75 (1987).
[20] Bohle, K. et al. Selection of reference genes for normalisation of specific gene
quantification data of Aspergillus niger. J Biotechnol 132, 353-358 (2007).
[21] Yan, J. X. et al. A modified silver staining protocol for visualization of proteins
compatible with matrix-assisted laser desorption/ionization and electrospray
ionization-mass spectrometry. Electrophoresis 21, 3666-3672 (2000).
[22] Matia-Gonzalez, A. M., Laing, E. E., Gerber, A. P. Conserved mRNA-binding
proteomes in eukaryotic organisms. Nat Struct Mol Biol 22, 1027-1033 (2015).
Chapter 4 - Carbohydrate arrays
125
[23] Sun, R. C. & Tomkinson, J. Characterization of hemicelluloses obtained by classical
and ultrasonically assisted extractions from wheat straw. Carbohyd polym 50, 263-271
(2002).
[24] Kormelink, F. J. et al. Characterisation by 1H NMR spectroscopy of oligosaccharides
derived from alkali-extractable wheat-flour arabinoxylan by digestion with endo-(1--
>4)-beta-D-xylanase III from Aspergillus awamori. Carbohydr Res 249, 369-382 (1993).
[25] Gildersleeve, J. C., Oyelaran, O., Simpson, J. T. & Allred, B. Improved procedure for
direct coupling of carbohydrates to proteins via reductive amination. Bioconjug Chem 19,
1485-1490 (2008).
[26] Pena, M. J. et al. Arabidopsis irregular xylem8 and irregular xylem9: implications for
the complexity of glucuronoxylan biosynthesis. Plant Cell 19, 549-563 (2007).
[27] Vliegenthart, J. F. G. H., R.A.; Kamerling, J.P. A 1H-NMR spectroscopic study on
oligosaccharides obtained from wheat arabinoxylans, in Xylans and Xylanases (ed J.
Visser) 17-37 (Elsevier Science Publishers B.V., 1992).
[28] Bigge, J. C. et al. Nonselective and efficient fluorescent labeling of glycans using 2-
amino benzamide and anthranilic acid. Anal Biochem 230, 229-238 (1995).
[29] Stowell, S. R. et al. Human galectin-1 recognition of poly-N-acetyllactosamine and
chimeric polysaccharides. Glycobiology 14, 157-167 (2004).
[30] Beaudoin, M. E., Gauthier, J., Boucher, I. & Waldron, K. C. Capillary electrophoresis
separation of a mixture of chitin and chitosan oligosaccharides derivatized using a
modified fluorophore conjugation procedure. J Sep Sci 28, 1390-1398 (2005).
[31] Evangelista, R. A. C., F.A.; Guttman, A. Reductive amination of N-linked
oligosaccharides using organic acid catalysts. J. Chromatogr. A 745, 273-280 (1996).
[32] Rustighi, I. et al. Analysis of N-acetylaminosugars by CE: a comparative derivatization
study. Electrophoresis 30, 2632-2639 (2009).
[33] Ban, L. et al. Discovery of glycosyltransferases using carbohydrate arrays and mass
spectrometry. Nat Chem Biol 8, 769-773 (2012).
[34] Pollet, A., Delcour, J. A. & Courtin, C. M. Structural determinants of the substrate
specificities of xylanases from different glycoside hydrolase families. Crit Rev Biotechnol
30, 176-191 (2010).
[35] Do, T. T, Quyen, D. T.,Nguyen, T.N., Nguyen, V.T., Molecular characterization of a
glycosyl hydrolase family 10 xylanase from Aspergillus niger. Protein Expr Purif 92, 196-
202 (2013).
Chapter 4 - Carbohydrate arrays
126
[36] Selig, M. J. et al. Heterologous expression of Aspergillus niger beta-D-xylosidase (XlnD):
characterization on lignocellulosic substrates. Appl Biochem Biotechnol 146, 57-68 (2008).
[37] Ruanglek, V. et al. Cloning, expression, characterization and high cell-density
production of recombinant endo-1,4-β-xylanase from Aspergillus niger in Pichia pastoris.
Enzyme Microb Technol. 41, 19-25 (2007).
[38] Ruhaak, L. R. et al. Glycan labeling strategies and their use in identification and
quantification. Anal Bioanal Chem 397, 3457-3481 (2010).
[39] Roy, R., Katzenellenbogen, E. & Jennings, H. J. Improved procedures for the
conjugation of oligosaccharides to protein by reductive amination. Can J Biochem Cell
Biol 62, 270-275 (1984).
[40] Both, P. et al. Discrimination of epimeric glycans and glycopeptides using IM-MS and
its potential for carbohydrate sequencing. Nat Chem 6, 65-74 (2014).
[41] Lanucara, F., Holman, S. W., Gray, C. J. & Eyers, C. E. The power of ion mobility-
mass spectrometry for structural characterization and the study of conformational
dynamics. Nat Chem 6, 281-294 (2014).
[42] Gray, C. J. et al. Applications of ion mobility mass spectrometry for high throughput,
high resolution glycan analysis. Biochim Biophys Acta 1860, 1688-1709 (2016).
[43] van Munster, J. M. et al. The role of carbon starvation in the induction of enzymes that
degrade plant-derived carbohydrates in Aspergillus niger. Fungal Genet Biol (2014).
Chapter 4 - Carbohydrate arrays
127
Acknowledgements
We acknowledge the Proteomics Facility of the University of Bristol, for their excellent
technical support of the protein identifications via their proteomics service. We thank Kevin
Butler and Mick Cooper, School of Chemistry, University of Nottingham, for acquiring the
NMR spectra and for training on the MALDI-ToF MS equipment, respectively. This study
was supported by the Biotechnology and Biological Sciences Research Council (BBSRC)
(BB/G01616X/1 and BB/K01434X/1), the Sustainable Chemical and Biological Processing
Priority Group, University of Nottingham, the IBCatalyst Glycoenzymes for bioindustries
(BB/M02903411), IBCatalyst Chemo-enzymatic production of speciality glycans
(BB/M028836/1) and EU FP7 ITN training in neurodegeneration therapeutics, intervention
and neurorepair 'TINTIN' (608381).
Author contributions
JvM, BT, AD, MR, CJG, DA and SF designed the experiments, JvM, BT, AD and MR
performed the experiments, JvM, BT, AD, MR, DA and SF analysed the data, JvM and BT
wrote the manuscript. All authors reviewed the manuscript.
Additional information
Competing financial interests: The authors declare no competing financial interests.
Chapter 4 - Carbohydrate arrays
128
4.4 Supporting Information
Application of carbohydrate arrays coupled with mass
spectrometry to detect activity of plant-polysaccharide
degradative enzymes from the fungus Aspergillus niger
Jolanda M van Munster1*, Baptiste Thomas2, Michel Riese2, Adrienne L Davis3, Christopher
J Gray2, David B Archer1, Sabine L Flitsch2
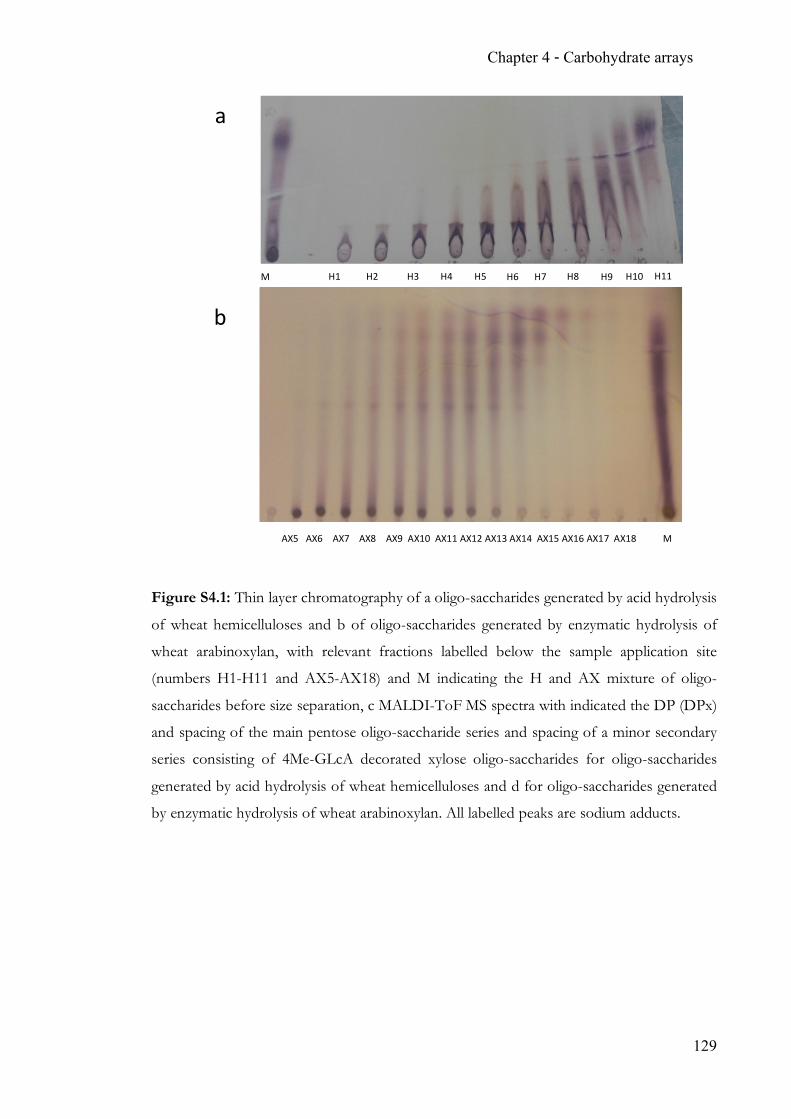
Chapter 4 - Carbohydrate arrays
129
Figure S4.1: Thin layer chromatography of a oligo-saccharides generated by acid hydrolysis
of wheat hemicelluloses and b of oligo-saccharides generated by enzymatic hydrolysis of
wheat arabinoxylan, with relevant fractions labelled below the sample application site
(numbers H1-H11 and AX5-AX18) and M indicating the H and AX mixture of oligo-
saccharides before size separation, c MALDI-ToF MS spectra with indicated the DP (DPx)
and spacing of the main pentose oligo-saccharide series and spacing of a minor secondary
series consisting of 4Me-GLcA decorated xylose oligo-saccharides for oligo-saccharides
generated by acid hydrolysis of wheat hemicelluloses and d for oligo-saccharides generated
by enzymatic hydrolysis of wheat arabinoxylan. All labelled peaks are sodium adducts.
H1 H2 H3 H4 H5 H6 H7 H8 H9 H10 H11 M
b
AX5 AX6 AX7 AX8 AX9 AX10 AX11 AX12 AX13 AX14 AX15 AX16 AX17 AX18 M
a
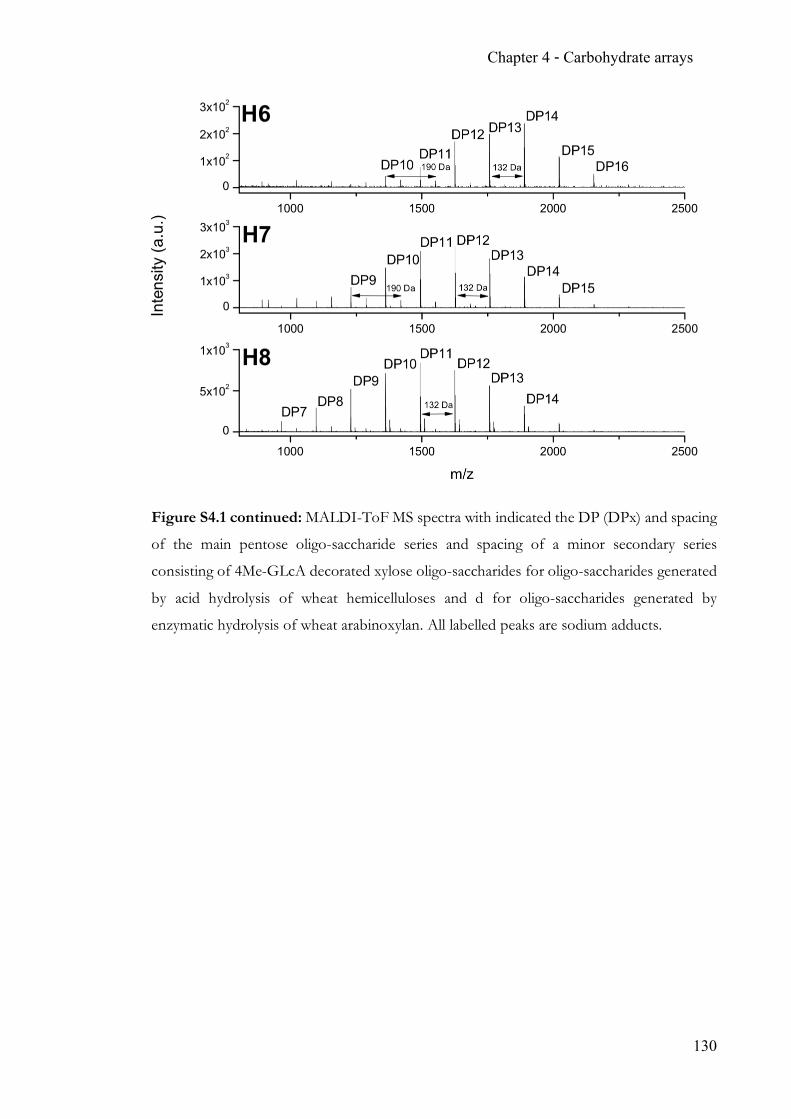
Chapter 4 - Carbohydrate arrays
130
Figure S4.1 continued: MALDI-ToF MS spectra with indicated the DP (DPx) and spacing
of the main pentose oligo-saccharide series and spacing of a minor secondary series
consisting of 4Me-GLcA decorated xylose oligo-saccharides for oligo-saccharides generated
by acid hydrolysis of wheat hemicelluloses and d for oligo-saccharides generated by
enzymatic hydrolysis of wheat arabinoxylan. All labelled peaks are sodium adducts.
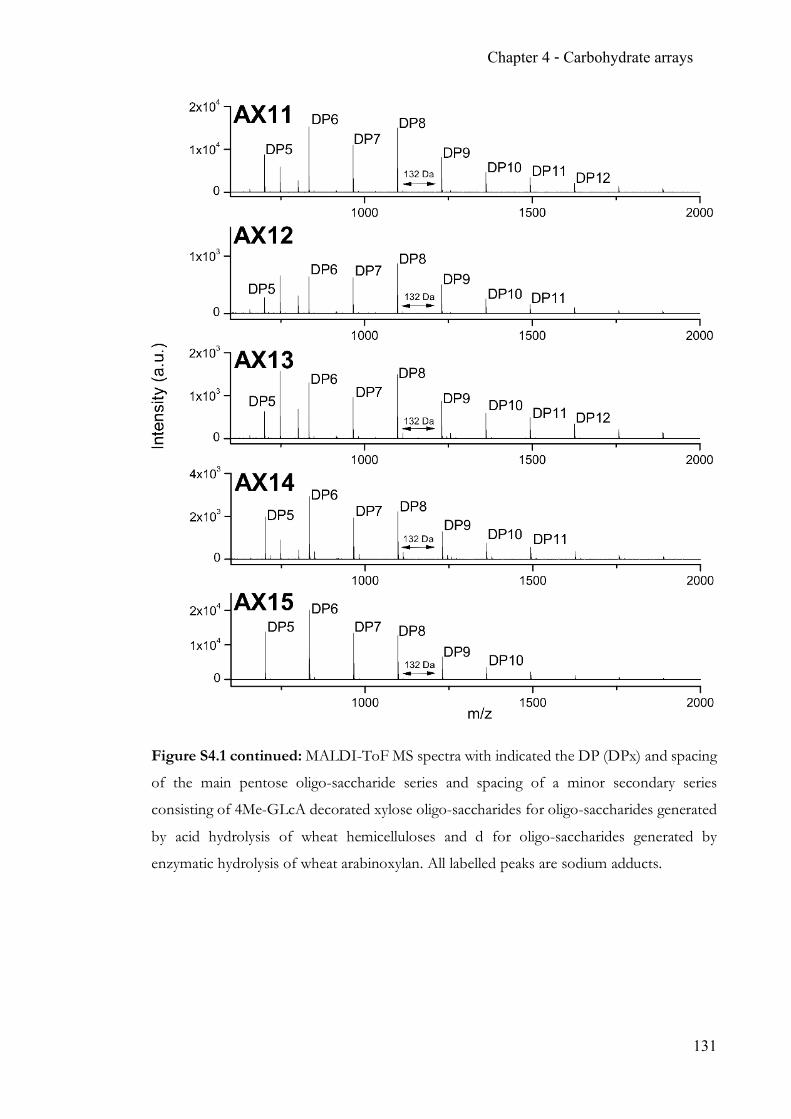
Chapter 4 - Carbohydrate arrays
131
Figure S4.1 continued: MALDI-ToF MS spectra with indicated the DP (DPx) and spacing
of the main pentose oligo-saccharide series and spacing of a minor secondary series
consisting of 4Me-GLcA decorated xylose oligo-saccharides for oligo-saccharides generated
by acid hydrolysis of wheat hemicelluloses and d for oligo-saccharides generated by
enzymatic hydrolysis of wheat arabinoxylan. All labelled peaks are sodium adducts.
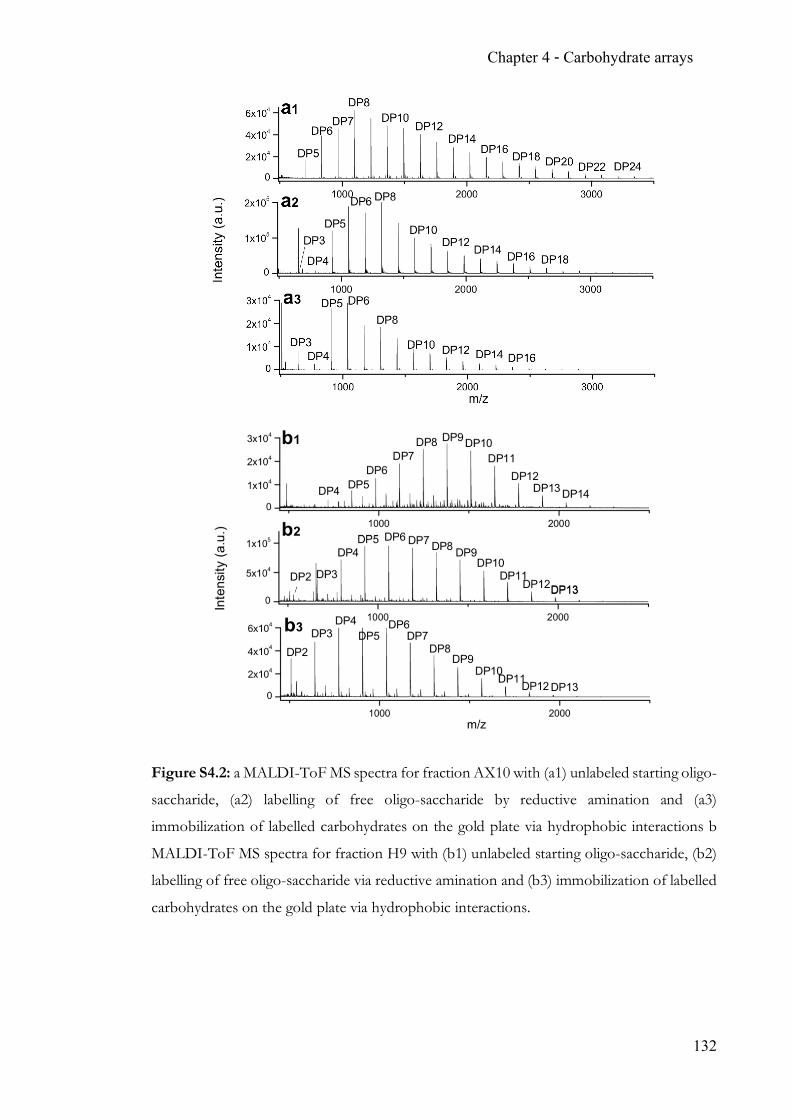
Chapter 4 - Carbohydrate arrays
132
Figure S4.2: a MALDI-ToF MS spectra for fraction AX10 with (a1) unlabeled starting oligo-
saccharide, (a2) labelling of free oligo-saccharide by reductive amination and (a3)
immobilization of labelled carbohydrates on the gold plate via hydrophobic interactions b
MALDI-ToF MS spectra for fraction H9 with (b1) unlabeled starting oligo-saccharide, (b2)
labelling of free oligo-saccharide via reductive amination and (b3) immobilization of labelled
carbohydrates on the gold plate via hydrophobic interactions.
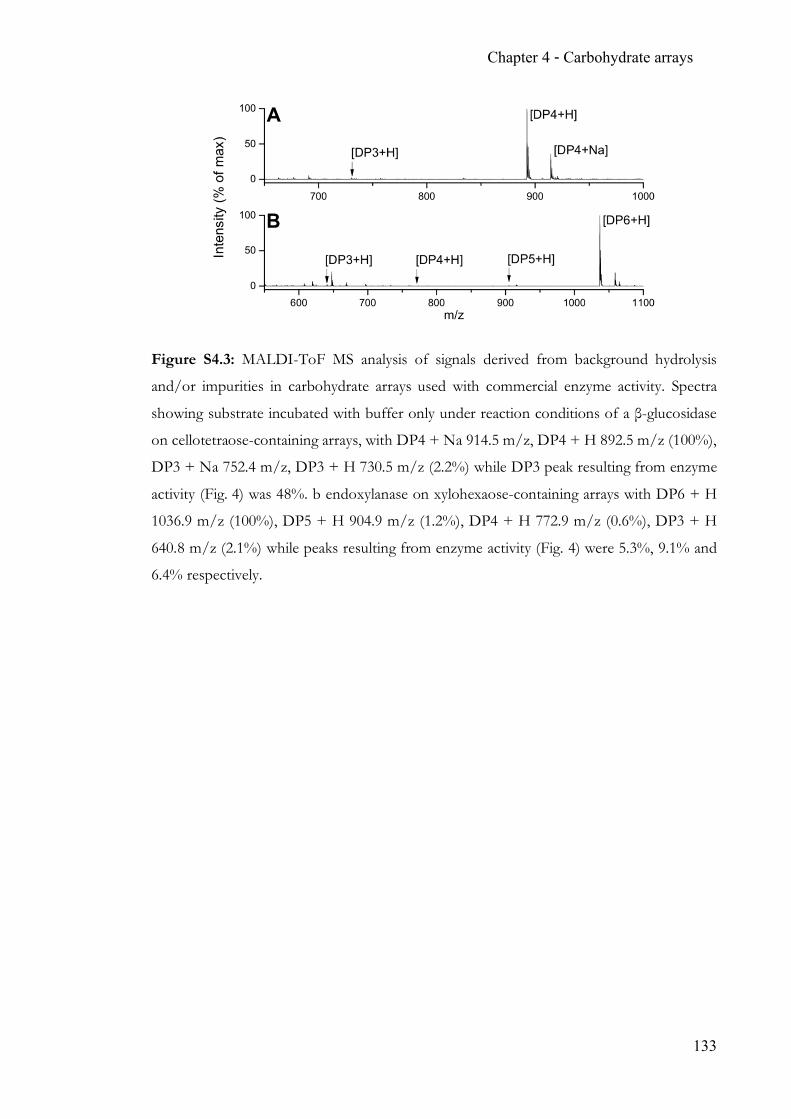
Chapter 4 - Carbohydrate arrays
133
Figure S4.3: MALDI-ToF MS analysis of signals derived from background hydrolysis
and/or impurities in carbohydrate arrays used with commercial enzyme activity. Spectra
showing substrate incubated with buffer only under reaction conditions of a β-glucosidase
on cellotetraose-containing arrays, with DP4 + Na 914.5 m/z, DP4 + H 892.5 m/z (100%),
DP3 + Na 752.4 m/z, DP3 + H 730.5 m/z (2.2%) while DP3 peak resulting from enzyme
activity (Fig. 4) was 48%. b endoxylanase on xylohexaose-containing arrays with DP6 + H
1036.9 m/z (100%), DP5 + H 904.9 m/z (1.2%), DP4 + H 772.9 m/z (0.6%), DP3 + H
640.8 m/z (2.1%) while peaks resulting from enzyme activity (Fig. 4) were 5.3%, 9.1% and
6.4% respectively.
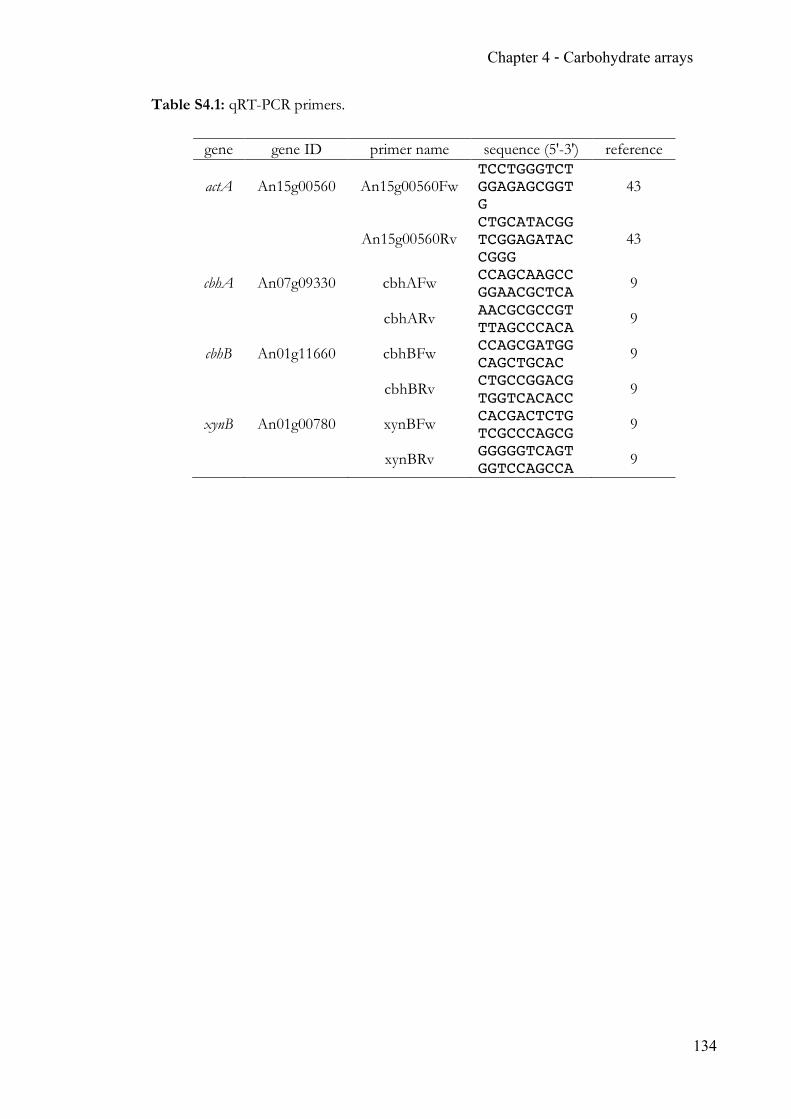
Chapter 4 - Carbohydrate arrays
134
Table S4.1: qRT-PCR primers.
gene gene ID primer name sequence (5'-3') reference
actA An15g00560 An15g00560Fw TCCTGGGTCT GGAGAGCGGT G
43
An15g00560Rv CTGCATACGG TCGGAGATAC CGGG
43
cbhA An07g09330 cbhAFw CCAGCAAGCC GGAACGCTCA 9
cbhARv AACGCGCCGT TTAGCCCACA 9
cbhB An01g11660 cbhBFw CCAGCGATGG CAGCTGCAC 9
cbhBRv CTGCCGGACG TGGTCACACC 9
xynB An01g00780 xynBFw CACGACTCTG TCGCCCAGCG 9
xynBRv GGGGGTCAGT GGTCCAGCCA 9
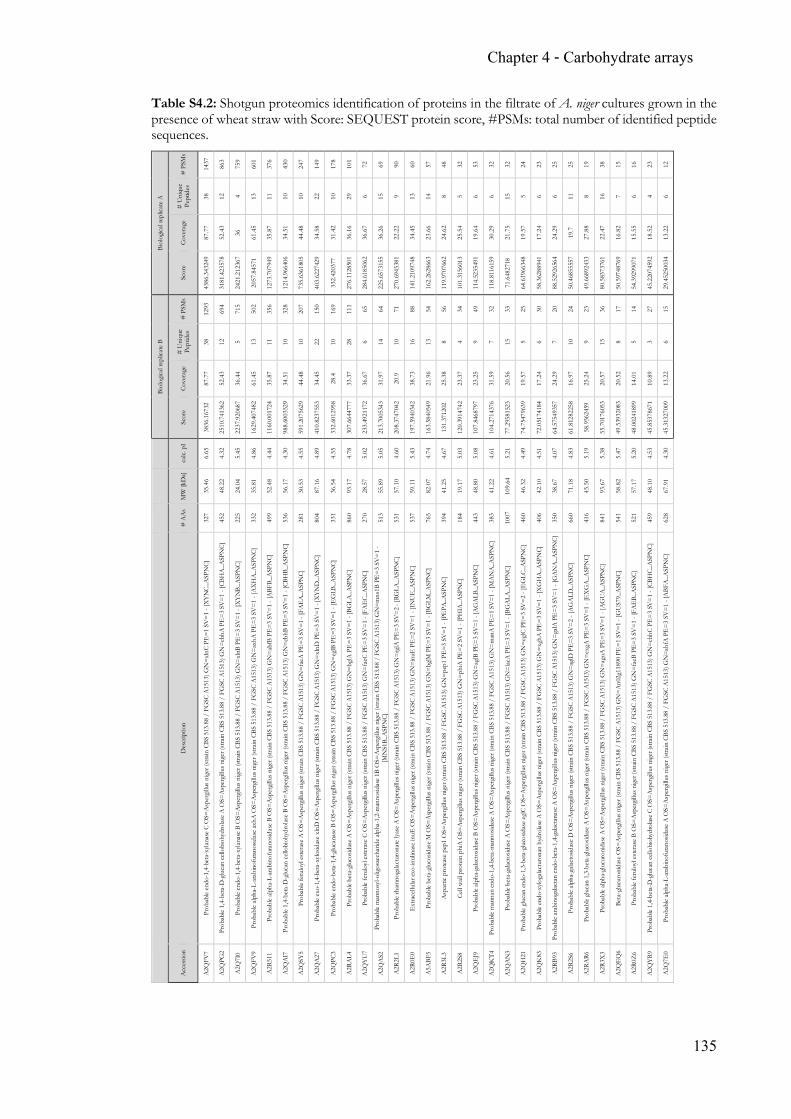
Chapter 4 - Carbohydrate arrays
135
Table S4.2: Shotgun proteomics identification of proteins in the filtrate of A. niger cultures grown in the presence of wheat straw with Score: SEQUEST protein score, #PSMs: total number of identified peptide sequences.
Biol
ogica
l rep
licat
e A
# P
SMs
1437
863
759
601
376
430
247
149
178
101
72
69
90
60
57
48
32
53
32
32
24
23
25
25
19
38
15
16
23
12
# U
niqu
e Pe
ptid
es
38
12
4 13
11
10
10
22
10
29
6 15
9 13
14
8 5 6 6 15
5 6 6 11
8 16
7 6 4 6
Cove
rage
87.7
7
52.4
3
36
61.4
5
35.8
7
34.5
1
44.4
8
34.5
8
31.4
2
36.1
6
36.6
7
36.2
6
22.2
2
34.4
5
23.6
6
24.6
2
25.5
4
19.6
4
30.2
9
21.7
5
19.5
7
17.2
4
24.2
9
19.7
27.8
8
22.4
7
16.8
2
15.5
5
18.5
2
13.2
2
Scor
e
4386
.343
249
3181
.423
578
2421
.212
367
2057
.845
71
1273
.707
949
1214
.966
406
735.
6361
805
403.
6227
429
332.
4203
77
276.
1128
501
284.
6185
062
225.
6573
155
270.
6945
381
141.
2109
748
162.
2628
663
119.
9707
662
101.
3156
013
114.
5235
491
118.
8116
159
71.6
4827
18
64.6
1966
348
58.3
6288
941
88.5
2926
564
50.4
6855
557
49.6
6892
433
80.5
8373
761
50.5
9748
769
54.3
9299
071
45.2
2074
592
29.4
5250
034
Biol
ogica
l rep
licat
e B
# P
SMs
1293
694
715
502
356
328
207
150
169
111
65
64
71
88
54
56
34
49
32
33
25
30
20
24
23
36
17
14
27
15
# U
niqu
e Pe
ptid
es
38
12
5 13
11
10
10
22
10
28
6 14
10
16
13
8 4 9 7 15
5 6 7 10
9 15
8 5 3 6
Cove
rage
87.7
7
52.4
3
36.4
4
61.4
5
35.8
7
34.5
1
44.4
8
34.4
5
28.4
33.3
7
36.6
7
31.9
7
20.9
38.7
3
21.9
6
25.3
8
23.3
7
23.2
5
31.5
9
20.5
6
19.5
7
17.2
4
24.2
9
16.9
7
25.2
4
20.5
7
20.5
2
14.0
1
10.8
9
13.2
2
Scor
e
3836
.167
32
2510
.741
362
2237
.920
687
1629
.407
482
1160
.001
724
988.
6003
529
591.
2075
629
410.
8237
553
332.
6012
958
307.
6644
777
233.
4921
172
213.
7005
343
208.
3747
042
197.
5940
342
163.
5840
549
131.
3712
02
120.
3914
742
107.
8468
797
104.
2714
376
77.2
9581
523
74.7
5479
639
72.0
5174
184
64.5
7549
357
61.8
1282
258
58.9
5624
59
55.7
0176
053
49.5
3932
083
48.0
0241
899
45.8
5378
671
45.3
1327
009
calc.
pI
6.65
4.32
5.45
4.86
4.44
4.30
4.55
4.89
4.55
4.78
5.02
5.05
4.60
5.43
4.74
4.67
5.03
5.08
4.61
5.21
4.49
4.51
4.07
4.83
5.19
5.38
5.47
5.20
4.53
4.30
MW
[kD
a]
35.4
6
48.2
2
24.0
4
35.8
1
52.4
8
56.1
7
30.5
3
87.1
6
36.5
4
93.1
7
28.5
7
55.8
9
57.1
0
59.1
1
82.0
7
41.2
5
19.1
7
48.8
0
41.2
2
109.
64
46.3
2
42.1
0
38.6
7
71.1
8
45.5
0
93.6
7
58.8
2
57.1
7
48.1
0
67.9
1
# A
As
327
452
225
332
499
536
281
804
331
860
270
513
531
537
765
394
184
443
383
1007
460
406
350
660
416
841
541
521
459
628
Des
crip
tion
Prob
able
endo
-1,4
-bet
a -xy
lana
se C
OS=
Asp
ergi
llus n
iger
(stra
in C
BS 5
13.8
8 /
FGSC
A15
13) G
N=
xlnC
PE
=1 S
V=
1 - [
XY
NC_
ASP
NC]
Prob
able
1,4 -
beta
-D-g
luca
n ce
llobi
ohyd
rolas
e A
OS=
Asp
ergi
llus n
iger
(stra
in C
BS 5
13.8
8 /
FGSC
A15
13) G
N=
cbhA
PE
=3
SV=
1 - [
CBH
A_A
SPN
C]
Prob
able
endo
-1,4
-bet
a -xy
lana
se B
OS=
Asp
ergil
lus n
iger
(stra
in C
BS 5
13.8
8 /
FGSC
A15
13) G
N=
xlnB
PE
=3
SV=
1 - [
XY
NB_
ASP
NC]
Prob
able
alph
a -L -
arab
inof
uran
osid
ase
axhA
OS=
Asp
ergi
llus n
iger
(stra
in C
BS 5
13.8
8 /
FGSC
A15
13) G
N=
axhA
PE
=3 S
V=
1 - [
AX
HA_
ASP
NC]
Prob
able
alph
a-L-
arab
inof
uran
osid
ase
B O
S=A
sper
gillu
s nig
er (s
train
CBS
513
.88
/ FG
SC A
1513
) GN
=ab
fB P
E=3
SV
=1
- [A
BFB_
ASP
NC]
Prob
able
1,4-
beta
- D- g
luca
n ce
llobi
ohyd
rolas
e B
OS=
Asp
ergi
llus n
iger
(stra
in C
BS 5
13.8
8 /
FGSC
A15
13) G
N=
cbhB
PE
=3
SV=
1 - [
CBH
B_A
SPN
C]
Prob
able
feru
loyl
este
rase
A O
S=A
sper
gillu
s nig
er (s
train
CBS
513
.88
/ FG
SC A
1513
) GN
=fa
eA P
E=
3 SV
=1
- [FA
EA_
ASP
NC]
Prob
able
exo-
1,4-
beta
-xyl
osid
ase
xlnD
OS=
Asp
ergil
lus n
iger
(stra
in C
BS 5
13.8
8 /
FGSC
A15
13) G
N=
xlnD
PE
=3
SV=
1 - [
XY
ND
_ASP
NC]
Prob
able
endo
-bet
a-1,
4-gl
ucan
ase
B O
S=A
sper
gillu
s nig
er (s
train
CBS
513
.88
/ FG
SC A
1513
) GN
=eg
lB P
E=3
SV
=1
- [E
GLB
_ASP
NC]
Prob
able
beta
- glu
cosid
ase
A O
S=A
sper
gillu
s nig
er (s
train
CBS
513
.88
/ FG
SC A
1513
) GN
=bg
lA P
E=
3 SV
=1
- [BG
LA_A
SPN
C]
Prob
able
feru
loyl
este
rase
C O
S=A
sper
gillu
s nig
er (s
train
CBS
513
.88
/ FG
SC A
1513
) GN
=fa
eC P
E=
3 SV
=1
- [FA
EC_
ASP
NC]
Prob
able
man
nosy
l-olig
osac
char
ide
alpha
-1,2
-man
nosid
ase
1B O
S=A
sper
gillu
s nig
er (s
train
CBS
513
.88
/ FG
SC A
1513
) GN
=m
ns1B
PE
=3
SV=
1 -
[MN
S1B_
ASP
NC]
Prob
able
rham
noga
lactu
rona
te ly
ase
A O
S=A
sper
gillu
s nig
er (s
train
CBS
513
.88
/ FG
SC A
1513
) GN
=rg
lA P
E=
3 SV
=2
- [RG
LA_ A
SPN
C]
Ext
race
llular
exo-
inul
inas
e in
uE O
S=A
sper
gillu
s nig
er (s
train
CBS
513
.88
/ FG
SC A
1513
) GN
=in
uE P
E=2
SV
=1
- [IN
UE_
ASP
NC]
Prob
able
beta
-glu
cosid
ase
M O
S=A
sper
gillu
s nig
er (s
train
CBS
513
.88
/ FG
SC A
1513
) GN
=bg
lM P
E=3
SV
=1
- [BG
LM_A
SPN
C]
Asp
artic
pro
teas
e pe
p1 O
S=A
sper
gillu
s nig
er (s
train
CBS
513
.88
/ FG
SC A
1513
) GN
=pe
p1 P
E=3
SV
=1
- [PE
PA_A
SPN
C]
Cell
wal
l pro
tein
phi
A O
S=A
sper
gillu
s nig
er (s
train
CBS
513
.88
/ FG
SC A
1513
) GN
=ph
iA P
E=
2 SV
=1
- [PH
IA_A
SPN
C]
Prob
able
alph
a-ga
lacto
sidas
e B
OS=
Asp
ergi
llus n
iger
(stra
in C
BS 5
13.8
8 /
FGSC
A15
13) G
N=
aglB
PE
=3
SV=
1 - [
AG
ALB
_ASP
NC]
Prob
able
man
nan
endo
-1,4
-bet
a-m
anno
sidas
e A
OS=
Asp
ergi
llus n
iger
(stra
in C
BS 5
13.8
8 /
FGSC
A15
13) G
N=
man
A P
E=
1 SV
=1
- [M
AN
A_A
SPN
C]
Prob
able
beta
-gala
ctos
idas
e A
OS=
Asp
ergil
lus n
iger
(stra
in C
BS 5
13.8
8 /
FGSC
A15
13) G
N=
lacA
PE
=3
SV=
1 - [
BGA
LA_A
SPN
C]
Prob
able
gluc
an en
do-1
,3-b
eta-
gluc
osid
ase
eglC
OS=
Asp
ergi
llus n
iger
(stra
in C
BS 5
13.8
8 /
FGSC
A15
13) G
N=
eglC
PE
=3
SV=
2 - [
EG
LC_A
SPN
C]
Prob
able
endo
-xylo
galac
turo
nan
hydr
olas
e A
OS=
Asp
ergi
llus n
i ger
(stra
in C
BS 5
13.8
8 /
FGSC
A15
13) G
N=
xghA
PE
=3
SV=
1 - [
XG
HA_
ASP
NC]
Prob
able
arab
inog
alact
an e
ndo -
beta
- 1,4
-gala
ctan
ase
A O
S=A
sper
gillu
s nig
er (s
train
CBS
513
.88
/ FG
SC A
1513
) GN
=ga
lA P
E=
3 SV
=1
- [G
AN
A_A
SPN
C]
Prob
able
alph
a-ga
lacto
sidas
e D
OS=
Asp
ergil
lus n
iger
(stra
in C
BS 5
13.8
8 /
FGSC
A15
13) G
N=
aglD
PE
=3 S
V=
2 - [
AG
ALD
_ASP
NC]
Prob
able
gluc
an 1
,3-b
eta-
gluc
osid
ase
A O
S=A
sper
gillu
s nig
er (s
train
CBS
513
.88
/ FG
SC A
1513
) GN
=ex
gA P
E=
3 SV
=1 -
[EX
GA
_ASP
NC]
Prob
able
alph
a-gl
ucur
onid
ase
A O
S=A
sper
gillu
s nig
er (s
train
CBS
513
.88
/ FG
SC A
1513
) GN
=ag
uA P
E=3
SV
=1
- [A
GU
A_A
SPN
C]
Beta
-glu
curo
nida
se O
S=A
sper
gillu
s nig
er (s
train
CBS
513
.88
/ FG
SC A
1513
) GN
=A
n02g
1189
0 PE
=1
SV=
1 - [
GU
S79_
ASP
NC]
Prob
able
feru
loyl
este
rase
B O
S=A
sper
gillu
s nig
er (s
train
CBS
513
.88
/ FG
SC A
1513
) GN
=fa
eB P
E=3
SV=
1 - [
FAE
B_A
SPN
C]
Prob
able
1,4-
beta
-D- g
luca
n ce
llobi
ohyd
rolas
e C
OS=
Asp
ergil
lus n
iger
(stra
in C
BS 5
13.8
8 /
FGSC
A15
13) G
N=
cbhC
PE
=3
SV=
1 - [
CBH
C_A
SPN
C]
Prob
able
alph
a -L -
arab
inof
uran
osid
ase
A O
S=A
sper
gillu
s nig
er (s
train
CBS
513
.88
/ FG
SC A
1513
) GN
=abf
A P
E=
3 SV
=1
- [A
BFA
_ASP
NC]
Acc
essio
n
A2Q
FV7
A2Q
PG2
A2Q
7I0
A2Q
FV9
A2R
511
A2Q
AI7
A2Q
SY5
A2Q
A27
A2Q
PC3
A2R
AL4
A2Q
YU
7
A2Q
AS2
A2R
2L1
A2R
0E0
A5A
BF5
A2R
3L3
A2R
2S8
A2Q
EJ9
A2Q
KT4
A2Q
AN
3
A2Q
H21
A2Q
K83
A2R
B93
A2R
2S6
A2R
AR6
A2R
3X3
A2Q
EQ
6
A2R
0Z6
A2Q
YR9
A2Q
7E0
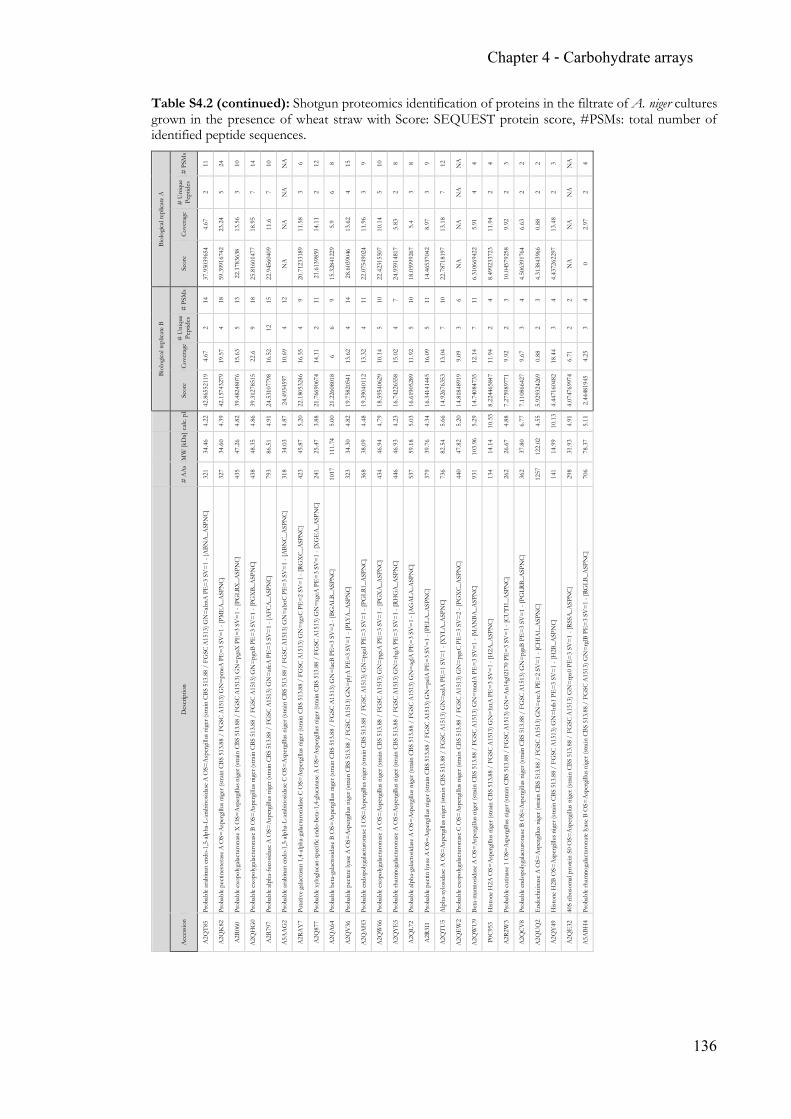
Chapter 4 - Carbohydrate arrays
136
Table S4.2 (continued): Shotgun proteomics identification of proteins in the filtrate of A. niger cultures grown in the presence of wheat straw with Score: SEQUEST protein score, #PSMs: total number of identified peptide sequences.
Biol
ogica
l rep
licat
e A
# P
SMs
11
24
10
14
10
NA
6 12
8 15
9 10
8 8 9 12
NA
4 4 3 2 2 3 NA
4
# U
niqu
e Pe
ptid
es
2 5 3 7 7 NA
3 2 6 4 3 5 2 3 3 7 NA
4 2 2 2 2 2 NA
2
Cove
rage
4.67
23.2
4
13.5
6
18.9
5
11.6
NA
11.5
8
14.1
1
5.9
13.6
2
11.9
6
10.1
4
5.83
5.4
8.97
13.1
8
NA
5.91
11.9
4
9.92
6.63
0.88
13.4
8
NA
2.97
Scor
e
37.9
5039
654
59.3
9916
742
22.1
7836
38
25.8
1601
477
22.9
4560
409
NA
20.7
1233
189
21.6
1398
59
15.3
2841
229
28.6
0390
46
22.0
7549
024
22.4
2315
507
24.9
5914
817
18.0
5999
267
14.4
6537
042
22.7
8718
197
NA
6.31
0669
422
8.49
9233
723
10.0
4579
258
4.50
6391
764
4.31
3843
966
4.43
7262
297
NA
0
Biol
ogica
l rep
licat
e B
# P
SMs
14
18
13
18
15
12
9 11
9 14
11
10
7 10
11
10
6 11
4 3 4 3 4 2 4
# U
niqu
e Pe
ptid
es
2 4 5 9 12
4 4 2 6 4 4 5 4 5 5 7 3 7 2 2 3 2 3 2 3
Cove
rage
4.67
19.5
7
15.6
3
22.6
16.5
2
10.6
9
16.5
5
14.1
1
6
13.6
2
13.3
2
10.1
4
15.0
2
11.9
2
16.0
9
13.0
4
9.09
12.1
4
11.9
4
9.92
9.67
0.88
18.4
4
6.71
4.25
Scor
e
42.8
6552
119
42.1
5743
279
39.4
8248
076
39.3
1278
515
24.5
3107
798
24.4
9345
97
22.1
8053
246
21.7
6690
674
21.2
2608
018
19.7
5820
541
19.3
9040
112
18.5
9540
629
16.7
4226
558
16.6
1905
289
16.3
4141
445
14.9
2676
353
14.8
1848
919
14.7
4084
735
8.22
4465
847
7.27
5989
771
7.11
0866
427
5.92
9324
269
4.44
7160
482
4.07
4769
974
2.44
4819
45
calc.
pI
4.22
4.39
4.82
4.86
4.91
4.87
5.20
3.88
5.00
4.82
4.48
4.79
4.23
5.03
4.34
5.66
5.20
5.29
10.5
5
4.88
6.77
4.55
10.1
3
4.91
5.11
MW
[kD
a]
34.4
6
34.6
0
47.2
6
48.3
5
86.5
1
34.0
3
45.8
7
25.4
7
111.
74
34.3
0
38.0
9
46.9
4
46.9
3
59.1
8
39.7
6
82.5
4
47.8
2
103.
96
14.1
4
26.6
7
37.8
0
122.
02
14.9
9
31.9
3
78.3
7
# A
As
321
327
435
438
793
318
423
241
1017
323
368
434
446
537
379
736
440
931
134
262
362
1257
141
298
706
Des
crip
tion
Prob
able
arab
inan
endo
-1,5
-alp
ha- L
-ara
bino
sidas
e A
OS=
Asp
ergi
llus n
iger
(stra
in C
BS 5
13.8
8 /
FGSC
A15
13) G
N=a
bnA
PE=
3 SV
=1
- [A
BNA
_ASP
NC]
Prob
able
pect
ines
tera
se A
OS=
Asp
ergi
llus n
iger
(stra
in C
BS 5
13.8
8 /
FGSC
A15
13) G
N=
pmeA
PE=
3 SV
=1
- [PM
EA
_ASP
NC]
Prob
able
exop
olyg
alact
uron
ase
X O
S=A
sper
gillu
s nig
er (s
train
CBS
513
.88
/ FG
SC A
1513
) GN
=pg
aX P
E=3
SV
=1
- [PG
LRX
_ASP
NC]
Prob
able
exop
olyg
alact
uron
ase
B O
S=A
sper
gillu
s nig
er (s
train
CBS
513
.88
/ FG
SC A
1513
) GN
=pg
xB P
E=
3 SV
=1
- [PG
XB_
ASP
NC]
Prob
able
alph
a-fu
cosid
ase
A O
S=A
sper
gillu
s nig
er (s
train
CBS
513
.88
/ FG
SC A
1513
) GN
=af
cA P
E=
3 SV
=1
- [A
FCA
_ASP
NC]
Prob
able
arab
inan
endo
-1,5
- alp
ha- L
-ara
bino
sidas
e C
OS=
Asp
ergi
llus n
iger
(stra
in C
BS 5
13.8
8 /
FGSC
A15
13) G
N=a
bnC
PE=
3 SV
=1
- [A
BNC_
ASP
NC]
Puta
tive
galac
tura
n 1,
4-al
pha -
galac
turo
nida
se C
OS=
Asp
ergi
llus n
iger
(stra
in C
BS 5
13.8
8 /
FGSC
A15
13) G
N=
rgxC
PE
=2 S
V=
1 - [
RGX
C_A
SPN
C]
Prob
able
xylo
gluc
an-s
peci
fic e
ndo-
beta
-1,4
-glu
cana
se A
OS=
Asp
ergi
llus n
iger
(stra
in C
BS 5
13.8
8 /
FGSC
A15
13) G
N=x
geA
PE
=3
SV=
1 - [
XG
EA_
ASP
NC]
Prob
able
beta
-gala
ctos
idas
e B
OS=
Asp
ergi
llus n
iger
(stra
in C
BS 5
13.8
8 /
FGSC
A15
13) G
N=
lacB
PE=
3 SV
=2
- [BG
ALB
_ASP
NC]
Prob
able
pect
ate
lyase
A O
S=A
sper
gillu
s nig
er (s
train
CBS
513
.88
/ FG
SC A
1513
) GN
=pl
yA P
E=3
SV
=1
- [PL
YA
_ASP
NC]
Prob
able
endo
poly
galac
turo
nase
I O
S=A
sper
gillu
s nig
er (s
train
CBS
513
.88
/ FG
SC A
1513
) GN
=pg
aI P
E=
3 SV
=1
- [PG
LR1_
ASP
NC]
Prob
able
exop
olyg
alact
uron
ase
A O
S=A
sper
gillu
s nig
er (s
train
CBS
513
.88
/ FG
SC A
1513
) GN
=pg
xA P
E=
3 SV
=1
- [PG
XA
_ASP
NC]
Prob
able
rham
noga
lactu
rona
se A
OS=
Asp
ergil
lus n
iger
(stra
in C
BS 5
13.8
8 /
FGSC
A15
13) G
N=
rhgA
PE
=3
SV=
1 - [
RHG
A_A
SPN
C]
Prob
able
alph
a-ga
lacto
sidas
e A
OS=
Asp
ergi
llus n
iger
(stra
in C
BS 5
13.8
8 /
FGSC
A15
13) G
N=
aglA
PE
=3
SV=
1 - [
AG
ALA
_ASP
NC]
Prob
able
pect
in ly
ase
A O
S=A
sper
gillu
s nig
er (s
train
CBS
513
.88
/ FG
SC A
1513
) GN
=pe
lA P
E=
3 SV
=1
- [PE
LA_A
SPN
C]
Alp
ha-x
ylos
idas
e A
OS=
Asp
ergi
llus n
iger
(stra
in C
BS 5
13.8
8 /
FGSC
A15
13) G
N=a
xlA
PE
=1
SV=
1 - [
XY
LA_A
SPN
C]
Prob
able
exop
olyg
alact
uron
ase
C O
S=A
sper
gillu
s nig
er (s
train
CBS
513
.88
/ FG
SC A
1513
) GN
=pg
xC P
E=
3 SV
=2
- [PG
XC_
ASP
NC]
Beta
- man
nosid
ase
A O
S=A
sper
gillu
s nig
er (s
train
CBS
513
.88
/ FG
SC A
1513
) GN
=m
ndA
PE
=3
SV=1
- [M
AN
BA_A
SPN
C]
Hist
one
H2A
OS=
Asp
ergi
llus n
iger
(stra
in C
BS 5
13.8
8 /
FGSC
A15
13) G
N=
httA
PE
=3
SV=
1 - [
H2A
_ASP
NC]
Prob
able
cutin
ase
1 O
S=A
sper
gillu
s nig
er (s
train
CBS
513
.88
/ FG
SC A
1513
) GN
=A
n14g
0217
0 PE
=3
SV=
1 - [
CUTI
1_A
SPN
C]
Prob
able
endo
poly
galac
turo
nase
B O
S=A
sper
gillu
s nig
er (s
train
CBS
513
.88
/ FG
SC A
1513
) GN
=pg
aB P
E=3
SV
=1
- [PG
LRB_
ASP
NC]
End
ochi
tinas
e A
OS=
Asp
ergi
llus n
iger
(stra
in C
BS 5
13.8
8 /
FGSC
A15
13) G
N=
ctcA
PE
=2
SV=
1 - [
CHIA
1_A
SPN
C]
Hist
one
H2B
OS=
Asp
ergi
llus n
iger
(stra
in C
BS 5
13.8
8 /
FGSC
A15
13) G
N=
htb1
PE
=3 S
V=
1 - [
H2B
_ASP
NC]
40S
ribos
omal
pro
tein
S0
OS=
Asp
ergi
llus n
iger
(stra
in C
BS 5
13.8
8 /
FGSC
A15
13) G
N=
rps0
PE=
3 SV
=1
- [RS
SA_A
SPN
C]
Prob
able
rham
noga
lactu
rona
te ly
ase
B O
S=A
sper
gillu
s nig
er (s
train
CBS
513
.88
/ FG
SC A
1513
) GN
=rg
lB P
E=3
SV=
1 - [
RGLB
_ASP
NC]
Acc
essio
n
A2Q
T85
A2Q
K82
A2R
060
A2Q
HG
0
A2R
797
A5A
AG
2
A2R
AY
7
A2Q
877
A2Q
A64
A2Q
V36
A2Q
AH
3
A2Q
W66
A2Q
YE
5
A2Q
L72
A2R
3I1
A2Q
TU5
A2Q
EW
2
A2Q
WU
9
P0C9
53
A2R
2W3
A2Q
CV8
A2Q
UQ
2
A2Q
Y49
A2Q
E32
A5A
BH4
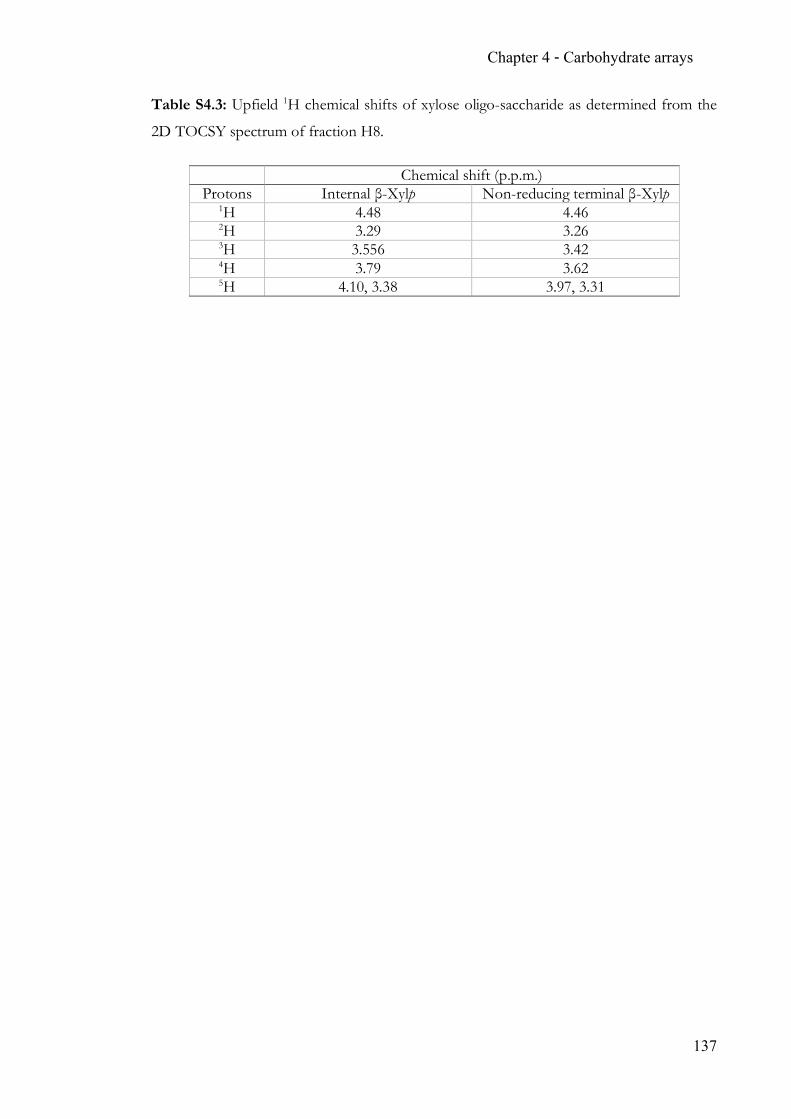
Chapter 4 - Carbohydrate arrays
137
Table S4.3: Upfield 1H chemical shifts of xylose oligo-saccharide as determined from the
2D TOCSY spectrum of fraction H8.
Chemical shift (p.p.m.) Protons Internal β-Xylp Non-reducing terminal β-Xylp
1H 4.48 4.46 2H 3.29 3.26 3H 3.556 3.42 4H 3.79 3.62 5H 4.10, 3.38 3.97, 3.31
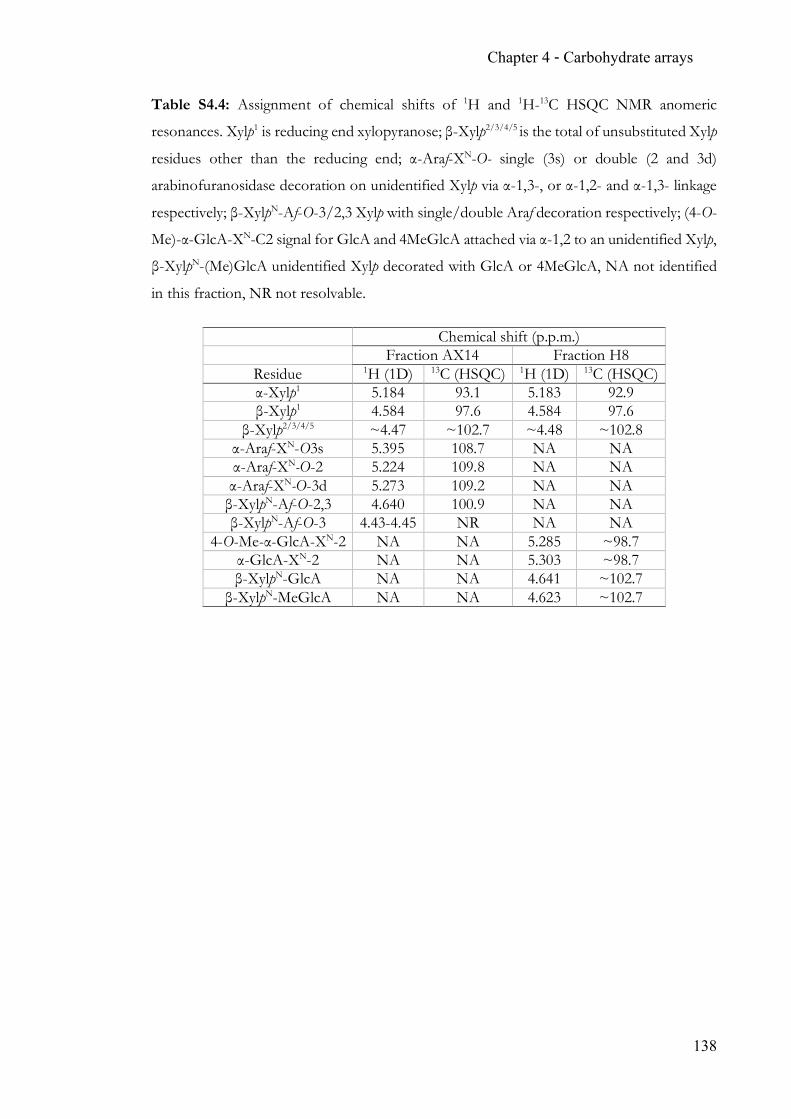
Chapter 4 - Carbohydrate arrays
138
Table S4.4: Assignment of chemical shifts of 1H and 1H-13C HSQC NMR anomeric
resonances. Xylp1 is reducing end xylopyranose; β-Xylp2/3/4/5 is the total of unsubstituted Xylp
residues other than the reducing end; α-Araf-XN-O- single (3s) or double (2 and 3d)
arabinofuranosidase decoration on unidentified Xylp via α-1,3-, or α-1,2- and α-1,3- linkage
respectively; β-XylpN-Af-O-3/2,3 Xylp with single/double Araf decoration respectively; (4-O-
Me)-α-GlcA-XN-C2 signal for GlcA and 4MeGlcA attached via α-1,2 to an unidentified Xylp,
β-XylpN-(Me)GlcA unidentified Xylp decorated with GlcA or 4MeGlcA, NA not identified
in this fraction, NR not resolvable.
Chemical shift (p.p.m.) Fraction AX14 Fraction H8
Residue 1H (1D) 13C (HSQC) 1H (1D) 13C (HSQC) α-Xylp1 5.184 93.1 5.183 92.9 β-Xylp1 4.584 97.6 4.584 97.6
β-Xylp2/3/4/5 ~4.47 ~102.7 ~4.48 ~102.8 α-Araf-XN-O3s 5.395 108.7 NA NA α-Araf-XN-O-2 5.224 109.8 NA NA α-Araf-XN-O-3d 5.273 109.2 NA NA β-XylpN-Af-O-2,3 4.640 100.9 NA NA β-XylpN-Af-O-3 4.43-4.45 NR NA NA
4-O-Me-α-GlcA-XN-2 NA NA 5.285 ~98.7 α-GlcA-XN-2 NA NA 5.303 ~98.7 β-XylpN-GlcA NA NA 4.641 ~102.7 β-XylpN-MeGlcA NA NA 4.623 ~102.7
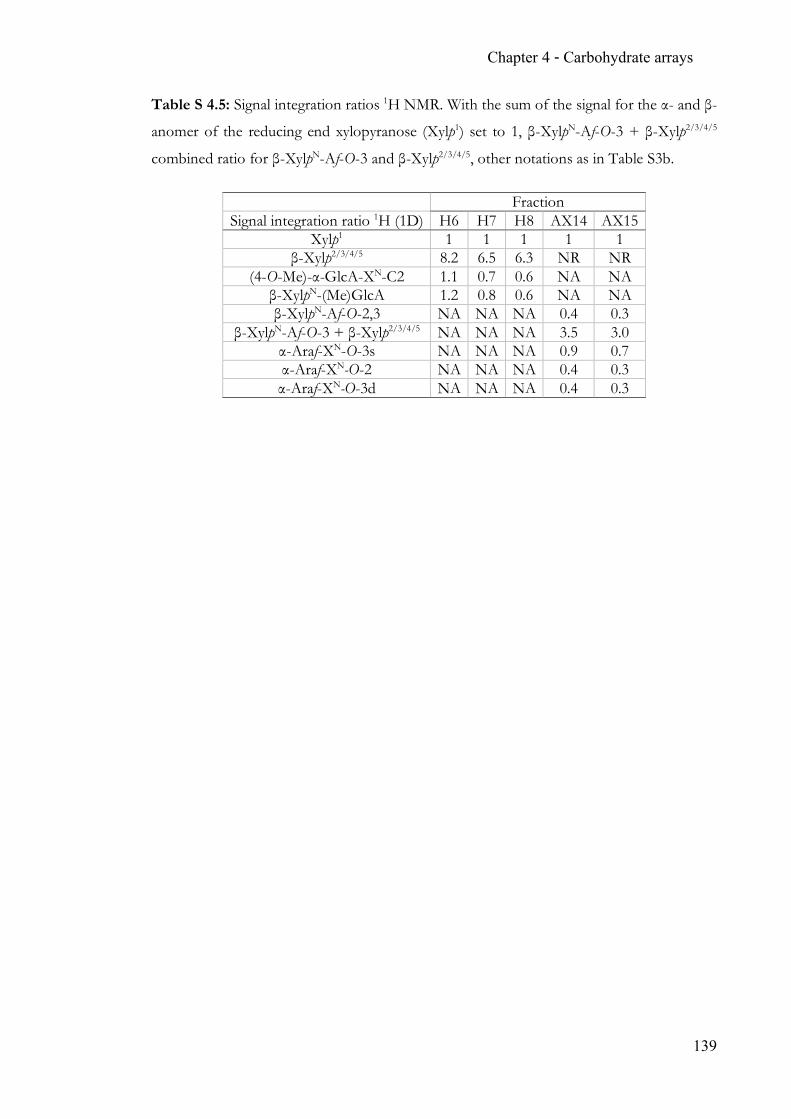
Chapter 4 - Carbohydrate arrays
139
Table S 4.5: Signal integration ratios 1H NMR. With the sum of the signal for the α- and β-
anomer of the reducing end xylopyranose (Xylp1) set to 1, β-XylpN-Af-O-3 + β-Xylp2/3/4/5
combined ratio for β-XylpN-Af-O-3 and β-Xylp2/3/4/5, other notations as in Table S3b.
Fraction Signal integration ratio 1H (1D) H6 H7 H8 AX14 AX15
Xylp1 1 1 1 1 1 β-Xylp2/3/4/5 8.2 6.5 6.3 NR NR
(4-O-Me)-α-GlcA-XN-C2 1.1 0.7 0.6 NA NA β-XylpN-(Me)GlcA 1.2 0.8 0.6 NA NA β-XylpN-Af-O-2,3 NA NA NA 0.4 0.3
β-XylpN-Af-O-3 + β-Xylp2/3/4/5 NA NA NA 3.5 3.0 α-Araf-XN-O-3s NA NA NA 0.9 0.7 α-Araf-XN-O-2 NA NA NA 0.4 0.3 α-Araf-XN-O-3d NA NA NA 0.4 0.3
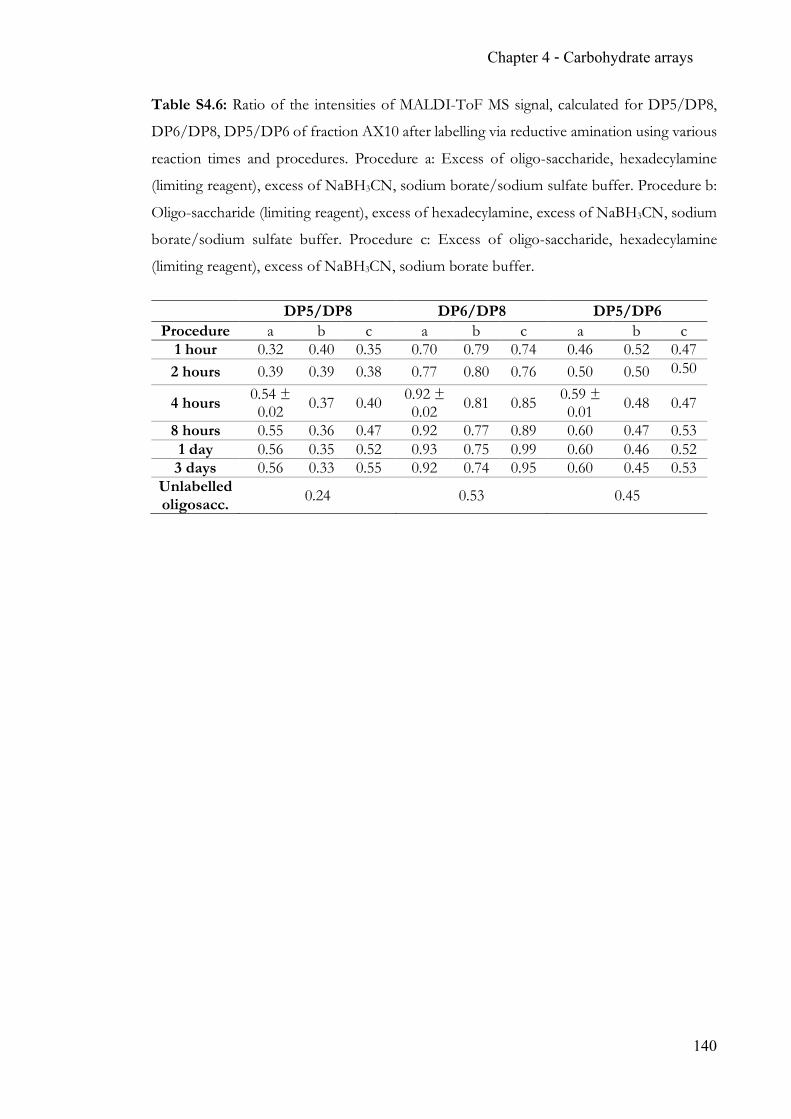
Chapter 4 - Carbohydrate arrays
140
Table S4.6: Ratio of the intensities of MALDI-ToF MS signal, calculated for DP5/DP8,
DP6/DP8, DP5/DP6 of fraction AX10 after labelling via reductive amination using various
reaction times and procedures. Procedure a: Excess of oligo-saccharide, hexadecylamine
(limiting reagent), excess of NaBH3CN, sodium borate/sodium sulfate buffer. Procedure b:
Oligo-saccharide (limiting reagent), excess of hexadecylamine, excess of NaBH3CN, sodium
borate/sodium sulfate buffer. Procedure c: Excess of oligo-saccharide, hexadecylamine
(limiting reagent), excess of NaBH3CN, sodium borate buffer.
DP5/DP8 DP6/DP8 DP5/DP6 Procedure a b c a b c a b c
1 hour 0.32 0.40 0.35 0.70 0.79 0.74 0.46 0.52 0.47 2 hours 0.39 0.39 0.38 0.77 0.80 0.76 0.50 0.50 0.50
4 hours 0.54 ± 0.02 0.37 0.40 0.92 ±
0.02 0.81 0.85 0.59 ± 0.01 0.48 0.47
8 hours 0.55 0.36 0.47 0.92 0.77 0.89 0.60 0.47 0.53 1 day 0.56 0.35 0.52 0.93 0.75 0.99 0.60 0.46 0.52
3 days 0.56 0.33 0.55 0.92 0.74 0.95 0.60 0.45 0.53 Unlabelled oligosacc. 0.24 0.53 0.45
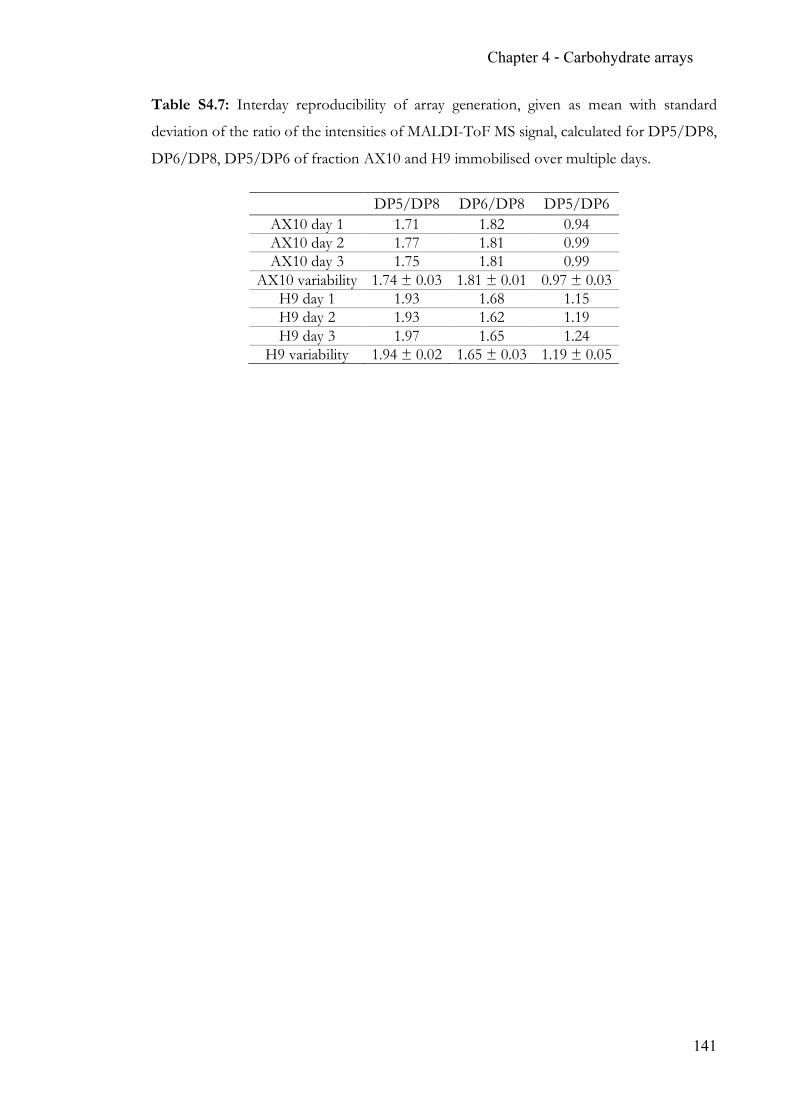
Chapter 4 - Carbohydrate arrays
141
Table S4.7: Interday reproducibility of array generation, given as mean with standard
deviation of the ratio of the intensities of MALDI-ToF MS signal, calculated for DP5/DP8,
DP6/DP8, DP5/DP6 of fraction AX10 and H9 immobilised over multiple days.
DP5/DP8 DP6/DP8 DP5/DP6 AX10 day 1 1.71 1.82 0.94 AX10 day 2 1.77 1.81 0.99 AX10 day 3 1.75 1.81 0.99
AX10 variability 1.74 ± 0.03 1.81 ± 0.01 0.97 ± 0.03 H9 day 1 1.93 1.68 1.15 H9 day 2 1.93 1.62 1.19 H9 day 3 1.97 1.65 1.24
H9 variability 1.94 ± 0.02 1.65 ± 0.03 1.19 ± 0.05
142
Chapter 5 Completing the N-acetylneuraminic acid toolkit
5.1 Summary
While plant-derived saccharides have industrial biotechnological relevance, N-glycans
form an integral part of eukaryotic biology. With an increasing number of therapeutic
glycoproteins being released, glycosylation is considered a crucial parameter to fine-tune
efficacy and prevent immunogenicity. Sialic acids (Neu5Ac) serves as a capping moiety in
human N-glycans. However, the enzymatic tool box for efficient analysis and remodelling
lacks an efficient α2,6-sialidase. This chapter presents the discovery and characterisation of
an α2,6-‘pseudo-sialidase’ and its application of complex glycoproteins.
5.2 Contribution
PB designed the study. PB identified candidate enzymes and recombinant protein was
provided by Prozomix Ltd., UK. As part of this thesis the analytical challenges were
addressed. PB and MR interpreted kinetic data. PB and KH performed biotransformation
reactions. MR designed, performed and interpreted N-glycan release and -analysis
experiments. MR and CJG co-designed, -performed and -analysed the ion mobility
experiments. EGP performed the NMR studies. LPC and JV provided compounds. The
manuscript was co-authored by PB, MR and CLG and edited by all authors.
5.3 Manuscript
This manuscript has been accepted for publication in Glycobiology on
19th December 2017.
Chapter 5 - ‘Pseudosialidase’
143
Development and application of a highly α2,6-selective
pseudosialidase.
Peter Both,*† Michel Riese,† Christopher J. Gray,† Kun Huang,† Edward G. Pallister, † Iaroslav
Kosov,† Louis P. Conway,‡ Josef Voglmeir,‡ and Sabine L. Flitsch*†
† School of Chemistry & Manchester Institute of Biotechnology, The University of
Manchester, Manchester M1 7DN, U.K.
‡ Glycomics Glycan Bioengineering Research Center, College of Food Science and
Technology, Nanjing Agricultural University, Nanjing 210095, China.
Abstract
Within human biology, combinations of regioisomeric motifs of α2,6- or α2,3-sialic acids
linked to galactose are frequently observed attached to glycoconjugates. These include
glycoproteins and glycolipids, with each linkage carrying distinct biological information and
function. Microbial linkage-specific sialidases have become important tools for studying the
role of these sialosides in complex biological settings, as well as being used as biocatalysts
for glycoengineering. However, currently, there is no α2,6-specific sialidase available. This
gap has been addressed herein by exploiting the ability of a Photobacterium sp. α2,6-
sialyltransferase to catalyze trans-sialidation reversibly and in a highly linkage-specific
manner, acting as a pseudosialidase with excess of cytidine monophosphate. Selective, near
quantitative removal of α2,6-linked sialic acids was achieved from a wide range of sialosides
including small molecules conjugates, simple glycan, glycopeptide and finally complex
glycoprotein including both linkages.
Chapter 5 - ‘Pseudosialidase’
144
Introduction
Structure-function studies of glycans rely on the elucidation of their structure and on the
isolation of sufficient amounts of pure well-defined material.1,2 Structural analysis can be
addressed using the enzymes responsible for glycan biosynthesis. These enzymes fall into
two broad categories: glycosyltransferases and trans-glycosidases which are responsible for
the formation of specific glycosidic linkages from certain activated glycosides,3-8 and
glycosidases that hydrolyze particular glycosidic linkages. All of these enzymes currently
characterized are highly stereo-selective for formation and cleavage of α- or β-glycosidic
bond, but the glycosyltransferases tend to show higher regioselectivities in glycan bond
formation.9-13
Over the years a number of elegant studies have highlighted the reversibility of many
reactions involving glycosidic bonds and in particular glycosidases have been used ‘in reverse’
for synthesis of glycosidic linkages.14-17 Similarly, reactions catalyzed by inverting
glycosyltransferases have been shown to be reversible (including GT80, GT52 and GT42
sialyltransferases),18-21 although there are no examples of applying them as highly selective
exo-sialidases.
Sialyltransferases are of particularly interest because their substrates (e.g. N-
acetylneuraminic acid, Neu5Ac; a sialic acid) are important building blocks of animal
glycomes. Sialic acid moieties are abundant in the gangliosides of neural membranes in the
brain and in many glycoproteins, as well as bacteria of the microbiota of higher animals.22,23
Sialylation is a terminal/capping modification of the non-reducing ends or branches of
glycans, with a particularly common motif being sialyl-galactoside either in α2,3- or α2,6-
glycosidic linkage.23
Sialic acids are involved in a wide range of biological processes, ranging from cancer to
microbial infections.24-27 Human influenza viruses preferentially bind α2,6-linked sialic acid,
Chapter 5 - ‘Pseudosialidase’
145
swine viruses bind both α2,6- and α2,3-linked sialic acid, while avian and equine viruses
display higher affinity toward α2,3-linked sialic acid.28-31 The great diversity, complexity and
heterogeneity of sialosides represent a serious challenge in the identification of glycan
structures and their function,23 and consequently sialidases have become important tools for
the analysis of sialo-glycoconjugates. Sialidases are highly selective for the α-sialyl linkage,
but show reduced specificity for regioisomeric structures, and with one know exception32
preferentially hydrolyze α2,3-linkages over α2,6-linkages (Figure 1, top; Figure S2).33 The
most commonly used sialidase to assess α2,3-linkages is NanB from Streptococcus pneumoniae,
which produces 2,7-anhydro-Neu5Ac from α2,3-sialosides.34,35 Hence, an enzyme with a
broad substrate scope able to selectively desialylate α2,6-linked Neu5Ac in native
glycoproteins, is currently missing in the glycomics toolbox.
Herein we discuss the exploitation of a α2,6-sialyltransferase as a pseudosialidase that
specifically removes α2,6-linked Neu5Ac by promoting the reverse reaction through addition
of excess CMP. Loss of Neu5Ac was shown by various chromatographic techniques, NMR,
mass spectrometry and ion mobility spectrometry for a wide range of sialosides including
small molecules conjugates, simple glycans, glycopeptides and finally glycoproteins. This
pseudosialidase was highly specific for α2,6-linked Neu5Ac compared to the other
commonly occurring regiosomer α2,3-linked Neu5Ac, for which selective sialidases are
already available.
Chapter 5 - ‘Pseudosialidase’
146
Experimental Section
Sialidase Activity Assays
Sialidase activity of sialidases was assessed using an equimolar mixture of sialosides 1 and
2 (0.25 mM each) and 7.7 µM of enzyme incubated at 37 °C. Salmonella typhinurium LT2
sialidase reaction mixtures contained 50 mM sodium citrate buffer pH 3.5. Reaction mixtures
for the two putative sialidases contained 50 mM tris(hydroxymethyl)-aminomethane (Tris)
buffer pH 7.5. Reactions were incubated at 37 °C and samples taken after 1, 2, 4 and 6 hours.
Sialyltransferase Activity Assay
Sialyltransferase activity was assessed using reaction mixtures containing 50 mM Tris
buffer (pH 7.5), 0.25 mM compound 3, 1 mM CMP-Neu5Ac and 20 mM MgCl2. Reactions
were incubated for six h at 37 °C.
Pseudosialidase Activity Assay.
Pseudosialidase activity of enzymes was evaluated using an equimolar mixture (0.25 mM
each) of sialosides 1 and 2 containing 50 mM Tris buffer (pH 7.5), 4 mM CMP and 20 mM
MgCl2. Reactions were incubated for six h at 37 °C. In the case of Photobacterium sp. JT-ISH-
224 α2,6-sialyltransferase samples were taken after 1, 2, 4 and 6 hours. The pseudosialidase
activity of Photobacterium sp. JT-ISH-224 α2,6-sialyltransferase towards sialoside 2 (0.25 mM)
was assessed using 50 mM Tris buffer pH 7.5, 4 mM CMP, 20 mM MgCl2 and 7.7 µM of
enzyme in the reaction mixtures which were incubated at 37 °C. Samples were taken after 1,
2, 4 and 6 hours.
Chapter 5 - ‘Pseudosialidase’
147
Kinetic Measurements.
The reaction mixtures for kinetic measurements contained 50 mM Tris buffer pH 7.5, 10
mM CMP, 20 mM MgCl2 and 1.54 µM of enzyme at different concentrations (8, 6, 4, 2, 1
and 0.5 mM) of sialoside 1. Reactions were incubated for 60 min at 37 °C. In none of the
reactions did conversion of sialoside 1 to compound 3 exceed 20 %. Conversion was in the
linear range for both the highest and the lowest concentration based on measurements at 30,
60 and 90 min.
Reverse Phase High-Performance Liquid Chromatography (RP HPLC).
Samples containing compounds 1, 2 and/or 3 were analyzed using RP HPLC.
Phenomenex C18 (2)column 250 x 2 mm 5 micron with UV detection at 245 nm (Eluents:
A – 50 mM ammonium formate pH 4.5, B – acetonitrile, flow rate 0.4 mL/min, 0-10 min
isocratic 10 % B, 10-30 min linear gradient 10 to 30 % B and from 30-45 isocratic 10 % B).
Pseudosialidase Reaction Followed by 13C NMR.
To follow pseudosialidase reaction using 13C labeled sialyllactose with 13C NMR a 200
µlenzymatic solution containing 6 mM uniformLy labeled 13C-pyruvate, 6 mM N-
acetylmannosamine (ManNAc), 6 mM CTP, 100 mM Tris buffer (pH 7.5), 10 mM MgCl2
10 µL (of 17.2 mg/mL) purified Escherichia coli K12 aldolase, 2 µL (of 6.3 mg/mL) Neisseria
meningitidis CMP-NeuAc synthase, 2.5 U Saccharomyces cerevisiae pyrophosphatase, was
incubated overnight at 37 °C to synthesize [1,2,3- 13C]-CMP-NeuAc. Following incubation
the enzymes were removed via ultrafiltration. 20 mM of lactose and 2 µlof (3 mg/mL)
Enterobacteriaceae bacterium FGI 57 α2,6-sialyltranferase was added to the filtrate and incubated
overnight to yield 13C labeled α2,6-sialyllactose labeled the C1, C2, and C3 position of the
sialic acid. The sialyltransferase was then removed through ultrafiltration. Some of the excess
lactose was broken down using a β1,4-galactosidase. Following removal of the β1,4-
Chapter 5 - ‘Pseudosialidase’
148
galactosidase, 25 mM CMP and 25 µl(of 14.6 mg/mL) Photobacterium sp. JT-ISH-224 (total
reaction volume increased to 300 µL), was added to the α2,6-sialyllactose mixture and
incubated overnight at 37 °C. Following incubation the enzyme was removed via
ultrafiltration, and the filtrate diluted to 650 µL using D2O and placed in an NMR tube. N.B.
NMR spectra were obtained separately for each stage of the reaction (Figure S6). The
samples were analyzed using a Varian VMS and Bruker Avance II+ 500 MHz spectrometer.
All 13C NMR spectra were obtained using 2048 scans, 1.0223616 acquisition time, 254.8 ppm
spectral width. The C3 carbon of the Neu5Ac was used as a diagnostic carbon (38-44 ppm)
in the NMR to follow the enzymatic reactions. 1 µLaliquots were also taken before and after
the pseudosialidase reaction and analyzed using an Agilent 6510 QTOF connected to an
Agilent 1200 series LC. Flow injection used was 0.3 mL/min 50 % acetonitrile 0.1 % formic
acid.
Pseudosialidase Activity Towards Egg Yolk peptido-N-glycan.
The pseudosialidase activity of Photobacterium sp. JT-ISH-224 α2,6-sialyltransferase
towards egg yolk protein derived α2,6-disialylated bi-antennary peptido-N-glycan from
Ludger was evaluated in reaction mixtures containing 50 mM Tris buffer pH 7.5, 4 mM CMP,
20 mM MgCl2, 0.25 mM peptido-N-glycan and 7.7 µM of enzyme which were incubated at
37 °C for 4 and 16 hours.
Enzymatic Treatment of Fetal Calf Fetuin.
Reactions containing either Photobacterium sp. JT-ISH-224 α2,6-sialyltransferase or
Photobacterium damsela (Pda2,6ST) α2,6-sialyltransferase were prepared using 50 mM Tris
buffer pH 7.5, 4 mM CMP, 20 mM MgCl2, 2 mg/mL fetuin and 7.7 µM of enzyme which
were incubated at 37 °C for 16 hours. Reaction containing Salmonella typhinurium LT2 sialidase
(NanH) consisted of 50 mM sodium citrate buffer pH 6, 2 mg/mL fetuin and 7.7 µM of
Chapter 5 - ‘Pseudosialidase’
149
enzyme which was incubated at 37 °C for 16 hours. Reaction of 25 µLcontaining Streptococcus
pneumoniae NanB consisted of 50 mM sodium phosphate buffer pH 6, 2 mg/mL fetuin and
2 µLof commercial enzyme (following the standard protocol provided by Sigma). Samples
were incubated at 37 °C for 16 hours. Untreated fetuin (from Sigma) served as a control.
Glycan Release, Labeling and Analysis.
Glycans were released and labeled using Waters’ GlycoWorks RapiFluor-MS N-Glycan
Kit and analyzed by hydrophilic interaction liquid chromatography (HILIC) using Waters’
ultra-performance liquid chromatography (UPLC) instrument. The N-glycans were cleaved
from the peptide/protein using PNGase F following detergent-assisted thermal
denaturation. Subsequent labeling with the RapiFluor-MS tag and solid phase extraction
yielded a purified complex mixture of labeled N-glycans for analysis. 20 µLof the glycan
mixture were injected and separated on a ACQUITY UPLC Glycan BEH Amide 130Å
column (1.7 µm, 2.1 x 150 mm) using a gradient (50 mM ammonium formate, pH 4.4 and
acetonitrile; 25 % buffer, 75 % acetonitrile to 46 % buffer, 54 % acetonitrile over 35 min)
with a flow rate of 0.4 mL/min at 60°C over 55 min. Retention times were calibrated against
dextran ladders to calculate glucose units (GU) values which were compared against the
GlycoBase database. Matching species were confirmed by MS.
Traveling Wave Ion Mobility-Mass Spectrometry (TWIMS-MS) Analysis.
Samples (approximately 1-10 µM, 45 mM ammonium acetate pH 7, 25 % DMF, 53.625
% acetonitrile in water) were infused into a Synapt G2-Si HDMS (Waters, UK) by static
nanoelectrospray ionization using pulled borosilicate emitters (World Precision Instruments,
USA, thin-wall capillary, 4” length, 1.2 mm OD). The capillary, cone voltage and source
temperature were typically set to 0.8-1.5 kV, 25 V and 40 °C respectively. No cone gas was
Chapter 5 - ‘Pseudosialidase’
150
used. The trap DC entrance, bias and exit were set to 0, 45 and 3 V. The IM travelling wave
speed was set to 1000 m/s and the wave height set at 40 V. Nitrogen drift gas flow was set
at 90 mL/min for all experiments. The helium and argon flow were set to 180 and 2 mL/min
respectively for the helium and trap cell. The trap voltage was set to 25 V for all collision-
induced dissociation data and was otherwise set to 4 V for MS acquisitions. The transfer
voltage was set to 2 V throughout. The mass measurements were calibrated using 2 mg/mL
NaI calibrant in 50% Isopropyl alcohol. Drift times were calibrated to a mix of dextran 1000
(0.1 mg/mL) and 5000 oligomers (0.5 mg/mL) in the presence of 1 mM NaH2PO4 in 50%
MeOH, whose CCS have been previously verified by DTIMS.
Mass spectra and ATDs were processed using MassLynx V4.1 (Waters, UK) and
OriginPro 9.1 (OriginLabs, USA) respectively. ATDs were calibrated and subsequently
normalized to their maximum intensity. Gaussian distributions were fitted to these spectra
and the center of this fitted peak was taken as the peaks CCS.
Protein Gel Electrophoresis, Western Blot and Lectin Binding.
Samples of commercially available fetal calf fetuin and asialofetuin (both from Sigma),
fetal calf fetuin treated with pseudosialidase and fetal calf fetuin treated with nonspecific
sialidase NanH were subject to sodium dodecyl sulfate polyacrylamide gel electrophoresis
(SDS-PAGE) [4 µg load of each in 30 µL wells]. Reference gel was stained with Instant Blue
(Expedeon).
Two gels were treated for 5 min with Towbin buffer and subject to semi-dry Western blot
(WB) using PVDF membranes (BioRad) activated by methanol and presoaked in Towbin
buffer. Protein transfer to the membrane took 50 min at 15 V.
Membrane blocking was achieved by 1 h incubation with ‘Protein-Free (TBS) Blocking
Buffer’ (Pierce) at room temperature (RT). Lectin binding buffer consisted of 10 mM sodium
phosphate, 150 mM NaCl, 1 % (v/v) Tween 20, pH 7.8. The final concentration of lectin
Chapter 5 - ‘Pseudosialidase’
151
for fluorescein labelled SNA I (from Sambucus nigra; Vector Laboratories) binding was 7.5
µg/mL (20 mL), while the final concentration of lectin for fluorescein labelled MAL I (from
Maackia amurensis; Vector Laboratories) binding was 10 µg/mL (20 mL). After a 1 h
incubation of the membranes with the respective lectins at RT images were obtained using
Typhoon Trio imaging system (blue laser, fluorescein specific filter, 50 µ pixels).
Results and Discussion
Pseudosialidase Activity Towards Simple Sialosides.
Given that efforts to identify new α2,6-sialidases so far had not been successful, we
decided to explore alternative strategies. Previous studies had shown that GT80 family38
sialyltransferases can catalyze both directions of the classical sialyltransferase reaction from
CMP-Neu5Ac to acceptor, which can be prevented by remocing CMP from the reaction
mixture.19-21 We decided to exploit this reversibility by adding excess CMP with the aim to
drive the reaction towards CMP-Neu5Ac formation, thus effectively using the enzyme as a
pseudosialidase. To ensure practical utility, it was important to demonstrate that the
specificity for the α2,6-linkage would be retained in the ‘hydrolysis’ reaction and the enzyme
can operate on complex glycoconjugates such as glycoproteins.
The GT80 family α2,6-sialyltransferases from Photobacterium damsela20 and Photobacterium sp.
JT-ISH-22439 were heterologously expressed in E. coli and their expression and activity
compared to three putative sialyltransferases from Neisseria gonorrhoae (GT52),
Enterobacteriaceae bacterium FGI 57 (GT52) and Campylobacter insulaenigrae (GT42) (Section
S2.1.). The GT52 members exhibited α2,6-sialyltransferase activity as well as α2,6-
pseudosialidase activity, but their bacterial expression was poor, which led us to explore more
suitable candidates. The enzyme from Campylobacter insulaenigrae (a GT42 member) was
confirmed to be an α2,3-sialyltransferase and also exhibited α2,3-pseudosialidase activity.
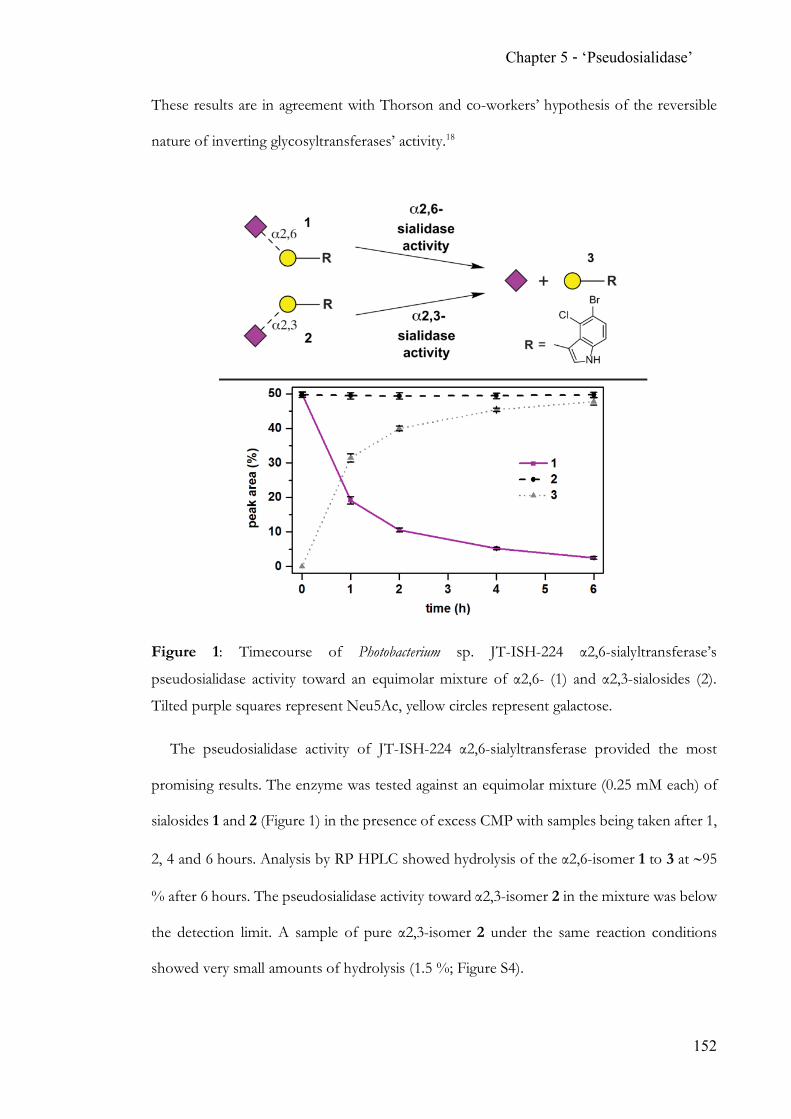
Chapter 5 - ‘Pseudosialidase’
152
These results are in agreement with Thorson and co-workers’ hypothesis of the reversible
nature of inverting glycosyltransferases’ activity.18
Figure 1: Timecourse of Photobacterium sp. JT-ISH-224 α2,6-sialyltransferase’s
pseudosialidase activity toward an equimolar mixture of α2,6- (1) and α2,3-sialosides (2).
Tilted purple squares represent Neu5Ac, yellow circles represent galactose.
The pseudosialidase activity of JT-ISH-224 α2,6-sialyltransferase provided the most
promising results. The enzyme was tested against an equimolar mixture (0.25 mM each) of
sialosides 1 and 2 (Figure 1) in the presence of excess CMP with samples being taken after 1,
2, 4 and 6 hours. Analysis by RP HPLC showed hydrolysis of the α2,6-isomer 1 to 3 at ~95
% after 6 hours. The pseudosialidase activity toward α2,3-isomer 2 in the mixture was below
the detection limit. A sample of pure α2,3-isomer 2 under the same reaction conditions
showed very small amounts of hydrolysis (1.5 %; Figure S4).
Chapter 5 - ‘Pseudosialidase’
153
Measurement of kinetics parameters for hydrolysis of 1 (Figure S5; Section S3.2.) showed
Km to be 4.9 ± 0.4 mM, kcat = 10 ± 1 min-1 and kcat/Km = 2 ± 0.4 mM-1min-1.
Previous work on trans-sialidase activity of GT80 family sialyltransferases suggests
formation of CMP-Neu5Ac.21 To confirm this, 13C labeled α2,6-sialyllactose (Neu5Ac labeled
at C 1, 2 and 3) was synthesized and used as a substrate, which allowed us to track the fate
of Neu5Ac by 13C NMR spectroscopy (Section S3.3.) and mass spectrometry (MS).
Interestingly, a decrease in the α2,6-sialyllactose signal and corresponding increase in free
Neu5Ac were observed, while no CMP-Neu5Ac intermediate was detected (Figures S6 and
S7), suggesting very fast further hydrolysis of CMP-Neu5Ac by the enzyme under the
reaction conditions. However, under the tested reaction conditions no sialidase activity was
detected in the absence of CMP.
Pseudosialidase Activity Towards Egg Yolk peptido-N-glycan.
Next, the activity of the α2,6-pseudosialidase towards the α2,6-disialylated bi-antennary
peptido-N-glycan (A2-peptide isolated from egg yolk; kindly provided by Ludger; Figure 2,
top) was assessed using ultra performance liquid chromatography (UPLC) coupled with
MS.40,41 Figure 2 shows that the enzyme does not discriminate between the two antennae
(partial hydrolysis generates near equimolar peaks of both mono-sialylated isomers, bottom
trace) and desialylation can be pushed to completion (Figure S8, bottom trace). The MS
profile of each peak is represented in the Supporting Information (Figures S9 – S11; Table
S1).
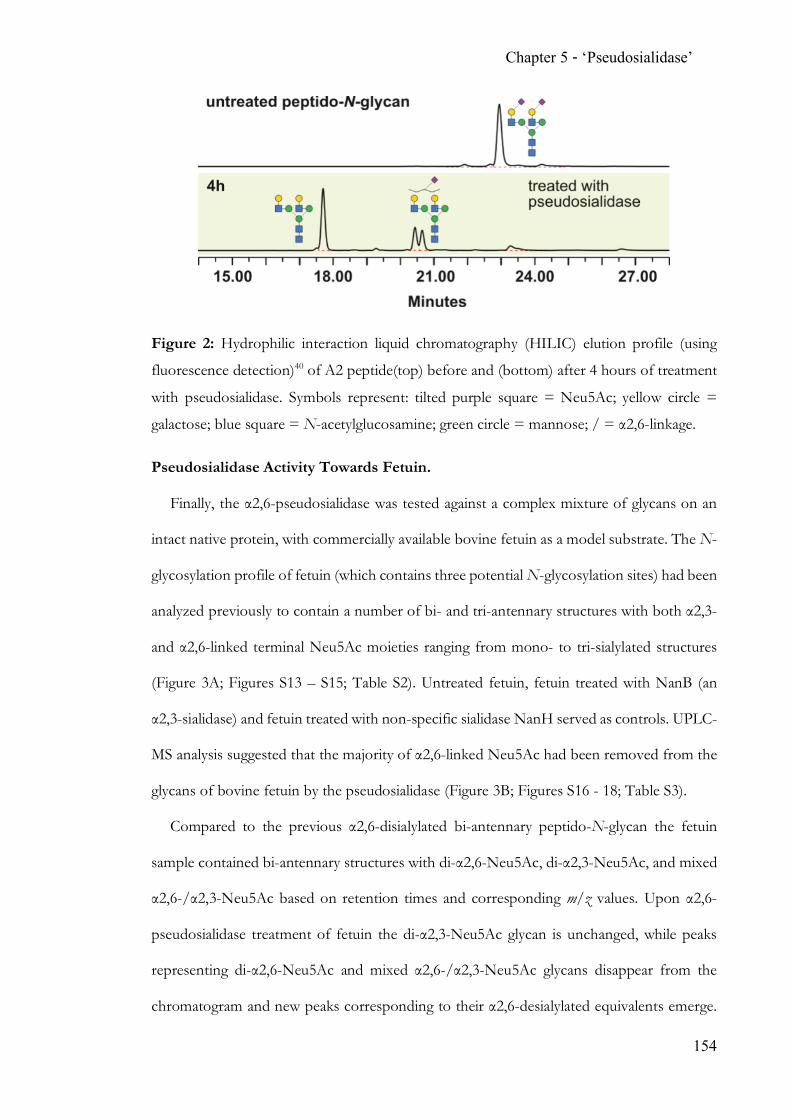
Chapter 5 - ‘Pseudosialidase’
154
Figure 2: Hydrophilic interaction liquid chromatography (HILIC) elution profile (using
fluorescence detection)40 of A2 peptide(top) before and (bottom) after 4 hours of treatment
with pseudosialidase. Symbols represent: tilted purple square = Neu5Ac; yellow circle =
galactose; blue square = N-acetylglucosamine; green circle = mannose; / = α2,6-linkage.
Pseudosialidase Activity Towards Fetuin.
Finally, the α2,6-pseudosialidase was tested against a complex mixture of glycans on an
intact native protein, with commercially available bovine fetuin as a model substrate. The N-
glycosylation profile of fetuin (which contains three potential N-glycosylation sites) had been
analyzed previously to contain a number of bi- and tri-antennary structures with both α2,3-
and α2,6-linked terminal Neu5Ac moieties ranging from mono- to tri-sialylated structures
(Figure 3A; Figures S13 – S15; Table S2). Untreated fetuin, fetuin treated with NanB (an
α2,3-sialidase) and fetuin treated with non-specific sialidase NanH served as controls. UPLC-
MS analysis suggested that the majority of α2,6-linked Neu5Ac had been removed from the
glycans of bovine fetuin by the pseudosialidase (Figure 3B; Figures S16 - 18; Table S3).
Compared to the previous α2,6-disialylated bi-antennary peptido-N-glycan the fetuin
sample contained bi-antennary structures with di-α2,6-Neu5Ac, di-α2,3-Neu5Ac, and mixed
α2,6-/α2,3-Neu5Ac based on retention times and corresponding m/z values. Upon α2,6-
pseudosialidase treatment of fetuin the di-α2,3-Neu5Ac glycan is unchanged, while peaks
representing di-α2,6-Neu5Ac and mixed α2,6-/α2,3-Neu5Ac glycans disappear from the
chromatogram and new peaks corresponding to their α2,6-desialylated equivalents emerge.
Chapter 5 - ‘Pseudosialidase’
155
Similar patterns are observed for tri-antennary structures. Treatment of fetuin with NanB
did not lead to complete removal of α2,3-linked Neu5Ac (Figure 3C; Figures S19 – S22;
Table S4). Treatment of fetuin with unspecific sialidase also did not proceed to completion
(Figure 3D; Figures S23 and S24; Table S5). However, a new peak not seen in previous
samples arose suggesting the presence of a tri-antennary structure with 1,3-linked galactose
(20.489 min, m/z 773.65 [M+3H]3+) instead of the usual 1,4-linked galactose (20.829 min,
m/z 773.50 [M+3H]3+) on one of the antennae.
In order to confirm that desialylation was generally α2,6-specific, ion mobility (IM) MS
was performed on selected samples (Section S3.6.). IM-MS is an emerging method for the
discrimination of isomeric structures and glycan sequencing.42-44 IM-MS2 had previously been
reported to be capable of easily and rapidly discerning Neu5Ac-α2,3/6-Gal-GlcNAc
terminating glycans based on the differing mobilities of the terminal B3-product ion (m/z
657) generated by collision-induced dissociation (detailed description in the SI).45,46 Initially,
the entire sample pool was analyzed (i.e. no quadrupole isolation of a specific m/z), so the
fragments represent the global glycan composition (Figure 4). The α2,6-disialylated bi-
antennary peptido-N-glycan (A2) gave rise to a B3 fragment with a collision cross section
(CCS) of 235 2 in close agreement with the values previously recorded by Kolarich and
coworkers (Figure 4A).45 In comparison, fetuin produced isomeric fragments corresponding
to α2,6- and α2,3-Neu5Ac terminating B3-product ions whose CCS were 235 and 246 Å2
respectively (Figure 4B). Treatment with the pseudosialidase resulted in a significant
reduction of the α2,6-Neu5Ac signal or was abolished for the α2,6-disialylated bi-antennary
peptido-N-glycan (A2) (Figure 4C).
Treatment of fetuin with the α2,3-specific sialidase NanB, resulted in the opposite
spectrum, where almost no α2,3-Neu5Ac signal was observed (Figure 4D). Treatment with
Salmonella typhimurium LT2 nonspecific sialidase (NanH) also resulted in the m/z 657 peak
being below detection level (data not shown).
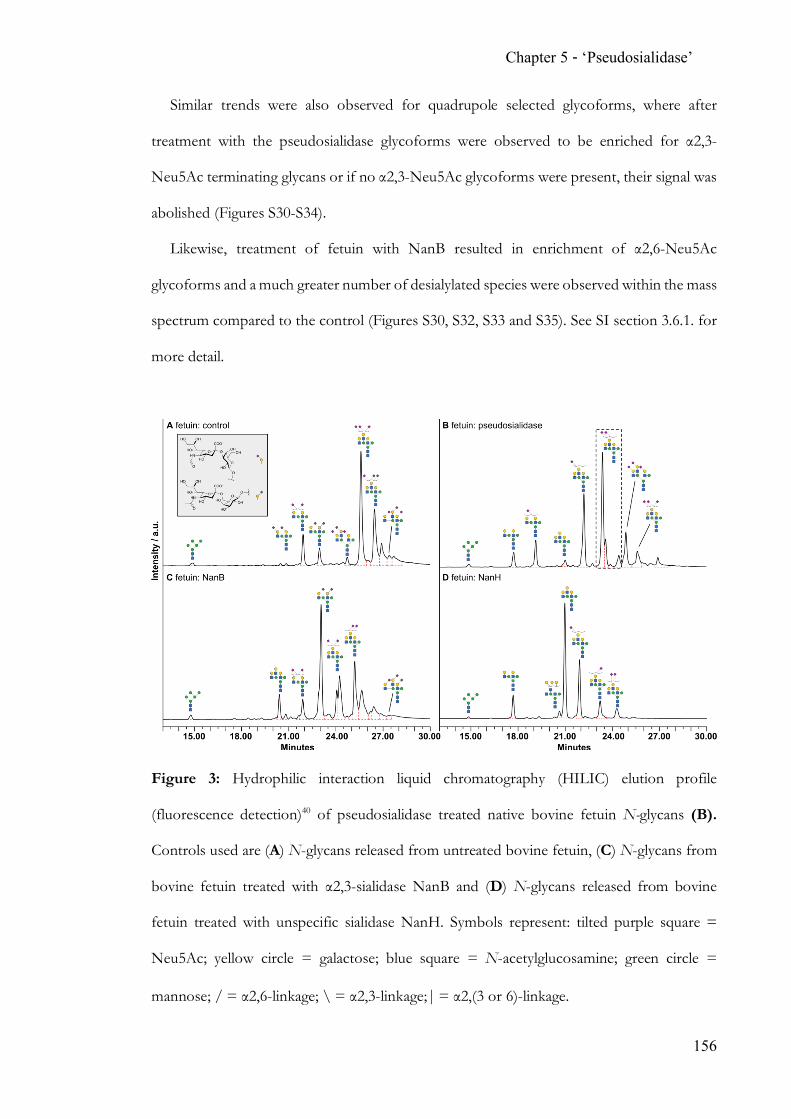
Chapter 5 - ‘Pseudosialidase’
156
Similar trends were also observed for quadrupole selected glycoforms, where after
treatment with the pseudosialidase glycoforms were observed to be enriched for α2,3-
Neu5Ac terminating glycans or if no α2,3-Neu5Ac glycoforms were present, their signal was
abolished (Figures S30-S34).
Likewise, treatment of fetuin with NanB resulted in enrichment of α2,6-Neu5Ac
glycoforms and a much greater number of desialylated species were observed within the mass
spectrum compared to the control (Figures S30, S32, S33 and S35). See SI section 3.6.1. for
more detail.
Figure 3: Hydrophilic interaction liquid chromatography (HILIC) elution profile
(fluorescence detection)40 of pseudosialidase treated native bovine fetuin N-glycans (B).
Controls used are (A) N-glycans released from untreated bovine fetuin, (C) N-glycans from
bovine fetuin treated with α2,3-sialidase NanB and (D) N-glycans released from bovine
fetuin treated with unspecific sialidase NanH. Symbols represent: tilted purple square =
Neu5Ac; yellow circle = galactose; blue square = N-acetylglucosamine; green circle =
mannose; / = α2,6-linkage; \ = α2,3-linkage; | = α2,(3 or 6)-linkage.
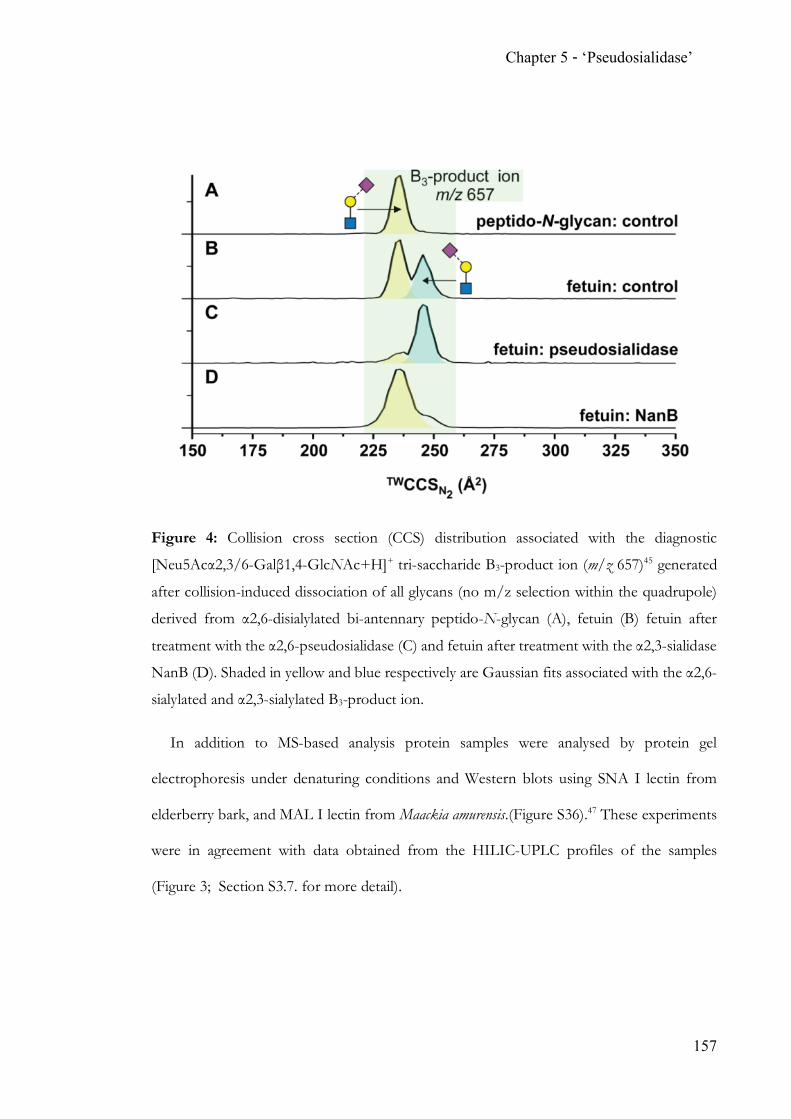
Chapter 5 - ‘Pseudosialidase’
157
Figure 4: Collision cross section (CCS) distribution associated with the diagnostic
[Neu5Acα2,3/6-Galβ1,4-GlcNAc+H]+ tri-saccharide B3-product ion (m/z 657)45 generated
after collision-induced dissociation of all glycans (no m/z selection within the quadrupole)
derived from α2,6-disialylated bi-antennary peptido-N-glycan (A), fetuin (B) fetuin after
treatment with the α2,6-pseudosialidase (C) and fetuin after treatment with the α2,3-sialidase
NanB (D). Shaded in yellow and blue respectively are Gaussian fits associated with the α2,6-
sialylated and α2,3-sialylated B3-product ion.
In addition to MS-based analysis protein samples were analysed by protein gel
electrophoresis under denaturing conditions and Western blots using SNA I lectin from
elderberry bark, and MAL I lectin from Maackia amurensis.(Figure S36).47 These experiments
were in agreement with data obtained from the HILIC-UPLC profiles of the samples
(Figure 3; Section S3.7. for more detail).
Chapter 5 - ‘Pseudosialidase’
158
Conclusions
In conclusion, we have demonstrated that the heterologously expressed Photobacterium sp.
JT-ISH-224 α2,6-sialyl-transferase is able to specifically target α2,6-linked Neu5Ac in
complex mixture of N-glycans of a native protein leading to removal of the target moiety
over α2,3-linkage in high yields. Hence, this α2,6-pseudosialidase should be a valuable
addition to the glycan analysis and remodeling toolbox.
Supporting Information
Additional experimental procedures, protein sequences, supplementary results containing
sialidase treatment profiles of compounds and MS data. This material is available free of
charge on the ACS Publications website as PDF
Corresponding Authors
[email protected], [email protected]
Author Contributions
The manuscript was written through contributions of all authors. / All authors have given
approval to the final version of the manuscript.
Notes
The authors declare no competing financial interests.
Acknowledgment
This study was supported by the BBSRC, EPSRC, InnovateUK: IBCatalyst
[BB/M02903411] and by the European Union’s Seventh Framework Programme
[FP7/2007–2013] under grant agreement No. 266025. The authors would like to thank
Ludger Ltd. for donating the egg yolk peptido-N-glycan.
Chapter 5 - ‘Pseudosialidase’
159
References
[1] Dosekova, E.; Filip, J.; Bertok, T.; Both, P.; Kasak, P.; Tkac, J. Med. Res. Rev. 2017, 37,
514-626.
[2] Wang, L. X.; Amin, M. N. Chem. Biol. 2014, 21, 51-66.
[3] Rich, J. R.; Withers, S. G. Nat. Chem. Biol. 2009, 5, 206-215.
[4] Wang, L. X. Carbohydr. Res. 2008, 343, 1509-1522.
[5] Chen, X.; Varki, A. ACS Chem. Biol. 2010, 5, 163-176.
[6] Schmaltz, R. M.; Hanson, S. R.; Wong, C. H. Chem. Rev. 2011, 111, 4259-4307.
[7] Wang, L. X.; Lomino, J. V. ACS Chem. Biol. 2012, 7, 110-122.
[8] Šardzík, R.; Green, A. P.; Laurent, N.; Both, P.; Fontana, C.; Voglmeir, J.;
Weissenborn, M. J.; Haddoub, R.; Grassi, P.; Haslam, S. M.; Widmalm, G.; Flitsch, S.
L. J. Am. Chem. Soc. 2012, 134, 4521-4524.
[9] Schedin-Weiss, S.; Winblad, B.; Tjernberg, L. O. FEBS J. 2014, 281, 46-62.
[10] Paleček, E.; Tkáč, J.; Bartošík, M.; Bertók, T.; Ostatná, V.; Paleček, J. Chem. Rev. 2015,
115, 2045-2108.
[11] Stanton, R.; Hykollari, A.; Eckmair, B.; Malzl, D.; Dragosits, M.; Palmberger, D.;
Wang, P.; Wilson, I. B.; Paschinger, K. Biochim. Biophys. Acta. 2017, 1861, 699-714.
[12] Paschinger, K.; Wilson, I. B. Glycoconj. J. 2016, 33, 273-283.
[13] Wilson, I. B.; Paschinger, K. Anal. Bioanal. Chem. 2016, 408, 461-471.
[14] Vic, G.; Hastings, J. J.; Crout, D. H. G. Tetrahedron Asymmetry. 1996, 7, 1973-1984.
[15] Hancock, S. M.; Corbett, K.; Fordham-Skelton, A. P.; Gatehouse, J. A.; Davis, B. G.
Chembiochem. 2005, 6, 866-875.
[16] Bojarova, P.; Kren, V. Chimia (Aurau). 2011, 65, 65-70.
[17] Lu, L.; Liu, Q.; Jin, L.; Yin, Z.; Xu, L.; Xiao, M. PLoS One. 2015, 10, e0140531. D.O.I.:
10.1371/journal.pone.0140531.
[18] Zhang, C.; Griffith, B. R.; Fu, Q.; Albermann, C.; Fu, X.; Lee, I. K.; Li, L.; Thorson, J.
S. Science. 2006, 313, 1291-1294.
[19] Lairson, L. L.; Wakarchuk, W. W.; Withers, S. G. Chem. Commun. (Camb.). 2007, 4, 365-
367.
[20] Cheng, J.; Huang, S.; Yu, H.; Li, Y.; Lau, K.; Chen, X. Glycobiology. 2010, 20, 260-268.
[21] Mehr, K.; Withers, S. G. Glycobiology. 2016, 26, 353-359.
[22] Freeze, H. H.; Eklund, E. A.; Ng, B. G.; Patterson, M. C. Annu. Rev. Neurosci. 2015, 38,
105-125.
Chapter 5 - ‘Pseudosialidase’
160
[23] Varki, N. M.; Varki, A. Lab. Invest. 2007, 87, 851-857.
[24] Stowell, S. R.; Ju, T.; Cummings, R. D. Annu. Rev. Pathol. 2015, 10, 473-510.
[25] Borsig, L.; Wong, R.; Hynes, R. O.; Varki, N. M.; Varki, A. Proc. Natl. Acad. Sci. U.S.A.
2002, 99, 2193-2198.
[26] Kato, K.; Ishiwa, A. Trop. Med. Health. 2015, 43, 41-52.
[27] Lubin, J. B.; Lewis, W. G.; Gilbert, N. M.; Weimer, C. M.; Almagro-Moreno, S.; Boyd,
E. F.; Lewis, A. L. Infect. Immun. 2015, 83, 3126-3136.
[28] Wang, Z.; Chinoy, Z. S.; Ambre, S. G.; Peng, W.; McBride, R.; de Vries, R. P.; Glushka,
J.; Paulson, J. C.; Boons, G. J. Science. 2013, 341, 379-383.
[29] Ito, T.; Couceiro, J. N.; Kelm, S.; Baum, L. G.; Krauss, S.; Castrucci, M. R.; Donatelli,
I.; Kida, H.; Paulson, J. C.; Webster, R. G.; Kawaoka, Y. J. Virol. 1998, 72, 7367-7373.
[30] Connor, R. J.; Kawaoka, Y.; Webster, R. G.; Paulson, J. C. Virology. 1994, 205, 17-23.
[31] Wilks, S.; de Graaf, M.; Smith, D. J.; Burke, D. F. Vaccine. 2012, 30, 4369-4376.
[32] Corfield, A. P.; Higa, H.; Paulson, J. C.; Schauer, R. Biochim. Biophys. Acta. 1983, 744,
121-126.
[33] Varki, A.; Schauer, R. Sialic Acids. In Essentials of Glycobiolgy, 2nd ed.; Varki, A.;
Cummings, R. D.; Esko, J. D.; Freeze, H. H.; Stanley, P.; Bertozzi, C. R.; Hart, G. W.;
Etzler, M. E.; Eds.; Cold Spring Harbor (NY): Cold Spring Harbor Laboratory Press;
2009. Chapter 14.
[34] Xu, G.; Kiefel, M. J.; Wilson, J. C.; Andrew, P. W.; Oggioni, M. R.; Taylor, G.L. J. Am.
Chem. Soc. 2011, 133, 1718-1721.
[35] Gut, H.; King, S. J.; Walsh, M. A. FEBS Lett. 2008, 582, 3348-3352.
[36] Huang, K.; Wang, M. M.; Kulinich, A.; Yao, H. L.; Ma, H. Y.; Martínez, J. E.; Duan,
X. C.; Chen, H.; Cai, Z. P.; Flitsch, S. L.; Liu, L.; Voglmeir, J. Carbohydr. Res. 2015, 415,
60-65.
[37] Minami, A.; Ishibashi, S.; Ikeda, K.; Ishitsubo, E.; Hori, T.; Tokiwa, H.; Taguchi, R.;
Ieno, D.; Otsubo, T.; Matsuda, Y.; Sia, S.; Inada, M.; Suzuki, T. FEBS Open Bio. 2013,
3, 231-236.
[38] Lombard, V.; Golaconda Ramulu, H.; Drula, E.; Coutinho, P. M.; Henrissat, B. Nucleic.
Acids. Res. 2014, 42, D490-495.
[39] Tsukamoto, H.; Takakura, Y.; Mine, T.; Yamamoto, T. J. Biochem. 2008, 143, 187-197.
[40] Bones, J.; Mittermayer, S.; O’Donoghue, N.; Guttman, A.; Rudd, P. M. Anal. Chem.
2010, 82, 10208-10215.
Chapter 5 - ‘Pseudosialidase’
161
[41] Campbell, M. P.; Royle, L.; Radcliffe, C. M.; Dwek, R. A.; Rudd, P. M. Bioinformatics
2008, 24, 1214-1216.
[42] Both, P.; Green, A. P.; Gray, C. J.; Šardzík, R.; Voglmeir, J.; Fontana, C.; Austeri, M.;
Rejzek, M.; Richardson, D.; Field, R. A.; Wildmalm, G.; Flitsch, S. L.; Eyers, C. E. Nat.
Chem. 2014, 6, 65-74.
[43] Hofmann, J.; Hahm, H. S.; Seeberger, P. H.; Pagel, K. Nature. 2015, 526, 241-244.
[44] Gray, C.J.; Schindler, B.; Migas, L. G.; Pičmanová, M.; Allouche, A. R.; Green, A. P.;
Mandal, S.; Motawia, M. S.; Sánchez-Pérez, R.; Bjarnholt, N.; Møller, B. L.; Rijs, A. M.;
Barran, P. E.; Compagnon, I.; Eyers, C. E.; Flitsch, S.L. Anal. Chem. 2017, 89, 4540-
4549.
[45] Hinnenburg, H.; Hofmann, J.; Struwe, W. B.; Thader, A.; Altmann, F.; Varón Silva,
D.; Seeberger, P. H.; Pagel, K.; Kolarich, D. Chem. Commun. (Camb.] 2016, 52, 4381-
4384.
[46] Hofmann, J.; Struwe, W. B.; Scarff, C. A.; Scrivens, J. H.; Harvey, D. J.; Pagel, K. Anal.
Chem. 2014, 86, 10789-10795.
[47] Cummings, R. D.; Etzler, M. E. Antibodies and Lectins in Glycan Analysis. In
Essentials of Glycobiolgy, 2nd ed.; Varki, A.; Cummings, R. D.; Esko, J. D.; Freeze,
H. H.; Stanley, P.; Bertozzi, C. R.; Hart, G. W.; Etzler, M. E.; Eds.; Cold Spring Harbor
(NY): Cold Spring Harbor Laboratory Press; 2009. Chapter 45.
Chapter 5 - ‘Pseudosialidase’
162
5.4 Supporting Information
Development and application of a highly α2,6-selective
pseudosialidase.
Peter Both,*† Michel Riese,† Christopher J. Gray, † Kun Huang,† Edward G. Pallister,†
Iaroslav Kosov,† Louis P. Conway,‡ Josef Voglmeir,‡ and Sabine L. Flitsch*†
Chapter 5 - ‘Pseudosialidase’
163
Chemo-enzymatic synthesis of UV active sialylgalactosides from 5-bromo-4-chloro-
3-indolyl-β-D-galactopyranoside (X-Gal)
Chemo-enzymatic synthesis of sialosides 1 and 2
X-Gal-α2,6-Neu5Ac (1) and X-Gal-α2,3-Neu5Ac (2) were chemo-enzymatically
synthesized according to a previously reported method.S1 Briefly, N-acetylglucosamine (44
mg, 0.20 mmol) was dissolved in 50 mL of water and combined with sodium pyruvate (53
mg, 0.48 mmol), cytidine triphosphate (38 mg, 79 µmol), X-Gal (3) (16 mg, 39 µmol) , MgCl2
(11 mg, 1.2 mmol), N-aceylglucosamine-2-Epimerase (50 mU from Pedobacter heparinus), sialic
acid aldolase (25 mU from Escherichia coli), CMP-sialic acid synthase (20 mU from Neisseria
meningitidis), sialyltransferase (20 mU of Campylobacter jejuni α2,3-Sialyltransferase or 25 mU
Photobacterium damsalae α2,6-Sialyltransferase), in 2-(N-morpholino)ethanesulfonic acid
(MES) buffer (final concentration of 40 mM, pH 6.5 to a final volume of 50 mL). The
solutions were incubated at 37°C until ≥80 % conversions were observed by HPLC analysis.
Excess X-Gal was digested using β-galactosidase from Escherichia coli (~10 U, 37 °C, 30 min)
and the X-Gal-labeled sialic acids were isolated by solid phase extraction (RP-SPE, yielding
7 mg and 10 mg, respectively), and analyzed using nuclear magnetic resonance (NMR)
spectroscopy.
Concentration assessment of 1 and 2 was performed by HPLC using standard curve of
the commercially available compound 3.
Sialidases and sialyltransferases used in this study
Photobacterium sp. JT-ISH-224 α2,6-sialyltransferase, Salmonella typhinurium LT2 sialidase
(NanH), Paeniclostridium sordellii 8483 sialidase, Saccharothrix xinjiangensis sialidase, Neisseria
gonorrhoae α2,6-sialyltransferase, Enterobacteriaceae bacterium FGI 57 α2,6-sialyltransferase and
Campylobacter insulaenigrae α2,3-sialyltransferase were obtained from Prozomix. Photobacterium
damsela α2,6-sialyltransferase was expressed and purified as reported previously.S2 Streptococcus
pneumoniae sialidase (NanB) was purchased in the form of aqueous solution from Sigma.
Chapter 5 - ‘Pseudosialidase’
164
Molecular weights and amino acid sequences of recombinant enzymes provided by
Prozomix, Ltd.
Photobacterium sp. JT-ISH-224 α2,6-sialyltransferase (MW = 58.8 kDa):
MGSSHHHHHHSSGLVPRGSHMEENTQSIIKNDINKTIIDEEYVNLEPINQSNISFTKHSWVQTC
GTQQLLTEQNKESISLSVVAPRLDDDEKYCFDFNGVSNKGEKYITKVTLNVVAPSLEVYVDHAS
LPTLQQLMDIIKSEEENPTAQRYIAWGRIVPTDEQMKELNITSFALINNHTPADLVQEIVKQAQ
TKHRLNVKLSSNTAHSFDNLVPILKELNSFNNVTVTNIDLYDDGSAEYVNLYNWRDTLNKTDNL
KIGKDYLEDVINGINEDTSNTGTSSVYNWQKLYPANYHFLRKDYLTLEPSLHELRDYIGDSLKQ
MQWDGFKKFNSKQQELFLSIVNFDKQKLQNEYNSSNLPNFVFTGTTVWAGNHEREYYAKQQINV
INNAINESSPHYLGNSYDLFFKGHPGGGIINTLIMQNYPSMVDIPSKISFEVLMMTDMLPDAVA
GIASSLYFTIPAEKIKFIVFTSTETITDRETALRSPLVQVMIKLGIVKEENVLFWADLPNCETG
VCIAV
Salmonella typhinurium LT2 sialidase (MW = 44.2 kDa):
MGSSHHHHHHSSGLVPRGSHMTVEKSVVFKAEGEHFTDQKGNTIVGSGSGGTTKYFRIPAMCTT
SKGTIVVFADARHNTASDQSFIDTAAARSTDGGKTWNKKIAIYNDRVNSKLSRVMDPTCIVANI
QGRETILVMVGKWNNNDKTWGAYRDKAPDTDWDLVLYKSTDDGVTFSKVETNIHDIVTKNGTIS
AMLGGVGSGLQLNDGKLVFPVQMVRTKNITTVLNTSFIYSTDGITWSLPSGYCEGFGSENNIIE
FNASLVNNIRNSGLRRSFETKDFGKTWTEFPPMDKKVDNRNHGVQGSTITIPSGNKLVAAHSSA
QNKNNDYTRSDISLYAHNLYSGEVKLIDDFYPKVGNASGAGYSCLSYRKNVDKETLYVVYEANG
SIEFQDLSRHLPVIKSYN
Chapter 5 - ‘Pseudosialidase’
165
Paeniclostridium sordellii 8483 sialidase (MW = 44 kDa):
MGSSHHHHHHSSGLVPRGSHMSNLNTTNEPQKTTIFNKNDNMWNAQYFRIPSLQTLADGTMLAF
SDIRYNGAADHAYIDIGAAKSTDNGQTWEYKTVMENDRIDSTFSRVMDSTTVVTDTGRIILIAG
SWNKNGNWASSTTSLRSDWSVQMVYSDDNGETWSDKVDLTTNKARIKNQPSNTIGWLGGVGSGI
VMSDGTIVMPIQIALRENNANNYYSSVIYSKDNGETWTMGNKVPDPKTSENMVIELDGALIMSS
RNDGKNYRASYISYDLGSTWEVYDPLHNKISTGNGSGCQGSFIKVTAKDGHRLGFISAPKNTKG
GYVRDNITVYMVDFDDLSKGVRELCIPYPEDGNSSGGGYSCLSFNNGKLSILYEANGNIEYKDL
TDYYLSLENNKKLK
Saccharothrix xinjiangensis sialidase (MW = 45.9 kDa):
MGSSHHHHHHSSGLVPRGSHMAPQNTQATPHFSTVDDPAMDAPQQHTAYVLFQGGHRESLNGIT
YHSFRIPAIVRTNAGTLLAFAEGRVKSNQDHGNINLVYKRGVNNGSKASDWSGLKEAVGAGMGT
WGNPTPVVDRATGTIWLFLSWNAADKSLGGGTNPDTGEPTSPIRQWGERRVYAMKSTDDGLTFT
GLDGSSRPTDLTEALLPKTKADGSTWAWDAMGPGAGLYTSGGALVIPAQHRNIYSTDHGRTWKV
QKLAEGTGEATITELADGTLYRNDRPGGTTWAEIAKRRFVARGGLDSGFAPFTPDDTLLDPKNQ
ASVLQYNNDAPARTIFLNSASTEVRTKMRVRLSYDGARTWPVSRPLSDGPSAPGAGTEGGYSSM
AKTSDYRIGALVESNLDVGDRTSARSIVFRKFNLSWILHGCAC
Neisseria gonorrhoae α2,6-sialyltransferase (MW = 42.9 kDa):
MGSSHHHHHHSSGLVPRGSHMDRVNQGERNAVSLLKDKLFNEEGKPVNLIFCYTILQMKVAERI
MAQHPGERFYVVLMSENRNEKYDYYFNQIKDKAERAYFFYLPYGLNKSFNFIPTMAELKVKSML
LPKVKRIYLASLEKVSIAAFLSTYPDAEIKTFDDGTNNLIRESSYLGGEFAVNGAIKRNFARMM
VGDWSIAKTRNASDEHYTIFKGLKNIMDDGRRKMTYLPLFDASELKAGDETGGTVRILLGSPDK
EMKEISEKAAKNFNIQYVAPHPRQTYGLSGVTALNSPYVIEDYILREIKKNPHTRYEIYTFFSG
AALTMKDFPNVHVYALKPASLPEDYWLKPVYALFRQADIPILAFDDKNQSHGKSK
Chapter 5 - ‘Pseudosialidase’
166
Enterobacteriaceae bacterium FGI 57 α2,6-sialyltransferase (MW = 37.7 kDa):
MGSSHHHHHHSSGLVPRGSHMKKVIKEETIEYDDIEFVYFSKTYDDKQSKYYELISVHAKKSTF
ITGVYSFKLIQELKAKFKGRSYDKVLLASLDDSINHYLLSFCDFNQLITFDDGVGNIIKTGAYF
IEDSRRSLKKRFFTLVHILLGRKYYLNLIKQRSDRHYTIYKGFENCVPNAKAISLFDFHLSPKT
FNNVTHVFLGTMFNEITIQQHEGDYLKKELLSYMLGIQGSVKYIPHPRSRDREFTPYEFESNGI
AEEIVFELLSHGYVVNLYGFASSCQFNLMNIRGVNIILLDSPRVNMAVKEAINMLLEKIPSSNY
INIQS
Campylobacter insulaenigrae α2,3-sialyltransferase (MW = 37.3 kDa):
MGSSHHHHHHSSGLVPRGSHMEEKNALICGNGPSLREIEYEKLPKNYDVFRCNQFYFEDKYYAG
KNIQYAFFNPYVFFEQYYTIKNIIDKDEYDIKNIVCSSFGLESIDSRNLLEFFYNYFPDTIFGF
DLIKQLKEFHSFIKFNEIYNEQRITSGIYMCAFAVAMGYKNIYISGIDFYSNKNQPYLFKYQTN
NVLKLIPEFKNEIKATIHSKNFDLKALEFLSKTYNVNFYSLNQNSELSKYIKLASIIRGNNDFV
IDNKPKDYIDDILLPANNTYKKFKKFPLPVIKNNLWFRLIKDLVRLPSDIKHYLKDKR
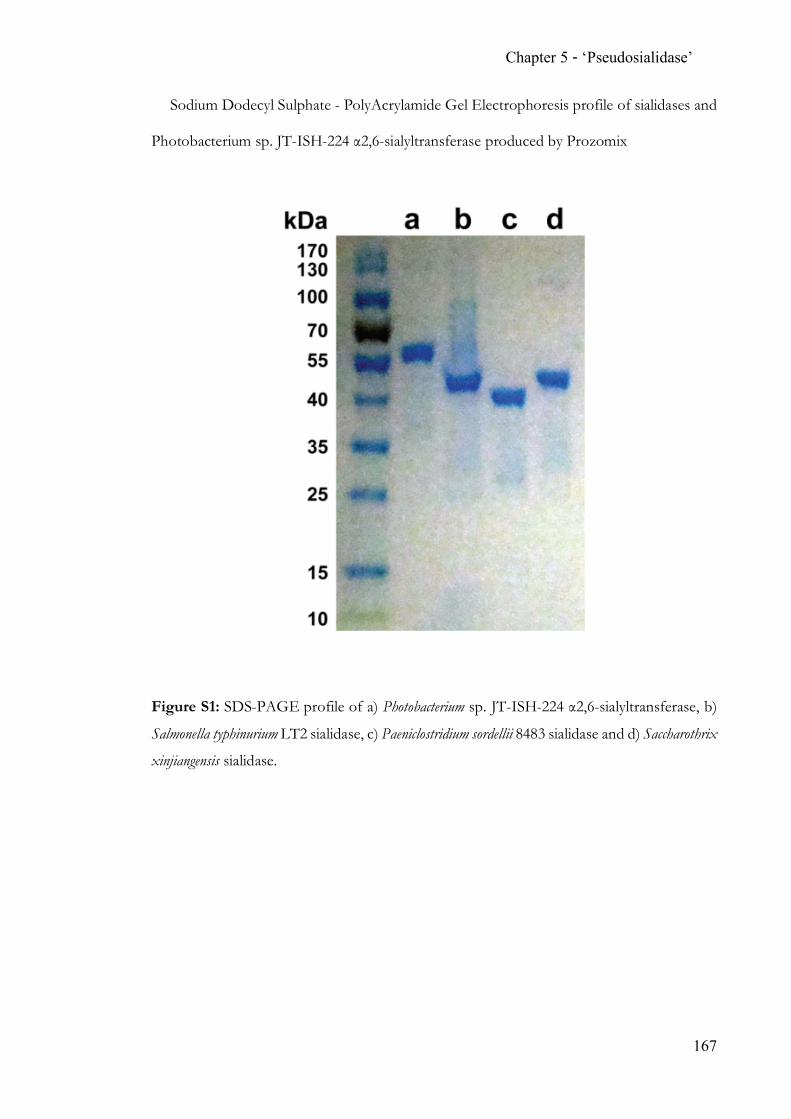
Chapter 5 - ‘Pseudosialidase’
167
Sodium Dodecyl Sulphate - PolyAcrylamide Gel Electrophoresis profile of sialidases and
Photobacterium sp. JT-ISH-224 α2,6-sialyltransferase produced by Prozomix
Figure S1: SDS-PAGE profile of a) Photobacterium sp. JT-ISH-224 α2,6-sialyltransferase, b)
Salmonella typhinurium LT2 sialidase, c) Paeniclostridium sordellii 8483 sialidase and d) Saccharothrix
xinjiangensis sialidase.
Chapter 5 - ‘Pseudosialidase’
168
Sialidases: Activity towards α2,3- and α2,6-sialoside
Sialidase activity of sialidases was assessed using an equimolar mixture of sialosides 1 and
2 (0.25 mM each) and 7.7 µM of enzyme incubated at 37 °C. Salmonella typhinurium LT2
sialidase reaction mixtures contained 50 mM sodium citrate buffer pH 3.5. Reaction mixtures
for the two putative sialidases contained 50 mM tris(hydroxymethyl)-aminomethane (Tris)
buffer pH 7.5. Reactions were incubated at 37 °C and samples taken after 1, 2, 4 and 6 hours.
Samples containing compounds 1, 2 and/or 3 were analyzed using RP HPLC.
Phenomenex C18 (2)column 250 x 2 mm 5 micron with UV detection at 245 nm (Eluents:
A – 50 mM ammonium formate pH 4.5, B – acetonitrile, flow rate 0.4 mL/min, 0-10 min
isocratic 10 % B, 10-30 min linear gradient 10 to 30 % B and from 30-45 isocratic 10 % B).
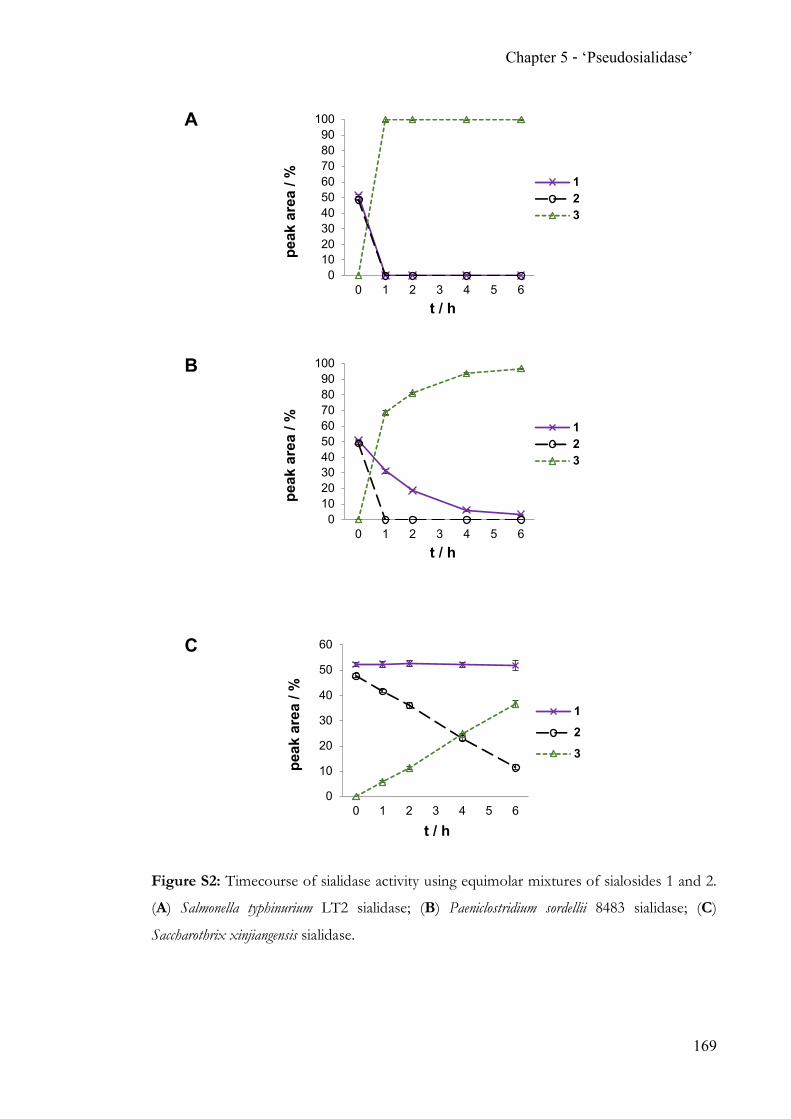
Chapter 5 - ‘Pseudosialidase’
169
Figure S2: Timecourse of sialidase activity using equimolar mixtures of sialosides 1 and 2.
(A) Salmonella typhinurium LT2 sialidase; (B) Paeniclostridium sordellii 8483 sialidase; (C)
Saccharothrix xinjiangensis sialidase.
0102030405060708090
100
0 1 2 3 4 5 6pe
ak a
rea
/ %t / h
123
0102030405060708090
100
0 1 2 3 4 5 6
peak
are
a / %
t / h
123
0
10
20
30
40
50
60
0 1 2 3 4 5 6
peak
are
a / %
t / h
123
A
B
C
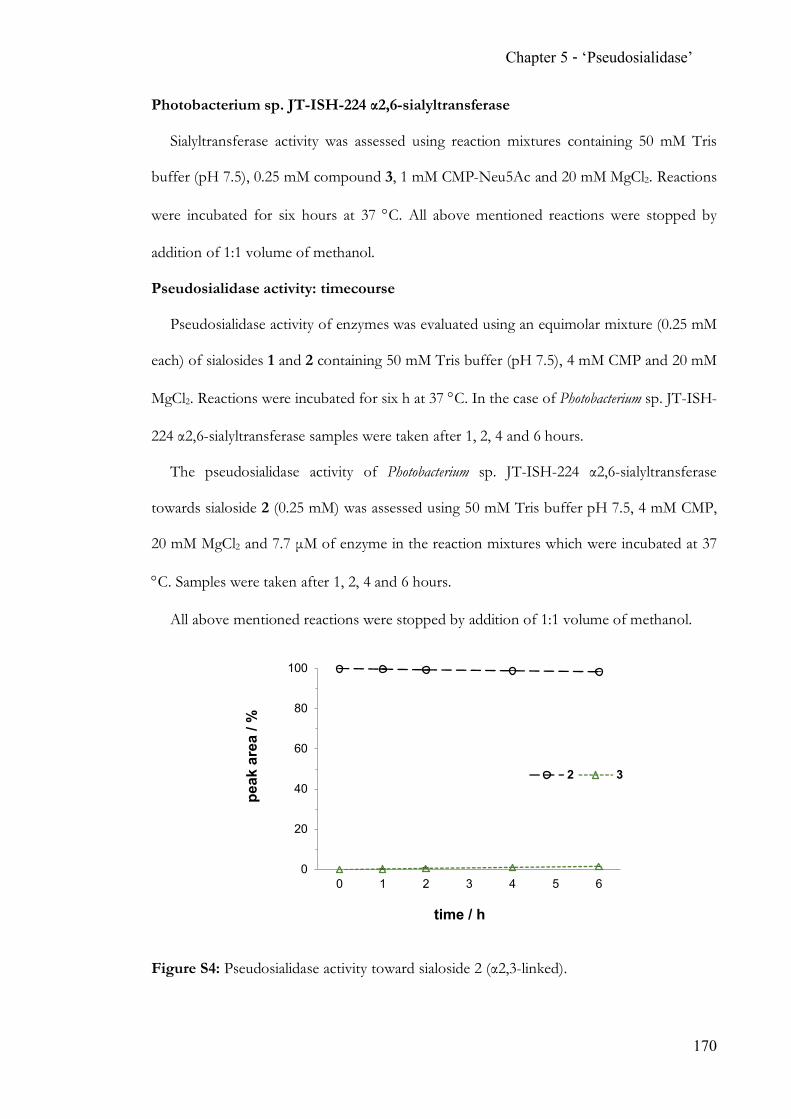
Chapter 5 - ‘Pseudosialidase’
170
Photobacterium sp. JT-ISH-224 α2,6-sialyltransferase
Sialyltransferase activity was assessed using reaction mixtures containing 50 mM Tris
buffer (pH 7.5), 0.25 mM compound 3, 1 mM CMP-Neu5Ac and 20 mM MgCl2. Reactions
were incubated for six hours at 37 °C. All above mentioned reactions were stopped by
addition of 1:1 volume of methanol.
Pseudosialidase activity: timecourse
Pseudosialidase activity of enzymes was evaluated using an equimolar mixture (0.25 mM
each) of sialosides 1 and 2 containing 50 mM Tris buffer (pH 7.5), 4 mM CMP and 20 mM
MgCl2. Reactions were incubated for six h at 37 °C. In the case of Photobacterium sp. JT-ISH-
224 α2,6-sialyltransferase samples were taken after 1, 2, 4 and 6 hours.
The pseudosialidase activity of Photobacterium sp. JT-ISH-224 α2,6-sialyltransferase
towards sialoside 2 (0.25 mM) was assessed using 50 mM Tris buffer pH 7.5, 4 mM CMP,
20 mM MgCl2 and 7.7 µM of enzyme in the reaction mixtures which were incubated at 37
°C. Samples were taken after 1, 2, 4 and 6 hours.
All above mentioned reactions were stopped by addition of 1:1 volume of methanol.
Figure S4: Pseudosialidase activity toward sialoside 2 (α2,3-linked).
0
20
40
60
80
100
0 1 2 3 4 5 6
peak
are
a / %
time / h
2 3
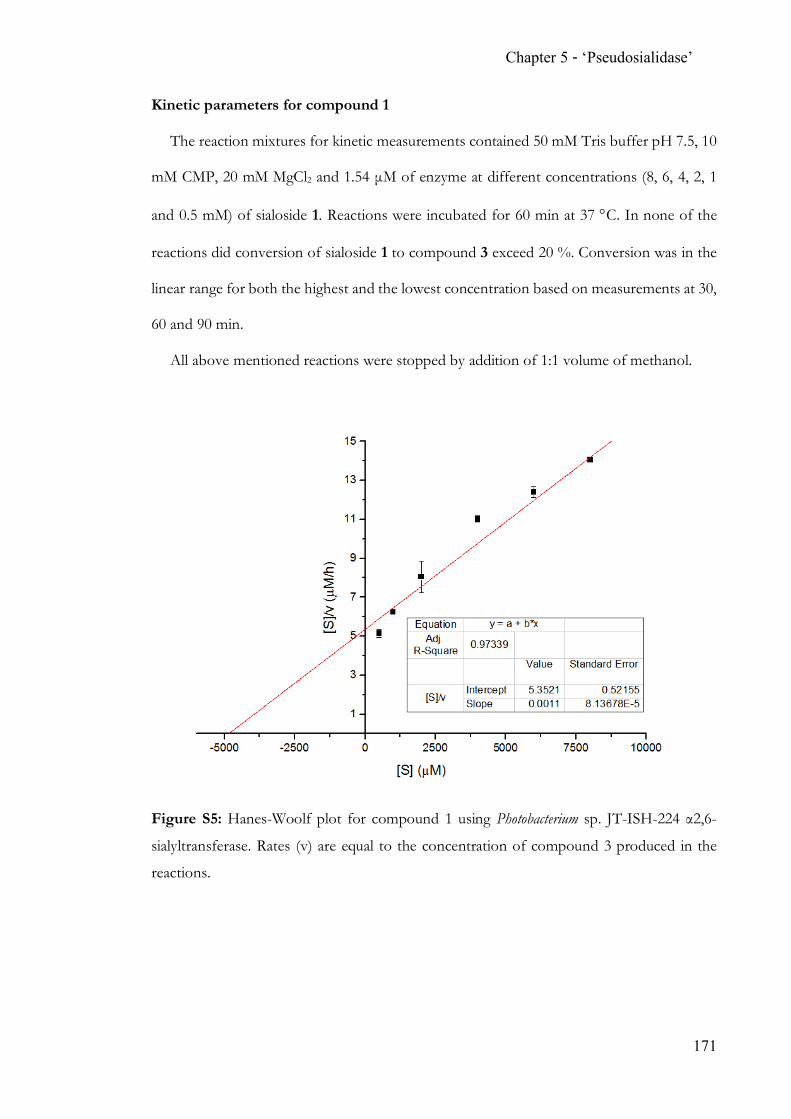
Chapter 5 - ‘Pseudosialidase’
171
Kinetic parameters for compound 1
The reaction mixtures for kinetic measurements contained 50 mM Tris buffer pH 7.5, 10
mM CMP, 20 mM MgCl2 and 1.54 µM of enzyme at different concentrations (8, 6, 4, 2, 1
and 0.5 mM) of sialoside 1. Reactions were incubated for 60 min at 37 °C. In none of the
reactions did conversion of sialoside 1 to compound 3 exceed 20 %. Conversion was in the
linear range for both the highest and the lowest concentration based on measurements at 30,
60 and 90 min.
All above mentioned reactions were stopped by addition of 1:1 volume of methanol.
Figure S5: Hanes-Woolf plot for compound 1 using Photobacterium sp. JT-ISH-224 α2,6-
sialyltransferase. Rates (v) are equal to the concentration of compound 3 produced in the
reactions.
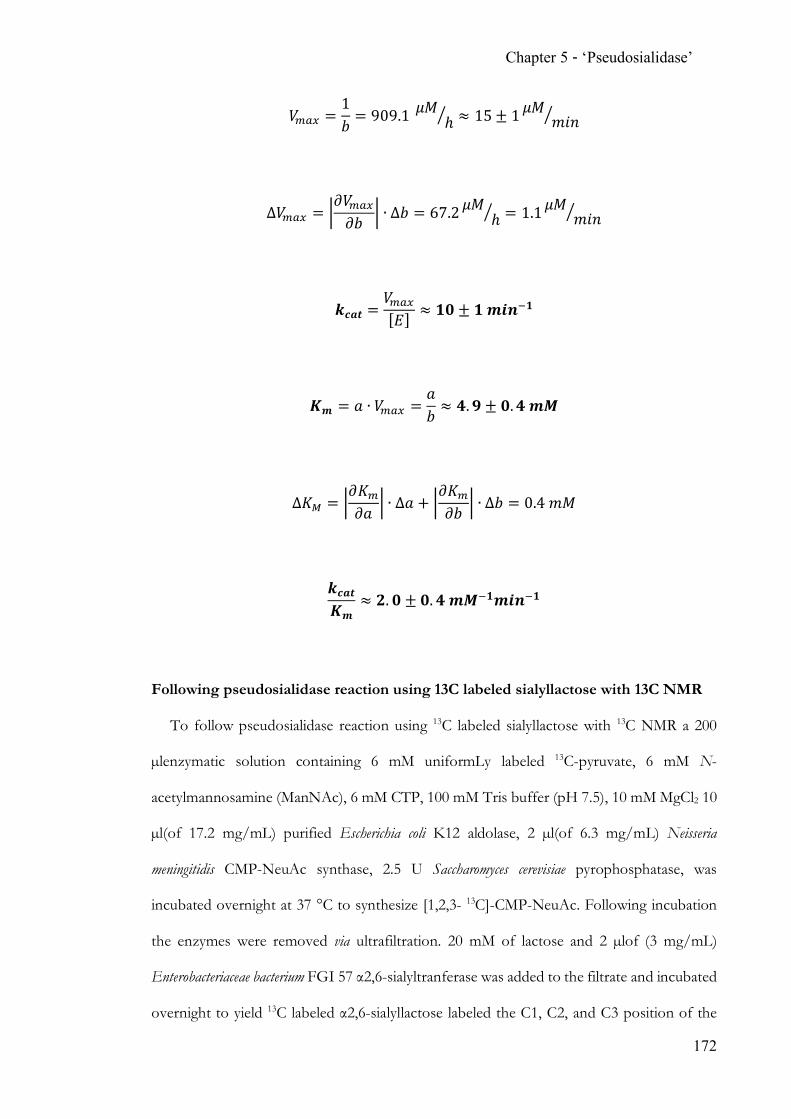
Chapter 5 - ‘Pseudosialidase’
172
𝑉UQ^ =1𝑏 = 909.1 𝜇𝑀 ℎj ≈ 15 ± 1𝜇𝑀 𝑚𝑖𝑛j
∆𝑉UQ^ = n𝜕𝑉UQ^𝜕𝑏 n ∙ ∆𝑏 = 67.2 𝜇𝑀 ℎj = 1.1𝜇𝑀 𝑚𝑖𝑛j
𝒌𝒄𝒂𝒕 =𝑉UQ^[𝐸] ≈ 𝟏𝟎 ± 𝟏𝒎𝒊𝒏{𝟏
𝑲𝒎 = 𝑎 ∙ 𝑉UQ^ =𝑎𝑏 ≈ 𝟒. 𝟗 ± 𝟎. 𝟒𝒎𝑴
∆𝐾a = n𝜕𝐾U𝜕𝑎 n ∙ ∆𝑎 + n
𝜕𝐾U𝜕𝑏 n ∙ ∆𝑏 = 0.4𝑚𝑀
𝒌𝒄𝒂𝒕𝑲𝒎
≈ 𝟐. 𝟎 ± 𝟎. 𝟒𝒎𝑴{𝟏𝒎𝒊𝒏{𝟏
Following pseudosialidase reaction using 13C labeled sialyllactose with 13C NMR
To follow pseudosialidase reaction using 13C labeled sialyllactose with 13C NMR a 200
µlenzymatic solution containing 6 mM uniformLy labeled 13C-pyruvate, 6 mM N-
acetylmannosamine (ManNAc), 6 mM CTP, 100 mM Tris buffer (pH 7.5), 10 mM MgCl2 10
µl(of 17.2 mg/mL) purified Escherichia coli K12 aldolase, 2 µl(of 6.3 mg/mL) Neisseria
meningitidis CMP-NeuAc synthase, 2.5 U Saccharomyces cerevisiae pyrophosphatase, was
incubated overnight at 37 °C to synthesize [1,2,3- 13C]-CMP-NeuAc. Following incubation
the enzymes were removed via ultrafiltration. 20 mM of lactose and 2 µlof (3 mg/mL)
Enterobacteriaceae bacterium FGI 57 α2,6-sialyltranferase was added to the filtrate and incubated
overnight to yield 13C labeled α2,6-sialyllactose labeled the C1, C2, and C3 position of the
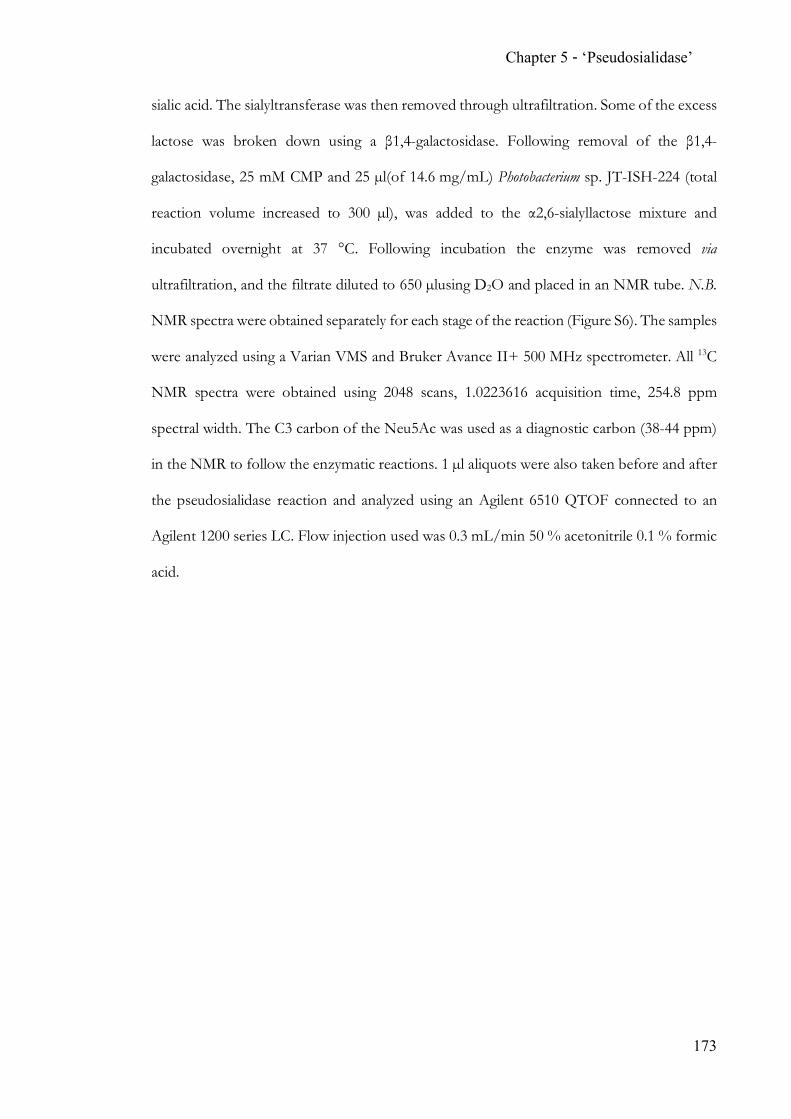
Chapter 5 - ‘Pseudosialidase’
173
sialic acid. The sialyltransferase was then removed through ultrafiltration. Some of the excess
lactose was broken down using a β1,4-galactosidase. Following removal of the β1,4-
galactosidase, 25 mM CMP and 25 µl(of 14.6 mg/mL) Photobacterium sp. JT-ISH-224 (total
reaction volume increased to 300 µl), was added to the α2,6-sialyllactose mixture and
incubated overnight at 37 °C. Following incubation the enzyme was removed via
ultrafiltration, and the filtrate diluted to 650 µlusing D2O and placed in an NMR tube. N.B.
NMR spectra were obtained separately for each stage of the reaction (Figure S6). The samples
were analyzed using a Varian VMS and Bruker Avance II+ 500 MHz spectrometer. All 13C
NMR spectra were obtained using 2048 scans, 1.0223616 acquisition time, 254.8 ppm
spectral width. The C3 carbon of the Neu5Ac was used as a diagnostic carbon (38-44 ppm)
in the NMR to follow the enzymatic reactions. 1 µl aliquots were also taken before and after
the pseudosialidase reaction and analyzed using an Agilent 6510 QTOF connected to an
Agilent 1200 series LC. Flow injection used was 0.3 mL/min 50 % acetonitrile 0.1 % formic
acid.
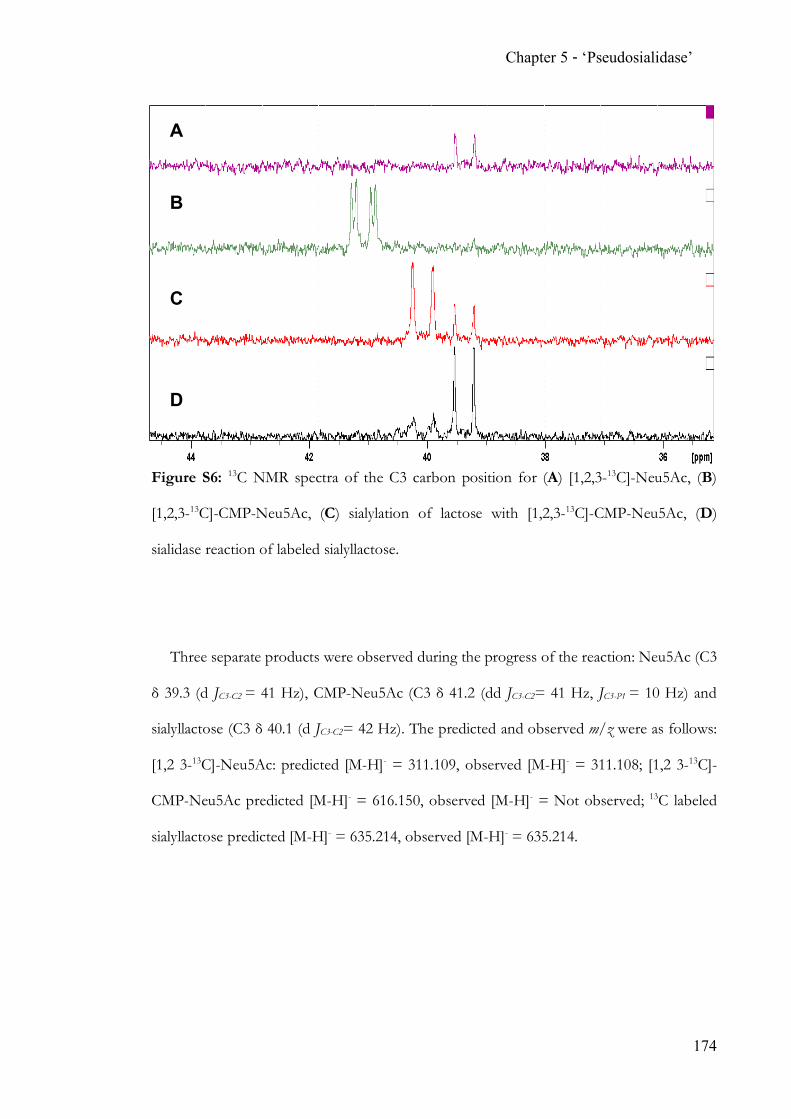
Chapter 5 - ‘Pseudosialidase’
174
Figure S6: 13C NMR spectra of the C3 carbon position for (A) [1,2,3-13C]-Neu5Ac, (B)
[1,2,3-13C]-CMP-Neu5Ac, (C) sialylation of lactose with [1,2,3-13C]-CMP-Neu5Ac, (D)
sialidase reaction of labeled sialyllactose.
Three separate products were observed during the progress of the reaction: Neu5Ac (C3
δ 39.3 (d JC3-C2 = 41 Hz), CMP-Neu5Ac (C3 δ 41.2 (dd JC3-C2= 41 Hz, JC3-P1 = 10 Hz) and
sialyllactose (C3 δ 40.1 (d JC3-C2= 42 Hz). The predicted and observed m/z were as follows:
[1,2 3-13C]-Neu5Ac: predicted [M-H]- = 311.109, observed [M-H]- = 311.108; [1,2 3-13C]-
CMP-Neu5Ac predicted [M-H]- = 616.150, observed [M-H]- = Not observed; 13C labeled
sialyllactose predicted [M-H]- = 635.214, observed [M-H]- = 635.214.
A
B
C
D
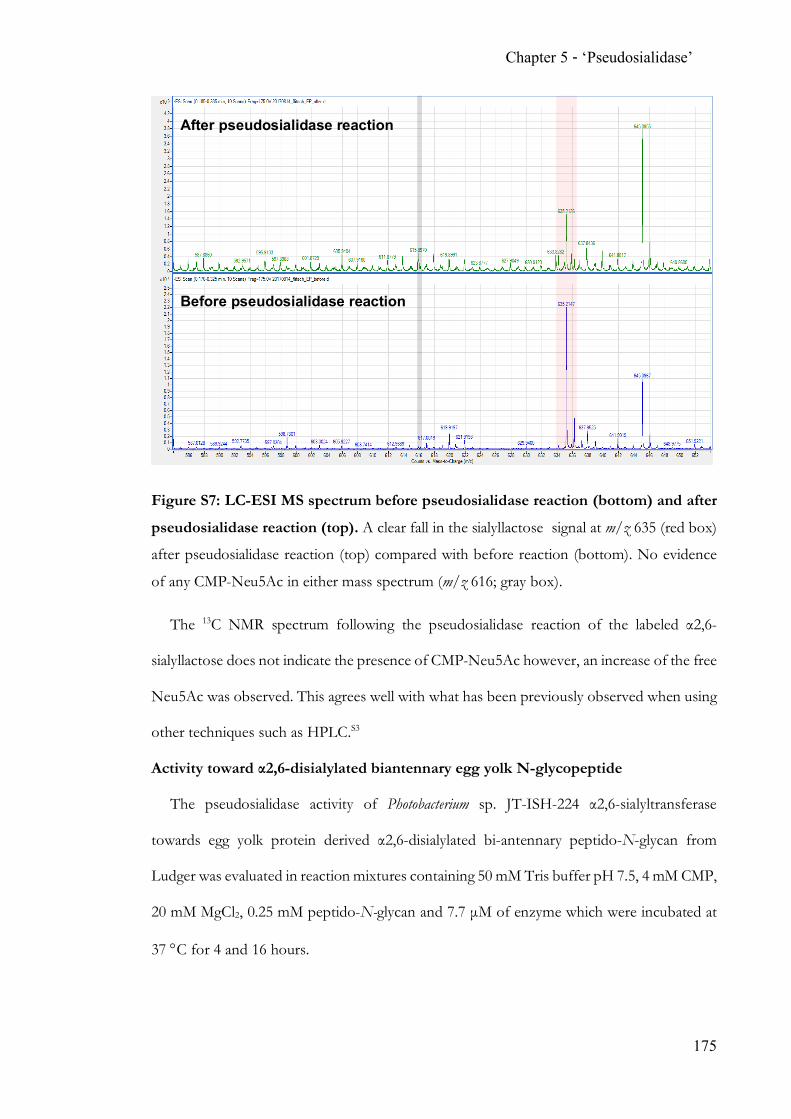
Chapter 5 - ‘Pseudosialidase’
175
Figure S7: LC-ESI MS spectrum before pseudosialidase reaction (bottom) and after
pseudosialidase reaction (top). A clear fall in the sialyllactose signal at m/z 635 (red box)
after pseudosialidase reaction (top) compared with before reaction (bottom). No evidence
of any CMP-Neu5Ac in either mass spectrum (m/z 616; gray box).
The 13C NMR spectrum following the pseudosialidase reaction of the labeled α2,6-
sialyllactose does not indicate the presence of CMP-Neu5Ac however, an increase of the free
Neu5Ac was observed. This agrees well with what has been previously observed when using
other techniques such as HPLC.S3
Activity toward α2,6-disialylated biantennary egg yolk N-glycopeptide
The pseudosialidase activity of Photobacterium sp. JT-ISH-224 α2,6-sialyltransferase
towards egg yolk protein derived α2,6-disialylated bi-antennary peptido-N-glycan from
Ludger was evaluated in reaction mixtures containing 50 mM Tris buffer pH 7.5, 4 mM CMP,
20 mM MgCl2, 0.25 mM peptido-N-glycan and 7.7 µM of enzyme which were incubated at
37 °C for 4 and 16 hours.
Before pseudosialidase reaction
After pseudosialidase reaction
Chapter 5 - ‘Pseudosialidase’
176
Figure S8: Desialylation of α2,6-disialylated bi-antennary egg yolk N-glycopeptide.
Upon inspection we noticed a shoulder on the desialylated species which becomes more
prevalent as time goes on (Figure S8, bottom). This shoulder is absent within the fetuin
samples, suggesting this peak does not arise from the α2,6-pseudosialidase isomerizing the
structure. No degalactosylated species were observed in this sample and the mass spectrum
of the peak after 4 and 16 hours are near identical (Figure S10 top and S11) suggesting the
presence of an additional isomer present in the starting material but inseparable by the
conditions used in HILIC UPLC. IM-MS analysis confirmed the presence of only α2,6-
sialylated precursors (Figure 5).
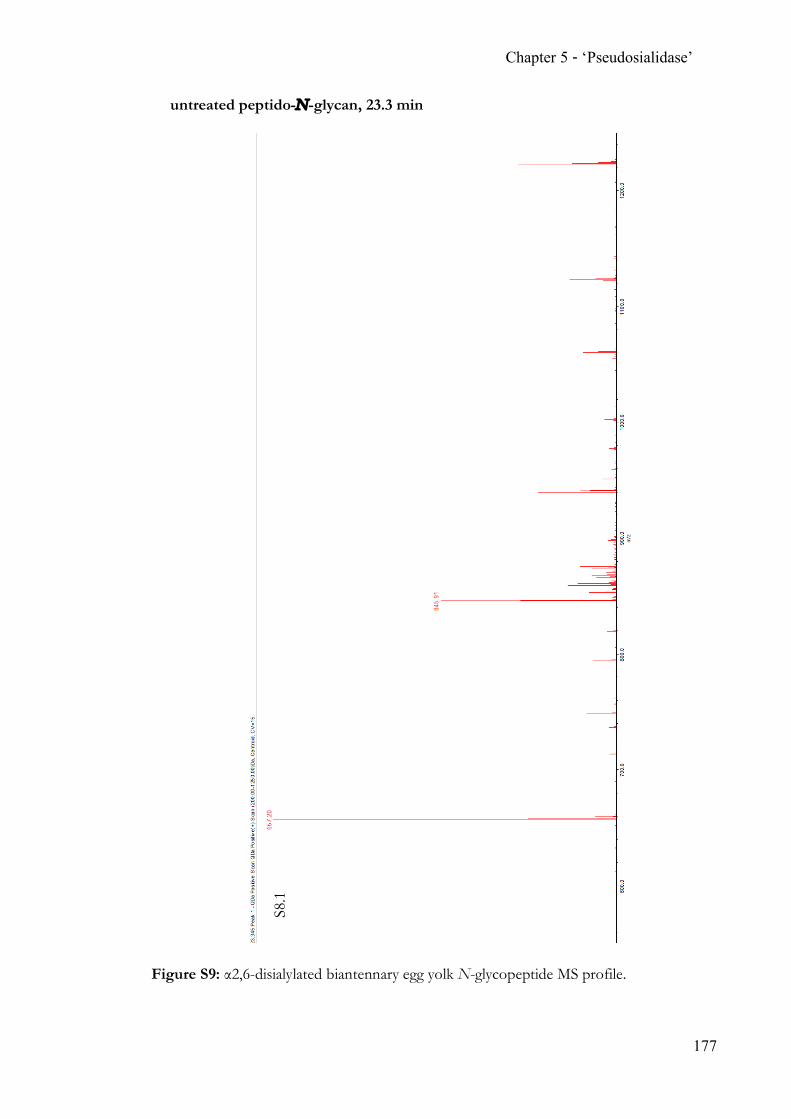
Chapter 5 - ‘Pseudosialidase’
177
untreated peptido-N-glycan, 23.3 min
Figure S9: α2,6-disialylated biantennary egg yolk N-glycopeptide MS profile.
S8.1
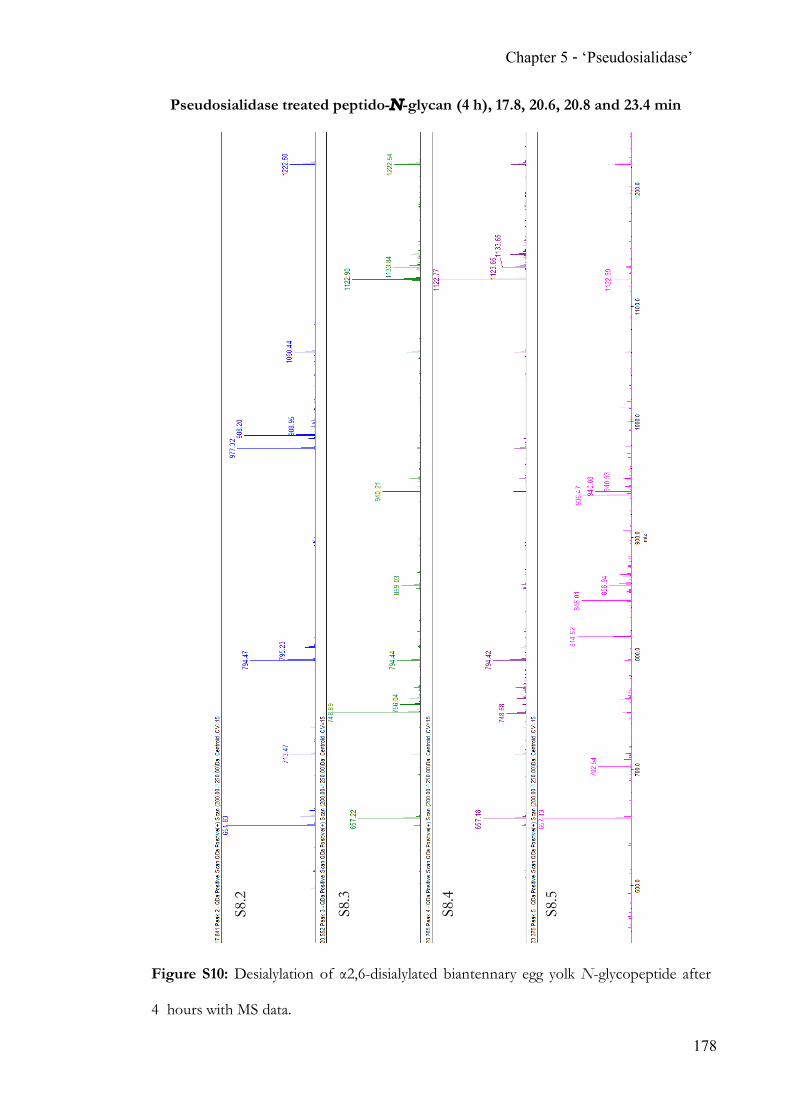
Chapter 5 - ‘Pseudosialidase’
178
Pseudosialidase treated peptido-N-glycan (4 h), 17.8, 20.6, 20.8 and 23.4 min
Figure S10: Desialylation of α2,6-disialylated biantennary egg yolk N-glycopeptide after
4 hours with MS data.
S8.2
S8.3
S8.4
S8.5
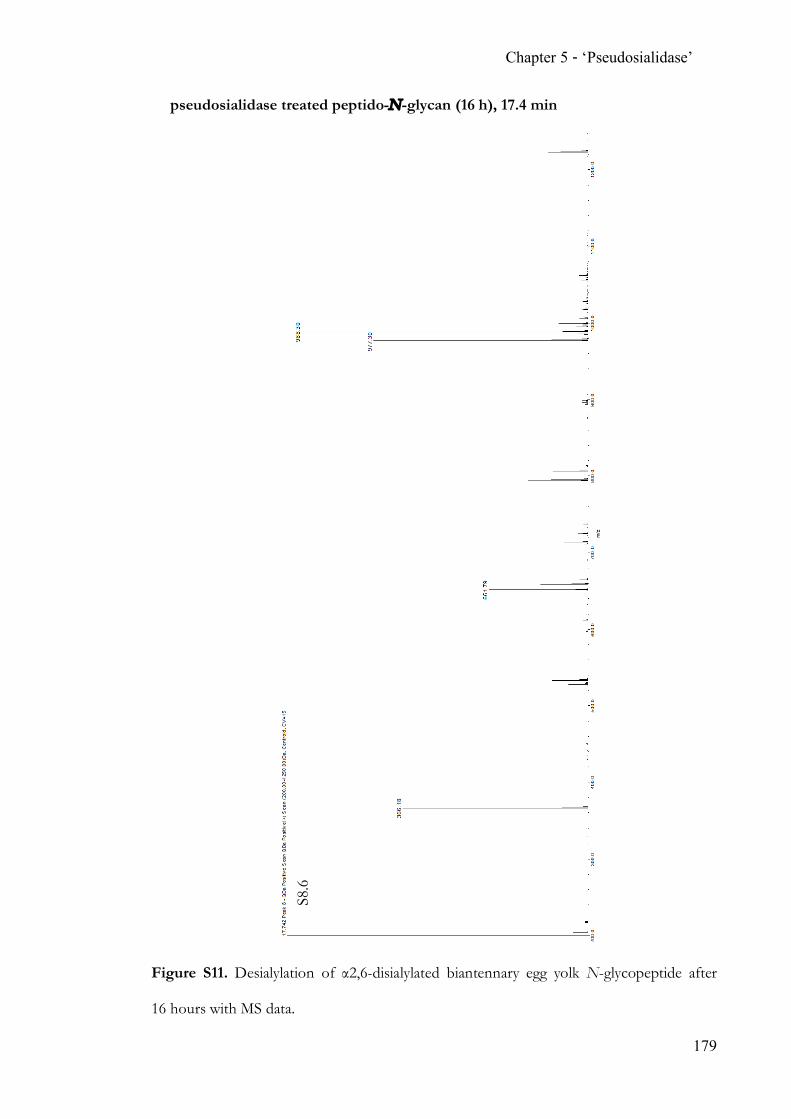
Chapter 5 - ‘Pseudosialidase’
179
pseudosialidase treated peptido-N-glycan (16 h), 17.4 min
Figure S11. Desialylation of α2,6-disialylated biantennary egg yolk N-glycopeptide after
16 hours with MS data.
S8.6
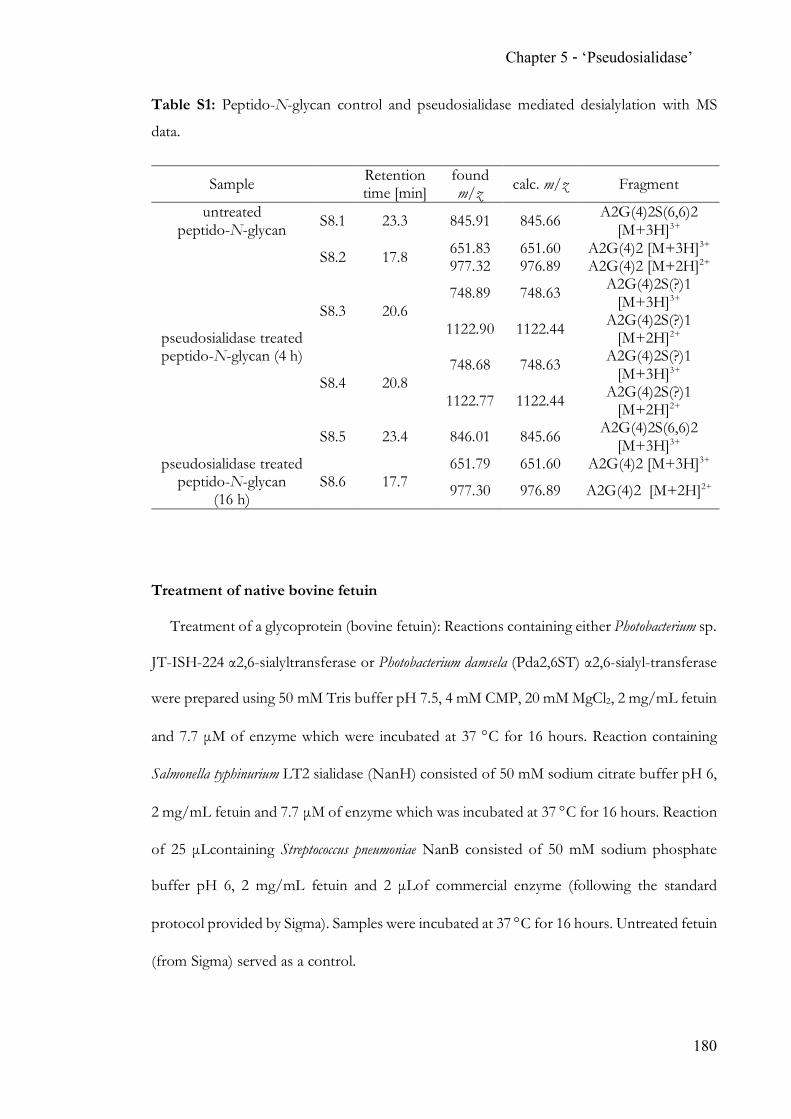
Chapter 5 - ‘Pseudosialidase’
180
Table S1: Peptido-N-glycan control and pseudosialidase mediated desialylation with MS
data.
Sample Retention time [min]
found m/z calc. m/z Fragment
untreated peptido-N-glycan S8.1 23.3 845.91 845.66 A2G(4)2S(6,6)2
[M+3H]3+
pseudosialidase treated peptido-N-glycan (4 h)
S8.2 17.8 651.83 651.60 A2G(4)2 [M+3H]3+ 977.32 976.89 A2G(4)2 [M+2H]2+
S8.3 20.6 748.89 748.63 A2G(4)2S(?)1
[M+3H]3+
1122.90 1122.44 A2G(4)2S(?)1 [M+2H]2+
S8.4 20.8 748.68 748.63 A2G(4)2S(?)1
[M+3H]3+
1122.77 1122.44 A2G(4)2S(?)1 [M+2H]2+
S8.5 23.4 846.01 845.66 A2G(4)2S(6,6)2 [M+3H]3+
pseudosialidase treated peptido-N-glycan
(16 h) S8.6 17.7
651.79 651.60 A2G(4)2 [M+3H]3+
977.30 976.89 A2G(4)2 [M+2H]2+
Treatment of native bovine fetuin
Treatment of a glycoprotein (bovine fetuin): Reactions containing either Photobacterium sp.
JT-ISH-224 α2,6-sialyltransferase or Photobacterium damsela (Pda2,6ST) α2,6-sialyl-transferase
were prepared using 50 mM Tris buffer pH 7.5, 4 mM CMP, 20 mM MgCl2, 2 mg/mL fetuin
and 7.7 µM of enzyme which were incubated at 37 °C for 16 hours. Reaction containing
Salmonella typhinurium LT2 sialidase (NanH) consisted of 50 mM sodium citrate buffer pH 6,
2 mg/mL fetuin and 7.7 µM of enzyme which was incubated at 37 °C for 16 hours. Reaction
of 25 µLcontaining Streptococcus pneumoniae NanB consisted of 50 mM sodium phosphate
buffer pH 6, 2 mg/mL fetuin and 2 µLof commercial enzyme (following the standard
protocol provided by Sigma). Samples were incubated at 37 °C for 16 hours. Untreated fetuin
(from Sigma) served as a control.
Chapter 5 - ‘Pseudosialidase’
181
Glycans were released and labeled using Waters’ GlycoWorks RapiFluor-MS N-Glycan
Kit and analyzed by hydrophilic interaction liquid chromatography (HILIC) using Waters’
ultra-performance liquid chromatography (UPLC) instrument. The N-glycans were cleaved
from the peptide/protein using PNGase F following detergent-assisted thermal
denaturation. Subsequent labeling with the RapiFluor-MS tag and solid phase extraction
yielded a purified complex mixture of labeled N-glycans for analysis. 20 µLof the glycan
mixture were injected and separated on a ACQUITY UPLC Glycan BEH Amide 130Å
column (1.7 µm, 2.1 x 150 mm) using a gradient (50 mM ammonium formate, pH 4.4 and
acetonitrile; 25 % buffer, 75 % acetonitrile to 46 % buffer, 54 % acetonitrile over 35 min)
with a flow rate of 0.4 mL/min at 60 °C over 55 min. Retention times were calibrated against
dextran ladders to calculate glucose units (GU) values which were compared against the
GlycoBase database.41 Matching species were confirmed by MS.
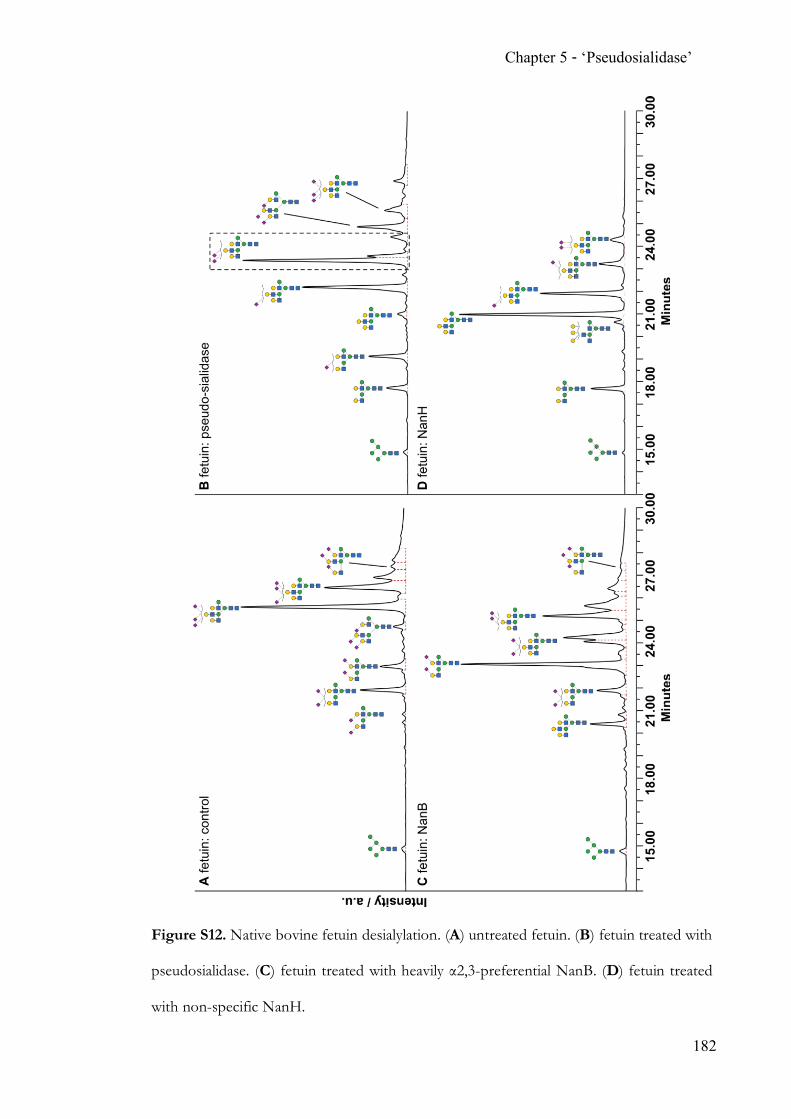
Chapter 5 - ‘Pseudosialidase’
182
Figure S12. Native bovine fetuin desialylation. (A) untreated fetuin. (B) fetuin treated with
pseudosialidase. (C) fetuin treated with heavily α2,3-preferential NanB. (D) fetuin treated
with non-specific NanH.
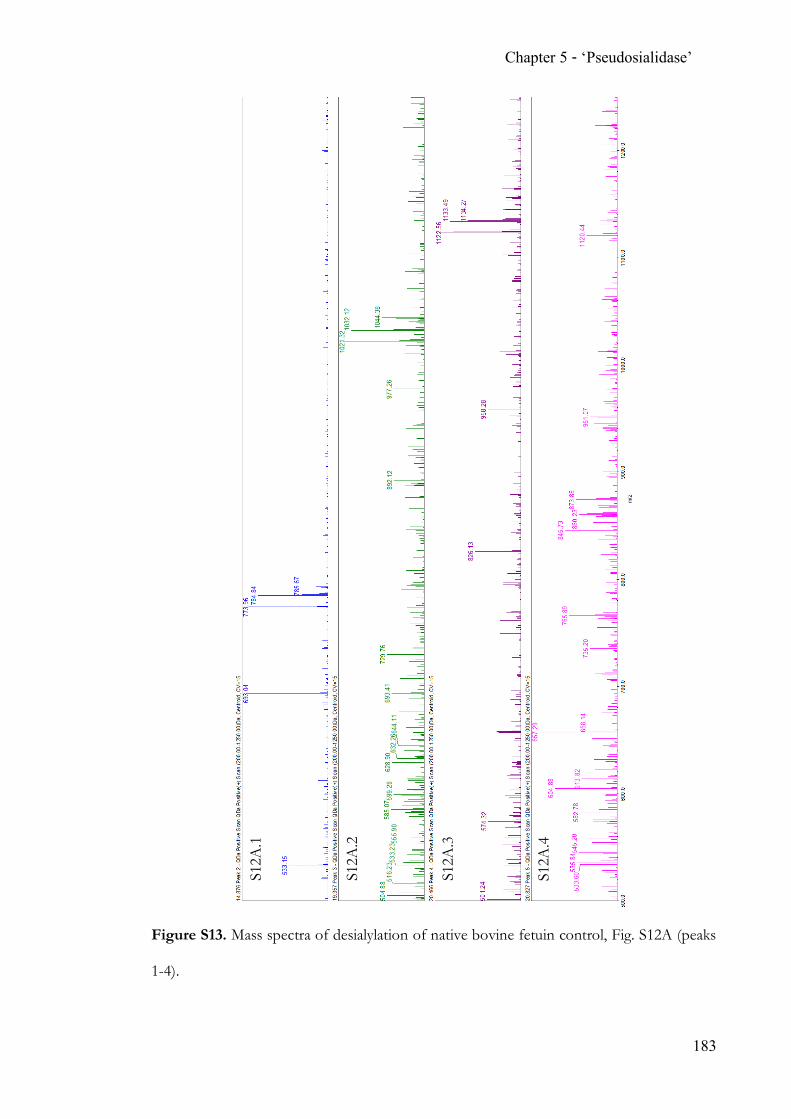
Chapter 5 - ‘Pseudosialidase’
183
Figure S13. Mass spectra of desialylation of native bovine fetuin control, Fig. S12A (peaks
1-4).
S12A
.1
S12A
.2
S12A
.3
S12A
.4
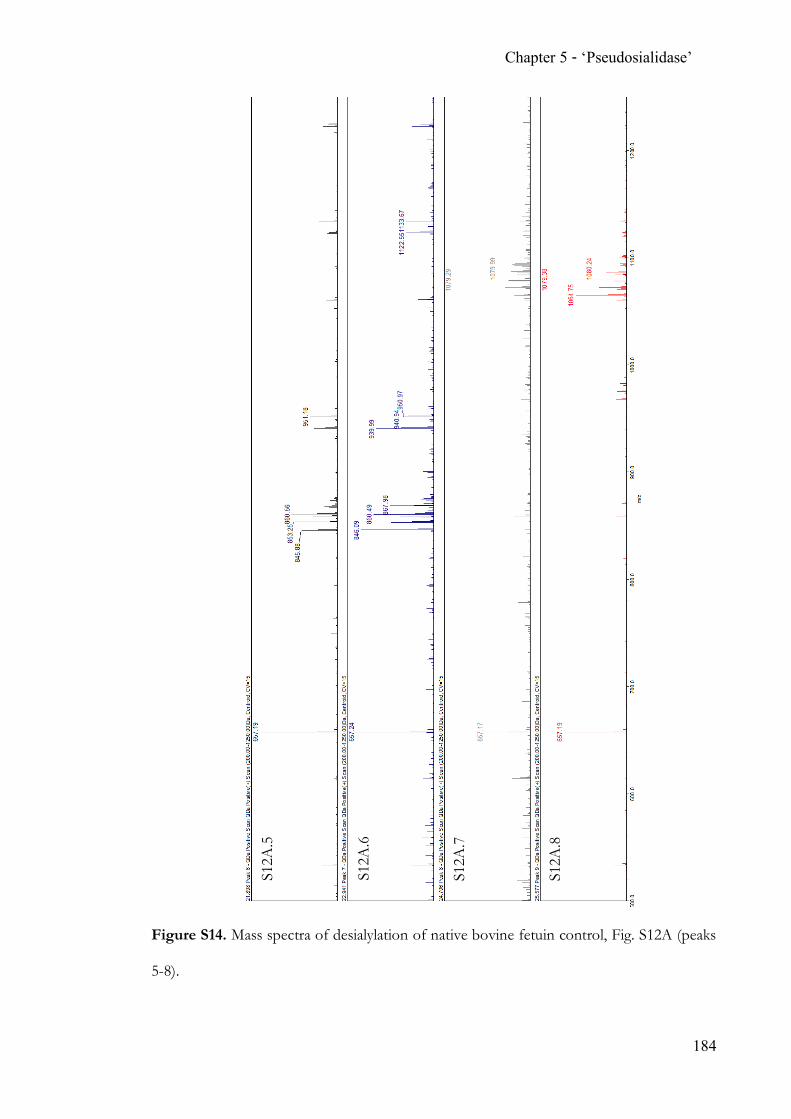
Chapter 5 - ‘Pseudosialidase’
184
Figure S14. Mass spectra of desialylation of native bovine fetuin control, Fig. S12A (peaks
5-8).
S12A
.5
S12A
.6
S12A
.7
S12A
.8
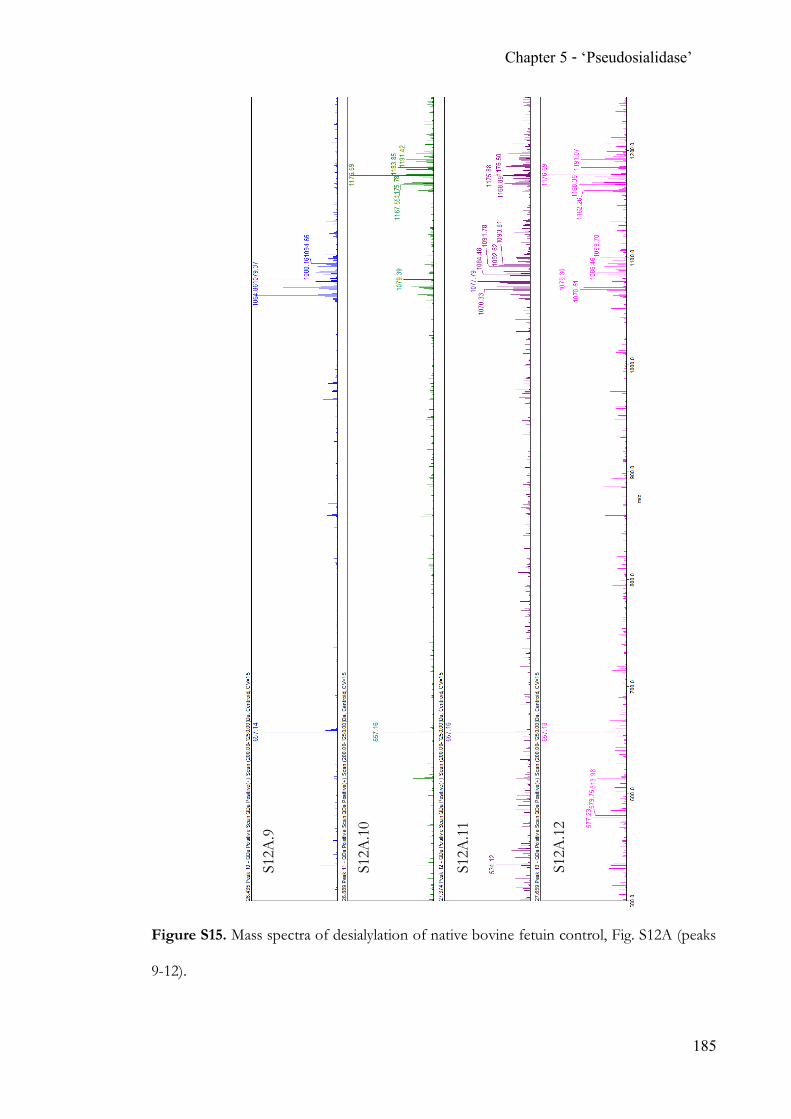
Chapter 5 - ‘Pseudosialidase’
185
Figure S15. Mass spectra of desialylation of native bovine fetuin control, Fig. S12A (peaks
9-12).
S12A
.9
S12A
.10
S12A
.11
S12A
.12
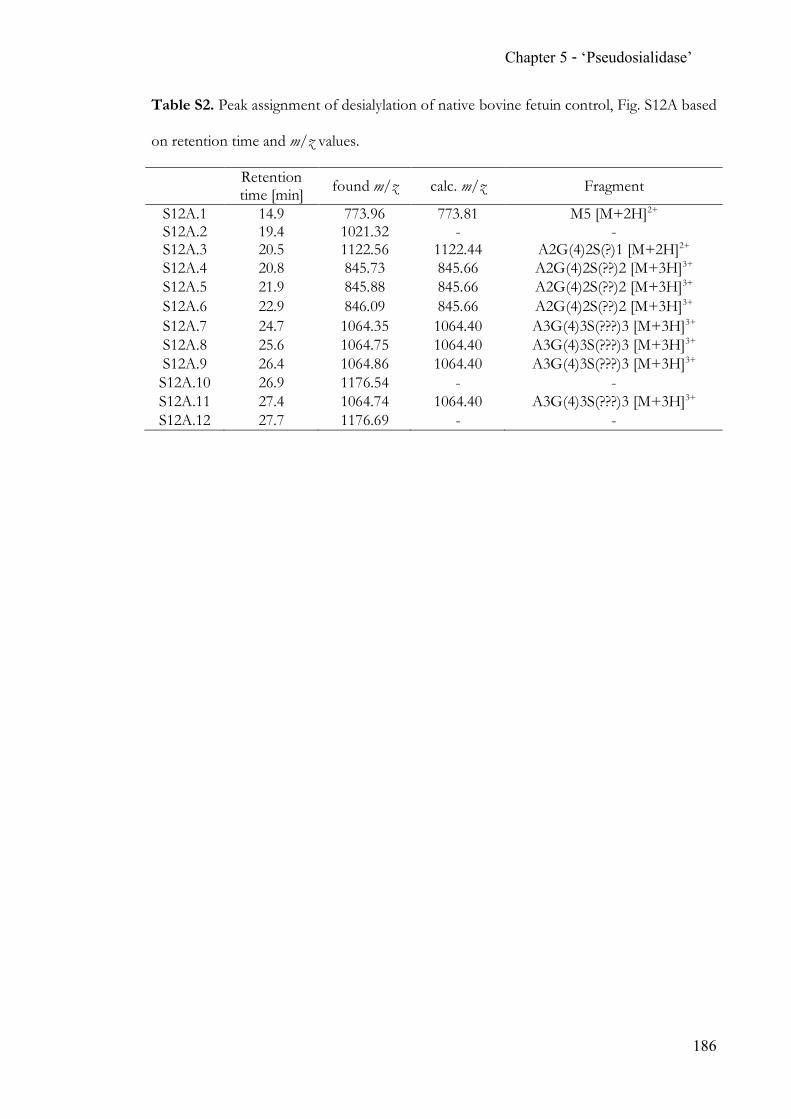
Chapter 5 - ‘Pseudosialidase’
186
Table S2. Peak assignment of desialylation of native bovine fetuin control, Fig. S12A based
on retention time and m/z values.
Retention time [min] found m/z calc. m/z Fragment
S12A.1 14.9 773.96 773.81 M5 [M+2H]2+ S12A.2 19.4 1021.32 - - S12A.3 20.5 1122.56 1122.44 A2G(4)2S(?)1 [M+2H]2+ S12A.4 20.8 845.73 845.66 A2G(4)2S(??)2 [M+3H]3+ S12A.5 21.9 845.88 845.66 A2G(4)2S(??)2 [M+3H]3+ S12A.6 22.9 846.09 845.66 A2G(4)2S(??)2 [M+3H]3+ S12A.7 24.7 1064.35 1064.40 A3G(4)3S(???)3 [M+3H]3+ S12A.8 25.6 1064.75 1064.40 A3G(4)3S(???)3 [M+3H]3+ S12A.9 26.4 1064.86 1064.40 A3G(4)3S(???)3 [M+3H]3+ S12A.10 26.9 1176.54 - - S12A.11 27.4 1064.74 1064.40 A3G(4)3S(???)3 [M+3H]3+ S12A.12 27.7 1176.69 - -
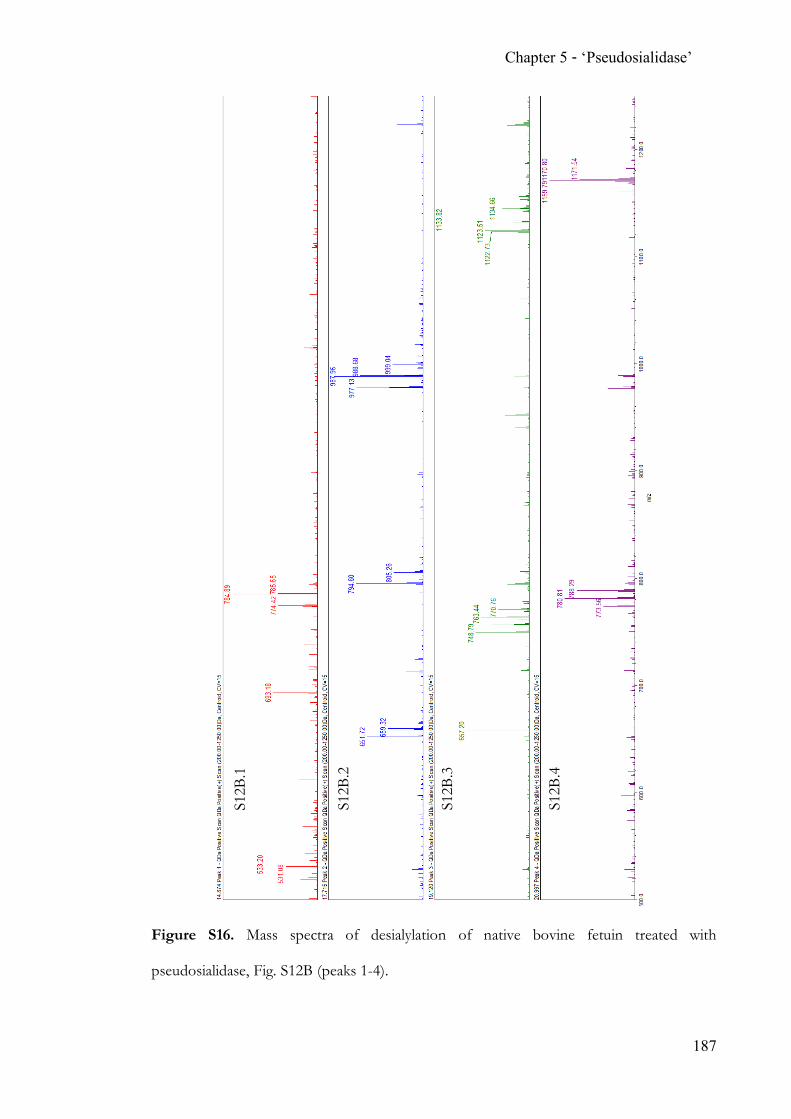
Chapter 5 - ‘Pseudosialidase’
187
Figure S16. Mass spectra of desialylation of native bovine fetuin treated with
pseudosialidase, Fig. S12B (peaks 1-4).
S12B
.1
S12B
.2
S12B
.3
S12B
.4
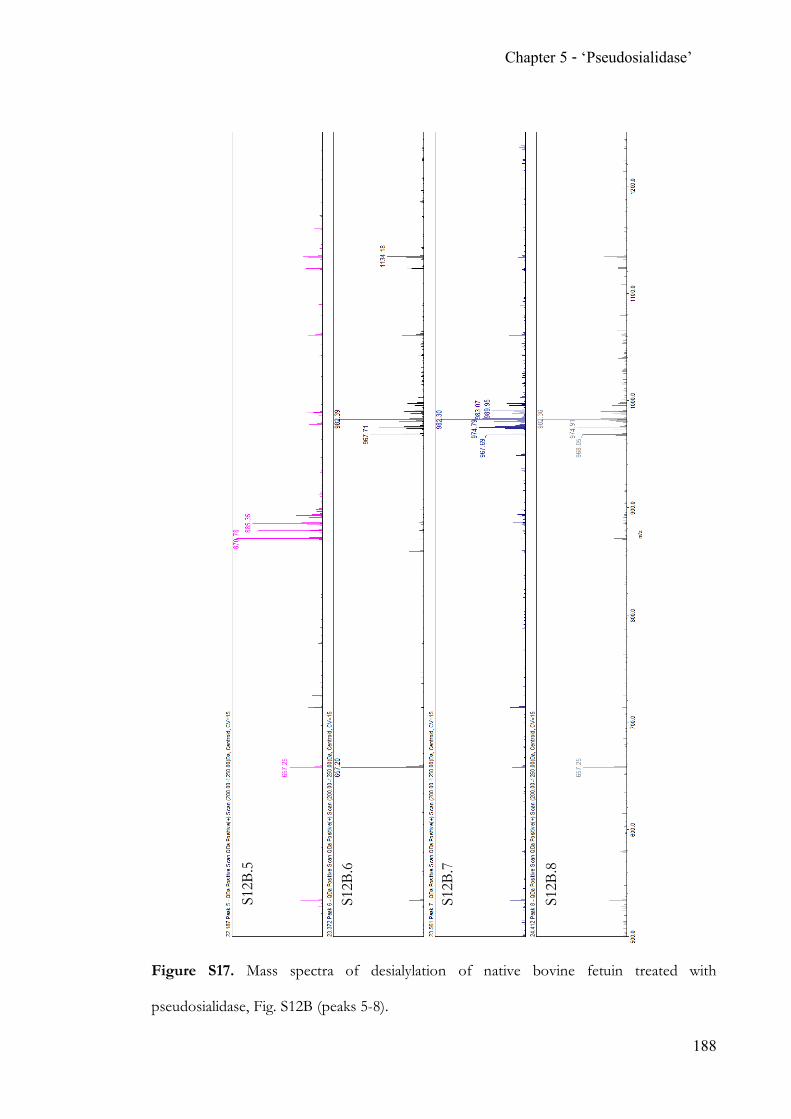
Chapter 5 - ‘Pseudosialidase’
188
Figure S17. Mass spectra of desialylation of native bovine fetuin treated with
pseudosialidase, Fig. S12B (peaks 5-8).
S12B
.5
S12B
.6
S12B
.7
S12B
.8
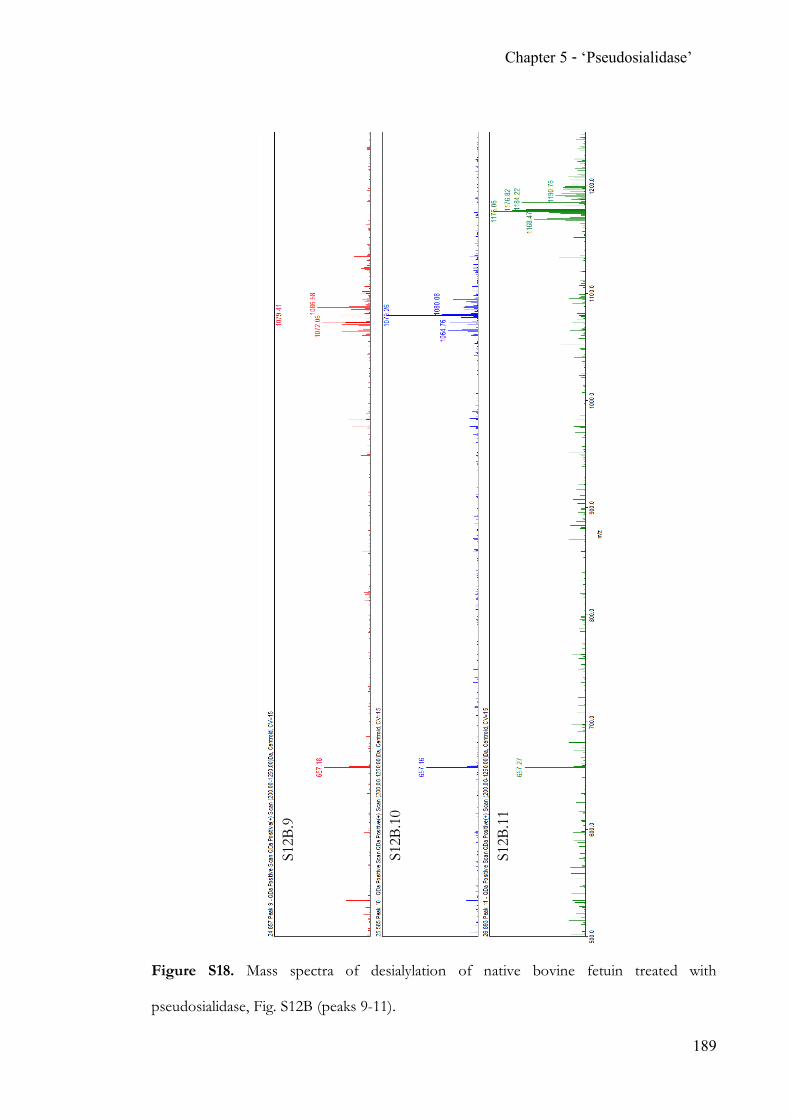
Chapter 5 - ‘Pseudosialidase’
189
Figure S18. Mass spectra of desialylation of native bovine fetuin treated with
pseudosialidase, Fig. S12B (peaks 9-11).
S12B
.9
S12B
.10
S12B
.11
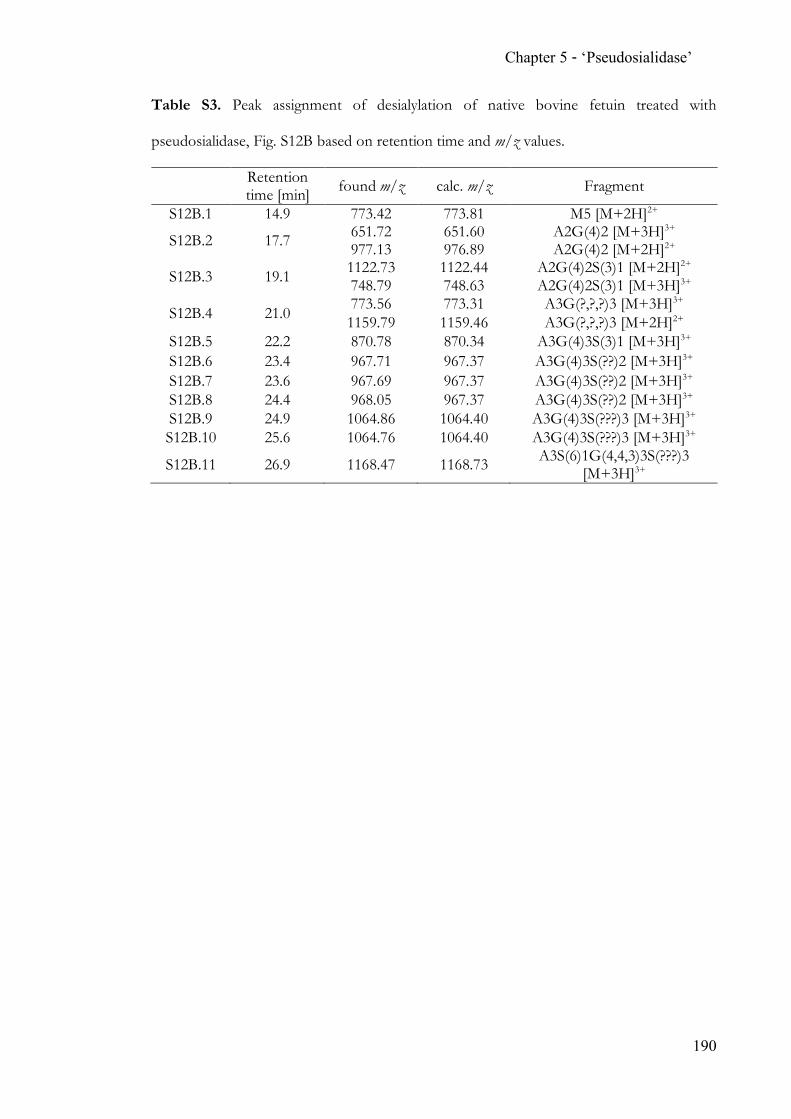
Chapter 5 - ‘Pseudosialidase’
190
Table S3. Peak assignment of desialylation of native bovine fetuin treated with
pseudosialidase, Fig. S12B based on retention time and m/z values.
Retention time [min] found m/z calc. m/z Fragment
S12B.1 14.9 773.42 773.81 M5 [M+2H]2+
S12B.2 17.7 651.72 651.60 A2G(4)2 [M+3H]3+ 977.13 976.89 A2G(4)2 [M+2H]2+
S12B.3 19.1 1122.73 1122.44 A2G(4)2S(3)1 [M+2H]2+ 748.79 748.63 A2G(4)2S(3)1 [M+3H]3+
S12B.4 21.0 773.56 773.31 A3G(?,?,?)3 [M+3H]3+ 1159.79 1159.46 A3G(?,?,?)3 [M+2H]2+
S12B.5 22.2 870.78 870.34 A3G(4)3S(3)1 [M+3H]3+ S12B.6 23.4 967.71 967.37 A3G(4)3S(??)2 [M+3H]3+ S12B.7 23.6 967.69 967.37 A3G(4)3S(??)2 [M+3H]3+ S12B.8 24.4 968.05 967.37 A3G(4)3S(??)2 [M+3H]3+ S12B.9 24.9 1064.86 1064.40 A3G(4)3S(???)3 [M+3H]3+ S12B.10 25.6 1064.76 1064.40 A3G(4)3S(???)3 [M+3H]3+
S12B.11 26.9 1168.47 1168.73 A3S(6)1G(4,4,3)3S(???)3 [M+3H]3+
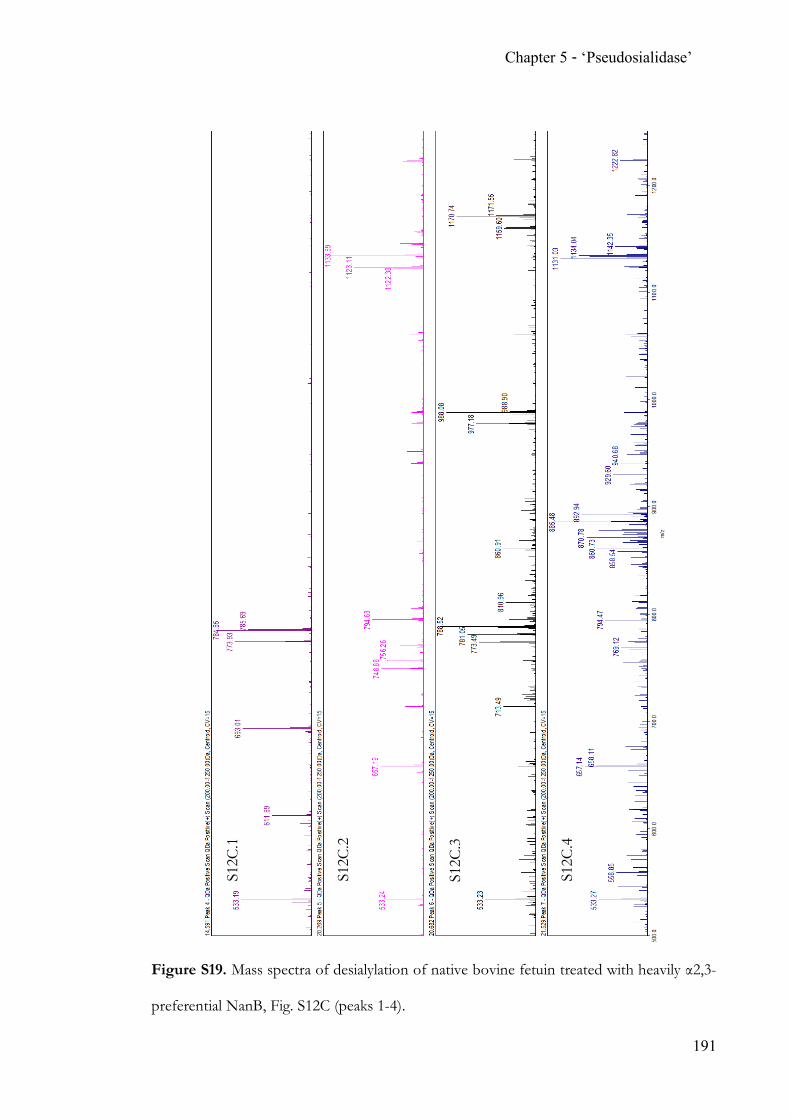
Chapter 5 - ‘Pseudosialidase’
191
Figure S19. Mass spectra of desialylation of native bovine fetuin treated with heavily α2,3-
preferential NanB, Fig. S12C (peaks 1-4).
S12C
.1
S12C
.2
S12C
.3
S12C
.4
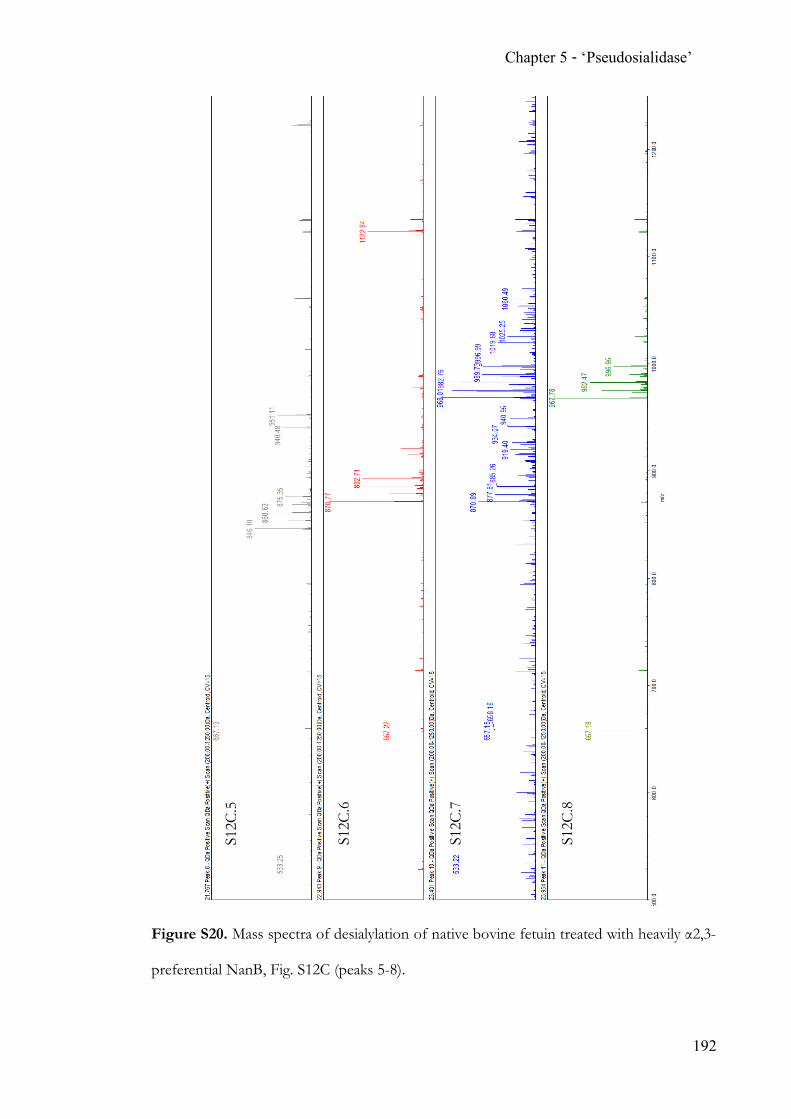
Chapter 5 - ‘Pseudosialidase’
192
Figure S20. Mass spectra of desialylation of native bovine fetuin treated with heavily α2,3-
preferential NanB, Fig. S12C (peaks 5-8).
S12C
.5
S12C
.6
S12C
.7
S12C
.8
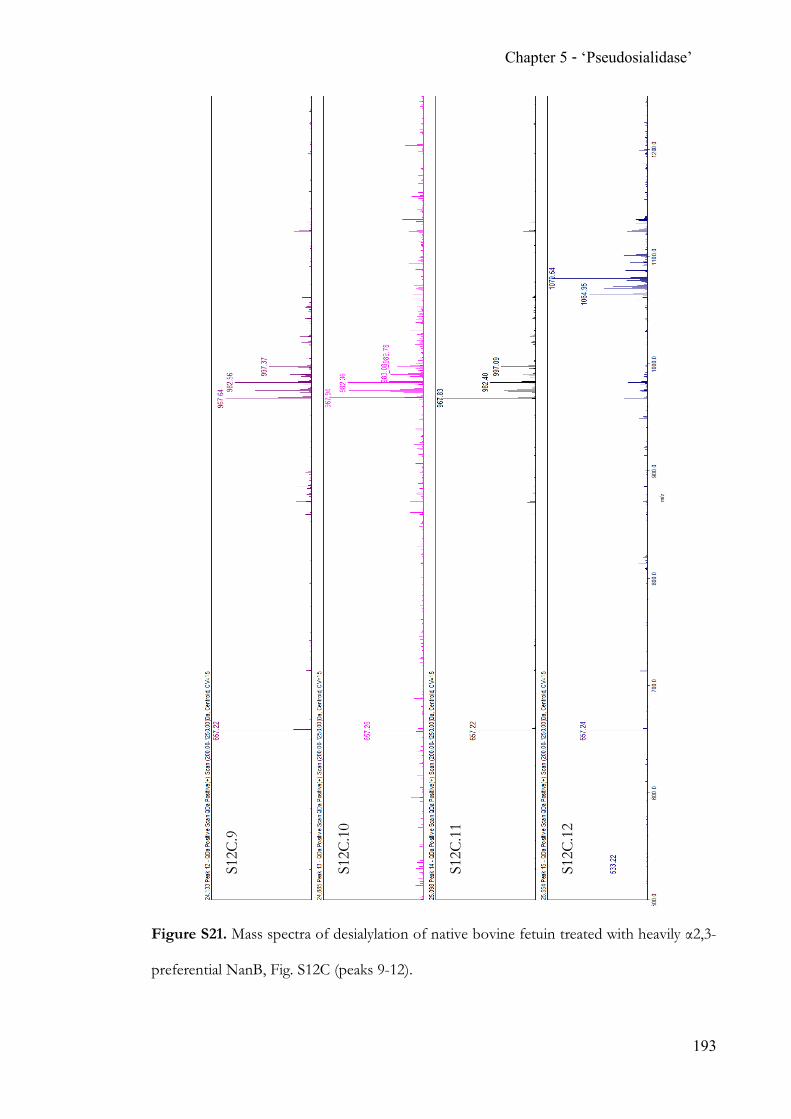
Chapter 5 - ‘Pseudosialidase’
193
Figure S21. Mass spectra of desialylation of native bovine fetuin treated with heavily α2,3-
preferential NanB, Fig. S12C (peaks 9-12).
S12C
.9
S12C
.10
S12C
.11
S12C
.12
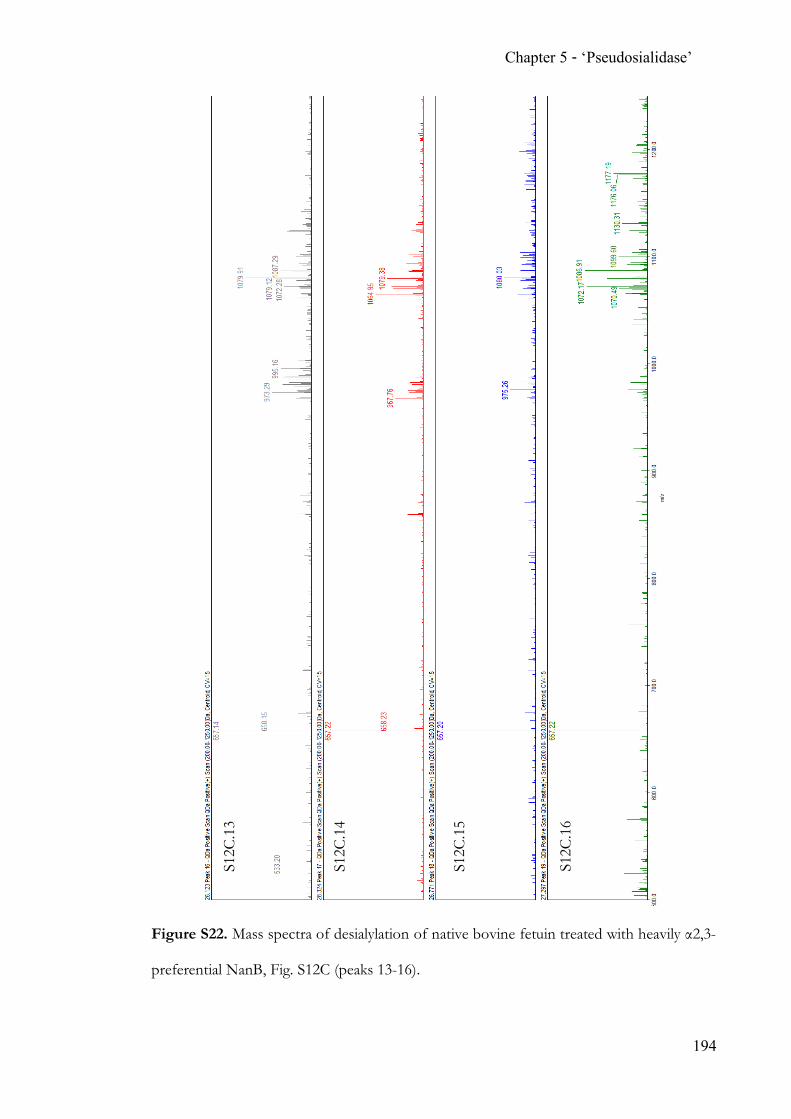
Chapter 5 - ‘Pseudosialidase’
194
Figure S22. Mass spectra of desialylation of native bovine fetuin treated with heavily α2,3-
preferential NanB, Fig. S12C (peaks 13-16).
S12C
.13
S12C
.14
S12C
.15
S12C
.16
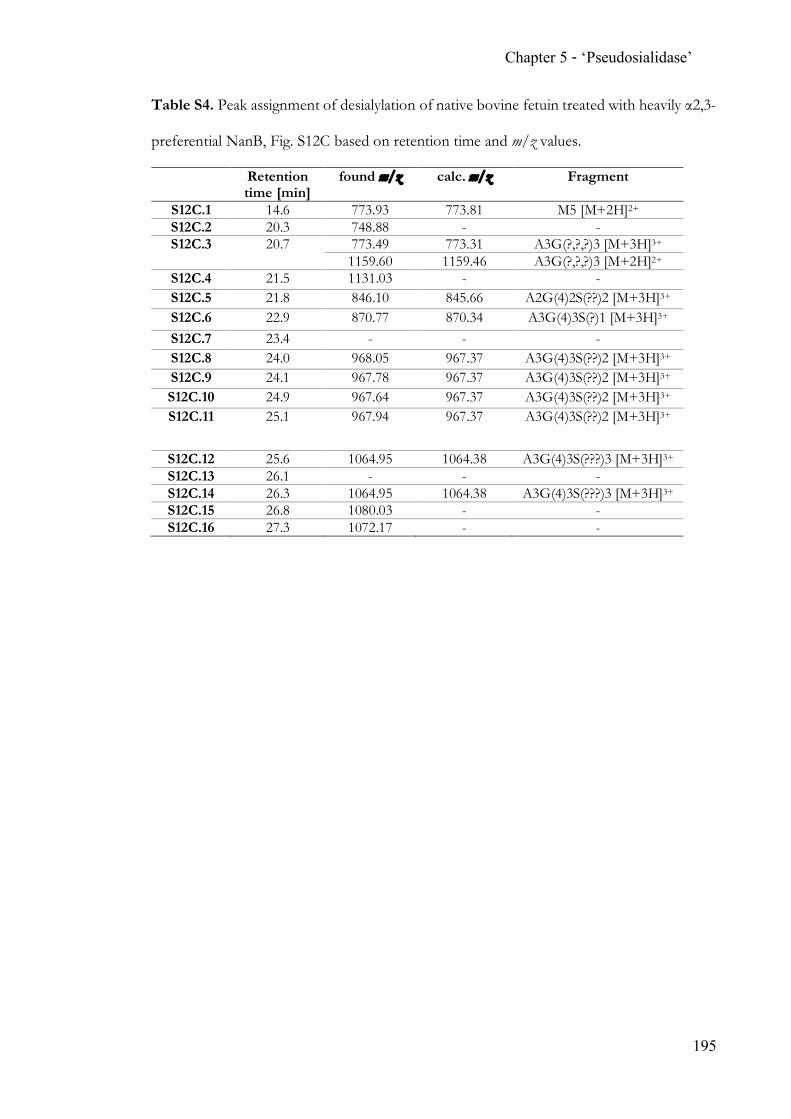
Chapter 5 - ‘Pseudosialidase’
195
Table S4. Peak assignment of desialylation of native bovine fetuin treated with heavily α2,3-
preferential NanB, Fig. S12C based on retention time and m/z values.
Retention time [min]
found m/z calc. m/z Fragment
S12C.1 14.6 773.93 773.81 M5 [M+2H]2+ S12C.2 20.3 748.88 - - S12C.3 20.7 773.49 773.31 A3G(?,?,?)3 [M+3H]3+
1159.60 1159.46 A3G(?,?,?)3 [M+2H]2+ S12C.4 21.5 1131.03 - - S12C.5 21.8 846.10 845.66 A2G(4)2S(??)2 [M+3H]3+ S12C.6 22.9 870.77 870.34 A3G(4)3S(?)1 [M+3H]3+ S12C.7 23.4 - - - S12C.8 24.0 968.05 967.37 A3G(4)3S(??)2 [M+3H]3+ S12C.9 24.1 967.78 967.37 A3G(4)3S(??)2 [M+3H]3+ S12C.10 24.9 967.64 967.37 A3G(4)3S(??)2 [M+3H]3+ S12C.11 25.1 967.94 967.37 A3G(4)3S(??)2 [M+3H]3+
S12C.12 25.6 1064.95 1064.38 A3G(4)3S(???)3 [M+3H]3+ S12C.13 26.1 - - - S12C.14 26.3 1064.95 1064.38 A3G(4)3S(???)3 [M+3H]3+ S12C.15 26.8 1080.03 - - S12C.16 27.3 1072.17 - -
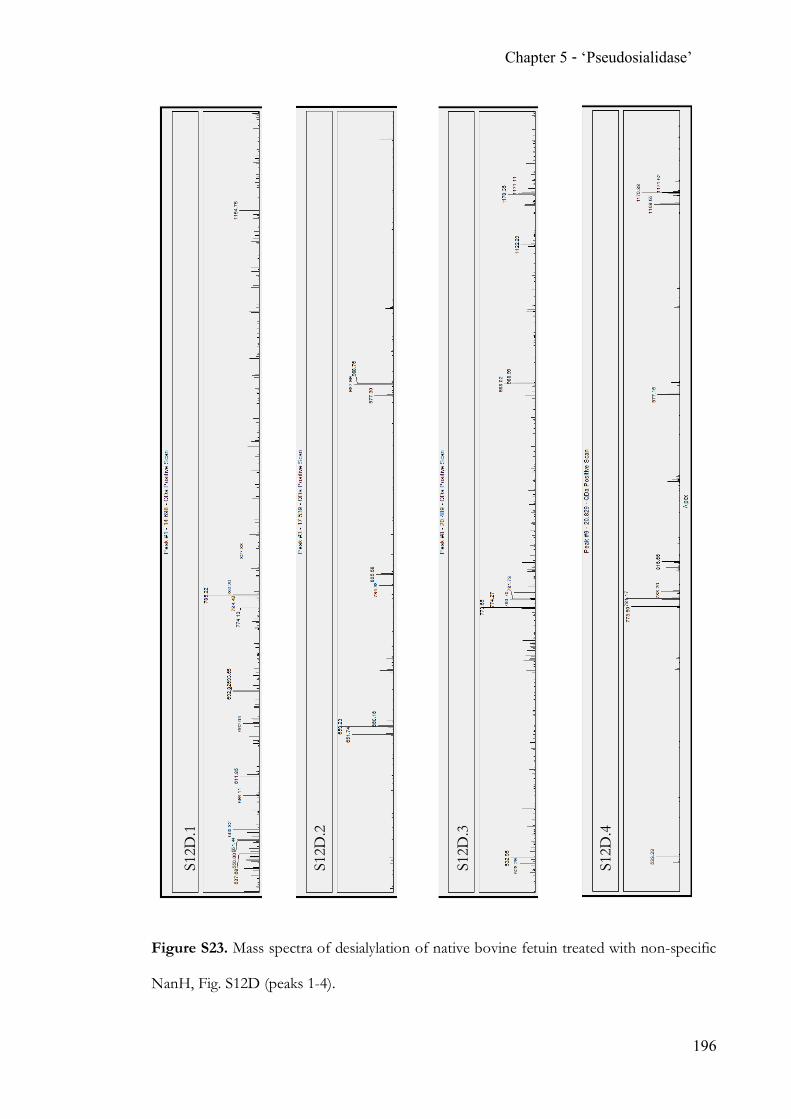
Chapter 5 - ‘Pseudosialidase’
196
Figure S23. Mass spectra of desialylation of native bovine fetuin treated with non-specific
NanH, Fig. S12D (peaks 1-4).
S12D
.1
S12D
.2
S12D
.3
S12D
.4

Chapter 5 - ‘Pseudosialidase’
197
Figure S24. Mass spectra of desialylation of native bovine fetuin treated with non-specific
NanH, Fig. S12D (peaks 5-7).
S12D
.5
S12D
.6
S12D
.7
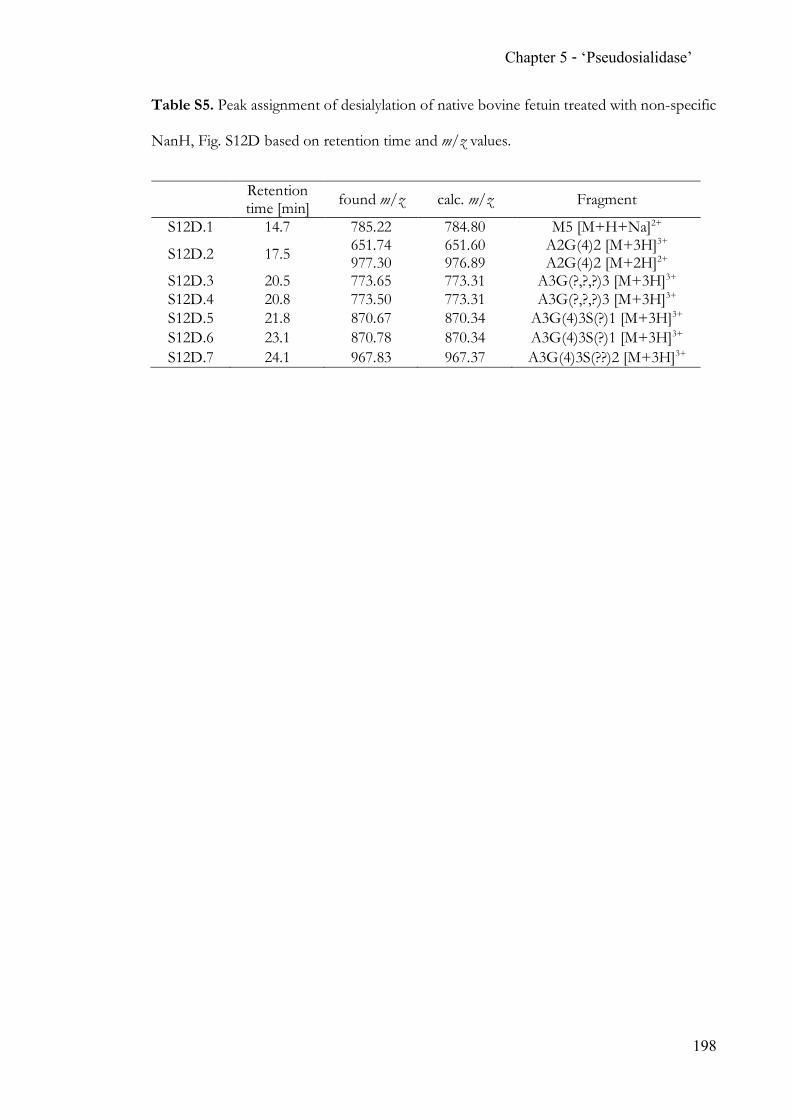
Chapter 5 - ‘Pseudosialidase’
198
Table S5. Peak assignment of desialylation of native bovine fetuin treated with non-specific
NanH, Fig. S12D based on retention time and m/z values.
Retention time [min] found m/z calc. m/z Fragment
S12D.1 14.7 785.22 784.80 M5 [M+H+Na]2+
S12D.2 17.5 651.74 651.60 A2G(4)2 [M+3H]3+ 977.30 976.89 A2G(4)2 [M+2H]2+
S12D.3 20.5 773.65 773.31 A3G(?,?,?)3 [M+3H]3+ S12D.4 20.8 773.50 773.31 A3G(?,?,?)3 [M+3H]3+ S12D.5 21.8 870.67 870.34 A3G(4)3S(?)1 [M+3H]3+ S12D.6 23.1 870.78 870.34 A3G(4)3S(?)1 [M+3H]3+ S12D.7 24.1 967.83 967.37 A3G(4)3S(??)2 [M+3H]3+
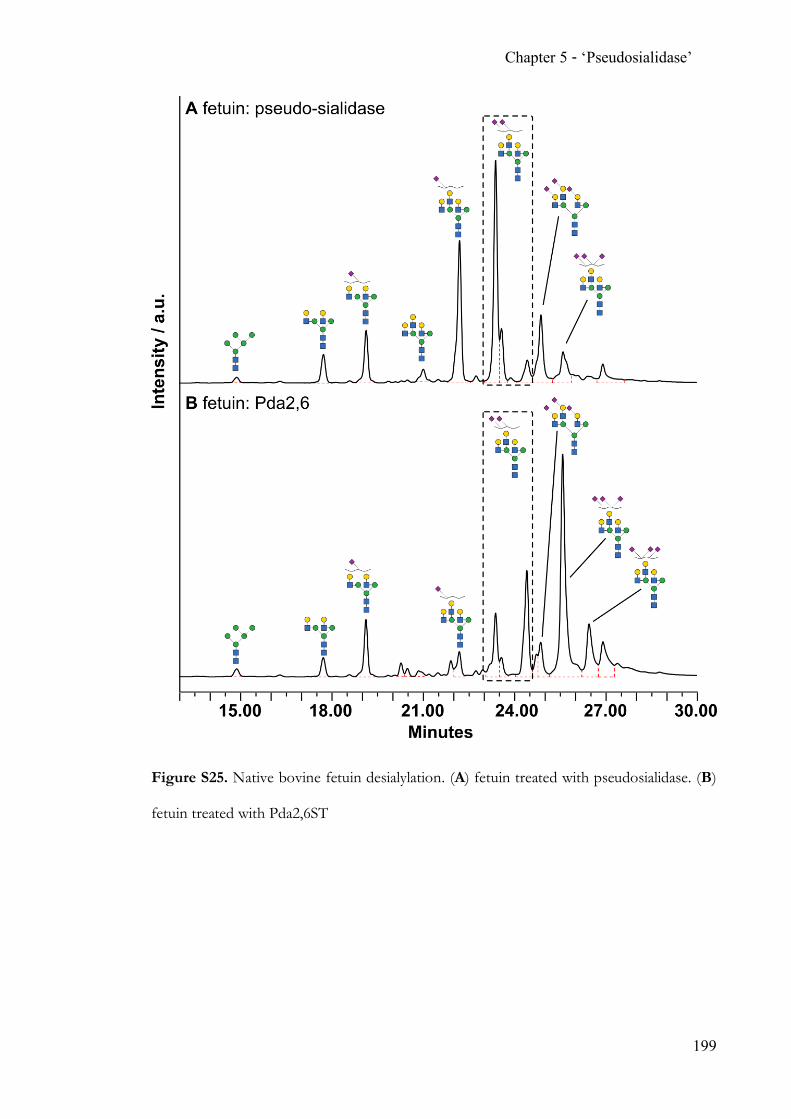
Chapter 5 - ‘Pseudosialidase’
199
Figure S25. Native bovine fetuin desialylation. (A) fetuin treated with pseudosialidase. (B)
fetuin treated with Pda2,6ST
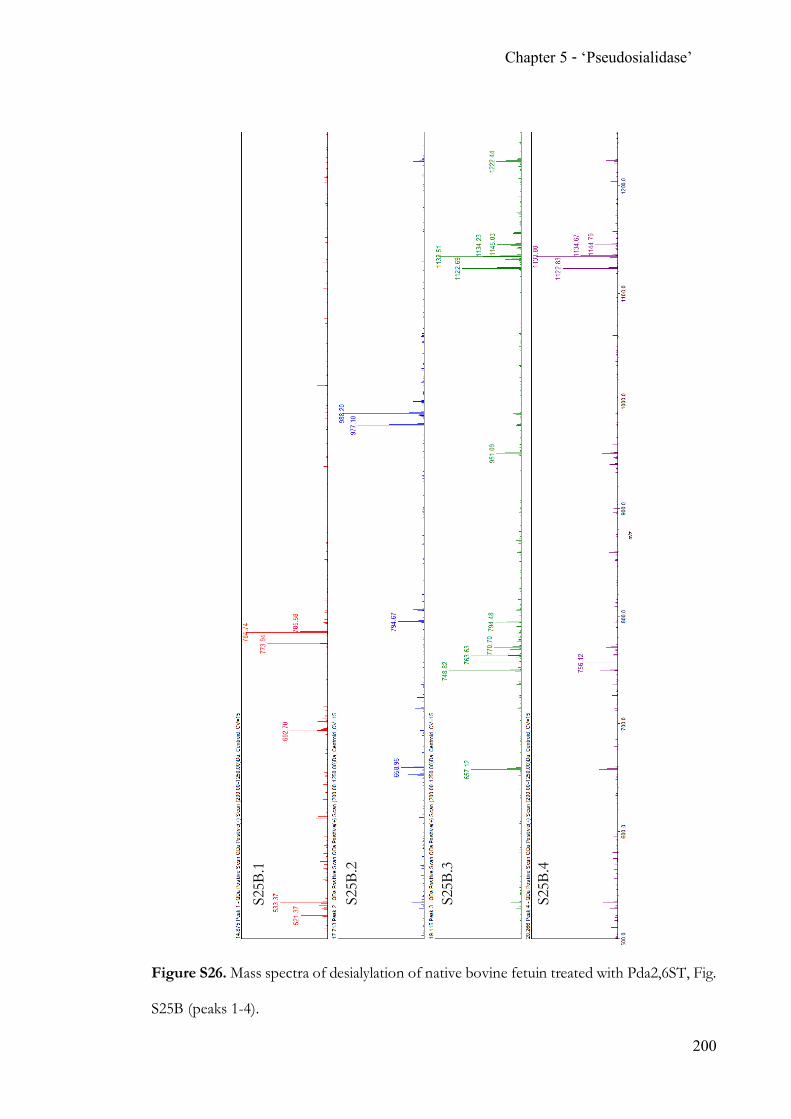
Chapter 5 - ‘Pseudosialidase’
200
Figure S26. Mass spectra of desialylation of native bovine fetuin treated with Pda2,6ST, Fig.
S25B (peaks 1-4).
S25B
.1
S25B
.2
S25B
.3
S25B
.4
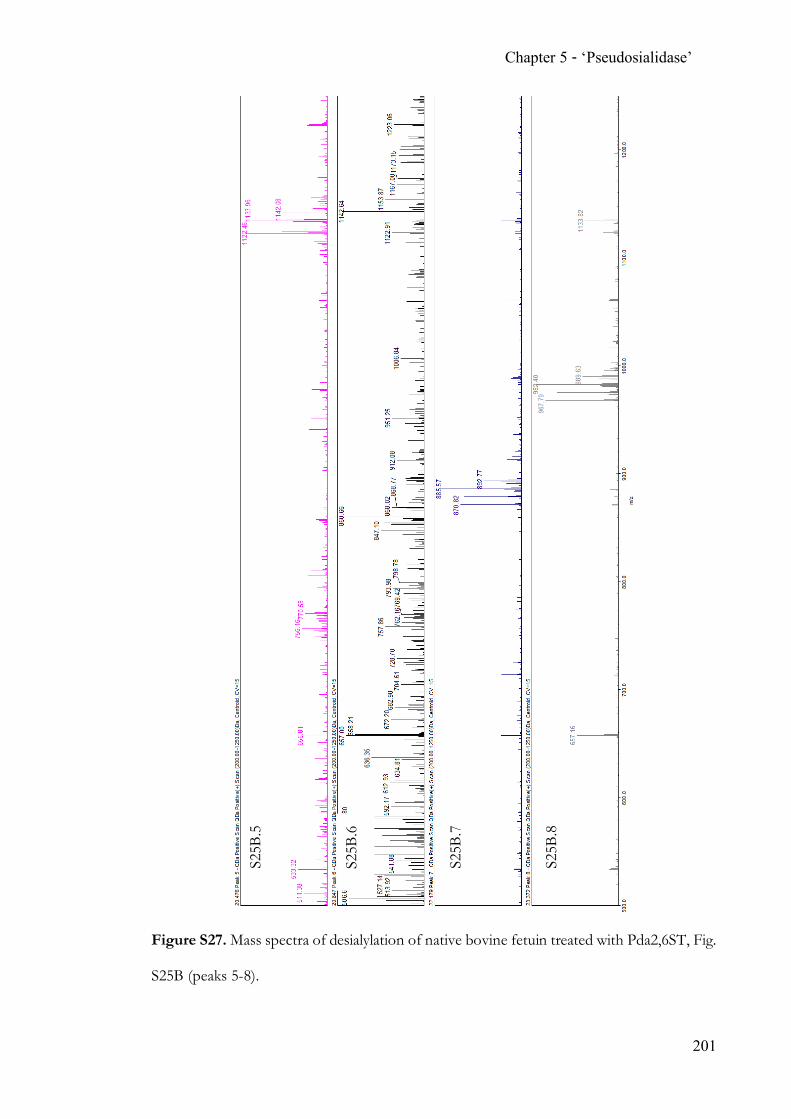
Chapter 5 - ‘Pseudosialidase’
201
Figure S27. Mass spectra of desialylation of native bovine fetuin treated with Pda2,6ST, Fig.
S25B (peaks 5-8).
S25B
.5
S25B
.6
S25B
.7
S25B
.8
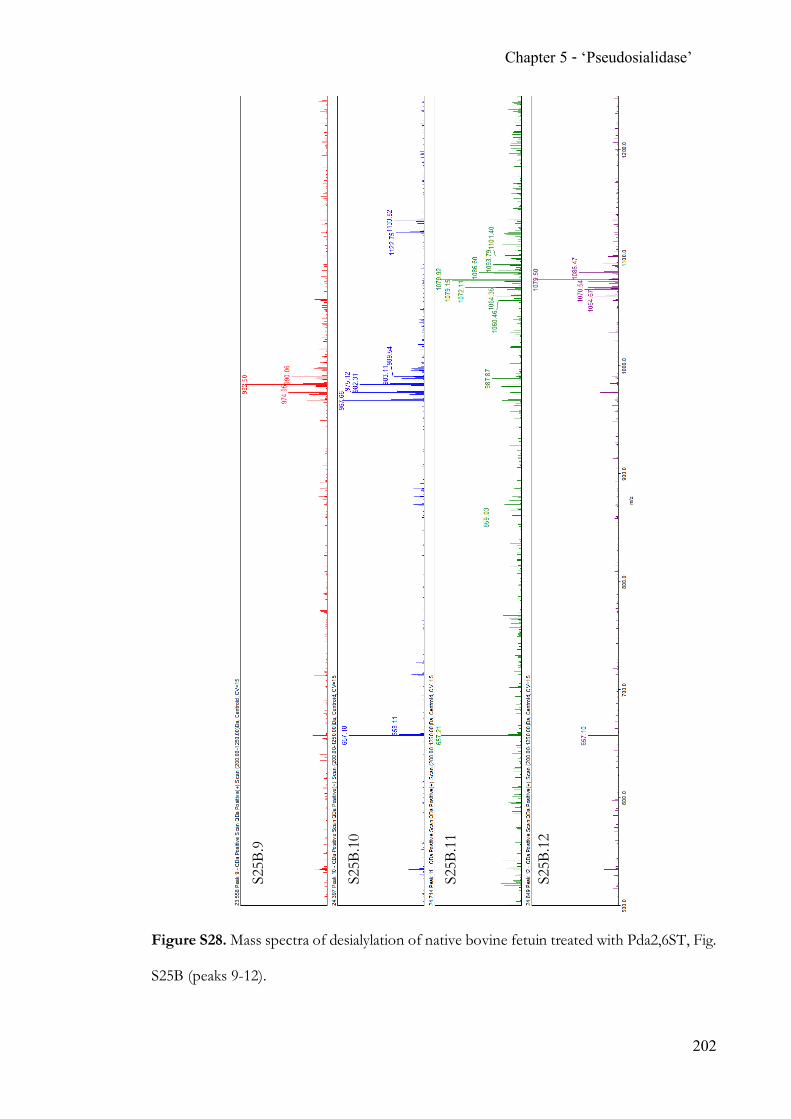
Chapter 5 - ‘Pseudosialidase’
202
Figure S28. Mass spectra of desialylation of native bovine fetuin treated with Pda2,6ST, Fig.
S25B (peaks 9-12).
S25B
.9
S25B
.10
S25B
.11
S25B
.12
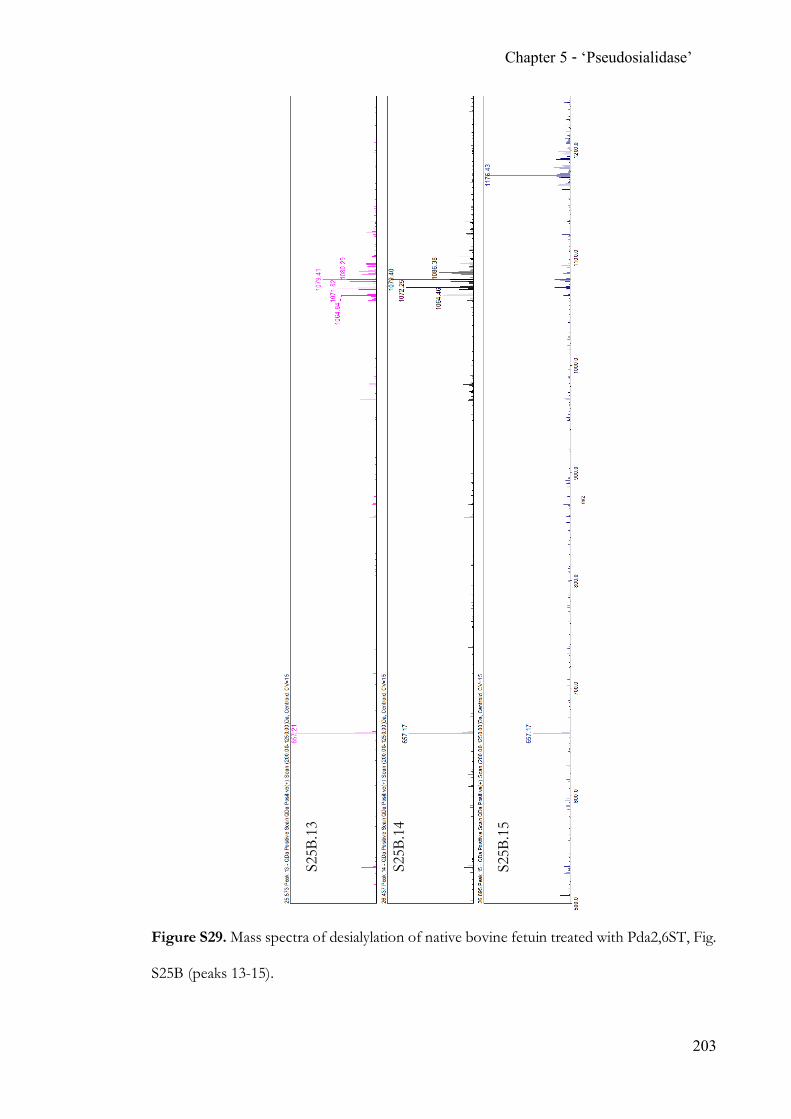
Chapter 5 - ‘Pseudosialidase’
203
Figure S29. Mass spectra of desialylation of native bovine fetuin treated with Pda2,6ST, Fig.
S25B (peaks 13-15).
S25B
.13
S25B
.14
S25B
.15
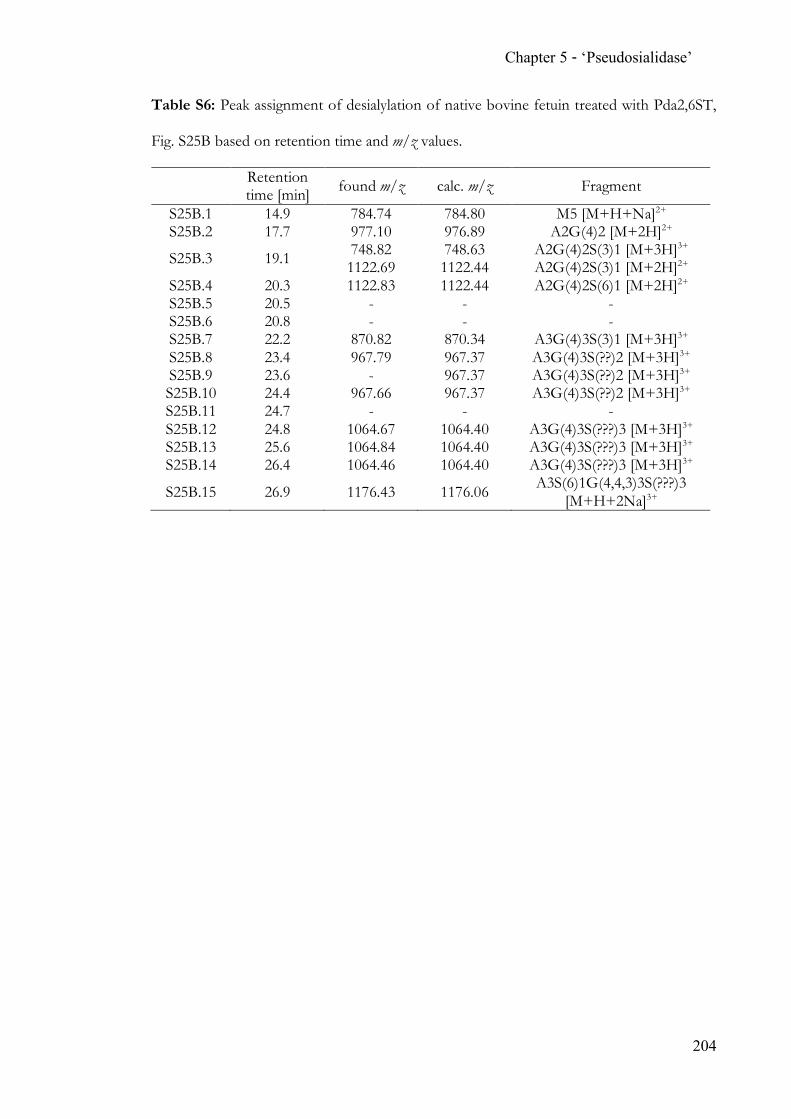
Chapter 5 - ‘Pseudosialidase’
204
Table S6: Peak assignment of desialylation of native bovine fetuin treated with Pda2,6ST,
Fig. S25B based on retention time and m/z values.
Retention time [min] found m/z calc. m/z Fragment
S25B.1 14.9 784.74 784.80 M5 [M+H+Na]2+ S25B.2 17.7 977.10 976.89 A2G(4)2 [M+2H]2+
S25B.3 19.1 748.82 748.63 A2G(4)2S(3)1 [M+3H]3+ 1122.69 1122.44 A2G(4)2S(3)1 [M+2H]2+
S25B.4 20.3 1122.83 1122.44 A2G(4)2S(6)1 [M+2H]2+ S25B.5 20.5 - - - S25B.6 20.8 - - - S25B.7 22.2 870.82 870.34 A3G(4)3S(3)1 [M+3H]3+ S25B.8 23.4 967.79 967.37 A3G(4)3S(??)2 [M+3H]3+ S25B.9 23.6 - 967.37 A3G(4)3S(??)2 [M+3H]3+ S25B.10 24.4 967.66 967.37 A3G(4)3S(??)2 [M+3H]3+ S25B.11 24.7 - - - S25B.12 24.8 1064.67 1064.40 A3G(4)3S(???)3 [M+3H]3+ S25B.13 25.6 1064.84 1064.40 A3G(4)3S(???)3 [M+3H]3+ S25B.14 26.4 1064.46 1064.40 A3G(4)3S(???)3 [M+3H]3+
S25B.15 26.9 1176.43 1176.06 A3S(6)1G(4,4,3)3S(???)3 [M+H+2Na]3+
Chapter 5 - ‘Pseudosialidase’
205
Traveling wave ion mobility-mass spectrometry (TWIMS-MS) analysis
Sialylated glycans were analyzed according to the protocol of Kolarich et al. with slight
adjustments.S5 Samples (approximately 1-10 µM, 45 mM ammonium acetate pH 7, 25 %
DMF, 53.625 % acetonitrile in water) were infused into a Synapt G2-Si HDMS (Waters, UK)
by static nanoelectrospray ionization using pulled borosilicate emitters (World Precision
Instruments, USA, thin-wall capillary, 4” length, 1.2 mm OD). The capillary, cone voltage
and source temperature were typically set to 0.8-1.5 kV, 25 V and 40 oC respectively. No
cone gas was used. The trap DC entrance, bias and exit were set to 0, 45 and 3 V. The IM
travelling wave speed was set to 1000 m/s and the wave height set at 40 V. Nitrogen drift
gas flow was set at 90 mL/min for all experiments. The helium and argon flow were set to
180 and 2 mL/min respectively for the helium and trap cell. The trap voltage was set to 25
V for all collision-induced dissociation data and was otherwise set to 4 V for MS acquisitions.
The transfer voltage was set to 2 V throughout. The mass measurements were calibrated
using 2 mg/mL NaI calibrant in 50% Isopropyl alcohol. Drift times were calibrated to a mix
of dextran 1000 (0.1 mg/mL) and 5000 oligomers (0.5 mg/mL) in the presence of 1 mM
NaH2PO4 in 50% MeOH, whose CCS have been previously verified by DTIMS.S6
Mass spectra and ATDs were processed using MassLynx V4.1 (Waters, UK) and
OriginPro 9.1 (OriginLabs, USA) respectively. ATDs were calibrated and subsequently
normalized to their maximum intensity. Gaussian distributions were fitted to these spectra
and the center of this fitted peak was taken as the peaks CCS.
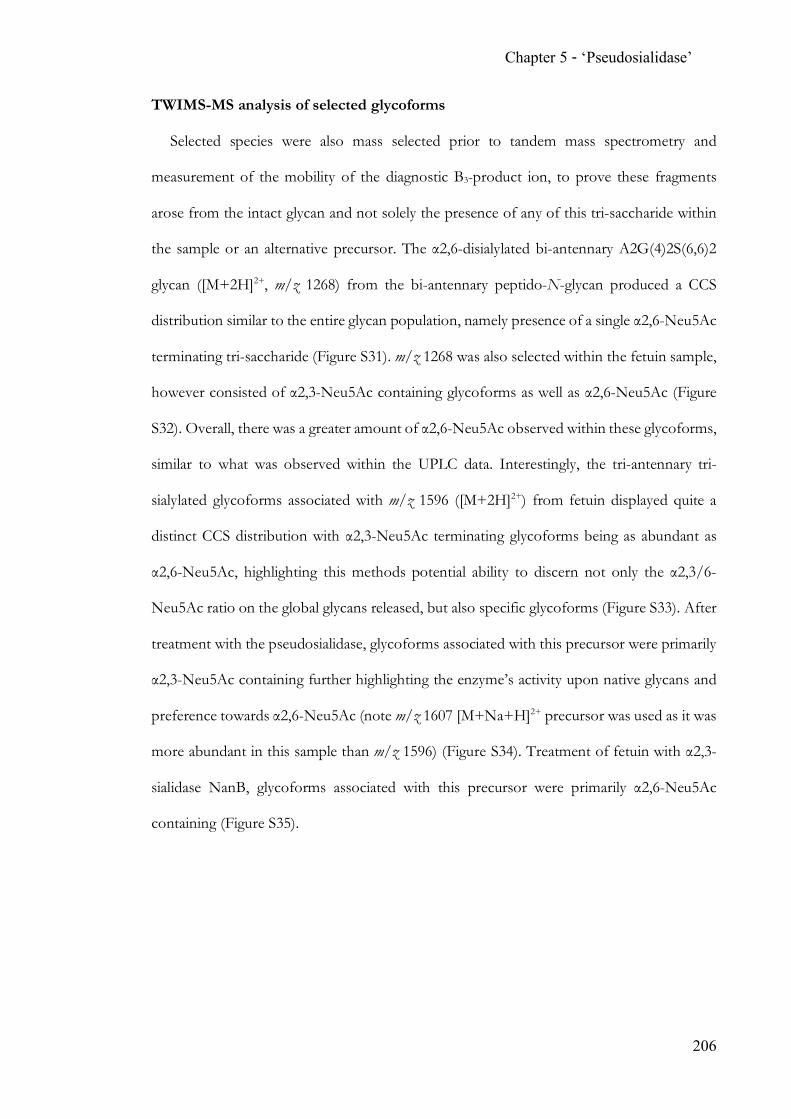
Chapter 5 - ‘Pseudosialidase’
206
TWIMS-MS analysis of selected glycoforms
Selected species were also mass selected prior to tandem mass spectrometry and
measurement of the mobility of the diagnostic B3-product ion, to prove these fragments
arose from the intact glycan and not solely the presence of any of this tri-saccharide within
the sample or an alternative precursor. The α2,6-disialylated bi-antennary A2G(4)2S(6,6)2
glycan ([M+2H]2+, m/z 1268) from the bi-antennary peptido-N-glycan produced a CCS
distribution similar to the entire glycan population, namely presence of a single α2,6-Neu5Ac
terminating tri-saccharide (Figure S31). m/z 1268 was also selected within the fetuin sample,
however consisted of α2,3-Neu5Ac containing glycoforms as well as α2,6-Neu5Ac (Figure
S32). Overall, there was a greater amount of α2,6-Neu5Ac observed within these glycoforms,
similar to what was observed within the UPLC data. Interestingly, the tri-antennary tri-
sialylated glycoforms associated with m/z 1596 ([M+2H]2+) from fetuin displayed quite a
distinct CCS distribution with α2,3-Neu5Ac terminating glycoforms being as abundant as
α2,6-Neu5Ac, highlighting this methods potential ability to discern not only the α2,3/6-
Neu5Ac ratio on the global glycans released, but also specific glycoforms (Figure S33). After
treatment with the pseudosialidase, glycoforms associated with this precursor were primarily
α2,3-Neu5Ac containing further highlighting the enzyme’s activity upon native glycans and
preference towards α2,6-Neu5Ac (note m/z 1607 [M+Na+H]2+ precursor was used as it was
more abundant in this sample than m/z 1596) (Figure S34). Treatment of fetuin with α2,3-
sialidase NanB, glycoforms associated with this precursor were primarily α2,6-Neu5Ac
containing (Figure S35).
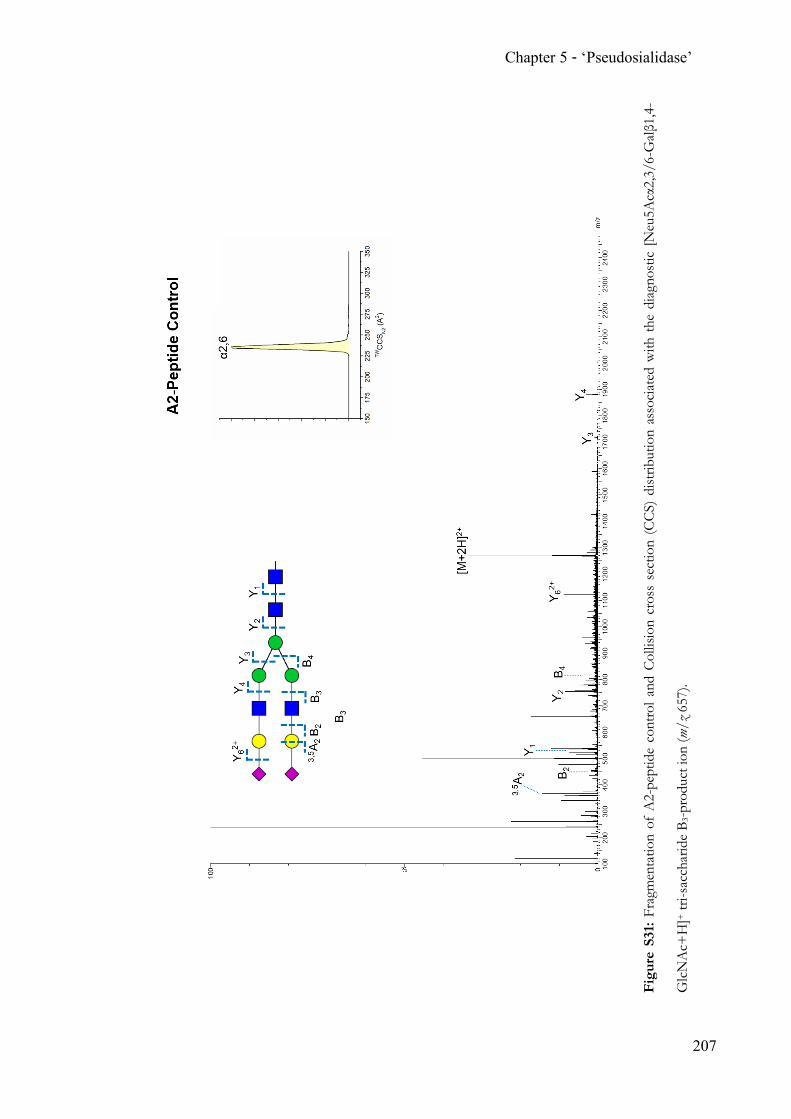
Chapter 5 - ‘Pseudosialidase’
207
Figu
re S
31: F
ragm
enta
tion
of A
2-pe
ptid
e co
ntro
l and
Col
lisio
n cr
oss
sect
ion
(CC
S) d
istrib
utio
n as
soci
ated
with
the
dia
gnos
tic [
Neu
5Acα
2,3/
6-G
alβ1
,4-
Glc
NA
c+H
]+ tr
i-sac
char
ide
B 3-p
rodu
ct io
n (m
/z 6
57).
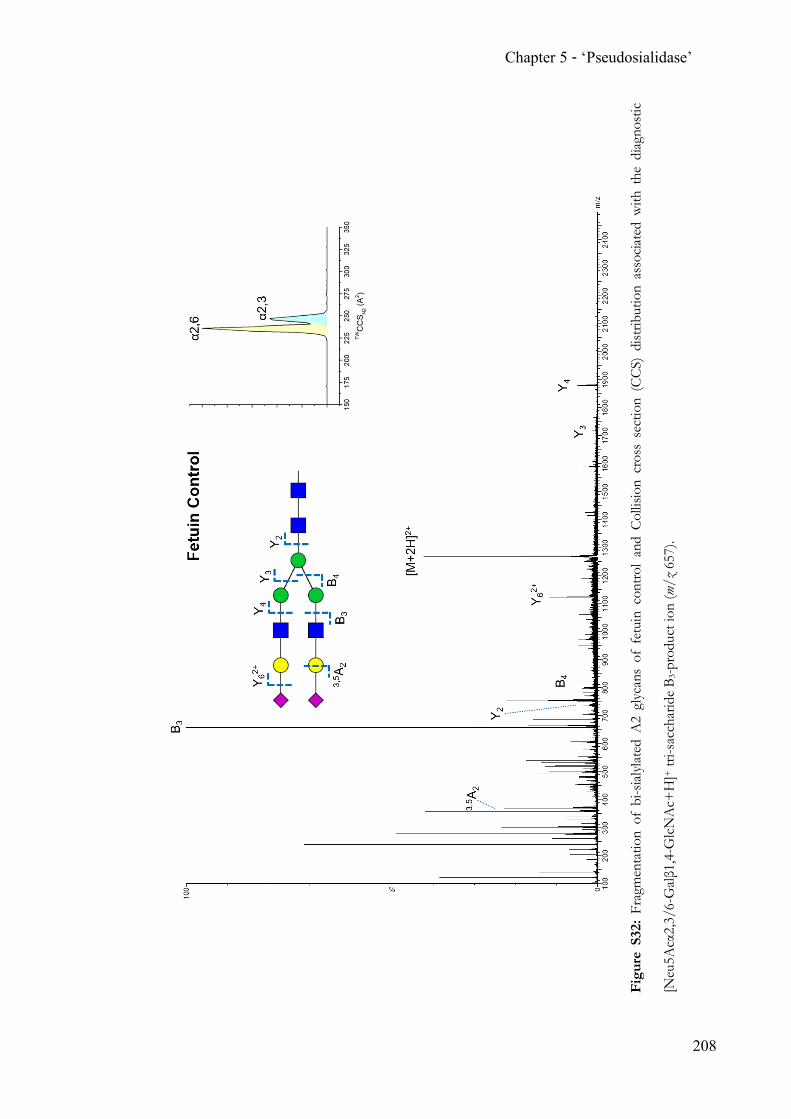
Chapter 5 - ‘Pseudosialidase’
208
Figu
re S
32:
Frag
men
tatio
n of
bi-s
ialy
late
d A
2 gl
ycan
s of
fet
uin
cont
rol
and
Col
lisio
n cr
oss
sect
ion
(CC
S) d
istrib
utio
n as
soci
ated
with
the
dia
gnos
tic
[Neu
5Acα
2,3/
6-G
alβ1
,4-G
lcN
Ac+
H]+
tri-s
acch
arid
e B 3
-pro
duct
ion
( m/z
657
).
Chapter 5 - ‘Pseudosialidase’
209
Figu
re S
33:
Frag
men
tatio
n of
tri -
sialy
late
d A
3 gl
ycan
s of
fet
uin
cont
rol
and
Col
lisio
n cr
oss
sect
ion
(CC
S) d
istrib
utio
n as
soci
ated
with
the
dia
gnos
tic
[Neu
5Acα
2,3/
6-G
alβ1
,4-G
lcN
Ac+
H]+
tri-s
acch
arid
e B 3
-pro
duct
ion
( m/z
657
).
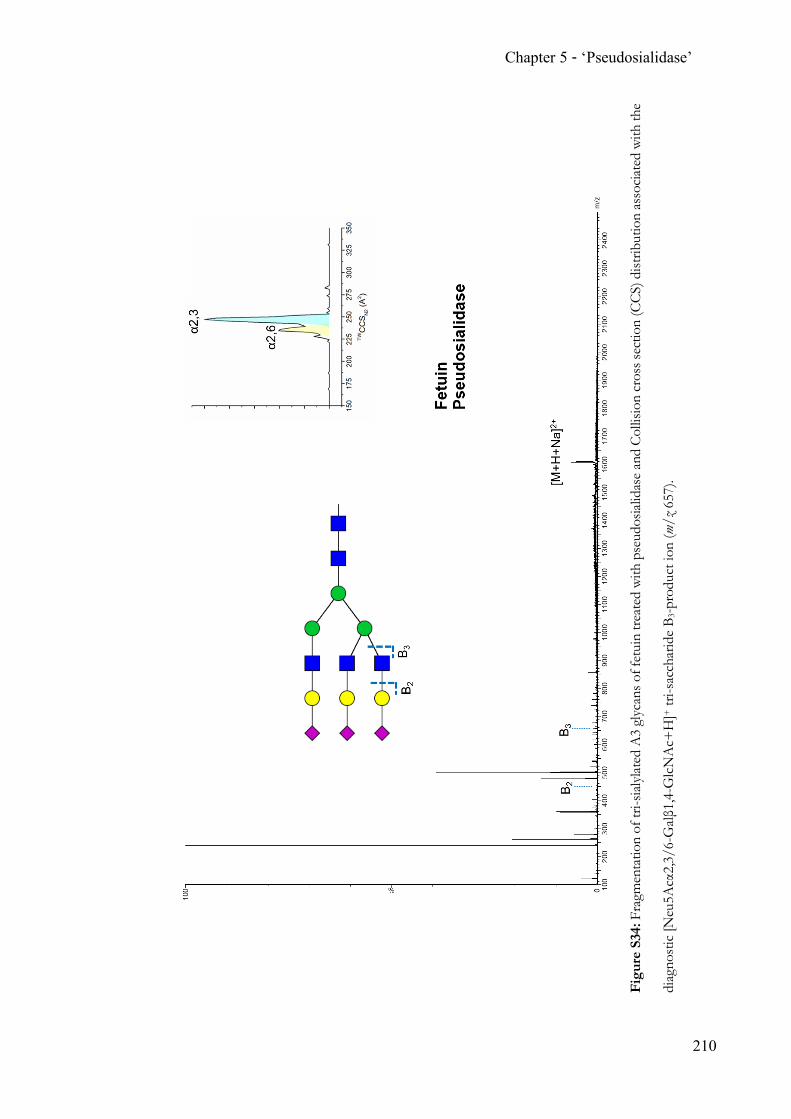
Chapter 5 - ‘Pseudosialidase’
210
Figu
re S
34: F
ragm
enta
tion
of tr
i- sia
lylat
ed A
3 gl
ycan
s of f
etui
n tre
ated
with
pse
udos
ialid
ase
and
Col
lisio
n cr
oss s
ectio
n (C
CS)
dist
ribut
ion
asso
ciat
ed w
ith th
e
diag
nost
ic [N
eu5A
cα2,
3/6-
Galβ
1,4-
Glc
NA
c+H
]+ tr
i -sac
char
ide
B 3-p
rodu
ct io
n (m
/z 6
57).
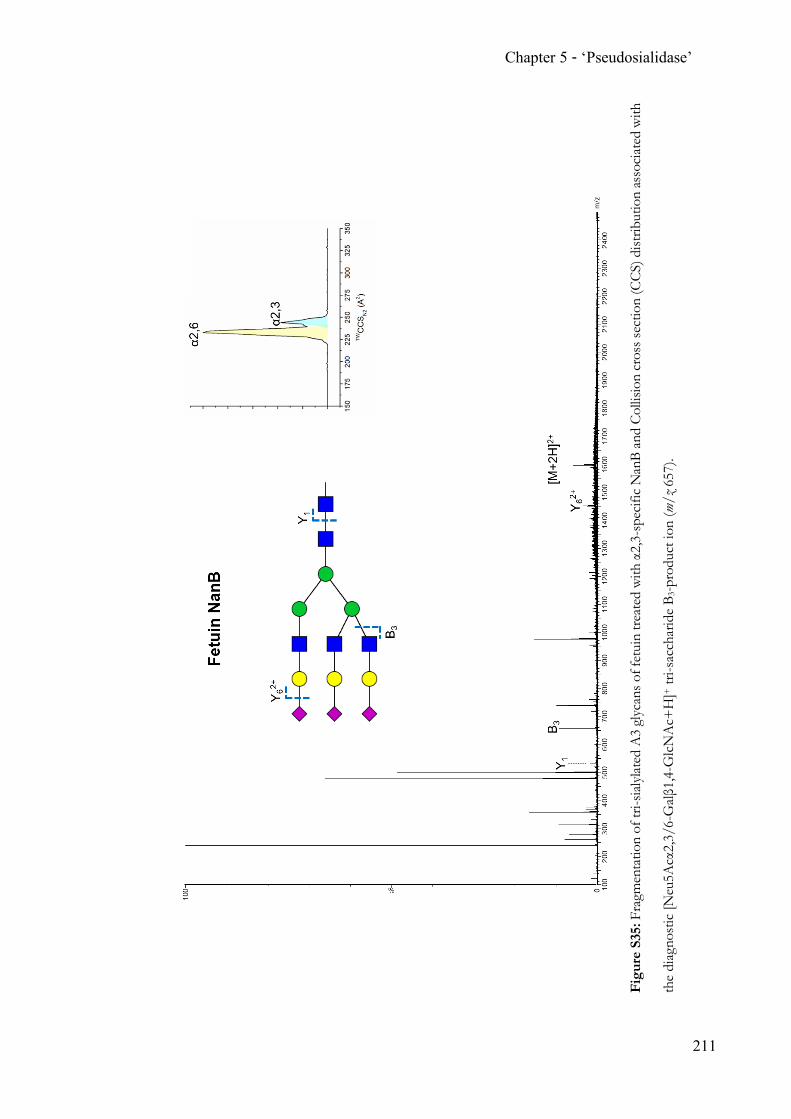
Chapter 5 - ‘Pseudosialidase’
211
Figu
re S
35: F
ragm
enta
tion
of tr
i- sia
lyla
ted
A3
glyc
ans o
f fet
uin
treat
ed w
ith α
2,3-
spec
ific
Nan
B an
d C
ollis
ion
cros
s sec
tion
(CC
S) d
istrib
utio
n as
soci
ated
with
the
diag
nost
ic [N
eu5A
cα2,
3/6-
Galβ
1,4-
Glc
NA
c+H
]+ tr
i-sac
char
ide
B 3-p
rodu
ct io
n (m
/z 6
57).
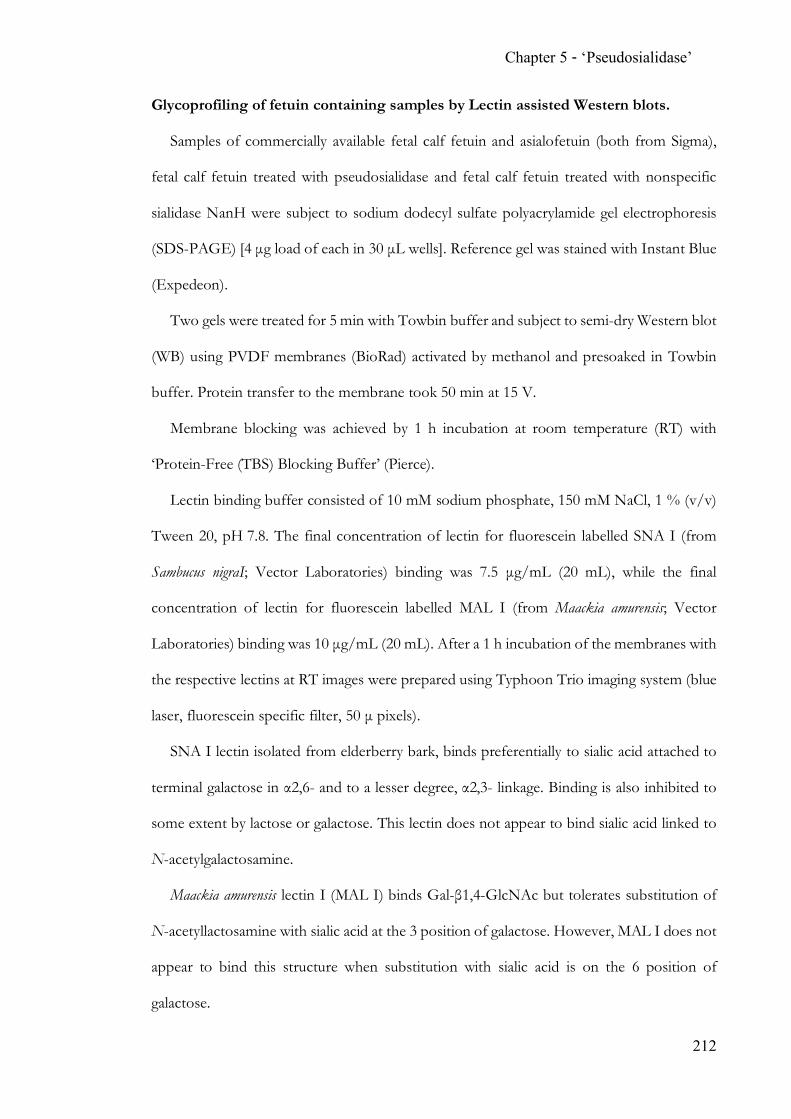
Chapter 5 - ‘Pseudosialidase’
212
Glycoprofiling of fetuin containing samples by Lectin assisted Western blots.
Samples of commercially available fetal calf fetuin and asialofetuin (both from Sigma),
fetal calf fetuin treated with pseudosialidase and fetal calf fetuin treated with nonspecific
sialidase NanH were subject to sodium dodecyl sulfate polyacrylamide gel electrophoresis
(SDS-PAGE) [4 µg load of each in 30 µL wells]. Reference gel was stained with Instant Blue
(Expedeon).
Two gels were treated for 5 min with Towbin buffer and subject to semi-dry Western blot
(WB) using PVDF membranes (BioRad) activated by methanol and presoaked in Towbin
buffer. Protein transfer to the membrane took 50 min at 15 V.
Membrane blocking was achieved by 1 h incubation at room temperature (RT) with
‘Protein-Free (TBS) Blocking Buffer’ (Pierce).
Lectin binding buffer consisted of 10 mM sodium phosphate, 150 mM NaCl, 1 % (v/v)
Tween 20, pH 7.8. The final concentration of lectin for fluorescein labelled SNA I (from
Sambucus nigraI; Vector Laboratories) binding was 7.5 µg/mL (20 mL), while the final
concentration of lectin for fluorescein labelled MAL I (from Maackia amurensis; Vector
Laboratories) binding was 10 µg/mL (20 mL). After a 1 h incubation of the membranes with
the respective lectins at RT images were prepared using Typhoon Trio imaging system (blue
laser, fluorescein specific filter, 50 µ pixels).
SNA I lectin isolated from elderberry bark, binds preferentially to sialic acid attached to
terminal galactose in α2,6- and to a lesser degree, α2,3- linkage. Binding is also inhibited to
some extent by lactose or galactose. This lectin does not appear to bind sialic acid linked to
N-acetylgalactosamine.
Maackia amurensis lectin I (MAL I) binds Gal-β1,4-GlcNAc but tolerates substitution of
N-acetyllactosamine with sialic acid at the 3 position of galactose. However, MAL I does not
appear to bind this structure when substitution with sialic acid is on the 6 position of
galactose.
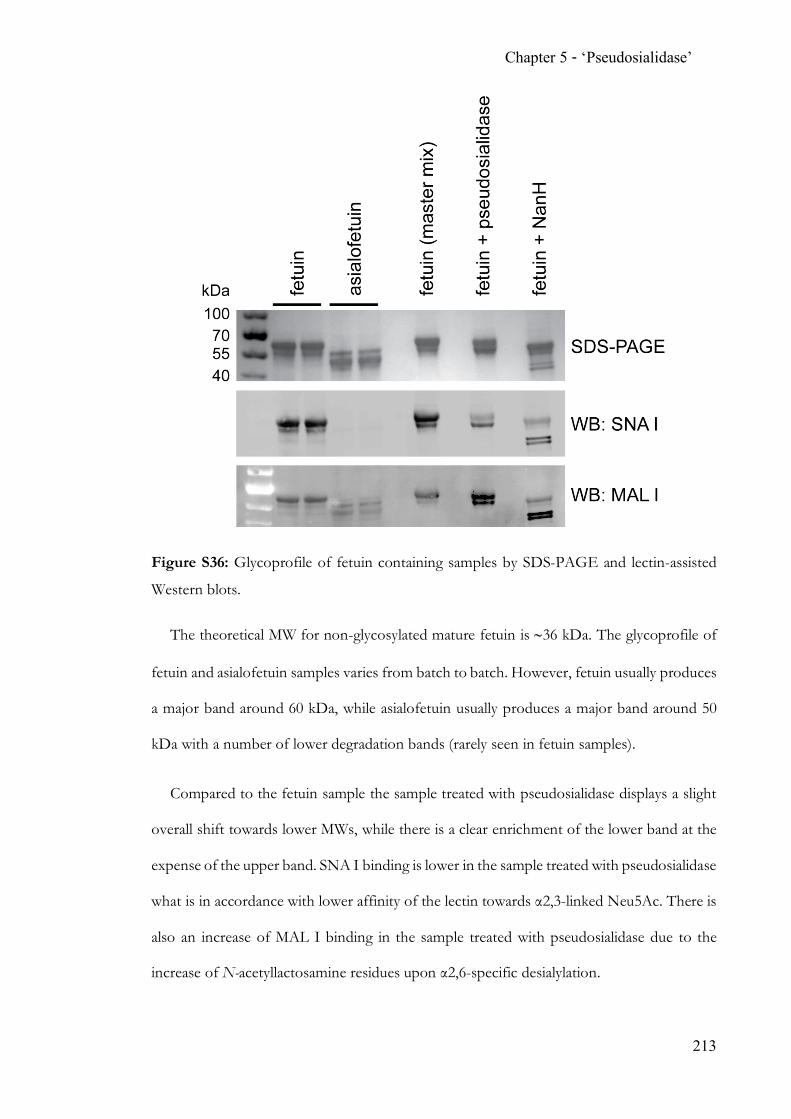
Chapter 5 - ‘Pseudosialidase’
213
Figure S36: Glycoprofile of fetuin containing samples by SDS-PAGE and lectin-assisted
Western blots.
The theoretical MW for non-glycosylated mature fetuin is ~36 kDa. The glycoprofile of
fetuin and asialofetuin samples varies from batch to batch. However, fetuin usually produces
a major band around 60 kDa, while asialofetuin usually produces a major band around 50
kDa with a number of lower degradation bands (rarely seen in fetuin samples).
Compared to the fetuin sample the sample treated with pseudosialidase displays a slight
overall shift towards lower MWs, while there is a clear enrichment of the lower band at the
expense of the upper band. SNA I binding is lower in the sample treated with pseudosialidase
what is in accordance with lower affinity of the lectin towards α2,3-linked Neu5Ac. There is
also an increase of MAL I binding in the sample treated with pseudosialidase due to the
increase of N-acetyllactosamine residues upon α2,6-specific desialylation.
Chapter 5 - ‘Pseudosialidase’
214
The sample treated with nonspecific sialidase NanH displays an additional MW shift of
bands and generation of two additional faint low MW bands. While the two main bands with
higher MW show diminished binding with both lectins the two faint bands show a more
significant binding to both lectins. Based on HILIC-UPLC data approximately 2/5 of the
N-glycans present in the sample still contain Neu5Ac (single or two per glycan) with both
α2,3- and α2,6-linkages present. Since these faint bands are of MWs, which correspond to
protein degradation products, give stronger signal with both lectins, we believe they may be
richer in sialylated remnants.
References
[S1] Huang, K.; Wang, M. M.; Kulinich, A.; Yao, H. L.; Ma, H. Y.; Martínez, J. E.; Duan,
X. C.; Chen, H.; Cai, Z. P.; Flitsch, S. L.; Liu, L.; Voglmeir, J. Carbohydr. Res. 2015, 415,
60.
[S2] Cheng, J.; Huang, S.; Yu, H.; Li, Y.; Lau, K.; Chen, X. Glycobiology. 2010, 20, 260.
[S3] Mehr, K.; Withers, S. G. Glycobiology. 2016, 26, 353.
[S4] Campbell, M. P.; Royle, L.; Radcliffe, C. M.; Dwek, R. A.; Rudd, P. M. Bioinformatics
2008, 24, 1214.
[S5] Hinnenburg, H.; Hofmann, J.; Struwe, W. B.; Thader, A.; Altmann, F.; Varón Silva,
D.; Seeberger, P. H.; Pagel, K.; Kolarich, D. Chem. Commun. (Camb.) 2016, 52, 4381.
[S6] Hofmann, J.; Struwe, W. B.; Scarff, C. A.; Scrivens, J. H.; Harvey, D. J.; Pagel, K. Anal.
Chem. 2014, 86, 10789.
215
Chapter 6 Endogenous modulation of neuronal dopamine
transport
6.1 Summary
The final chapter discusses the effects of glycolipids and their associated catabolic
enzymes on human health. While the etiology of Parkinson’s disease is not fully understood
a correlation between Gaucher’s and Parkinson’s disease has been identified. Especially the
role of the lysosomal β-glucocerebrosidase has been of particular interest. The following
manuscript in preparation reveals a new perspective on the involvement of
glucosylsphingosine in the neurodegenerative process of dopaminergic neurons.
6.2 Contribution
As part of this thesis the general idea was development. MR and SLF designed the study.
MR designed, and TD performed computational experiments. MR provided compounds to
YMG. YMG and TL performed cell culture experiments and analysed the data. MR
interpreted the data and wrote the manuscript. All authors edited the manuscript.
6.3 Manuscript
This manuscript is prepared in the Nature Letters format. Additional experiments are in
progress. Submission is anticipated for 2018 to Nature Letters.
Chapter 6 - Dopamine transport
216
Endogenous modulation of neuronal dopamine
transport
Michel Riese,† Teodora Djikic, ‡ Yasmina Marti Gil,§ Thorsten Lau, § Partick Schloss,§ Kemal
Yelekci,‡ and Sabine L. Flitsch*†
† School of Chemistry & Manchester Institute of Biotechnology, The University of
Manchester, Manchester M1 7DN, U.K.
‡ Department for Bioinformatics and Genetics, Faculty of Science, Kadir Has University,
Istanbul, Turkey.
§ Biochemistry Laboratory, Department of Psychiatry and Psychotherapy, Central Institute
of Mental Health, Medical Faculty Mannheim, Heidelberg University, Germany.
Abstract
Parkinsons disease (PD) is the second most common neurodegenerative disorder and is
characterised by the loss of dopaminergic neurons in the substaia nigra pars compacta resulting
in altered dopamine signalling.
The most cited genetic risk factors are mutations in the gba1 gene1,2. Dysfunctional
glucocerebrosidase leads to the accumulation of glycolidips and is associated with the
lysosomal storage disorder Gauchers disease (GD).
Increased levels of glucosylsphingosine as well as reduced activity of GBA1 are found to
be linked with lower survival of neurons. However, the underlying molecular mechanism are
yet to be understood3.
In this study, we demonstrate a direct interaction between the neuronal dopamine
transporter (DAT) and glucosylsphingosine (GlcSph).
Similar to cocaine, a known inhibitor of DAT, GlcSph (IC50 = approx. 2 µM) shows a
ten-fold increased inhibition of DAT-mediated dopamine transport. With the recently
Chapter 6 - Dopamine transport
217
described model of the human DAT it was possible to gain insights into possible mechanisms
of the interaction between GlcSph and DAT. Whereas dopamine binds the open-out
conformation, GlcSph shows a much stronger binding to the open-in conformation.
The discovery of an endogenous DAT inhibitor associated with a known genetic risk
factor is the first interaction of its kind to be described and offers a molecular explanation
towards the correlated pathologies of PD and GD. The underlying mechanism needs further
investigation, but this interaction might reveal a new dimension to the field.
Introduction
Amongst neurodegenerative diseases Parkinson’s disease (PD) is the second most
common after Alzheimer’s disease. PD is age-dependent and affects 1% of people over the
age of 60 and even up to 4% in higher age-groups worldwide4. The neuropathology of PD is
characterised by the loss of dopaminergic neurons in the substaia nigra pars compacta leading to
a depletion of the neurotransmitter dopamine. Amongst the symptoms reduced facilitation
of voluntary movements (tremor, bradykinesia and rigidity) and non-motor symptoms are
prevalent4,5. Patients are treated with dopamine agonists like L-Dopa to reduce the severity
of symptoms. To the present day no cure for PD is available.
The etiology of PD is complex and still unclear. However, genetic (e.g. alpha-synuclein
and gba1) and non-genetic risk factors have been studied extensively4 suggesting oxidative
stress, inflammation, mitochondrial dysfunction and protein sorting as well as small molecule
involvement are important features of a heterogeneous pathology6.
Over the last decade, studies linking Gaucher’s disease (GD) with PD attracted a lot of
attention7. GD patients are described to have an up to thirteen-fold increased probability to
develop PD with earlier on-set2,8. The hydrolase glucocerebrosidase (GCase) is encoded by
the GBA1 gene and cleaves the glycosidic bonds of glucosylcerebrosides and –sphingosines
in lysosomes. Mutations in the gba1 gene are the main cause for the lysosomal storage
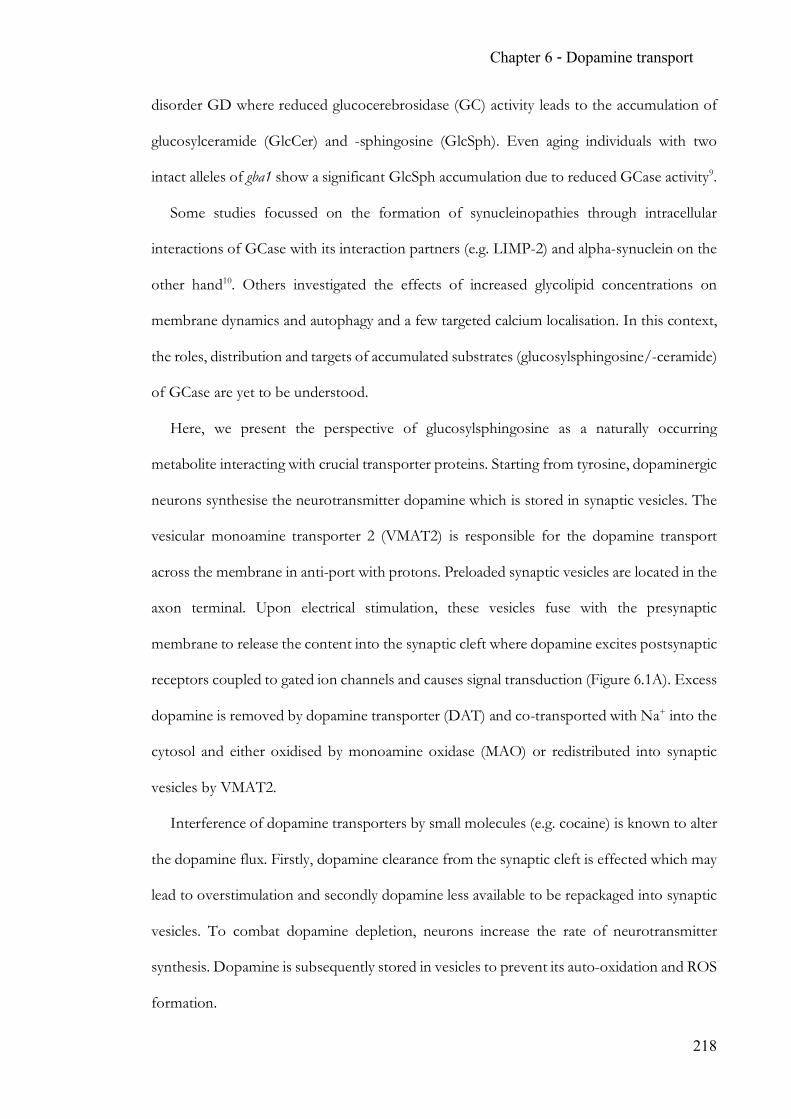
Chapter 6 - Dopamine transport
218
disorder GD where reduced glucocerebrosidase (GC) activity leads to the accumulation of
glucosylceramide (GlcCer) and -sphingosine (GlcSph). Even aging individuals with two
intact alleles of gba1 show a significant GlcSph accumulation due to reduced GCase activity9.
Some studies focussed on the formation of synucleinopathies through intracellular
interactions of GCase with its interaction partners (e.g. LIMP-2) and alpha-synuclein on the
other hand10. Others investigated the effects of increased glycolipid concentrations on
membrane dynamics and autophagy and a few targeted calcium localisation. In this context,
the roles, distribution and targets of accumulated substrates (glucosylsphingosine/-ceramide)
of GCase are yet to be understood.
Here, we present the perspective of glucosylsphingosine as a naturally occurring
metabolite interacting with crucial transporter proteins. Starting from tyrosine, dopaminergic
neurons synthesise the neurotransmitter dopamine which is stored in synaptic vesicles. The
vesicular monoamine transporter 2 (VMAT2) is responsible for the dopamine transport
across the membrane in anti-port with protons. Preloaded synaptic vesicles are located in the
axon terminal. Upon electrical stimulation, these vesicles fuse with the presynaptic
membrane to release the content into the synaptic cleft where dopamine excites postsynaptic
receptors coupled to gated ion channels and causes signal transduction (Figure 6.1A). Excess
dopamine is removed by dopamine transporter (DAT) and co-transported with Na+ into the
cytosol and either oxidised by monoamine oxidase (MAO) or redistributed into synaptic
vesicles by VMAT2.
Interference of dopamine transporters by small molecules (e.g. cocaine) is known to alter
the dopamine flux. Firstly, dopamine clearance from the synaptic cleft is effected which may
lead to overstimulation and secondly dopamine less available to be repackaged into synaptic
vesicles. To combat dopamine depletion, neurons increase the rate of neurotransmitter
synthesis. Dopamine is subsequently stored in vesicles to prevent its auto-oxidation and ROS
formation.
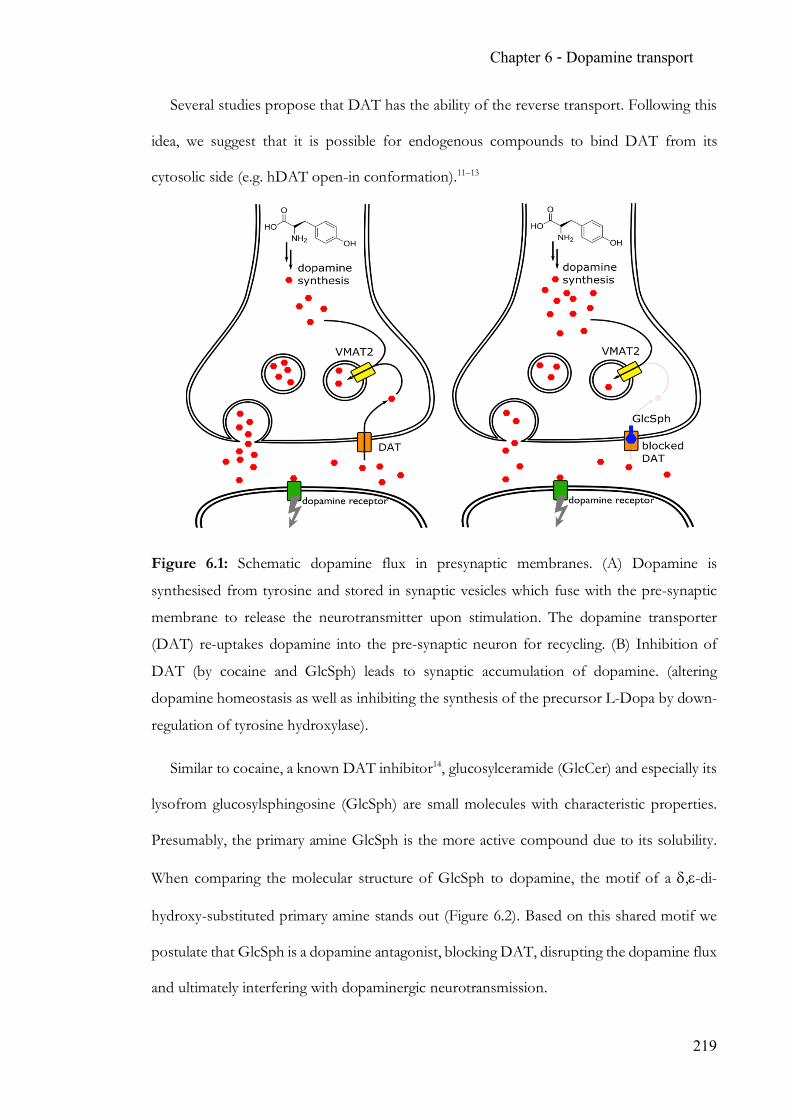
Chapter 6 - Dopamine transport
219
Several studies propose that DAT has the ability of the reverse transport. Following this
idea, we suggest that it is possible for endogenous compounds to bind DAT from its
cytosolic side (e.g. hDAT open-in conformation).11–13
Figure 6.1: Schematic dopamine flux in presynaptic membranes. (A) Dopamine is
synthesised from tyrosine and stored in synaptic vesicles which fuse with the pre-synaptic
membrane to release the neurotransmitter upon stimulation. The dopamine transporter
(DAT) re-uptakes dopamine into the pre-synaptic neuron for recycling. (B) Inhibition of
DAT (by cocaine and GlcSph) leads to synaptic accumulation of dopamine. (altering
dopamine homeostasis as well as inhibiting the synthesis of the precursor L-Dopa by down-
regulation of tyrosine hydroxylase).
Similar to cocaine, a known DAT inhibitor14, glucosylceramide (GlcCer) and especially its
lysofrom glucosylsphingosine (GlcSph) are small molecules with characteristic properties.
Presumably, the primary amine GlcSph is the more active compound due to its solubility.
When comparing the molecular structure of GlcSph to dopamine, the motif of a d,e-di-
hydroxy-substituted primary amine stands out (Figure 6.2). Based on this shared motif we
postulate that GlcSph is a dopamine antagonist, blocking DAT, disrupting the dopamine flux
and ultimately interfering with dopaminergic neurotransmission.
Chapter 6 - Dopamine transport
220
Results
Molecular docking
In order to assess GlcSph’s potential to act as a dopamine analogue a recent model of the
human DAT (hDAT) was used for molecular docking experiments. The homology model of
hDAT is based on the crystal structure of DAT from Drosophila spec. and is validated against
dopamine and known inhibitors.15 Similarly, a panel of amines (Figure 6.2) was docked into
hDAT’s two distinct states: open-out and open-in. The strength of each respective docking
result was calculated to give free energy ((DG) and inhibitory constant (Ki). Dopamine and
cocaine, a known inhibitor for DAT, were found to bind to hDAT with expected free
energies (DGdopamine-out = -4.57 kcal/mol and DGcocaine-out = -8.26 kcal/mol respectively, Table
S1) to the open-out state. DAT’s affinity for dopamine was reduced in the open-in
conformation and for cocaine was low (DGdopamine-in = -5.79 kcal/mol). Docking of the
glycolipids which are known to accumulate due to gba1 mutations show millimolar inhibitory
constants Ki for GlcCer in both open-in and open-out states. GlcSph shows similar levels of
association to hDAT in the open-out state compared to dopamine. Interestingly, the
calculated affinity for GlcSph (DGGlcSph = -7.58 kcal/mol, Ki(GlcSph) = 2.77 µmol, Table
S1) in the open-in conformation was higher than for dopamine and comparable to the
strength of cocaine’s binding to the open-out state (Table S1). This tight interaction between
GlcSph and hDAT, especially in its open-in state, lead to the detailed analysis of the substrate
binding site. While dopamine’s and GlcSph’s position and orientation in the open-out state
are similar with amino acids Asp79 and Tyr156 interacting with the substrate’s amino groups,
dopamine’s planar architecture results in additional hydrogen bonding between Ala77 and
Ser422 and dopamine’s hydroxyl groups. However, GlcSph’s lipid motif causes further van-
der-Waals interactions with amino acids Cys319, Phe320 and Leu485 which are unoccupied
in the case of dopamine (Fig S1).
Chapter 6 - Dopamine transport
221
In the open-in conformation, the substrates’ amine groups are coordinated by ionic
interactions between Asp79 as well as hydrogen bonding with the peptide backbone of amino
acids Ala77 and Val78. While this amine anchor locks both molecules into a similar position,
dopamine has got few additional interactions with hDAT. Leu322 is a hydrogen bond
acceptor for the hydroxyl groups and the aromatic ring shows pi-stacking with Phe76. While
these interactions are not present in case of GlcSph, its more complex architecture provides
van-der-Waals and hydrophobic interactions between the lipid tail and amino acids Trp267
and Leu418. Especially the additional hydroxyl groups of the glucosyl moiety show great
potential for extensive hydrogen bonding with amino acids Ala77, Asp421, Ser422, Gly425
and Gly426. Additionally, the alpha-hydroxyl group forms a hydrogen bond with the peptide
backbone of Leu418 (Fig. S2). Interestingly, both dopamine and GlcSph appear to be located
in a very similar position inside hDAT with close alignment of the two structures in their
docked and energy-minimised structures (Figure 6.2).
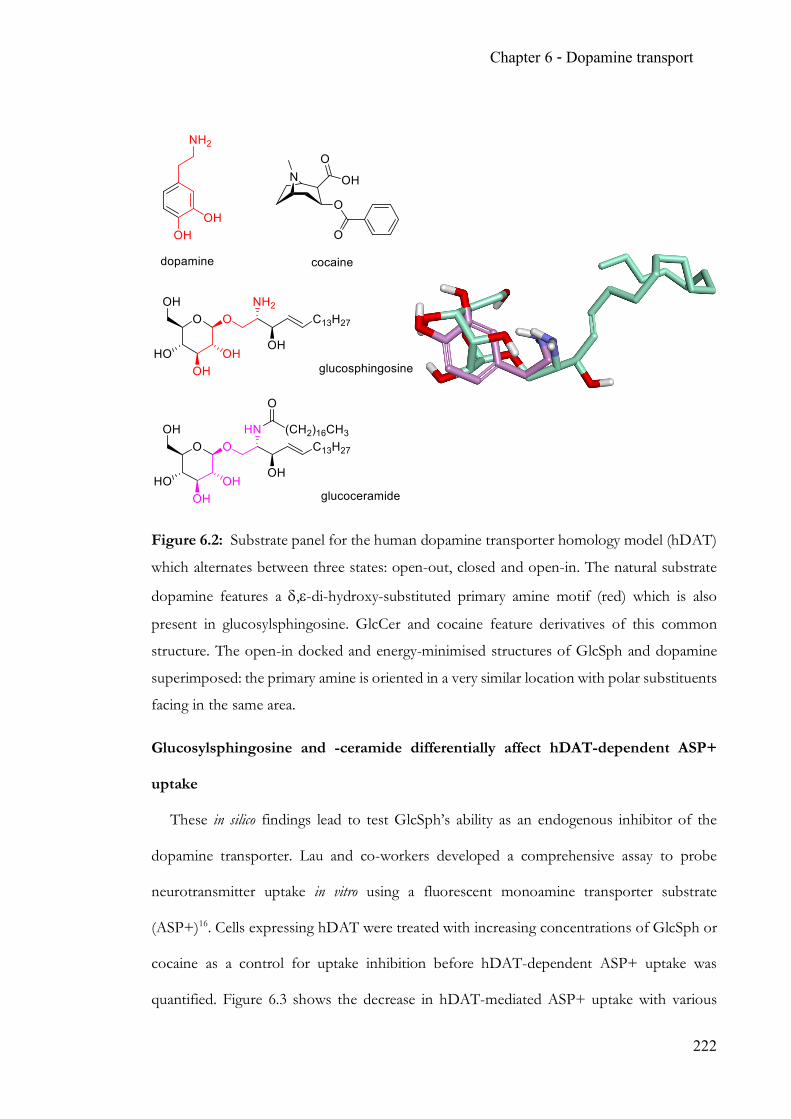
Chapter 6 - Dopamine transport
222
Figure 6.2: Substrate panel for the human dopamine transporter homology model (hDAT)
which alternates between three states: open-out, closed and open-in. The natural substrate
dopamine features a d,e-di-hydroxy-substituted primary amine motif (red) which is also
present in glucosylsphingosine. GlcCer and cocaine feature derivatives of this common
structure. The open-in docked and energy-minimised structures of GlcSph and dopamine
superimposed: the primary amine is oriented in a very similar location with polar substituents
facing in the same area.
Glucosylsphingosine and -ceramide differentially affect hDAT-dependent ASP+
uptake
These in silico findings lead to test GlcSph’s ability as an endogenous inhibitor of the
dopamine transporter. Lau and co-workers developed a comprehensive assay to probe
neurotransmitter uptake in vitro using a fluorescent monoamine transporter substrate
(ASP+)16. Cells expressing hDAT were treated with increasing concentrations of GlcSph or
cocaine as a control for uptake inhibition before hDAT-dependent ASP+ uptake was
quantified. Figure 6.3 shows the decrease in hDAT-mediated ASP+ uptake with various
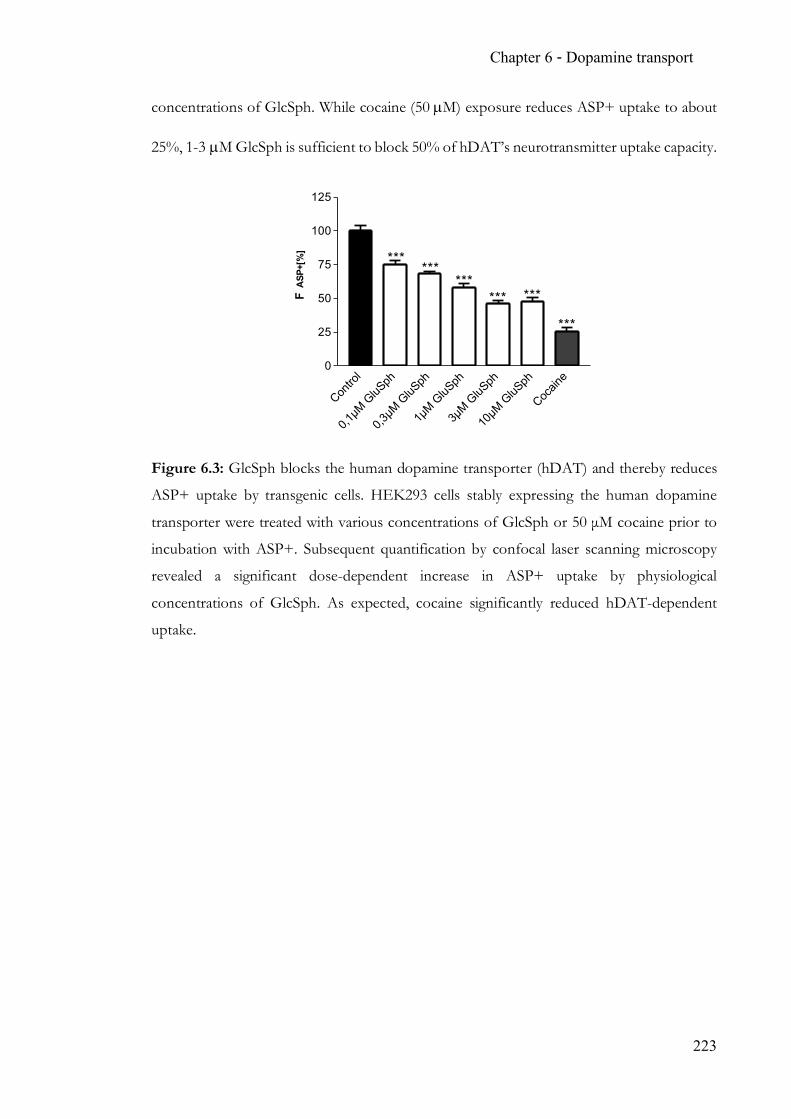
Chapter 6 - Dopamine transport
223
concentrations of GlcSph. While cocaine (50 µM) exposure reduces ASP+ uptake to about
25%, 1-3 µM GlcSph is sufficient to block 50% of hDAT’s neurotransmitter uptake capacity.
Figure 6.3: GlcSph blocks the human dopamine transporter (hDAT) and thereby reduces
ASP+ uptake by transgenic cells. HEK293 cells stably expressing the human dopamine
transporter were treated with various concentrations of GlcSph or 50 µM cocaine prior to
incubation with ASP+. Subsequent quantification by confocal laser scanning microscopy
revealed a significant dose-dependent increase in ASP+ uptake by physiological
concentrations of GlcSph. As expected, cocaine significantly reduced hDAT-dependent
uptake.
Contro
l
0,1µM
GluS
ph
0,3µM
GluS
ph
1µM G
luSph
3µM G
luSph
10µM
GluS
ph
Cocain
e0
25
50
75
100
125
FASP+[%] ***
******
*** ***
***
Chapter 6 - Dopamine transport
224
Discussion
Looking at glucosylsphingosine, a naturally occurring substrate it suggests that the shared
structural motifs with the neurotransmitter dopamine could lead to biological interference.
Molecular dynamics simulations of the human dopamine transporter in complex with
substrates reveal that glucosylsphingosine could have similar binding modes compared to
dopamine. Our findings suggest two possible mechanisms of interaction:
Firstly, GlcSph could be a competitive inhibitor for dopamine in the open-out state of
DAT reducing the rate of dopamine transport across the pre-synaptic membrane.
Secondly, GlcSph demonstrates a high probability to bind to DAT in the open-in
conformation. A strong interaction could trap DAT in the final phase of the transport cycle
and prevent its return to the open-out state abolishing DAT-mediated dopamine transport
completely.
The reduction of dopamine analogue uptake in vitro underlines GlcSph’s potential to
modulate dopamine distribution with down-stream effects like dopamine accumulation
leading to altered signal clearance in the synaptic cleft and dopamine depletion in pre-synaptic
neurons. Inefficient recycling of dopamine can cause increased catecholamine metabolism
linked to cytotoxic ROS formation17.
Additionally, the vesicular monoamine transporter 2 (VMAT-2) is believed to be affected
by MPTP+ in a similar fashion18. We postulate that VMAT-2 might be targeted by GlcSph
causing further perturbation of the neuronal dopamine homeostasis and dopamine packaging
into vesicles escalating into neurotoxicity.
Chapter 6 - Dopamine transport
225
References
1. Neudorfer, O. et al. Occurrence of Parkinson’s syndrome in type 1 Gaucher disease.
QJM 89, 691–694 (1996).
2. Aharon-Peretz, J., Rosenbaum, H. & Gershoni-Baruch, R. Mutations in the
glucocerebrosidase gene and Parkinson’s disease in Ashkenazi Jews. N. Engl. J. Med.
351, 1972–7 (2004).
3. Alcalay, R. N. et al. Glucocerebrosidase activity in Parkinson’s disease with and without
GBA mutations. Brain 138, 2648–2658 (2015).
4. de Lau, L. M. & Breteler, M. M. Epidemiology of Parkinson’s disease. Lancet Neurol. 5,
525–535 (2006).
5. Chaudhuri, K. R., Healy, D. G. & Schapira, A. H. Non-motor symptoms of
Parkinson’s disease: diagnosis and management. Lancet Neurol. 5, 235–245 (2006).
6. Sampson, T. R. et al. Gut Microbiota Regulate Motor Deficits and Neuroinflammation
in a Model of Parkinson’s Disease. Cell 1–12 (2016).
7. Sidransky, E. Gaucher disease and parkinsonism. Mol. Genet. Metab. 84, 302–304
(2005).
8. Alcalay, R. N. et al. Glucocerebrosidase activity in Parkinson’s disease with and without
GBA mutations. Brain 138, 2648–2658 (2015).
9. Rocha, E. M. et al. Progressive decline of glucocerebrosidase in aging and Parkinson’s
disease. Ann. Clin. Transl. Neurol. 2, 433–438 (2015).
10. Mazzulli, J. R. et al. Gaucher disease glucocerebrosidase and α-synuclein form a
bidirectional pathogenic loop in synucleinopathies. Cell 146, 37–52 (2011).
11. Jones, S. R., Gainetdinov, R. R., Wightman, R. M. & Caron, M. G. Mechanisms of
amphetamine action revealed in mice lacking the dopamine transporter. J. Neurosci. 18,
1979–1986 (1998).
12. Leviel, V. The reverse transport of DA, what physiological significance? Neurochem. Int.
38, 83–106 (2001).
13. Fog, J. U. et al. Calmodulin Kinase II Interacts with the Dopamine Transporter C
Terminus to Regulate Amphetamine-Induced Reverse Transport. Neuron 51, 417–429
(2006).
14. Reith, M. E. A., Meisler, B. E., Sershen, H. & Lajtha, A. Structural requirements for
cocaine congeners to interact with dopamine and serotonin uptake sites in mouse brain
and to induce stereotyped behavior. Biochem. Pharmacol. 35, 1123–1129 (1986).
Chapter 6 - Dopamine transport
226
15. Djikic, T. & Yelekci, K. Human Dopamine Transporter: The first implementation of
a combined in silico/in vitro approach revealing the substrate and inhibitor specificities.
submitted (2017).
16. Lau, T., Proissl, V., Ziegler, J. & Schloss, P. Visualization of neurotransmitter uptake
and release in serotonergic neurons. J. Neurosci. Methods 241, 10–17 (2015).
17. Marchitti, S. A., Deitrich, R. A. & Vasiliou, V. Neurotoxicity and Metabolism of the
Catecholamine-Derived 3,4-Dihydroxyphenylacetaldehyde and 3,4-
Dihydroxyphenylglycolaldehyde: The Role of Aldehyde Dehydrogenase. Pharmacol.
Rev. 59, 125–150 (2007).
18. Hogan, K. A., Staal, R. G. W. & Sonsalla, P. K. Analysis of VMAT2 binding after
methamphetamine or MPTP treatment: Disparity between homogenates and vesicle
preparations. J. Neurochem. 74, 2217–2220 (2000).
Chapter 6 - Dopamine transport
227
6.4 Supporting Information
Endogenous modulation of neuronal dopamine
transport
Michel Riese,† Teodora Djikic, ‡ Yasmina Marti Gil,§ Thorsten Lau, § Partick Schloss,§ Kemal
Yelekci,‡ and Sabine L. Flitsch*†
Chapter 6 - Dopamine transport
228
Materials and Methods
Molecular dynamics simulation
Substrates were docked in a 3D model of human dopamine transporter (hDAT) that was
previously obtained in our laboratory.144 The open-out conformation was created from
drosophila’s DAT (PDB access code: 4M48).145 The open-in conformation was modelled on
the basis of LeuT (PDB access code: 3TT3)146, using BIOVIA D.S 2016. The sequences were
aligned using the secondary structures of transmembrane proteins. Sequence similarity
between hDAT and LeuT was estimated to be 40.4%. 20 models were created using “Build
Homology Model” protocol. And they were verified using MODELLER plug-in of BIOVIA
D.S and the best model (Normalized DOPE score = -0.32) was chosen.
The energy of ligands and proteins was minimised and the structures were protonated to
pH = 7.4 in the same programme. Dopamine, cocaine, glucosylceramide and
glucosylsphingosine were docked in AutoDock (www.autodock.org).147 All the compounds
were set to be flexible, while the proteins were kept rigid. AutoDock adds a free-energy
scoring function created from a linear regression analysis, the AMBER force field, and a large
set of diverse protein-ligand complexes with known inhibition constants.148 As a centre of
binding pocket, CA atom of amino acid Phe320, was chosen. Due to the size of molecules
and number of active torsions a grid box was set to be 70 (each grid point is 0.375 Å) in all
directions for glucosylceramide and glucosylsphingosine and number of evaluation
25,000,000 was used. Whereas the grid box for dopamine and cocaine was set to 50 in all
directions and the number of evaluations was 5,000,000. For the docking studies the
Lamarckian genetic algorithm was used as search algorithm. For visualisation of non-bonded
interactions BIOVIA Discovery Studio 2016 was used.
Chapter 6 - Dopamine transport
229
Calculation of binding energies
Autodock uses a molecular mechanics model for enthalpic contributions such as vdW
and hydrogen bonding, and an empirical model for entropic changes upon binding. Each
component is multiplied by empirical weights found from the calibration against a set of
known binding constants. The scoring function of Autodock is represented in following
equation:
𝛥𝐺 = 𝛥𝐺526 ��𝐴0�𝑟0��
−𝐵0�𝑟0���
0�
+ 𝛥𝐺;{/<12�𝐸(𝑡) �𝐶0�𝑟0���
−𝐷0�𝑟0���
� +0�
𝛥𝐺898: �𝑞0𝑞�𝜀𝑟0��0�
+ 𝛥𝐺><?𝑁><? + 𝛥𝐺=<9 ��𝑆0𝑉� + 𝑆�𝑉0�𝑒{?��
�
���
0�
where ΔG stands for free energy of binding, rij is the magnitude of the distance between
i and j atoms, qi and qj are the charge at points i and j respectively, in C and ε0 is the
permittivity of a vacuum, S - solvation term for atom V –atomic fragmental volume of atom
σ – Gaussian distance constant; it is a sum of van der Walls, hydrogen bonds, electrostatics
(Coulomb's Law), torsions and desolvatation energies.
Quantification of hDAT-dependent ASP+ uptake in Glucosylsphingosine and
Glucosylceramide exposed cells
Transgenic HEK293 cells constitutively expressing hDAT were cultured as described
(HEK293-hDAT)149: cells were maintained in Dulbecco’s modified Eagle’s medium
supplemented with 10% fetal bovine serum, penicillin (100 U/mL), streptomycin
(100 µg/mL), and geneticin (200 µg/mL) at 37°C and 5 % CO2. Glucosylsphingosine
(GluSph, Sigma) or Glucosylceramide (GluCer, Avantis) were applied at 0.1, 0.3, 1, 3 or
Chapter 6 - Dopamine transport
230
10 µM for 10 min in confluent HEK293-hDAT populations. Subsequently, HEK293-hDAT
were loaded with 10 µM 4-(4-(dimethylamino)styryl)-N-methylpyridinium iodide (ASP+,
#D288, Life Technologies) for 30 s. Then, cells were washed with medium devoid of both,
dye and lipid, before being mounted for confocal microscopy to avoid background staining.
All lipids and fluorescent dye used were applied in pH- and temperature-adjusted bath
solutions to avoid temperature or pH shifts that might interfere with protein function or
transport.
ASP+ live cell imaging was performed as described before using a Leica TCS SP5
confocal imaging system attached to a DM IRE2 microscope.150,151 Images were acquired
with a HCX PL APO 63× oil planchromat lens with a NA 1.40 (Leica, Mannheim, Germany)
and a DPSS laser to excite ASP+ (561 nm). HEK-hDAT cells were kept at 37°C during
image acquisition using a microscope microheating system (Ibidi, Planegg, Germany). The
Z-stacks were acquired with sections taken every 0.5 µm and all images were exported as tiff-
files. Data analysis was performed according to Lau et al.151 Confocal z-stacks were imported
into NIH ImageJ (version 1.45s; National Institutes of Health, Bethesda, MD) to generate z-
projections and subsequent intensity quantification using the MultiMeasure plugin in defined
regions of interest (ROIs). For all ROIs, the integrated densities of the fluorescence were
determined. At least 30 cells per treatment were quantified in three independent experiments.
For data presentation and comparison of individual experiments, ASP+ fluorescence
intensity was normalized to each experiment’s control values. Statistical analysis was
performed using GraphPad Software (GraphPad Software Inc., La Jolla, USA): one-way
ANOVA and post hoc Tukey tests were calculated using experimental raw data; p < 0.05
was considered significant. The results are displayed in bar graphs as means ± SEMs.
Chapter 6 - Dopamine transport
231
Results
Molecular dynamics simulation
Table 6.1. Results of the MD simulation based on the homology model of hDAT. Substrates
were modelled into two distinct states and the free energy as well as inhibitory concentrations
were calculated.
Open-out Open-in Compound ΔG / kcal/mol Ki / µmol ΔG / kcal/mol Ki / µmol Dopamine -4.57 450.62 -5.79 56.73 Cocaine -8.26 0.88 - -
Glucosylsphingosine (GlcSph) -4.95 233.84 -7.58 2.77 Glucosylceramide (GlcCer) -2.64 11610.00 -3.96 1250.00
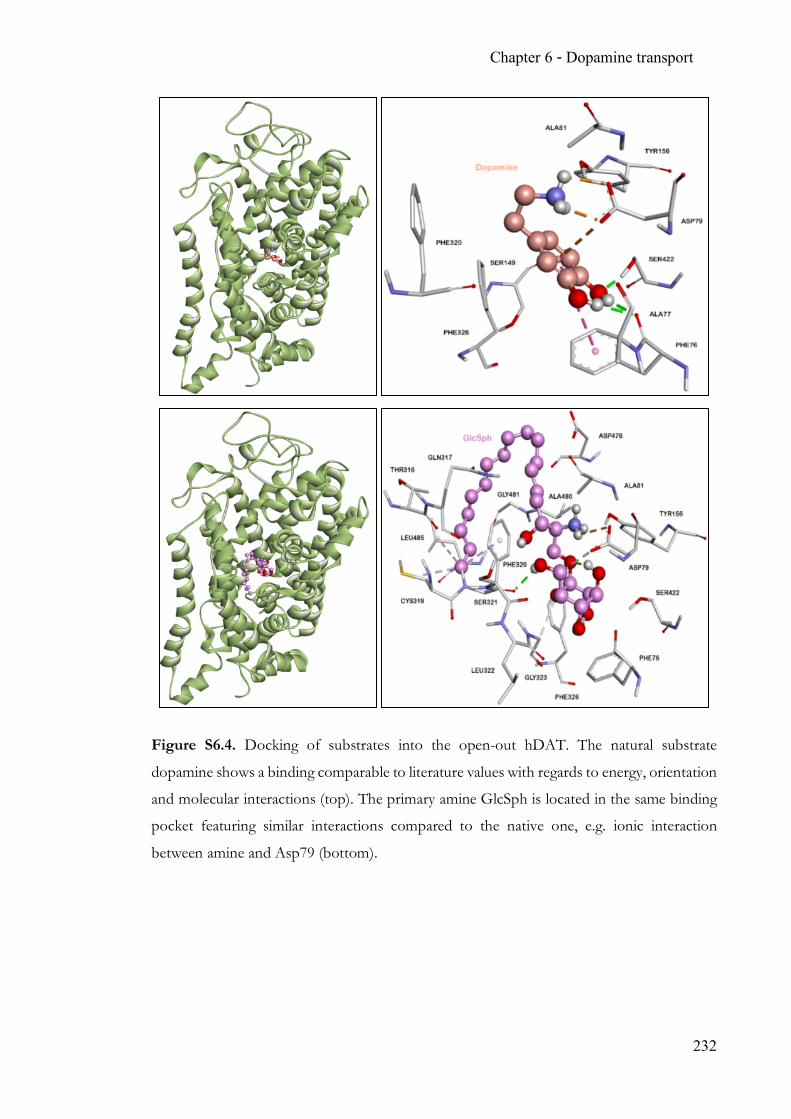
Chapter 6 - Dopamine transport
232
Figure S6.4. Docking of substrates into the open-out hDAT. The natural substrate
dopamine shows a binding comparable to literature values with regards to energy, orientation
and molecular interactions (top). The primary amine GlcSph is located in the same binding
pocket featuring similar interactions compared to the native one, e.g. ionic interaction
between amine and Asp79 (bottom).
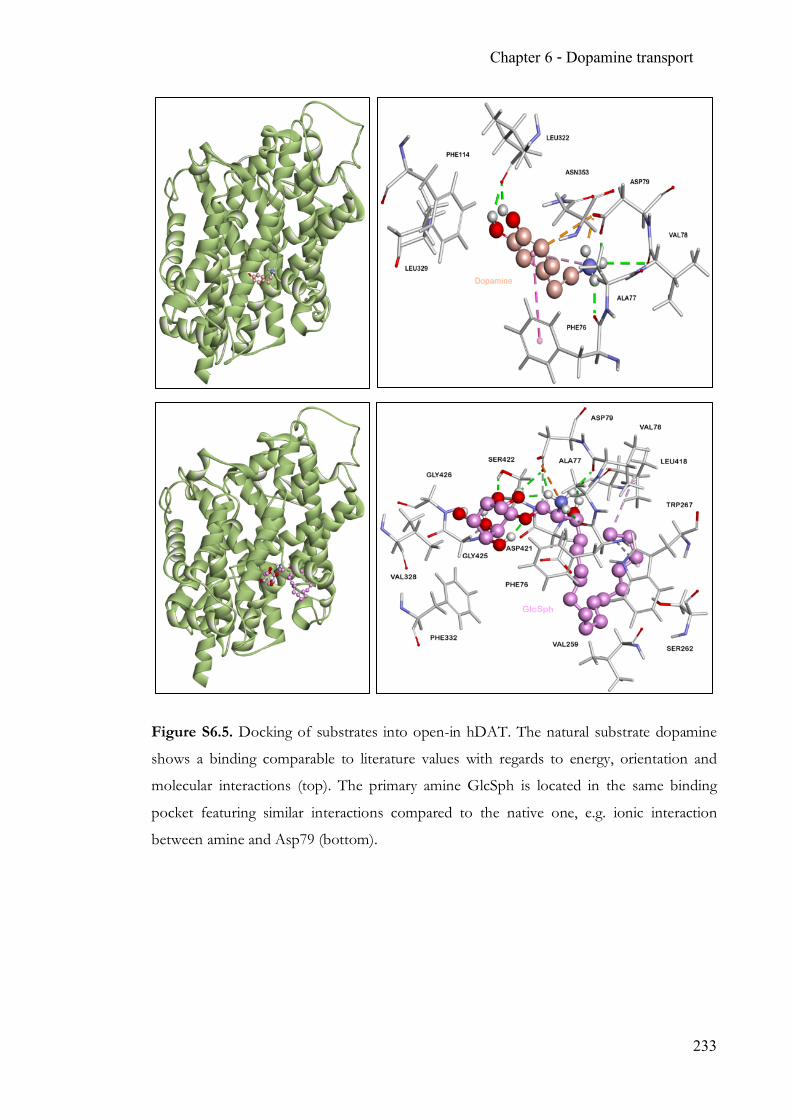
Chapter 6 - Dopamine transport
233
Figure S6.5. Docking of substrates into open-in hDAT. The natural substrate dopamine
shows a binding comparable to literature values with regards to energy, orientation and
molecular interactions (top). The primary amine GlcSph is located in the same binding
pocket featuring similar interactions compared to the native one, e.g. ionic interaction
between amine and Asp79 (bottom).
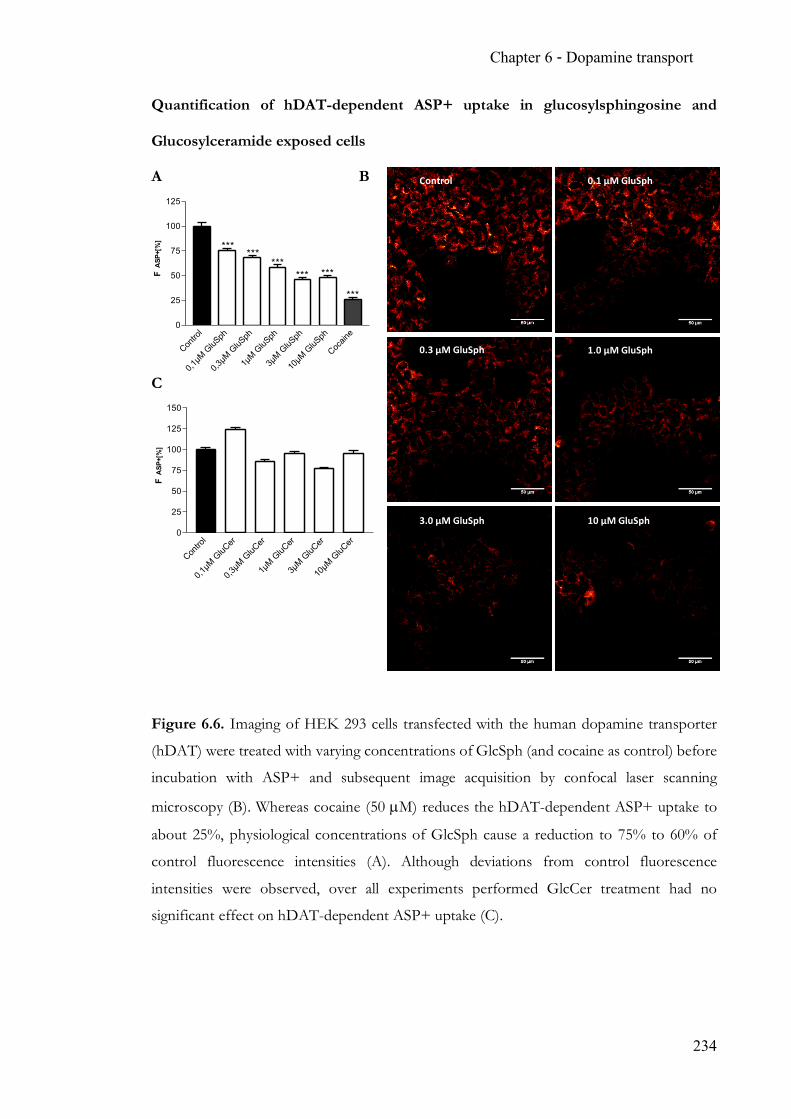
Chapter 6 - Dopamine transport
234
Quantification of hDAT-dependent ASP+ uptake in glucosylsphingosine and
Glucosylceramide exposed cells
A B
C
Figure 6.6. Imaging of HEK 293 cells transfected with the human dopamine transporter
(hDAT) were treated with varying concentrations of GlcSph (and cocaine as control) before
incubation with ASP+ and subsequent image acquisition by confocal laser scanning
microscopy (B). Whereas cocaine (50 µM) reduces the hDAT-dependent ASP+ uptake to
about 25%, physiological concentrations of GlcSph cause a reduction to 75% to 60% of
control fluorescence intensities (A). Although deviations from control fluorescence
intensities were observed, over all experiments performed GlcCer treatment had no
significant effect on hDAT-dependent ASP+ uptake (C).
Contro
l
0,1µM
GluS
ph
0,3µM
GluS
ph
1µM G
luSph
3µM G
luSph
10µM
GluS
ph
Cocain
e0
25
50
75
100
125
FASP+[%] ***
******
*** ***
***
Contro
l
0,1µM
GluC
er
0,3µM
GluC
er
1µM G
luCer
3µM G
luCer
10µM
GluC
er0
25
50
75
100
125
150
FASP+[%]
Control 0.1 µM GluSph
0.3 µM GluSph 1.0 µM GluSph
3.0 µM GluSph 10 µM GluSph
Chapter 6 - Dopamine transport
235
References
1. Djikic, T. & Yelekci, K. Human Dopamine Transporter: The first implementation
of a combined in silico/in vitro approach revealing the substrate and inhibitor
specificities. submitted (2017).
2. Penmatsa, A., Wang, K. H. & Gouaux, E. X-ray structure of dopamine transporter
elucidates antidepressant mechanism. Nature 503, 85–90 (2013).
3. Krishnamurthy, H. & Gouaux, E. X-ray structures of LeuT in substrate-free
outward-open and apo inward-open states. Nature 481, 469–474 (2012).
4. Morris, G. M. et al. Software news and updates AutoDock4 and AutoDockTools4:
Automated docking with selective receptor flexibility. J. Comput. Chem. 30, 2785–
2791 (2009).
5. Cornell, W. D. et al. A Second Generation Force Field for the Simulation of
Proteins, Nucleic Acids, and Organic Molecules. J. Am. Chem. Soc. 117, 5179–
5197 (1995).
6. Hummerich, R. et al. DASB - In vitro binding characteristics on human
recombinant monoamine transporters with regard to its potential as positron
emission tomography (PET) tracer. J. Neurochem. 90, 1218–1226 (2004).
7. Martí, Y., Matthaeus, F., Lau, T. & Schloss, P. Methyl-4-phenylpyridinium
(MPP +) differentially affects monoamine release and re-uptake in murine
embryonic stem cell-derived dopaminergic and serotonergic neurons. Mol. Cell.
Neurosci. 83, 37–45 (2017).
8. Lau, T., Proissl, V., Ziegler, J. & Schloss, P. Visualization of neurotransmitter
uptake and release in serotonergic neurons. J. Neurosci. Methods 241, 10–17
(2015).
236
Chapter 7 Discussion and Outlook
Recently, the focus in glycoscience has shifted to carbohydrate active enzymes underlining
their central role in the field: CAZymes mediate the metabolism of carbohydrates and as
such are intimately involved in metabolic diseases involving glycoconjugates. Additionally,
CAZymes have become valuable tools in biotechnology, similar to restriction enzymes in
molecular biology. This thesis presents a number of projects aiming to increase the
understanding of CAZymes by developing analytical tools such as NMR and mass
spectrometry, ultimately leading to new biotechnological processes and perspectives on cell
biology.
A label-free NMR method devoid of complex sample preparations presented in Chapter 3
enables the rapid analysis of oxidation products resulting from the glycan oxidation mediated
by galactose oxidase. Oligo-saccharides up to tri-saccharides were easily assigned and
quantified. This novel activity screen complements indirect measurements of GOase activity
and reveals the identity of the product. Screening of α- and β-glucosides suggests a preference
for α-linkages. Together with the improvement in expression, GOase variants prove to be a
versatile tool for the regiospecific oxidation of glucosides and galactosides. Future efforts to
optimise the redox potential through oxygen supply and hydrogen peroxide removal should
increase yields at higher substrate concentrations. Therefore, GOase-mediated oxidation of
glucosides would be suitable for industrial application. Furthermore, the presented NMR
analysis of oxidised glycans with minimal sample preparation is a valuable tool. Compared
to Bonnet et al.’s work, the chromatographic separation of by-products can be avoided
resulting in a more streamLined analysis. Additional applications are conceivable where
regiospecific oxidation reactions of glycans are performed. The importance of 6-oxo-
saccharide derivatives is given through potential applications in biotechnology using plant-
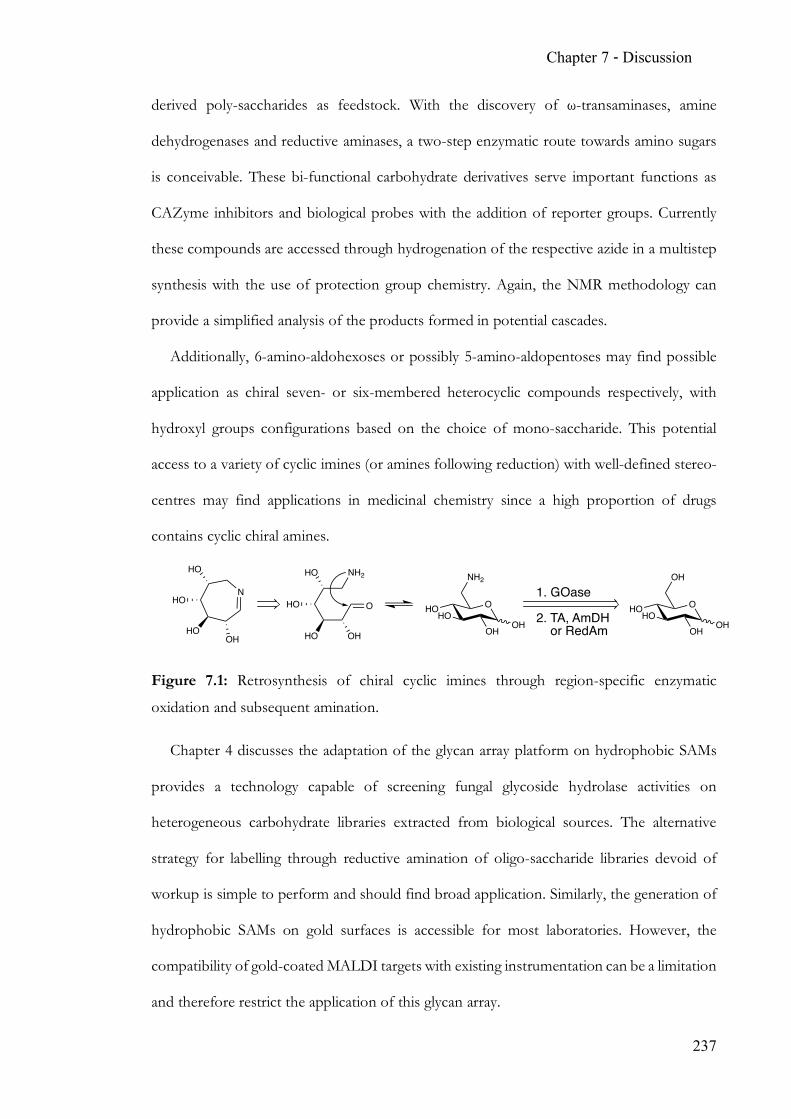
Chapter 7 - Discussion
237
derived poly-saccharides as feedstock. With the discovery of ω-transaminases, amine
dehydrogenases and reductive aminases, a two-step enzymatic route towards amino sugars
is conceivable. These bi-functional carbohydrate derivatives serve important functions as
CAZyme inhibitors and biological probes with the addition of reporter groups. Currently
these compounds are accessed through hydrogenation of the respective azide in a multistep
synthesis with the use of protection group chemistry. Again, the NMR methodology can
provide a simplified analysis of the products formed in potential cascades.
Additionally, 6-amino-aldohexoses or possibly 5-amino-aldopentoses may find possible
application as chiral seven- or six-membered heterocyclic compounds respectively, with
hydroxyl groups configurations based on the choice of mono-saccharide. This potential
access to a variety of cyclic imines (or amines following reduction) with well-defined stereo-
centres may find applications in medicinal chemistry since a high proportion of drugs
contains cyclic chiral amines.
Figure 7.1: Retrosynthesis of chiral cyclic imines through region-specific enzymatic
oxidation and subsequent amination.
Chapter 4 discusses the adaptation of the glycan array platform on hydrophobic SAMs
provides a technology capable of screening fungal glycoside hydrolase activities on
heterogeneous carbohydrate libraries extracted from biological sources. The alternative
strategy for labelling through reductive amination of oligo-saccharide libraries devoid of
workup is simple to perform and should find broad application. Similarly, the generation of
hydrophobic SAMs on gold surfaces is accessible for most laboratories. However, the
compatibility of gold-coated MALDI targets with existing instrumentation can be a limitation
and therefore restrict the application of this glycan array.
OHOHO
OH
OH
1. GOase
2. TA, AmDH or RedAm OH
OHOHO
OH
NH2
OH
HO
HO
HO
OH
OHO
HO
HO
OH
N
NH2
Chapter 7 - Discussion
238
Nevertheless, profiling hydrolytic activity can be a valuable tool to assign biochemical
functions to putative CAZymes mined from metagenome data. Initial experiments are on-
going in order to transfer the (hydrophobic) SAM glycan array technology onto an updated
gold chip format compatible with an in-house MALDI-IM-MS instrument. The addition of
ion mobility separation opens up a new dimension in glycan analysis and will vastly expand
the possibilities of the array technology presented here. In particular the analysis of partially
hydrolysed glycan libraries including branched oligo-saccharides is going to benefit
dramatically.
Conventional structural analysis of poly-saccharides is based mainly on mono-saccharide
composition, linkage analysis and chromatographic separation to determine overall size
distribution. While mono-saccharide analysis requires total hydrolysis of the poly-saccharide,
linkage information is accessible following methylation of the intact saccharide prior to
hydrolysis, subsequent acetylation and gas chromatographic separation of derivatised mono-
saccharides. The use of ion mobility separation of mono-saccharides (generated via collision
induced dissociation) and di-saccharides reveals composition and linkage information is an
elegant, in-line technology compared to time consuming chemical hydrolysis and
derivatisation.
Chapter 7 - Discussion
239
Figure 7.2: Schematic of traditional saccharide analysis workflow involving multiple
derivatisation steps followed by GC-MS analysis.
In conclusion, the presented MALDI-ToF screen provides valuable information on the
hydrolytic activity towards mixed linear saccharides. The future addition of ion mobility will
expand the experimental scope and address traditional shortcomings of poly-saccharide
analysis.
While the aforementioned ion mobility separation of glycans is reserved for those with
access to state-of-the-art instrumentation, (N-)glycan analysis still relies heavily on the use of
exo-glycoside hydrolases in order to sequentially and specifically dissect analytes prior to LC-
MS analysis. The α2,6-sialyltransferase presented in Chapter 5 has been demonstrated to act
as α2,6-‘pseudo-sialidase’. The specific removal of α2,6-linked Neu5Ac from complex
glycans and even glycoproteins has potential applications in glyco-engineering settings where
remodelling therapeutic or otherwise active peptides require homogeneous glycosylation.
With the increasing importance of therapeutic glycoproteins (see Table 1.1), quality control
over the specific composition is essential for efficacy and safety of the drug.
OHOHO
OH
OH
Methylation
MeIO OHO
OH
OH
OH
OMeOMeO
OMe
OMe
O OMeO
OMe
OMe
OMe
Hydrolysis
H+OMeO
MeOOMe
OMe
HO OMeO
OMe
OMe
OMeOH
Reduction
NaBD4
CHDOH
CHOMe
MeOHC
CHOMe
CHOH
CH2OMe
CHDOH
CHOMe
MeOHC
CHOH
CHOH
CH2OMe
Acetlyation
Ac2O
CHDOH
CHOMe
MeOHC
CHOMe
CHOAc
CH2OMe
CHDOH
CHOMe
MeOHC
CHOAc
CHOAc
CH2OMe
terminal Glc 4-linked Glc
Chapter 7 - Discussion
240
Furthermore, an α2,6-specific sialidase may find applications in cancer and pathogen
biology. Recent discoveries of hypersialylation in various forms of cancer suggest a
correlation between the extend of terminally sialylated N-glycans (on Fas and TNFR1) and
immune-evasive behaviour of carcinoma cells. The expression levels of the sialyltransferase
ST6Gal-I in abnormal cells is increased and may be countered by a specific α2,6-
‘pseudosialidase’.
Additionally, the human influenza virus recognises and attaches to α2,6-sialylation on host
cells, while most pathogens preferentially bind to α2,3-sialylated glycans which are common
throughout the animal kingdom. This specificity switch is another example of the crucial role
of linkage configuration in terminal sialic acids where the presented CAZyme provides a
diagnostic or potentially therapeutic value.
From an analytic perspective, the linkage discrimination performed on a mixture of
analytes is a first of its kind. Traditionally, a parent ion would have been selected, fragmented
to give the diagnostic fragment and then mobility separated. This novel approach of
fragmenting the entire ion population originating from a heterogeneous sample ensures the
sample wide absence of a Neu5Acα2,6-Galβ1,4-GlcNAc fragment. The imprecise analytical
approach has got the potential to analyse glycomes more globally and provide information
beyond the usual single ion species scope that is present in state-of-the-art ion mobility glycan
analysis.
Chapter 6 offers a novel perspective on the pathobiochemistry of Parkinson’s disease
with respect to the current literature surrounding the correlation between GCase-mediated
lysosomal deficiency and neurotoxcicity.
While the etiology of Parkinson’s disease is still not fully understood, current literature
suggests multiple aspects with aging being the central factor. A significant proportion of the
research on the correlation between Gaucher’s disease and Parkinson’s disease focusses on
the reduced activity of the lysosomal β-glucocerebrosidase, which is the most important
Chapter 7 - Discussion
241
genetic risk factor and the resulting impact on the lysosomal function. Other reports describe
the critical role of the dopamine metabolism and its involvement in neuronal ROS levels.
The identification of a shared chemical motif between the glycolipid glucosylsphingosine and
the neurotransmitter dopamine lead to the discovery of an endogenous modulator of DAT-
mediated dopamine transport. The presented in silico findings are based on a three-stage
homology model of the human dopamine transporter and supported by a significant
reduction of DAT-mediated ASP+ uptake in vitro. Both models used to probe GlcSph’s
influence on DAT are validated against the known inhibitor cocaine. These conclusions form
the basis to connect the currently unrelated but simultaneously observed events of elevated
glycolipid and ROS levels, two key neurotoxicity mediators.
Following publication of the data, further experiments are anticipated targeting
intracellular ROS levels, additional in vitro experiments with neuronal cell models and in
particular VMAT-2 inhibition are planned to complement the data presented so far. The
vesicular monoamine transporter 2 is of central importance in the dopamine homeostasis
and is likely to be affected by GlcSph because of VMAT-2’s structural similarity to DAT.
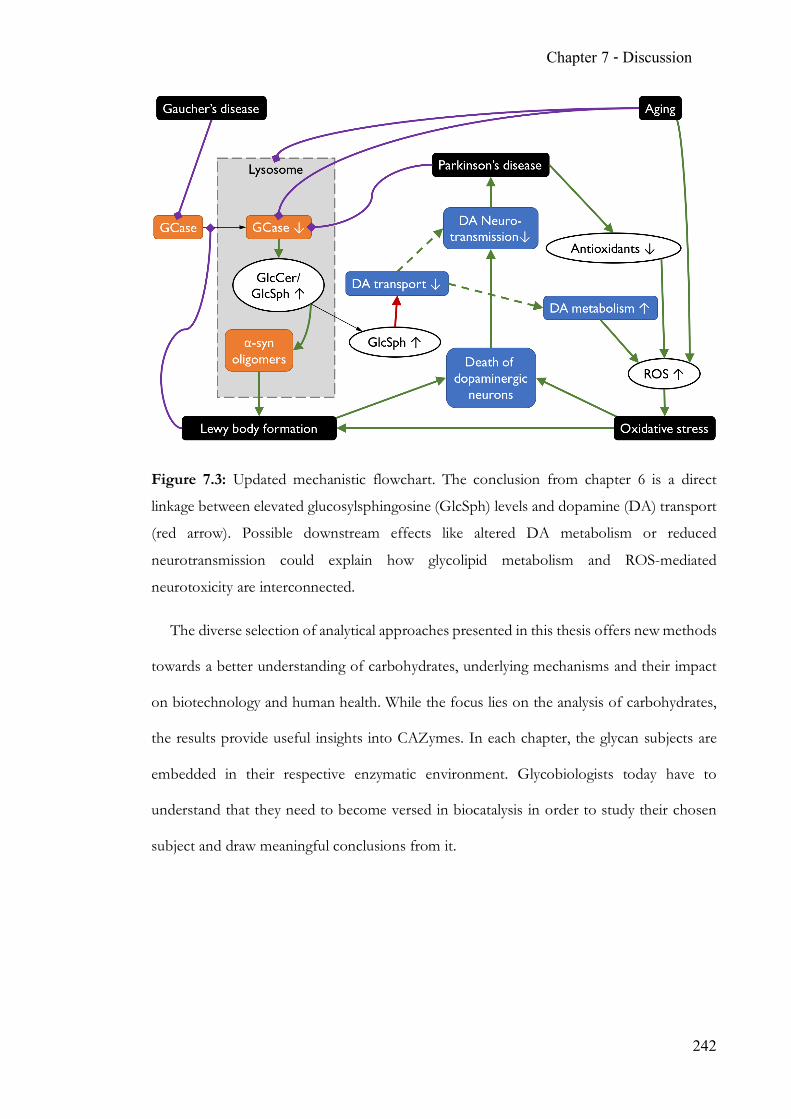
Chapter 7 - Discussion
242
Figure 7.3: Updated mechanistic flowchart. The conclusion from chapter 6 is a direct
linkage between elevated glucosylsphingosine (GlcSph) levels and dopamine (DA) transport
(red arrow). Possible downstream effects like altered DA metabolism or reduced
neurotransmission could explain how glycolipid metabolism and ROS-mediated
neurotoxicity are interconnected.
The diverse selection of analytical approaches presented in this thesis offers new methods
towards a better understanding of carbohydrates, underlying mechanisms and their impact
on biotechnology and human health. While the focus lies on the analysis of carbohydrates,
the results provide useful insights into CAZymes. In each chapter, the glycan subjects are
embedded in their respective enzymatic environment. Glycobiologists today have to
understand that they need to become versed in biocatalysis in order to study their chosen
subject and draw meaningful conclusions from it.
Related Documents