2002 ANNUAL REPORT Deployment strategic Development innovative

Welcome message from author
This document is posted to help you gain knowledge. Please leave a comment to let me know what you think about it! Share it to your friends and learn new things together.
Transcript
2002 ANNUAL REPORT
Deploymentstra teg ic
Developmentinnovative
Contents
1 Company Profile
2 Financial Performance Summary
4 Disclosure Regarding Forward-Looking
Statements
6 Report of the Chief Executive Officer
11 Report on Technology
12 From Fort Worth, Texas, to Yemen
14 From Houston, Texas, to
Mexico’s Burgos Basin and the North Sea
18 From Calgary, Alberta,
to northwestern Alberta and Indonesia
22 From Edmonton, Alberta,
to the Fort McMurray oil sands
24 From Nisku, Alberta, to Veracruz, Mexico
26 From Cheltenham, England,
to Mexico’s Burgos Basin
28 From Hannover, Germany,
to Cold Lake, Alberta
30 The Precision Group of Companies
32 Health, Safety and the Environment
37 Management’s Discussion and Analysis
50 Financial Reporting
74 Corporate Governance
77 Shareholder Information
Glossary
Annual Meeting
The Annual and Special Meeting of the Shareholdersof Precision Drilling Corporation will be held in theMcMurray Room of the Calgary Petroleum Club, 319-5th Avenue SW, Calgary, Alberta, Canada, at 3:00 p.m. (Calgary time) on May 13, 2003.
Shareholders are encouraged to attend and thoseunable to do so are requested to complete the Formof Proxy at their earliest convenience.

Precision Drilling Corporation is an international oil and gas service company that provides a
comprehensive range of services, new and innovative technology, and superior customer service to the
energy industry around the world.
Headquartered in Calgary, Alberta, Canada, we have built on our success as a leader in the Canadian
drilling service industry to include operations on six continents, with regional centers serving Canada, the
United States, Latin America, Europe/Africa, the Middle East, and Asia/Pacific.
Through our Contract Drilling Group, Technology Services Group, and Rental and Production Group, we
provide drilling and service rigs; drilling and completion services; open hole and cased hole wireline
services; controlled pressure drilling; sophisticated downhole tools; logging-while-drilling systems;
directional drilling services; drill bit and tool manufacturing; drilling, completion, and production rental
equipment; and industrial maintenance services.
In 2002, Precision launched the first of a new generation of sophisticated drilling and formation
evaluation tools designed to meet the tough technological challenges of offshore, hostile environments and
high-cost exploration and development.
With these tools, we are taking our Corporation to a new level of technical excellence for the world’s
energy industry, and opening up new potential for profitability and success for both our customers and
our Corporation.
1
P r e c i s i o nProfile

2
InformationHistorical
Share Performance TSX
0
50
100
150
200
TSXPD
020100999998
Share Performance NYSE Value of Shares Outstanding$ Millions
0
500
1000
1500
2000
2500
3000
0201009999980
50
100
150
200
OSXS&PPDS
020100999998
April 30 December 31 April 30 December 31 April 30 December 31
Financial Summary (Stated in thousands of Canadian dollars, except per share amounts, which are presented on a diluted basis)
% %Increase Increase
Years ended December 31, 2002 2001 (Decrease) 2000 (Decrease)
Revenue $1,689,150 $1,953,563 (14) $1,355,453 44Operating earnings (1) 159,021 381,632 (58) 258,214 48Cash flow (2) 194,771 465,673 (58) 297,873 56
Per share 3.55 8.59 (59) 5.91 45Earnings before goodwill amortization 91,265 218,319 (58) 152,874 43
Per share 1.66 4.03 (59) 3.03 33Net earnings 91,265 186,534 (51) 130,113 43
Per share 1.66 3.44 (52) 2.58 33Shareholders’ equity 1,533,000 1,415,979 8 1,206,780 17
Per share 28.35 26.63 6 23.08 15Net capital expenditures (3) 239,543 340,691 (30) 180,484 89Long-term debt (4) 514,878 496,200 4 548,096 (9)Number of shares outstanding, end of year (000’s) 54,067 53,176 2 52,283 2
(1) Refer to explanation on page 37 of this annual report.(2) Funds provided by operations.(3) Excludes business acquisitions.(4) Excludes current portion of long-term debt.

3
Quarterly Summary (Stated in thousands of Canadian dollars, except per share amounts, which are presented on a diluted basis)
Year ended December 31, 2002 Q1 Q2 Q3 Q4 Year
Revenue $ 566,114 $ 345,954 $ 382,830 $ 394,252 $ 1,689,150Operating earnings (1) 114,911 5,767 23,626 14,717 159,021Cash flow (2) 117,273 11,957 25,490 40,051 194,771
Per share 2.16 0.22 0.46 0.73 3.55Earnings before goodwill amortization 66,829 3,327 12,246 8,863 91,265
Per share 1.23 0.06 0.22 0.16 1.66Net earnings 66,829 3,327 12,246 8,863 91,265
Per share 1.23 0.06 0.22 0.16 1.66
Year ended December 31, 2001 Q1 Q2 Q3 Q4 Year
Revenue $ 613,655 $ 409,917 $ 474,016 $ 455,975 $ 1,953,563Operating earnings (1) 159,538 58,024 90,287 73,783 381,632Cash flow (2) 170,345 92,066 109,978 93,284 465,673
Per share 3.12 1.68 2.05 1.74 8.59Earnings before goodwill amortization 88,009 39,053 49,588 41,669 218,319
Per share 1.61 0.71 0.92 0.78 4.03Net earnings 80,059 31,123 41,648 33,704 186,534
Per share 1.47 0.57 0.77 0.63 3.44
(1) Refer to explanation on page 37 of this annual report.(2) Funds provided by operations.
Revenue$ Millions
April 30 December 31
0
500
1000
1500
2000
020100999998
April 30 December 31
0
2
4
6
8
10
020100999998
Cash Flow Dollars per share diluted
April 30 December 31
0
1
2
3
4
5
020100999998
Dollars per share diluted
Earnings Before Goodwill Amortization

Disclosure Regarding Forward-looking Statements
Certain statements contained in this annual report, including statements which may contain words such as
“could”, “should”, “expect”, “estimate”, “likely”, “believe”, “will” and similar expressions and statements relating
to matters that are not historical facts are forward-looking statements including, but not limited to, statements
as to: future capital expenditures, including the amount and nature thereof; oil and gas prices and demand;
expansion and other development trends of the oil and gas industry; business strategy; expansion and growth
of the Corporation’s business and operations, including the Corporation’s marketshare and position in the
domestic and international drilling markets; and other such matters.
These statements are based on certain assumptions and analyses made by the Corporation in light of its
experience and its perception of historical trends, current conditions and expected future developments, as well
as other factors it believes are appropriate in the circumstances. However, whether actual results, performance
and achievements will conform with the Corporation’s expectations and predictions is subject to a number of
risks and uncertainties which could cause actual results to differ materially from the Corporation’s expectations,
including: fluctuations in the price and demand of oil and gas; fluctuations in the level of oil and gas exploration
and development activities; fluctuations in the demand for well servicing, contract drilling and ancillary oilfield
services; the existence of competitors, technological changes and developments in the oil and gas industry; the
ability of oil and gas companies to raise capital; the effects of severe weather conditions on operations and
facilities; the existence of operating risks inherent in the well servicing, contract drilling and ancillary oilfield
services; political circumstances impeding the progress of work in any of the countries in which the Corporation
does business; identifying and acquiring suitable acquisition targets on reasonable terms; general economic,
market or business conditions, including stock market volatility; changes in laws or regulations, including
taxation, environmental and currency regulations; the lack of availability of qualified personnel or management;
and other unforeseen conditions which could impact on the use of services supplied by the Corporation.
Consequently, all of the forward-looking statements made in this report are qualified by these cautionary
statements and there can be no assurance that the actual results or developments anticipated by the Corporation
will be realized or, even if substantially realized, that they will have the expected consequences to or effects on
the Corporation or its business or operations. The Corporation assumes no obligation to update publicly any such
forward-looking statements, whether as a result of new information, future events or otherwise.
4

5
P r e s s u r ePerforming Under

Report of the Chief Executive Officer
TO OUR SHAREHOLDERS, EMPLOYEES, CUSTOMERS AND ASSOCIATES:
In many ways, 2002 was a transition year for Precision Drilling Corporation.
Our vision to develop new, innovative measurement-while-drilling (MWD) and logging-while-drilling (LWD)
tools through the Advantage R & D team progressed through the development phase to deployment, marking a
significant milestone in our five-year strategic plan. We can be proud of this accomplishment, but must
acknowledge that it was not without cost. The commercialization occurred somewhat later than our plan
demanded and the financial results of our Technology Services group suffered accordingly. We remain firm in
our belief that the continued commercialization of these tools will take our Corporation to a new level of
technical excellence and enhance Precision’s ability to profit in the high-margin international drilling technology
marketplace.
The environment in which our Corporation operated also went through a shift, from high activity levels in
North America during 2001 to declining utilization throughout 2002. It was not until December that the Canadian
marketplace experienced a reversal of this trend.
The Contract Drilling group again demonstrated its resilience and ability to reduce costs in the face of a down
market by managing the transition from one extreme to another. They once again underscored their position as
the backbone of the organization, using a simple philosophy of managing costs in line with revenue. They
maintained their position as the premier drilling contractor in Canada, drilling 6,315 wells or over 42% of all
wells drilled, and continued to take a leadership position in safety and technical matters both inside the
organization and in the industry.
As we enter 2003, our Corporation finds
itself on much firmer ground. The rollout of
our new technologies has become reality. Our
internal processes and our cost consciousness
have been strengthened. The outlook for
increased activity within the industry looks
bright, particularly in North America — and
our core businesses remain in a strong
position to profit from a re-energized market.
PERFORMANCE ANALYSIS
There were a number of factors that had
an impact on the Corporation and the
industry in 2002. Allegations of energy
market manipulation and corporate wrong-
doing, political unrest in South America,
global recession, and the looming possibility
of war in the Middle East were just a few of the external economic and geopolitical issues that overshadowed
the year. In Canada, the federal government’s ratification of the Kyoto Accord resulted in the re-examination of
near and long-term business investment decisions in almost all industry sectors.
6
Rig 709The story of Rig 709 is unique in the history of Precision’s
technological and geographical growth, as well as being
representative of the Corporation’s roots. Originally
developed in 1991 to drill in the slant mode under a lake to
reach known oil reserves, it was redesigned in 1996 to
incorporate pull-down capabilities for the pioneering of
SAGD wells in northern Alberta. It traveled to Kazakhstan in
2000 for a 30 well specialized drilling project, then returned
to Canada’s East Coast for a three well project. In 2002, the
rig returned to the eastern hemisphere and is in the process
of drilling its sixth well in India, where its mobility, size,
top-drive, slant capabilities and safety features are
delivering value to another Precision client.
Regardless of how such uncontrollable events unfold, our business has traditionally been driven by one single
factor - commodity prices. Yet 2002 was not a typical year. Uncertainty was pervasive around the world and our
activity did not follow the trend expected from the movement in commodity prices.
In North America, Precision’s main market, commodity prices went through a dramatic shift. High drilling
activity levels in 2001 were followed by a marked decrease in activity throughout 2002. At the same time, sharp
declines in oil and gas prices late in 2001 were followed by a relatively quick recovery in 2002 – but this recovery
did not result in more drilling activity, as would be expected. Rig utilization in Canada did not begin to climb
until December 2002.
There is much speculation as to why our customers did not resume drilling activities in the latter half of 2002.
Some of the theories put forward include uncertainty about whether or not commodity prices and markets would
be sustained, the desire for operators to repair balance sheets and pay down debt, the fact that many were
entrenched in reorganizations, and the integration of recent acquisitions. Also, with the growing number of income
trusts, cash flows were increasingly diverted from operational investments to make distributions to unitholders.
Whatever the causes, the slump in drilling activity in North America was a primary reason why Precision was
unable to sustain the progressive increase in revenues that has characterized recent years. Our Corporation was
able to realize its second-highest-ever revenues: $1.7 billion compared to the record-breaking $2.0 billion achieved
in 2001. But in the area that the Corporation prides itself, profitability, we disappointed our shareholders. Earnings
per share were $1.66, down significantly from $4.03 per share in Precision’s record 2001 year.
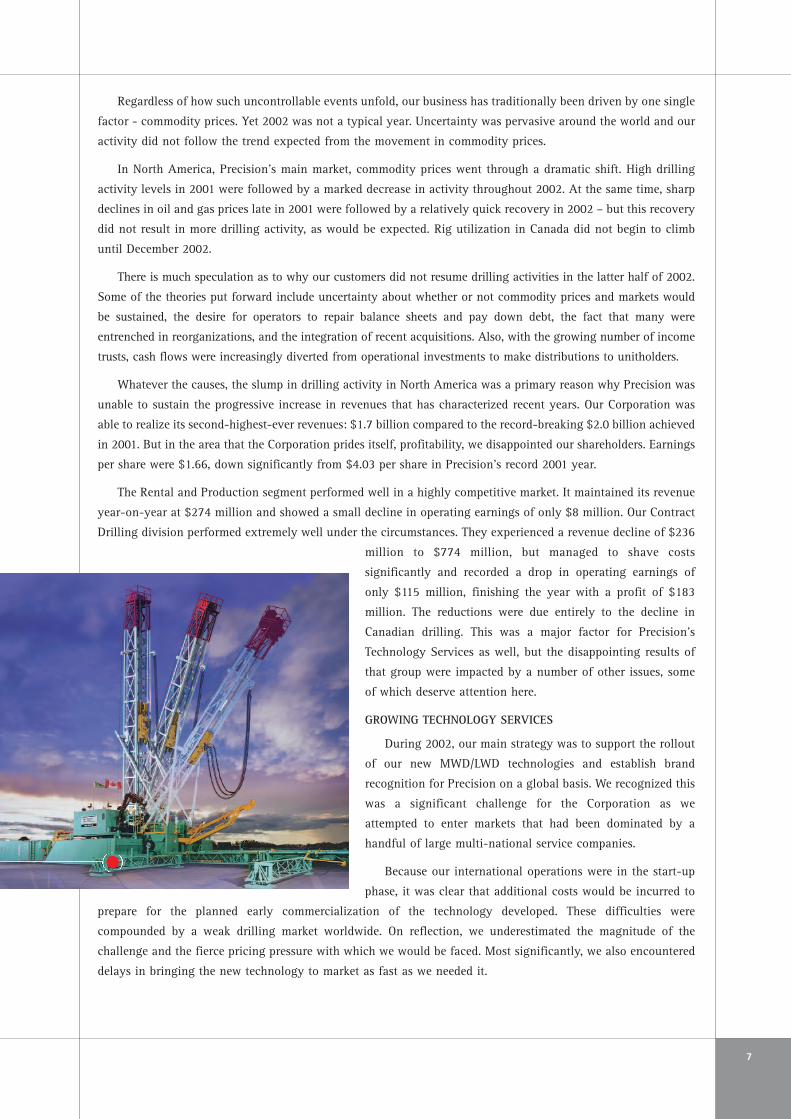
The Rental and Production segment performed well in a highly competitive market. It maintained its revenue
year-on-year at $274 million and showed a small decline in operating earnings of only $8 million. Our Contract
Drilling division performed extremely well under the circumstances. They experienced a revenue decline of $236
million to $774 million, but managed to shave costs
significantly and recorded a drop in operating earnings of
only $115 million, finishing the year with a profit of $183
million. The reductions were due entirely to the decline in
Canadian drilling. This was a major factor for Precision’s
Technology Services as well, but the disappointing results of
that group were impacted by a number of other issues, some
of which deserve attention here.
GROWING TECHNOLOGY SERVICES
During 2002, our main strategy was to support the rollout
of our new MWD/LWD technologies and establish brand
recognition for Precision on a global basis. We recognized this
was a significant challenge for the Corporation as we
attempted to enter markets that had been dominated by a
handful of large multi-national service companies.
Because our international operations were in the start-up
phase, it was clear that additional costs would be incurred to
prepare for the planned early commercialization of the technology developed. These difficulties were
compounded by a weak drilling market worldwide. On reflection, we underestimated the magnitude of the
challenge and the fierce pricing pressure with which we would be faced. Most significantly, we also encountered
delays in bringing the new technology to market as fast as we needed it.
7

The result was a disappointing financial performance for the Technology Services group. Revenue dropped
only $30 million from 2001 to $639 million, but our operating earnings fell by close to $100 million, to a loss
of $41 million. In Canada, revenues were down $63 million while operating earnings declined by $38 million to
$7 million. In the U.S., where we faced lower activity levels, the decision was made not to pare costs, but to
maintain and continue our investment to be ready for the upturn. In hindsight, this was a mistake. Revenues
declined $62 million and operating earnings dropped $60 million to a loss of $25 million.
Internationally, we experienced a significant increase in our marketshare as we grew revenue by
approximately $95 million. Unfortunately, this aggressive revenue growth was matched by increases in
operating, administration and depreciation costs as we continued to build our international infrastructure. The
result was no appreciable change in earnings for the year.
We recognize that getting to the deployment stage of our new technologies has involved a considerable
investment for our Corporation in a relatively short period of time. We have learned a tremendous amount in the
last 12 months and have recognized our mistakes, but we are also firmly committed to our strategy. We will
continue with the commercialization of our new tools as our highest priority. This is the cornerstone of our plan
to establish ourselves as a global oilfield service player and provide the long-term returns expected by our
shareholders.
We will not, however, pursue a “growth at all costs” strategy. In 2003, Precision is focused on profitable
growth in areas where we can obtain premium returns. In the first quarter of 2003, we have already completed
a review of our cost structure and have made a number of cuts in the global organization. Management changes
have been made that reflect our transition to a focused, cost-control environment. Our Technology Services group
has now been restructured and the direction is clear: return on investment comes first.
LOOKING AHEAD
We are optimistic about the immediate future, especially in
the Canadian marketplace.
We expect a significant turnaround in drilling activity in
North America in 2003, perhaps to levels as high as those
achieved in 2001. The reason is simple. While oil is the fuel of
choice on a global basis, natural gas is a significant and growing
energy source for the North American economy. In 2002, we
went from a situation where gas storage was full to now being
at its lowest levels in five years. Reserves must be added, and
quickly. By early 2003, we had already seen heightened activity,
which we expect to continue well into 2004.
This is good news for all of Precision’s product lines. We
expect Contract Drilling to be operating flat-out in Canada in
2003. Our leading-edge technology and fleet of specialized
rigs will continue to give us a competitive edge in making the
most of today’s drilling environment. Our advanced coiled
tubing technology has helped us capitalize on the preference for shallow gas drilling in the Western Canadian
Sedimentary Basin. Our fleet of deep drilling rigs is the largest in Canada, while our expertise in specialized
drilling services for Steam Assisted Gravity Drainage (SAGD) projects, which we helped pioneer, is ideal for
clients developing the heavy oil and oil sands of northern Alberta.
8
Restructured and re-focused, the Technology Services team is poised to have a very successful year, especially
in Canada and the United States. Their new tools will continue to roll out to our regional centers throughout
2003 and we believe we will start to demonstrate to our customers the superior performance of our technology.
Our new PrecisionLWD™ system, designed to operate at depths and in hostile environments where traditional
tools cannot operate, has performed beyond expectations in field tests. We are also very excited about the new
4 3/4 in. Revolution™ rotary steerable system that has now successfully completed trials and is approaching full
commercialization.
In Latin America, there are signs of increased activity, despite the political and economic instability which
affected Precision’s operations in Venezuela in 2002. Our integrated services project in the Burgos Basin of
Mexico continues to be a major success story, and the original 240 gas well project is now expected to involve
the drilling of more than 300 wells.
In other areas of our business, CEDA remains a key and profitable part of our Corporation. It is likely to follow
up its record-breaking performance last year as the clear leader in the Canadian turnkey industrial maintenance
and turnaround markets. It is already viewed as the premier company in North America in offering specialized
catalyst services to refinery and petrochemical plants in Canada and the United States.
In early 2003, Precision bolstered its balance sheet with the sale of Energy Industries for $60 million. Energy
Industries, which specializes in compression equipment packaging, sales, service and rental, was a well-run
organization with an industry-leading management, sales and technical team. It was not, however, a business
that Precision could expect to grow significantly, particularly on a global basis. The sale should benefit both
Precision and Energy Industries.
As always, we will continue to emphasize our
commitment to health, safety and environmental
(HSE) practices in 2003. At Precision, achieving
excellence in health and safety is a priority. In
2002, the Corporation’s statistics for overall lost
time due to incidents continued to outstrip the
industry average, while our safety performance
earned us $1.3 million in performance rebates from
Canadian workers’ compensation boards. Both
achievements demonstrate the success of our
efforts to protect our people and ensure they are
receiving effective messages about safety.
We will also continue to take environmental
issues seriously. We were proud to receive the
ranking as the most environmentally responsible
oil and gas service company in Canada from a
national organization focused on corporate social
responsibility. This will ensure that we set the bar
even higher in the coming year.
9
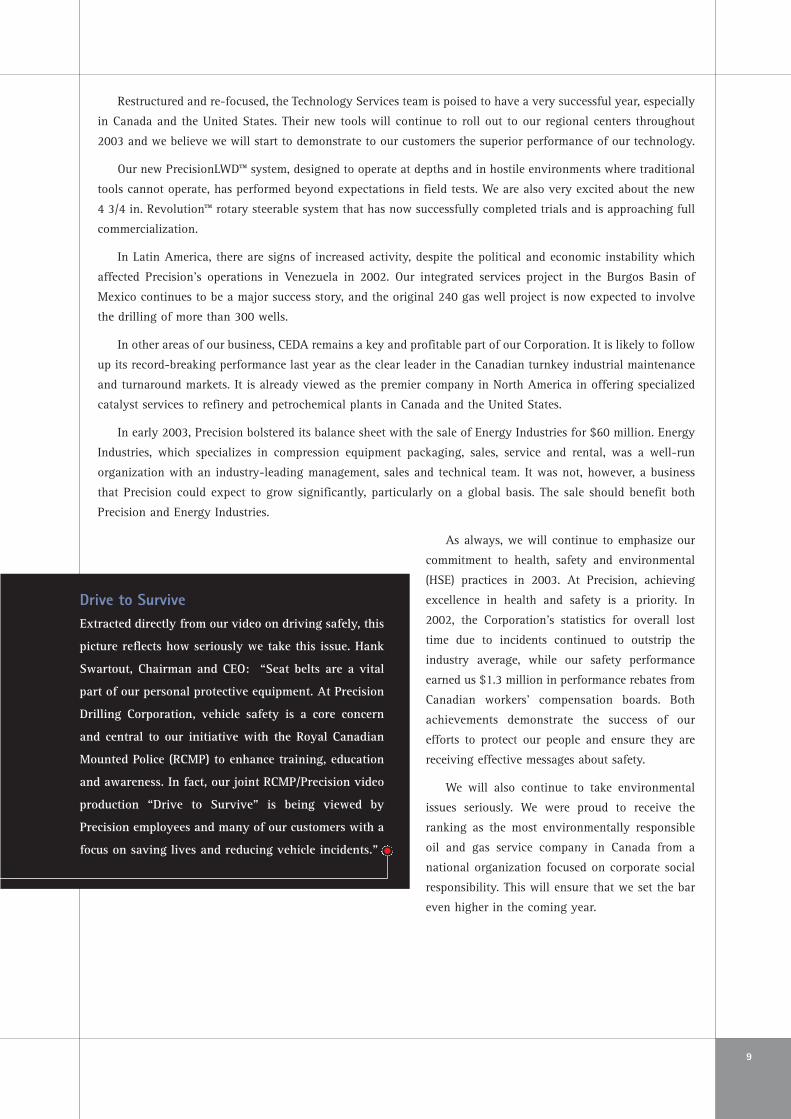
Drive to Survive Extracted directly from our video on driving safely, this
picture reflects how seriously we take this issue. Hank
Swartout, Chairman and CEO: “Seat belts are a vital
part of our personal protective equipment. At Precision
Drilling Corporation, vehicle safety is a core concern
and central to our initiative with the Royal Canadian
Mounted Police (RCMP) to enhance training, education
and awareness. In fact, our joint RCMP/Precision video
production “Drive to Survive” is being viewed by
Precision employees and many of our customers with a
focus on saving lives and reducing vehicle incidents.”

TAKING PROACTIVE STEPS
As we head into 2003, we are fully aware of the potential for market volatility that characterizes our business.
We will focus on our core businesses and work to increase the efficient operation of all of our business units.
Much work was already done in this area in 2002. Our Contract Drilling group increased internal efficiencies
and effectiveness by flattening its management structure, tightening cost controls in deployment and use of
assets, and integrating technology with people. The group’s four operations centers were consolidated into two
centers located in Calgary and Nisku, Alberta, while the engineering team was brought together into one facility.
Improvements were also made in communications systems to support our rigs in terms of standards and safety,
ensuring that all customers get the same package of quality service.
Corporate-wide, we are improving our information systems to provide our people with better, more timely
information about our customers and our operations. We are currently in the midst of a project to implement an
integrated information system within Technology Services to replace a myriad of systems inherited from
numerous acquisitions. This system will integrate Technology Services more closely with the Contract Drilling
group and allow them to benefit from a number of the process efficiencies already enjoyed by the rest of the
organization.
We are proud of the success we had in launching our new technologies in 2002 and in positioning Precision
as a provider of the sophisticated tools and services that are the future of the industry. In 2003, we will stay the
course in developing our technological edge, while enhancing operational and administrative cost control. We
have transitioned ourselves in 2002 to be a more global player and have paid the admission price to put us on
the map. We will continue that transition by growing our global footprint and our market share with our
expertise in drilling, wireline and MWD/LWD.
The engine for that growth will continue to be Contract Drilling.
Precision’s success and growth as a global company has been built on the foundation of long-term customer
relationships gained over the years by delivering quality service with leadership in innovative technology and
oilfield equipment. We recognize that in order to maintain our current customer loyalty and expand our customer
base, both domestically and internationally, we must strive to continually reinforce this basic principle of
customer focus. Our Corporation has distinguished itself from the competition by the high standards we practice
in the field, the ability to deploy rigs and drill wells in record time, and the strength of our marketing and
technological expertise. These differentiating factors all boil down to one common element: the quality of our
people and of their outstanding performance.
On behalf of Precision’s senior management and Board of Directors, I extend our appreciation to every
member of our team around the world.
Hank B. Swartout
Chairman of the Board, President and Chief Executive Officer
March 21, 2003
10

The following section highlights the development and deployment of some of Precision’s new
technologies. Details of Precision’s operations during 2002 are included in Management’s Discussion and
Analysis (page 37). For a description of our Corporation and its history, please refer to the 2002 Renewal
Annual Information Form, a hard copy of which may be obtained through Precision’s Corporate Secretary.
It is also available on the Internet at www.precisiondrilling.com.
Development
In 1999, as part of our global growth strategy, Precision embarked on an ambitious research and
development program to develop the high-end technology capabilities that would allow us to compete as a
major player on the international market.
Precision was already a Canadian leader in providing products and services for cased hole, open hole and
directional drilling. However, we recognized the huge technological leap that would be required to take us
from our existing technology, designed to operate within Canada’s benign environment, to the sophisticated
technology needed to succeed in more challenging environments around the world.
We made that leap by breaking the traditional mold in research and development. We identified key
technologies that would support our growth; created a dedicated group to focus on technology services;
capitalized on existing expertise by hiring the proven leaders in their field; established research and
development centers in areas where that expertise was concentrated; and created distribution channels
through regional centers in Canada, the United States, Latin America, Europe/Africa, the Middle East, and
Asia/Pacific.
Deployment
Unencumbered by an established research and development hierarchy, or an inventory of existing tools
that required retrofitting, Precision moved quickly ahead in creating drilling and formation evaluation tools
that offered a whole new level of performance benefits.
By 2002, a number of those tools were already being used by clients around the world, with more poised
for commercialization early in 2003.
11
TechnologyReport on

12
Fort Worth, Texas
Getting a Clearer Picture with Wireline Technology
When Precision acquired Computalog Ltd. in 1999, it also acquired considerable expertise
in manufacturing and research and development of new wireline technologies. Computalog’s
research and development group, located in Fort Worth, includes some of the best engineers,
physicists, software developers and mechanical designers in the industry.
Specializing in open and cased hole wireline tool
development, including completion services, the Fort
Worth team introduced significant new products in
2002.
In addition to the new High Resolution Micro
Imager (HMI™) tool, which is used to image reservoir
features and provide high resolution data about
subsurface formations, Computalog launched a number
of other state-of-the-art tools. These included a Spectral
Gamma Ray tool that is used in formation evaluation
and enables Precision to effectively compete in high-
technology wells, and the Flow Rate Tester (FRT)® tool,
a new generation formation fluid sampling tool that
provides rapid multiple downhole tests for real-time
logging of reservoir production potential. Another
Computalog product, the Hi-Temperature Slim Sector
Bond™ tool, has a diameter of just 42 mm (1 11/16 in.)
and is setting new standards for cement bond
evaluation in cased holes by successfully logging wells
at temperatures up to 218˚C (425˚F).
In 2003, Computalog will be expanding its research,
development and training activities by adding a new
4,300 square meter (46,000 square foot) facility
adjacent to the manufacturing facility in Fort Worth.
High Resolution Micro Imager (HMI™) ToolThe HMI™ tool uses electrical imaging to
make it possible to visualize the borehole in
real time, showing sedimentary features,
cross-bedding, fractures, thin beds and
structural features such as bed dip, direction,
faults and reservoir structure. This
sophisticated tool features six independent
arms, each with a pad of 25 buttons that
gather the high-resolution data customers
need to visualize complex subsurface
structures. The wellbore is sampled at a rate
of 400 samples per meter (120 samples per
foot) to give clients excellent imaging
coverage and fine vertical resolution.
Development

13
DeploymentYemenPrecision’s HMI™ tool is on site in Yemen where it ishard at work for a large international energy companyoperating in that country’s Masila Block. The project,involving three open hole and two cased hole units,was awarded to Precision in June 2002. A camp facilitywas set up, equipment mobilized and operations begunby September. The HMI™ tool provided our client withvaluable information which was used to determinetheir development well program.

Houston, Texas
Achieving the Advantage in Drilling and Formation Evaluation Technology
Created by Precision as a new research and development group in 1999, Advantage
R & D, Inc. was located in Houston to draw on the area’s proven expertise in the design and
development of high-end formation evaluation tools for the energy industry.
Advantage employs more than 60 staff, including engineers, physicists and technicians,
focused on creating innovative measurement-while-drilling (MWD) and logging-while-drilling
(LWD) technology. A state-of-the-art facility combines a first-class work environment with the
latest in computer modeling technology, personnel training, manufacturing capabilities, and
testing facilities.
Advantage’s initial development efforts focused on a directional gamma ray MWD tool
designed to give clients increased reliability and workability in extreme environments. The
Hostile Environment Logging (HEL™) MWD system has demonstrated unprecedented
capabilities for operations at high temperatures, under high pressures and at high flow rates.
It is the backbone of an emerging suite of tools capable of operating in hostile environments,
including the sophisticated PrecisionLWD™ system.
LWD systems are used to gather information about the formation being drilled, the well
path, and other parameters used to monitor downhole drilling conditions. The PrecisionLWD™
system is specifically designed for challenging ultra-deepwater drilling environments, which
includes wells with high pressures, fast drilling rates, or that require high circulation rates.
14
Development
PrecisionLWD™ SystemThe new PrecisionLWD™ system is designed to address the shortcomings of the LWD systems that are
currently available to deepwater operators, while also meeting their requirements for the future. With this
new system, operators can successfully log wells while drilling up to 122 meters (400 feet) per hour. The
PrecisionLWD™ system also operates at pressures up to 30,000 psi, which allows deeper wells to be drilled
successfully. Before the PrecisionLWD™ system was introduced, operators had to rely on systems that could
log at only 61 meters (200 feet) per hour, at pressures of only 25,000 psi.
Continued on page 16

15
Burgos Basin, MexicoThe PrecisionLWD™ system
has been used successfully
in Mexico’s Burgos Basin,
combining the HEL™ MWD
system with the Multi-
Frequency Resistivity
(MFR™) tool. This system,
coupled with new density
and neutron porosity tools
to be commercialized in
2003, will form a triple-
combo LWD service that
will allow operators to
make complete formation
evaluation decisions.
Deployment

With the PrecisionLWD™ system, the engineers at Advantage have created a versatile
drilling and formation evaluation platform that can transmit data using either mud-pulse or
electromagnetic (EM) technology. Typical MWD
systems rely on mud-pulse telemetry to transmit data
from downhole to the surface, with data quality
potentially limited by such factors as drilling fluid flow
rates, pressure drop at the bit, and drilling fluid that
may be lost to the formation.
EM technology is not affected by these drilling
factors and can create substantial savings in drilling
time and project costs. This ensures that downhole
information can be obtained during all phases of a
drilling operation, including underbalanced drilling.
Together, Advantage’s new MWD, LWD and EM tools
have given Precision entry into high-temperature, high-
pressure and high-margin markets around the world.
16
EMpulse™Electromagnetic SystemElectromagnetic (EM) MWD
technology allows downhole
real-time drilling data to be
transmitted independent of rig
hydraulics and without impact to
rig operations. The EMpulse™
electromagnetic MWD system uses
low-frequency electromagnetic
waves to transmit downhole data
in real time to the surface during
conventional and underbalanced
horizontal and directional drilling
operations. EM telemetry trans-
mits information through the
formation to a surface antenna,
where it is received and sent to a
data acquisition system to be
decoded and processed.
Development
From page 14
17
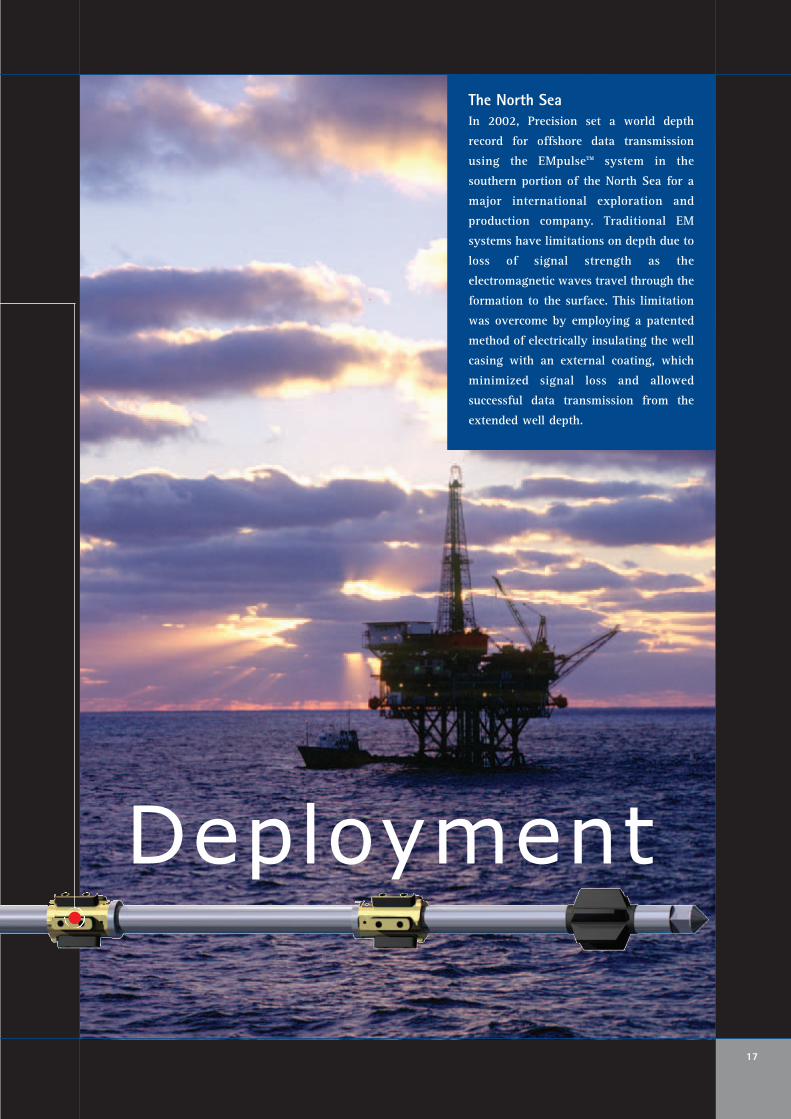
Deployment
The North SeaIn 2002, Precision set a world depth
record for offshore data transmission
using the EMpulse™ system in the
southern portion of the North Sea for a
major international exploration and
production company. Traditional EM
systems have limitations on depth due to
loss of signal strength as the
electromagnetic waves travel through the
formation to the surface. This limitation
was overcome by employing a patented
method of electrically insulating the well
casing with an external coating, which
minimized signal loss and allowed
successful data transmission from the
extended well depth.

Calgary, Alberta
Centralizing Expertise to Support Drilling and Completions
Under the umbrella of Precision’s Research and Development Canada (R & D Canada)
group, three specialized teams were brought under common management and one roof in the
fall of 2002.
The Edmonton, Alberta engineering team of Computalog Drilling Services was
consolidated with the Polar Completions and Flow Rate Tester (FRT)® tool development groups
in Calgary to help speed the delivery of critical technologies to the field and enhance financial
performance by sharing engineering services within Precision.
R & D Canada designs and manufactures ancillary products and technologies to support
major projects at other Precision centers, and also designs and launches its own products for
which a market has been identified. The group is located in a 7,300 square meter (79,000
square foot) research and manufacturing center in Calgary which is equipped with test
facilities and ultra-modern, computer-controlled machine tools capable of producing any
downhole equipment under stringent quality assurance systems
In 2002, in partnership with Polar Completions, R & D Canada introduced the Z-Frac™
Selective Stimulation System, comprised of several downhole tools. The system allows a
hydraulic fracturing operation to be performed on multiple zones within a wellbore in a single
run, saving customers time and money.
18
DevelopmentZ-Frac™ Selective Stimulation ToolThe Z-Frac™ tool gives operators the ability to perforate and fracture multiple zones in a single
run, cutting days off conventional completion programs and saving costs. With the Z-Frac™ tool,
operators can work in hostile fluids at pressures as high as 10,000 psi. This tool also features a
downhole shutoff valve, which allows the tool string to be placed and moved within the wellbore,
under pressure, without the use of wireline blanking plugs. To date, the
Z-Frac™ tool has performed with no mechanical failures.
Continued on page 20

19
Deployment
Northwestern AlbertaAn operator in northwestern Alberta
needed a way to cost-effectively
fracture multiple zones at high
pressures. The Z-Frac™ tool’s straddle
packer technology, combined with
Precision’s snubbing services,
allowed the operator to perform
single trip, multi-zone sand fracture
treatments at savings of between
$80,000 to $100,000 per well over
conventional multi-zone frac
programs. While initial development
of the Z-Frac™ tool focused on 5 1/2
in. casing strings, the tool is now so
popular that two prototypes for other
sizes of casing are being tested in
early 2003.

R & D Canada also introduced the Vari-Cone™ liner hanger system, which offers operators
more options for choosing downhole equipment configurations. Because of that flexibility, the
Vari-Cone™ system increases Precision’s competitive edge, giving customers access to a high-
end technology that was previously available only through a handful of large multinational
companies. In 2002, development of Vari-Cone™ technologies resulted in four patents pending.
A number of other sophisticated technologies
and products have been engineered by R & D
Canada and were either launched in 2002 or
expected to be in the field early in 2003.
These include the Selective Set Open Hole
Straddle Packer, currently the only system that
exclusively uses tubing hydraulics to operate
downhole assemblies. It allows operators to
selectively test isolated zones within horizontal
wells to determine their potential and/or stimulate
production. Other R & D Canada products include a
Coiled Tubing Orienter to control direction of
drilling by discrete changes of circulation; a
Variable Gauge Stabilizer which can modify the
bottomhole assembly configuration hydraulically
without tripping out; and larger-diameter additions
to Precision’s line of mud-lubricated drilling
motors to complement the HEL™ MWD system.
20
Vari-Cone™ Liner Hanger SystemPrecision’s Vari-Cone™ liner hangers are
available in single or multiple cone
configurations. They feature a proprietary
Scabbard Slip™ system that provides
superior slip protection, drill-down
capability with a unique rotational lock
mechanism, improved flow dynamics
during well conditioning and cementing
operations, and a locking collet to prevent
premature mechanical shearing of the slip
assembly during run-in. The system also
includes, as a standard, safety features
normally associated with premium liner
systems.
DevelopmentFrom page 18

21
Deployment
IndonesiaIn 2002, Indonesia’s
national oil company
became the first Precision
client to deploy Vari-Cone™
liner hangers, which were
installed on land in Java
and in northern Sumatra.
Both systems featured
Vari-Cone™ tandem cone
liner hangers with integral
liner top packers. By early
2003, several Vari-Cone™
liner hangers had been
installed successfully.

Edmonton, Alberta
Breaking New Ground in Maintenance and Safety
Precision’s research and development team in Edmonton is
an integral part of CEDA International Corporation (CEDA),
the only Canadian company offering turnkey industrial
maintenance and turnaround services to the energy industry.
CEDA’s research and development efforts have grown out of
its unique knowledge and experience, with the focus on
developing new tools and applications that are marketable in the
field. The new SuperLance™ tool is an outstanding example.
Working in collaboration with a large producer of crude oil
from oil sands, CEDA developed this revolutionary tool for
removing coke buildup, which largely determines when a coker
unit must be shut down for maintenance. Conventional lancing
systems provide only limited access to the curved section of the
coker snout and no access to the entire gas outlet tube piping.
Drawing upon Precision’s experience in coiled tubing
drilling, CEDA adapted water blasting technology into a coiled
lance that allows full access into the snout and gas outlet tube
piping. The SuperLance™ tool performs online coker maintenance
in a fraction of the time of conventional methods, with no
shutdown in production, and with much reduced safety risk. It
ultimately provides our clients with a new dimension in “online
cleaning” unparalleled by traditional means. This process can be
used in other cleaning applications that only months ago were
considered impossible tasks.
22
The SuperLance™ SystemUsing the SuperLance™ system, a
coil of about 24 meters (80 feet) of
tubing is fed into a coker unit with
a hydraulically-powered chain
driver. The tubing’s tip is equipped
with multi-directional water
cutting jets that blast away the
coke buildup with high-pressure
water at 7,500 psi. Greater crew
safety comes from the automated
design of the lance injection
process during the cleaning
operation. The new hydraulic-
driven injection system is operated
remotely from the vessel nozzle,
while the conventional method
requires a crew to work at the
nozzle where the snout lance is
injected.
Development

23
Fort McMurray, AlbertaDuring field testing in October 2002, the
SuperLance™ system found immediate
success at an Alberta oil sands refinery,
working flawlessly through initial field
trials. The client was able to successfully
clean the reactor snout and gas outlet tubes.
The automated cleaning processes also
proved beneficial in improving the safety of
the entire snout lancing process. Although
developed for the energy industry, there is
considerable potential for adapting the
SuperLance™ system to improve
maintenance practices in other industries.
Deployment

Nisku, Alberta
Getting More Bite from Drill Bit Technology
Strategically located in the supply and service corridor serving the drilling industry in Alberta, United
Diamond Ltd. was formed by Precision in September 2000 to focus on polycrystalline diamond compact (PDC)
drill bit technology. PDC bits drill with more speed and durability than traditional bits in many formations.
Now Canada’s largest steel-bodied PDC drill bit manufacturer, United Diamond has an aggressive research
and development program aimed at creating even more stable and durable PDC drill bits. It employs the latest
in cutter technology with superior abrasion resistance.
In 2002, United Diamond continued to invade traditional rollercone drill bit territory when the research and
development team in Nisku introduced the TorkBuster™ tool which gives their PDC bits an added edge. This tool
increases rates of penetration, drills harder formations at even faster rates, and maintains steady and reduced
torque in drillstrings.
With the launch of the TorkBuster™ tool and the growing demand for PDC bits, United Diamond has already
outgrown its original 700 square meter (7,500 square foot) shop. In the spring of 2003, United Diamond is
moving into a new facility of almost triple the size which allows more room for manufacturing, an expanded
welding and repair center, TorkBuster™ tool repair, inventory, and operations personnel.
24
The Torkbuster™ ToolThe TorkBuster™ tool runs above the PDC bit in both rotary and directional drilling assemblies to
help the bit shear the formation being drilled. The tool provides a high frequency, radially-directed
impact to the bit which increases the rate of penetration, allows harder formations to be drilled at
faster rates, and maintains a relatively small, steady torque level in the drillstring. Reducing torque
in the drillstring improves the reliability of mud motors, downhole tools and other assembly
components. It also allows for a smoother well path and reduced fatigue on drillpipe, drill collars
and tool joints.
Development

25
Deployment
Veracruz, MexicoThe TorkBuster™ tool has been deployed in Mexico to drill tough carbonate formations
in the Veracruz area. Combined with a Computalog Commander® mud motor and a
PDC drill bit from United Diamond, the TorkBuster™ tool has tripled the average rate
of penetration.

Cheltenham, England
Gaining more Control with Rotary Steerable Technology
Smart Stabilizer Systems Ltd., Precision’s newest research and development group, is based in Cheltenham,
England, where rotary steerable technology was created and where a large pool of engineering suppliers support
the technology. The acquisition of BecField Drilling Services Ltd. in 2000 connected Precision to the existing
local expertise, and to the potential for creating our own suite of state-of-the-art tools.
Rotary steerable systems allow operators to orient and control the well
trajectory while rotating the drill string. The result is faster penetration
rates, smoother wellbores, and fewer doglegs than in wells drilled by
conventional methods using mud motors.
Precision’s new Revolution™ rotary steerable system is the first 4 3/4 in.
rotary steerable system to use point-the-bit technology to improve borehole
quality and bit life, which translates into enhanced efficiency and cost
savings. For our customers, the small tool diameter opens up different size
and casing design options, and helps them realize the better bottom line
benefits that smaller boreholes have on drilling and completion costs. By
designing the 4 3/4 in. tool size first, Precision reduced the engineering
challenges associated with producing the Revolution™ system in larger tool
sizes, as well as shortening time to market and gaining better control of
research and development costs.
Smart Stabilizer Systems moved into a new 1,300 square meter (14,000
square foot) research and development facility in 2002. The site features the
latest high-tech assembly, testing and quality inspection equipment, and uses
the latest 3D computer-aided design techniques.
In 2003, Smart Stabilizer Systems will focus on delivering tools for
larger hole sizes and on further integrating near-bit sensors to help optimize
the drilling process.
26
Development
Revolution™ Rotary Steerable SystemThe first 4 3/4 in. rotary
steerable system to use point-
the-bit technology to control
the well path, Precision’s
Revolution™ system is fully
integrated with the
PrecisionLWD™ system. The
short, compact design of the
Revolution™ system reduces the
complexity of rotary steerable
drilling technology while
placing critical LWD
measurements close to the bit.

27
Burgos Basin, MexicoFirst deployed successfully in Alberta on the drilling of
a directional well southeast of Calgary, the Revolution™
rotary steerable system helped Precision’s customer
control the hole deviation and direction much more
efficiently than by using conventional mud motors.
By early 2003, the Revolution™ system was also being
used as part of Precision’s integrated services project in
Mexico’s Burgos Basin. The system was used to
efficiently drill a vertical well in a single run, in an
area where formation influences had always
necessitated directional correction runs.
Deployment

Hannover, Germany
Keeping Logging Tools on Track
Located in Hannover, Precision’s directional drilling research and development center in Germany, System
Entwicklung und Simulation (SES) or System Development and Simulation, was acquired with the purchase of
BecField Drilling Services Ltd. in 2000.
The SES facility incorporates both research and manufacturing elements. A nearby test well allows tools in
development to be tested under real-world conditions and provides a training venue for international operators.
The center was used in the 1990s to develop, manufacture and support a MWD system. This system is still
the basis of Precision’s directional drilling service business in Europe/Africa and the Middle East.
More recently, a team of wireline engineers and
operators manufactured the new PrecisionTrac™
wireline conveyance system — a system that helps
operators perform wireline logging jobs in highly
deviated wells.
Other products currently under development in
Hannover include a turbine generator power system
with potential for reducing LWD costs and enhancing
the operating range of the EMpulse™ electromagnetic
MWD system. Work also continues on a new high-
temperature mud-pulse telemetry system with
improved data rate capability, and a new
communication method for relaying commands from
the surface to the Revolution™ rotary steerable
system.
28
PrecisionTrac™ Wireline Conveyance SystemWith the PrecisionTrac™ system, customers can
get logging and completion tools to the bottom of
any wellbore. The system allows standard
logging tools to be run on wireline cable in
horizontal wells. Technical modifications by
Hannover engineers also allow Precision’s new
tool to perform in deeper, hotter wells, reducing
clients’ costs. The PrecisionTrac™ system can also
be used to fire perforating guns and set
production packers.
Development

29
Cold Lake, AlbertaExtracting the millions of barrels of heavy
oil that lie below the plains of Alberta and
Saskatchewan in western Canada utilizes a
special technique called Steam Assisted
Gravity Drainage (SAGD). In 2002, a leading
independent oil and gas company used the
PrecisionTrac™ wireline conveyance system
to deploy a ranging tool needed to ensure
accurate well spacing for use of SAGD. The
PrecisionTrac™ system eliminated the need
for the tanks and pumping capabilities
normally required for this procedure.
Deployment

NATURE OF BUSINESS NAME OF BUSINESS LOCATION EQUIPMENT AND FACILITIES
CONTRACT DRILLING GROUP
Contract Drilling Precision Drilling Canada 227 drilling rigs(34% of the industry in Canada)
Precision Drilling International International 16 drilling rigs
Well Servicing Precision Well Servicing Canada 240 service rigs(26% of the industry in Canada)
Rig Assist Snubbing Live Well Service Canada, 23 snubbing units International (33% of the industry in Canada)
Camp and Catering Services LRG Catering Ltd. Canada 74 oilfield camps
Supply Procurement Columbia Oilfield Supply Ltd. Canada 40,000 square foot warehouse and Distribution and distribution facility
Drilling Equipment Engineering Rostel Industries Ltd. Canada 48,000 square foot yard and Manufacturing and shop facility
TECHNOLOGY SERVICES GROUP
MWD/LWD and Computalog Drilling Services Canada, U.S., 135 drilling systemsDirectional Drilling Services International
Wireline Logging and Computalog Wireline Services Canada, U.S., 46 open hole units, 177 casedPerforating Services International hole units, 8 slickline units,
2 barges with cased hole skids
Plains Perforating Ltd. Canada 24 cased hole units, 10 slicklineChallenger Wireline units, 4 mechanical units,
6 combination units
Controlled Pressure Drilling Northland Energy Canada, U.S., 179 well testing systems, and Well Testing International 44 RBOP® rotating blowout
preventers, 22 controlledpressure drilling systems
Completion Products Polar Completions Canada, U.S., 55,000 square foot yard and Services Engineering Inc. International and manufacturing facility
Pressure Pumping Services Fleet Cementers, Inc. U.S. 16 cement units, 8 acid units, 1 fracturing spread, 1 sand delivery unit, 2 nitrogen units, 7 coiled tubing units,1 cement testing facility
PDC Drill Bits United Diamond Ltd. Canada, U.S., 19,000 square foot facility, International manufacturing and operations
support for 400 jobs/month
RENTAL AND PRODUCTION GROUP
Industrial Maintenance CEDA International Corporation Canada, U.S. 166 vacuum trucks, and Turnaround Services 79 high-pressure units,
14 bundle blasters
Natural Gas Compression Energy Industries Inc. Canada 90,000 square feet of Services (sold effective January 1, 2003) production capacity
Surface Oilfield Equipment Smoky Oilfield Rentals Canada 3,600 surface unitsRental and Transportation
Downhole Drilling Big D Rentals Canada 10,000 joints of specialty Equipment Rental drill stem, 4,000 tools
Wellsite Accommodation Rental Ducharme Oilfield Rentals Canada 281 trailers
Total employees, including contracted and project management individuals, as at December 31, 2002: 9,365
30

31
ResponsibilityRaising the bar in Corporate

Health, Safety and the Environment
Just as 2002 was a year for achieving new heights in technological development, it was also a year for
Precision to raise the bar on its health, safety and environmental (HSE) practices.
In fact, the downturn in drilling activity gave Precision the opportunity to consolidate HSE management
systems; intensify training efforts so field personnel were ready to perform at the highest possible standards
when activity resumed; and demonstrate our commitment to providing HSE leadership, from the ranks of senior
management to field workers anywhere in the world.
The results were rewarding for both our people and our bottom line.
SYSTEM CONSOLIDATION
In 2002, a new Shared Business Services department was formed to bring together some of the common
services within the organization, including HSE.
As a result, HSE initiatives will be integrated on a corporate-wide basis, rather than a business segment basis,
in 2003. This will result in cost savings, and allow Precision to share best practices found within the systems and
procedures already developed by individual business units.
A corporate HSE Management System document was generated in 2002 for all Precision’s business segments.
This high level document identifies our HSE policy and key beliefs and provides a framework for systematically
evaluating each of our business activities and identifying associated risks.
English, French, German and Spanish versions of the manual were prepared in 2002 and an Arabic version
will be completed in 2003. Work also began on creating an internal HSE site on Precision’s Intranet so our
employees have access to the same information from any location around the world, at any time.
OUTSTANDING PERFORMANCE
Precision’s safety performance continues to outstrip the industry average.
In Canada in 2002, the lost time incident (LTI) rates for our Contract Drilling Group (CDG) were 1.1 per
200,000 man hours; for our Technology Services Group (TSG) 1.4; and, for our Rental and Production Group 0.6.
Source Occupational Injuries and Diseases in Alberta (Upstream Oil & Gas and Construction) for the Years 1994 - 2001.
In other notable achievements in 2002, REPPSCO Services, a Rental and Production Group company and
subsidiary of CEDA International Corporation, passed the one-million-hours milestone without sustaining a single
lost time injury. Precision also had 264 drilling and service rigs operate free of recordable incidents in 2002.
32
0
1
2
3
4
5CDGIndustry
20012002
Lost Time IncidentsContract Drilling Group Technology Services Group Rental and Production Group
0
1
2
3
4
5TSGIndustry
200120020
1
2
3
4
5RPGIndustry
20012002(1) 2002 industry statistics are not yet available
(1)

WORKERS’ COMPENSATION REBATES
Precision’s ongoing investment in HSE is realizing returns on a financial, as well as the human level. As a
result of the proactive safety programs we have in place, Precision will receive $1.3 million in rebates from
Canadian workers’ compensation boards for our 2002 performance.
AWARDS AND RECOGNITION
Precision’s commitment to providing leadership in HSE practices continues to earn us recognition at home
and around the world.
Our Corporation received the 2002 Green Machines ranking as the most environmentally responsible
company in Canada for oil and gas services from a national group specializing in socially responsible investing
and corporate social responsibility.
Also in 2002, Computalog Wireline Services earned the Carrier Safety Award from the Petroleum Services
Association of Canada in the over 10 million kilometers category. This award recognizes the safety performance
of all commercial vehicles in British Columbia, Alberta, Saskatchewan, Manitoba and the Territories.
Internationally, Precision Drilling Technology Services GmbH won the gold award from the Royal Society for
the Prevention of Accidents for achieving a high standard of health and safety while working in the Middle East
over the last four years.
In Germany, TSG earned the Safety Certificate Contractors One Star Award for implementation of its HSE
management systems. This award results from review by an independent registration body. In 2003, TSG will aim
for the Two Star Award by pursuing more detailed implementation.
HSE PROGRAMS
Driver Safety
Precision has made dramatic improvements in reducing risk at our worksites and working towards our
ultimate goal of Target Zero™. It is now time to extend the same focus to one of our greatest risks, driving to
and from the worksite.
In 2002, Precision stepped up efforts to address one of the riskier parts of our day-to-day-work through a
program called Driver Safety. An initiative that began within TSG, where a collision-risk assessment tool is used
for all new hires, Driver Safety is currently being reviewed as a company-wide program.
Hank Swartout, Chairman and CEO: “Seat belts are a vital part of our personal protective equipment. At
Precision Drilling Corporation, vehicle safety is a core concern and central to our initiative with the Royal
Canadian Mounted Police (RCMP) to enhance training, education and awareness. In fact, our joint RCMP/Precision
video production “Drive to Survive” is being viewed by Precision employees and many of our customers with a
focus on saving lives and reducing vehicle incidents.”
33
Target Zero™ — It’s People, It’s PersonalTarget Zero™ is a bold safety statement that encompasses our mission to
hurt no one. It is built upon management commitment and acceptance of
safety responsibility. Target Zero™ is supported through our investment
in training, and ensuring expectations to work safely are understood,
with an overall focus on continuous improvement in all aspects of HSE.

Safety Stand Down Week in Canada
Precision participated in the industry’s first annual Safety Stand Down Week in January 2002. During the
busiest time of the year senior managers, up to and including the Chief Executive Officer, visited worksites to
discuss safety issues.
This program reinforced the strong focus that already exists within our Corporation for HSE accountability
at the senior management level. During 2002, senior management completed a total of more than 300 site visits.
Recycling
A key part of Precision’s HSE management system is to protect the environment by working to reduce, mitigate
or eliminate potentially harmful effects from our activities or operations anywhere in the world. In 2002, TSG
demonstrated this commitment by locating a German company that will recycle the lithium battery cells used in
our MWD systems. In Mexico’s Burgos Basin, Precision’s integrated services team has developed systems for
disposing of hazardous waste and creating an audit trail for measuring environmental performance.
Investing in People
During 2002, more than 1,200 supervisors and operations personnel completed observation and
communication training during the downturn of drilling activity. This initiative helped participants develop a
greater understanding of safety accountability and responsibility and provided support for the adoption of a
philosophy that only accepts zero injuries. The mutual investment in time of both Precision management and field
staff translated into the ability to quickly and safely ramp up to top performance once increased drilling activity
resumed.
Communication
During 2002, Precision produced a number of videos addressing a wide range of HSE subjects and concerns.
Such productions are essential to helping us communicate to employees throughout our Corporation with a
consistent message about safety. All videos will be made available via Precision’s Intranet so employees can view
them anytime, from anywhere.
34
Corporate Giving – Giving back in the communities in which we operateCorporate giving is an important part of corporate citizenship for Precision, because it helps
strengthen our roots in the communities we serve.
In 2002, our Corporate Donations Program experienced its most active year to date, fulfilling over
65% of requests within the scope of 12 categories. These categories are: rural and urban
community; international aid; women’s groups; youth; aboriginal; medical; disabilities; the arts; the
homeless; educational; the environment; and political.
More than half the donation requests were brought forward by Precision employees, with additional
requests provided by customers, shareholders and the communities in which we operate.
Of course, the social consciousness of our employees extends far beyond corporate requests, which is
why so many volunteer for a number of local charities, from the United Way and fun runs supporting
cancer and other research, to adopting families of the less fortunate during the holiday season.
Giving back to the community is a philosophy we are proud to share with our employees.

35
AccountingA Full

36
0
50
100
150
200
250
300
350
400
020100999998
Net Capital Expenditures$ Millions
Crude Oil PricesWTI yearly average – US$/Bbl
0
5
10
15
20
25
30
35
02010099980
1
2
3
4
5
6
0201009998
Natural Gas PricesAECO yearly average – Cdn.$/Mmbtu
0
100
200
300
400
500
020100999998
Cash Flow$ Millions
Rental and Production Group
Technology Services Group
Contract Drilling Group
2001 RevenueTotal: $1,953.6 Million
Rental and Production Group
Technology Services Group
Contract Drilling Group
2002 RevenueTotal: $1,689.2 Million
April 30 December 31 April 30 December 31
Rental and Production Group
Technology Services Group
Contract Drilling Group
2000 RevenueTotal: $1,355.5 Million
18%
55%
14%
27%52%34%
16%
46%38%

Management’s Discussion and Analysis
Management’s Discussion and Analysis focuses on key statistics from the Consolidated Financial Statements, and pertains to knownrisks and uncertainties relating to the oilfield and industrial service sectors. This discussion should not be considered all-inclusive, asit excludes changes that may occur in general economic, political and environmental conditions. Additionally, other elements may ormay not occur which could affect the Corporation in the future. In order to obtain the best overall perspective, this discussion shouldbe read in conjunction with the material contained in other parts of this annual report, including the audited Consolidated FinancialStatements and the related Notes. The effects on the Consolidated Financial Statements arising from differences in generally acceptedaccounting principles between Canada and the United States are described in Note 15 to the Consolidated Financial Statements.
HIGHLIGHTS (1)
(Stated in thousands of Canadian dollars, except per share amounts, which are presented on a diluted basis)
Increase Increase IncreaseYears ended December 31, 2002 (Decrease) 2001 (Decrease) 2000 (Decrease)
Financial Results
Revenue $1,689,150 $ (264,413) $1,953,563 $ 598,110 $1,355,453 $ 620,713% change (14%) 44% 84%
Operating earnings (2) 159,021 (222,611) 381,632 123,418 258,214 138,299% of revenue/% change 9% (58%) 20% 48% 19% 115%
Earnings before goodwill amortization 91,265 (127,054) 218,319 65,445 152,874 101,461% of revenue/% change 5% (58%) 11% 43% 11% 197%
Earnings before goodwill amortization per share 1.66 (2.37) 4.03 1.00 3.03 1.89% change (59%) 33% 166%
Net earnings 91,265 (95,269) 186,534 56,421 130,113 94,531% of revenue/% change 5% (51%) 10% 43% 10% 266%
Net earnings per share 1.66 (1.78) 3.44 0.86 2.58 1.79% change (52%) 33% 227%
Cash flow (3) 194,771 (270,902) 465,673 167,800 297,873 196,394% of revenue/% change 12% (58%) 24% 56% 22% 194%
Cash flow per share 3.55 (5.04) 8.59 2.68 5.91 3.67% change (59%) 45% 164%
Financial Position
Working capital 210,256 215,919 157,736Long-term debt (4) 514,878 496,200 548,096Long-term debt to long-term
debt plus equity (4) 0.25 0.26 0.31
(1) Quarterly financial information for the two year period ended December 31, 2002, is presented on page 3 of this annual report.(2) Operating earnings is not a recognized measure under Canadian generally accepted accounting principles (GAAP). Management
believes that in addition to net earnings, operating earnings is a useful supplemental measure as it provides an indication of theresults generated by the Corporation’s principal business activities prior to consideration of how those activities are financed orhow the results are taxed in various jurisdictions. Investors should be cautioned, however, that operating earnings should not beconstrued as an alternative to net earnings determined in accordance with GAAP as an indicator of Precision’s performance.Precision’s method of calculating operating earnings may differ from other companies and, accordingly, operating earnings maynot be comparable to measures used by other companies.
(3) Funds provided by operations (see Consolidated Statements of Cash Flow).(4) Excluding current portion of long-term debt, which is included in working capital.
37

SUMMARY INCOME STATEMENT
(Stated in thousands of Canadian dollars)
Years ended December 31, 2002 2001 2000
Operating earnings (loss):Contract Drilling Group $ 183,400 $ 298,100 $ 212,633Technology Services Group (40,646) 60,428 30,620Rental and Production Group 43,618 51,678 43,289Corporate and Other (27,351) (28,574) (28,328)
159,021 381,632 258,214Interest, net 35,236 43,582 28,713Dividend income (39) (1,106) –Gain on disposal of investments (900) (1,805) (40)Earnings before income taxes, non-controlling interest
and goodwill amortization 124,724 340,961 229,541Income taxes 32,308 121,774 76,667Earnings before non-controlling interest and
goodwill amortization 92,416 219,187 152,874Non-controlling interest 1,151 868 –Earnings before goodwill amortization 91,265 218,319 152,874Goodwill amortization, net of tax – 31,785 22,761Net earnings $ 91,265 $ 186,534 $ 130,113
Oilfield activity in both Canada and the U.S., as measured by number of wells drilled, declined by
approximately 20% in 2002 relative to 2001. As a result we experienced a reduction of revenue and an erosion
of operating margins due to competitive pressures. International drilling activity increased moderately in 2002
in all regions except Latin America. The political instability in Venezuela had a negative impact on activity levels
and operating results of both our Contract Drilling Group and the Technology Services Group.
The Contract Drilling Group performed well in the softer market and undertook a number of initiatives to
further improve the efficiency of operations. Actions taken were aimed at standardization of operating and
administrative processes and realization of economies of scale. The Canadian operation’s refinement of its
integrated management information systems has been an enabler for continued improvement of this business.
The strength of this group continues to be the foundation that allows the Corporation to pursue its long-term
strategies with respect to the Technology Services Group.
Throughout 2002, the Corporation continued to focus on the Technology Services Group and two key
elements of its long term plan, development of new technologies and geographic expansion, both of which
present Precision with opportunities for continued growth. Progress was made on both fronts. Revenue generated
outside Canada and the U.S. grew by 63% in 2002 over 2001 from $150.0 million to $245.2 million. A significant
portion of this growth occurred in Mexico with the success of the Corporation’s integrated services project in the
Burgos Basin. Revenue also grew in each of the Corporation’s other operating regions, namely Europe/Africa,
Latin America, the Middle East and Asia/Pacific. The pursuit of growth, however, came with a cost as operations
and administrative support structures were uneconomic at this stage in the business’ development.
With respect to technology, new product introductions in 2002 included the High Resolution Micro Imager
(HMI™) tool, the Flow Rate Tester (FRT)® tool, the Hostile Environment Logging (HEL™) MWD system, the
PrecisionLWD™ system, the EMpulse™ electromagnetic MWD system, the Z-Frac™ tool, the Vari-Cone™ liner
hanger system, and the TorkBuster™ tool. Early in 2003, the new Revolution™ rotary steerable system underwent
successful field tests as has the LWD Triple-Combo tool set. The further deployment of our new suite of tools
should begin to generate increasingly significant revenues over the next several years.
38

The Corporation’s strong balance sheet is another element of the solid foundation that allows Precision to
continue to pursue its long-term strategic objectives. Precision enjoys a strong working capital position and a
long-term debt to long-term debt plus equity ratio of a modest 25% at December 31, 2002. Early in 2003, the
Corporation’s balance sheet was further bolstered by the sale of Energy Industries Inc. for proceeds of $60 million,
which were used to pay down borrowings under our revolving credit facility.
Precision’s operations are managed in three industry segments. The Contract Drilling Group (CDG) includes
drilling rigs, service rigs, hydraulic well assist snubbing units, procurement and distribution of oilfield supplies,
camp and catering services, and manufacture, sale and repair of drilling equipment. The Technology Services
Group (TSG) includes wireline, directional drilling, MWD/LWD services, well testing, pumping services for
cementing, fracturing and well stimulation, the design, manufacture and marketing of downhole completion tools
and the design, manufacture and marketing of polycrystalline diamond compact (PDC) drill bits. The Rental and
Production Group (RPG) includes oilfield equipment rental services, industrial maintenance services and
compression equipment packaging, rental, sales and service.
CONTRACT DRILLING GROUP
(Stated in thousands of Canadian dollars, except per day/hour amounts)
% of % of % ofYears ended December 31, 2002 Revenue 2001 Revenue 2000 Revenue
Revenue $ 773,949 $ 1,010,020 $ 743,544Expenses:
Operating 494,511 63.9 603,797 59.8 440,513 59.2General and administrative 30,265 3.9 33,124 3.3 32,417 4.4Depreciation 63,045 8.1 75,511 7.5 58,194 7.8Foreign exchange 2,728 0.4 (512) (0.1) (213) –
Operating earnings $ 183,400 23.7 $ 298,100 29.5 $ 212,633 28.6% % %
% Increase % Increase % IncreaseYears ended December 31, 2002 (Decrease) 2001 (Decrease) 2000 (Decrease)
Number of drilling rigs (end of year) 243 (2.0) 248 1.6 244 10.9Drilling operating days (worldwide) 35,081 (25.6) 47,142 8.7 43,376 43.8Revenue per operating day $ 16,008 (0.1) $ 16,097 15.3 $ 13,961 13.8Number of service rigs (end of year) 240 (6.6) 257 – 257 238.2Service rig operating hours 392,210 (20.4) 492,480 121.3 222,539 108.3Revenue per operating hour $ 446 4.4 $ 427 12.4 $ 380 11.8
Most of CDG’s assets are positioned within the energy services market in Canada where we have a dominant
market share in each of our core businesses, with unique capability in our vertical integration. Deployment of
assets into international markets in situations that meet our financial targets and operational expertise is a
growth initiative that is steadfastly pursued within this group. International contract drilling is active with 16
drilling rigs engaged in Mexico, Venezuela, India, Oman, Brazil and Argentina.
Geographic Distribution of Revenue
39
InternationalCanada
2002Total: $773.9 Million
2001Total: $1,010.0 Million
2000 Total: $743.5 Million
15% 11%
85% 89%
13%
87%

The segment’s core business, drilling and workover services in Canada, incorporates the following elements:
❚ Contract drilling rigs – Precision Drilling – 227 drilling rigs – 34% of industry rigs
❚ Service rigs – Precision Well Servicing – 240 service rigs – 26% of industry rigs
❚ Snubbing units – Live Well Service – 23 snubbing units – 33% of industry units
❚ Drilling camps and catering – LRG Catering – 74 camps – 20% of industry camps
These operations, along with the drilling rigs working internationally, are supported by the following
services:
❚ Rostel Industries provides standardized workmanship in equipment manufacture and repair services.
❚ Columbia Oilfield Supply provides centralized procurement, inventory and distribution of consumable
supplies.
2002 2001Type of Drilling Rig Depth Canada International Total Canada International Total
Single to 1,200 m 17 – 17 16 2 18Super Single® to 2,500 m 16 4 20 17 3 20Double to 3,000 m 96 6 102 99 7 106Light triple to 3,600 m 48 5 53 47 6 53Heavy triple to 7,600 m 39 1 40 39 1 40Coiled tubing 11 – 11 11 – 11Total fleet 227 16 243 229 19 248
Type of Service Rig 2002 2001
Single 1 4Freestanding mobile single 50 23Mobile single 55 91Double 58 60Freestanding mobile double 6 5Mobile double 45 48Heavy double 7 9Freestanding heavy double 2 –Slant 16 16Swab – 1Total fleet 240 257
While safety and quality service are our primary focus, close behind are our basic and simple methods of
controlling costs in conjunction with revenue generation. Canada is a market that has allowed the segment to
mature into an efficient and productive business model, but not without challenge. Due to the seasonal and
economic cycles associated with our industry, our fixed cost support infrastructure is lean with great elasticity
to expand direct variable costs to meet high equipment demand periods and conversely, to shrink with drops in
utilization. Fixed cost support infrastructure relates to salaried office personnel and systems while variable costs
typically relate to our employees that work directly with equipment on the job, in the field. The variable, hourly
paid field employees work and get paid when associated equipment is generating revenue. The only exception is
for maintenance work and, certain educational and training endeavours.
40

2002 Compared to 2001
The asset base for CDG was virtually unchanged during the year, as there were no additions and certain rigs,
five drilling and 17 service, have been taken out of service. The reasons for the decline in activity in 2002
compared to 2001 were two-fold. First, competition and industry capacity continued to increase, albeit at a slower
pace, as competitors continued to build new equipment. Available rigs in Canada are now at an all-time high.
Second, although the fourth best year ever in western Canada in terms of well completions, 2002 was
characterized by low risk drilling whereby short duration shallow gas wells were dominant. A lack of confidence
in energy commodity pricing triggered conservative spending by our customers. This is noteworthy as drilling
parameters serve as a lead indicator for most future energy services within a region. There were 14,459 wells
drilled in Canada in 2002, a mark that resulted in a drilling rig activity decline of 27% to 31,363 operating days
for Precision in Canada, representing a 38% utilization rate, a post-1992 low. Service rig activity declined 20%
to 392,210 hours in Canada (44% utilization). Our service rig work was split one-third new well completion, with
the remaining two-thirds directed towards the workover of existing wells in production. Snubbing unit activity
declined 15% and camp and catering days declined 37% to 9,041 days (33% utilization).
Capital expenditures should ensure that equipment is kept up-to-date with economic and environmentally
based technological upgrades. Capital expenditures are managed to closely match changes in demand for our
existing asset base. Measures of demand include utilization, revenue and operating earnings. Compared to the
prior year, service and drilling rig utilization declined a combined 24%, capital expenditures were down 59%,
revenue reduced 23% and operating earnings declined 38%.
In terms of operating earnings, the $114.7 million dollar drop over the prior year is due to a volume reduction
of $69.7 million resulting from lower equipment utilization, with the remaining $45.0 million due to price
competitiveness giving rise to lower rig dayrates and less coverage of fixed infrastructure costs. Drilling and
service rig dayrates were strong in the first quarter of 2002 as record 2001 performance momentum carried
forward through winter drilling. However, as the remaining three quarters progressed, steadily softening demand
continued to erode operating margins and CDG exited the year with margins at 52 week lows. With spot market
rates for drilling rigs in early 2003 having increased by $1,000 per day in the oversupplied doubles market, there
are early signs that equipment demand and rates may strengthen in 2003 rather than deteriorate throughout the
year, as they did in 2002.
2001 Compared to 2000
CDG saw revenue increase by 36% in 2001 over 2000. This increase was the net result of improved pricing
and an increased fleet size with acquisitions completed in the second half of 2000. Price increases realized during
the buoyant first half of 2001 were for the most part maintained throughout the remainder of the year.
Operating earnings increased by $85.5 million or 40%; however, as a percentage of revenue it remained
relatively consistent at 30% in 2001 compared to 29% in 2000. The mix of business within the segment
influenced this latter comparison. Well servicing typically generates less operating margin than contract drilling
rigs. Although well service hours experienced 121% growth and drilling rig operating days a mere 9%, overall
operating earnings as a percentage of revenue increased due to strong pricing for drilling rigs in Canada and
internationally. During 2001, Canadian rig labour rates were increased approximately 10%.
Within CDG, 88% of revenue was generated in Canada. Canadian equipment utilization for 2001 as a
percentage of available days was nominally less than 2000 due to a highly unusual decline in demand during
the fourth quarter. Both drilling and service rig operations managed to build and hold pricing gains until late in
the year. As 2001 came to a close, competitive pressure was serving to lower customer pricing as available rig
supply in the spot market was growing.
41

TECHNOLOGY SERVICES GROUP
(Stated in thousands of Canadian dollars)
% of % of % ofYears ended December 31, 2002 Revenue 2001 Revenue 2000 Revenue
Revenue $ 639,367 $ 669,439 $ 372,425Expenses:
Operating 493,425 77.2 440,547 65.8 255,012 68.5General and administrative 91,123 14.3 81,905 12.2 38,920 10.5Depreciation and amortization 58,935 9.2 51,656 7.7 27,969 7.5Research and engineering 34,862 5.4 32,440 4.9 20,288 5.4Foreign exchange 1,668 0.3 2,463 0.4 (384) (0.1)
Operating earnings (loss) $ (40,646) (6.4) $ 60,428 9.0 $ 30,620 8.2
% Increase % Increase % IncreaseYears ended December 31, 2002 (Decrease) 2001 (Decrease) 2000 (Decrease)
Wireline jobs performed 30,813 (18.6) 37,845 28.6 29,431 220.6Directional wells drilled 1,654 44.1 1,148 15.1 997 –(1)
Well testing/CPD (2) man days (Canada only) 49,227 (18.1) 60,135 43.9 41,777 70.6
(1) Not available in 1999.
(2) Controlled Pressure Drilling (CPD).
2002 Compared to 2001
As illustrated in the following charts, TSG continued its geographic diversification efforts in 2002. Revenue
declined by $30.1 million or 4.5% in 2002 compared to 2001. The Canadian and U.S. operations saw revenue
decline as a result of reduced activity levels. The year over year decline in number of wells drilled amounted to
approximately 20% in both markets. The U.S. operations were also hampered by delays in the rollout of our new
suite of tools. We believe that the segment’s new generation tools should generate a growing revenue base as
more tools are deployed.
Geographic Distribution of Revenue
Revenue increased in all regions except Canada and the U.S. as the segment’s expanded international presence
facilitated the participation in a broader spectrum of projects. The political situation in Venezuela did have a
negative effect on revenue as oil and gas production activity in that country was virtually shut down in the last
six weeks of the year.
Having set up regional operations centers in 2001, our strategy in 2002 was to establish brand recognition
for Precision through successful completion of competitively bid projects. With these expanded operations,
Precision is now becoming recognized as a viable alternative to the historical group of oilfield service providers
in many international markets. However, the scope of TSG’s growth initiatives, in terms of both geography and
product lines, combined with the impact of delays in the deployment of new technologies, resulted in operations
42
Rest of WorldU.S.Canada
2002Total: $639.4 Million
2001Total: $669.4 Million
2000 Total: $372.4 Million
38%22%
12%
38%
24%32%
46% 30% 58%

support and administrative organizations that were uneconomic for the start-up revenue levels realized. This is
also reflected in operating and general and administrative expense, which grew 11.9% year-over-year while
revenue declined by 4.5%.
Rectifying this situation is now the top priority of management. The research and engineering team and
manufacturing operations have made substantial progress towards achieving the objectives established when the
Corporation’s expansion into technology services was initiated. These significant technological developments are
described below. The emphasis will now be on operating the business units as efficiently as possible and growing
the revenue base to make full use of the infrastructure. This will involve focusing on the segment’s two main
product lines, namely wireline and directional drilling services. We believe many of the start-up costs are behind
us and with the delivery of the new generation tools, Precision will be able to more effectively compete in the
global oilfield services market.
Success in increasing revenue and profitability in TSG is largely dependent upon the deployment of the
technologies discussed above. The number of tools manufactured and delivered to field operations increased
steadily over the course of 2002.
Significant technology developments were achieved in both drilling and wireline services in 2002. The focus
for 2003 will be to actively support the field testing and deployment of the new technologies presently under
development and to develop and deploy important enabling infrastructure technology.
The EMpulse™ electromagnetic MWD system had three major upgrades that allowed it to operate under more
severe levels of shock and vibration. The basic system was upgraded to be able to operate at temperatures up to
150°C with the high-temperature system up to 175°C. Improved features for offshore drilling applications
included the creation of an antenna deployment and recovery system, development of surface handling systems
and the creation of an innovative system for transmitting the signal through a specially coated casing string.
Development of the Hostile Environment Logging (HEL™) MWD system and the PrecisionLWD™ system, each
designed to operate in high-temperature and high-pressure wells, was completed in 2002. The PrecisionLWD™
system consists of a pulser, downhole power system, communication infrastructure, azimuthal gamma ray tool,
directional tool, high accuracy bore and annulus pressure monitors, Multi-Frequency Resistivity (MFR™), neutron
porosity and density tools (referred to as a triple-combo system), as well as the surface systems needed to deliver
the service at the rig site.
Field testing of the 4 3/4 in. Revolution™ rotary steerable system commenced late in 2002. This tool is
designed to be used in conjunction with the HEL™ MWD and PrecisionLWD™ systems.
Progress was made in cased hole logging, the most significant being the development of a best-in-class
high-temperature Sector Bond™ tool; a high reliability pulsed neutron generator for the Pulsed Neutron Decay-
Spectrum (PND®-S) tool, and a gamma ray/neutron tool. Highlights in open hole logging include successfully
field testing the Spectral Gamma Ray tool. The software group added significant processing and field
interpretation capability to the cased hole workstation.
2001 Compared to 2000
In 2001, TSG made progress in pursuit of its international growth objectives. Significant effort and
investment was directed to the U.S. wireline operation resulting in increased market share and providing a solid
base from which to expand our other services lines in this market.
43

The integration of acquisitions, most notably Geoservices S.A. and BecField Drilling Services Ltd. (BecField),
was also a focus in 2001. These additions provided technological advances and distribution channels with
established operating structures in international markets. The integrated service contract in Mexico’s Burgos
Basin established Precision’s presence in that country, which resulted in additional controlled pressure drilling,
well testing, directional drilling, MWD/LWD and drill bit contracts. These expansion initiatives combined with
increased domestic activity levels to generate an 80% increase in revenue to $669.4 million in 2001 compared to
2000.
Operating earnings increased by 97% to $60.4 million from $30.6 million in 2000. As a percentage of
revenue, operating earnings improved slightly from 8% to 9%. The operational and administrative infrastructure
necessary to deliver the segment’s services internationally were in the initial stages of development in the U.S.,
Latin America, Europe/Africa, the Middle East and Asia/Pacific. This included the equipment and facilities to
repair the MWD/LWD tools being produced by the Corporation’s research and engineering staff at Advantage
R & D, Inc. (formerly Advantage Engineering Services, Inc.). Costs for training field personnel and establishing
technical support networks were also incurred to facilitate the rollout of the suite of new tools.
RENTAL AND PRODUCTION GROUP
(Stated in thousands of Canadian dollars)
% of % of % ofYears ended December 31, 2002 Revenue 2001 Revenue 2000 Revenue
Revenue $ 274,403 $ 271,880 $ 239,220Expenses:
Operating 203,055 74.0 192,857 71.0 171,192 71.6General and administrative 12,674 4.6 12,353 4.5 11,207 4.7Depreciation 15,095 5.5 14,934 5.5 13,995 5.8Foreign exchange (39) – 58 – (463) (0.2)
Operating earnings $ 43,618 15.9 $ 51,678 19.0 $ 43,289 18.1
% Increase % Increase % IncreaseYears ended December 31, 2002 (Decrease) 2001 (Decrease) 2000 (Decrease)
Equipment rental days (000’s) 607 (34.4) 925 37.9 671 40.4Number of compressor packages sold 77 37.5 56 (17.6) 68 15.3Plant maintenance man-days (000’s) 259 12.6 230 15.0 200 –(1)
(1) Not available in 1999.
2002 Compared to 2001
Revenue in RPG increased modestly in 2002 over 2001 as reductions in the oilfield equipment rental business
were more than offset by increases in the industrial plant maintenance operation and the compression packaging
business. The industrial plant maintenance business benefited from the commissioning work performed at a new
heavy oil upgrading plant and continued high levels of maintenance work at oil sands projects in northern
Alberta. Operating margins were consistent with 2001 levels. During the year, this business was expanded
through the acquisition of a vacuum truck operation in northern Alberta. The utilization of these assets will be
enhanced by using them for plant maintenance work in addition to their continued operation in the oil and gas
drilling and well servicing market.
Compression packaging revenue increased slightly and margins remained consistent with 2001 levels. Energy
Industries Inc., the subsidiary which carried on this business, was sold in March 2003 with an effective date of
January 1, 2003. Although this operation had been profitable since its acquisition by Precision in 1996, it was
not a core business in the Corporation’s energy services globalization strategy.
44

The oilfield equipment rental business saw revenue decline in conjunction with reduced Canadian drilling
activity. This also had an impact on overall segment profitability as the rental business has higher margins than
the industrial plant maintenance and compression packaging businesses.
2001 Compared to 2000
Revenue in RPG increased by $32.7 million in 2001 or 14%, with the majority of the increase coming from
the industrial maintenance and plant turnaround operation. This business saw strong returns from its expansion
to service the oil sands projects in northern Alberta and from its focus on providing a full range of services to
its customers.
Operating margins improved slightly with increased activity levels. In spite of strong competitive pressures,
the gas compression business was able to maintain its revenue and operating margins.
OTHER ITEMS
2002 Compared to 2001
Corporate and Other Expenses
Net expenses for the Corporate and Other segment declined by $2.0 million in 2002 compared to 2001. The
primary reason was the reduction in variable compensation payments, which are tied to corporate performance.
Foreign Currency Translation
Effective January 1, 2002, the Corporation was required to adopt, on a retroactive basis, a new Canadian
accounting standard whereby unrealized gains or losses on foreign currency denominated long-term monetary
items will no longer be deferred and amortized but rather expensed as incurred. The new standard is consistent
with U.S. practice.
Interest Expense
Net interest expense declined by $8.3 million in 2002 as a result of the reduced cost of borrowing due to
declining interest rates and reduced borrowing levels. The average debt outstanding in 2002 was $568.4 million
compared to $630.8 million in 2001. Interest coverage, defined as operating earnings divided by net interest
expense, declined to approximately five times in 2002 compared to nine times in 2001. Interest coverage is
expected to move back towards 2001 levels in 2003 based upon anticipated activity levels and interest rates.
Income Taxes
The effective tax rate on earnings before income taxes and goodwill amortization was 26% in 2002 compared
to 36% in 2001. This reduction is due to the combined impact of tax rate reductions instituted by both the Alberta
and Canadian Federal governments and income taxed in jurisdictions with lower tax rates.
The effective tax rate in 2002 and 2001 was reduced by 0.5% and 2%, respectively, as a result of tax rate
decreases enacted by the Alberta government in those years. Canadian GAAP required that the effect of these
rate reductions be reflected as a decrease of future tax expense. The impact of these rate reductions was $2.6
million in 2002 and $6.0 million in 2001.
Goodwill Amortization
In 2001, standards under both Canadian and U.S. GAAP were issued that eliminated the amortization of
goodwill. These rules were adopted January 1, 2002, by the Corporation.
45
2001 Compared to 2000
Corporate and Other Expenses
Corporate and Other expenses of $30.8 million increased 8% from $28.6 million in 2000 following the growth
of the Corporation. In particular, the continued development of the corporate office in Houston, Texas, facilitated
marketing initiatives to support the international expansion. Corporate expenses are primarily personnel related
costs, including incentive pay, which is tied to performance. The strong financial performance of the Corporation
resulted in increased employee compensation costs.
Interest Expense
Net interest expense increased by $14.9 million or 52% in 2001 over 2000, following the increase in average
net borrowings from $455.9 million in 2000 to $630.8 million in 2001. Net borrowings at year-end dropped to
$600.1 million from $675.4 million at year-end 2000. As a percentage of revenue, net interest expense remained
at 2%. Interest coverage, defined as operating earnings divided by net interest expense, remained at nine times.
Income Taxes
The Corporation’s effective tax rate was 36% of earnings before income taxes and goodwill amortization,
compared to 33% in 2000. The increase in the tax rate resulted from the impact on future tax expense of tax
rate reductions in 2001 and 2000. In 2001, the Alberta government enacted a 2% reduction in tax rates effective
April 1, 2001. In 2000, the Canadian Federal government substantially enacted into law a 7% corporate tax rate
reduction over the period 2001 to 2004. Canadian GAAP required that the effect of these rate reductions be
reflected as a decrease of future tax expense in the year the law is passed or substantially enacted. The impact
of the Alberta tax rate reduction in 2001 was $6.0 million and in 2000 the impact of the Canadian Federal rate
reduction was $19.9 million. Excluding the impact of these rate reductions on future tax expense, the
Corporation’s effective tax rate was 38% in 2001 and 42% in 2000.
Goodwill Amortization
Goodwill amortization increased by $9.0 million, partially due to adding $23.9 million in goodwill from the
BecField acquisition and also from the full year of amortization on the $268.9 million of goodwill primarily
associated with the acquisitions of Plains Perforating Ltd. and CenAlta Energy Services Inc. in 2000.
LIQUIDITY AND CAPITAL RESOURCES
The Corporation continues to adhere to its conservative financial philosophies, the cornerstones of which are
to manage capital spending in relation to cash flow and to maintain a strong balance sheet. On a combined basis,
over the last two years our investing activities have been financed entirely from operating cash flow. Our balance
sheet remains solid with working capital of $210.3 million and a long-term debt to long-term debt plus equity
ratio of 25% at December 31, 2002.
In March 2003, the Corporation received $60.0 million on the sale of Energy Industries Inc. These funds were
used to repay borrowings under the $350.0 million revolving credit facility. At December 31, 2002, borrowings
under the facility amounted to $208.3 million.
Management believes that maintaining focus on these financing principles is a key element of the
Corporation’s risk management program that must respond to the very cyclical oil and gas business. The
Corporation’s strong balance sheet and unutilized borrowing capacity, combined with funds generated from
operations, is expected to provide sufficient capital to fund its ongoing operations and future expansions.
46
ACCOUNTING STANDARD CHANGES
In 2003, the Corporation will be required to adopt new Canadian accounting standards relating to testing the
impairment of long-lived assets. These standards are substantially equivalent to the corresponding U.S. rules. The
new standards establish a two step process for determining the impairment on long-lived assets held for use. An
impairment loss is recognized when the carrying amount of a long-lived asset exceeds the sum of the
undiscounted cash flows expected to result from its use and eventual disposition. The amount of any impairment
loss recognized is equal to the excess of the asset’s carrying value over the present value of the discounted cash
flows expected to result from its use and eventual disposition.
BUSINESS RISKS
Crude Oil and Natural Gas Prices
The price received by our customers for the crude oil and natural gas they produce has a direct impact on
cash flow available for them to finance the acquisition of services provided by the Corporation.
Prices for crude oil are established in a worldwide market in which supply and demand are subject to a vast
array of economic and political influences. This results in very volatile pricing; a prime example of which is West
Texas Intermediate crude oil trading at US $29 per barrel in early 2001, US $20 in late 2001, and recently in
excess of US $30. Natural gas prices are established in a more “local” North American market due to the
requirement to transport this gaseous product in pressurized pipelines. Demand for natural gas is seasonal and
is correlated to heating and electricity generation requirements. Demand for natural gas and fuel oils is also
affected by consumer’s ability to switch from one to the other to take advantage of relative price variations.
The Corporation partially manages the risk of volatile commodity prices, and thus volatile demand for its
services, by striving to maintain cost structures that are scalable to activity levels. However, cost structures in
CDG are more variable in nature than those within TSG. In addition, our strong balance sheet and adherence to
conservative financing practices provide the resilience to withstand and benefit from downturns and upturns in
the business cycle.
Workforce Availability
The Corporation’s ability to provide reliable services is dependent upon the availability of well-trained,
experienced crews to operate our field equipment and experienced sales and technical support professionals.
During periods of high activity levels, the attraction and retention of such employees is sometimes challenging
due to competition for their services. We must also balance the requirement to maintain a skilled workforce with
the need to establish cost structures that vary as much as possible with activity levels.
Within CDG, our most experienced people are retained during periods of low utilization by having them fill
lower level positions on our field crews. The Corporation has established training programs for employees new
to the oilfield service sector and we work closely with industry associations to ensure competitive compensation
levels and to attract new workers to the industry as required.
Many of our Canadian businesses have recently experienced manpower shortages. Over 70 drilling rigs ran
without relief crews throughout the early part of 2003, requiring them to shut down when crews needed time off.
TSG’s Canadian operations have been supported by additional people and equipment brought in from other
regional operations to meet peak winter demand.
47

Weather
The ability to move heavy equipment in the Canadian oil and natural gas fields is dependent on weather
conditions. As warm weather returns in the spring, the winter’s frost comes out of the ground, rendering many
secondary roads incapable of supporting the weight of heavy equipment until they have thoroughly dried out. This
“spring breakup”, which generally occurs in March and April and has a duration of from four to six weeks, has a
direct impact on the Corporation’s activity levels. In addition, many exploration and production areas in northern
Canada are accessible only in winter months when the ground is frozen hard enough to support equipment. The
timing of freeze up and spring breakup affects the ability to move equipment in and out of these areas.
Working with customers, we strive to position equipment where possible such that it can be working on
location during spring breakup, limiting the need to move equipment during this time period as much as possible.
However, many uncontrollable factors affect our ability to plan in this fashion and the spring season, which can
occur any time from late March through May, is traditionally our slowest time.
Technology
Technological innovation by oilfield service companies has improved the effectiveness of the entire
exploration and production sector over the industry’s 140-year history. Recently, development of directional and
horizontal drilling, controlled pressure drilling, coiled tubing drilling, and methods of providing real-time data
during drilling and production operations have increased production volumes and the recoverable amount of
discovered reserves. Innovations such as 3D and 4D seismic have improved the success rate of exploration wells
partially offsetting the decline in the quantity of drillable prospects.
Our ability to deliver more efficient services is critical to our continued success. The Corporation has
continuously built upon its experience and teamed with customers to provide solutions to their unique problems.
Our ability to design and build specialized equipment has kept us on the leading edge of drilling technology. The
success of our in-house designed and built Super Single® rig, both in Canada and abroad, is testimony of our
dedication to these efforts.
The continued development of our TSG segment and, in particular, the work of its research and development
teams put the Corporation at another level where high-end technological innovation is paramount to success. We
have assembled teams of highly qualified experienced professionals that work in state-of-the-art testing facilities.
The technologies they have developed are at or near the commercial deployment stage, however, the success of
future technological endeavours is never certain.
Acquisition Integration
The Corporation has worked towards its strategic objective of becoming an integrated service provider of
sufficient size to benefit from economies of scale and to provide the foundation from which to pursue
international opportunities. Business acquisitions have been an important tool in this pursuit and will continue
to be so in the future. Continued successful integration of new businesses, people and systems is key to our future
success.
Foreign Operations
The Corporation is working hard to export its expertise and technologies to oil and gas producing regions
around the world. With this comes the risk of dealing with business and political systems that are much different
than we are accustomed to in North America. The Corporation has hired employees who have experience working
in the international arena and it is committed to recruiting qualified resident nationals on the staffs of all of its
international operations.
48

Foreign Currency Exchange Rates
The Corporation has a number of sources of foreign currency exchange risk. On international contracts,
attempts are made to structure revenue streams such that a portion sufficient to match local expenditures is
denominated in the local currency, with the remainder being denominated in U.S. dollars. In addition, many of
our business units buy a portion of their parts and supplies from suppliers in the U.S. Also, the manufacturing
effort associated with the deployment of the new suite of tools is taking place in the U.S. As a result, the
Corporation is presently a net payer of U.S. dollars.
Merger and Acquisition Activity
Merger and acquisition activity in the oil and gas exploration and production sector can impact demand for
our services as customers focus on reorganization activities prior to committing funds to significant drilling and
maintenance projects. Future merger and acquisition activity could have a short-term impact on our business,
but in the long-term should result in a stronger, more active market.
OUTLOOK
Strengthening domestic natural gas prices and relatively strong world oil prices should bode well for business
prospects in the energy services sector. The economics of natural gas supply and demand is the fundamental
driver of our business in North America. The combination of high natural gas demand induced by harsher winter
weather conditions and declining production capability due to depleting reserves and reduced drilling activity
support the growing consensus that natural gas prices will remain strong through 2003 and into 2004. Strong,
sustainable pricing is what has been required to get production companies recently back to work drilling and
completing wells to close the natural gas supply and demand gap. Canadian activity has been very strong in the
first quarter of 2003 and all indications are that demand for the services provided by the Corporation will remain
high throughout the year and into 2004.
Recently oilfield activity in the U.S. has shown signs of reacting to these same business fundamentals with
the rig count climbing to over 900. This has been reflected in the results of our U.S. business units. Mexico is
also a key player in the North American natural gas supply and demand picture and the Corporation will continue
to build on its success in that country.
The expected increase in North American oilfield activity and the deployment of new tools should enhance
Precision’s results in 2003. International activity is expected to continue at its existing pace, barring any impact
that war in the Middle East might have. From this solid foundation, we will continue to move forward with our
technological and global expansion efforts but in a more focused manner, concentrating on our core service lines
and the profitability of those businesses, particularly within TSG. The geopolitical environment in many
international regions will likely also play a factor in the speed of our expansion efforts as we weigh the risks
associated with deploying people and equipment.
Although delayed beyond original expectations, our suite of new downhole tools is now moving from the
development stage to the deployment stage. This new equipment is a key element that should allow the
Corporation to compete effectively and grow in international markets and to better utilize the service delivery
infrastructure established over the last two years.
49
50
Management’s Report to the Shareholders
The accompanying consolidated financial statements and all information in the Annual Report are the
responsibility of management. The consolidated financial statements have been prepared by management in
accordance with the accounting policies in the notes to financial statements. When necessary, management has
made informed judgments and estimates in accounting for transactions which were not complete at the balance
sheet date. In the opinion of management, the financial statements have been prepared within acceptable limits
of materiality, and are in accordance with Canadian generally accepted accounting principles (GAAP) appropriate
in the circumstances. The financial information elsewhere in the Annual Report has been reviewed to ensure
consistency with that in the consolidated financial statements.
Management has prepared Management’s Discussion and Analysis (MD & A). The MD & A is based upon the
Company’s financial results prepared in accordance with Canadian GAAP. The MD & A compares the audited
financial results for the twelve months ended December 31, 2002 to December 31, 2001 and the twelve months
ended December 31, 2001 to December 31, 2000. Note 15 to the consolidated financial statements describes the
impact on the consolidated financial statements of significant differences between Canadian and United States
GAAP.
Management maintains appropriate systems of internal control. Policies and procedures are designed to give
reasonable assurance that transactions are properly authorized, assets are safeguarded and financial records
properly maintained to provide reliable information for the preparation of financial statements.
KPMG LLP, an independent firm of Chartered Accountants, was engaged, as approved by a vote of
shareholders at the Corporation’s most recent annual general and special meeting, to audit the consolidated
financial statements in accordance with generally accepted auditing standards in Canada and provide an
independent professional opinion.
The Audit Committee of the Board of Directors, which is comprised of three directors who are not employees
of the Corporation, has discussed the consolidated financial statements, including the notes thereto, with
management and external auditors. The consolidated financial statements have been approved by the Board of
Directors on the recommendation of the Audit Committee.
Hank B. Swartout (signed) Dale E. Tremblay (signed)
Chairman of the Board, President Senior Vice President Finance
and Chief Executive Officer and Chief Financial Officer
March 6, 2003

51
Auditors’ Report to the Shareholders
We have audited the consolidated balance sheets of Precision Drilling Corporation as at December 31, 2002
and 2001 and the consolidated statements of earnings and retained earnings and cash flow for each of the years
in the three-year period ended December 31, 2002. These consolidated financial statements are the responsibility
of the Corporation’s management. Our responsibility is to express an opinion on these consolidated financial
statements based on our audits.
We conducted our audits in accordance with Canadian generally accepted auditing standards. Those
standards require that we plan and perform an audit to obtain reasonable assurance whether the financial
statements are free of material misstatement. An audit includes examining, on a test basis, evidence supporting
the amounts and disclosures in the financial statements. An audit also includes assessing the accounting
principles used and significant estimates made by management, as well as evaluating the overall financial
statement presentation.
In our opinion, these consolidated financial statements present fairly, in all material respects, the financial
position of the Corporation as at December 31, 2002 and 2001 and the results of its operations and its cash flow
for each of the years in the three-year period ended December 31, 2002 in accordance with Canadian generally
accepted accounting principles.
KPMG LLP (signed)
Chartered Accountants
Calgary, Canada
February 11, 2003, except for
Note 20 which is as at March 6, 2003

52
Consolidated Balance Sheets(Stated in thousands of dollars)
As at December 31, 2002 2001
(Restated – Note 2)
AssetsCurrent assets:
Cash $ 17,315 $ 13,231
Accounts receivable 443,799 474,528
Income taxes recoverable 7,804 –
Inventory (Note 3) 132,909 111,393
601,827 599,152
Property, plant and equipment, net of
accumulated depreciation (Note 4) 1,521,444 1,418,609
Intangibles, net of accumulated amortization of
$15,235 (2001 - $9,413) 72,380 74,004
Goodwill 546,921 545,377
Other assets (Note 5) 17,443 14,216
$ 2,760,015 $ 2,651,358
Liabilities and Shareholders’ Equity
Current liabilities:
Bank indebtedness (Note 6) $ 95,321 $ 85,384
Accounts payable and accrued liabilities (Note 18) 268,568 253,342
Incomes taxes payable – 12,764
Current portion of long-term debt (Note 7) 27,682 31,743
391,571 383,233
Long-term debt (Note 7) 514,878 496,200
Future income taxes (Note 11) 318,547 355,078
Non-controlling interest 2,019 868
Shareholders’ equity:
Share capital (Note 8) 912,916 887,160
Retained earnings 620,084 528,819
1,533,000 1,415,979
Commitments and contingencies (Notes 10 and 19)
$ 2,760,015 $ 2,651,358
See accompanying notes to consolidated financial statements.
Approved by the Board:
Hank B. Swartout (signed) H. Garth Wiggins (signed)
Director Director

53
Consolidated Statements of Earnings and Retained Earnings(Stated in thousands of dollars, except per share amounts)
Years ended December 31, 2002 2001 2000
(Restated - Note 2) (Restated - Note 2)
Revenue $ 1,689,150 $ 1,953,563 $ 1,355,453
Expenses:
Operating 1,190,991 1,238,864 871,016
General and administrative 158,490 153,498 102,848
Depreciation and amortization 141,429 145,120 101,300
Research and engineering 34,862 32,440 20,288
Foreign exchange 4,357 2,009 1,787
1,530,129 1,571,931 1,097,239
Operating earnings 159,021 381,632 258,214
Interest:
Long-term debt 34,508 44,112 31,166
Other 1,334 556 473
Income (606) (1,086) (2,926)
Dividend income (39) (1,106) –
Gain on disposal of investments (900) (1,805) (40)
Earnings before income taxes, non-controlling
interest and goodwill amortization 124,724 340,961 229,541
Income taxes: (Note 11)
Current 69,288 25,753 36,252
Future (36,980) 96,021 40,415
32,308 121,774 76,667
Earnings before non-controlling interest and
goodwill amortization 92,416 219,187 152,874
Non-controlling interest 1,151 868 –
Earnings before goodwill amortization 91,265 218,319 152,874
Goodwill amortization, net of tax (Note 2) – 31,785 22,761
Net earnings 91,265 186,534 130,113
Retained earnings, beginning of year (Note 2) 528,819 342,285 282,204
Adjustment on adoption of liability method
of accounting for income taxes (Note 2) – – (70,032)
Retained earnings, end of year $ 620,084 $ 528,819 $ 342,285
Earnings per share before
goodwill amortization: (Note 12)
Basic $ 1.70 $ 4.12 $ 3.14
Diluted $ 1.66 $ 4.03 $ 3.03
Earnings per share: (Note 12)
Basic $ 1.70 $ 3.52 $ 2.67
Diluted $ 1.66 $ 3.44 $ 2.58
See accompanying notes to consolidated financial statements.

54
Consolidated Statements of Cash Flow(Stated in thousands of dollars except per share amounts)
Years ended December 31, 2002 2001 2000
(Restated - Note 2) (Restated - Note 2)
Cash provided by (used in):
Operations:
Net earnings $ 91,265 $ 186,534 $ 130,113
Items not affecting cash:
Depreciation and amortization 141,429 145,120 101,300
Goodwill amortization – 31,785 22,761
Future income taxes (36,980) 96,021 40,415
Gain on disposal of investments (900) (1,805) (40)
Amortization of deferred financing costs 1,294 1,302 1,435
Unrealized foreign exchange loss (gain)
on long-term debt (2,488) 5,848 1,889
Non-controlling interest 1,151 868 –
Funds provided by operations 194,771 465,673 297,873
Changes in non-cash working capital balances (Note 18) 4,452 (33,443) (60,988)
199,223 432,230 236,885
Investments:
Business acquisitions,
net of cash acquired (Note 14) (4,594) (35,557) (364,959)
Purchase of property, plant and equipment (267,794) (366,019) (195,377)
Purchase of intangibles (4,198) (5,673) (5,627)
Proceeds on sale of property, plant and equipment 32,449 31,001 20,520
Proceeds on disposal of investments 1,872 2,283 64
Investments (5,672) 227 95
(247,937) (373,738) (545,284)
Financing:
Increase in long-term debt 119,380 22,083 321,543
Repayment of long-term debt (102,275) (83,437) (118,219)
Deferred financing costs on long-term debt – (38) (1,973)
Issuance of common shares on exercise of options 25,756 20,294 21,009
Issuance of common shares on exercise of warrants – 2,371 –
Redemption of warrants – – (18,924)
Change in bank indebtedness 9,937 (27,236) 73,340
52,798 (65,963) 276,776
Increase (decrease) in cash 4,084 (7,471) (31,623)
Cash, beginning of year 13,231 20,702 52,325
Cash, end of year $ 17,315 $ 13,231 $ 20,702
Funds provided by operations per share: (Note 12)
Basic $ 3.63 $ 8.79 $ 6.11
Diluted $ 3.55 $ 8.59 $ 5.91
See accompanying notes to consolidated financial statements.

55
Notes to Consolidated Financial Statements(Tabular amounts stated in thousands of dollars except per share amounts)
Precision Drilling Corporation (the “Corporation”) is a vertically integrated oilfield service company,
providing oilfield and industrial services to customers worldwide.
The financial statements are prepared in accordance with generally accepted accounting principles (GAAP)
in Canada. Management is required to make estimates and assumptions that affect the reported amounts of assets
and liabilities and disclosure of contingent assets and liabilities at the date of the financial statements and the
reported amounts of revenues and expenses during the reported period. Actual results could differ from these
estimates.
1. SIGNIFICANT ACCOUNTING POLICIES:
(a) Principles of consolidation:
The consolidated financial statements include the accounts of the Corporation and its subsidiaries, all
of which, except one, are wholly-owned.
(b) Inventory:
Inventory is carried at the lower of average cost and replacement value.
(c) Property, plant and equipment:
Drilling rig equipment is depreciated by the unit-of-production method based on 3,650 drilling days
with a 20% salvage value. Drill pipe and drill collars are depreciated over 1,100 drilling days and have
no salvage value. Service rig equipment is depreciated by the unit-of-production method based on
24,000 hours for single and double rigs and 48,000 hours for heavy double rigs. Service rigs have a
20% salvage value.
Field technical equipment is depreciated by the straight-line method over periods ranging from 2 to 10
years.
Rental equipment is depreciated by the straight-line method over periods ranging from 10 to 15 years.
Other equipment is depreciated by the straight-line method over periods ranging from 3 to 10 years.
Light duty vehicles are depreciated by the straight-line method over 4 years. Heavy-duty vehicles are
depreciated by the straight-line method over periods ranging from 7 to 10 years.
Buildings are depreciated by the straight-line method over periods ranging from 10 to 30 years.
(d) Intangibles:
Intangibles, which are comprised of acquired patents, are recorded at cost and amortized by the
straight-line method over their useful lives ranging from 5 to 15 years.
(e) Goodwill:
Goodwill is recorded at cost, less amortization, and is tested for impairment annually in the fourth
quarter.

56
(f) Investments:
Investments in shares of associated companies, over which the Corporation has significant influence,
are accounted for by the equity method. Other investments are carried at cost. If there are other than
temporary declines in value, these investments are written down to their net realizable value.
(g) Deferred financing costs:
Costs associated with the issuance of long-term debt are deferred and amortized by the straight-line
method over the term of the debt. The amortization is included in interest expense.
(h) Income taxes:
The Corporation follows the liability method of accounting for future income taxes. Under the liability
method, future income tax assets and liabilities are determined based on “temporary differences”
(differences between the accounting basis and the tax basis of the assets and liabilities), and are
measured using the currently enacted, or substantively enacted, tax rates and laws expected to apply
when these differences reverse. Income tax expense is the sum of the Corporation’s provision for
current income taxes and the difference between opening and ending balances of the future income tax
assets and liabilities.
(i) Revenue recognition:
Revenue is primarily recognized as services are rendered based upon agreed daily, hourly or job rates.
The Corporation’s manufacturing activities relate to equipment sale contracts, which follow the
percentage of completion method of revenue recognition.
(j) Post-employment benefits:
The Corporation entered into an employment agreement with a senior officer, which provides for
certain post-employment benefits. Costs of these benefits are charged to earnings on a straight-line
basis over ten years.
(k) Foreign currency translation:
Accounts of foreign operations, all of which are considered financially and operationally integrated,
are translated to Canadian dollars using average exchange rates for the year for revenue and expenses.
Monetary assets and liabilities are translated at the year-end current exchange rate and non-monetary
assets and liabilities are translated using historical rates of exchange. Gains or losses resulting from
these translation adjustments are included in net earnings.
Transactions in foreign currencies are translated at rates in effect at the time of the transaction.
Monetary assets and liabilities are translated at current rates. Gains and losses are included in income.
(l) Stock-based compensation plans:
The Corporation has equity incentive plans, which are described in Note 8. No compensation expense
is recognized for these plans when stock options are issued. Any consideration received on exercise of
the stock options is credited to share capital.
(m) Research and engineering:
Research and engineering costs are charged to income as incurred. Costs associated with the
development of new operating tools and systems are expensed during the period unless the recovery
of these costs can be reasonably assured given the existing and anticipated future industry conditions.
57
Upon successful completion and field testing of the tools any deferred costs are transferred to the
related capital asset accounts.
(n) Per share amounts:
Basic per share amounts are calculated using the weighted average number of shares outstanding
during the year. Diluted per share amounts are calculated based on the treasury stock method, which
assumes that any proceeds obtained on exercise of options would be used to purchase common shares
at the average market price during the period. The weighted average number of shares outstanding is
then adjusted by the net change.
(o) Comparative figures:
Certain comparative figures have been reclassified to conform with the current financial statement
presentation.
2. ACCOUNTING CHANGES:
(a) Accounting for business combinations, goodwill and other intangible assets:
Effective January 1, 2002, the Corporation prospectively adopted the new Canadian accounting
standards relating to business combinations and goodwill and other intangible assets.
Under the new business combination standard, the Corporation is required to use the purchase method
to account for all business combinations and identify, separate from goodwill, other intangible assets
that arise from contractual or legal rights or that can be separately sold.
Under the new standard for accounting for goodwill, goodwill is no longer amortized, but is tested for
impairment at least annually. An assessment of potential goodwill impairment is completed annually
in the fourth quarter.
(b) Foreign currency translation:
Effective January 1, 2002, the Corporation adopted, on a retroactive basis, a new Canadian accounting
standard whereby unrealized gains or losses are not deferred and amortized as previously required but
rather expensed as incurred.
As a result of this change, unrealized gains and losses related to translation of foreign currency
denominated long-term debt are no longer deferred and amortized over the term of the debt but are
expensed as incurred. Prior period results have been restated to reflect this change. The retroactive
application of this standard has reduced the opening balance of retained earnings by $1.6 million and
$115,000 at January 1, 2002 and January 1, 2001 respectively, and increased the opening balance of
retained earnings by $1.3 million at January 1, 2000.
(c) Stock-based compensation plans:
Effective January 1, 2002, the Corporation has prospectively adopted the new accounting policies with
respect to accounting for stock options. The Corporation’s stock-based compensation plans for
employees do not involve the direct award of stock, or call for the settlement in cash or other assets.
As a result, the Corporation has the option to apply either the intrinsic value based or the fair value
based method of accounting for stock-based compensation awards granted to employees.
The Corporation has elected to apply the intrinsic value based method and accordingly, no
compensation costs have been recognized in the financial statements. Any consideration received on
exercise of the stock options is credited to share capital.

58
(d) Incomes taxes:
Effective January 1, 2000, the Corporation adopted the liability method of accounting for future income
taxes.
Prior to adoption of this new accounting standard, income tax expense was determined using the
deferral method. Under this method, deferred income tax expense was determined based on “timing
differences” (differences between the accounting and tax treatment of expense or income items), and
were measured using the tax rates in effect in the year the differences originated.
The Corporation adopted the new income tax accounting standard retroactively, without restating the
financial statements of any prior period. As a result, the Corporation recorded a reduction to retained
earnings and an increase to the future tax liability, formerly the deferred tax liability, in the amount of
$70.0 million as at January 1, 2000.
3. INVENTORY:
2002 2001
Finished goods and work in progress $ 94,323 $ 55,118
Operating supplies 19,740 30,020
Manufacturing parts and materials 18,846 26,255
$ 132,909 $ 111,393
4. PROPERTY, PLANT AND EQUIPMENT:
Accumulated Net Book2002 Cost Depreciation Value
Rig equipment $ 1,065,742 $ 269,213 $ 796,529
Field technical equipment 513,591 78,399 435,192
Rental equipment 97,390 31,012 66,378
Other equipment 174,331 84,447 89,884
Vehicles 82,091 21,477 60,614
Buildings 71,131 15,266 55,865
Land 16,982 – 16,982
$ 2,021,258 $ 499,814 $ 1,521,444
Accumulated Net Book2001 Cost Depreciation Value
Rig equipment $ 1,022,281 $ 215,862 $ 806,419
Field technical equipment 365,858 31,669 334,189
Rental equipment 96,509 28,211 68,298
Other equipment 167,292 71,243 96,049
Vehicles 72,276 15,413 56,863
Buildings 52,734 10,622 42,112
Land 14,679 – 14,679
$ 1,791,629 $ 373,020 $ 1,418,609
Effective January 1, 2001, the Corporation changed its estimated salvage value on drilling and service rigs
from nil to 20%. The impact resulted in a reduction of related depreciation expense in the year ended December
31, 2002 by $6.9 million ($10.5 million – December 31, 2001) and an increase in net earnings after income taxes
of $4.2 million ($6.1 million – December 31, 2001) and $0.08 per share – Diluted ($0.11 – December 31, 2001).

59
5. OTHER ASSETS:
2002 2001
Investments, at cost less provision for impairment $ 8,960 $ 4,280Investments, at equity 2,114 2,273Deferred financing costs, net of accumulated amortization 6,369 7,663
$ 17,443 $ 14,216
6. BANK INDEBTEDNESS:
A wholly-owned subsidiary of the Corporation has available a revolving credit loan facility of US $15.0
million. Advances under this facility bear interest at the bank’s prime lending rate less 1.75% and are fully
guaranteed by the Corporation. The facility is renewable and extendable annually at the option of the lenders.
As at December 31, 2002 $14.3 million (US $9.2 million) (December 31, 2001 - $1.9, US $1.2) was drawn on this
facility. Availability of this facility is further reduced by outstanding letters of credit in the amount of $1.3
million (US $811,000).
As at December 31, 2002, and 2001, the Corporation has included borrowings of $80.0 million under its
extendable revolving unsecured facility in bank indebtedness, as the funds were used to finance working capital.
7. LONG-TERM DEBT:
2002 2001
Unsecured debentures – Series 1 $ 200,000 $ 200,000
Unsecured debentures – Series 2 150,000 150,000
EDC facility (2002 – US $7,917, 2001 – US $13,194) 12,255 21,025
EDC facility (2002 – US $30,000, 2001 – US $40,000) 46,440 63,740
Extendable revolving unsecured facility 128,318 79,781
Equipment loans 3,892 11,114
Capital lease obligations 1,655 2,283
542,560 527,943
Less amounts due within one year 27,682 31,743
$ 514,878 $ 496,200
The $200.0 million 6.85% Series 1 unsecured debentures mature June 26, 2007 and have an effective interest
rate of 7.44% after taking into account deferred financing costs. The debentures are redeemable at any time at
the option of the Corporation upon payment of a redemption price equal to the greater of an amount calculated
with reference to the yield on a Government of Canada bond with the same maturity, and par.
The $150.0 million 7.65% Series 2 unsecured debentures mature October 27, 2010 and have an effective
interest rate of 7.71% after taking into account deferred financing costs. The debentures are redeemable at any
time at the option of the Corporation upon payment of a redemption price equal to the greater of an amount
calculated with reference to the yield on a Government of Canada bond with the same maturity, and par.
The $12.3 million unsecured term financing facility with Export Development Canada (EDC) is repayable in
semi-annual installments, matures on January 20, 2004 and bears interest at six-month U.S. Libor plus applicable
margin. The margin is dependent upon the Corporation’s credit rating, which at December 31, 2002 resulted in
a margin of 0.8%.
The $46.4 million unsecured term financing facility with EDC is repayable over five years in semi-annual
installments, matures September 15, 2005 and bears interest at six-month U.S. Libor plus applicable margin. The
margin is dependent upon the Corporation’s credit rating, which at December 31, 2002 results in a margin of 0.9%.
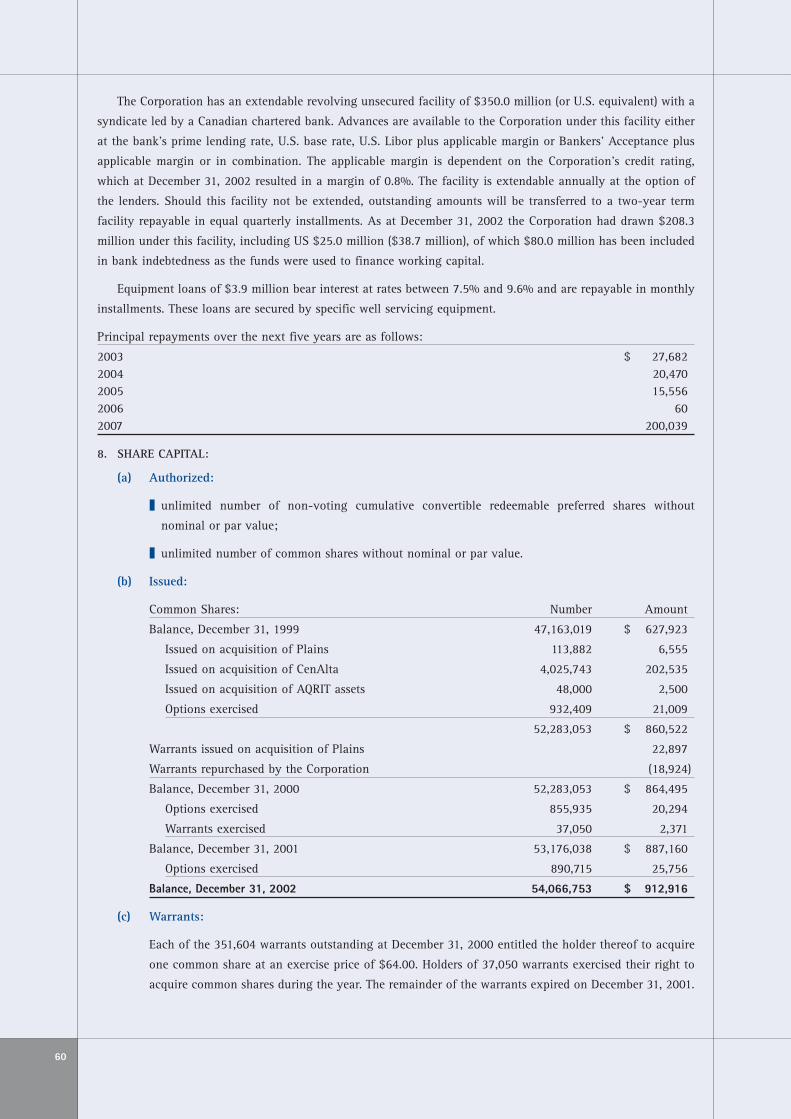
60
The Corporation has an extendable revolving unsecured facility of $350.0 million (or U.S. equivalent) with a
syndicate led by a Canadian chartered bank. Advances are available to the Corporation under this facility either
at the bank’s prime lending rate, U.S. base rate, U.S. Libor plus applicable margin or Bankers’ Acceptance plus
applicable margin or in combination. The applicable margin is dependent on the Corporation’s credit rating,
which at December 31, 2002 resulted in a margin of 0.8%. The facility is extendable annually at the option of
the lenders. Should this facility not be extended, outstanding amounts will be transferred to a two-year term
facility repayable in equal quarterly installments. As at December 31, 2002 the Corporation had drawn $208.3
million under this facility, including US $25.0 million ($38.7 million), of which $80.0 million has been included
in bank indebtedness as the funds were used to finance working capital.
Equipment loans of $3.9 million bear interest at rates between 7.5% and 9.6% and are repayable in monthly
installments. These loans are secured by specific well servicing equipment.
Principal repayments over the next five years are as follows:
2003 $ 27,6822004 20,4702005 15,5562006 602007 200,039
8. SHARE CAPITAL:
(a) Authorized:
❚ unlimited number of non-voting cumulative convertible redeemable preferred shares without
nominal or par value;
❚ unlimited number of common shares without nominal or par value.
(b) Issued:
Common Shares: Number Amount
Balance, December 31, 1999 47,163,019 $ 627,923
Issued on acquisition of Plains 113,882 6,555
Issued on acquisition of CenAlta 4,025,743 202,535
Issued on acquisition of AQRIT assets 48,000 2,500
Options exercised 932,409 21,009
52,283,053 $ 860,522
Warrants issued on acquisition of Plains 22,897
Warrants repurchased by the Corporation (18,924)
Balance, December 31, 2000 52,283,053 $ 864,495
Options exercised 855,935 20,294
Warrants exercised 37,050 2,371
Balance, December 31, 2001 53,176,038 $ 887,160
Options exercised 890,715 25,756
Balance, December 31, 2002 54,066,753 $ 912,916
(c) Warrants:
Each of the 351,604 warrants outstanding at December 31, 2000 entitled the holder thereof to acquire
one common share at an exercise price of $64.00. Holders of 37,050 warrants exercised their right to
acquire common shares during the year. The remainder of the warrants expired on December 31, 2001.
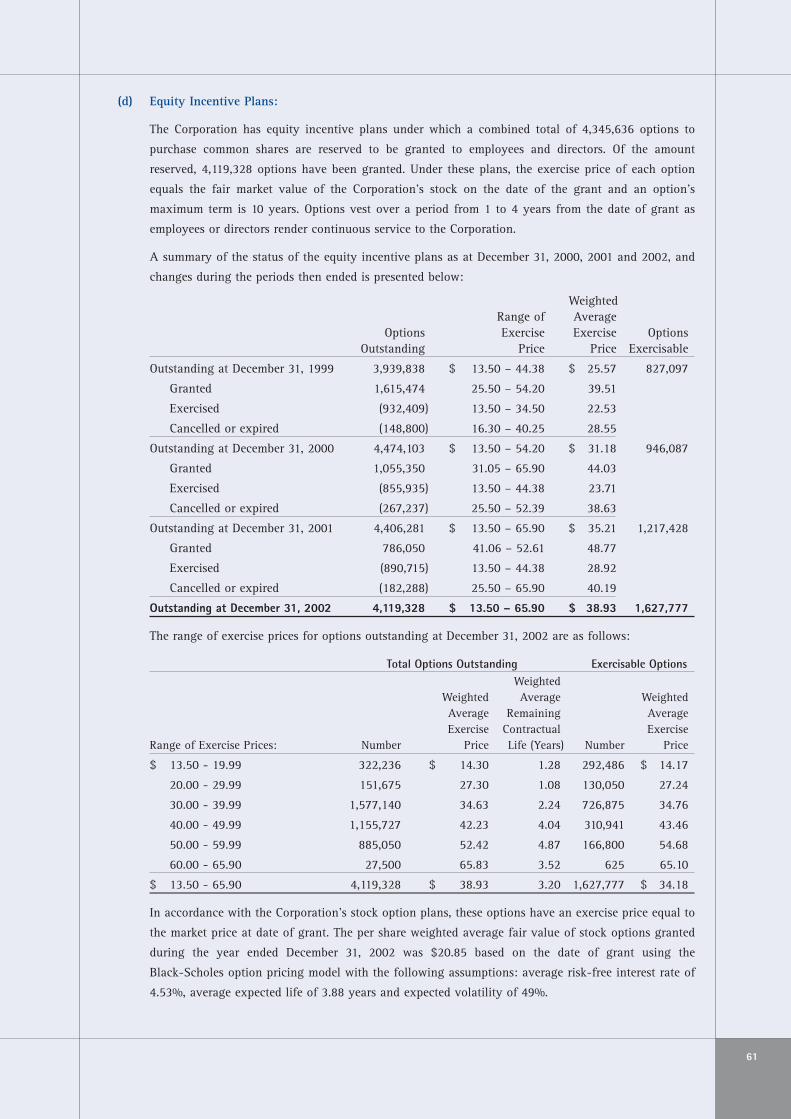
61
(d) Equity Incentive Plans:
The Corporation has equity incentive plans under which a combined total of 4,345,636 options to
purchase common shares are reserved to be granted to employees and directors. Of the amount
reserved, 4,119,328 options have been granted. Under these plans, the exercise price of each option
equals the fair market value of the Corporation’s stock on the date of the grant and an option’s
maximum term is 10 years. Options vest over a period from 1 to 4 years from the date of grant as
employees or directors render continuous service to the Corporation.
A summary of the status of the equity incentive plans as at December 31, 2000, 2001 and 2002, and
changes during the periods then ended is presented below:
WeightedRange of Average
Options Exercise Exercise OptionsOutstanding Price Price Exercisable
Outstanding at December 31, 1999 3,939,838 $ 13.50 – 44.38 $ 25.57 827,097
Granted 1,615,474 25.50 – 54.20 39.51
Exercised (932,409) 13.50 – 34.50 22.53
Cancelled or expired (148,800) 16.30 – 40.25 28.55
Outstanding at December 31, 2000 4,474,103 $ 13.50 – 54.20 $ 31.18 946,087
Granted 1,055,350 31.05 – 65.90 44.03
Exercised (855,935) 13.50 – 44.38 23.71
Cancelled or expired (267,237) 25.50 – 52.39 38.63
Outstanding at December 31, 2001 4,406,281 $ 13.50 – 65.90 $ 35.21 1,217,428
Granted 786,050 41.06 – 52.61 48.77
Exercised (890,715) 13.50 – 44.38 28.92
Cancelled or expired (182,288) 25.50 – 65.90 40.19
Outstanding at December 31, 2002 4,119,328 $ 13.50 – 65.90 $ 38.93 1,627,777
The range of exercise prices for options outstanding at December 31, 2002 are as follows:
Total Options Outstanding Exercisable OptionsWeighted
Weighted Average WeightedAverage Remaining AverageExercise Contractual Exercise
Range of Exercise Prices: Number Price Life (Years) Number Price
$ 13.50 - 19.99 322,236 $ 14.30 1.28 292,486 $ 14.17
20.00 - 29.99 151,675 27.30 1.08 130,050 27.24
30.00 - 39.99 1,577,140 34.63 2.24 726,875 34.76
40.00 - 49.99 1,155,727 42.23 4.04 310,941 43.46
50.00 - 59.99 885,050 52.42 4.87 166,800 54.68
60.00 - 65.90 27,500 65.83 3.52 625 65.10
$ 13.50 - 65.90 4,119,328 $ 38.93 3.20 1,627,777 $ 34.18
In accordance with the Corporation’s stock option plans, these options have an exercise price equal to
the market price at date of grant. The per share weighted average fair value of stock options granted
during the year ended December 31, 2002 was $20.85 based on the date of grant using the
Black-Scholes option pricing model with the following assumptions: average risk-free interest rate of
4.53%, average expected life of 3.88 years and expected volatility of 49%.

62
Had the Corporation determined compensation costs based on the fair value at the date of grant for
stock options granted since January 1, 2002; net earnings and earnings per share (EPS) would have
decreased to the pro forma amounts indicated below. These pro forma amounts reflect compensation
cost amortized over the option’s vesting period.
Year Ended December 31, 2002 As Reported Pro Forma
Net earnings $ 91,265 $ 85,071
Basic EPS $ 1.70 $ 1.59
Diluted EPS $ 1.66 $ 1.55
9. EMPLOYEE BENEFIT PLANS:
The Corporation has a defined contribution employee benefit plan covering a significant number of its
employees. The Corporation matches individual employee contributions up to 5% of the employee’s
compensation. Employer matching contributions under the plan totalled $6.9 million for the year ended
December 31, 2002 (year ended December 31, 2001 - $6.3 million; year ended December 31, 2000 - $4.3 million).
10. COMMITMENTS:
The Corporation has commitments for operating lease agreements, primarily for vehicles and office space, in
the aggregate amount of $121.6 million. Payments over the next five years are as follows:
2003 $ 30,781
2004 23,161
2005 16,821
2006 13,795
2007 11,461
Rent expense included in the statements of earnings is as follows:
2002 $ 18,085
2001 16,923
2000 12,064
11. INCOME TAXES:
The provision for income taxes differs from that which would be expected by applying statutory rates. A
reconciliation of the difference is as follows:
2002 2001 2000
Earnings before income taxes and non-controlling interest $ 124,724 $ 309,176 $ 206,780
Income tax rate 39% 42% 45%
Expected income tax provision $ 48,642 $ 129,854 $ 93,051
Add (deduct):
Non-deductible expenses 2,098 4,259 1,458
Utilization of prior period losses – – (1,828)
Non-deductible amortization – 13,096 10,106
Income taxed in jurisdictions with lower tax rates (13,029) (18,102) (5,869)
Other (2,852) (1,369) (317)
34,859 127,738 96,601
Reduction of future tax balances due to
substantively enacted tax rate reductions (2,551) (5,964) (19,934)
$ 32,308 $ 121,774 $ 76,667

63
During 2002 and 2001, the Province of Alberta enacted a 0.5% and 2% reduction in tax rates, respectively,
which has been reflected as a reduction in future tax expense in 2002 and 2001. In addition, during 2000, the
Federal Government of Canada introduced tax rate reductions to be implemented over the period from 2001 to
2004. The effect of the 7% tax rate reduction, from 29% to 22%, on the Corporation’s future tax balances was
reflected as a reduction of future tax expense in 2000.
The Corporation’s operations are complex and the computation of the provision for income taxes involves
tax interpretations, regulations and legislation that are continually changing. There are tax matters that have not
yet been confirmed by taxation authorities, however, management believes that the provision for income taxes
is adequate.
The net future tax liability is comprised of the tax effect of the following temporary differences:
2002 2001
Liabilities:
Property, plant and equipment and intangibles $ 296,103 $ 268,030
Assets held in partnership with different tax year 50,640 122,124
Deferred financing costs 2,385 2,805
$ 349,128 $ 392,959
Assets:
Losses carried forward $ 29,070 $ 33,449
Accrued liabilities 1,511 4,432
30,581 37,881
$ 318,547 $ 355,078
The Corporation has available losses of $150.5 million of which the benefit of $77.7 million has been
recognized. These losses expire from time to time up to 2009.
12. PER SHARE AMOUNTS:
Per share amounts have been calculated on the weighted average number of common shares outstanding. The
weighted average shares outstanding for the year ended December 31, 2002 was 53,701,873 (year ended
December 31, 2001 – 52,952,879; year ended December 31, 2000 – 48,722,141).
Diluted per share amounts reflect the dilutive effect of the exercise of the warrants and options outstanding.
The diluted shares for the year ended December 31, 2002 was 54,815,167 (year ended December 31, 2001 –
54,198,348; year ended December 31, 2000 – 50,431,349).
13. SIGNIFICANT CUSTOMERS:
During the years ended December 31, 2002, 2001 and 2000, no one customer accounted for more than 10%
of the Corporation’s revenue.
14. ACQUISITIONS:
During the year ended December 31, 2002, the Corporation completed the following business acquisitions:
(a) Acquisition of the business assets of NightHawk Vacuum Services Ltd. (NightHawk) in September 2002.
NightHawk provides oilfield vacuum services in northern Alberta and British Columbia.
(b) Paid additional consideration in conjunction with an acquisition made in 2001. This additional
consideration was payable based on the development of a commercially viable technology.

64
The acquisitions have been accounted for by the purchase method with results of operations of the acquired
businesses included in the financial statements from effective dates of acquisition. The details of the acquisitions
are as follows:
NightHawk Other Total
Net assets acquired at assigned values:
Working capital $ (47) $ – $ (47)
Property, plant and equipment 3,097 – 3,097
Goodwill – 1,544 1,544
3,050 1,544 4,594
Consideration:
Cash $ 3,050 $ 1,544 $ 4,594
During the year ended December 31, 2001, the Corporation completed business acquisitions, the most
significant of which was the acquisition of all the issued and outstanding shares of BecField Drilling Services
Ltd. (BecField) in January 2001. BecField provides directional drilling and measurement-while-drilling services
through its technical field and support personnel to the onshore and offshore oil and gas industry. It has
established operations in Europe and the Middle East.
The acquisitions have been accounted for by the purchase method with results of operations of the acquired
businesses included in the financial statements from the effective dates of acquisition. The details of the
acquisitions are as follows:
BecField Other Total
Net assets acquired at assigned values:
Working capital $ 2,446 (a) $ 1,136 (b) $ 3,582
Property, plant and equipment 5,036 4,074 9,110
Goodwill 23,877 2,783 26,660
Future income taxes - (800) (800)
$ 31,359 $ 7,193 $ 38,552
Consideration:
Cash $ 31,359 $ 7,193 $ 38,552
(a) Includes cash of $1,880.(b) Includes cash of $1,115.
During the year ended December 31, 2000, the Corporation completed business acquisitions, the most
significant of which were:
(a) Acquisition of all the issued and outstanding shares of Plains Energy Services Ltd. (Plains) in July 2000.
Plains provides wireline, surface control systems, well servicing and contract drilling services to the oil
and gas industry and engineers, manufactures, sells and operates specialty products, tools and equipment.
(b) Acquisition of all the issued and outstanding shares of CenAlta Energy Services Inc. (CenAlta) in October
2000. CenAlta provides equipment and crews for the servicing and drilling of oil and natural gas wells
in western Canada.
(c) Acquisition of the global directional drilling and electromagnetic measurement-while-drilling business
and associated assets from Geoservices S.A. (Geoservices) in October 2000.

65
The acquisitions have been accounted for by the purchase method with results of operations of the acquired
businesses included in the financial statements from the effective dates of acquisition. The details of the
acquisitions are as follows:
Plains CenAlta Geoservices Other Total
Net assets acquired at assigned values:
Working capital $ 11,178 $ (2,240) $ 6,717 $ 18 $ 15,673
Property, plant and equipment 122,207 219,411 20,879 13,793 376,290
Intangibles 2,640 – 64,621 3,608 70,869
Goodwill 188,540 72,351 – 7,972 268,863
Other assets 28 – – – 28
Long-term debt (42,535) (50,725) – – (93,260)
Future income taxes (4,755) (34,262) – – (39,017)
$ 277,303 $ 204,535 $ 92,217 $ 25,391 $ 599,446
Consideration:
Common shares $ 6,555 $ 202,535 $ – $ 2,500 $ 211,590
Warrants 22,897 – – – 22,897
Cash 247,851 2,000 92,217 22,891 364,959
$ 277,303 $ 204,535 $ 92,217 $ 25,391 $ 599,446
The following pro forma information provides an indication of what the Corporation’s results of operations
would have been had Plains and CenAlta been acquired effective January 1, 2000:
2000
Revenues $1,546,431
Earnings before goodwill amortization 128,245
Net earnings 97,857
Earnings per share before goodwill amortization:
Basic $ 2.47
Diluted 2.38
Earnings per share:
Basic $ 1.88
Diluted 1.82
15. UNITED STATES GENERALLY ACCEPTED ACCOUNTING PRINCIPLES:
These financial statements have been prepared in accordance with Canadian GAAP which, in the case of the
Corporation conform with United States generally accepted accounting principles (U.S. GAAP) in all material
respects, except as follows:
Income taxes:
In 2000 the Corporation adopted the liability method as described in Note 1 without restatement of prior
years. As a result, the Corporation recorded an adjustment to retained earnings and future tax liability in the
amount of $70.0 million at January 1, 2000. U.S. GAAP required the use of the liability method prescribed
in the Statement of Financial Accounting Standards (SFAS) No. 109, which substantially conforms with the
Canadian GAAP accounting standard adopted in 2000. Application of U.S. GAAP in years prior to 2000
would have resulted in $70.0 million of additional goodwill being recognized at January 1, 2000 as opposed
to an implementation adjustment to retained earnings allowed under Canadian GAAP. In 2000, 2001 and

66
2002 the U.S. GAAP financial statements would reflect an increase in goodwill of $66.5 million, $63.0 million
and $63.0 million, respectively, and a corresponding increase in retained earnings. An additional charge to
earnings of $3.5 million would be required related to this goodwill in each of 2000 and 2001.
Under Canadian GAAP, future tax liabilities and assets are calculated by reference to current tax legislation
and proposed legislation that is considered substantively enacted but not yet enacted into law. U.S. GAAP
requires that only enacted income tax legislation be used for calculation of future tax amounts. In 2000 the
Federal Government of Canada introduced tax rate reductions that were substantively enacted at December
31, 2000 but that were not passed into legislation until 2001. The resulting reduction of future tax balances
recognized under Canadian GAAP in 2000 would not be recognized under U.S. GAAP until 2001.
The application of U.S. accounting principles would have the following impact on the consolidated financial
statements:
Consolidated Statements of Earnings
Years ended December 31, 2002 2001 2000
Net earnings under Canadian GAAP $ 91,265 $ 186,534 $ 130,113
Adjustments under U.S. GAAP:
Goodwill amortization – (3,502) (3,502)
Income tax rate – 19,934 (19,934)
Net income and comprehensive income under U.S. GAAP $ 91,265 $ 202,966 $ 106,677
Earnings per share under U.S. GAAP:
Basic $ 1.70 $ 3.83 $ 2.19
Diluted $ 1.66 $ 3.74 $ 2.12
Balance Sheets
December 31, 2002 December 31, 2001As reported U.S. GAAP As reported U.S. GAAP
Current assets $ 601,827 $ 601,827 $ 599,152 $ 599,152
Property, plant and equipment 1,521,444 1,521,444 1,418,609 1,418,609
Intangibles 72,380 72,380 74,004 74,004
Goodwill 546,921 609,950 545,377 608,406
Other assets 17,443 17,443 14,216 14,216
$ 2,760,015 $ 2,823,044 $ 2,651,358 $ 2,714,387
Current liabilities $ 391,571 $ 391,571 $ 383,233 $ 383,233
Long-term debt 514,878 514,878 496,200 496,200
Future income taxes 318,547 318,547 355,078 355,078
Non-controlling interest 2,019 2,019 868 868
Shareholders’ equity 1,533,000 1,596,029 1,415,979 1,479,008
$ 2,760,015 $ 2,823,044 $ 2,651,358 $ 2,714,387
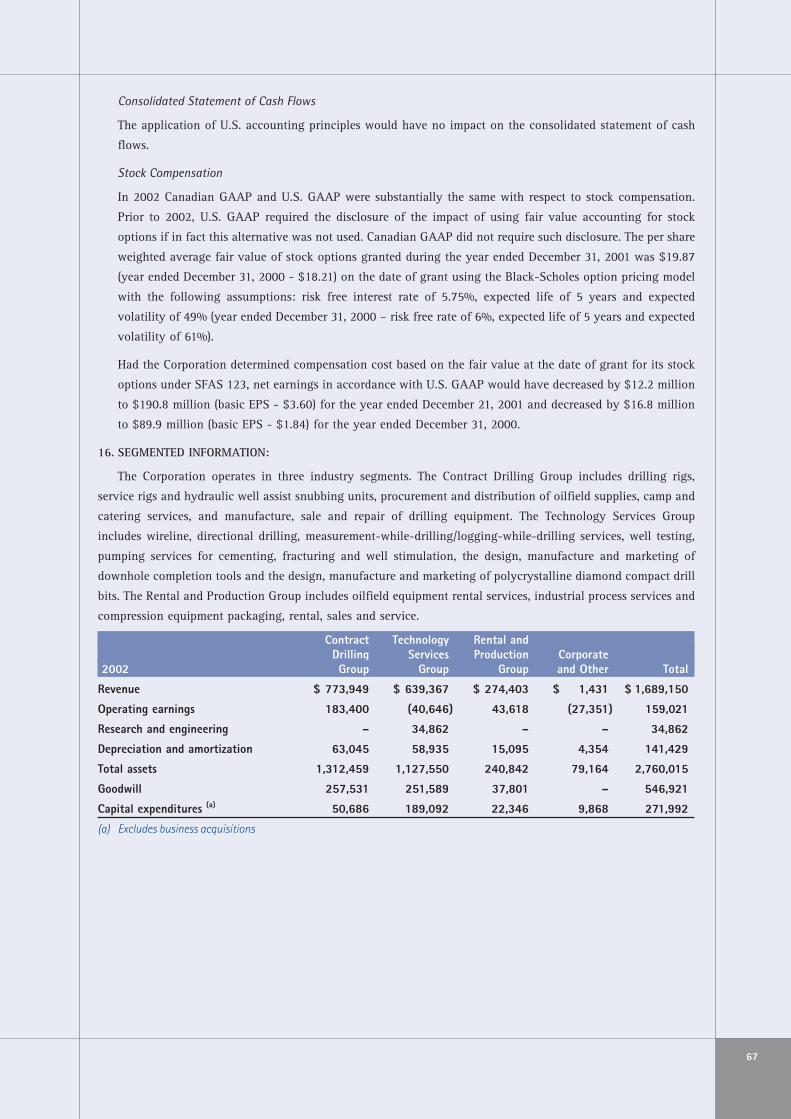
67
Consolidated Statement of Cash Flows
The application of U.S. accounting principles would have no impact on the consolidated statement of cash
flows.
Stock Compensation
In 2002 Canadian GAAP and U.S. GAAP were substantially the same with respect to stock compensation.
Prior to 2002, U.S. GAAP required the disclosure of the impact of using fair value accounting for stock
options if in fact this alternative was not used. Canadian GAAP did not require such disclosure. The per share
weighted average fair value of stock options granted during the year ended December 31, 2001 was $19.87
(year ended December 31, 2000 - $18.21) on the date of grant using the Black-Scholes option pricing model
with the following assumptions: risk free interest rate of 5.75%, expected life of 5 years and expected
volatility of 49% (year ended December 31, 2000 – risk free rate of 6%, expected life of 5 years and expected
volatility of 61%).
Had the Corporation determined compensation cost based on the fair value at the date of grant for its stock
options under SFAS 123, net earnings in accordance with U.S. GAAP would have decreased by $12.2 million
to $190.8 million (basic EPS - $3.60) for the year ended December 21, 2001 and decreased by $16.8 million
to $89.9 million (basic EPS - $1.84) for the year ended December 31, 2000.
16. SEGMENTED INFORMATION:
The Corporation operates in three industry segments. The Contract Drilling Group includes drilling rigs,
service rigs and hydraulic well assist snubbing units, procurement and distribution of oilfield supplies, camp and
catering services, and manufacture, sale and repair of drilling equipment. The Technology Services Group
includes wireline, directional drilling, measurement-while-drilling/logging-while-drilling services, well testing,
pumping services for cementing, fracturing and well stimulation, the design, manufacture and marketing of
downhole completion tools and the design, manufacture and marketing of polycrystalline diamond compact drill
bits. The Rental and Production Group includes oilfield equipment rental services, industrial process services and
compression equipment packaging, rental, sales and service.
Contract Technology Rental andDrilling Services Production Corporate
2002 Group Group Group and Other Total
Revenue $ 773,949 $ 639,367 $ 274,403 $ 1,431 $ 1,689,150
Operating earnings 183,400 (40,646) 43,618 (27,351) 159,021
Research and engineering – 34,862 – – 34,862
Depreciation and amortization 63,045 58,935 15,095 4,354 141,429
Total assets 1,312,459 1,127,550 240,842 79,164 2,760,015
Goodwill 257,531 251,589 37,801 – 546,921
Capital expenditures (a) 50,686 189,092 22,346 9,868 271,992
(a) Excludes business acquisitions

68
Contract Technology Rental andDrilling Services Production Corporate
2001 Group Group Group and Other Total
Revenue $1,010,020 $ 669,439 $ 271,880 $ 2,224 $1,953,563
Operating earnings 298,100 60,428 51,678 (28,574) 381,632
Research and engineering – 32,440 – – 32,440
Depreciation and amortization 75,511 51,656 14,934 3,019 145,120
Total assets 1,367,682 987,061 241,044 55,571 2,651,358
Goodwill 257,531 250,045 37,801 – 545,377
Capital expenditures (a) 122,575 203,547 27,352 18,218 371,692
2000
Revenue $ 743,544 $ 372,425 $ 239,220 $ 264 $1,355,453
Operating earnings 212,633 30,620 43,289 (28,328) 258,214
Research and engineering – 20,288 – – 20,288
Depreciation and amortization 58,194 27,969 13,995 1,142 101,300
Total assets 1,376,007 722,461 203,132 6,326 2,387,926
Goodwill 272,779 237,328 40,395 – 550,202
Capital expenditures (a) 97,498 78,468 21,828 3,210 201,004
(a) Excludes business acquisitions
The Corporation’s operations are carried on in the following geographic locations:
2002 Canada International Total
Revenue $1,118,020 $ 571,130 $1,689,150
Assets 2,081,200 678,815 2,760,015
2001
Revenue $ 1,412,370 $ 541,193 $1,953,563
Assets 2,175,877 475,481 2,651,358
2000
Revenue $1,105,183 $ 250,270 $1,355,453
Assets 2,048,009 339,917 2,387,926
17. FINANCIAL INSTRUMENTS:
(a) Fair value:
The carrying value of cash, accounts receivable and accounts payable and accrued liabilities approximate
their fair value due to the relatively short period to maturity of the instruments. The fair value of long-
term debt, exclusive of the unsecured debentures, approximates its carrying value as it bears interest at
floating rates. The $200 million Series 1 debentures have a fair value of approximately $210.5 million as
at December 31, 2002 (December 31, 2001 – $201.5 million) and the $150 million Series 2 unsecured
debentures have a fair value of approximately $161.1 million at December 31, 2002 (December 31, 2001
- $153.2 million). As at December 31, 2002 investments have a carrying value of $11.1 million (December
31, 2001 - $6.6 million) and a fair value of approximately $12.7 million (December 31, 2001 - $7.8
million).

69
(b) Credit risk:
Accounts receivable includes balances from a large number of customers. The Corporation assesses the
credit worthiness of its customers on an ongoing basis as well as monitoring the amount and age of
balances outstanding. Accordingly, the Corporation views the credit risks on these amounts as normal for
the industry. As at December 31, 2002 the Corporation’s allowance for doubtful accounts was $14.9
million (December 31, 2001 - $13.0 million).
(c) Interest rate risk:
The Corporation manages its exposure to interest rate risks through a combination of fixed and floating
rate borrowings. As at December 31, 2002, 43% of its total long-term debt was in floating rate
borrowings.
(d) Foreign currency risk:
The Corporation is exposed to foreign currency fluctuations in relation to its international operations,
however, management believes this exposure is not material to its overall operations.
18. SUPPLEMENTAL INFORMATION:
2002 2001 2000
Cash interest paid $ 35,660 $ 45,967 $ 29,504
Cash income taxes paid 89,856 11,066 34,771
Components of change in non-cash working capital balances:
Accounts receivable $ 30,829 $ (41,608) $ (120,686)
Inventory (21,516) (24,024) (6,391)
Accounts payable and accrued liabilities 15,707 17,503 64,479
Income taxes payable (20,568) 14,686 1,610
$ 4,452 $ (33,443) $ (60,988)
The components of accounts payable and accrued liabilities are as follows:
2002 2001
Accounts payable $ 69,940 $ 58,228
Accrued liabilities:
Payroll 45,115 58,117
Other 153,513 136,997
$ 268,568 $ 253,342
19. CONTINGENCIES:
The Corporation, through the performance of its services and product sales obligations, is sometimes named
as a defendant in litigation. The nature of these claims is usually related to personal injury, completed operations
or product liability. The Corporation maintains a level of insurance coverage deemed appropriate by management
and for matters for which insurance coverage can be maintained. The Corporation has no outstanding claims
having a potentially material adverse effect on the Corporation as a whole.
20. SUBSEQUENT EVENT:
On March 6, 2003 the Corporation sold Energy Industries Inc., a wholly owned subsidiary, for $60 million
cash. The effective date of the transaction is January 1, 2003.

70
Supplementary Information
THE TORONTO STOCK EXCHANGE – SHARE TRADING SUMMARY
High Low Close Volume ValueCanada ($) ($) ($) of Shares ($)
2002March 31 51.58 36.74 50.97 19,417,580 841,050,535June 30 61.30 47.61 52.61 18,359,677 1,008,242,529September 30 54.30 42.50 47.90 15,770,027 763,653,639December 31 58.23 43.60 50.95 17,546,936 922,073,312
61.30 36.74 50.95 71,094,220 3,535,020,0152001
March 31 72.00 50.00 56.60 17,872,755 1,086,989,966June 30 68.00 46.36 47.35 15,507,944 911,351,354September 30 49.50 30.65 33.40 25,231,371 998,766,128December 31 42.75 31.58 41.06 22,194,662 828,520,975
72.00 30.65 41.06 80,806,732 3,825,628,4232000
March 31 48.95 33.90 48.55 15,684,504 643,952,179June 30 59.50 43.80 57.20 15,846,874 851,428,913September 30 59.00 47.90 53.85 13,604,034 731,986,873December 31 57.15 39.30 56.25 15,461,804 747,323,156
59.50 33.90 56.25 60,597,216 2,974,691,121
THE NEW YORK STOCK EXCHANGE – SHARE TRADING SUMMARY
High Low Close Volume ValueUnited States ($) ($) ($) of Shares ($)
2002March 31 32.35 23.10 31.96 15,502,400 419,853,448June 30 39.24 30.00 34.74 17,441,600 616,795,917September 30 35.00 26.66 30.10 18,290,300 560,468,184December 31 37.45 27.38 32.54 19,727,900 665,228,176
39.24 23.10 32.54 70,962,200 2,262,345,7252001
March 31 46.40 33.06 35.67 20,504,400 816,043,158
June 30 44.50 30.50 31.24 20,689,100 808,735,284
September 30 32.46 19.45 21.16 18,847,500 523,502,280
December 31 27.19 19.99 25.82 23,462,000 555,447,564
46.40 19.45 25.82 83,503,000 2,703,728,286
2000March 31 33.75 23.31 33.38 14,504,500 416,080,112June 30 40.38 29.38 38.63 14,323,200 512,362,421September 30 39.56 32.38 35.63 12,586,000 455,927,521December 31 37.94 25.56 37.53 15,878,300 491,100,502
40.38 23.31 37.53 57,292,000 1,875,470,556

71
STATEMENTS OF EARNINGS AND RETAINED EARNINGS
Years ended December 31 Years ended April 30($ millions except per share amounts) 2002 2001 2000 1999 1999 1995 1990
Revenue 1,689.2 1,953.6 1,355.5 734.7 693.9 178.6 31.7Expenses:
Operating 1,191.0 1,238.9 871.0 486.3 450.5 122.4 24.7General and administrative 158.5 153.5 102.9 58.4 51.1 12.1 3.9Depreciation and amortization 141.4 145.1 101.3 67.2 61.1 9.8 1.1Research and engineering 34.9 32.5 20.3 3.6 – – –Foreign exchange 4.4 2.0 1.8 (0.7) (0.4) – –
Operating earnings 159.0 381.6 258.2 119.9 131.6 34.3 2.0Interest, net 35.2 43.5 28.7 16.5 18.9 1.5 1.2Dividend income – (1.1) – (1.4) (17.8) (0.7) –Gain on disposal of investments and subsidiary (0.9) (1.8) – (24.9) (17.0) – –Reduction of carrying amount of investments – – – 13.1 11.0 – –Reduction of carrying amount of property,
plant and equipment – – – 10.2 10.2 – 5.1Forgiveness of long-term debt – – – – – – (5.2)Earnings before taxes, non-controlling
interest and goodwill amortization 124.7 341.0 229.5 106.4 126.3 33.5 0.9Income taxes 32.3 121.8 76.6 55.0 58.0 16.4 –Earnings before non-controlling interest and
goodwill amortization 92.4 219.2 152.9 51.4 68.3 17.1 0.9Non-controlling interest 1.1 0.9 – – – 0.2 –Earnings before goodwill amortization 91.3 218.3 152.9 51.4 68.3 16.9 0.9Goodwill amortization – 31.8 22.8 15.8 14.9 – –Net earnings 91.3 186.5 130.1 35.6 53.4 16.9 0.9Retained earnings, beginning of period 528.8 342.3 282.2 246.6 206.9 20.7 5.7Adjustment on adoption of liability method
of accounting for income taxes – – (70.0) – – – –Adjustment on purchase and cancellation
of share capital – – – – – (0.2) –Retained earnings, end of period 620.1 528.8 342.3 282.2 260.3 37.4 6.6Earnings before goodwill amortization per share:
Basic ($) 1.70 4.12 3.14 1.16 1.62 1.03 0.08Diluted ($) 1.66 4.03 3.03 1.14 1.60 1.00 – (1)
Earnings per share:Basic ($) 1.70 3.52 2.67 0.80 1.27 1.03 0.08Diluted ($) 1.66 3.44 2.58 0.79 1.25 1.00 – (1)
(1) Not available.

72
Additional Selected Financial Data
Years ended December 31 Years ended April 30($ millions except per share amounts) 2002 2001 2000 1999 1999 1995 1990
Returns:Return on sales (1) 5.4% 9.5% 9.6% 4.8% 7.7% 9.5% 2.8%Return on assets (2) 3.4% 7.3% 7.5% 2.7% 9.3% 14.7% 3.2%Return on equity (3) 6.1% 14.0% 13.4% 4.4% 15.9% 29.1% 7.0%
Financial position:Working capital 210.3 215.9 157.7 162.9 91.2 8.4 3.8Current ratio 1.54 1.56 1.42 1.85 1.54 1.21 1.53Property, plant, equipment
and intangibles 1,593.8 1,492.6 1,287.9 761.6 683.5 66.8 15.7Total assets 2,760.0 2,651.4 2,387.9 1,436.3 1,247.7 119.1 27.4Long-term debt 514.9 496.2 548.1 226.8 215.0 1.4 5.6Shareholders’ equity 1,533.0 1,416.0 1,206.8 910.1 768.3 67.0 12.7Long-term debt to shareholders’ equity 0.34 0.35 0.45 0.25 0.28 0.02 0.44
Other Financial Data:Net capital expenditures excluding
business acquisitions 239.5 340.7 180.5 41.1 88.3 11.8 1.1EBITDA (4) 300.5 526.8 359.5 187.1 192.7 44.1 3.1EBITDA – % of revenue 17.8% 27.0% 26.5% 25.5% 27.8% 24.7% 9.8%Operating earnings 159.0 381.6 258.2 119.9 131.6 34.3 2.0Operating earnings – % of revenue 9.4% 19.5% 19.1% 16.3% 19.0% 19.2% 6.2%Cash flow (5) 194.8 465.7 297.9 101.5 95.8 28.3 2.0Cash flow per share ($)
Basic 3.63 8.79 6.11 2.28 2.27 1.73 0.18Diluted 3.55 8.59 5.91 2.24 2.25 1.68 –(8)
Book value per share ($) (6) 28.35 26.63 23.08 19.30 18.12 4.09 1.12Price earnings ratio (7) 30.0 11.7 21.1 46.3 19.8 6.7 17.4Weighted average common shares
outstanding (000’s) 53,702 52,953 48,722 44,500 42,086 16,398 11,218
(1) Return on sales was calculated by dividing net earning by total revenues.(2) Return on assets was calculated by dividing net earnings by quarter average total assets.(3) Return on equity was calculated by dividing net earnings by quarter average total shareholders’ equity.(4) Earnings before net interest, taxes, depreciation, amortization, non-controlling interest, dividend income, gain on disposal of
investments and subsidiary, reduction in carrying amounts of investments and property, plant and equipment and forgivenessof long-term debt. EBITDA is not a recognized measure under Canadian GAAP. Management believes that in addition to netearnings, EBITDA is a useful supplemental measure as it provides an indication of the results generated by the Corporation'sprincipal business activities prior to consideration of how those activities are financed or how the results are taxed in variousjurisdictions and prior to the impact of depreciation and amortization. Investors should be cautioned, however, that EBITDAshould not be construed as an alternative to net earnings determined in accordance with GAAP as an indicator of Precision'sperformance. Precision's method of calculating EBITDA may differ from other companies and, accordingly, EBITDA may not becomparable to measures used by other companies.
(5) Funds provided from operations excluding forgiveness of debt for 1990.(6) Book value per share was calculated by dividing shareholders’ equity by common shares outstanding.(7) Year end closing price divided by basic earnings per share.(8) Not available.

73
StewardshipGuidance and

74
Corporate Governance
INTRODUCTION
Precision’s Board of Directors is comprised of experienced, proven leaders representing a diverse group of
professions and industries in Canada and the U.S. There were eight Directors as of December 31, 2002.
Together, the Directors work to help our Corporation realize its full potential by sharing their creative vision,
initiative and sense of how outside events and developments can affect Precision’s future. They bring sound
judgment, integrity and independence of thought to the task and are encouraged to speak their minds, while
respecting others, so that different viewpoints can flourish in the process of developing a sensible consensus.
Precision’s Board is responsible for maintaining our Corporation’s high standards, managing the evolution of
our Corporate Governance program to comply with current regulatory trends, and providing stewardship of the
Corporation.
STEWARDSHIP
The Board oversees the management of the business affairs of the Corporation, discharging its responsibilities
either directly or through Board committees. The Board encourages Precision’s management, led by the President
and Chief Executive Officer (CEO), to be strong leaders and make clear and appropriate executive decisions.
Among its many specific duties, the Board:
❚ selects, evaluates, sets the compensation for and, if necessary, replaces the CEO;
❚ provides advice and counsel to the CEO, nominates Directors and evaluates Board performance;
❚ holds an annual formal strategic planning session and approves strategic plans and objectives, major
decisions and corporate plans;
❚ oversees the ethical, legal and social conduct of the organization, and reviews the financial performance
and condition of the Corporation;
❚ identifies and considers risks in the operations of Precision and establishes policies for monitoring and
managing those risks;
❚ provides succession planning for senior management;
❚ represents the interests of all shareholders in general and not of just one group.
An orientation program for new Directors is in place and individual Directors can engage outside consultants
with the authorization of the Corporate Governance and Nominating Committee.
Board policy limits non-employee Directors to terms of no longer than 15 years on the Board, with an age
limit of 70 years.
BOARD COMMITTEES
The Board of Directors has established an Audit Committee, a Compensation Committee and a Corporate
Governance and Nominating Committee. All Board committees are composed of outside, independent directors.
Full details of committee mandates are set out in the Management Information Circular.
All members of each committee attended all meetings either in person or by telephone. In 2002, the Audit
Committee met five times, the Compensation Committee met three times and the Corporate Governance and
Nominating Committee met six times.

75
Summary of Meeting Attendance
Board Committee
Meetings (1) Meetings (1)
Director Attended Attended
W. C. (Mickey) Dunn 8 of 9 6 of 6Robert J. S. Gibson 7 of 9 11 of 11Steven C. Grant 9 of 9 8 of 8Murray K. Mullen 9 of 9 3 of 3Patrick M. Murray (appointed July 31, 2002) 4 of 4 (2) 1 of 1 (3)
Fred W. Pheasey (appointed July 31, 2002) 4 of 4 (2) 2 of 2 (3)
Hank B. Swartout 9 of 9 0 of 0H. Garth Wiggins 8 of 9 5 of 5
(1) Attendance in person or by telephone.(2) Five meetings were held prior to July 31, 2002.(3) Four meetings were held prior to July 31, 2002.
INDEPENDENCE AND ACCOUNTABILITY
The Corporate Governance and Nominating Committee is responsible for recommending to the Board its size,
composition and membership, succession planning for Directors and Board committee structure. Seven members
of Precision’s Board are independent and “unrelated” to our Corporation.
Hank B. Swartout is the only “related” Director, serving as Chairman of the Board and Precision’s President
and Chief Executive Officer. The Corporate Governance and Nominating Committee has concluded this dual role
does not impair the Board’s ability to function independently of management. Mr. Swartout’s extensive
knowledge of Precision’s business is beneficial to the rest of the Directors. To further reinforce independence, the
Board appoints a Chairman from the independent Directors present at each regularly held in-camera session.
COMPENSATION
The Compensation Committee annually reviews and recommends the compensation for non-employee
Directors. Those Directors receive an annual retainer of US $16,000 per year. They also receive board and
committee meeting fees of US $1,000 for attendance in person and US $500 for attendance by telephone.
Committee Chairs receive a retainer of US $5,000. Related travel and out-of-pocket expenses are reimbursed.
Shareholdings of Board Members
❚ Total Common Shares held by the non-employee Directors: 54,000.
❚ Total Stock Options held by the non-employee Directors: 160,000.
REGULATORY INITIATIVES
As a result of the many recently reported bankruptcies and other failures of large United States companieswhich stem from apparent inadequacies in corporate governance and appropriate disclosure to the public, theCongress of the United States has passed legislation known as the Sarbanes-Oxley Act which has mandatednumerous changes in how companies govern themselves and disclose information. Precision Drilling Corporationis now subject to the new U.S. rules due to the fact that it is listed on the New York Stock Exchange.
The New York Stock Exchange has also mandated additional corporate governance requirements for listedcorporations.
In response, the Corporate Governance and Nominating Committee has determined that the Board ofDirectors and its Committees and the Corporation have processes in place or are implementing further steps tocomply with these new rules and initiatives within the prescribed timeframe.

76
Directors
W.C. (Mickey) Dunn (3) — Edmonton, Alberta
A member of Precision’s Board of Directors since September 1992, Mr. Dunn has been Chairman of TrueEnergy Ltd., a publicly traded oil and gas exploration company, since January 2000. Previously, he was Presidentand a Director of Cardium Service and Supply Limited.
Robert J. S. Gibson (1) (3) — Calgary, Alberta
Mr. Gibson has been President of a private investment firm, Stuart & Company Limited, since 1973 and isalso Managing Director of Alsten Holdings Ltd. He has been a Director of Precision since June 1996.
Steven C. Grant (2) — Houston, Texas
Mr. Grant is currently the Managing Director of Investment Banking at Raymond James & Associates inHouston. Previously, he was the Senior Vice President and Chief Financial Officer of Enterra Corporation inHouston, Texas. He has been a Director of Precision since May 2000.
Murray K. Mullen (2) — Calgary, Alberta
Mr. Mullen joined Mullen Trucking Ltd. in 1977 and is currently Chairman, President and Chief ExecutiveOfficer of Mullen Transportation Inc., a publicly traded company whose shares are listed on the Toronto StockExchange. Mr. Mullen has been a Director of Precision since September 1996 and is active in professional andcommunity organizations.
Patrick M. Murray (1) — Dallas, Texas
Mr. Murray is President and Chief Executive Officer of Dresser, Inc. and has been a Director of Precision sinceJuly 2002. A member of the American Petroleum Institute, and the Society of Petroleum Engineers, he is also aboard member of the Valve Manufacturers Association, the Petroleum Equipment Suppliers Association andHouston-based Harvest Natural Resources, Inc.
Frederick W. Pheasey (3) — Edmonton, Alberta
Mr. Pheasey is currently the Executive Vice President and a Director of National-Oilwell, Inc. Previously, hewas the founder and Board Chairman of Dreco Energy Services, which was acquired by National-Oilwell in 1987.Mr. Pheasey has been a Director of Precision since July 2002.
Hank B. Swartout — Calgary, Alberta
Mr. Swartout has been Chairman, President and Chief Executive Officer of Precision Drilling Corporationsince 1985. Previously, he held positions as Manager of Bawden Western Oceanic Offshore, Vice President of RigDesign and Construction for Dreco, and Manager of Construction for Nabors Drilling Canada.
H. Garth Wiggins (1) — Calgary, Alberta
Mr. Wiggins has been the President of a private investment firm, Kamloops Money Management, since 1993.He is also currently a Principal at Kenway, Mack, Slusarchuk, Stewart Chartered Accountants. Previously, he wasVice President Finance and Chief Financial Officer of Tri Link Resources Ltd. and a partner of Farvolden, Wiggins,Balderston Chartered Accountants. He has been a Director of Precision since September 1997.
(1) Audit Committee member.(2) Compensation Committee member.(3) Corporate Governance and Nominating Committee member.

77
Shareholder Information
HEAD OFFICE
Precision Drilling Corporation4200, 150-6th Avenue S.W.Calgary, Alberta, Canada T2P 3Y7Telephone: 403-716-4500Facsimile: 403-264-0251Website: www.precisiondrilling.com
INTERNATIONAL CENTERS
United StatesSuite 1700363 N. Sam Houston Parkway EastHouston, Texas 77060, USTelephone: 281-260-5600Facsimile: 281-260-5670
Latin AmericaAvenida la EstanciaCentro Ciudad ComercialTamanaco (CCCT)Torre B, Piso 1, Oficina B-105Chuao, Caracas, VenezuelaCodigo Postal 1064Telephone: 58-212-959-6211Facsimile: 58-212-959-3595
Europe/AfricaEddesser Strasse 131234 Edemissen, GermanyTelephone: 49-5176-989650Facsimile: 49-5176-989670
Middle EastP. O. Box 2146 Bin Arrar BuildingFloor 2, Office Number 2Al Najda Street, Abu Dhabi,United Arab EmiratesTelephone: 971-2-6747-333Facsimile: 971-2-6747-373
Asia/Pacific4th Floor, Graha ElnusaJL. T.B. Sirnatupang Kav 1BJakarta, 12560 IndonesiaTelephone: 62-21-7854-6300Facsimile: 62-21-7884-1266
OTHER INTERNATIONAL OFFICES
Barbados2nd Floor Trident House,Broad Street, Bridgetown,Barbados, West IndiesTelephone: 246-228-4293Facsimile: 246-426-5992
MexicoAv. Ind. Rio San JuanManzana 7, Lote 6,Parque Industrial del Norte,Cd. Reynosa, Tamaulipas,Mexico C.P. 88730Telephone: 52-8-929-5104Facsimile: 52-8-929-5114
VenezuelaAvenida Intercomunal El
Tigre-El Tigrito,Al Lado de American Diesel,El Tigre, Estado Anzoategui,VenezuelaTelephone: 58-2832-412701Facsimile: 58-2832-412228
DIRECTORS
(See page 76 for listing and biographies.)
OFFICERS
Hank B. SwartoutChairman of the Board,President and Chief ExecutiveOfficer
Dale E. TremblaySenior Vice President Financeand Chief Financial Officer
John R. KingSenior Vice PresidentTechnology Services Group
M.J. (Mick) McNultySenior Vice President Operations Finance
R.T. (Bob) GermanVice President and Chief Accounting Officer
Jan M. CampbellCorporate Secretary
BANKERRoyal Bank of CanadaCalgary, Alberta
LEGAL COUNSELBorden Ladner Gervais LLP
Calgary, Alberta
AUDITORSKPMG LLP
Calgary, Alberta

78
Shareholder Information
STOCK EXCHANGE LISTINGS
Common shares of PrecisionDrilling Corporation are listed onThe Toronto Stock Exchange underthe trading symbol PD and on theNew York Stock Exchange underthe trading symbol PDS.
SHARE SPLIT
In 1997, Precision’s Board ofDirectors authorized a two for onesplit of the Corporation’s commonshares. The record date for the splitwas September 30, 1997.
TRADING PROFILE
Toronto (TSX)January 1, 2002, to December 31, 2002
High: $61.30 Low: $36.74Volume traded: 71,094,220
New York (NYSE)January 1, 2002, to December 31, 2002
High: US $39.24 Low: US $23.10 Volume traded: 70,962,200
Annual Share Trading Volumes
As a Precision Drilling Corporation
shareholder, you are invited to take
advantage of shareholder services
or to request more information
about the Corporation.
TRANSFER AGENT AND REGISTRAR
Computershare Trust Company of Canada
Calgary, Alberta
TRANSFER POINT
Computershare Trust Company, Inc.
New York, New York
ACCOUNT QUESTIONS
Our Transfer Agent can help youwith a variety of shareholderrelated services, including:
❚ Change of address
❚ Lost share certificates
❚ Transfer of stock to another
person
❚ Estate Settlement
You can call our Transfer Agenttoll free at: 1-888-267-6555
You can write to them at:
Computershare Trust Companyof Canada
100 University Avenue, 9th FloorToronto, Ontario M5J 2Y1
Or you can email them at:[email protected]
Shareholders of record who receivemore than one copy of this annualreport can contact our TransferAgent and arrange to have theiraccounts consolidated. Shareholderswho own Precision shares through abrokerage firm can contact theirbroker to request consolidation oftheir accounts.
QUARTERLY UPDATES
If you would like to receivequarterly reports but are not aregistered shareholder, please write or call us with your name andaddress. To receive our newsreleases by fax, please forward yourfax number to us.
ONLINE INFORMATION
To receive our news releases by e-mail, or to view this annualreport, please visit our website atwww.precisiondrilling.com and refer to the Investor Relations section.
PUBLISHED INFORMATION
If you wish to receive copies ofthe 2002 Renewal AnnualInformation Form as filed with theCanadian securities commissionsand as filed under Form 40-F withthe U.S. Securities and ExchangeCommission, or additional copiesof this annual report, pleasecontact:
Corporate Secretary Precision Drilling Corporation4200, 150-6th Avenue SWCalgary, Alberta T2P 3Y7Telephone: 403-716-4500Facsimile: 403-264-0251
ESTIMATED QUARTERLY RELEASE DATES
2003 First Quarter May 1, 2003
2003 Second QuarterAugust 1, 2003
2003 Third QuarterOctober 30, 2003
Millions
0
20
40
60
80
100
NYSE
TSX
0201009998

Glossary of Terms
Borehole. Also known as thewellbore, this is the hole made bythe drillbit, including the open oruncased part of the well.
Cased hole. The part of the wellborewhich has been protected by metalcasing to prevent fluid, pressure, andstability problems.
Carbonate. A class of sedimentaryrock; common examples includelimestone, dolomite and chalk.
Coiled tubing. A length ofcontinuous steel tubing wound on aspool that is used for various welldrilling or workover operations.
Coke. The hard black carbonsubstance that remains in refiningprocesses after distillation ofhydrocarbons.
Completion. The process ofassembling downhole tubing andequipment to finish a well so that itcan safely produce oil or gas.
Controlled pressure drilling. Uses adrilling fluid with a hydrostaticpressure that is lower than thattraditionally used to drill through azone. The hydrostatic pressure maybe reduced to allow the well to flowduring the drilling operation in acontrolled manner.
Dogleg. The rate of directionalchange in a wellbore, usuallyexpressed as degrees per 100 feet.
Deviation. The angle a wellbore takesfrom the vertical direction (driftangle).
Directional drilling. The use ofequipment and engineering tointentionally change the angle ofthe wellbore so that drillingefficiency can be enhanced orformations or obstructions can becircumvented in order to reach thepay zone.
Drillstring. Comprised of a string oftools, including the drillpipe, bottomhole assembly and any other toolsneeded to make the drill bit rotate atthe bottom of the wellbore.
Electromagnetic (EM) telemetry. Adata communication method thatworks on the principle oftransmission of an electromagneticwave along the drillstring to surfacewhere the data is detected anddecoded by a surface transceiver.
Formation evaluation. Measurementof formation properties in thewellbore to determine the presenceof hydrocarbons.
Fracturing. A method of stimulatingproduction in formations which havelow permeability. High-pressurefluids and solids are pumped into theface of the formation to createfractures and fissures through whichhydrocarbons can flow.
Gamma ray technology. Measures thenatural occurring radiation informations. Primarily used as alithology indicator to differentiatebetween shales and sandstones.
Heavy oil. Viscous, high-density oil.
Oil sands. A porous sandstoneformation that contains oil.
Horizontal drilling. Directionaldrilling technique where thewellbore inclination approaches orexceeds 90 degrees from vertical.
Liner hanger. Devices used duringwell completion to attach liners tothe internal well instead of fullcasing strings. Liners that hang fromthe end of larger casing can savesignificant money on casing costs.
Logging-while-drilling (LWD)technology. Uses downhole tools tomeasure formation properties in realtime while the well is being drilled.Properties measured includeformation resistivity, porosity anddensity.
Measurement-while-drilling (MWD)technology. Uses downhole tools tomeasure wellbore properties in realtime while the well is being drilled.Properties measured includewellbore inclination and azimuth,downhole pressure, temperature,drillstring vibration and shock.
Mud-pulse telemetry. Thetransmission of downholeinformation to the surface whiledrilling by pressure pulses in thedrilling mud.
Open hole. The part of a well that isnot cased. This can be the completewellbore immediately after the wellis drilled, or the section of thewellbore that occurs below thecasing after completion.
Point-the-bit technology. Method ofchanging the direction of thewellbore by deflecting the drillstring,causing the bit to drill in theopposite direction from thedeflection.
Polycrystalline diamond compact(PDC) bits. A type of bit that usescutters with synthetic diamond disksto shear rock with a continuousscraping motion.
Ranging tool. A device used duringSAGD to steer a well path alongsidea previously drilled well.
Rotary steerable system. A tooldesigned for directional drilling thatallows wellbore direction to bechanged while drilling withcontinuous rotation from thesurface.
Steam assisted gravity drainage(SAGD). A technique used to extractheavy oils. A horizontal productionwell is drilled through the reservoir,and a second horizontal well, usedfor steam injection, is drilled a fewmeters above the first well. Steam isinjected into the upper well, heatingthe oil in the lower well andallowing it to flow more easily.
Snubbing. A procedure movingdrillpipe or tubing in and out of awellbore when the well is underpressure.
Wireline. Single-strand ormultistrand cable used to lowerevaluation tools into the boreholeand to transmit data
Workover. The repair or servicing ofa producing well to restore orincrease production.

2002 ANNUAL REPORT
Precision Drilling Corporation
4200, 150-6th Avenue SW
Calgary, Alberta, Canada T2P 3Y7
Telephone: 403-716-4500
Facsimile: 403-264-0251
Website: www.precisiondrilling.com
Related Documents


![Toronto Hydro Corporation · Toronto Hydro Corporation NOTES TO INTERIM CONSOLIDATED FINANCIAL STATEMENTS [all tabular amounts in thousands of dollars, unaudited] September 30, …](https://static.cupdf.com/doc/110x72/5ae50e617f8b9a5b348f97dd/toronto-hydro-corporation-hydro-corporation-notes-to-interim-consolidated-financial.jpg)