PLATTS CRUDE OIL MARKETS ASIA 2013 Goodwood Park Hotel, Singapore September 18-19, 2013 Developing New Supply Opportunities with Russia: The Philippines’ Perspective ATTY. JOSE M. LAYUG, JR. Senior Partner , Puno & Puno Law Offices Philippine Energy Expert, University of the Philippines College of Law

Welcome message from author
This document is posted to help you gain knowledge. Please leave a comment to let me know what you think about it! Share it to your friends and learn new things together.
Transcript

PLATTS
CR
UD
E OIL
MA
RK
ETS A
SIA
20
13
G
oodwood P
ark Hotel, S
ingapore S
eptember 1
8-1
9, 2
01
3
Developing New Supply Opportunities with Russia:
The Philippines’ Perspective ATTY. JOSE M. LAYUG, JR.
Senior Partner , Puno & Puno Law Offices Philippine Energy Expert, University of the
Philippines College of Law
1. Energy Supply and Demand Situation
2. Philippines’ Growth: Drivers of Oil Demand
3. The Downstream Oil Industry Framework
4. Tapping Russia as New Supply Center
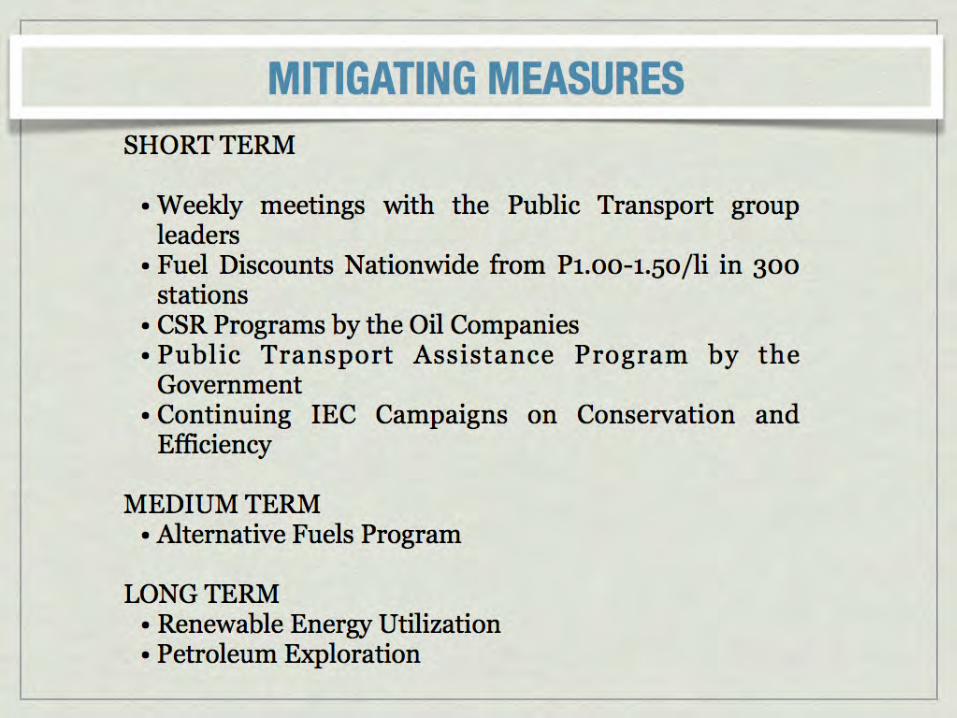
5. Mitigating Measures
DISCUSSION OUTLINE
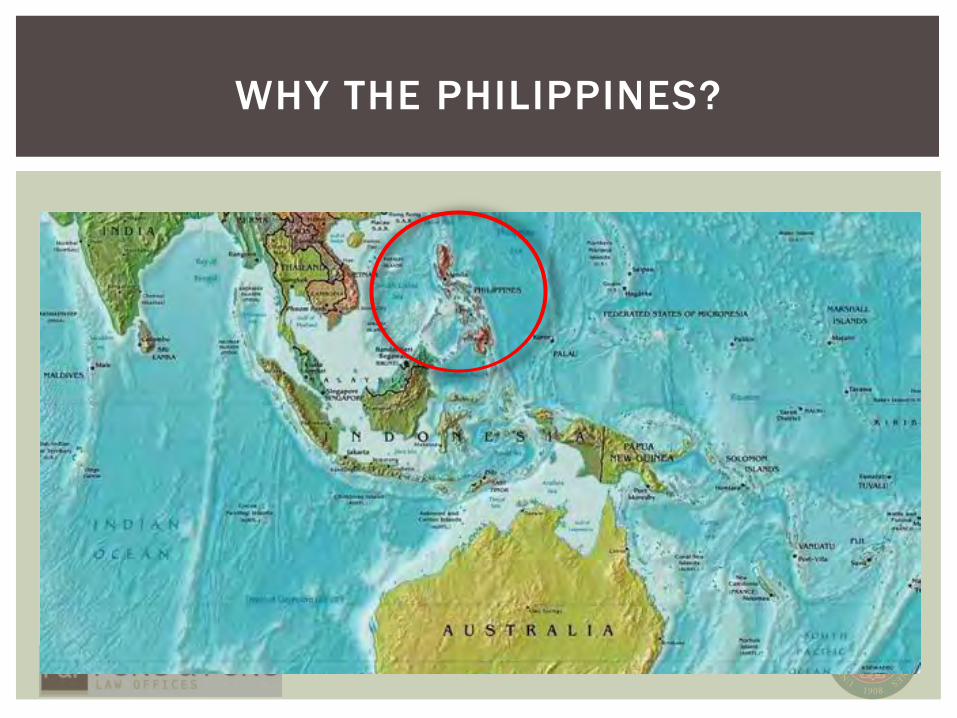
WHY THE PHILIPPINES?
ENERGY SUPPLY AND DEMAND SITUATION
PH
ILIPP
INES
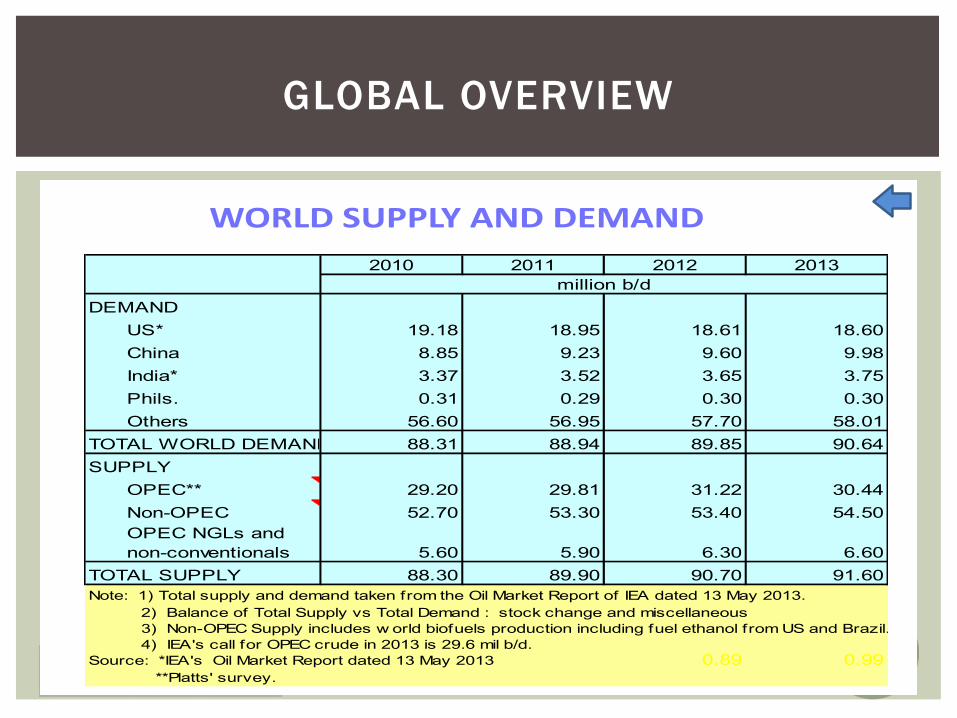
WORLD SUPPLY AND DEMAND 2010 2011 2012 2013
DEMANDUS* 19.18 18.95 18.61 18.60China 8.85 9.23 9.60 9.98India* 3.37 3.52 3.65 3.75Phils. 0.31 0.29 0.30 0.30Others 56.60 56.95 57.70 58.01
TOTAL WORLD DEMAND 88.31 88.94 89.85 90.64SUPPLY 0.01 0.01
OPEC** 29.20 29.81 31.22 30.44Non-OPEC 52.70 53.30 53.40 54.50OPEC NGLs and non-conventionals 5.60 5.90 6.30 6.60
TOTAL SUPPLY 88.30 89.90 90.70 91.60Note: 1) Total supply and demand taken from the Oil Market Report of IEA dated 13 May 2013. 2) Balance of Total Supply vs Total Demand : stock change and miscellaneous
3) Non-OPEC Supply includes w orld biofuels production including fuel ethanol from US and Brazil. 4) IEA's call for OPEC crude in 2013 is 29.6 mil b/d.
Source: *IEA's Oil Market Report dated 13 May 2013 0.89 0.99 **Platts' survey.
million b/d
GLOBAL OVERVIEW
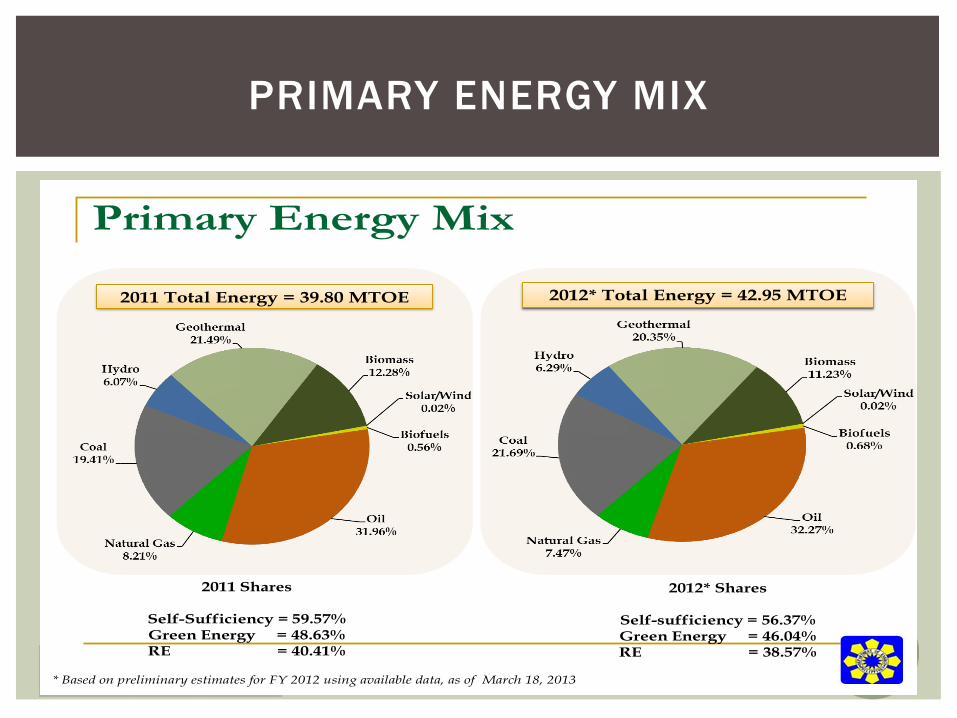
2011 Shares
Self-Sufficiency = 59.57% Green Energy = 48.63% RE = 40.41%
2011 Total Energy = 39.80 MTOE 2012* Total Energy = 42.95 MTOE
2012* Shares
Self-sufficiency = 56.37% Green Energy = 46.04% RE = 38.57%
* Based on preliminary estimates for FY 2012 using available data, as of March 18, 2013
Primary Energy Mix
PRIMARY ENERGY MIX
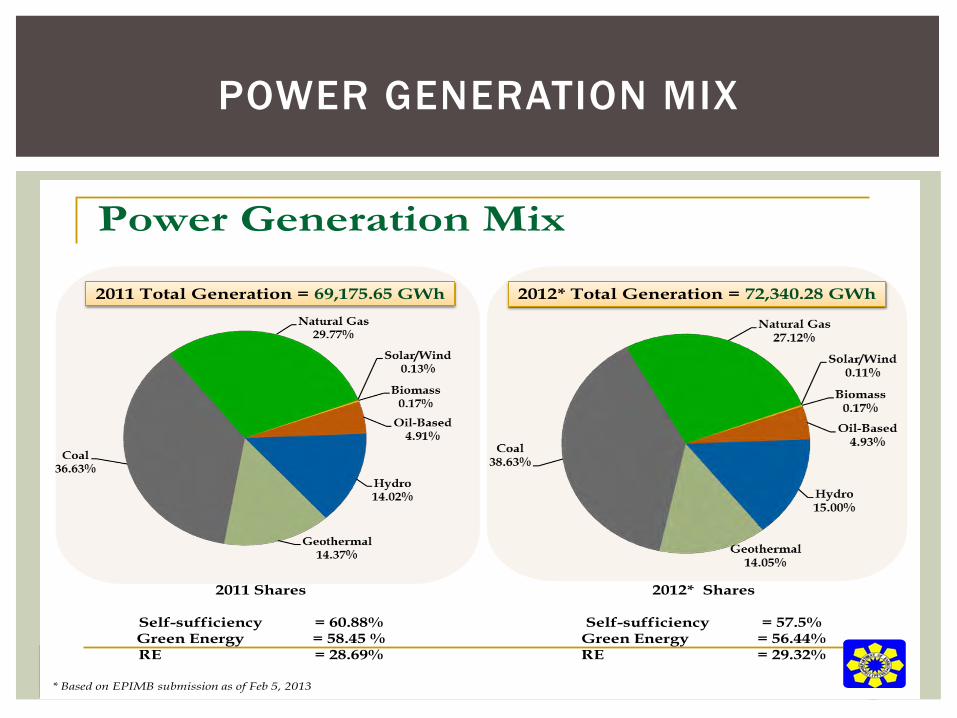
POWER GENERATION MIX
2011 Total Generation = 69,175.65 GWh 2012* Total Generation = 72,340.28 GWh
* Based on EPIMB submission as of Feb 5, 2013
2012* Shares
Self-sufficiency = 57.5% Green Energy = 56.44% RE = 29.32%
2011 Shares
Self-sufficiency = 60.88% Green Energy = 58.45 % RE = 28.69%
Power Generation Mix
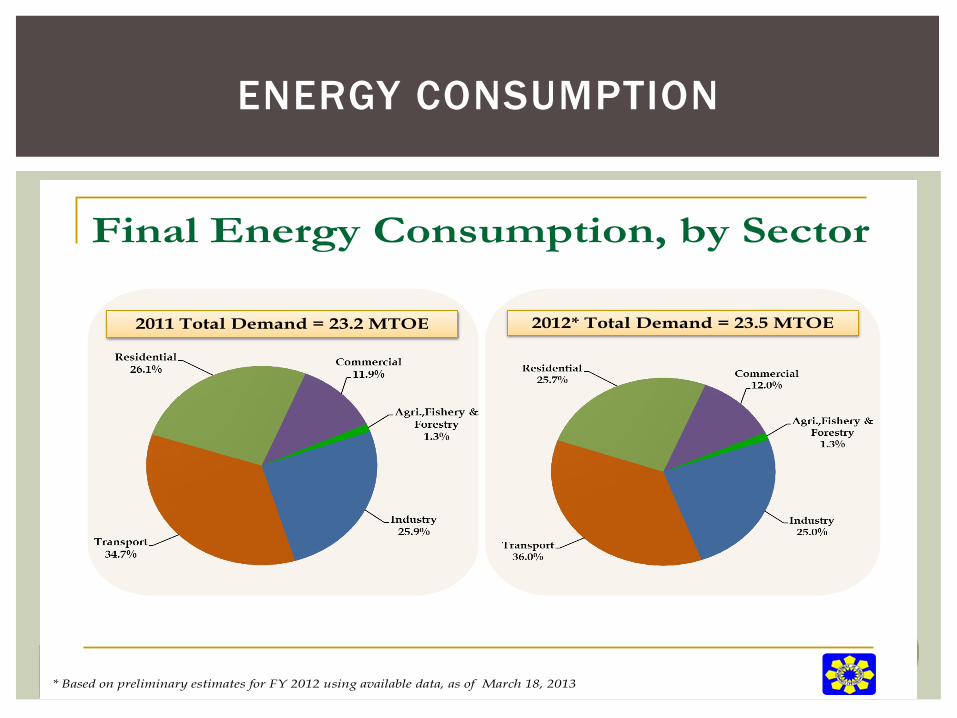
2011 Total Demand = 23.2 MTOE 2012* Total Demand = 23.5 MTOE
Final Energy Consumption, by Sector
* Based on preliminary estimates for FY 2012 using available data, as of March 18, 2013
ENERGY CONSUMPTION

2011 Total Demand = 23.2 MTOE 2012* Total Demand = 23.8 MTOE
Final Energy Consumption, by Fuel
* Based on preliminary estimates for FY 2012 using available data, as of March 18, 2013
ENERGY CONSUMPTION
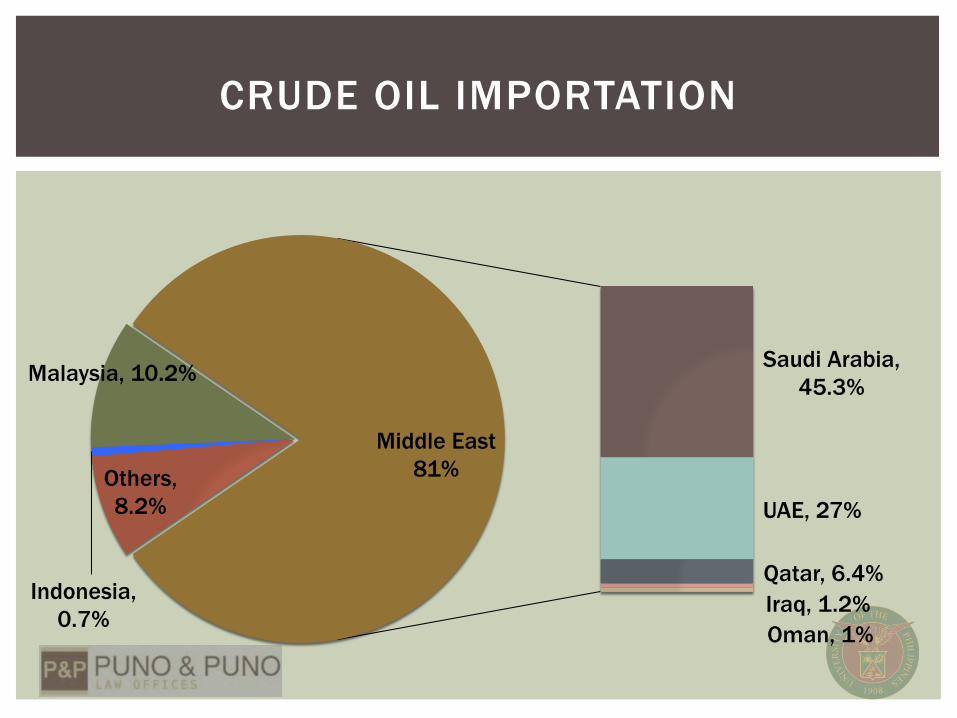
CRUDE OIL IMPORTATION
Others, 8.2%
Indonesia, 0.7%
Malaysia, 10.2% Saudi Arabia, 45.3%
UAE, 27%
Qatar, 6.4%
Oman, 1% Iraq, 1.2%
Middle East 81%
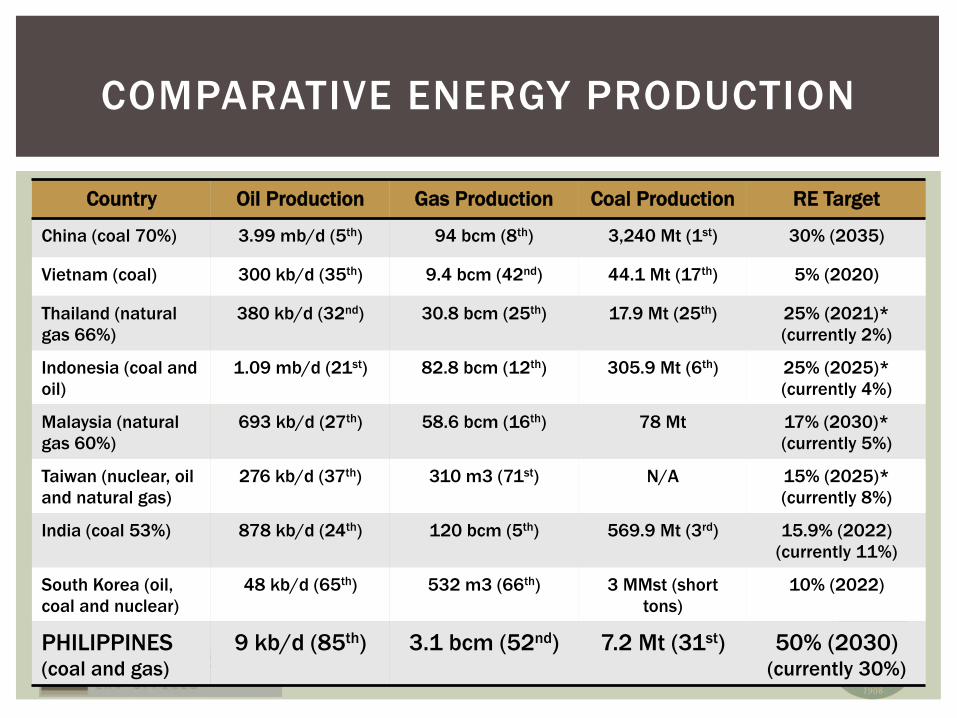
COMPARATIVE ENERGY PRODUCTION
Country Oil Production Gas Production Coal Production RE Target
China (coal 70%) 3.99 mb/d (5th) 94 bcm (8th) 3,240 Mt (1st) 30% (2035)
Vietnam (coal) 300 kb/d (35th) 9.4 bcm (42nd) 44.1 Mt (17th) 5% (2020)
Thailand (natural gas 66%)
380 kb/d (32nd) 30.8 bcm (25th) 17.9 Mt (25th) 25% (2021)* (currently 2%)
Indonesia (coal and oil)
1.09 mb/d (21st) 82.8 bcm (12th) 305.9 Mt (6th) 25% (2025)* (currently 4%)
Malaysia (natural gas 60%)
693 kb/d (27th) 58.6 bcm (16th) 78 Mt 17% (2030)* (currently 5%)
Taiwan (nuclear, oil and natural gas)
276 kb/d (37th) 310 m3 (71st) N/A 15% (2025)* (currently 8%)
India (coal 53%) 878 kb/d (24th) 120 bcm (5th) 569.9 Mt (3rd) 15.9% (2022) (currently 11%)
South Korea (oil, coal and nuclear)
48 kb/d (65th) 532 m3 (66th) 3 MMst (short tons)
10% (2022)
PHILIPPINES (coal and gas)
9 kb/d (85th) 3.1 bcm (52nd) 7.2 Mt (31st) 50% (2030) (currently 30%)
33
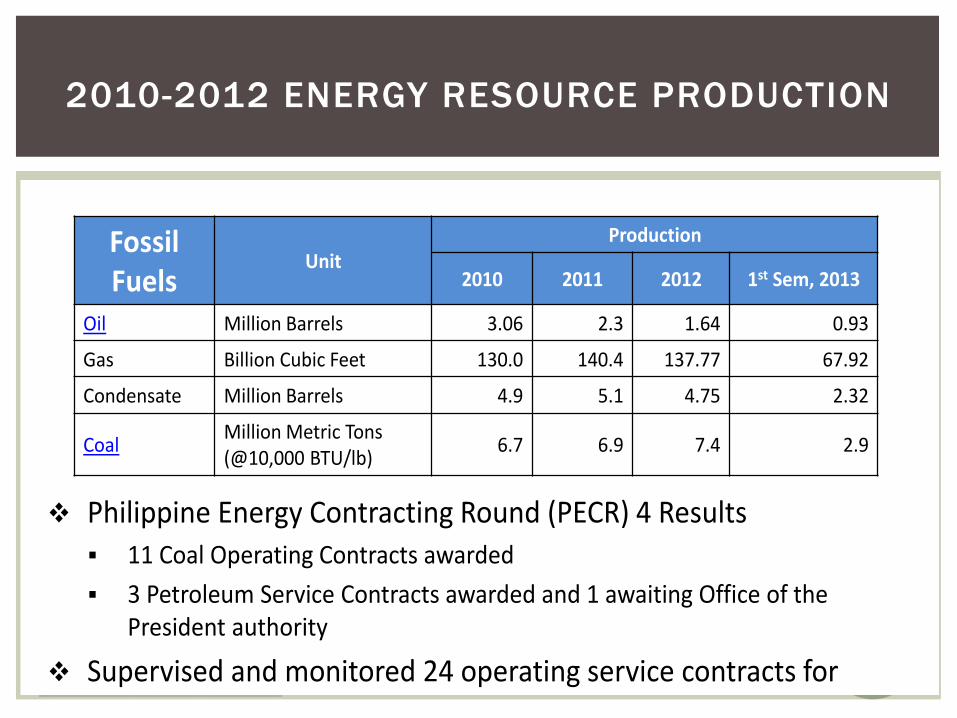
Enhanced Indigenous Energy Development
Fossil Fuels
Unit Production
2010 2011 2012 1st Sem, 2013
Oil Million Barrels 3.06 2.3 1.64 0.93
Gas Billion Cubic Feet 130.0 140.4 137.77 67.92
Condensate Million Barrels 4.9 5.1 4.75 2.32
Coal Million Metric Tons (@10,000 BTU/lb) 6.7 6.9 7.4 2.9
Philippine Energy Contracting Round (PECR) 4 Results 11 Coal Operating Contracts awarded 3 Petroleum Service Contracts awarded and 1 awaiting Office of the
President authority
Supervised and monitored 24 operating service contracts for petroleum and 71 for coal exploration and development
2010-2012 ENERGY RESOURCE PRODUCTION
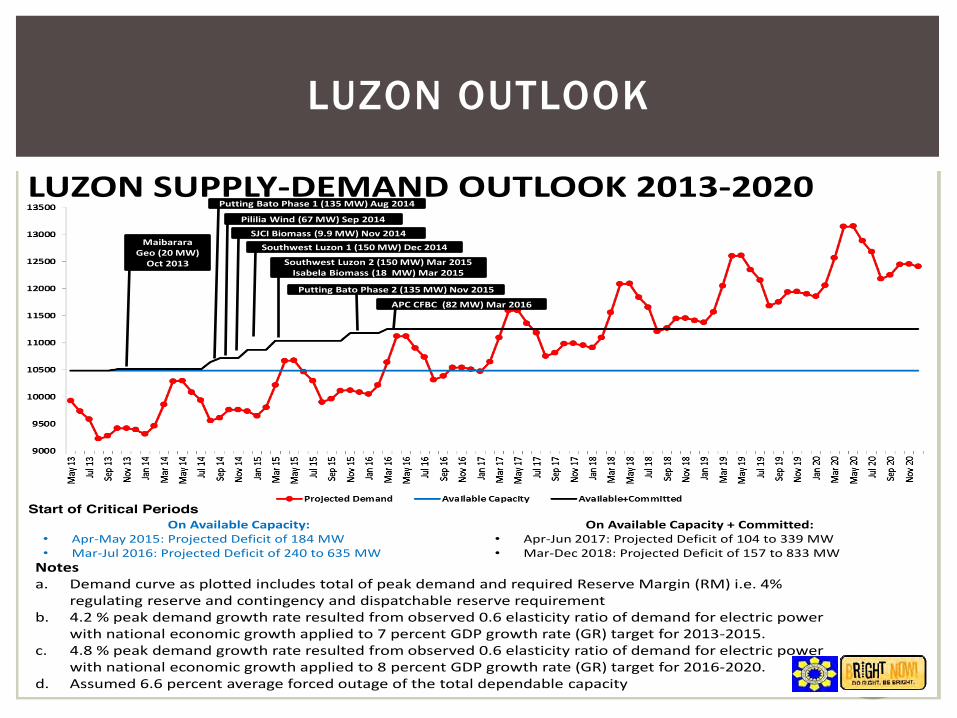
LUZON SUPPLY-DEMAND OUTLOOK 2013-2020
Notes a. Demand curve as plotted includes total of peak demand and required Reserve Margin (RM) i.e. 4%
regulating reserve and contingency and dispatchable reserve requirement b. 4.2 % peak demand growth rate resulted from observed 0.6 elasticity ratio of demand for electric power
with national economic growth applied to 7 percent GDP growth rate (GR) target for 2013-2015. c. 4.8 % peak demand growth rate resulted from observed 0.6 elasticity ratio of demand for electric power
with national economic growth applied to 8 percent GDP growth rate (GR) target for 2016-2020. d. Assumed 6.6 percent average forced outage of the total dependable capacity
On Available Capacity: • Apr-May 2015: Projected Deficit of 184 MW • Mar-Jul 2016: Projected Deficit of 240 to 635 MW
On Available Capacity + Committed: • Apr-Jun 2017: Projected Deficit of 104 to 339 MW • Mar-Dec 2018: Projected Deficit of 157 to 833 MW
Start of Critical Periods
Maibarara Geo (20 MW)
Oct 2013
Putting Bato Phase 1 (135 MW) Aug 2014
Pililia Wind (67 MW) Sep 2014 SJCI Biomass (9.9 MW) Nov 2014
Southwest Luzon 1 (150 MW) Dec 2014
Southwest Luzon 2 (150 MW) Mar 2015 Isabela Biomass (18 MW) Mar 2015
Putting Bato Phase 2 (135 MW) Nov 2015
APC CFBC (82 MW) Mar 2016
LUZON OUTLOOK
1600
1800
2000
2200
2400
2600
2800
3000
3200
May
13
Jul 1
3
Sep 1
3
Nov 1
3
Jan 14
Mar
14
May
14
Jul 1
4
Sep 1
4
Nov 1
4
Jan 15
Mar
15
May
15
Jul 1
5
Sep 1
5
Nov 1
5
Jan 16
Mar
16
May
16
Jul 1
6
Sep 1
6
Nov 1
6
Jan 17
Mar
17
May
17
Jul 1
7
Sep 1
7
Nov 1
7
Jan 18
Mar
18
May
18
Jul 1
8
Sep 1
8
Nov 1
8
Jan 19
Mar
19
May
19
Jul 1
9
Sep 1
9
Nov 1
9
Jan 20
Mar
20
May
20
Jul 2
0
Sep 2
0
Nov 2
0
Projected Demand Available Capacity Available+Committed
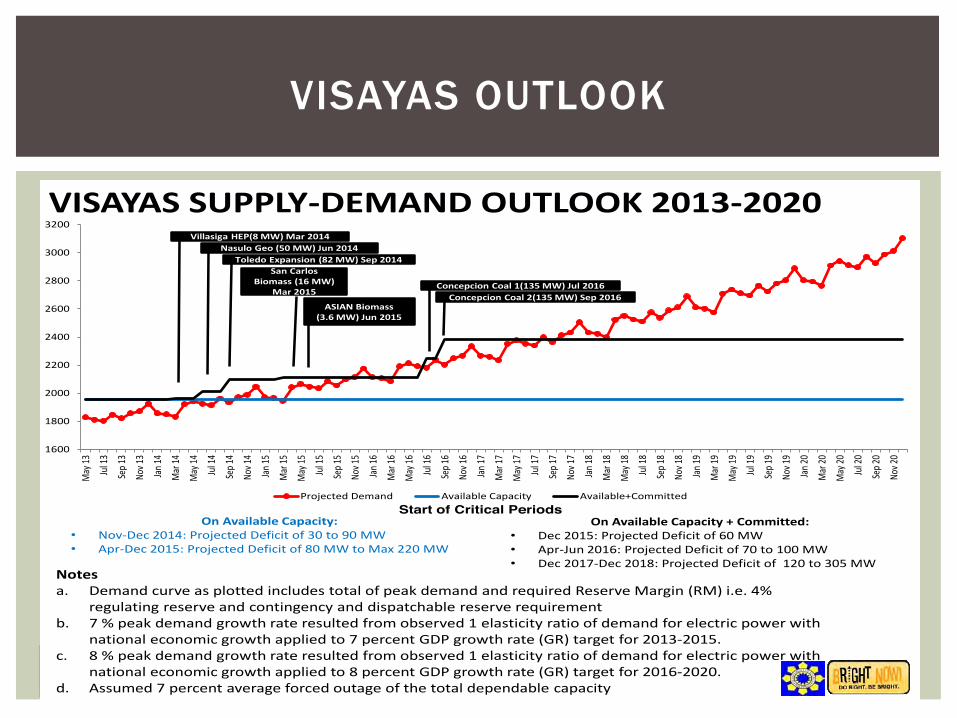
VISAYAS SUPPLY-DEMAND OUTLOOK 2013-2020
Notes a. Demand curve as plotted includes total of peak demand and required Reserve Margin (RM) i.e. 4%
regulating reserve and contingency and dispatchable reserve requirement b. 7 % peak demand growth rate resulted from observed 1 elasticity ratio of demand for electric power with
national economic growth applied to 7 percent GDP growth rate (GR) target for 2013-2015. c. 8 % peak demand growth rate resulted from observed 1 elasticity ratio of demand for electric power with
national economic growth applied to 8 percent GDP growth rate (GR) target for 2016-2020. d. Assumed 7 percent average forced outage of the total dependable capacity
On Available Capacity: • Nov-Dec 2014: Projected Deficit of 30 to 90 MW • Apr-Dec 2015: Projected Deficit of 80 MW to Max 220 MW
On Available Capacity + Committed: • Dec 2015: Projected Deficit of 60 MW • Apr-Jun 2016: Projected Deficit of 70 to 100 MW • Dec 2017-Dec 2018: Projected Deficit of 120 to 305 MW
Villasiga HEP(8 MW) Mar 2014 Nasulo Geo (50 MW) Jun 2014
Toledo Expansion (82 MW) Sep 2014
ASIAN Biomass (3.6 MW) Jun 2015
Concepcion Coal 1(135 MW) Jul 2016 Concepcion Coal 2(135 MW) Sep 2016
San Carlos Biomass (16 MW)
Mar 2015
Start of Critical Periods
VISAYAS OUTLOOK
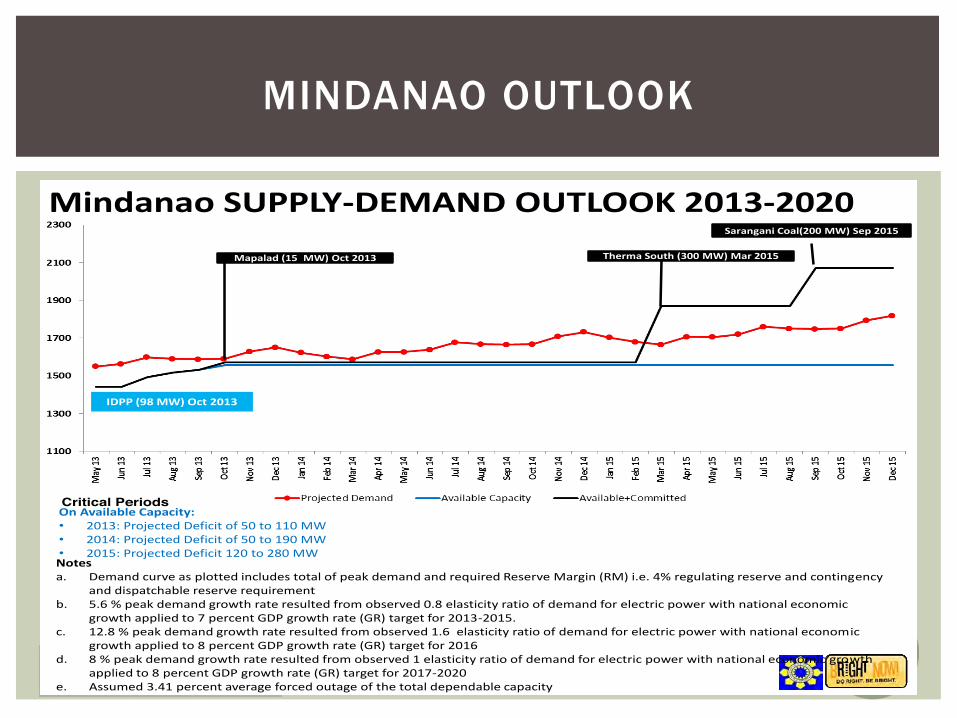
Mindanao SUPPLY-DEMAND OUTLOOK 2013-2020
Notes a. Demand curve as plotted includes total of peak demand and required Reserve Margin (RM) i.e. 4% regulating reserve and contingency
and dispatchable reserve requirement b. 5.6 % peak demand growth rate resulted from observed 0.8 elasticity ratio of demand for electric power with national economic
growth applied to 7 percent GDP growth rate (GR) target for 2013-2015. c. 12.8 % peak demand growth rate resulted from observed 1.6 elasticity ratio of demand for electric power with national economic
growth applied to 8 percent GDP growth rate (GR) target for 2016 d. 8 % peak demand growth rate resulted from observed 1 elasticity ratio of demand for electric power with national economic growth
applied to 8 percent GDP growth rate (GR) target for 2017-2020 e. Assumed 3.41 percent average forced outage of the total dependable capacity
On Available Capacity: • 2013: Projected Deficit of 50 to 110 MW • 2014: Projected Deficit of 50 to 190 MW • 2015: Projected Deficit 120 to 280 MW
Critical Periods
Mapalad (15 MW) Oct 2013 Therma South (300 MW) Mar 2015
Sarangani Coal(200 MW) Sep 2015
IDPP (98 MW) Oct 2013
MINDANAO OUTLOOK
PHILIPPINES GDP: DRIVERS OF OIL DEMAND
PH
ILIPP
INES
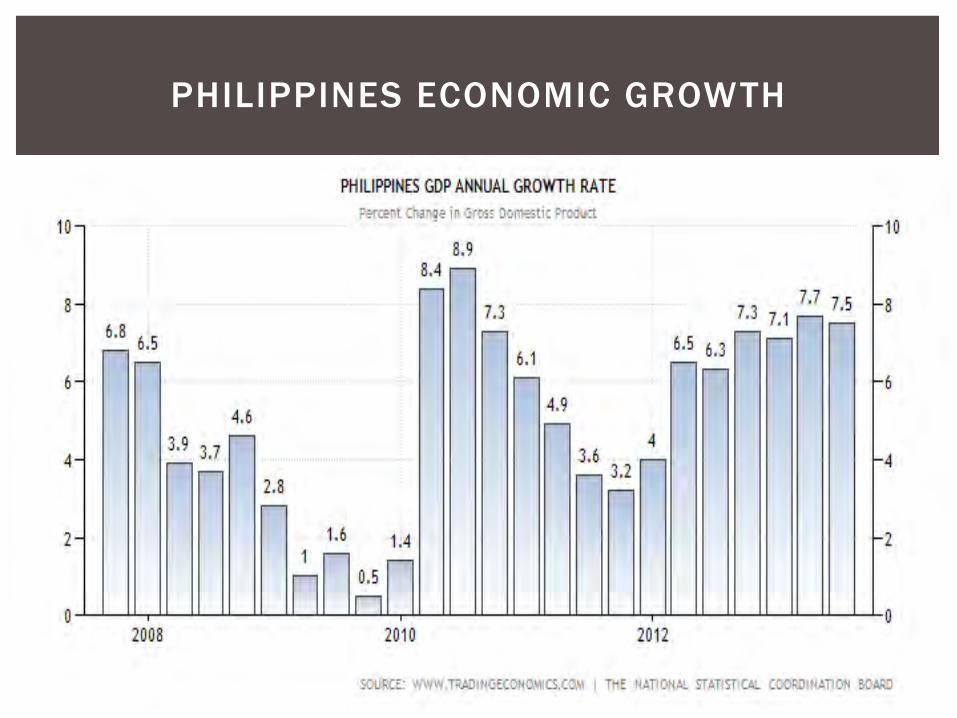
PHILIPPINES ECONOMIC GROWTH
PHILIPPINE ECONOMY
Slide No. 1NATIONAL STATISTICAL COORDINATION BOARDIntegrity • Independence • Professionalism
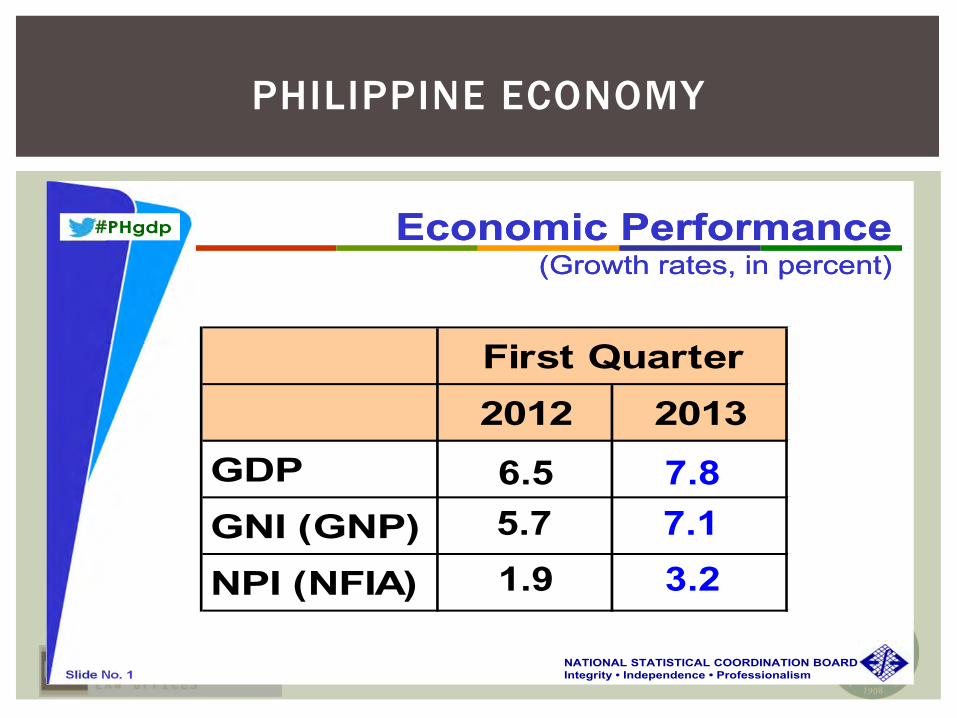
#PHgdp Economic Performance(Growth rates, in percent)
Economic Performance(Growth rates, in percent)
2012 2013GDPGNI (GNP)NPI (NFIA)
First Quarter
7.86.5
3.21.97.15.7

Slide No. 3NATIONAL STATISTICAL COORDINATION BOARDIntegrity • Independence • Professionalism
#PHgdp Per Capita GDP, GNI, HFCE(Growth rates, in percent)
Per Capita GDP, GNI, HFCE(Growth rates, in percent)
2013Q1 Q4 Q1
GDPGNI (GNP)HFCE (PCE)
2012
6.1
3.45.3
4.54.65.3
5.14.04.7
PHILIPPINE ECONOMY
Slide No. 6NATIONAL STATISTICAL COORDINATION BOARDIntegrity • Independence • Professionalism
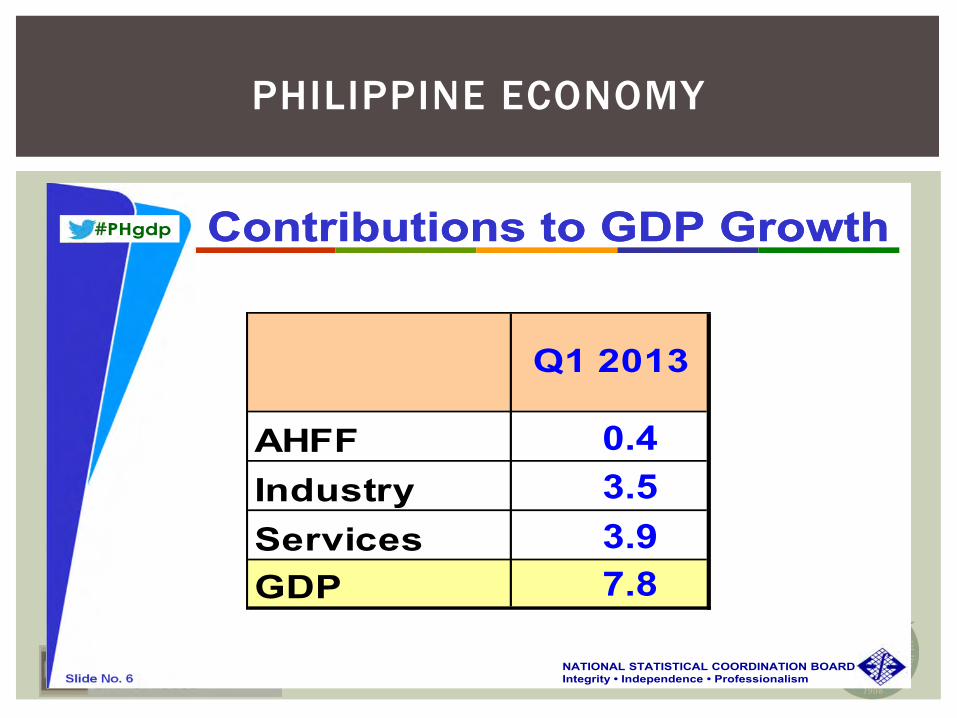
#PHgdp Contributions to GDP GrowthContributions to GDP Growth
AHFFIndustryServicesGDP
Q1 2013
3.9
0.43.5
7.8
PHILIPPINE ECONOMY
Slide No. 9NATIONAL STATISTICAL COORDINATION BOARDIntegrity • Independence • Professionalism
#PHgdp Industry(Growth rates, in percent)
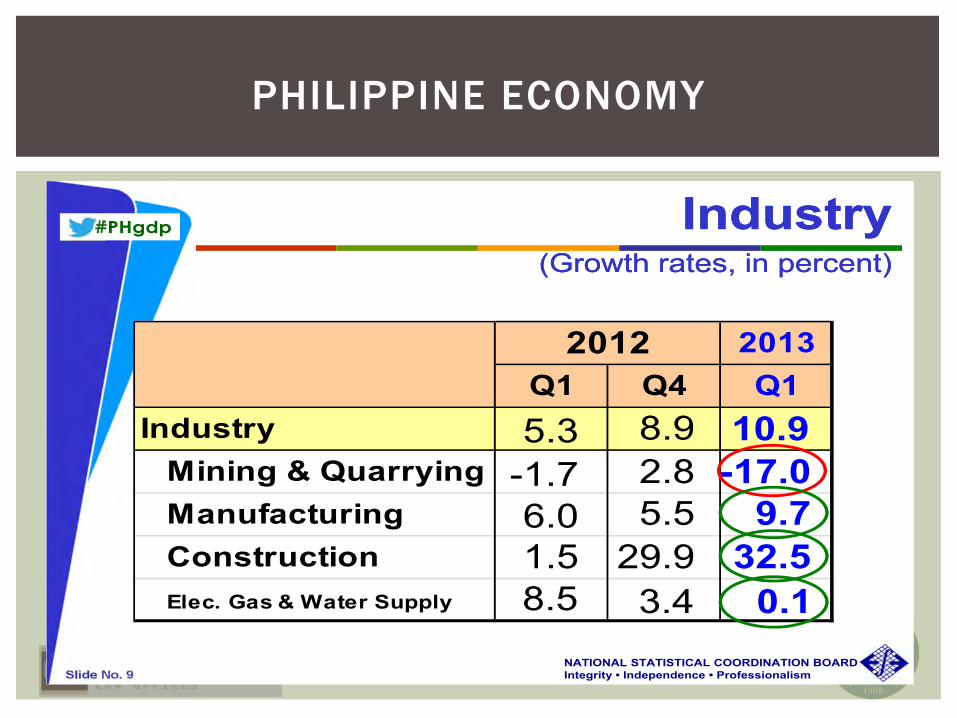
Industry(Growth rates, in percent)
2013Q1 Q4 Q1
Industry Mining & Quarrying Manufacturing Construction Elec. Gas & Water Supply
2012
9.7
10.9-17.0
32.50.1
8.9
5.52.8
29.93.4
6.0
5.3-1.7
1.58.5
PHILIPPINE ECONOMY
Slide No. 11NATIONAL STATISTICAL COORDINATION BOARDIntegrity • Independence • Professionalism
#PHgdp
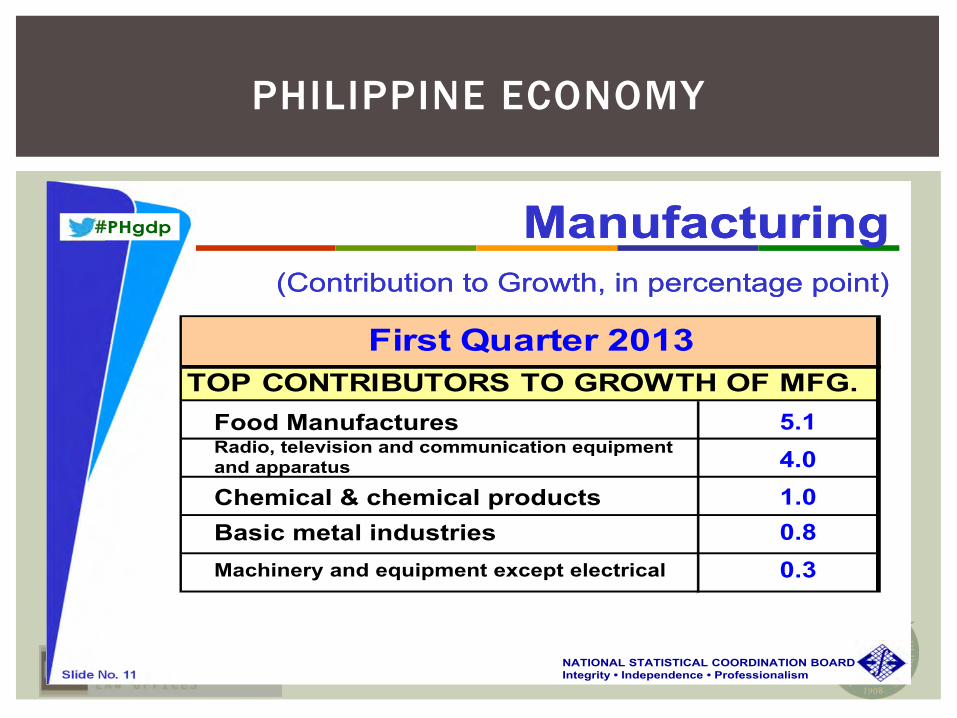
TOP CONTRIBUTORS TO GROWTH OF MFG.First Quarter 2013
Food Manufactures 5.1
Manufacturing(Contribution to Growth, in percentage point)
Manufacturing(Contribution to Growth, in percentage point)
Radio, television and communication equipment and apparatus 4.0Chemical & chemical products 1.0Basic metal industries 0.8Machinery and equipment except electrical 0.3
PHILIPPINE ECONOMY
Slide No. 13NATIONAL STATISTICAL COORDINATION BOARDIntegrity • Independence • Professionalism
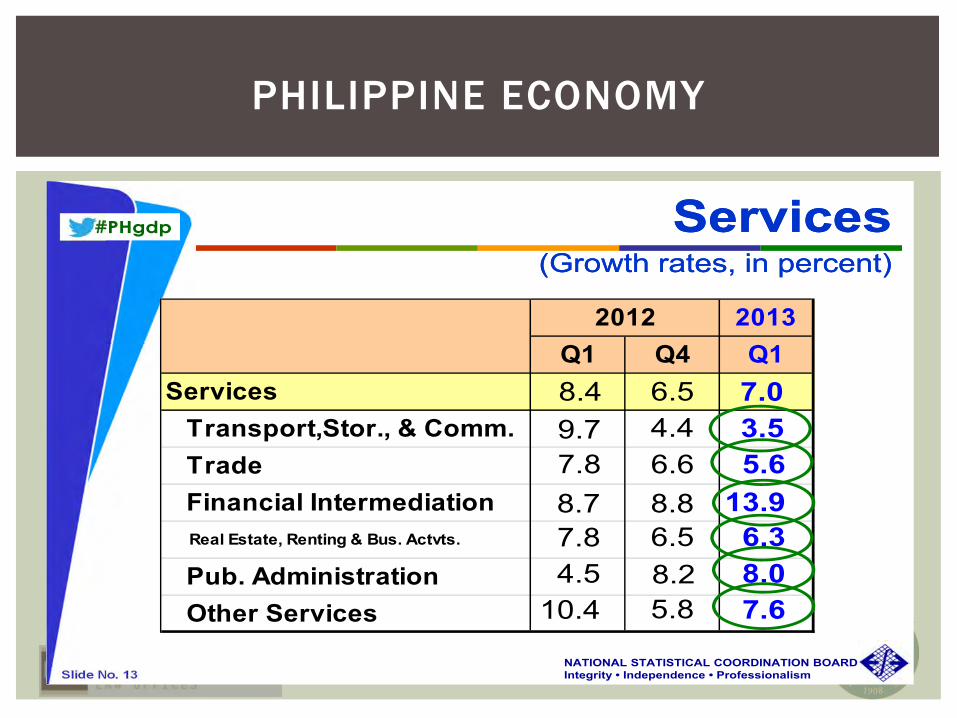
#PHgdp Services(Growth rates, in percent)
Services(Growth rates, in percent)
2013Q1 Q4 Q1
Services Transport,Stor., & Comm. Trade Financial Intermediation Real Estate, Renting & Bus. Actvts.
Pub. Administration Other Services
2012
7.0
5.63.5
8.06.3
7.6
13.9
6.5
6.64.4
8.86.58.25.8
8.49.77.88.77.84.5
10.4
PHILIPPINE ECONOMY

PHILIPPINE DOWNSTREAM OIL INDUSTRY FRAMEWORK
PH
ILIPP
INES
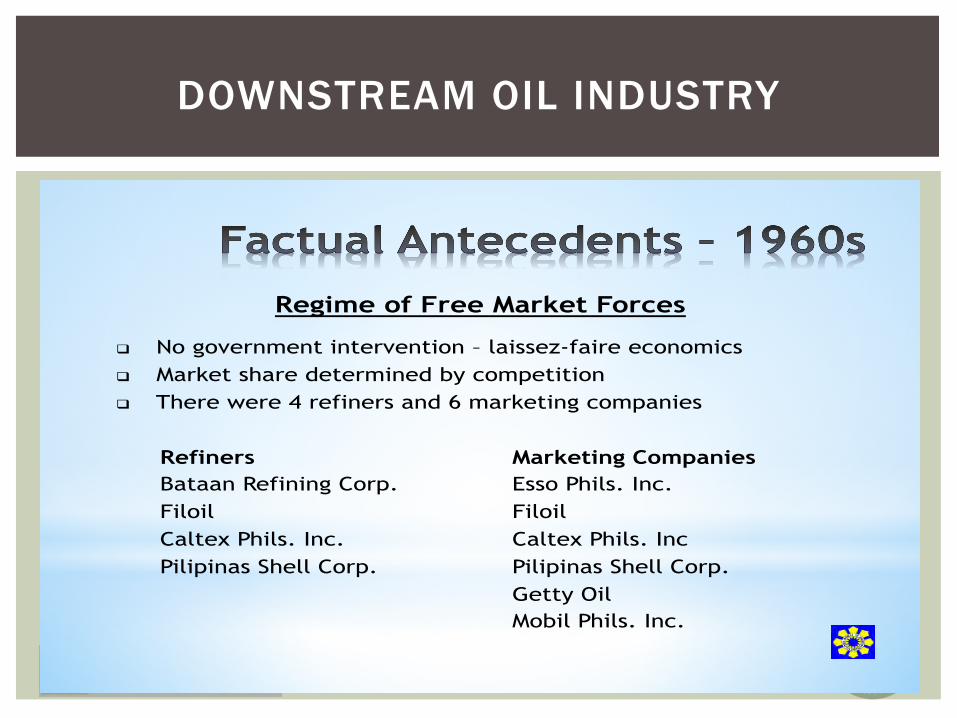
Regime of Free Market Forces
! No government intervention – laissez-faire economics
! Market share determined by competition
! There were 4 refiners and 6 marketing companies
Refiners Marketing Companies
Bataan Refining Corp. Esso Phils. Inc.
Filoil Filoil
Caltex Phils. Inc. Caltex Phils. Inc
Pilipinas Shell Corp. Pilipinas Shell Corp.
Getty Oil
Mobil Phils. Inc.
DOWNSTREAM OIL INDUSTRY

The Dawn of Regulation
! RA 6124 (1970) – created the Price Control Council to set
maximum selling prices of essential commodities
! RA 6173 (1971) – created the Oil Industry Commission (OIC); oil
price regulation was introduced
! PD 334 (1973) – formed the Philippine National Oil Company;
entry of the government in the oil industry
! PD 1206 (1977) – abolished OIC but created 2 separate agencies:
(1) Board of Energy to regulate domestic oil prices and (2) Dept.
of Energy, later renamed to Ministry of Energy, to formulate
energy policies and programs
DOWNSTREAM OIL INDUSTRY

The Subsidy Regime: CPEF and OPSF
! In 1979, a Consumer Price Equalization Fund (CPEF) was established to avoid frequent oil price movements; CPEF was abolished in June 1983
! PD 1956 (1984) – created the Oil Price Stabilization Fund (OPSF) to stabilize the domestic price of petroleum products
! Letter of Instruction No. 1441 (1984) – directed BOE, in consultation with MOE, to review and reset domestic oil prices every 2 months starting January 1985 to reflect prevailing price of crude oil and petroleum products
! Executive Order No. 172 – created the Energy Regulatory Board (ERB) to replace BOE
DOWNSTREAM OIL INDUSTRY
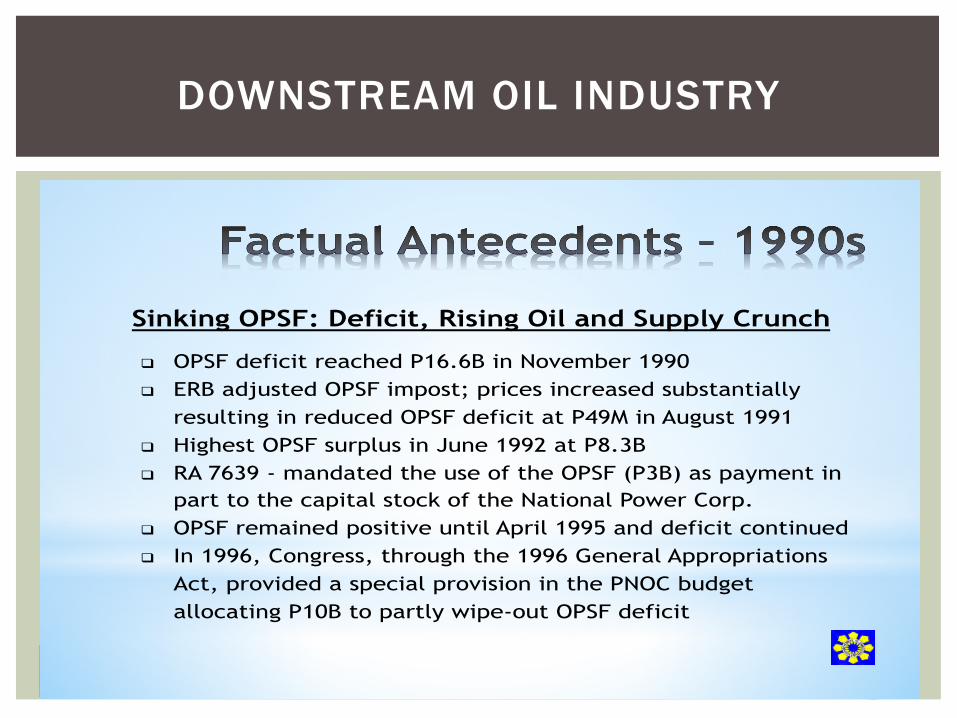
Sinking OPSF: Deficit, Rising Oil and Supply Crunch
! OPSF deficit reached P16.6B in November 1990 ! ERB adjusted OPSF impost; prices increased substantially
resulting in reduced OPSF deficit at P49M in August 1991 ! Highest OPSF surplus in June 1992 at P8.3B ! RA 7639 - mandated the use of the OPSF (P3B) as payment in
part to the capital stock of the National Power Corp. ! OPSF remained positive until April 1995 and deficit continued ! In 1996, Congress, through the 1996 General Appropriations
Act, provided a special provision in the PNOC budget allocating P10B to partly wipe-out OPSF deficit
DOWNSTREAM OIL INDUSTRY
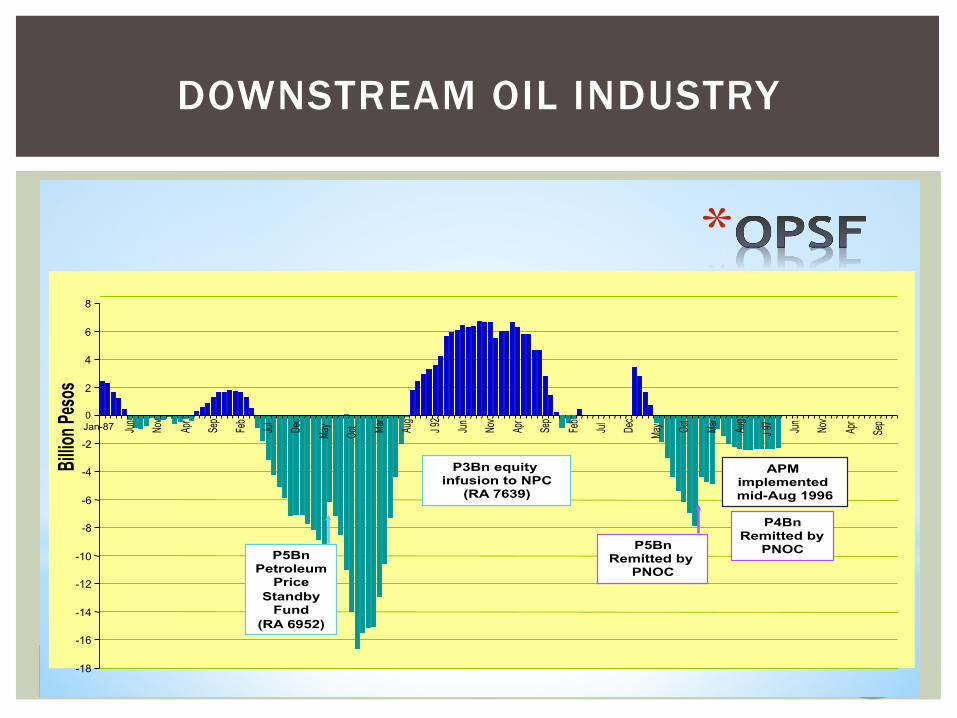
-18 -16 -14 -12 -10
-8 -6 -4 -2 0
2 4 6 8
Jan-87 Jun
Nov
Apr
Sep
Feb
Jul
Dec
May
Oct Ma
r
Aug
J 92
Jun
Nov
Apr
Sep
Feb
Jul
Dec
May Oc
t
Mar
Aug
J 97 Jun
Nov
Apr
Sep
Billio
n Pes
os
P5Bn Petroleum
Price Standby
Fund (RA 6952)
P3Bn equity infusion to NPC
(RA 7639)
P5Bn Remitted by
PNOC
P4Bn Remitted by
PNOC
APM implemented mid-Aug 1996
*
DOWNSTREAM OIL INDUSTRY
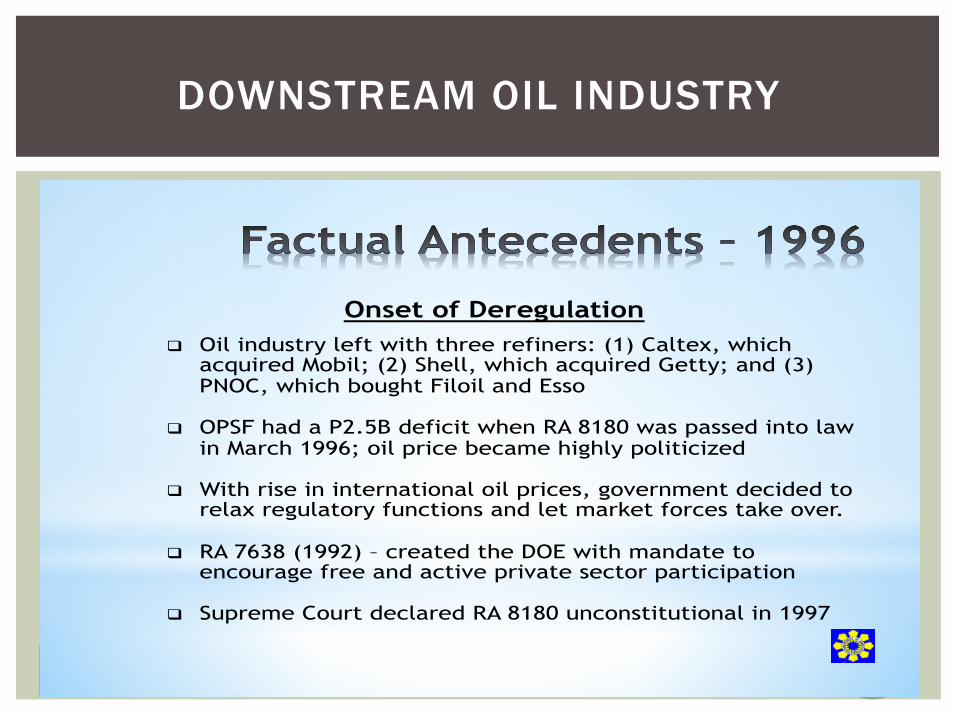
Onset of Deregulation
! Oil industry left with three refiners: (1) Caltex, which acquired Mobil; (2) Shell, which acquired Getty; and (3) PNOC, which bought Filoil and Esso
! OPSF had a P2.5B deficit when RA 8180 was passed into law in March 1996; oil price became highly politicized
! With rise in international oil prices, government decided to
relax regulatory functions and let market forces take over.
! RA 7638 (1992) – created the DOE with mandate to encourage free and active private sector participation
! Supreme Court declared RA 8180 unconstitutional in 1997
DOWNSTREAM OIL INDUSTRY

Transition Phase to Full Deregulation
! RA 8479 – New Downstream Oil Deregulation Law signed in
February 1998
! Automatic pricing mechanism - adjusted the wholesale posted prices of petroleum products based on the changes in Singapore Posted Prices. APM enabled adjustments in domestic prices to approximate closely and reflect promptly the movement of international prices of oil
! Executive Order No. 471 (1998) declared full deregulation of
the downstream oil industry
DOWNSTREAM OIL INDUSTRY
DUBAI CRUDE PRICES/FOREX March 1984 – MTD August 2011
0
10
20
30
40
50
60
70
80
90
100
110
120
130
140
150
M-84
J-85
N-85
S-86
J-87
M-88
M-89
J-90
N-90
S-91
J-92
M-93
M-94
J-95
N-95
S-96
J-97
M-98
M-99
J-00
N-00
S-01
J-02
M-03
M-04
J-05
N-05
S-06
J-07
M-08
M-09
J-10
N-10
S-11
0
5
10
15
20
25
30
35
40
45
50
55
60
Dubai US$/bbl Dubai P/li Forex P/1$
$/bbl P/$
I. Energy Reform Agenda II. Renewable Energy Resources
III. Upstream Oil and Gas Resources
IV. Coal Resources V. Downstream Oil and Gas Resources
DISCUSSION OUTLINE
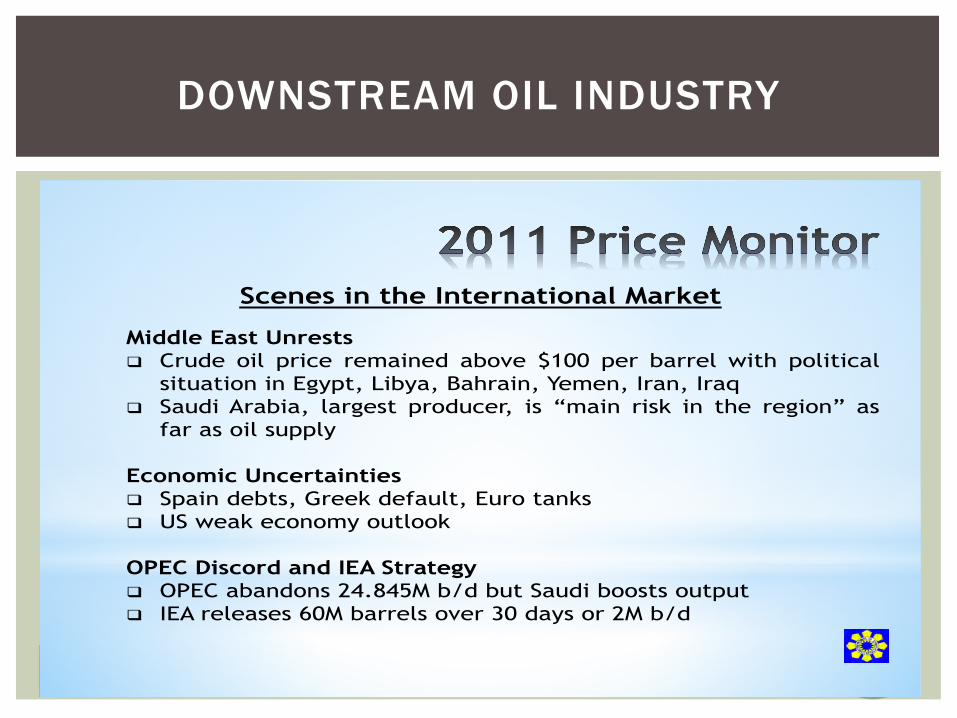
Scenes in the International Market
Middle East Unrests ! Crude oil price remained above $100 per barrel with political
situation in Egypt, Libya, Bahrain, Yemen, Iran, Iraq ! Saudi Arabia, largest producer, is “main risk in the region” as
far as oil supply
Economic Uncertainties ! Spain debts, Greek default, Euro tanks ! US weak economy outlook
OPEC Discord and IEA Strategy ! OPEC abandons 24.845M b/d but Saudi boosts output ! IEA releases 60M barrels over 30 days or 2M b/d
DOWNSTREAM OIL INDUSTRY
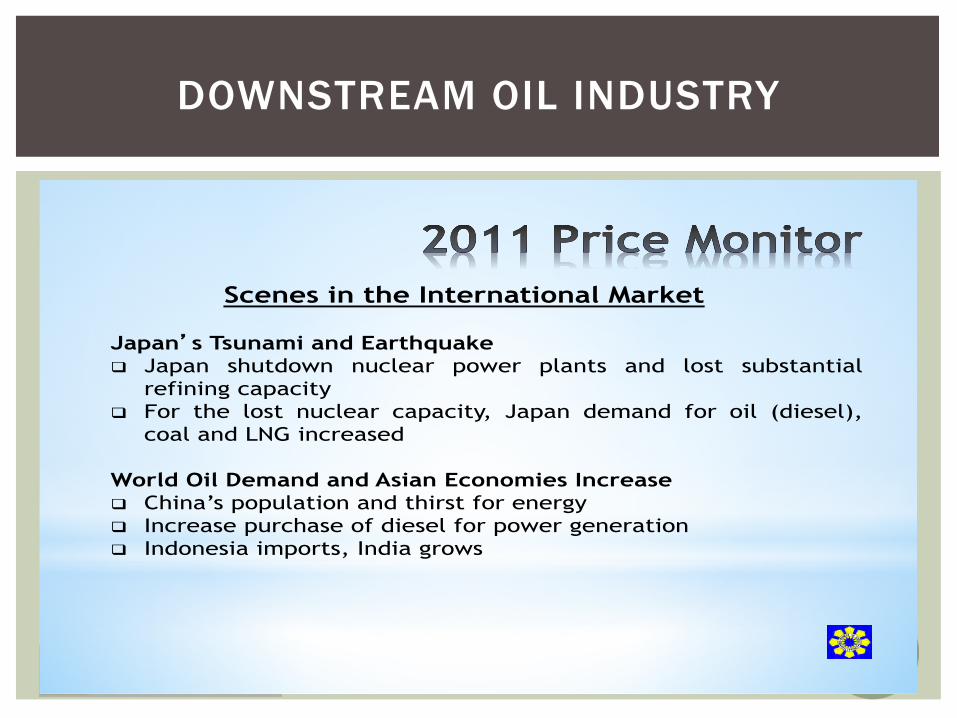
Scenes in the International Market Japan�s Tsunami and Earthquake ! Japan shutdown nuclear power plants and lost substantial
refining capacity
! For the lost nuclear capacity, Japan demand for oil (diesel),
coal and LNG increased
World Oil Demand and Asian Economies Increase ! China’s population and thirst for energy
! Increase purchase of diesel for power generation
! Indonesia imports, India grows
DOWNSTREAM OIL INDUSTRY
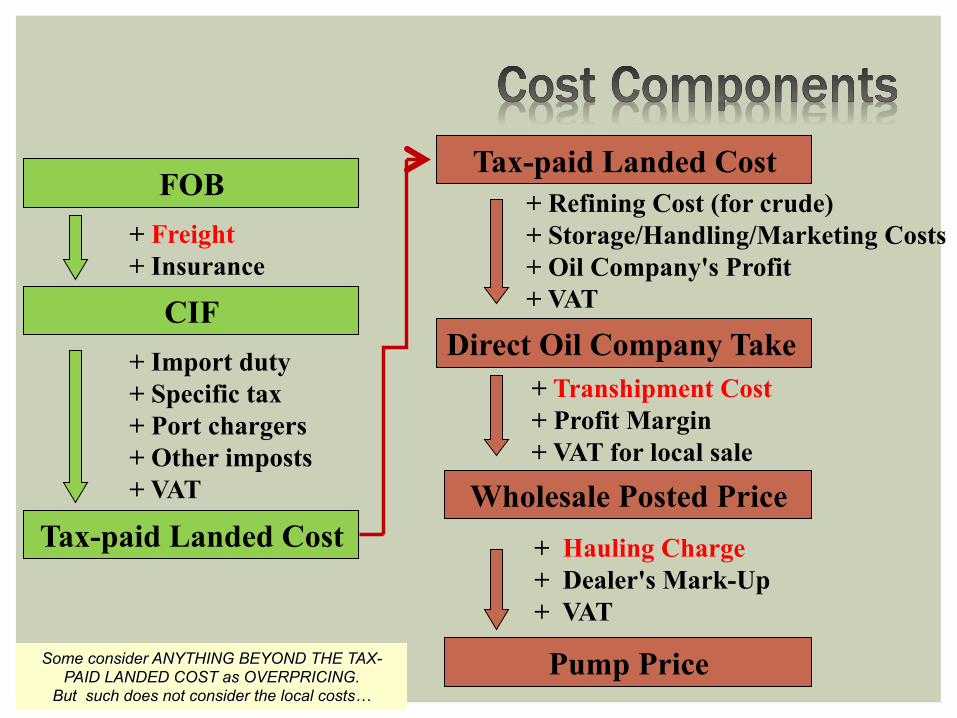
+ Refining Cost (for crude) + Storage/Handling/Marketing Costs + Oil Company's Profit + VAT
Wholesale Posted Price
Direct Oil Company Take
+ Hauling Charge + Dealer's Mark-Up + VAT
+ Transhipment Cost + Profit Margin + VAT for local sale
Pump Price
FOB
+ Freight + Insurance
+ Import duty + Specific tax + Port chargers + Other imposts + VAT Tax-paid Landed Cost
CIF
Tax-paid Landed Cost
Some consider ANYTHING BEYOND THE TAX-PAID LANDED COST as OVERPRICING.
But such does not consider the local costs…

2011 PRICE MONITOR The ERB Formula
AUTOMATIC PRICING MECHANISMComputation of the estimated adjustment for the week
LANDED COST (Product) Past Week Present WeekUS$ PER BARREL
FOB (MOPS*) a1 a2
FREIGHT PLUS b1 b2
CIF c1 = a1+b1 c2 = a2+b2
EXCHANGE RATE d1 d2
PESO LANDED COST
CIF e1 = c1*d1 e2 = c2*d2
DUTY: f1 = e1*__% f2 = e2*__%
OCEAN LOSS g1 = e1*0.5% g2 = e2*0.5%
TOTAL (Without VAT) h1 = e1+f1+g1 h2 = e2+f2+g2
TOTAL (With VAT) i1 = h1 * 1.12 i2 = h2 * 1.12
PESO LANDED COST, P/li j1 = i1/159 j2 = i2/159
DIFFERENCE
Peso/barrel k2 = i2 - i1
Peso/liter l2 = k2/159
* MOPS of ULG, Diesel, IFO or LPG (Contract Price, CP)
Note: The value appearing in l2 is the estimated adjustment in the price
of the product for the monthWPP = Landed Cost + Oil company Margin + Specific Tax + VATPP = WPP + Dealers/Haulers Margin
1. Energy Supply and Demand Situation
2. Philippines GDP: Drivers of Oil Demand
3. The Downstream Oil Industry
4. Tapping Russia as New Supply Center
5. Next Steps
DOWNSTREAM OIL INDUSTRY
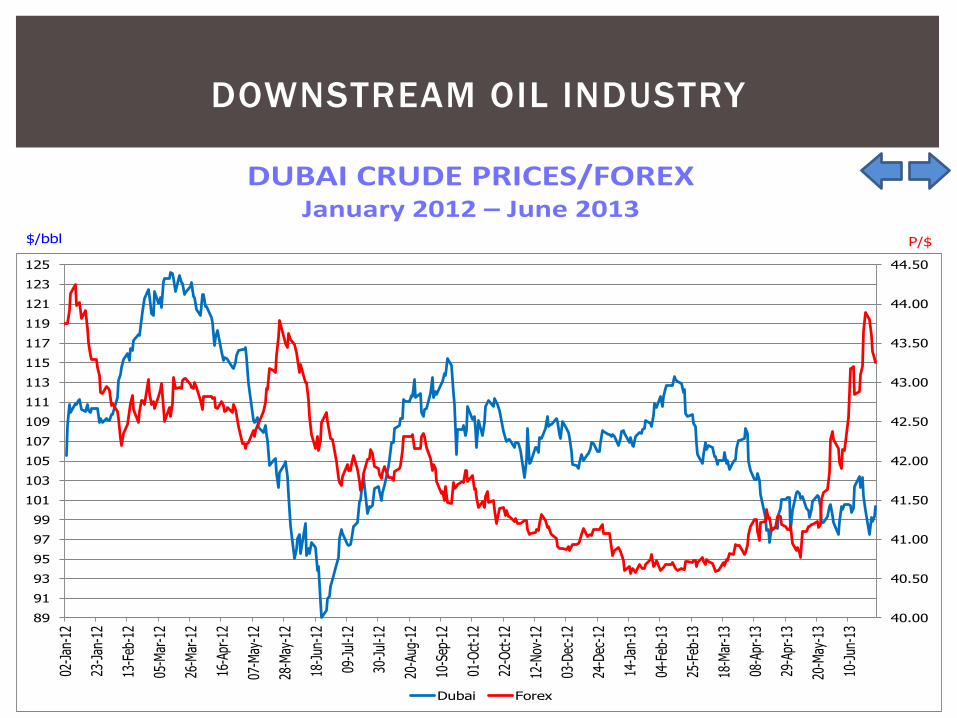
DUBAI CRUDE PRICES/FOREX January 2012 – June 2013
$/bbl P/$
40.00
40.50
41.00
41.50
42.00
42.50
43.00
43.50
44.00
44.50
89
91
93
95
97
99
101
103
105
107
109
111
113
115
117
119
121
123
125
02-Ja
n-12
23-Ja
n-12
13-F
eb-1
2
05-M
ar-1
2
26-M
ar-1
2
16-A
pr-1
2
07-M
ay-1
2
28-M
ay-1
2
18-Ju
n-12
09-Ju
l-12
30-Ju
l-12
20-A
ug-1
2
10-S
ep-1
2
01-O
ct-12
22-O
ct-12
12-N
ov-1
2
03-D
ec-1
2
24-D
ec-1
2
14-Ja
n-13
04-F
eb-1
3
25-F
eb-1
3
18-M
ar-1
3
08-A
pr-1
3
29-A
pr-1
3
20-M
ay-1
3
10-Ju
n-13
Dubai Forex
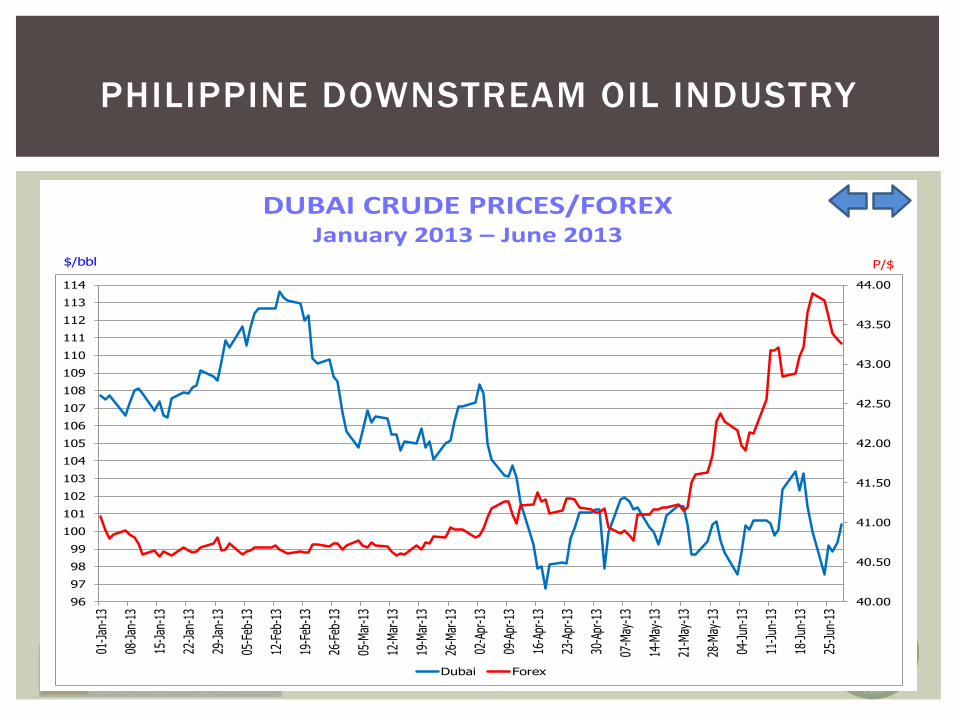
DUBAI CRUDE PRICES/FOREX January 2013 – June 2013
$/bbl P/$
40.00
40.50
41.00
41.50
42.00
42.50
43.00
43.50
44.00
96
97
98
99
100
101
102
103
104
105
106
107
108
109
110
111
112
113
114
01-Ja
n-13
08-Ja
n-13
15-Ja
n-13
22-Ja
n-13
29-Ja
n-13
05-F
eb-1
3
12-F
eb-1
3
19-F
eb-1
3
26-F
eb-1
3
05-M
ar-1
3
12-M
ar-1
3
19-M
ar-1
3
26-M
ar-1
3
02-A
pr-1
3
09-A
pr-1
3
16-A
pr-1
3
23-A
pr-1
3
30-A
pr-1
3
07-M
ay-1
3
14-M
ay-1
3
21-M
ay-1
3
28-M
ay-1
3
04-Ju
n-13
11-Ju
n-13
18-Ju
n-13
25-Ju
n-13
Dubai Forex
PHILIPPINE DOWNSTREAM OIL INDUSTRY
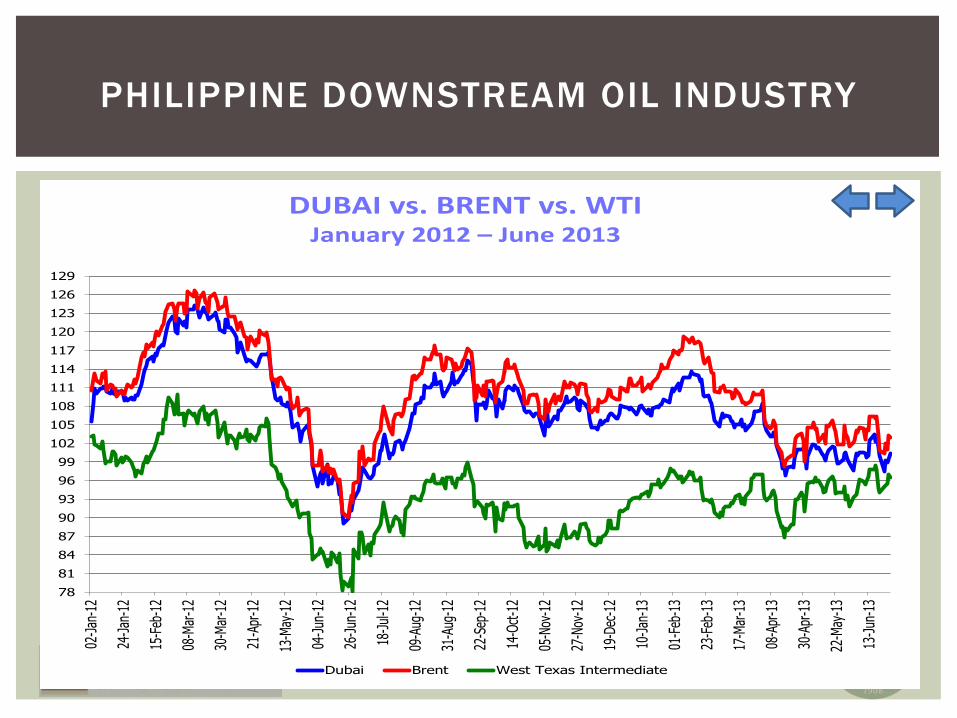
DUBAI vs. BRENT vs. WTI January 2012 – June 2013
$/bbl
78
81
84
87
90
93
96
99
102
105
108
111
114
117
120
123
126
129
02-Ja
n-12
24-Ja
n-12
15-F
eb-1
2
08-M
ar-1
2
30-M
ar-1
2
21-A
pr-1
2
13-M
ay-1
2
04-Ju
n-12
26-Ju
n-12
18-Ju
l-12
09-A
ug-1
2
31-A
ug-1
2
22-S
ep-1
2
14-O
ct-12
05-N
ov-1
2
27-N
ov-1
2
19-D
ec-1
2
10-Ja
n-13
01-F
eb-1
3
23-F
eb-1
3
17-M
ar-1
3
08-A
pr-1
3
30-A
pr-1
3
22-M
ay-1
3
13-Ju
n-13
Dubai Brent West Texas Intermediate
PHILIPPINE DOWNSTREAM OIL INDUSTRY

DUBAI vs. BRENT vs. WTI January 2005 – MTD September 2013
$/bbl
35
45
55
65
75
85
95
105
115
125
135
Jan-
05
May
-05
Sep-
05
Jan-
06
May
-06
Sep-
06
Jan-
07
May
-07
Sep-
07
Jan-
08
May
-08
Sep-
08
Jan-
09
May
-09
Sep-
09
Jan-
10
May
-10
Sep-
10
Jan-
11
May
-11
Sep-
11
Jan-
12
May
-12
Sep-
12
Jan-
13
May
-13
Sep-
13
Dubai Brent West Texas Intermediate
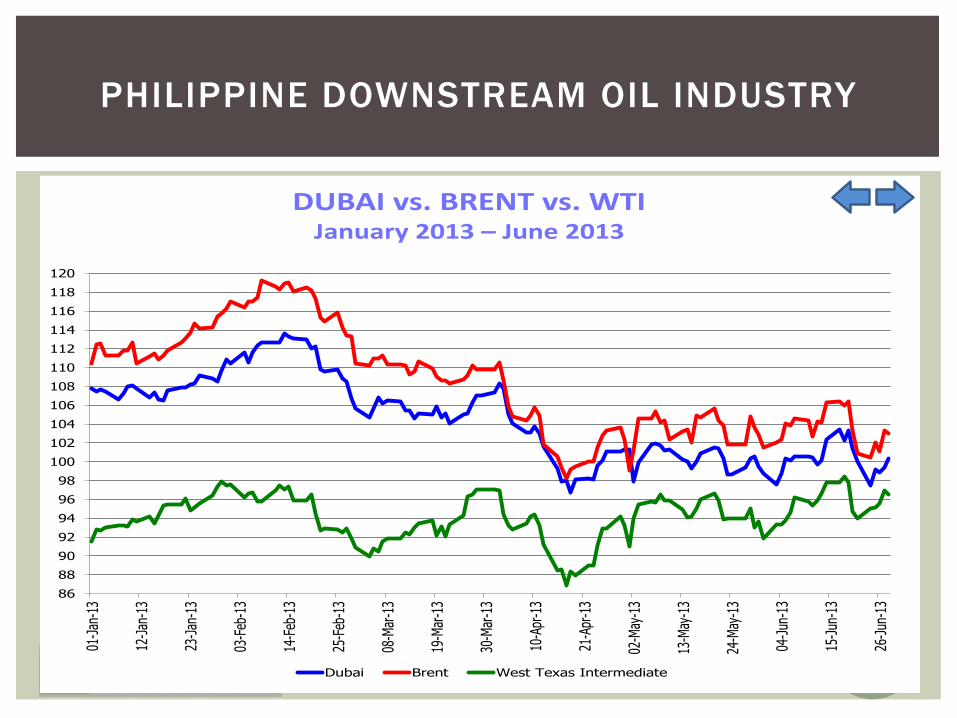
DUBAI vs. BRENT vs. WTI January 2013 – June 2013
$/bbl
86
88
90
92
94
96
98
100
102
104
106
108
110
112
114
116
118
120
01-Ja
n-13
12-Ja
n-13
23-Ja
n-13
03-F
eb-1
3
14-F
eb-1
3
25-F
eb-1
3
08-M
ar-1
3
19-M
ar-1
3
30-M
ar-1
3
10-A
pr-1
3
21-A
pr-1
3
02-M
ay-1
3
13-M
ay-1
3
24-M
ay-1
3
04-Ju
n-13
15-Ju
n-13
26-Ju
n-13
Dubai Brent West Texas Intermediate
PHILIPPINE DOWNSTREAM OIL INDUSTRY

METRO MANILA PRICING Gasoline P/li
30323436384042444648505254565860626466
2/2-
6
4/13
-17
6/22
-26
8/31
-9/4
11/9
-13
1/18
-22
3/29
-4/2
6/7-
11
8/16
-20
10/2
5-29
1/3-
7/11
3/14
-18
5/23
-27
8/1-
5
10/1
0-14
12/1
9-23
2/27
-3/2
5/7-
11
7/16
-20
9/24
-28
12/3
-7
2/11
-15
4/22
-26
Calculated Based on Adviced Adjustments (Suggested Retail Price)
Calculated from Mean of Platts Singapore
Common Price Metro Manila
PHILIPPINE DOWNSTREAM OIL INDUSTRY
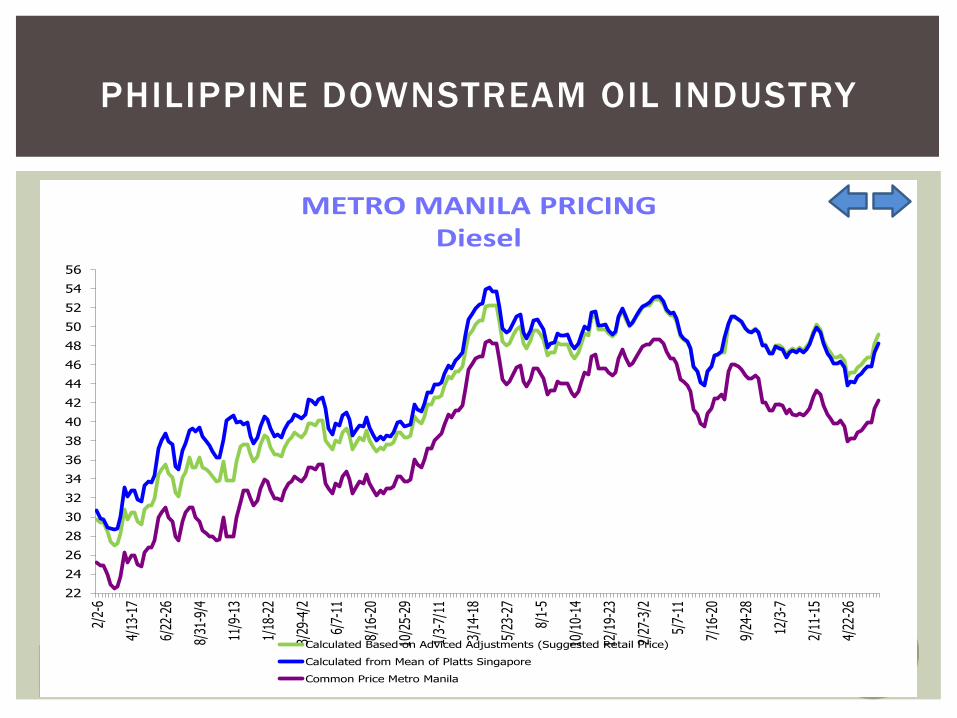
PHILIPPINE DOWNSTREAM OIL INDUSTRY
METRO MANILA PRICING Diesel P/li
22
24
26
28
30
32
34
36
38
40
42
44
46
48
50
52
54
56
2/2-
6
4/13
-17
6/22
-26
8/31
-9/4
11/9
-13
1/18
-22
3/29
-4/2
6/7-
11
8/16
-20
10/2
5-29
1/3-
7/11
3/14
-18
5/23
-27
8/1-
5
10/1
0-14
12/1
9-23
2/27
-3/2
5/7-
11
7/16
-20
9/24
-28
12/3
-7
2/11
-15
4/22
-26
Calculated Based on Adviced Adjustments (Suggested Retail Price)
Calculated from Mean of Platts Singapore
Common Price Metro Manila
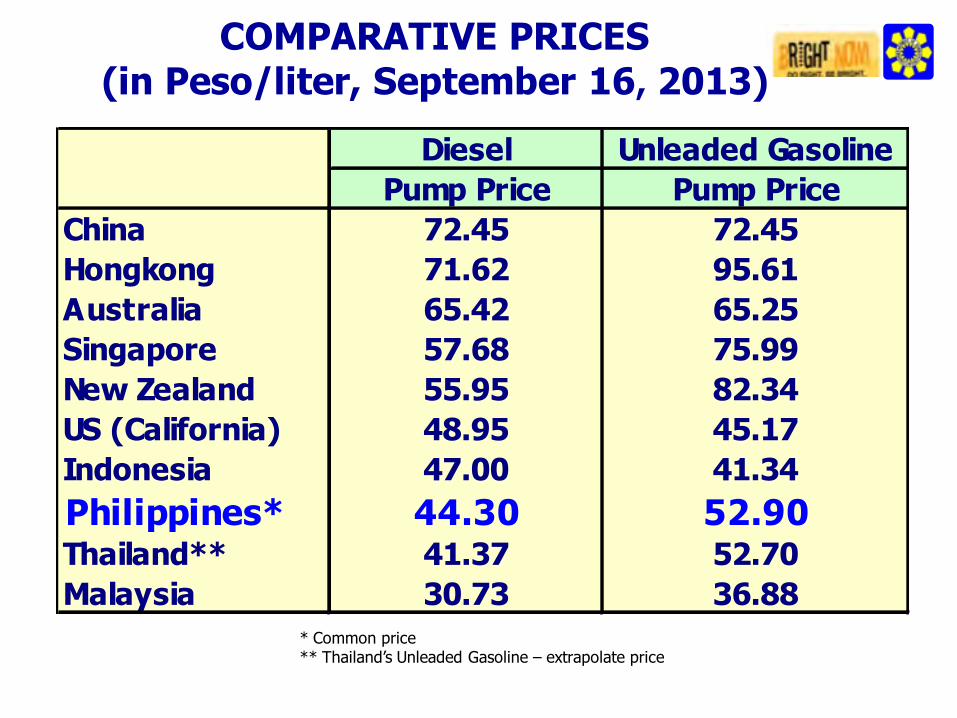
COMPARATIVE PRICES (in Peso/liter, September 16, 2013)
* Common price** Thailand’s Unleaded Gasoline – extrapolate price
Diesel Unleaded GasolinePump Price Pump Price
China 72.45 72.45Hongkong 71.62 95.61Australia 65.42 65.25Singapore 57.68 75.99New Zealand 55.95 82.34US (California) 48.95 45.17Indonesia 47.00 41.34Philippines* 44.30 52.90Thailand** 41.37 52.70Malaysia 30.73 36.88
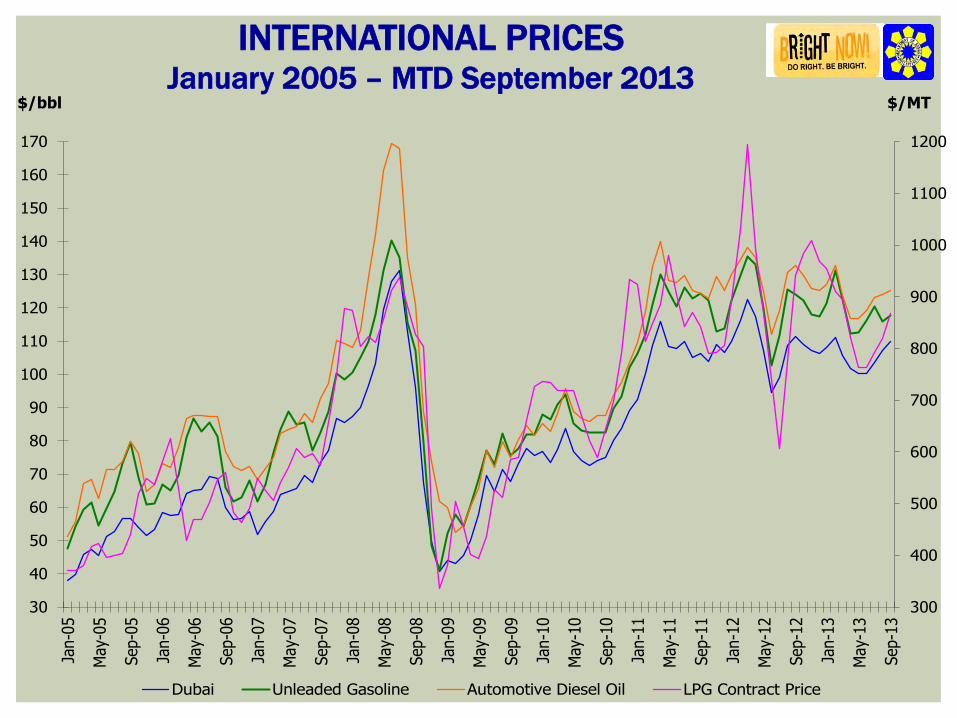
INTERNATIONAL PRICES
January 2005 – MTD September 2013 $/bbl $/MT
300
400
500
600
700
800
900
1000
1100
1200
30
40
50
60
70
80
90
100
110
120
130
140
150
160
170
Jan-
05
May
-05
Sep-
05
Jan-
06
May
-06
Sep-
06
Jan-
07
May
-07
Sep-
07
Jan-
08
May
-08
Sep-
08
Jan-
09
May
-09
Sep-
09
Jan-
10
May
-10
Sep-
10
Jan-
11
May
-11
Sep-
11
Jan-
12
May
-12
Sep-
12
Jan-
13
May
-13
Sep-
13
Dubai Unleaded Gasoline Automotive Diesel Oil LPG Contract Price
TAPPING RUSSIA AS MAJOR SUPPLY SOURCE
PH
ILIPP
INES

CRUDE OIL IMPORTATION
Country of Origin 2008 2009 2010 2011 2012 1H 2103
Saudi Arabia 46,603 22,578 30,359 30,795 29,784 8,197
Iran 1,915 819 5,874 0 0
UAE 13,054 10,144 18,088 14,730 16,230 5,145
Qatar 0 8,372 4,273 1,551 5,018 3,730
Middle East 61,572 42,243 54,232 52,955 51,032 18,122
ASEAN (Malaysia, Indonesia, Brunei, Singapore, Vietnam
6,121 5,168 7,335 2,341 3,176 1,159
Russia 180 2,782 5,207 14,318 9,508 6,540

¡ Less vulnerability to oil price fluctuation in Middle East (lower price)
¡ Supply security (3rd largest after US and out-produced Saudi Arabia by 1.15 million barrels per day in 2013)
¡ Multiple sources: Rosneft, Lukoil, Gazprom, Tatneft, etc.)
¡ Stable energy strategy and reserves § 17.8 billion tonnes of proven oil reserves § 48.8 trillion cubic meters of gas
¡ Russian energy policy shift to Asia and China
TAPPING RUSSIA AS SUPPLIER
DEPARTMENT OF ENERGY PROGRAMS
RESOURCE DEVELOPMENT
AYALA ECONOMIC BRIEFING August 23, 2011

POLITICAL ISSUES

DEPARTMENT OF ENERGY PROGRAMS
RESOURCE DEVELOPMENT
AYALA ECONOMIC BRIEFING August 23, 2011

PLATTS
CR
UD
E OIL
MA
RK
ETS A
SIA
20
13
G
oodwood P
ark Hotel, S
ingapore S
eptember 1
8-1
9, 2
01
3
Developing New Supply Opportunities with Russia:
The Philippines’ Perspective ATTY. JOSE M. LAYUG, JR.
Senior Partner , Puno & Puno Law Offices Philippine Energy Expert, University of the
Philippines College of Law
Related Documents