University of Tennessee, Knoxville University of Tennessee, Knoxville TRACE: Tennessee Research and Creative TRACE: Tennessee Research and Creative Exchange Exchange Doctoral Dissertations Graduate School 12-2016 DEVELOPING ENTREPRENEURIAL ECOYSTEMS: INTEGRATING DEVELOPING ENTREPRENEURIAL ECOYSTEMS: INTEGRATING SOCIAL EVOLUTIONARY THEORY AND SIGNALING THEORY TO SOCIAL EVOLUTIONARY THEORY AND SIGNALING THEORY TO EXPLAIN THE ROLE OF MEDIA IN ENTREPRENEURIAL EXPLAIN THE ROLE OF MEDIA IN ENTREPRENEURIAL ECOSYSTEMS ECOSYSTEMS Jason Andrew Strickling University of Tennessee, Knoxville, [email protected] Follow this and additional works at: https://trace.tennessee.edu/utk_graddiss Part of the Business Administration, Management, and Operations Commons Recommended Citation Recommended Citation Strickling, Jason Andrew, "DEVELOPING ENTREPRENEURIAL ECOYSTEMS: INTEGRATING SOCIAL EVOLUTIONARY THEORY AND SIGNALING THEORY TO EXPLAIN THE ROLE OF MEDIA IN ENTREPRENEURIAL ECOSYSTEMS. " PhD diss., University of Tennessee, 2016. https://trace.tennessee.edu/utk_graddiss/4169 This Dissertation is brought to you for free and open access by the Graduate School at TRACE: Tennessee Research and Creative Exchange. It has been accepted for inclusion in Doctoral Dissertations by an authorized administrator of TRACE: Tennessee Research and Creative Exchange. For more information, please contact [email protected].

Welcome message from author
This document is posted to help you gain knowledge. Please leave a comment to let me know what you think about it! Share it to your friends and learn new things together.
Transcript

University of Tennessee, Knoxville University of Tennessee, Knoxville
TRACE: Tennessee Research and Creative TRACE: Tennessee Research and Creative
Exchange Exchange
Doctoral Dissertations Graduate School
12-2016
DEVELOPING ENTREPRENEURIAL ECOYSTEMS: INTEGRATING DEVELOPING ENTREPRENEURIAL ECOYSTEMS: INTEGRATING
SOCIAL EVOLUTIONARY THEORY AND SIGNALING THEORY TO SOCIAL EVOLUTIONARY THEORY AND SIGNALING THEORY TO
EXPLAIN THE ROLE OF MEDIA IN ENTREPRENEURIAL EXPLAIN THE ROLE OF MEDIA IN ENTREPRENEURIAL
ECOSYSTEMS ECOSYSTEMS
Jason Andrew Strickling University of Tennessee, Knoxville, [email protected]
Follow this and additional works at: https://trace.tennessee.edu/utk_graddiss
Part of the Business Administration, Management, and Operations Commons
Recommended Citation Recommended Citation Strickling, Jason Andrew, "DEVELOPING ENTREPRENEURIAL ECOYSTEMS: INTEGRATING SOCIAL EVOLUTIONARY THEORY AND SIGNALING THEORY TO EXPLAIN THE ROLE OF MEDIA IN ENTREPRENEURIAL ECOSYSTEMS. " PhD diss., University of Tennessee, 2016. https://trace.tennessee.edu/utk_graddiss/4169
This Dissertation is brought to you for free and open access by the Graduate School at TRACE: Tennessee Research and Creative Exchange. It has been accepted for inclusion in Doctoral Dissertations by an authorized administrator of TRACE: Tennessee Research and Creative Exchange. For more information, please contact [email protected].

To the Graduate Council:
I am submitting herewith a dissertation written by Jason Andrew Strickling entitled
"DEVELOPING ENTREPRENEURIAL ECOYSTEMS: INTEGRATING SOCIAL EVOLUTIONARY
THEORY AND SIGNALING THEORY TO EXPLAIN THE ROLE OF MEDIA IN ENTREPRENEURIAL
ECOSYSTEMS." I have examined the final electronic copy of this dissertation for form and
content and recommend that it be accepted in partial fulfillment of the requirements for the
degree of Doctor of Philosophy, with a major in Business Administration.
David W. Williams, Major Professor
We have read this dissertation and recommend its acceptance:
Anne D. Smith, T. Russell Crook, Roberto Ragozzino, Phillip R. Daves
Accepted for the Council:
Carolyn R. Hodges
Vice Provost and Dean of the Graduate School
(Original signatures are on file with official student records.)

DEVELOPING ENTREPRENEURIAL ECOSYSTEMS: INTEGRATING SOCIAL EVOLUTIONARY THEORY AND
SIGNALING THEORY TO EXPLAIN THE ROLE OF MEDIA IN ENTREPRENEURIAL ECOSYSTEMS
A Dissertation Presented for the Doctor of Philosophy
DegreeThe University of Tennessee, Knoxville
Jason Andrew StricklingDecember 2016

ii
DEDICATION
This dissertation is dedicated to my family, including the family I have chosen for myself,
whose support and faith in me led me to persevere and demonstrate the resilience that ultimately
resulted in this document; to my mother and father, who always took my calls; to my sisters,
Michelle and Kyla, who commiserated and helped out in small and large ways; to Elaine Seat,
who provided me with guidance, mentorship, and a place to work; to the Huntsville crew, who
never doubted and threatened to beat me up if I even thought about doing something else; to the
Davidson crowd, who understood the trials and tribulations, listened, and supported; and finally
to the Laura Madden, LaDonna Thornton, Nawar Chaker, and Laura D’Oria for making me laugh
and making it fun.

iii
ACKNOWLEDGEMENTS
A work of scholarly and achievement such as this is not completed in a vacuum and I am
indebted to many people for their help and support in making my success possible. My chair,
Dave Williams, has provided invaluable guidance and support, proving himself to be a thoughtful,
thorough, and kind individual to whom I am eternally grateful. I also appreciate the help and
support of Anne Smith, who demonstrated repeatedly through her actions how much she believed
in me. Russell Crook, too, proved to be a true friend and colleague, who I feel lucky to have
worked with here. I am also grateful to the other members of my committee, Roberto Ragozzino
and Phil Daves, for patiently working with me through the dissertation process.
Other UT faculty members also impacted my academic development. Franz Kellermanns,
Annette Ranft, Tim Munyon, Elaine Seat, and Cheryl Barksdale have been wonderful exemplars
of the best Academia has to offer. Of course, none of this could be possible without the efforts
of Glenda Hurst, who smoothed out the process, called in favors when I faltered in keeping
track of deadlines, and shepherded me through the maze of paperwork in an unerring fashion
with a faith and belief in my ability that inspired me. In addition, I appreciate the O&S doctoral
students, including Tim Madden, Laura Madden, Mary Beth Rousseau, Blake Mathias, Kristen
Day, Kyle Turner, Nastaran Simarasl, David Jiang, Laura D’Oria, Xinran Wang, Dan White,
Erika Williams, Justin Yan, Nick Mmbaga, and Mike Lerman for their friendship. The other
member of my doctoral cohort, Nawar Chaker, deserves special recognition for his friendship and
unwavering patience with me.
iv
ABSTRACT
Entrepreneurship drives innovation, social change, and economic development locally,
regionally, nationally, and worldwide (Konczal, 2013). The activities, relationships, and entities
utilized to enhance entrepreneurial activity are just one important part of what scholars have
termed the entrepreneurial ecosystem (EE), in acknowledgement of the interconnectedness of
these factors with other market dimensions.
This dissertation integrates previous definitions of the EE and proposes a new definition
that emphasizes the importance of the social environment and the role of communication for
change and EE development. Building on evidence from diverse streams of research to further our
understanding of entrepreneurial ecosystem activity, this dissertation argues that an overlooked
explanation for EE change is social evolutionary theory (SET). Further, in exploring the
mechanisms behind EE change, the dissertation explores the role of media signals on the pattern
of firm formation and failure EEs. Doing so, the dissertation proposes a theoretical approach and
model primarily based on SET (Margulis, 1971) and utilizes signaling theory (Spence, 1973) to
address a gap in SET and thus explain how changes in EEs over time occur.
Using a sample of U.S. metropolitan statistical areas (MSAs) as EEs, data about media
signals, industry diversity, resource availability, new venture formation, and firm failures over a
ten year period were analyzed to test the formal model. Results support SET and signaling theory
explanations for EEs but also offers some counterintuitive extensions of SET. This study contributes
to literature on EEs by providing and testing a model of change specifying mechanisms that social
actors use to coordinate entrepreneurship-related activities. The study also provides insights for
policymakers and entrepreneurs in EEs about the importance of communication frequency and
content for motivating potential entrepreneurs to pursue new ventures.

v
TABLE OF CONTENTS
CHAPTER 1: INTRODUCTION ....................................................................................................1
Chapter Overview ....................................................................................................................1
Research Question and Research Objectives ...........................................................................2
Research Question............................................................................................................2
Objectives of this Research ..............................................................................................3
Problem: Incomplete Theoretical Explanation of EE Development .................................4
Challenge: Definitional Inconsistency .............................................................................5
Gaps and Limitations: Many Disciplines, Many Conversations ......................................6
Research Agenda ......................................................................................................................6
Theoretical Underpinnings ..............................................................................................6
Methodological Approach ................................................................................................7
Implications and Contributions ................................................................................................7
Implications for Research .................................................................................................7
Implications for Practice ..................................................................................................8
Implications for Policy .....................................................................................................8
Organization of Dissertation ....................................................................................................9
CHAPTER 2: LITERATURE REVIEW ......................................................................................10
Chapter Overview ..................................................................................................................10
Entrepreneurial Ecosystems ...................................................................................................10
Entrepreneurial Ecosystem Relevant Concepts .....................................................................14
Entrepreneurship ............................................................................................................14
Agglomeration................................................................................................................17
Clusters ..........................................................................................................................19
Entrepreneurship Policy .................................................................................................20
Economic Development Policy ......................................................................................22
Resources .......................................................................................................................24
Entrepreneurial Culture .................................................................................................26
Institutions .....................................................................................................................29
Media Studies .................................................................................................................32

vi
Population Ecology ........................................................................................................33
Industrial Ecology ..........................................................................................................34
Conclusion ..............................................................................................................................36
Chapter Summary ..................................................................................................................38
CHAPTER 3: THEORY & HYPOTHESIS DEVELOPMENT ....................................................40
Chapter Overview ..................................................................................................................40
Theory ....................................................................................................................................41
Social Evolutionary Theory ...........................................................................................41
Signaling Theory ............................................................................................................49
Hypothesis Development .......................................................................................................54
Signal Frequency ...........................................................................................................57
Signal Attributes ............................................................................................................60
Signal Valence ................................................................................................................63
Industry Diversity ..........................................................................................................68
Resources .......................................................................................................................70
Chapter Summary ..................................................................................................................73
CHAPTER 4: METHODS .............................................................................................................75
Chapter Overview ..................................................................................................................75
Sample Frame and Data Collection ........................................................................................75
Sample Frame and Selection ..........................................................................................75
Data Collection and Research Procedures ....................................................................76
Independent Variables ............................................................................................................78
Signal Frequency ............................................................................................................78
Signal Attributes ............................................................................................................79
Moderators .............................................................................................................................80
Signal Valence ................................................................................................................80
Industry Diversity ..........................................................................................................81
Resource Availability ....................................................................................................82
Dependent Variables ..............................................................................................................83
New Venture Formation .................................................................................................83

vii
Firm Failures ..................................................................................................................83
Analytical Methodology ........................................................................................................83
Chapter Summary ..................................................................................................................88
CHAPTER 5: RESULTS ...............................................................................................................90
Chapter Overview ..................................................................................................................90
Descriptive Statistics ..............................................................................................................90
New Firms ..............................................................................................................................90
Firm Failures ..........................................................................................................................92
Robustness Checks .................................................................................................................93
Chapter Summary ..................................................................................................................94
CHAPTER 6: DISCUSSION AND CONCLUSION .....................................................................96
Chapter Overview ..................................................................................................................96
General Discussion ................................................................................................................96
Signal Frequency and New Firms ..................................................................................96
Signal Frequency and Firm Failures ..............................................................................99
Signal Content and New Firms ...................................................................................100
Signal Content and Firm Failure ..................................................................................103
Boundary Conditions & Future Directions ..........................................................................104
Implications ..........................................................................................................................108
Implications for Research .............................................................................................108
Implications for Practice .............................................................................................. 111
Implications for Policy ................................................................................................. 112
Conclusion ............................................................................................................................ 113
Objectives of this Research .......................................................................................... 113
Chapter Summary ................................................................................................................ 115
LIST OF REFERENCES ............................................................................................................. 116
APPENDIX ..................................................................................................................................135
VITA ............................................................................................................................................150

viii
LIST OF TABLES
Table 3.1 Summary of Hypotheses: Signaling in Entrepreneurial Ecosystems ...........................136
Table 4.1 Selected MSAs ..............................................................................................................137
Table 4.2 Summary of Variables and Measures ...........................................................................138
Table 5.1 Descriptive Statistics .....................................................................................................139
Table 5.2 Correlations ..................................................................................................................140
Table 5.3 Summary of Effects of IVs and Moderators on New Firms ......................................... 141
Table 5.4 Summary of Effects of IVs and Moderators on Firm Failures .....................................142
Table 5.5 Summary of Robustness Test Using Age 0 Firms ........................................................ 143
Table 5.6 Summary of Robustness Test Using Age 0 Firms, Size 1-4 .........................................144
Table 5.7 Summary of Results of Primary Analysis .................................................................... 145
Table 6.1 Exemplar Quotations from Articles for E.O. Content ..................................................146

ix
LIST OF FIGURES
Figure 3.1 Model of Relationships ................................................................................................ 147
Figure 5.1 Interaction of Signal Frequency and Valence on New Firms ......................................148
Figure 5.2 Interaction of Signal Frequency and Resources on New Firms ..................................148
Figure 5.3 Interaction of Signal Frequency and Valence on Firm Failures ..................................148
Figure 5.4 Interaction of Signal Frequency and Resources on Firm Failures ..............................149
Figure 5.5 Interaction of E.O. Content and Resources on Firm Failures .....................................149

1
CHAPTER 1: INTRODUCTION
Chapter Overview
Entrepreneurs and their small enterprises are responsible for almost all the economic
growth in the United States.
-Ronald Reagan, Speech at Moscow State University, 1988
Entrepreneurship drives innovation, social change, and economic development locally,
regionally, nationally, and worldwide (Konczal, 2013). Politicians talk about the importance of
entrepreneurship, and the topic receives a considerable amount of coverage in the media (Markusen,
2013). Because of the importance of entrepreneurship, leaders at all levels are interested in ways
they can influence entrepreneurial activity among their constituents. This has led to a variety of
approaches to increasing entrepreneurial activity, many of which are not successful, while others
have succeeded beyond expectations (Lichtenstein & Lyons, 2010). For example, research has
found that training and events that increase the skills and social networks of entrepreneurs tend
to be more successful than providing money directly to (potential) entrepreneurs in the form of
grants (Lichtenstein & Lyons, 2010). The activities, relationships, and entities utilized to enhance
entrepreneurial activity are just one important part of what scholars have termed the entrepreneurial
ecosystem (EE), in acknowledgement of the interconnectedness of these factors with other market
dimensions. This dissertation focuses on the entrepreneurial ecosystems of the U.S. economy and
a subset of activities, specifically media-related, influencing new business formation.
The research to date on entrepreneurial ecosystems has addressed components such as
human capital (Florida et al., 2002), investment capital (Lerner, 1999) and industry agglomeration
(Glaeser et al., 1992). Despite these substantial bodies of research, more research is needed to
investigate antecedents that contribute to increasing entrepreneurial activity, specifically venture
formation and failure, in entrepreneurial ecosystems. Such antecedents include the role of media
and communication as they influence (potential) entrepreneurs and other ecosystem actors
(Aldrich & Yang, 2012). Past research has theorized how ecosystems change over time, but has not
investigated the specific mechanisms, such as communication. Thus, additional research is needed
on how these changes take place as well as on the specific mechanisms driving these changes. By
incorporating the notion of EEs as ecosystems, this dissertation builds on evidence from different
streams of research to further our understanding of entrepreneurial ecosystem activity by arguing

2
that a critically overlooked driver of EE changes is the role of media signals on the formation and
failure of firms in an entrepreneurial ecosystem.
In designing and conducting a study on the role of media signals on EE, I outline the
foundational elements of this proposed dissertation as follows. First, I review the set of existing
definitions of entrepreneurial ecosystems along with the definitions of closely related concepts.
I synthesize a definition of entrepreneurial ecosystems from extant, related definitions. This
synthesized definition emphasizes the role of (potential) entrepreneurs as social actors and the
importance of coordinating activities through communication. Second, I review the literature
on entrepreneurial ecosystems and related literature streams such as agglomeration (Beaudry
& Schiffauerova, 2009), population ecology (Breslin, 2008), and industrial ecology (Korhonen,
2001) to identify relevant findings and constructs for both the proposed definition and the
current study. Third, I integrate social evolutionary theory (Margulis, 1971) and signaling
theory (Spence, 1973) to develop a model and hypotheses for the effects of signals in the media
on (potential) entrepreneurs’ decisions to start or terminate firms. Then, I discuss methodology
for testing the hypotheses developed.
Following, in Chapter 1, I address the primary research question of the dissertation.
I outline the theories I use in the dissertation to develop hypotheses. I discuss the objectives,
assumptions, and scope of the dissertation. Then, I identify the research methodology used to
test the hypotheses. Next, I identify expected contributions and implications of the research for
theory, practice, and policy. Finally, I conclude with a summary of the chapter and an outline of the
organization of the dissertation.
Research Question and Research Objectives
Research Question
How do signals in the media influence (potential) entrepreneurs to start new ventures or
terminate existing ventures in entrepreneurial ecosystems? To answer this question, I focus on
the social actors in the ecosystem and the media as a channel for sending signals to (potential)
entrepreneurs. This approach focuses primarily on social evolutionary theory (SET) (Margulis,
1971) as an explanation for the behaviors exhibited and utilizes signaling theory (Spence, 1973)
logic to fill a gap in the existing SET framework. SET provides a set of evolutionary processes that
3
result in continuous change in actors and ecosystems, and offers a set of logics that explain why
actors engage in cooperative activities when competition is the baseline (Margulis, 1971; Nowak,
2006). SET also provides the expected set of cooperative and competitive relationships in which
social actors engage. However, little work in SET has addressed how social actors invoke the rules
to develop the relationships. Signaling theory provides the explanation for how the transmission of
information between signalers and receivers results in these relationships. Specifically, the signal
reduces information asymmetry between signaler and receiver, allowing the receiver to choose the
appropriate cooperative or competitive relationship (Spence, 1973; Connelly et al., 2011). Alone,
SET does not explain mechanisms to induce cooperation. When the two theories are combined in
this way, they provide an explanation for both cooperative behaviors and the mechanisms utilized
by social actors to induce the cooperation.
Objectives of this Research
In conjunction with the previously stated research question, I aim to meet the following
research objectives:
• To develop a comprehensive and inclusive definition of entrepreneurial ecosystems
incorporating past research, one that emphasizes a multi-theoretical approach to the
phenomenon;
• To integrate social evolutionary and signaling theory in the context of entrepreneurial
ecosystems to explain not just why cooperation occurs, but also the mechanisms used to
induce cooperation;
• To explore and understand the role of signals and communication in entrepreneurial
ecosystems;
• To provide support for the entrepreneurial ecosystem as an appropriate level of analysis
for entrepreneurship research

4
Problem: Incomplete Theoretical Explanation of EE Development
At the close of World War II, River City, Alabama was a bustling town of fifty thousand
people. River City had ship building facilities, was an intermodal shipping hub between rail and
waterways, hosted major repair yards for railroads, bottling plants, and manufactured lumber. A
nearby city of only twenty thousand inhabitants hosting only chemical munitions facilities from
the war and a munitions dump would soon eclipse the River City and become the Rocket City. At
the close of World War II, Rocket City had none of the natural resources of River City, no river
access and only a single railroad spur for the munitions dump. In terms of human capital, Rocket
City had seven thousand temporary workers brought to the region by the Army. River City had
some industry diversity, focused around manufacturing and transportation, while Rocket City
had none. In 2010, the River City MSA had approximately 154,000 residents and 2945 firms, 235
of which were newly established, while the Rocket City had approximately 418,000 residents
and 8726 firms, 771 of which were newly established. Why did River City have so little growth
while Rocket City had so much?
Explanations of traditional approaches to the phenomenon of entrepreneurial ecosystem
growth and development, in terms of agglomeration, or resources would seem to favor River
City. Research in the area suggests that access to resources and diverse industries should result in
economic growth as firms choose to co-locate with both related and unrelated firms to benefit from
reduced vulnerability to environmental shocks and knowledge spillovers (Jacobs, 1969; McCann &
Folta, 2008). Yet, contrary to these predictions, Rocket City – and its EE - clearly grew more than
River City. Another explanation is needed. In comparison case studies examining the change in EEs
over time, such as Silicon Valley in California and Route 128 in Massachusetts, researchers have
explored the difference between an EE that thrived (Silicon Valley) and one that did not (Route 128)
(Saxenian, 1996). This research suggested that part of the difference in growth could be attributed
to differing attitudes, beliefs, and the structure of the organizations in the regions (Saxenian,
1996). However, River City and Rocket City are neighbors only thirty-five miles apart, so regional
differences in culture seemingly do not explain how these two MSAs developed so differently.
To explain the differences in these two EEs over time, as well as others like them, new theory
is needed. Evolutionary theory has been proposed as one explanation for how these communities
develop and change over time (Aldrich & Martinez, 2010). It has been used to conceptually explain
5
how different institutions, beliefs, norms, and attitudes develop through repeated interactions
(Aldrich & Martinez, 2010). This perspective acknowledges the interrelatedness of the actors in the
ecosystem and how their interactions result in institutional changes. However, this perspective has
not fully considered the importance of communication in changing ecosystems, generally assuming
that communication happens, but not investigating the specific mechanisms that lead to the change.
I argue that communication differentiates successful ecosystems in that those that are more effective
at coordinating efforts to produce entrepreneurship have more effectively communicated messages
about entrepreneurship to other social actors in their entrepreneurial ecosystems.
Challenge: Definitional Inconsistency
The literature examining entrepreneurial ecosystems was virtually non-existent ten years
ago. As an emerging literature stream, there is little consistency or communication among the
papers as yet, though a forthcoming special issue seeks to address some of these issues (Autio
et al., 2015). The recent work in the area of entrepreneurial ecosystems still utilizes some case
study methodology (Bosma & Hoevet, 2015; Marti, Courpasson, & Dubard, 2013), but has also
begun to make comparisons between ecosystems (Parker, 2008), and to use large data sets, such
as the Global Entrepreneurship Monitor (GEM) (Szerb, Acs, & Ortega-Argile, 2015) to conduct
systematic research. The increased interest in the topic has led to a proliferation of and inconsistency
among definitions (Krueger, 2012; Stam, 2015). The definitions used leave questions as to the
appropriate level of analysis, whether city (Watkins, Ozkazanc-Pan, Clark, & Motoyama, 2015),
region (Duval-Couetil & Hutcheson, 2015), or nation (Isenberg, 2010; Acs, Estrin, Mickiewicz,
& Szerb, 2014). The definitions used also leave some question as to the appropriate scope, which
actors to include or exclude, and the relevant features of the ecosystem. The definitions leave some
question as to the role of some members of an ecosystem, such as the degree to which government
might be considered to be an actor. Integrating the definitions proposed and utilized by various
researchers (Bahrami & Evans, 1996; Aldrich & Martinez, 2010; Stam, 2015), in the following
chapters, I synthesize a definition that offers insight into these elements.
6
Gaps and Limitations: Many Disciplines, Many Conversations
Studies in the area of entrepreneurial ecosystems have not consistently spoken to one
another, remaining heavily siloed within their disciplines of economics (Glaeser et al., 1992),
sociology (Flora et al., 2005), and political science (Barthik, 1991). Research in management
journals has generally been more comprehensive, but still relies heavily on single streams, often
from other disciplines. This creates problems for scholars interested in researching entrepreneurial
ecosystems, not only in determining which literature should be used – sociology, economics, political
science – but also with identifying the gaps in the literature. A researcher taking a sociological
perspective might intend to explore questions related to knowledge transfer, and propose a novel
relationship to their literature stream, and may unintentionally overlook literature in another stream
that addresses closely related questions which could provide insight into their own research and
have been explored in knowledge-spillover in agglomeration (Beaudry & Schiffauerova, 2009).
Similarly, entrepreneurship policy researchers focused on economics literature may not realize the
relevance of economic development policy research from political science for their own research.
As such, identifying relevant literature for entrepreneurial ecosystems and key findings benefits all
those interested in the topic, so that they may incorporate findings from other literatures and also
advance our understanding without a duplication of effort.
Research Agenda
Theoretical Underpinnings
I use logic from signaling theory to explain the specific mechanisms through which SET
rules and outcomes occur. Then, I develop a model of signaling behavior in entrepreneurial
ecosystems. Specifically, I consider the influence of highly visible signals transmitted through the
media and the influence of the signals on the formation and failure of firms in the entrepreneurial
ecosystem. I develop hypotheses based on specific mechanisms of signaling behavior, including
signal frequency (volume), signal attributes (content), and signal valence (tenor) and how they
influence firm formation and failure. Further, I explicate the mechanisms through which
environmental factors of industry diversity and resource availability might affect the interpretation
and influence of these signals by receivers.

7
Methodological Approach
I test the hypotheses by designing a study and collecting data from a sample of
entrepreneurial ecosystems. For the purposes of the study, I operationalize entrepreneurial
ecosystems as Metropolitan Statistical Areas (MSAs) as defined by the U.S. Bureau of Labor &
Statistics (BLS). I use archival data provided by the BLS, Kauffman Foundation, and collected
from the Factiva Database. I leverage QDA Miner and validated content analysis dictionaries
(Pennebaker et al., 2007; Short et al., 2009) with the data from Factiva with to generate variables
of signal frequency (number of articles), signal content (entrepreneurial orientation), and signal
valence (positive or negative affect). Combining these variables with the archival data, I create
a ten year cross-sectional time-series dataset, or panel. I utilize pooled ordinary least squares
regression to test the proposed model and relationships
Implications and Contributions
Implications for Research
The research I perform in this dissertation has several implications for researchers. First,
I contribute to our understanding of how entrepreneurial ecosystems can develop differently over
time, based on new theory predicting the pattern of cooperative and competitive behaviors in
EEs and utilize communication as a mechanism for motivating change in EEs. Then, I integrate
various definitions of EE across literatures to derive a single definition that encompasses the prior
definitions, acknowledges the dynamic nature of the actors and the outcomes, and emphasizes
the role of all members of the EE as social actors who engage in some form of communication to
coordinate activities (Stam, 2015; Aldrich & Martinez, 2010). This updated and integrated definition
motivates the use of social evolutionary theory (Margulis, 1971) in entrepreneurship research and
specifically applies it to the concept of the entrepreneurial ecosystem as an explanation motivating
cooperation and the logics behind cooperation. This builds on prior work using evolutionary
theory and the evolutionary approach in entrepreneurship research (Aldrich & Ruef, 2006; Breslin,
2008). While past research has identified the types of relationships that emerge, cooperative
and competitive (Aldrich & Martinez, 2010), social evolutionary theory has specific logics for
cooperation that enhance our understanding of the phenomenon.

8
In addition to the application of social evolutionary theory, I utilize logic and insights
from signaling theory to provide a clearer theoretical understanding of the specific mechanisms
social actors can utilize, in the form of signals and communication, to induce cooperation. Further,
integrating elements of social evolutionary theory from evolutionary anthropology highlights the
role of signaling to induce desired cooperative behavior on the part of intended receivers (Sosis &
Alcorta, 2003). In purely competitive environments, signaling could reduce competitive advantages
of the signaler. Yet, the use of such communication between social actors in entrepreneurial
ecosystems becomes clearer in this light – signals for coordinating activities (Stam, 2015).
Implications for Practice
The present study highlights the role of communication for social actors in the
entrepreneurial ecosystem. The definition of an EE emphasizes that all participants in the EE,
from policy-makers, politicians, universities, firms, and (potential) entrepreneurs, are social
actors and they are part of co-evolving population that rely upon one another and are affected
by the decisions and actions of other social actors. As such, communication is important, both
as a signaler and receiver of information, for all parties, as a mechanism to influence the actions
of other social actors in ways that benefit the signaler by inducing cooperative behaviors. Social
actors who ignore communication place themselves at risk of both losing out on potential partners
and missing important signals about the EE itself. While identifying the appropriate signals can be
difficult, due to many factors, it may prove rewarding if the signalers and receivers are calibrated.
Implications for Policy
As noted previously, communication matters, and this is especially true for those engaged
in the formulation of policy. While the present study does not deal directly with the communication
of policy, it does have implications for those engaged in policy formulation and implementation.
Because many policies require those who would benefit to take some form of action to request the
benefits of the intervention, communicating the presence and intentions of the policy to the intended
recipients is crucial (Saiz, 2001). If no one knows what aid might be available, how it could benefit
them, or how they can access it, entrepreneurial activity in the ecosystem can suffer. The study
demonstrates that merely sending the signal is insufficient. Signals must be frequent, consistent,

9
and calibrated in terms of signal attributes and valence to successfully reach the receivers with the
message intact. Lack of these factors of the signal results in a failure to induce cooperation with
the policy-maker or intended partner and the policy may fail to be effective.
Organization of Dissertation
I have organized the dissertation as follows. In Chapter 2, I review the limited literature
on entrepreneurial ecosystems and provide an integrated definition of the concept. Then I
provide a multidisciplinary survey of related literature streams covering topics of importance for
entrepreneurial ecosystem researchers, consistent with the definition I develop. In Chapter 3, I
describe the key tenets and assumptions of social evolutionary theory and signaling theory. Then,
I develop a model of signaling behavior in entrepreneurial ecosystems as it influences patterns
of entrepreneurial activity in the form of new firm formations and firm failures. In Chapter 4, I
describe my sample frame and data collection procedures, as well as the analytical techniques I
employ to test the hypotheses developed in Chapter 3. In Chapter 5, I provide the results on my
analyses and summarize the findings. Finally, in Chapter 6, I discuss the findings, the contributions,
and implications of the present study.

10
CHAPTER 2: LITERATURE REVIEW
Chapter Overview
In this chapter, I have three primary goals. First, I will identify current definitions of the
entrepreneurial ecosystem and describe some of their strengths and weaknesses, as well the overlaps
and inconsistencies. Then, I will integrate the definitions for the purpose of this dissertation. While
researchers generally agree on certain aspects of the definition, there are unresolved differences
in other aspects which are relevant to the present study. Second, in the absence of a single, well-
established literature stream focusing on entrepreneurial ecosystems, I will review the disciplines
of economics, political science, sociology, management, and industrial ecology. The purpose of
this survey of the literature is to highlight the components of entrepreneurial ecosystems which
have been studied in prior research and to integrate insights from these diverse disciplines which
seldom speak to or acknowledge the research of the other streams, due to the focus on their
respective questions of interest, questions more aligned with discipline than with the phenomenon
and development of the entrepreneurial ecosystem concept. Finally, I will provide a justification for
examining the entrepreneurial ecosystem as a system, one in which all of the diverse perspectives
should be considered because of their influence not just on the ecosystem as a whole, but also
because of the influence each of them may have on each another.
Entrepreneurial Ecosystems
The literature examining entrepreneurial ecosystems was virtually non-existent ten years
ago, when only a few case studies had been published about the emergence of Silicon Valley
(Bahrami & Evans, 1995) and comparisons between Silicon Valley and Boston’s Route 128
(Saxenian, 1996). A search of the Web of Science SSCI using ‘entrepreneur*’ and ‘ecosystem*’
identified only 14 papers prior to 2011, while 81 had been published by 2015 (Autio et al., 2015).
As an emerging literature stream, there is little consistency or communication among the papers
as yet, though a forthcoming special issue seeks to address some of these issues (Autio et al.,
2015). Conversely, literatures on related topics such as economic geography (Krugman, 1991) and
clusters (Porter, 1990) gained momentum and had been researched more consistently over the
same time period (Beaudry & Schiffauerova, 2009). This recent work in the area of entrepreneurial
11
ecosystems still utilizes some case study methodology (Bosma & Hoevet, 2015; Marti, Courpasson,
& Dubard, 2013), but has also begun to make comparisons between ecosystems (Parker, 2008),
and to use large data sets, such as the Global Entrepreneurship Monitor (GEM) (Szerb, Acs, &
Ortega-Argile, 2015) to conduct systematic research. Recent work has also theorized and studied
the entrepreneurial ecosystems of nations (Isenberg, 2010; Acs, Estrin, Mickiewicz, & Szerb,
2014), regions (Duval-Couetil & Hutcheson, 2015; Fishman, O’Shea, & Allen, 2015), and cities
(Watkins, Ozkazanc-Pan, Clark, & Motoyama, 2015) in both established economies such as the
U.S. (Hechavarria & Ingram, 2014) and in emerging economies (Manimala & Wasdani, 2015).
The increased interest in the topic has led to a proliferation of and inconsistency among definitions
(Krueger, 2012; Stam, 2015).
While the term ecosystem was first coined by Moore (1993), one of the first definitions to
emerge of the concept that would become the entrepreneurial ecosystem was, “a community of
independent players that operate inter-dependently, that feed off, compete and collaborate with
one another and that operate within a common climate (Bahrami & Evans, 1995).” The limitations
of the definition are that it does not offer an explanation of why communities of players would
compete or collaborate, it does not propose any particular outcome, and there is no explanation
for how such a community would develop. This last point is particularly salient, because recent
studies have been interested in how entrepreneurial ecosystems can be built.
More recent work has further developed and refined the definition of an organizational
community or entrepreneurial ecosystem as:
a set of co-evolving organizational populations joined by ties of commensalism and
symbiosis through their orientation to a common technology, normative order, or
regulatory regime (Aldrich & Martinez, 2010 p 408).
This definition explains that the population works together to a degree, through
symbiotic relationships, and that the community develops around a common, shared technology
or institution. The above definition also acknowledges the dynamic nature of entrepreneurial
ecosystems through the process of co-evolution. Further, this definition allows researchers to
identify the appropriate boundaries, stakeholders, inputs, and outcomes related to the study of
an entrepreneurial ecosystem. Authors appealing to the non-academic audiences and policy-
makers seeking solutions for economic development have utilized a similar definition to this one,
12
marketed as start-up communities, that suggest creating a technology base or regulatory regime in
the form of incentives or university involvement in the ecosystems would be the appropriate base
for building such communities (Feld, 2012).
Researchers have noted that the literature published over the last few years has generally
failed to use a consistent definition of an entrepreneurial ecosystem, with some authors citing
studies that either invoke the term as a buzz word or fail to define the term at all (Krueger, 2012)
and other authors noting the definitions used across related literatures do not often speak to one
another and thus have no shared definition (Stam, 2015). Further, a recent call for papers for a
special issue notes that the theoretical underpinnings of the entrepreneurial ecosystem concept
seem to be lacking (Autio et al., 2015). A recent critique of the concept noted three important
issues that need to be resolved in many of the definitions in the literature: 1) that the definition
of an entrepreneurial ecosystem many studies use is largely tautological because entrepreneurial
ecosystems are defined as systems that produce entrepreneurs, 2) that many studies, for lack of a
theoretical framework, provide laundry lists of relevant topics, and 3) that the appropriate level of
analysis for an entrepreneurial ecosystem has not yet been identified (Stam, 2015). The critique
synthesizes several approaches to entrepreneurial ecosystems in an effort to resolve the first and
second points (Stam, 2015). The author highlights the importance of entrepreneurial activity value
creation and economic growth, proposing that the ultimate outcome of an entrepreneurial ecosystem
should be productive entrepreneurship, and any activities, even firm failures that result in net value
creation for the ecosystem should be considered (Stam, 2015; Davidsson, 2005; Baumol, 1993). The
definition proposed for an entrepreneurial ecosystem is “a set of interdependent actors and factors
coordinated in such a way that they enable productive entrepreneurship (Stam, 2015 p 1765).” This
definition addresses concerns about the tautological nature of the definition, in that productive
entrepreneurship is defined as economic value creation (Stam, 2015). It also solves certain aspects
of the laundry list approach in prior studies, in that these studies might be categorized as they
relate to actors and factors (Stam, 2015). The definition still lacks a theoretical underpinning,
however, being largely focused on integrating prior empirical work.
However, an examination of the definitions of entrepreneurial ecosystems, based on case
studies (Bahrami & Evans, 1995), theoretical work from an evolutionary perspective (Aldrich &
Ruef, 2006), and this integration of recent empirical work (Stam, 2015) yields certain insights and

13
commonalities. First, all of the definitions implicitly acknowledge the social nature of the actors
in the ecosystem and indeed, theoretical work has identified entrepreneurship as an activity of
social construction (Aldrich & Martinez, 2010). Second, there is consistency among the definitions
in terms of interdependence and the need for coordination, or cooperation, in addition to an
underlying assumption of some form of competition. What these definitions lack, however, is the
logic for cooperative behaviors and the mechanisms through which the actors organize (coordinate)
and cooperate. As such, I propose to integrate the definitions such that:
an entrepreneurial ecosystem is a co-evolving population of interdependent social
actors and factors coordinated (cooperating) through communication in such a
way that they enable productive entrepreneurship (Baumol, 1993; Aldrich & Ruef,
2006; Stam, 2015).
This definition incorporates the logic for cooperation as productive entrepreneurship and the
mechanism of cooperation and coordination as communication. Further, through the consideration
of co-evolving populations of social actors, as well as the outcome of productive entrepreneurship,
the definition addresses the dynamic nature of entrepreneurial ecosystems. Additionally, social
actors and factors can refer to a broad range of entities, policies, institutions, culture, and can be
incorporated into the examination and study of the ecosystem as a whole. The nature and definition
of the outcome is also sufficiently broad that it allows the use of such ecosystem-level outcomes
as firm formation, firm failure, or even regional growth. Finally, the definition also addresses the
issue of level of analysis. To the extent that a co-evolving population of interdependent social actors
can be identified for study, the definition provides justification for several levels of aggregation.
Because this definition emphasizes the social nature of entrepreneurship and the systems in which
they operate as social systems, the definition highlights a number of potential theories to explain
what happens in the formation and change of entrepreneurial ecosystems, including institutional
theory (Meyer & Rowan, 1991; Scott, 2000), social cognitive theory (Bandura, 2001), and social
evolutionary theory (Margulis, 1971; Nowak, 2006). Further, because the definition also emphasizes
communication as the mechanism for coordination, theories of communication, such as signaling
theory (Spence, 1973; 1974), agenda-setting theory (McCombs & Shaw, 1978) and mass media
theory (Bittner, 1977) could provide insight and explanations to develop our understanding of the
phenomenon of entrepreneurial ecosystems.

14
In the following sections, I identify relevant topics of interest for entrepreneurial ecosystem
research, the theoretical basis, level of analysis, and findings. Consistent with my definition of an
entrepreneurial ecosystem, I also identify the relevance of the literature in terms of applicability
to social actors, factors, communication, and cooperation. Topics of interest include: the definition
and study of entrepreneurship (Shane & Venkataraman, 2000; Baumol, 1990), literature on
agglomeration (Glaeser et al., 1992) and clusters (Porter, 1990), entrepreneurship policy (Gilbert et
al., 2004), economic development policy (Bartik, 1991; 2015), resources (Barney, 1991), institutions
(Thornton & Ocasio, 2012), media studies (Rindova et al., 2006), population ecology (Aldrich,
1990), and industrial ecology (Frosch & Gallopoulos, 1989; Korhonen, 2001). These relevant topics
are drawn from economics (Krugman, 1991), sociology (Zucker, 1989), and communications
(McCombs & Shaw, 1978), as well as from management studies (Aldrich & Martinez, 2010;
Audretsch & Keilbach, 2004) and because many topics may be covered by more than one field, I
organize them by concept.
Entrepreneurial Ecosystem Relevant Concepts
Entrepreneurship
The phenomenon at the heart of the entrepreneurial ecosystem concept is entrepreneurship,
specifically productive entrepreneurship. To understand the impact of social actors, factors, and
communication on entrepreneurship in an ecosystem, the concept must be defined. Further,
because entrepreneurship does not occur without the actions of an entrepreneur, exploring the role
of the entrepreneur is necessary. Entrepreneurs are social actors, situated in the entrepreneurial
ecosystem, coordinating many activities and roles to create value through communication with
other social actors in the ecosystem, and researchers have identified many of the activities and
roles needed for success.
Researchers have used many definitions for entrepreneurship, including entry into new
products or processes (Schumpeter, 1934; Baumol, 1993), entry into new markets (Lumpkin & Dess,
1996), the creation of new organizations (Gartner 1985; 1988) and new enterprise creation (Low &
MacMillan, 1988). More broadly, entrepreneurship has been defined as the process of opportunity
recognition (Shane & Venkataraman, 2000), a process in which entrepreneurs take advantage of
opportunities through new combinations of resources (Wiklund, 1998), or pursue opportunities
15
without regard to their controlled resources (Stevenson & Jarillo, 1990). Opportunities are defined
as “chances to meet market needs through creative combinations of resources to deliver superior
value (Ardichvili, Cardozo, and Ray, 2003 p 108).” Opportunities, by this definition, include many
activities that have been previously considered to be the focus of entrepreneurship besides just the
creation of new businesses (Gartner, 2001).
Opportunity recognition is a process that has at least three key factors to consider,
including the environment, resources, and the entrepreneur. All three factors contribute to
the presence and recognition of unique, lucrative opportunities (Venkataraman, 1997). The
environmental component of opportunities includes such factors as information availability and
asymmetry (Ardichvili et al., 2003) as well as institutional factors relating to the legitimacy and
desirability of a potential opportunity (Bruton et al., 2010). Institutional factors include whether
entrepreneurship or innovation are viewed favorably, whether in the general environment or
within a firm (Bruton et al., 2010; Shane, 2000; Hayek, 1945). ). Legitimacy refers to the degree
to which an entrepreneur’s venture is accepted (Aldrich & Fiol, 1994) or has a right to exist in the
environment (Suchman, 1995). Cognitive legitimacy is the degree to which a venture has become
taken for granted, or become part of the landscape, while sociopolitical legitimacy is the degree to
which key stakeholders accept the venture (Aldrich & Fiol, 1994). The legitimacy of the venture
influences access to a range of important factors, such as support from government, funding, and
resource access, as well as access to markets and customers.
Resources are important for the recognition and exploitation of an opportunity. From
resource-based perspectives (Barney, 1991), resources should be rare, valuable, inimitable,
and organized in order to provide a basis for capabilities (Hitt, Ireland, and Hoskisson, 2013).
These capabilities arise from the unique combinations a firm or entrepreneur is able to imagine
and implement and are then able to provide a basis for sustained competitive advantage to an
organization (Hitt et al., 2013). The heterogeneity of resources across firms has been proposed as
the true key to understanding superior performance among entrepreneurs (Alvarez & Busenitz,
2001; Alvarez & Barney, 2007). Several definitions of entrepreneurship highlight the role of
resources (Wiklund, 1998; Stevenson & Jarillo, 1990).
The third component of the opportunity, according to Venkataraman (1997) is the
entrepreneur, the individual responsible for recognizing the opportunity and taking the actions
16
that constitute entrepreneurship. Entrepreneurs are social actors engaged in a process of social
construction, one in which they create a new social entity, a new venture based on an opportunity
(Aldrich & Martinez, 2010). To recognize opportunities, entrepreneurs engage in information
search (Cooper, Folta, & Woo, 1995) in which they leverage information from the environment
(Archdivili et al., 2003) and from their personal networks through social capital (Baron, 2000;
Westlund & Bolton, 2003). The purpose of the information search is to gain new information
about such topics as customer needs, new technologies, or new markets (Archdivili et al.,
2003). Entrepreneurs also receive information from other sources, in the form of coaching from
incubators (Audet & Couteret, 2012) and information about entrepreneurship generally from the
media (Aldrich & Yang, 2012). Entrepreneurs also need to coordinate activities and communicate
to stakeholders in their venture, such as venture capitalists (Shepherd & Zacharaki, 2001; Balboa
& Marti, 2007) or followers who participate in the activities of the venture (Baum, Locke, &
Kirkpatrick, 1998; Michael, 2009).
Combining the environment, resources, and the entrepreneur, an opportunity is created.
Because of the focus of the present study on the ecosystem-level of analysis, rather than the
individual, and consistent with the definition of an entrepreneurial ecosystem, the present study
uses the definition from the literature that has considered entrepreneurship to be the creation
of new enterprise (Low & MacMillan, 1998) or new organizations (Gartner 1985; 1988). Other
research has focused on entrepreneurship as a mechanism for innovation, the creation of new
products or processes (Schumpeter, 1934; Baumol, 1993). These definitions overlap to an
extent, but do not entirely cover the same set of phenomena, as some new ventures are not
necessarily innovative. Similarly, new innovations do not necessarily result in new firm creation.
Productive entrepreneurship, defined as economic value creation, can result from either form of
entrepreneurship (Davidsson, 2005).
The role of entrepreneurship as the key outcome of entrepreneurial ecosystems research
cannot be understated, thus examining research in entrepreneurship provides some insights that
can be used in the study of ecosystems. Following Venkataraman (1997), I define entrepreneurship
as opportunity recognition which incorporates the environment, resources, and the entrepreneur.
Although other definitions of entrepreneurship and the intersection of the individual and
opportunity vary significantly (Alvarez & Barney, 2007; Baker & Nelson, 2005; McMullen &
17
Shepherd, 2006; Sarasvathy, 2001), the definition of entrepreneurship relevant to this dissertation
is one that identifies the importance of the environment, the entrepreneurial ecosystem, for the
opportunity, in terms of information (Archdibili et al., 2003) and legitimacy (Aldich & Fiol, 1994).
The research addresses the role of entrepreneurs as social actors engaged in the construction of
new entities (Aldrich & Martinez, 2010) and the coordination and communication processes in
which they engage to search for information (Archdivili et al., 2003; Cooper et al., 1995). Finally,
the outcome of productive entrepreneurship was defined as new venture creation, one type of
opportunity recognized, consistent with streams of research in the area of entrepreneurship
(Gartner, 1985; Davidsson, 2005).
Agglomeration
Agglomeration research relates to the study of entrepreneurial ecosystems in at least three
ways. First, agglomeration considers factors in the external environment and how they impact the
performance of firms, including new ventures. Second, agglomeration research has examined the
importance of the presence of both related and unrelated firms for the performance of firms in
ecosystems. Other firms are key social actors with whom interdependencies may develop. Finally,
the presence of knowledge spillovers as an explanation for firm performance benefits in this stream
of research implies the importance and relevance of communication.
The focal research phenomenon of the field of economic geography is the spatial location
of firms and economic activity (Krugman, 1991). While this literature has not always been a part
of mainstream economics, it has nonetheless re-emerged as a thriving stream since relatively
recent work has developed the theory of agglomeration and applied it to questions of firm
(Audretsch & Feldman, 1996), cluster (Porter, 1990; Porter, 1998), regional (Baptista, 2000), and
country economic performance (Isaksen & Onsager, 2010). Research in the area has additionally
considered multiple performance measures, including growth (Glaeser et al., 1992; Rosenthal &
Strange 2003), productivity (Almeida, 2006; Rao, 2004), and innovation (Feldman & Audretsch,
1999; Baptista & Swann, 1998). Recent reviews of the literature have found that there is broad
consensus among published articles in the literature that agglomeration matters (Beaudry &
Schiffauerova, 2009; McCann & Folta, 2008).

18
The literature on agglomeration can be categorized into two broad streams, based on the
theoretical arguments, which tend to relate to the level of analysis being considered (McCann &
Folta, 2008). The first stream examines the effects of agglomeration on diverse industries, seeking
to explain why firms would choose to co-locate with unrelated firms, consistent with early work
theorizing the existence of knowledge spillovers between industries and benefits to regions in terms
of portfolio effects reducing vulnerability to environmental shocks (Jacobs, 1969; Montgomery,
1994; McCann & Folta, 2008; Beaudry & Schiffauerova, 2009). These types of effects, because
they are external to the firms and industries benefitting, have been termed Jacobs’s externalities
(Jacobs, 1969). The theoretical argument for the mechanism of these externalities is that increased
diversification increases spillovers between industries, which leads to more competition for
resources, and that the increased competitive pressure increases the rate of innovation and
technology adoption (Jacobs, 1969; Beaudry & Schiffauerova, 2009). Work in this area has tended
to examine the regional level and has been less concerned with performance or competitiveness of
firms, but rather the performance of the region (McCann & Folta, 2008).
The other literature stream in agglomeration research has focused more on the reasons
that similar firms would choose to co-locate and the benefits they might derive from co-location
(McCann & Folta, 2008; Beaudry & Schiffauerova, 2009). This behavior has been explained
by factors exogenous to other economic actors in the region and by the endogenous creation
of externalities (McCann & Folta, 2008). This framework was developed from the work of
Marshall (1890), Arrow (1962), and Romer (1986) into the MAR (Marshall, Arrow, Romer)
model of regional specialization (Glaeser et al., 1992). The exogenous factors proposed include
access to factors of production that are regionally specific, such as natural resources (Marshall,
1920) and these factors have been found to explain certain types of agglomeration, such as
those around natural transportation resources (e.g. navigable waterways) and resource deposits
(e.g. coal deposits), although research has found that only about twenty percent of the variance
can be explained by exogenous factors (Ellison & Glaeser, 1999; McCann & Folta, 2008). The
endogenous creation of externalities, on the other hand, would be those benefits that accrue to a
region such that the benefits are greater with the number of firms in the industry (Arthur, 1990;
Marshall, 1920), for example labor market pooling and transaction cost reductions (Martin &
Sunley, 2003; Beaudry & Schiffauerova, 2009).
19
Several interesting findings have emerged from agglomeration research that are of
particular interest to the present study, beyond the agreement between both streams and prominent
researchers that agglomeration matters (McCann & Folta, 2008; Beaudry & Schiffauerova, 2009).
Research in both streams has overlapped to a degree, examining agglomeration at varying levels,
including cities (Visser, 1990), MSAs (DeCarolis & Deeds, 1999), states and provinces (Shaver &
Flyer, 2000; Baptista, 2000), and countries (Isaksen & Onsager, 2010) and the findings suggest that
the level of agglomeration studied matters, such that the magnitude of the effect of agglomeration
increases with smaller geographic units (Beaudry & Schiffauerova, 2009). Further, it appears that
the effects of MAR and Jacobs’s externalities differ according to industry characteristics. MAR
variables have stronger influence on lower technology industries, while the MAR variables have
been shown to hinder high technology industries under some conditions, although this may be an
artifact of measurement inconsistency across studies (Beaudry & Schiffauerova, 2009; Frenken
et al., 2005). Finally, Jacobs’s externalities appear to have a positive effect across studies, but the
effect is less pronounced in lower technology industries, meaning that some degree of the effects
of a diverse region are important for all industries. These findings, among others, contribute to the
literature on entrepreneurial ecosystems, especially the understanding of factors in the environment.
Clusters
The literature on clusters further develops the important relationships for entrepreneurial
ecosystem research identified in the agglomeration literature, particularly the importance of related
industries as social actors and for spillovers due to communication. Developed from the logic of
agglomeration and economic geography, the cluster research differs from agglomeration in two
ways (Porter, 1990; Lindqvist, 2009). First, a cluster is defined as a group of related industries and
their supporting institutions, including non-market actors (Porter, 1990; Porter, 1998). Second,
while agglomeration research views co-location as an outcome and influence on performance,
cluster research has examined the mechanism through which the benefits of agglomeration accrue
to clusters (Lindqvist, 2009). The appropriate unit of analysis for research in cluster research has
been identified as the cluster, rather than individual firms or regions (Porter, 1990). Because of
the specific definition of a cluster, research in this area has leaned toward economic policy and
regional development policy (Porter, 1998; Lindqvist, 2009). This research has been focused on

20
the ways in which policy can influence and enhance the benefits of agglomeration for clusters
(Delgado, Porter, & Stern, 2012; Porter, 2003). As evidence for the beneficial influence of clusters
and to motivate policy decisions, other research has examined the effect of the presence of clusters
on entrepreneurship (Delgado, Porter, & Stern, 2010), cluster innovation (Delgado, Porter, & Stern,
2014), and cluster economic performance (Porter, 2003).
The impact of cluster research has been in the area of policy (Martin & Sunley, 2003;
Lindqvist, 2009). Because clusters encompass more than a single industry, capturing links between
firms, spillovers, technology, skills, and other supporting institutions as well as non-market actors,
clusters provide a basis for collective action and government intervention (Porter, 2000). This
has led to the development of numerous public-private partnerships to foster cluster development
and improvement (Ketels, Lindqvist, & Solveil, 2006) and has led some researchers to conclude
that the cluster concept has become a fad (Martin & Sunley, 2003). Cluster initiatives attempt
to strengthen the relationship between agglomeration and the effects of proximity to other firms
by increasing the number of firms and thus generating greater benefit from exogenous factors of
location decision, as explained under the logic for agglomeration benefits (Arthur, 1990).
Research using the cluster concept as a proxy for agglomeration has found that firms in
clusters have increased performance (Kukalis, 2009) and innovation (Bell, 2005). Other research
in the area has suggested that firms in clusters perform better as a group than firms in other
locations (Tallman et al., 2004). An interesting finding related to the present study is that regions
with industry clusters may see higher failure rates but that the failure rates are offset with higher
firm births (Sorenson & Audia, 2000). The cluster research also strengthens the role of non-market
actors that support the related industries of the cluster indirectly. While the research in this area
has examined the role of government and public-private partnerships, this same logic provides a
basis for exploring the role of other non-market actors, including the media. Such public-private
partnerships highlight the influence of social actors in the environment other than firms.
Entrepreneurship Policy
Research in the area of entrepreneurship policy focuses on the role of the government
for the entrepreneurial ecosystem, both as an independent social actor, and as a facilitator for
cooperation and communication. As a social actor, governments directly interact with other actors
21
in the ecosystem. As a facilitator, government can intervene with incentives to cooperate or share
information. Further, governments can enact policies that influence the relationship between other
social actors and environmental factors, from resource access to institutions.
From the neoclassical economics perspective, no role for entrepreneurship exists,
because of the assumptions of perfect competition and the expectation that markets will reach
equilibrium (Baumol, 1990; Kirzner, 1997). However, other schools of thought in economics
examine entrepreneurship and economic activity (Knight, 1921; Schumpeter, 1934; Hayek, 1945;
Baumol, 1990). Austrian economists theorize that entrepreneurs are the engines of the economy,
agents seeking to learn more about the preferences of other actors under conditions of imperfect
knowledge, leading to continual change in the preferences of all market actors as the market tries
to reach an equilibrium which cannot be achieved (Kirzner, 1997; Hayek, 1945). Other economists,
not of the Austrian school, also recognized the importance of entrepreneurship for economic
activity, proposing that entrepreneurs are those individuals who are willing to bear uncertainty
and thus profit as a reward (Knight, 1921), while others focus on the difference in motivations of
entrepreneurs, given equivalent perceptions (Schumpeter, 1934).Theorists have made efforts to
reconcile the differences between these perspectives and entrepreneurship is widely recognized by
economists as an important process (McMullen & Shepherd, 2006).
Empirical research in the area of entrepreneurship has covered a diverse range of economic
outcomes, including unemployment rates (Tervo, 2006), individual maximization decisions (Parker,
2004), personal characteristics of entrepreneurs (Djankov et al., 2006), and social capital (Minniti,
2004). An area of entrepreneurship research that has studied regional impacts, specifically, has been
research concerning the knowledge spillover theory of entrepreneurship, which has investigated
the impact of entrepreneurship on regional innovation, in which knowledge spills over between
individuals who then engage in entrepreneurship, increasing regional economic growth (Audretsch
& Keilbach, 2004, 2005; Audretsch, Bonte, & Keilback, 2008). The consensus of entrepreneurship
policy research has demonstrated the impact of entrepreneurship on employment, productivity,
and innovation, as well as generating the spillovers, particularly due to start-up activity in cities
and regions (Acs & Armington, 2006; Fritsch, 2004). Such research leads to prescriptions for
increasing entrepreneurship and entrepreneurial activity in regions as a mechanism for improving
economic growth (Gilbert et al., 2006).

22
The economics literature and research on the topic of entrepreneurship most relevant to
the present study is in the area of entrepreneurship policy. Combining insights from the findings
of various streams of economics literature, including agglomeration (Glaeser et al., 1992), clusters
(Porter, 2003), and knowledge spillovers (Acs & Armington, 2006; Audretsch & Keilbach, 2004),
entrepreneurship policy literature both makes recommendations for leveraging these mechanisms
to increase innovation and entrepreneurship for regional growth and assesses the degree to which
such policies are effective (Gilbert et al., 2004). Economic policy research has examined the
effectiveness of policies at various levels of government, including city (Sternberg, 1996), state
(Braunerjhelm & Carlsson, 1999), and federal interventions (Lerner, 1999) in the U.S. (Lugar &
Goldstein, 1991; Saxenian, 1994) and worldwide (Kim & Nugent, 1999; Acs et al., 2014).
Entrepreneurial policy research has further identified channels through which
entrepreneurship policy operates to influence decisions made at the individual, industry, and
regional levels (Audretsch, Grilo, & Thurik, 2007). According to this research, a policy falls
into one of six broad categories, depending on which aspect of the entrepreneurial ecosystem
it influences (Carree, van Stel, Thurik, &Wennekers, 2007). Policy can increase the 1) demand
for entrepreneurship (e.g., technology transfer policies), 2) the supply of potential entrepreneurs
(e.g., immigration policy), 3) the knowledge, skills, and abilities of potential entrepreneurs (e.g.,
training programs), 4) the preference of individuals to pursue entrepreneurship (e.g., values and
attitudes about entrepreneurship), 5) the attractiveness of entrepreneurial vs. non-entrepreneurial
decisions (e.g., taxation policy benefitting self-employment), and 6) the market access for potential
entrepreneurs (e.g., property rights protections) (Audretsch, Grilo, & Thurik, 2007; Thurik, 2009).
The conclusion has been that it is the portfolio of policy decisions, rather than any particular
policy that influences the development of entrepreneurship in a region (Thurik, 2009). All of these
mechanisms are also related to the role of the government as either a social actor or facilitator in
the entrepreneurial ecosystem, whether influencing cooperation, communication, or factor access.
Economic Development Policy
Economic development policy literature explores additional and alternate mechanisms
through which the government takes social action and acts as a facilitator. In addition, this
literature also explores the role of individual politicians and the public as social actors with

23
influence on entrepreneurial ecosystem decisions and actions. Separate from, yet complementary
to entrepreneurship policy, is the study of economic development policy, a stream of literature
from the discipline of political science. Political scientists study the effects of political activities
and political behaviors, including politicians and governments, as well as the outcomes of such
activities, from their influence on public opinion to the performance of the economy as indicated by
growth and employment (Vaughn, Pollard, & Dyer, 1985). Theories of political science regarding
the role of government in fostering economic development emphasize the role of voting, interest
groups, public opinion, and bureaucracy on these decisions (Bartik, 1991). Economic development
policies contribute to the business climate either because they provide direct assistance to firms or
indirectly change conditions (e.g., public schools) (Bartik, 1991). Economic development policy
research linked to economic performance of the region has focused on direct interventions. These
direct policies have been further categorized into traditional and entrepreneurial approaches.
Traditional approaches tend to focus on attracting outside businesses to a region through
marketing, financial incentives, and non-financial incentives and have been called smoke-stack
chasing policies (Daneke, 1985; Bartik, 1994). Entrepreneurial approaches focus on improving the
local capital markets, education for small businesses, research, and other non-financial assistance, to
grow business from within the region (Bartik, 1991). In spite of findings that traditional approaches
do not often result in long-term economic growth or benefits for the region, such approaches are
easier for politicians to understand, to employ, and to explain to voters (Wolman, 1988). Political
science research has found that these visible public figures are evaluated by their constituents on
easy to understand information, especially job growth and unemployment, rather than on regional
output or more abstract measures of economic growth (Bartik, 1991; Bartik, 2015).
In seeking to understand why traditional policies for economic development fail in their
growth goals, political scientists explicitly acknowledge the trade-offs and costs associated with
economic development, costs related to supporting a larger population of individuals and firms
demanding services and utilizing infrastructure (Wolman, 1988). Indeed, the literature in political
science has found that economic development policies are inherently risky for political actors,
because they do not know whether benefits will exceed costs when they implement policies
(Reigeluth, Wolman, & Reinhard, 1980). As the paradigm of local government has shifted to the
point where urban and state governments now compete to attract firms, governments have chosen
24
to offer additional incentives and the larger these incentives to attract firms and increase jobs, the
less likely the region is to see benefits (Wolman, 1988; Bartik, 2015).
Perhaps the most important contribution of economic development policy literature to
the topic of entrepreneurial ecosystems is the acknowledgement that, in spite of objective criteria
measuring increases in innovation, social benefits, and per capita income of economic development
policies, the decision-makers rely primarily on job creation and employment as an indicator of
success (Bartik, 2011). Convincing voters and politicians of the importance of certain types of
policies is perhaps as important as identifying and implementing effective policies. Voters and
politicians are important social actors for the entrepreneurial ecosystem, actors largely ignored in
other research streams, and they are actors whose decisions and judgments can have disproportionate
impacts on entrepreneurship in an ecosystem through changing rules and access to factors.
Resources
In entrepreneurial ecosystems, resources are the factors of production available for the
production of goods or services by current and potential entrepreneurs. As such, they are the
quintessential factors of the entrepreneurial ecosystem definition. Research into agglomeration
and clusters has identified resource availability as a benefit of co-location of firms (Glaeser et
al., 1992). In the structure-environment-performance paradigm, resources are assumed to be
largely homogenous among firms (Porter, 1981). From this perspective, resource heterogeneity,
if it developed, would quickly be eliminated by the market because resources were assumed to
be immobile (Barney, 1991). An alternative to this perspective, the resource-based view (RBV),
assumes that resources are mobile and heterogeneous across firms (Barney, 1991). It is through
leveraging asymmetrical resource bundles that firms are capable of creating sustainable competitive
advantage and thus provide above-average returns to shareholders (Sirmon, Hitt, & Ireland, 2007).
Under RBV, resources are capable of contributing to sustained competitive advantage when they
are valuable, rare, inimitable and non-substitutable (Barney, 1991). Valuable resources are those
that allow firms to increase efficiency or effectiveness. Rare resources are not homogenous among
competitors and do not have near substitutes, hence they are non-substitutable. Inimitability may
be the most interesting dimension of a resource, because of the importance of causal ambiguity,
meaning that a firm, itself, might not fully understand its resource (King, 2007; Reed & DeFillippi,

25
1990). Firm location within a particular ecosystem affects resource access, from natural resources
(Marshall, 1920) to knowledge (Glaeser et al., 1992).
Ecosystem resources may follow assumptions of either the structure-environment-
performance paradigm or the RBV, depending on the characteristics of the resource. For the
individual firms operating in the industry, however, these ecosystem resources may be taken-
for-granted characteristics of the environment. Infrastructure improvements, including roads or
high-speed internet availability, offer ecosystems advantages over competitors, and are highly
immobile between ecosystems, while firms in the ecosystem have equal access to them. Human
capital in the ecosystem, improved through the quality of education and presence of institutions of
higher education, moves between ecosystems more freely, as well as moving freely between firms
in the ecosystem. Thus, decision-makers managing the ecosystem often face a problem known as
the tragedy of the commons in choosing which resources to develop. These resources contribute
to the public good and are expensive to develop and maintain, however the benefit of the resources
can be reaped unequally by constituent groups, or not at all.
Transforming these resources into performance, whether through economic growth or
additional jobs, requires action as the mere possession of resources does not contribute to superior
performance (Priem & Butler, 2001). Ecosystems depend on successful firms to determine their
own performance, thus knowledge of how these resources are utilized is relevant for ecosystems.
Resource management, or orchestration, proposes the mechanisms through which resources
are transformed into superior performance, because, contrary to some arguments, the actions
necessary are not self-evident (Sirmon et al., 2007; Sirmon et al., 2011). The dynamic resource
management model proposes three types of actions for resource management, structuring the
resource portfolio, bundling resources to form capabilities, and leveraging capabilities to exploit
market opportunities (Sirmon et al., 2007). If a firm possesses resources and effectively manages
them, they should have superior financial performance. Research supports the idea that superior
sustained performance extends from resources (Wiggins & Ruefli, 2002) and that they explain at
least some of the variance in firm performance (Crook et al., 2008). Following this logic, resources
should also explain a degree of the performance for ecosystems, mediated by the performance
of firms, although with the added costs ecosystems incur for maintaining public goods, the
relationship may not be as strong.
26
The development and utilization of resources incurs a cost for the entrepreneurial
ecosystem. The cost can be financial for resources such as public transportation or hi-speed
internet service. In other cases, the cost may be environmental, such as with the extraction of
resources or the pollution associated with manufacturing. For the ecosystem, opportunity costs are
also important to consider, because resources currently engaged by firms may be unavailable for
entrepreneurship. Resources that are highly mobile are also subject to the tragedy of the commons,
in which an ecosystem’s activities have developed these resources, but then the ecosystem does
not benefit from them because they leave (Hardin, 1968, 2009; West et al., 2007). Human capital
development, such as investment in higher education, typifies this problem for ecosystems. An
educated workforce benefits high quality, high technology ventures, however the education they
received also creates more opportunities for the workers and provides them with higher levels
of mobility (Maston, 1985). It is vital for ecosystems to develop resources and also to maintain
resources within the ecosystem.
Entrepreneurial Culture
For the purposes of the present study, entrepreneurial culture encompasses a set of
related constructs in the literature at the ecosystem level that triangulate on the socially
constructed environment of the firm, including an entrepreneurially-supportive regional culture
(Beugelsdjik, 2007), entrepreneurial capital (Audretsch & Keilback, 2004), and entrepreneurial
social infrastructure (ESI) (Flora et al., 1997). These constructs are grounded in a rich history of
research into values, norms, and beliefs, all of which contribute to and shape the interpretation of
the environment by potential entrepreneurs. Entrepreneurial culture influences the perceptions
of social actors in the entrepreneurial ecosystem about entrepreneurial action. It can also play an
important role in shaping aspects of the environment that would be included under factors, such
as institutions, norms, and beliefs. Finally, entrepreneurial culture may affect the desirability of
cooperation and communication among social actors in the entrepreneurial ecosystem.
Entrepreneurship capital includes institutions, policies, demographics, history, and a host
of other sociological factors (Audretsch & Keilbach, 2004). Entrepreneurship capital, constructed
through social interactions of actors in the environment, develops social networks and a sense of
belonging and trust which facilitate the transfer of knowledge and leads to higher levels of start-
27
up activity as entrepreneurs innovate and create firms almost as a by-product of their innovation
(Audretsch & Keilbach, 2004). Sociologists aggregated individual-level opinions and argue that
these beliefs, combined, reflect the entrepreneurial social infrastructure (ESI) of an entrepreneurial
ecosystem (Flora, Sharp, Flora, & Newlon, 1997). Basing the argument on collective action by the
community to facilitate economic growth, these scholars argue that ESI facilitates the legitimacy
of entrepreneurship, mobilization of community resources for entrepreneurship, and improves
networks of entrepreneurs (Flora et al., 1997). The definition of entrepreneurial capital and the
definition of ESI both acknowledge the social construction of many important aspects of the
environment of the individual entrepreneur.
Another area of research has concentrated on linking work at the country level to regional
level culture, specifically through utilizing dimensions of a national culture scale theoretically
relevant to entrepreneurship (Hofstede, 2001; Beugelsdijk et al., 2013). Related research has
developed a definition-agnostic scale of entrepreneurial culture based on archival data, through
identification of the differences in responses between entrepreneurs and non-entrepreneurs on
a national values scale (Beugelsdijk, 2007). Although such a measure is certainly valuable and
was demonstrated to relate to economic growth, it neglects the importance of the views of non-
entrepreneurs for entrepreneurship in a region as well (Beugelsdjik, 2007).
Research in this area has been critical of the perceived failure of past research to theoretically
identify the specific mechanisms through which entrepreneurial culture influences business
formation and economic growth of ecosystems (Beugelsdijk, 2007). This research suggests that
entrepreneurial culture may create conditions for economic dynamism, including increased variety,
competition, and innovation, which then lead to economic growth (Carree & Thurik, 2003). Support
for this link has been found in research identifying a relationship between the presence and size of
a creative-class and firm creation (Florida, 2002), as well as research linking new firm formation
rates to regional entrepreneurial values (Davidsson, 1995). Research in ESI linked dimensions of
legitimacy of alternatives, resource mobilization as a collective, and network quality to economic
growth, using the aggregate of individual survey responses, suggesting that these are potential
indicators of entrepreneurial culture (Flora et al., 1997). Studying entrepreneurial culture across
a broad range of contexts requires measuring it quantitatively, and the research to date has made
excellent progress in this direction.

28
Research has provided evidence for the shift in culture over time, although the specific
mechanisms and expected directionality are not well understood (Beugelsdijk et al., 2013).
When considering the signs and artifacts that embody entrepreneurial culture, the mechanism
for intentional shift seems clearer. Research demonstrates a link between public opinion and
changes in policy, although this literature also shows a distinct delay in how quickly policy
changes (Phillips, 2013). Because culture has enduring qualities, shifts in one sign alone will only
move it so far, and such a delay or resistance would be expected. And of course, the role media
plays in the convergence of cultures internationally has received considerable attention (Jenkins,
2006). The media introduces new stories and myths as signs and also has the potential to shape
their interpretation. When signs pertaining to entrepreneurial culture shift in multiple domains at
once, and in the same direction, reinforcing one another, the entrepreneurial culture should move
more rapidly in that direction. The preferred components of entrepreneurial culture include signs
encouraging acceptance and legitimacy of alternatives (Flora et al., 1997; Aldrich & Martinez,
2011), collective action (Flora et al., 1997), and favorable network and social interactions (Flora et
al., 1997; Audretsch & Keilbach, 2004).
Legitimacy of alternatives refers to the degree to which an entrepreneurial culture exhibits
openness to discussion of new ideas, individuals not taking discussion personally, and focusing on
process as opposed to solutions (Flora et al., 1997). These types of entrepreneurial cultures make
it easier for new firms to attain cognitive legitimacy, the acceptance of new ventures as a normal
event, and sociopolitical legitimacy, the acceptance by entrepreneurial ecosystem stakeholders
of the new venture as appropriate (Aldrich & Fiol, 1994). Research has further identified two
domains of sociopolitical legitimacy: moral acceptance, or the conformation to norms and values,
and regulatory acceptance, or the conformation to rules and regulations (Aldrich & Martinez,
2011). Entrepreneurial cultures should have lower thresholds of acceptance for new ventures in
many of these areas, easing their births. Collective action refers to the mobilization of community
resources toward community support and development and the degree to which a community
and individuals in the community are willing to support public goods (Flora et al., 1997).
Entrepreneurial cultures support public goods and focus on the development of resources for the
benefit of the community, although the source of the backing can be from public or private sources,
29
depending on the ecosystem, (Flora et al., 1997). The development of these resources contributes
to entrepreneurship as described previously.
Entrepreneurial cultures also encourage favorable network qualities that facilitate the
transfer of information and knowledge among diverse groups, and include diversity of community
networks for each individual, inclusivity, horizontal linkages to other communities, vertical
linkages (to regional, state, and federal governments), and broad definitions of community with
permeable boundaries (not insular, essentially) (Flora et al., 1997). Diverse individual networks
allow more people to bridge structural holes with their weak ties (Granovetter, 1974; Flora et al.,
1997), while inclusivity leads to a broader range of backgrounds and perspectives in the network.
Linking to other communities, working with higher tier governments, and broadly defining the
boundaries of the community all increase network size and access, resulting in better chances
for knowledge spillovers (Audretsch & Keilbach, 2004), partnerships, and mobile resource
acquisition (Flora et al., 1997).
The most important findings of entrepreneurial culture research are in the impact culture
can have on entrepreneurship. Entrepreneurial culture encourages individuals to ask questions
of current processes and look for improvements. Entrepreneurial culture rewards those who
take risks and pursue opportunities, awarding approval in the form of stories and accolades,
financial rewards for success to reinforce behaviors, and power in the community through
unofficial or official means. Entrepreneurial culture encourages autonomy and institutions
and the bureaucracy of an ecosystem will likely reflect this with lower impediments and fewer
regulations. As such, entrepreneurial culture mainly fits firmly into the factors, as far as the
definition of an entrepreneurial ecosystem.
Institutions
Research in this area related to entrepreneurial ecosystems may touch on rules and
regulations, as well as legitimacy of entrepreneurship, all of which are factors of the entrepreneurial
ecosystem. These factors may influence the rules of communication and cooperation, the norms
among social actors, and the perceptions about such activities as cooperation among actors.
Institutional theory addresses the setting and environment in which entrepreneurship
occurs, including the basis for establishing and evaluating legitimacy of entrepreneurship (Tolbert
30
et al., 2011). Institutions consist of cognitive, normative, and regulative structures and activities
providing stability and meaning to social behavior (Scott, 2000). Institutions are transported by
various carriers – cultures, structures and routines – and they operate at multiple levels (Scott,
2000). Regulative structures establish rules, review conformity to the rules, and levy sanctions to
influence future behavior (Scott, 2000). Normative structures introduce prescriptive, evaluative,
and obligatory dimensions into social life, including values and norms, while cognitive structures
frame the nature of reality and the ways in which meaning is created (Scott, 2000). These structures
influence behavior through pressures to conform and to seek legitimacy.
Organizations are legitimized if they conform to expectations and yield to coercive,
normative, and mimetic pressures (DiMaggio & Powell, 1991; Meyer & Rowan, 1991). Coercive
isomorphism stems from formal and informal political influence and legitimacy, defined as the
pressures experienced by organizations from other organizations or the overall organizational
field to act in a certain way (DiMaggio & Powell, 1991). Mimetic isomorphism occurs when an
organization mimics what other organizations do, often as a response to environmental uncertainty
(DiMaggio & Powell, 1991). Organizations model their own behavior after that of successful
firms in an attempt to capture similar success. Normative isomorphism emerges with increasing
professionalization, the codification of specific trades or disciplines, which then influences those
practicing within an organization (DiMaggio & Powell, 1991). Similar human capital inputs as
a result of similar education or participation in professional network activities lead to similar
organizational structures (DiMaggio & Powell, 1991). Researchers in this area highlight the
limitations of the current literature, including a focus on culture, single-country studies, and
a lack of consistency among streams of institutional theory being applied to entrepreneurship
(Bruton et al., 2010). To better understand how institutions change, a new perspective emerged in
the form of institutional logics.
Institutional logics are socially constructed patterns and rules of behavior that provide
meaning to interactions (Ocasio & Thornton, 1999; Thornton et al., 2012; Thornton, 2002).
This comprehensive definition incorporates the symbolic, normative, and structural aspects of
institutional logics, corresponding to the three pillars of institutional theory (Scott, 1987) as well
as synthesizing previous definitions (Jackall, 1988; Friedland & Alford, 1991; Townley, 1997). The
institutional logics perspective, as a meta-theory (Thornton, Ocasio, & Lounsbury, 2012), offers
31
insights into how institutions at the societal level create underlying logics that guide the activities
of organizations, lead to change, and not only explain how isomorphism exists, but heterogeneity
in organizations as well (Thornton & Ocasio, 2008).
Different sources provide institutional logics, as identified by a typology of seven
institutional orders: markets, corporations, professions, states, families, communities, and religions
(Friedland & Alford, 1991; Thornton, 2004; Thornton et al., 2012). Each of the institutional orders
consists of a set of taken for granted rules and norms, has an economic system, its own sources
of legitimacy, learning mechanisms, control mechanisms, an organizational form, and logic of
exchange (Thornton et al., 2012). Institutional orders serve as sources of rationality for individuals
and organizations, such that it is no longer necessary for those using institutional logics, rather than
institution theory, to suppose that isomorphism would be expected (Townley, 2002). Institutional
logics may also develop at multiple levels, not just society-wide, often taking shape given activities
at the society-level (Bhappu, 2000; Haveman & Rao, 1997).
Because the institutional orders often interact through the material and cultural perceptions
of individuals and organizations, the orders are actually interdependent. The interplay of the material
and cultural aspects are often interpreted through the lens of the particular institutional logic being
employed by an individual, organization, or field at a particular time (Thornton & Ocasio, 1999).
Various institutional orders may have more influence over the course of time (Lounsbury, 2002;
Thornton & Ocasio, 2008). Research specific to the context of entrepreneurship has advanced the idea
that the market logic is an entrepreneurial logic, and that the interaction of this entrepreneurial logic
with other logics results in varying norms about entrepreneurship across contexts and individuals
(Miller et al., 2011). The perspective has also been applied to the emergence and legitimization of
types of entrepreneurship, such as that of social entrepreneurship (Nicholls, 2010).
Entrepreneurial ecosystems research must acknowledge the importance of institutions for
the many effects they have on entrepreneurial activity. Findings indicate that institutions play
key roles through normative, regulatory, and cognitive factors contributing the perceptions that
entrepreneurship is a legitimate, desirable social outcome (Aldrich & Fiol, 1994). Recent work
investigating the process of institutional change and the interaction of logics reinforces these
conclusions. They play an important role, not only as factors, but for how they affect communication
and cooperation among social actors in the entrepreneurial ecosystem.
32
Media Studies
The media acts as a conduit for communication in the entrepreneurial ecosystem and
can also act as a non-market social actor as well. Communications theory in this area highlights
the influence the media can have on directing public attention and shaping public perceptions
(McCombs & Shaw, 1978). Previous studies have highlighted the importance of the media as
an information mediator or infomediary, affecting sense-making processes and evaluations by
organizational stakeholders (Deephouse, 2000; Pollock & Rindova, 2003), as well as providing a
conceptual model for how media might influence entrepreneurship (Aldrich & Yang, 2012), and
at least one study has examined the influence of mass media on entrepreneurial activity at the
national level (Hindle & Klyver, 2007). Prior research has shown that media coverage of topics
shapes public perception through several mechanisms, including the volume or number of articles
in which a particular issue, organization, or industry is mentioned has been to shape public
perception (Pollock & Rindova, 2003).
Research has related increased media attention to increases in organization and industry
social approval, including legitimacy, reputation, and celebrity (Deephouse, 1996; Deephouse
& Carter, 2005; Pollock & Rindova, 2003; Rindova, Pollock, & Hayward, 2006; Westphal &
Deephouse, 2011; Zavyalova, Pfarrer, Reger & Shapiro, 2012). This line of research also examined
the effect of media coverage on measures of organizational performance, including market share
and financial performance (Deephouse, 2000), organizational survival (Rao, 1994) and IPO pricing
(Pollock & Rindova, 2003).
In the area of entrepreneurship, conceptual papers have suggested that a link exists between
stories of entrepreneurs portrayed in the media and the creation of wealth (Lounsbury & Glynn,
2001). This research has suggested that such stories mediate the relationship between available
resources, entrepreneurial and institutional, and entrepreneurial identity and legitimacy. Other
research in this area has looked at how media can affect the formation and legitimacy of industries
(Navis & Glynn, 2010), the decision of entrepreneurs to enter new industries (Sine, Haveman, &
Tolbert, 2005), and even the effect that media coverage can have on the success of entrepreneurial
ventures in new technology areas (Benjamin et al., 2016). The effect of media on entrepreneurship
has generally been theorized as altering perceptions of institutional legitimacy (Sine et al., 2005;
Navis & Glynn, 2010; Aldrich & Yang, 2012) through changing public perceptions and attention

33
(McCombs & Shaw, 1978). Thus, the media is a social actor, a conduit for communication, and can
affect the perceptions of coordinating and cooperating activities.
Population Ecology
In many ways, the population ecology literature aligns closely with the entrepreneurial
ecosystem definition. The influence of the external environment, in terms of the factors, is
important for both literatures. In addition, population ecology has often taken a population
level approach and utilized evolutionary theory to explain behavior. Thus the definition of an
entrepreneurial ecosystem draws heavily from population ecology.
Population ecologists have considered the questions of why and how organizations
change over time and how new organizational forms emerge (Hannan & Freeman, 1977; Aldrich
& Martinez, 2010). Researchers and theorists in this stream of literature rely primarily on the
precepts of evolutionary theory to explain processes of change (McKelvey & Aldrich, 1983;
Aldrich, 1979). As a theory of change, evolutionary theory explains how variation and adaptation
behavior of individuals and firms leads to superior performance and thus their selection over
their competitors, and then how these superior behaviors diffuse throughout a species, as only
those firms with the superior behavior are retained while others fail (Aldrich 1979; Aldrich &
Ruef, 2006). Although the theory explains change at individual, species, and population levels,
the effects are most easily observed and measured at the species level, thus studies in this area
have focused primarily on the species level of analysis, examining the change in species of firms
over time (Carroll & Hannan, 1989; Lomi, 1995), although more recent studies have considered
changes in firm characteristics (St-Jean, LeBel, & Audet, 2010; Cardozo et al., 2010).
Early studies examined the influences of environmental characteristics such as institutions
(Carroll & Hannan, 1989) and legitimization (Barnett & Carroll, 1987) on the population distribution
of firms in industries, finding that characteristics such as population density influenced the
formation and failure of firms (Aldrich, 1990). The mechanisms of action proposed for population
density were many, including the increase in knowledge density, social network contacts, and
higher propensity for collective action with higher population density of firms (Aldrich, 1990).
Criticisms of the population approach, however, called for further investigation into the socio-
political elements contributing to legitimization (Powell, 1995). The link between legitimization

34
and population ecology outcomes has been explored, leading to research synthesizing institutional
and population ecology approaches (Carroll & Hannan, 1989; Zucker, 1989).
Population ecologists are often interested in the births and deaths of firms and this creates
a natural overlap between population ecology and entrepreneurship, especially in the case of
entrepreneurship researchers interested in the importance of the environment (Low & MacMillan,
1988; Breslin, 2008). Entrepreneurship research utilizing the population ecology perspective
examines the influence of the environment on populations of entrepreneurial firms (Breslin,
2008). Entrepreneurship research in the area has examined various relationships and individual
mechanisms of the approach for entrepreneurship, including variation (Aldrich, 1999; Aldrich
& Martinez, 2001), selection (McKelvey, 1982; Aldrich & Martinez, 2001; Delacroix & Carroll,
1983), and retention (Aldrich & Fiol, 1994). The streams also overlap in the consideration of the
importance of legitimization, due in part to institutional theory studies that have combined them.
Most relevant to the present study, the importance of location dependencies was also
identified, as well as heterogeneity between firms in different spatial and temporal locations (Hawley,
1986; Baum & Mezias, 1992; Lomi, 1995). Studies in the area had identified the level of aggregation
as an important factor in the determination of effects, finding that city-levels seemed insignificant
in some studies (Carroll & Wade, 1991), while regional or state aggregation was significant (Carroll
& Wade, 1991; Hawley 1986; Lomi, 1995). Spatial location was found to be an important predictor
of both births and survival (Lomi, 1995). Mechanisms of legitimization, the evolutionary processes
that have been investigated and linked to actual phenomena, as well as the utilization of population-
level measures of firm birth and survival also bear importance for the present study.
Industrial Ecology
From the system approach, to the relative newness of the field, industrial ecology and
entrepreneurial ecosystems have several commonalities. The definition of an industrial ecosystem
incorporates systems of people as social actors, for example, and similar to the definition of an
entrepreneurial ecosystem, the definition of an industrial ecosystem acknowledges the dynamic
nature of both the ecosystem and the outcomes. As a relatively new paradigm to the analysis
of industrial systems, industrial ecology emerged from multidisciplinary approaches to studying
industrial-environment interactions (Frosch & Gallopoulos, 1989; Lifset & Graedel, 2002). While

35
the primary focus of the field is on manufacturing and product design, researchers also situated
their studies in the natural world and use the guidelines of studies in natural ecosystems to enhance
their understanding and prescriptions for industrial ecosystems (Ehrenfeld, 2000). This approach
is facilitated by several assumptions - 1) organizations are systems of people, and these systems
must function within the constraints of the local ecosystem, 2) the dynamics and principles of
natural ecosystems provide valuable insights, 3) high material and energy efficiencies generate
competitive advantages and economic benefits, and 4) the ultimate source of advantage is the
long-term sustainability of the natural ecosystem in which industry is situated (Lowe & Evans,
1995). The first assumption influences the variety of methodological choices, in that systems
modeling approaches considering all aspects of the industrial ecosystem are the preferred method
of analysis (Ehrenfeld, 2000). The second assumption influences the prescriptions for industrial
ecosystem design because of the mechanisms identified in natural ecosystems. The third and
fourth assumptions influence the goals and outcomes of researchers in this area.
The natural ecosystem principles applied to best design for industrial ecosystems include
roundput, diversity, locality, and continuous change (Korhonen, 2001). Roundput in the industrial
ecosystem is used to describe both the flow of energy and the use of materials by firms, such that
waste materials used by one firm are used as inputs by other firms. Conceptual work investigating
firm strategy in industrial ecosystems has identified the strategic benefits of firms engaging in
roundput to be primarily through the reduction of costs of resources and increasing efficiency
(Esty & Porter, 1998). Firms either increase the value of their available resources or find ways
to lower the effective costs looking within the firm, within the value chain, or outside the value
chain (Esty & Porter, 1998). Ecosystem diversity carries benefits analogous to biodiversity, in that
the range of actors and interdependencies leads to more opportunities for cooperation and greater
exchange of information, not unlike those benefits of economics literature on agglomeration
(Jacobs, 1969). As diversity increases, the range of potential inputs and outputs for firms increases,
leading to more opportunities for efficiencies (Korhonen, 2001). Locality describes the effect of
the local environment on the adaptation and decisions of firms, which are locally situated and
are constrained by geographic conditions, such as natural resource access or transportation
infrastructure (Korhonen, 2001). Finally, this research assumes that change is continuous, often
gradual, and can occur in institutions, culture, and among actors (Ehrenfeld & Gertler, 1997).

36
Because industrial ecology considers the system and all of the actors as situated within the natural
systems, all of the principles of natural systems apply.
Research in the area of industrial ecology, using the above principles and guidelines as
theoretical insight and explanation, has mostly developed in the direction of case studies and
theoretical modeling at present and a systematic analysis across industrial ecosystems has not
been conducted. However, the case studies and models do yield interesting results and avenues
for future research. Research has examined the roles of firms and technology. Firm in industrial
ecosystems exhibiting the best practices following the IE principles have been observed to act
as policy-makers, rather than policy-takers, going beyond basic expectations of participation
by stakeholders (Ehrenfeld, 2000; Socolow, 1994). Technology serves to enable efficient use of
resources and to solve ecosystem problems and challenges (Ausubel & Langford, 1997; Lifset
& Graedel, 2002). Further, a role for entrepreneurship has been identified in the research as
well, because entrepreneurial activity enhances and increases the carrying capacity of the
environment (Lowe & Evans, 1995).
Industrial ecology, as a new paradigm, has the potential to lend several findings and
principles to the study of entrepreneurial ecosystems. Of particular interest is the systems approach
to the study of the ecosystem, that it is not only constituted of systems and constrained by a local
ecosystem, but that it must also be situated in a larger system context (Ehrenfeld, 2000). The
application of complexity theory and complex modeling to industrial ecosystems suggests that
similar methodological approaches might be appropriate for entrepreneurial ecosystems, as they
are also emergent, self-organizing systems (Ehrenfeld, 2000). Finally, the application of biological
ecosystem principles may provide a roadmap for researchers interested in entrepreneurial ecosystems
to identify a framework for analysis, as has been done in the industrial ecosystems literature.
Conclusion
In broad terms, the preceding literatures have provided insight into the study of
entrepreneurial ecosystems in one of several areas consistent with the definition. The study of social
actors, factors of the environment, cooperative behaviors, and the importance of communication
have all been considered across these concept areas and literatures. Whether through new
theoretical approaches, identifying environmental factor variables, or the influence of non-market

37
social actors, each of the literatures examines the phenomenon of the entrepreneurial ecosystem
from different levels of analysis and perspectives, but each literature provides a justification for
the regional unit of analysis, and for considering regional outcomes (Porter, 1990; Kort, 1981). The
diversity of the literatures also reinforces the importance of considering the ecosystem holistically,
given that each has found relationships between differing, but often related variables - including
agglomeration and resources, and institutions and media, for example.
Theoretical lenses include evolutionary approaches, institutional approaches, and media
studies approaches. Evolutionary theory explains changes occurring at the individual, species,
and population levels as variation, selection, and retention processes take place and influence the
distribution of firms surviving in the ecosystem (Aldrich, 1990). Institutional approaches address
normative, regulatory, and cognitive-cultural factors of the environment that may influence the
selection processes of evolutionary theory or the decision processes of potential entrepreneurs (Scott,
1990; Carroll & Hannan, 1989). Media studies approaches examine the influence of non-market
information carriers on the legitimization process and institutions surrounding entrepreneurship
(Deephouse, 2000; Hayward et al., 2006). Entrepreneurs are subject to changing institutional
environments which may affect their decisions as well as the survival of their firms and the synthesis
of these theories provides an explanation and mechanism for altering the institutional environment.
Other factors identified in the research were not linked to the physical and competitive
environment. These include agglomeration, clusters, and resources to which firms may belong or
have access. Location decisions influence firm performance through access to resources (Marshall,
1920; Barney, 1991), social networks (Aldrich, 1990), and related industries for partnerships
(Porter, 1990) and research has identified the presence of historical contingencies influencing firm
performance that are related to spatial decisions as well (Lomi, 1995; Glaeser et al., 1992). Location
decisions affect transportation and efficiency costs, as well as providing the potential for symbiotic
interactions, from an industrial ecological perspective (Korhonen, 2001).
The influence of non-market stakeholders also matters to the performance of firms, whether
those stakeholders are politicians (Bartik, 1991), government (Bartik, 2015), or the media (Hayward
et al., 2006). These non-market players may influence the market through direct interventions,
such as in the case of economic development policies targeting specific firms or industries, or
through entrepreneurship policy designed to increase access to the market for entrepreneurs. They
38
may also indirectly affect the market through policies that increase human capital, or through the
mechanism of changing public opinion. The research supports the conclusion that their influence
makes a difference for the birth and survival of firms (Bartik, 2015; Stanley, 1996).
The research in these areas supports the examination of firm births and survivals as
appropriate outcomes, though they also use different metrics within their literature streams, they
have triangulated on births and deaths as a region appropriate measure. Population ecology (Hannan
& Freeman, 1977), entrepreneurship policy (Gilbert et al., 2004), agglomeration (Glaeser et al.,
1992), and some institutional studies (Carroll & Hannan, 1989) have considered it a reasonable
measure. Integrating the preceding streams provides support for the regional level of analysis
(Gilbert et al., 2004), outcomes of firm birth and survival (Carroll & Hannan, 1989), investigation
into sociopolitical precursors of entrepreneurship (Powell, 1995; Aldrich & Martinez, 2010), as
well as consideration of physical and competitive conditions in the regional environment (Glaeser
et al., 1992) and for considering it as a system (Ehrenfeld, 2000).
The diverse literatures highlight the importance of social actors and communication to
motivate coordination and cooperation in the entrepreneurial ecosystem. Social actors as diverse
as potential entrepreneurs, industry competitors, government, politicians, and the media all
influence the outcome of productive entrepreneurship in the ecosystem. These social actors also
have varying influences on the factors that comprise the environment of the entrepreneur and this
influence leads to the evolution of both the environment in terms of social systems, institutions,
and culture, as well as the social actors and their perceptions. A theoretical approach at the system
level incorporating the social aspects of the entrepreneurial ecosystem and the mechanisms of
communication is needed to provide a theoretical explanation for cooperation.
Chapter Summary
In this chapter, I set out to accomplish three goals. First, I reviewed the emerging literature on
entrepreneurial ecosystems and identified the primary definitions of the concept. I then integrated
the definitions and further explicitly identified the social role of actors in the ecosystem as well
as the mechanism of communication for coordinating activities and cooperation to improve value
creation in the entrepreneurial ecosystem. Second, I surveyed diverse literatures and identified
their relevance to entrepreneurial ecosystem research based on the integrated definition, linking

39
each to social actors, factors, cooperation, and communication. Third, through the integrated
definition and the survey of related literatures, I have argued for the importance of a systems
approach to entrepreneurial ecosystem studies, based on the interdependence of social actors and
the dynamic nature of the ecosystem social actors, factors, and outcome.
40
CHAPTER 3: THEORY & HYPOTHESIS DEVELOPMENT
Chapter Overview
In this chapter, I identify a gap in social evolutionary theory (SET) due to assumptions
about the way communication between social entities works, and then I use signaling theory logic
and mechanisms to propose a model of signaling behavior explaining patterns of firm formation
and firm failure in entrepreneurial ecosystems. The model offers insights into the mechanisms
through which social actors in the environment communicate and induce cooperative behaviors.
The addition of signaling theory logic and mechanisms to social evolutionary theory enhances the
explanatory power and applicability of SET.
In the first section of the chapter, I describe social evolutionary theory, its key assumptions
and logics for action. Social evolutionary theory provides a basis and explanation for the
cooperative behaviors of actors in social environments such as entrepreneurial ecosystems (EEs).
Key assumptions include the presence of evolutionary processes of variation, selection, retention,
and struggle for survival, all of which are present in entrepreneurial ecosystems. The logics
through which organisms are induced to cooperate are further explicated. These logics, or rules
for why individuals would choose to cooperate, include kin selection, direct reciprocity, indirect
reciprocity, network reciprocity, and group selection. While SET does explain the logic behind
these rules and the expected outcomes of their application, SET does not explain how individuals
leverage the rules in order to benefit from cooperative behaviors. Thus I describe signaling theory
in the second section of the chapter and explain how the two theories complement one another.
Due to information asymmetry, social actors possess incomplete knowledge of potential partners,
for example their openness to cooperation or their fitness as cooperative partners. To induce
cooperative behaviors, they must reduce this information asymmetry through signals. Signaling
theory explains how these signals are transmitted, received, and interpreted by actors in the social
environment of the entrepreneurial ecosystem.
In the final section of the chapter, I synthesize insights from these two theories to propose
a model of signaling behavior in entrepreneurial ecosystems. Specifically, I consider the influence
of highly visible signals transmitted through the media and the influence of the signals on the
formation and failure rates of firms in the entrepreneurial ecosystem. Signals transmitted by
the media to induce entrepreneurial behaviors originate from diverse entrepreneurial ecosystem

41
stakeholders, including politicians, business leaders, non-governmental organizations supportive of
entrepreneurship, and other entrepreneurs. For the most part, these signalers have vested interests
in creating more entrepreneurship and through their costly signals, in terms of time, reputation, or
money, they convey information about the quality of the EE for potential entrepreneurs. Building
from these assumptions, I develop hypotheses based on specific mechanisms of signaling behavior,
including signal frequency (volume), signal attributes (content), and signal valence (tenor) and
how they influence firm formation and failure. Further, I propose the mechanisms through which
environmental factors of industry diversity and resource availability might affect the interpretation
and influence of these signals by receivers.
Theory
Social Evolutionary Theory
Social evolutionary theory draws on the tenets and processes of evolutionary theory to
explain why organisms develop cooperative strategies and identifies the mechanisms through which
cooperation is possible in social environments (Nowak, 2006). In nature, individuals compete for
survival in situations where they have limited access to food, shelter, and mates, but biologists
observe many examples of cooperative behaviors designed to reduce the time spent searching
for food, improve protection from the elements, and ensure mate selection for reproduction and
spreading genes (Margulis, 1971; Corning, 1995). The same reasoning for cooperation of other
organisms applies to people as well. Indeed, research in the area of social evolutionary theory has not
only identified the mechanisms through which organisms in nature induce cooperative behaviors,
but has also found mechanisms that apply uniquely to humans (Nowak, 2006; West et al., 2007).
Driving the need for cooperative behaviors, competition for scarce resources underlies
social evolutionary theory and evolutionary theory, from which researchers draw the processes of
evolution (Darwin, 1859; Nowak, 2006). Four processes constitute evolutionary theory: variation,
selection (natural selection), retention (diffusion), and the struggle for existence (Aldrich,
McKelvey, & Ulrich, 1984; Aldrich & Ruef, 2006). Variation is most easily described as some
form of intentional or accidental change in response to external stimuli operating on the organism.
Accidental or unintentional changes are often referred to as blind variations (McKelvey & Aldrich,
1983; Aldrich & Ruef, 2006). Genetic mutations, such as albinism or polydactyly, are examples of
42
blind variations (Galis, 1999). Intentional variations usually involve behavior, such as an organism
choosing an alternate food source or environment, for example the migration of bears into northern
climates, where they eventually became polar bears.
Variation, alone, does not ensure survival or fitness, rather it is the interaction of the
modified organism with the environment that determines survival, a process known as selection
(Darwin, 1859; Aldrich & Ruef, 2006). By virtue of their variations, whether blind or natural, some
organisms experience superior performance, being better adapted to survival (Darwin, 1859). For
example, the peppered moth of Great Britain has both light and dark versions, and the dark version
was more prominent and successful during the industrial revolution because that variant was able
to blend in with the sooty buildings more easily, avoiding predators (Miller, 1999). It is important
to clarify that selection does not necessarily result in any kind of optimum performance, only an
improvement over other organisms without the variation, so better enough, but not best (Berkley,
2016). Variations that do not produce better adaptation are selected against and should become
extinct in the population, while the successful variations should be reproduced through heredity
in succeeding generations (Darwin, 1859; Aldrich & Ruef, 2006). The diffusion of successful
variations through the population is known as retention (Darwin, 1859). In the case of the peppered
moth, the lighter variants all but disappeared as they were consumed by predators, but the variant
was retained in the genes (Miller, 1999). This illustrates the fourth process as well, the struggle for
survival, which necessitates the evolutionary process (Darwin, 1859; Aldich & Ruef, 2006).
Evolutionary theory has been applied to organizations as well, as an explanation for how
organizations change over time (Aldrich, 1976; Hannan & Freeman, 1977; Aldrich & Ruef, 2006).
Just as with individual organisms, organizations change over time as organizations adapt, are
selected, and traits leading to success are retained (Aldrich & Ruef, 2006). The evolutionary cycle
operates continuously on the population of organizations. Organizations adapt through intentional
and blind variation, the same as organisms. Intentional variation may result from changes in
organizational form or strategy designed to take advantage of perceived market opportunities
(Aldrich & Ruef, 2006; Barnett & Carroll, 1995). Blind variations occur as well, such as in the
reproduction of existing forms or businesses, when those recreating the form do not possess a full
understanding of why the form works well (or does not work well), for example (Aldrich, 1999;
Breslin, 2008). Adaptations and blind variations of firms are subject to the process of selection.

43
If the variation enhances survival of the organization, it is selected, while a reduction results in
selection of competing forms (Aldrich & Ruef, 2006). At the population level, the organizations
with the best adaptations to the environment at any given time should survive and those traits that
offered the benefits are then retained. Retention occurs when the new trait that proved successful
in the selection phase proliferates into the next generation through reproduction (Aldrich, 1999).
Reproduction of organizations may be in terms of new firm founding or the diffusion of practices
or innovations (Breslin, 2008). Over time, the configurations possessing the trait become dominant
as managers recognize which exploitative behaviors are most successful, exemplifying the
principle of retention. As in the case of organisms, the competition over scarce resources results in
a struggle for continued existence, motivating the need to adapt and change to maintain superior
performance as competitors do the same (Aldrich et al., 1984; Aldrich & Ruef, 2006).
Building on evolutionary theory, from the struggle for existence to the processes of variation,
selection, and retention, social evolutionary theory (SET) specifically addresses competition and
cooperation of organisms, and because they are composed of organisms, organizations (Nowak,
2006; Chandler, 1962). In addition to the core evolutionary theory principles, SET also has
assumptions about social behavior and fitness (Nowak, 2006; West el al., 2007). First, as defined
by social evolutionary theory, social behavior is any behavior that has consequences for both an
actor and a recipient (Hamilton, 1964b; West et al., 2007). Second, and related, the consequences of
the behavior are measured in terms of direct fitness and indirect fitness (West et al., 2006). Direct
fitness affects the production of offspring, leading to retention through successful reproduction. As
an example of direct fitness among organizations, consider the case of spin-offs such as Fairchild
Semiconductor, originally a division of Fairchild Camera and Instrument, as firms reproduce
their structure (Laws, 2010). Indirect fitness, on the other hand, relates to the reproduction of
related individuals. Fairchild Semiconductor also presents an example of indirect fitness among
organizations. It had tremendous influence on the entire ecosystem through the transference of
its culture and training of a generation of executives and entrepreneurs, including AMD, Intel,
Netscape, and Google, among others (Saxenian, 1994; Saxenian, 1996; Laws, 2010).
Social evolutionary theory, therefore, suggests that organisms cooperate with one another
rather than compete, because they gain either direct or indirect fitness through the relationship,
and thus increase the chance of passing on their traits (Hamilton, 1964b; West et al., 2006). Of

44
note, as exemplified with Fairchild, indirect fitness does not strictly require genetic relation.
Individuals can benefit indirectly through cooperating with other individuals who possess traits
that result in cooperation (Hamilton & Axelrod, 1981). In addition, SET research highlights
that cooperative behaviors benefit not just individuals but the entire ecosystem and these
benefits accrue at the population level. Specifically, populations consisting of more individuals
engaged in cooperative behaviors have higher average fitness, while populations with more
individuals focused on purely competitive behaviors have lower average fitness (Nowak, 2006).
To clarify this finding, populations where more firms cooperate have lower variation between
the highest and lowest members of the population and the average fitness for all members of
the population is higher. From an entrepreneurial ecosystem perspective, the entire ecosystem
would be performing better and firms, on average, would perform better (Nowak, 2006). On
the other hand, populations with more pure competitors exhibit larger variation between high
and low performers - there are exceptional competitors and their performance comes at a
price for the low performers. In this type of population, the average fitness of the population is
lower than with cooperative populations (Nowak, 2006). From the ecosystem perspective, the
ecosystem performance suffers with pure competition, rather than cooperation. This implies
that entrepreneurial ecosystems with higher levels of cooperation should have higher average
fitness and will exhibit less variation in terms of individual fitness.
Social evolutionary theory proposes four possible social relationships between actors: 1)
mutualism, 2) altruism, 3) selfishness, and 4) spite (West et al., 2007; West et al., 2006). Mutualism
exists when both the recipient and the actor receive a positive benefit from the interaction.
Organizational studies literature in the domain of evolutionary theory further distinguishes between
partial and full mutualism (Aldrich & Martinez, 2010). Partial mutualism corresponds to SET’s
altruism, in which one party benefits, while the other does not (Aldrich & Martinez, 2010; West
et al., 2007). A relationship is altruistic when the actor receives no benefit or incurs a cost, while
the recipient benefits. Selfishness reverses the relationship of altruism, such that the actor receives
benefits while the recipient incurs negative consequences. Selfishness corresponds to the partial
competition relationship identified in organizational studies (Aldrich & Martinez, 2010). Finally,
spiteful relations results in negative consequences for both the actor and the recipient, similar to
45
the full competition condition in organizational studies (Aldrich & Martinez, 2010). These social
interactions allow social evolutionary theory to be extended to the organization level of analysis.
Further, social evolutionary theory proposes the logics through which organisms, and
organizations as well, induce cooperative behaviors (Nowak, 2006; West et al., 2007). These logics
are kin selection, direct reciprocity, indirect reciprocity, network reciprocity, and group selection
(Nowak, 2006). The first form of cooperation is kin selection, in which natural selection operates
in such a way as to promote the cooperation of individuals who are genetic relatives (Hamilton,
1964a). In less cognitively sophisticated life forms, from microorganisms to cattle, kin selection
functions through indirect fitness. An organism may undertake an action that would be costly to it
in order to ensure the survival of its genes. In an organizational context, this can be construed in
several ways. First, some organizations or their representatives may be considered genetic relatives
of the firm, such as in the case of a spin-off or “child” company. Firms might also have an actual
genetic, biological tie between them, such as when two firms are controlled by the same family.
Shared directors or corporate officers who have moved between firms might also provide a familial
tie between firms. In order for kin selection to function, all that is required is the perception
of relatedness on the part of decision-makers in the organization. This perception of relatedness
results in their willingness to undertake actions that will benefit a recipient, although benefits to
the actor are not required, thus mutualism and altruism both apply in this case. For entrepreneurs
with new ventures, a sense of kinship may arise from shared education or experiences. With the
emergence of more directed efforts to encourage entrepreneurship, accelerators and incubators
have become more common. Entrepreneurs who share mentors, are part of the same accelerator
cohort, or received office space in the same incubator are likely to develop a sense of kinship
with other entrepreneurs, thus encouraging cooperation. The shared identity as entrepreneurs may
foster this as well (Yang & Aldrich, 2012).
The second form that cooperation can take in natural selection is direct reciprocity, which
explains cooperation among unrelated individuals, and develops from repeated interactions between
individuals or organizations (Trivers, 1971). However, a component of competition also exists in
this relationship, because hyper-competitive environments can result from repeated decisions to
compete (Barnett & Hansen, 1996). This type of cooperation is most easily represented by the
Prisoner’s Dilemma (Hamilton & Axelrod, 1981), in which, during multiple rounds of play, the

46
players have an opportunity to either cooperate or defect (compete), knowing that in the next
round their actions will potentially affect the actions of the other player. Multiple strategies can be
employed to win the game by surpassing the performance of competitors. The simplest winning
strategy is known as tit-for-tat, in which the game begins with cooperation and then the previous
player’s move is repeated, a cooperative action for cooperation, and a defection for defection
(Hamilton & Axelrod, 1981; Nowak, 2006). In the real world, however, cognition is present and
so non-cooperation can be forgiven. In this strategy, termed win-stay (Nowak & Sigmund, 1993),
cooperation is repeated as long as the player is doing well (Nowak & Sigmund, 1993). Game
theorists suggest that in cooperative environments, win-stay surpasses tit-for-tat in performance
(Nowak & Sigmund, 1993). In an organizational context, direct reciprocity is most readily
represented by formal arrangements, such as strategic alliances, in which an exchange relationship
has been detailed and can be enforced. As described in the Prisoner’s Dilemma example, any of
the four types of consequences may result from direct reciprocity. In entrepreneurial ecosystems,
cultural factors can affect the perceptions of entrepreneurs about the desirability of working
with other entrepreneurs. Non-market entities directing ecosystem development may encourage
entrepreneurs to work together more strongly because their goals are aligned to the health or
benefit of the ecosystem as a whole, rather than to the success or failure of a particular firm.
Indirect reciprocity takes into consideration the asymmetric relationships among people
and organizations. It requires actors to be capable of recognizing and remembering the actions of
cooperators and competitors; thus it occurs only in humans (Nowak, 2006). Indirect reciprocity
involves helping others, whether individuals or organizations, where the potential for direct
reciprocity does not exist. Although direct reciprocity is based on immediate exchange, indirect
reciprocity operates through the intermediary of reputation. One organization helping another
organization results in an increase in reputation and all decisions about whether to assist others
are based on how aiding others, or not, will affect the reputation of the organization (Nowak,
2006; Rankin et al., 2007). Individuals and organizations that help others have been shown to
be more likely to receive assistance in return (Nowak, 2006; Nowak & Sigmund, 1998). Indirect
reciprocity requires memory and the ability to survey and understand the social situations, as
well as the ability to acquire and disseminate information through language (Nowak & Sigmund,
1998). Among organizations, indirect reciprocity occurs when entities provide aid or cooperate
47
with no expectations of returns. For example, during the 2008 hops shortage, Samuel Adams
provided 20,000 pounds of hops to craft breweries caught unprepared (BYO, 2008). The company
had no expectations for remuneration. Social dilemma and public goods problems are situations in
which game theorists have experimentally tested this issue, particularly with the development of
common resources. All four of the social evolutionary theory responses can be observed in indirect
reciprocity. In the entrepreneurial ecosystem, indirect reciprocity is enhanced through the non-
market entities capable of offering support to new ventures. For example, senior entrepreneurs who
take on mentoring roles to nascent entrepreneurs may receive indirect benefits from government or
other non-market entities, including access to social capital or other reputational benefits.
The fourth form of cooperation in natural selection is network reciprocity, or spatial
reciprocity, in which clusters of cooperating individuals or organizations form to assist each
other (Nowak, 2006; Nowak & May, 1992). Among lower order organisms, network reciprocity
occurs among populations that are physically co-located. In this type of cooperation, all of these
organizations that cooperate pay a cost for each of their neighbors to receive some benefit, while
entities that do not cooperate pay no cost and are essentially free-riders. When the cooperators
cluster, they can exclude the non-cooperators and enhance their own benefit, which allows
them to compete more effectively. This means that organizations can eliminate some portion
of competition at one level in order to better compete as a network. Examples of this type of
cooperation in organizations would be value network or supply chains, in which integrated
networks of organizations compete more effectively than individual companies acting in their own
best interests while participating in the buyer-seller relationships. Competing social networks are
also an example of this form of reciprocity, when the entire network cooperates to compete against
other networks. Entire entrepreneurial ecosystems can develop this form of cooperation, as the
new ventures forming compete against other established ecosystems or large entities. If the culture
of the ecosystem develops in such a way as to encourage an ‘us’ versus ‘them’ mentality toward an
outside entity, this type of cooperation occurs.
Group selection is the final form of cooperation and this type of cooperation operates on
two levels simultaneously: within-group and between-group. At the within-group level, cooperators
are less effective than non-cooperators, because non-cooperators take resources and do not pay
for them, which allows non-cooperators to benefit more (Nowak, 2006). At the between-group

48
level, agglomerations of cooperators have more favorable resource availability and grow faster
(Nowak, 2006). This differs from network reciprocity, for example, because the individual network
members are working together as a unit to compete, rather than working against each other. In
an organizational context, this means that individual companies within an industry or strategic
group might receive a boost when they choose not to cooperate, but they lose out to groups of
companies that choose to work together to compete as an industry. Group selection is particularly
interesting when considering the idea of community ecologies (Astley, 1985; Moore, 2006), which
are considered to be a higher form of organization, composed of small organizations. An effective
group configuration of cooperators benefits all of the participants and provides better resource
access for all. An extreme example of group selection would be a cartel that competes against a
second group of firms that are highly competitive among themselves. This level of cooperation
develops when ecosystems compete with one another.
While extant SET has identified different forms of and rules for explaining what actions
(cooperation or competition) will happen under certain conditions, little work in the area of SET has
investigated or indeed hypothesized the specific mechanisms at work to explain how individuals
can leverage these rules of cooperation to elicit or induce the desired cooperative relationship and
corresponding behaviors. Any combination of these rules might be at work in a given relationship
or population, resulting in multiple rules and reasons to cooperate or to compete, depending on the
information exchanged between social actors. As explained above, SET identifies four potential
relationships that can emerge between social actors. Mutualism occurs when both benefit and
share the cost. Altruism occurs when one benefits at a self-imposed cost for the other. Selfishness
occurs when one benefits at the cost of the other. Finally, spite occurs when one self-imposes a cost
to impose a cost on the other. These relationships emerge based on the rules of cooperation: kin
selection, direct reciprocity, indirect reciprocity, network reciprocity, and group selection (Nowak,
2006). The link between the rules and the behavior that emerges, however, has not been explored
in SET, only implied. In this dissertation, I suggest this gap in the theory can be addressed through
the application of logic and theory about how groups and individuals communicate.
Inducing a behavior through any of these mechanisms in a social context requires
communication. This link has been explored to a limited extent in the context of evolutionary biology
(Warrington et al., 2014). Yet, the qualities and traits which would lead individuals or organizations

49
to follow through on the logics and engage in the cooperative behavior are not obvious or easily
identified by the potential partners. Consider the case of kin selection in nature as an example.
Apostle birds cannot visually identify members sharing their genetic markers to ensure survival of
their genes (Warrington et al., 2014). They have developed a cooperative breeding strategy, however,
and need to be able to assist family members. They have developed a communication mechanism,
such that members of the same family lineage, even from diverse geographic regions, can identify
each other through song (Warrington et al., 2014). This allows the family sub-populations to
have better chances of success and survival. In an organizational context, firms want to induce
cooperation as well and doing so is not a direct process. Partner firms cannot know in advance the
outcome of such a partnership or the qualities of the original firm that would make cooperation
beneficial; only engaging in cooperative activities of some sort will prove such a claim.
The fact that firms have imperfect knowledge of one another, as with organisms, results
in information asymmetry. Firms reduce the information asymmetry in the expectation that the
information they communicate will lead potential partners to conclude that cooperation is desirable
through one of the above logics. Cooperation then leads to one of the four relationship types:
mutualism, altruism, selfishness, or spite (West et al., 2007). The nature of the relationship affects firm
performance and the resulting change results in selection. Successful relationships are retained and
may diffuse, while unsuccessful relationships should fail. The process begins with communication
and inducement to cooperate, however. SET has little to offer in terms of how the information is
transmitted, only why it matters and what effect it will have. Thus, another theoretical lens is needed
to understand the specific nature and dynamics of the communications between actors.
Signaling Theory
Signaling theory addresses the mechanisms actors use to reduce the effects of information
asymmetry between them (Spence, 1974; Birch & Buetler, 2007; Connelly et al., 2011). Signaling
theory originated with work in economics concerning the characteristics of information as an
economic good (Stiglitz, 2000; Rothschild & Stiglitz, 1976; Spence, 1974). Research in economics
surrounding and utilizing signaling theory has led to the development of information economics
(Birchler & Buetler, 2007), a field of research that examines the production, reproduction, and
communication of information in markets, and has identified and modeled the properties of
50
information, which has certain similarities to public goods, while emphasizing the importance
of appropriating value from information generated (Birchler & Buetler, 2007; Stiglitz, 2000).
Research utilizing this perspective in management and economics has primarily considered the
problem of adverse selection, when hidden information may result in the selection of undesirable
outcomes over desirable outcomes (Birchler & Buetler, 2007). The problem of adverse selection
has been examined in areas such as price inefficiencies in IPOs (Ragozzino & Reuer, 2007),
micro-financing of entrepreneurial ventures (Moss, Neubaum, & Meyskens, 2014), and insurance
markets (Puelz & Snow, 1994), among others.
An alternative perspective on signaling theory has also been used to explain and explore
signaling in the context of human social behavior, particularly in anthropology (Bird & Smith,
2005) and religion (Sosis & Alcorta, 2003). Rather than focusing on markets for information and
price efficiency, this research has examined the signaling behavior individuals and groups use
to induce desired behaviors from other individuals and groups (Sosis & Alcorta, 2003), as well
as within communities (Sosis & Bressler, 2000). Some research in this area has also considered
the importance of audience effects, a parallel concept to the non-excludability of information
in information economics (McGrath & Nerkar, 2004). Assumptions of this stream of literature
parallel those of information economics, although the streams have developed largely without
cross-over. Similar to information economics, this perspective assumes that signalers possess
unobservable attributes, that the receivers stand to gain something from accurate information,
that signalers and receivers have at least partially conflicting interests, and that signal cost and
benefit depends on the quality of the signal (Bird & Smith, 2005). Based on these assumptions, an
outcome of cooperation between individuals or groups has been identified as one goal of signaling
behavior (Sosis & Alcorta, 2003). Based on this perspective, in purely competitive situations,
information asymmetry would be desirable, because it would allow actors an advantage over their
rivals (Nayyar, 1990; King, 2007).
A recent review of signaling theory in the organizational studies literature identified over
40 studies of signaling behavior (Connelly et al., 2011). Across the topics studied, the goal of
signaling was to induce some form of cooperative behavior, whether from customers (Carter,
2006), potential investors (Arthurs et al., 2008), employees (Ryan et al., 2000), or competitors
(McGrath & Nerkar, 2004). This is consistent with social evolutionary theory, which explains how

51
cooperation can be an appropriate choice and may even be a superior competitive option (Nowak,
2006). In social environments, cooperation may involve sharing information with specific parties
with whom one wishes to cooperate to induce cooperative behavior. Consider intellectual property
as an example of information asymmetry. In order to obtain a patent and receive protections,
information has to be shared with a government. The government and firm cooperate and both
receive benefits as well as indicating to potential investors that there is IP as a basis for market
competition (McGrath & Nerkar, 2004). However the reduction in information asymmetry means
that possible competitors understand what the firm has done and can then attempt to duplicate
it. If a firm does not want to receive government protection for the property, they can alternately
choose to maintain information asymmetry and treat the intellectual property as a trade secret.
This highlights the trade-offs that exist within signaling behavior, that there are costs associated
with the signal and reducing information asymmetry, as well as potential benefits.
The commonality between all of these situations is the need to communicate the existence
of an underlying quality or trait to the potential cooperator, a quality or trait that is not directly
observable (Connelly et al., 2011). Only the results of the quality will be observable and only after
the cooperative behavior has taken place. To communicate the existence of the quality, the signaler,
the actor attempting to induce cooperation, must send a signal to a receiver, a potential partner.
The signal, by definition, contains information about the signaler that will induce cooperation by
reducing information asymmetry, and demonstrates the benefits of cooperation to the receiver.
The receiver must benefit in some way, else there is no reason for cooperation to occur.
In theory, there is a purely dyadic relationship between a single signaler and a single receiver.
In practice, there are often many signalers and many receivers, constituting a communication
network (McGregor & Peake, 2000; Busenitz et al., 2005). The area encompassed by the signal’s
coverage comprises the entirety of the communication network. In the context of entrepreneurial
ecosystems, the ecosystem corresponds to the active space of the signal (McGregor & Peake,
2000). In communication networks, additional issues face the signaler and receiver of a specific
signal and the size of the active space may matter to the signaler because of the presence of
other signalers and unintended receivers. Research has found that the environment of the signal
in organizational signals can moderate the effect of the signal, so clearly defining the active
signaling space matters for signaling research (Ndofor & Levitas, 2004). Such issues can relate
52
to the signaler, the signal itself, the receiver, or the environment (Connelly et al., 2011). Signaler
issues include honesty of the signal, which is whether or not the signaler actually possesses the
desirable quality (Arthurs et al., 2008). Additionally, there can be signaler issues relating to the
credibility of the source (Sanders & Boivie, 2004).
The signal itself is subject to observability parameters, whether it is clear, visible, or sufficient
strength to be noticed by intended receivers (Warner et al., 2006). Further, the signal quality and
value suffer when it does not correspond to the desirable quality sufficiently (Busenitz et al., 2005).
Research in this area has also examined frequency of signals and the consistency between signals as
areas where issues might arise in the signal being received and interpreted correctly by the receivers
(Fischer & Reuber, 2007). Additionally, each signal has an associated cost, both to the signaler
(Certo, 2003) as well as to the receiver (McGregor & Peake, 2000). For the signaler, this is the cost
of encoding and sending the message, while the receiver incurs the cost of identifying the signal and
decoding it for discriminating information (McGregor & Peake, 2000).
Other issues from the perspective of the receiver may arise in the successful transmission
of the information when the receiver does not have adequate attention for the signal (Gulati &
Higgins, 2003). Even when the signal is received, it is subject to interpretation by the receiver
and the calibration of the signaler and receiver may be misaligned, leading to misinterpretation
due to differences in shared lexicons or perceived importance of certain aspects of the signal
(Perkins & Hendry, 2005).
The environment, too, can affect the signal, including the sending of feedback or
countersignals that influence interpretation or perception by the receivers or signalers (Gulati &
Higgins, 2003). Further, the environment can distort the signal, for example, through the presence
of multiple signalers or receivers, or external forces or actors that influence the interpretation
(Zahra & Filatochev, 2004). When multiple signalers are present, for example, signalers must
make a determination about the extent to which they compete or cooperate with other signalers
to enhance the observability of the signal they are sending, so that it does not get lost (Matos &
Schlepp, 2005). Among the effects observed when multiple receivers are present, audience effects
describe the change in the signal when certain kinds of audience members are present (Matos &
Schlepp, 2005). There are, generally, two types of audiences, the evolutionary audience, defined as
the audience that was present during the development of the signal and its contents, generally does

53
not change the content of the current signal, although it likely shaped the signal in past iterations.
The apparent or intended audience, on the other hand, noticeably impacts the signal when the
signaler is aware of their presence (Matos & Schlepp, 2005).
Because signals, by definition, convey information about an unobservable quality in the
signaler, the content of the message must be encoded in a manner that allows it to demonstrate the
possession of the underlying quality. The mechanism of encoding utilizes signs and symbols that
co-evolve with the rise of the need for the signal to be sent. In the study of human communication
networks, which include organizational studies, these signs and symbols co-evolve from the social
and institutional environments of the signalers and receivers through repeated interactions and
signaling (Sosis & Alcorta, 2003). The content, then, is subject to change over time, as the underlying
qualities change and as the content is refined to better represent the underlying quality. Each iteration
of the signaling process, from signal encoding to counter-signaling, results in changes over time.
This change can be illustrated through the example of car warranties and involves the
potential for signalers to cheat (Akerlof, 1970). Cheating occurs when a signaler conveys that
they possess the desired quality, when they do not (Connelly et al., 2011; Akerlof, 1970). Akerlof
(1970) describes the problem as one of signaling that a car being sold is of high quality and not a
lemon. In order to signal this, a manufacturer offers a warranty on the car, guaranteeing that the
customer can drive it safely for so many years or miles. Because the actual quality of the car’s
construction is impossible to observe at the time of purchase (the owner will only know if a car
will last 100,000 miles once he has driven 100,000 miles), the offer of a warranty signals that the
manufacturer believes it to be high quality. If the use of a warranty provides an advantage to the
first car company offering it, other manufacturers in the high quality market will also have to
signal the quality of their vehicles, most likely through the use of the already established signal,
a warranty. Car manufacturers who do not provide high quality vehicles, those selling lemons,
might cheat, also attempting to send the signal of high quality through offering a warranty.
Signaling costs play an important role in the proliferation of cheating, and change over
time of the signals. In this situation, there are essentially three possible outcomes for the change
in the signal, based on signaling costs. First, if the warranty is too costly for even the high quality
car manufacturers to afford, they will stop using it. Second, if the warranty costs are too low, such
that even the low quality manufacturers can provide it and still sustain superior performance,
54
the warranty will cease to be a discriminating signal, one that allows a receiver to distinguish
between a signaler who possesses the quality and one who does not. Finally, the warranty cost
could be such that it only pays for the genuinely high quality manufacturers to offer a warranty.
In this case, the warranty offer will be retained as a signal and a warranty will become a sign of
high quality cars (Akerlof, 1970).
This example also illustrates the mechanisms of social evolutionary theory. Both the car
manufacturer and the consumer are seeking a cooperative relationship. The car manufacturer
offers a product for profit, while the customer benefits from the product’s features and quality.
The first car company to offer a warranty has demonstrated the process of variation, changing
something about the way they signal. The customers then engage in a selection process. If the
signal results in higher customer preference, then the selection is successful and the warranty is
likely to be retained by the car manufacturer in future iterations of the social evolutionary process.
The example also demonstrates the process of retention at the social level as the warranty either
diffuses through the population of car manufacturers, or does not. Other car manufacturers observe
the competitor and adapt to follow the example, if successful and the cost is not too great. In the
example, cheating by low quality manufacturers serves to illustrate the case of selfishness in social
evolutionary theory. If the signal is copied out of spite, it may lead to adverse selection, in which
a less successful quality is chosen to the mutual detriment of both parties. It would be expected
that those firms that choose maladaptive strategies would ultimately falter and fail to thrive. Thus,
the two theories are complementary in nature, as signaling theory and social evolutionary theory
jointly explain the co-evolution of important social structures and processes.
Hypothesis Development
Entrepreneurship is a process of social construction (Aldrich & Martinez, 2010), one
in which a potential entrepreneur must actively engage many participants, inducing their
cooperation through the act of signaling the quality of a successful venture. The quality of
success is undeniably unobservable at the start of a new venture, given that even researchers
are generally uncertain about new venture survival rates, with five year failure rate estimates
in U.S. samples ranging from as high as eighty percent (Starbuck & Nystrom, 1981) to sixty
55
percent (Audretsch, 1991) to as low as thirty-three percent (Holtz-Eakin et al., 1994) depending
on the measurement of failure (Yang & Aldrich, 2012).
From the perspective of the potential entrepreneur, there is no way to observe the underlying
quality of the environment as it pertains to success, except to start and potentially fail. Each
potential entrepreneur operates within a communication network, an entrepreneurial ecosystem,
from which he receives signals from the environment as well as sending signals to potential
cooperators. Understanding the mechanisms through which these signals are sent, received, and
influence decisions of potential entrepreneurs to engage in entrepreneurship benefits from the
application of both social evolutionary theory, which explains the importance of and motivation for
cooperative social actions within an entrepreneurial ecosystem, as well as from signaling theory,
which offers insight into the specific mechanisms actors use to induce cooperative behaviors.
In applying both of these theories to the entrepreneurial ecosystem, it is necessary to
define the roles filled by actors in the context, in terms of signaler and receiver. There are many
actors in an entrepreneurial ecosystem, including current entrepreneurs, potential entrepreneurs,
government, professional organizations, support firms, customers, suppliers, and the media,
among many others. Each of these actors plays the role of both signaler and receiver, which results
in a multitude of signals in the entrepreneurial ecosystem at any time. As individuals, signalers
and receivers are interested in establishing the most efficient and profitable relationships and
outcomes possible. As members of the entrepreneurial ecosystem, the interests of theses social
actors converge and diverge to a varying degree. Certain individuals are more concerned with
ecosystem-level outcomes and the success or failure of individuals or firms are not as important
as the performance of the whole. Politicians, business leaders, non-profit organizations devoted
to entrepreneurship, and even the media itself all have reasons to support entrepreneurship in
an entrepreneurial ecosystem and to be more invested in the survival and success of the entire
ecosystem above the interested of individual firms. Politicians, for example, are judged by job
growth in the ecosystem, not the success of a single firm (Bartik, 2011). Consistent with the
previously cited findings in SET, cooperative behaviors are the behaviors most likely to result
in a higher average fitness and success for the population of firms, while competitive behaviors
are more likely to result in individual firms performing better in terms of fitness, rather than the
population. There is verifiable information that these signalers can transmit in terms of evidence

56
of the entrepreneurial ecosystem’s fitness, including economic conditions, new firm starts, and
information about rules or regulations. More importantly, there is also non-verifiable information
that would require signaling - such as the openness of the government to certain types of firms,
availability of potential partners, and private investment funding.
In order for these signals to be believable, there must be a cost associated, consistent with
the mechanisms of signaling theory. These costs can be financial, in terms of investment the
signalers have put into the ecosystem, reputational because the signalers will suffer a reputation
decline if their information is proven false, or may also be measured in terms of time devoted to
a particular topic or initiative. An example of one such cost would be coverage of the efforts of
politicians to fund area redevelopment of locations specifically for entrepreneurship, even though
the area might not be ideal for the type of business being targeted. Potential entrepreneurs might
be motivated to start a firm to take advantage of the costly investment the signalers have made,
only to find that the location requirements hinder their efforts and make survival harder. The
media picks up signals about these quality signals and amplifies the signal to the entire population
of potential entrepreneurs in the entrepreneurial ecosystem.
Research has demonstrated the importance of the media as a central channel of information
and communication, an infomediary (Pollock & Rindova, 2003). Thus, many signals will be
collected and communicated through the media, which makes these signals highly observable
by potential entrepreneurs and of particular importance. Other signals are also present in the
environment outside of those transmitted by the media. The actions of competitors transmit
information and may be interpreted as signaling future activities. Similarly those actions taken
by other actors in the ecosystem may result in the transmission of information, either as signals
or as distortion of more relevant signals. Any of these signals may be interpreted by the potential
entrepreneur as an opportunity for cooperation thus inducing entrepreneurial action, possibly
the founding of a new firm.
Signals vary from ecosystem to ecosystem, in content, tenor, and volume, due to the
coevolution of the signalers, receivers, and the social structures and institutions in the ecosystem
over time. For example, some ecosystems may develop strong culture and institutions around
particular industries, such that signals pertaining to local industry ventures or opportunities are
highly visibility or are given additional weight in the interpretation by receivers. Such weight and
57
visibility develop from the repeated social interactions as those firms varied, were selected, and were
retained, per the mechanism and predictions of SET. The same evolutionary processes influence
the positivity or negativity of the signal as well as the number of signals being sent as signalers
and receivers communicate. SET offers insight into how these mechanisms operate at the level of
the entrepreneurial ecosystem and how they influence potential entrepreneurs. In the following
sections, I develop specific, testable hypotheses about the mechanisms of these signals on potential
entrepreneurs in entrepreneurial ecosystems, grounded in these two complementary theories.
Signal Frequency
Defined as the number of times a particular signal is transmitted over time, prior research
has found a positive relationship between signal frequency and effectiveness. Signal frequency has
been examined in a number of contexts, including diversification (Baum & Korn, 1999), location
decisions of firms (Chung & Kalnins, 2001), and entrepreneurship (Carter, 2006; Janney & Folta,
2003). The relationship between signal frequency and the effectiveness of the signal has been
observed to apply to competitors (Baum & Korn, 1999) as well as stakeholders (Carter, 2006), and
to potential partners (Michael, 2009). The mechanism through which this operates is the reduction
of information asymmetry between the signaler and receiver, as predicted by signaling theory.
To understand the phenomenon, it is necessary to appreciate the role played by time in
the repeated interactions between signaler and receiver. At any given time, T0, before a signal has
been transmitted, information asymmetry exists between the signaler and the receiver. Once the
signaler transmits the first encoded message, a reduction in the effect of information asymmetry
occurs, albeit the level of reduction will depend on the characteristics of the signal. Between Tt
and Tt+1, information asymmetry increases once again, because the signaler continues to conduct
operations. At Tt+1, when a second signal is sent, information asymmetry is reduced once again.
Each additional signal transmitted results in further reduction of the effects of information
asymmetry between the signaler and receiver.
First, information about what has transpired in the interval between Tt and Tt+1 is
transmitted, updating the receiver on actions and operations the signaler has taken, as well as
changes in underlying qualities that are of interest to the receiver. Second, each additional signal
transmitted allows for calibration between the signaler and receiver on the encoding factors of the
58
message. Recall from above that calibration is the degree to which a signaler and receiver share
similar lexicons of words, signs, and symbols (Janney & Folta, 2006). In the initiating signal at
Tt, signaler and receiver assume they share the lexicons, though this may not be true, leading to
misunderstandings and distortions of the signal (Perkins & Hendry, 2005). Prior research has
demonstrated a positive link between frequency of signals and the accuracy of interpretation
(Filatotchev & Bishop, 2002).
Third, the interval between and given time Tt and Tt+1 may have an influence on the
calibration of signals as well. As the interval increases, more time passes between the signals,
and the amount of information that has to be transmitted about intervening operations is likely
to increase by virtue of operations, assuming the signaler is a functional entity. While studies
have shown that the increase in time between signals can lead receiver to be more highly attuned
to the next incoming signal (Janney & Folta, 2003), receivers are also limited in the amount of
attention they are able to devote to a particular signal (Gulati & Higgins, 2003). When a given
signal contains more information than a signaler can comfortably attend to, this can also lead to
distortion of the interpretation. Further, because receivers attend to signals from multiple signalers
in communication networks (McGregor & Peake, 2000), a longer time delay between signals can
lead to a decay in the calibration of the lexicons. The final mechanism of frequency relates to
signaling consistency. When signals are consistent over time, they reinforce the credibility of the
signaler in the perceptions of the receiver (Sanders & Boivie, 2004). As the time between signals
increases, however, receivers may fail to perceive the consistency of the messages. At the extreme,
the interval between Tt and Tt+1 may be so great that the receiver fails to recall the signal at Tt by
the time a signal is transmitted at Tt+1. All of these factors, considered together, demonstrate the
importance of sending a signal with regular frequency.
In the context of the media in an entrepreneurial ecosystem (EE), the same logic applies.
When signals are transmitted about entrepreneurship in the EE, frequent signals will: 1) reduce
the information asymmetry between signalers (EE stakeholders) and receivers (potential
entrepreneurs), 2) allow signalers and receivers to better calibrate their lexicons as far the signal
content is concerned, 3) reduce the decay of calibration between signals, and 4) increase recognition
of signal consistency when it is present. Ceteris paribus, frequent signals about entrepreneurship
will bring receiver attention to entrepreneurship. The increase in the attention to entrepreneurship

59
will lead to an increase in the pool of potential entrepreneurs as they consider it a course of action
they might not otherwise have known existed or considered reasonable to pursue. Thus:
H1a: Frequent signals about entrepreneurship will lead to more new venture starts in an entrepreneurial ecosystem.
However, signaling frequency does not account for the qualities of the receiver, or for the
appropriateness of entrepreneurship as a viable pursuit for a particular receiver. Indeed, a signal
that has the appropriate qualities to reach appropriate receivers, that is signals that are highly
observable, of adequate strength, clarity, intensity, and visibility (Lampel & Shamsie, 2000), will
be visible to inappropriate receivers as well. Even when signalers are honest about the information
transmitted (Arthurs et al., 2008) and are credible signalers (Busenitz et al., 2005), receipt by
inappropriate receivers may result in the wrong actions by those receivers. Much of this rests
with the characteristics of an inappropriate receiver. Just as the appropriate receiver will be
calibrated to the message and give attention to the right messages, inappropriate receivers will pay
attention to messages that do not specifically target them and due to miscalibration between their
lexicons and those of the signalers, they will interpret the signals as encouraging them to engage in
entrepreneurship. This is one of the downfalls of communication networks, that a message can be
simply be received and misinterpreted by the wrong receiver (McGregor & Peake, 2000).
In the context of the media in an entrepreneurial ecosystem, the same logic applies. When
signals are transmitted about entrepreneurship in the EE, frequent signals will: 1) reduce the
perceived information asymmetry between signalers and inappropriate receivers (those who do not
possess the qualities correlated to success), 2) allow signalers and inappropriate receivers to better
calibrate their lexicons as far the signal content is concerned, 3) reduce the decay of calibration
between signals, and 4) increase recognition of signal consistency when it is present. Because
inappropriate receivers will be better able to mimic appropriate receivers, they will be more likely
to found new ventures as well. Due to their lack of the underlying quality correlating to success,
making them unqualified, they are more likely to fail. Ceteris paribus, frequent signals about
entrepreneurship will bring receiver attention to entrepreneurship. The increase in the attention to
entrepreneurship will lead to an increase in the pool of unqualified potential entrepreneurs as they
consider it a course of action they might not otherwise have considered reasonable to pursue. Thus:H1b: Frequent signals about entrepreneurship will lead to more entrepreneurial failures in an entrepreneurial ecosystem.
60
Signal Attributes
Consistent with signaling theory, the attributes of the message must represent an
underlying, desirable quality that is unobservable at the time the signal is sent (Spence, 1974).
Similarly, the sender of the signal is assumed to be in possession of more complete information
than the receiver (Balboa & Marti, 2007). As identified previously, although signaling theory is
frequently used to explain behaviors and interpretations at the macro-level of analysis, there are
strong assumptions about the importance of the dyadic relationship between a single signaler
and a single receiver (Spence, 1974). The research in this area has covered topics ranging from
technology diffusion in hypercompetitive industries (Lampel & Shamsie, 2000) to individual firm
signaling behavior in alliance formation (Park & Mezias, 2005) to the decisions of individuals
about job-selection (Ryan et al., 2000). All of these studies have focused on the importance of the
information asymmetry problem and have further delved into attributes of signals that influence
decisions and actions.
Research has thus identified several mechanisms through which signals lead to action.
Perceived legitimacy on the part of decision-makers, or the degree to which a decision-maker
believes actions are desirable (Suchman, 1995), has been explored in some depth and research has
found support for legitimacy as a mechanism through which signals convey the presence of the
unobserved quality (Perkins & Hendry, 2005; Bell, Moore, & Al-Shammari, 2008). Legitimacy
has been studied in entrepreneurship financing (Higgins & Gulati, 2006), board compensation
decisions (Perkins & Hendry, 2005), and in the context of equity managers’ reputation and
performance (Balboa & Marti, 2007). When individuals perceive an option is legitimate due to
signals of quality, they are more likely to pursue the option.
In the case of entrepreneurship in an entrepreneurial ecosystem, receivers (potential
entrepreneurs) do not possess complete information about pursuing entrepreneurship as an
alternative to their current employment and so uninformed receivers rely upon information
provided by the media. As a career alternative, entrepreneurship has many characteristics in
common with other jobs, as individuals self-select into becoming entrepreneurs. Research on
employment self-selection using signaling theory as a lens has examined the attributes individuals
use to make inferences about their various employment alternatives and to make decisions about
which alternative to pursue (Highhouse et al., 2007; Hochwarter et al., 2007; Ryan et al., 2000).

61
Such research has identified two major categories of attributes used by individuals - instrumental
attributes and symbolic attributes (Lievens & Highhouse, 2003).
This framework, originally used in marketing research on branding and product attributes
(Turban et al., 1998; Keller, 1993), has found that, consistent with product decisions in which
individuals have incomplete information, when making decisions about jobs and organizations,
individuals prioritize symbolic attributes over instrumental attributes (Lievens &Highhouse,
2003). In the absence of information about instrumental attributes, the research has found that
individuals will infer them from symbolic attributes. Instrumental attributes include the physical,
tangible, and functional attributes of a job, product, or organization, while symbolic attributes
include intangible and subjective attributes. In the case of entrepreneurship, instrumental
attributes would include the need to identify opportunities, develop supporting relationships such
as securing financing, and then implementation of the business model. Symbolic attributes, on
the other hand, would be intangible and subjective, including reputation of entrepreneurship,
perceived characteristics of an entrepreneur, and social desirability of being an entrepreneur.
The source of the signal also transmits some information about the legitimacy and
desirability of entrepreneurship. Prior research has shown that, in the absence of primary sources,
the media is a credible source for most receivers seeking information (Lampel & Shamsie, 2000).
This research has found a positive relationship between information asymmetry and the perceived
credibility of the media, such that where information asymmetry is high, the media may be the
only credible information source. Further, as the time to make a decision decreases, individuals
are more likely to perceive the media as a credible source (Lampel & Shamsie, 2000). In general,
information asymmetry is higher in situations where the underlying quality has intangible,
knowledge-based, or subjective attributes (Ndofor & Levitas, 2004; Lampel & Shamsie, 2000).
In other cases, the attribute may be tangible or functional, in which case, examination of the
attribute may be easier, leading to lower information asymmetry once a decision-maker can
engage in some sort of interaction or personal investigation (Lampel & Shamsie, 2000).
Uninformed receivers (potential entrepreneurs), in the absence of further information, are
likely to infer the desirability and legitimacy of pursuing entrepreneurship based on the symbolic
attributes transmitted in the signal from credible sources. Once a decision has been made and action
taken on the part of the receiver, the action can be interpreted by the original signaler as a counter-

62
signal (Connelly et al., 2011; Srivastava, 2001). Because of the repeated interactions of signalers and
receivers over time, signalers are subject to adjust the content of the message to the audience. In the
case of entrepreneurship in an EE, potential entrepreneurs either take steps to start a business or not.
When entrepreneurship is perceived as socially desirable, based on the signal attributes
transmitted, individuals are likely to make a decision to emulate the qualities they perceive as
desirable. In cases where others perceive they actually possess the qualities, they may be able to
successfully start a business. If the attributes transmitted are actually representative of the underlying
quality corresponding to successful entrepreneurs, then, ceteris paribus, they will have a higher
likelihood of succeeding as well. In each subsequent iteration of interactions between signalers and
receivers, the qualities will be reinforced by signals from the media in response to more successful
entrepreneurs who exhibit the quality. In entrepreneurship, the underlying quality stakeholders seek
is the ability to succeed, something that cannot be observed directly at the start of a venture.
Consistent with these prior findings about attributes and also consistent with the
legitimacy argument, uninformed receivers of signals about entrepreneurship are likely to base
their decisions about whether entrepreneurship is the right path for them based on the symbolic
attributes presented in the signals.
H2a: Signal attributes of entrepreneurship will result in more new venture starts in an entrepreneurial ecosystem.
Even if a potential entrepreneur does not possess the quality, making them unqualified,
they may still seek to start a business, based on the symbolic attributes associated with being an
entrepreneur and the social desirability of entrepreneurship. In this case, these are unqualified
entrepreneurs are considered to be “cheaters”, those who do not possess the quality. The outcome
of cheating depends on the cost of pursuing entrepreneurship, relative to cheating. If the costs
of starting a firm and running it are not high, a higher percentage of entrepreneurs without the
qualities will start firms and, they may continue to operate and consume ecosystem resources
indefinitely. In this event, the quality, whether corresponding to successful entrepreneurship or
not, will cease to serve as a mechanism for discriminating between those entrepreneurs who will
succeed and those who will not. If the costs of starting and running a firm are higher than the cost
of emulating the qualities that signal success, the new ventures will fail relatively soon and the
signal attributes will continue to be discriminating signals.
63
A legitimate, socially desirable status for entrepreneurship will induce individuals to pursue
entrepreneurship when they are unqualified, to “cheat”, because it may result in higher reputation
or status for them in the ecosystem. Research has found that the desire to belong to a particular
socially desirable group can lead people to choose jobs or organizations for which they are not
particularly suited, resulting in adverse self-selection (Lievens & Highhouse, 2003). In signaling
terms, they do not possess the underlying quality that corresponds to successful new ventures.
In cases where cheating is not costly, they will eventually fail because they do not possess the
qualities to succeed. Thus:
H2b: Signal attributes of entrepreneurship will result in more failures in an entrepreneurial ecosystem.
Signal Valence
Signal valence refers to the positivity or negativity of the signal being transmitted.
Signaling theory assumes that the purpose of a signal is for a signaler to induce cooperative
behavior from a receiver, thus this implies that signals will generally have a positive valence.
Research has identified the primary mechanism through which signal valence operates to be the
formation and maintenance of reputation (Fombrun & Shanley, 1990; Deephouse, 2000; Fischer
& Reuber, 2007). This is consistent with the predictions of social evolutionary theory research
as well, which has found that where repeated interactions occur, individuals develop reputations
which then assist them in forming new cooperative relationships (Nowak, 2006). As reputation
requires cognition and awareness of past actions and indirect causal relationships, this phenomenon
only occurs among humans (Nowak, 2006; Rankin et al., 2007). The development of a reputation
also requires memory of actions and information dissemination capabilities (Nowak & Sigmund,
1998). Much management research has been devoted to studying this dissemination and reputation
process, the social construction of reputation (Fombrun & Shanley, 1990; Rao 1994; Rindova &
Fombrun, 1999; Deephouse, 2000; Fischer & Reuber, 2007), and the ways in which it affects both
the behavior of the firm and the reactions of others to a firm, including competitor actions (Pfarrer
et al., 2008), stakeholders (Zavyalova et al., 2012), and investors (Pollock & Rindova, 2003).
Researchers have also identified reputation as an important mechanism for decision-making
under conditions of information asymmetry (Balboa & Marti, 2007). An organization’s reputation,
64
defined as public perception about attributes of the organization, has been demonstrated to serve
as a signal to audiences of the underlying performance of the firm (Basdeo et al., 2006). Research
in the area of reputation has examined how reputation develops over time through repeated signals
and how, in the presence of multiple signalers and receivers in the environment, reputation can
form and change over time (Basdeo et al., 2006). Reputation has also been demonstrated to serve
as a substitute for information about the firm, such that decision-makers infer positive attributes
from a positive reputation (Balboa & Marti, 2007).
Because reputation forms through the transmission of signals, whether a signaler develops a
positive or negative reputation depends on the valence of the signals being transmitted to receivers
in the environment. Positive signals enhance the reputation of the signaler, while negative signals
decrease reputation (Fombrun & Shanley, 1990). Thus signalers prefer to transmit positive signals
to increase their reputation and induce cooperation from receivers.
Signal valence is subject to the same signal criteria as signal attributes, in that the signal cost,
signal credibility, and signal consistency will influence the interpretation of a receiver (Connelly
et al., 2011). In entrepreneurial ecosystems, costs of positive signals include the production of the
signal, the opportunity cost to the signaler or sending a poor signal, the increase in competition
generated by the signal. As long as the benefits of the positivity of the signal surpass the cost, a
positive signal will be transmitted. The media, as a purveyor of information in the absence of
primary sources, has been shown to be a credible source in research, thus signal credibility is
likely to be high (Lampel & Shamsie, 2000). The consistency of the valence is likely to influence
the interpretation of the signal as well. A consistent pattern of positive signals will reinforce the
reputation of a signaler and increase the likelihood of inducing cooperation.
However, research has also demonstrated that signals can be negative. Further, because
signals may be ambiguous (Fombrun & Shanley, 1990), such negative signals may be unintentional
(Perkins & Hendry, 2005). Negative signals may garner more attention from receivers, intended
or unintended, for a variety of reasons related to the characteristics of the signal. Signal costs
of negative signals are inherently more costly to the signaler, because they are highly likely to
result in lost opportunities for cooperation in the future (Nowak, 2006). In line with signaling
theory logic, costly signals are more salient for receivers and considered to be more credible and
reliable (Connelly et al., 2011). Negative signals may also disrupt the pattern of positive signals,

65
thereby decreasing consistency, in turn reducing the effectiveness of signals and further reducing
the credibility of the signaler. In addition to the signal characteristics, negative signals may garner
more receiver attention because of the phenomenon of loss aversion (Tversky & Kahneman, 1973).
When receivers perceive the potential for loss, they avoid the source of the loss, meaning negative
signals would tend to reduce cooperative behaviors benefiting the signaler.
Research has demonstrated that the pattern of signals has meaning to receivers and
influences interpretation of signal attributes (Balboa & Marti, 2007). The pattern of the valence
of the signals sent may provide the discriminatory factor needed to transmit messages to the
appropriate receivers. Neither signal frequency nor signal attribute in the media address the
mechanism through which signalers ensure the appropriate receivers act on the information.
Frequency and signal attributes target all receivers equally. Signal valence may fulfill this
distinguishing role for receivers as it provides a more realistic expectation of the signal. Positive
valence will strengthen the relationship between frequency and new venture starts in an EE as
the multitude of positive signals induce the desired behavior. Negative valence will attenuate
the relationship between frequency and new venture starts, however, as only those who believe
they possess some form of inside information, or are strongly motivated despite the signaled
probabilities of success, will pursue the undesirable behavior. Thus:
H3a: Signal valence moderates the positive relationship between signal frequency and new venture starts, such that the more positive (negative) the signal valence, the stronger (weaker) the relationship between signal frequency and new venture starts.
Positive signals, as stated above, would not discriminate between appropriate and
inappropriate audiences, painting a picture of entrepreneurship that appeals to the qualified
and unqualified alike. As such, positive valence of signals would be expected to strengthen the
relationship between signal frequency and firm failures as increased numbers of unqualified
individuals engage in entrepreneurship as well. Because negative valence leads to fewer individuals
engaging in the behavior, entrepreneurship, as the frequency of negative signals increases, fewer
failures are likely to take place, attenuating the relationship between frequency and firm failures.
This follows from the previous logic, that only those individuals who strongly believe they are in
possession of unique information or are highly motivated, will found firms. Such individuals are
also likely to pursue the venture longer, in the face of potential failure, due to the same beliefs.

66
H3b: Signal valence moderates the positive relationship between signal frequency and venture failures, such that the more positive (negative) valence, the stronger (weaker) the relationship between signal frequency and venture failures.
At the core of the signal attributes is the correspondence between the signal attributes
and the unobservable, underlying quality of success. When the attributes correspond to success
and the receivers possess them, the probability of success is much higher. Conversely, the
attributes may not correspond to success or the receivers may not possess them, in which case,
the probability of success decreases. As developed in the hypotheses for signal attributes, these
attributes can be either instrumental or symbolic, and in the absence of instrumental information,
decision-makers will base their reasoning on symbolic, inferring instrumental attributes from the
available information on symbolic attributes (Highhouse et al., 2007). Symbolic attributes are
those attributes that are intangible and subjective and thus, they are open to more interpretation
by receivers. The valence of the signal can thus influence the interpretation of these attributes and
the receiver weight used to evaluate them.
When signals about these attributes have a positive valence, individuals are likely to have
higher opinions of those who possess the attributes. Just as when they make decisions about jobs
or organizations, individuals would be expected to prioritize desirable behaviors associated with
strong positive valence signals over those with neutral or negative valence signals (Lievens &
Highhouse, 2003). More positive signals will result in possessing the attributes being even more
socially desirable and thus individuals may wish to believe they possess the attributes, even when
they do not. In an effort to countersignal that they do possess the attribute, they attempt to engage
in the behavior signified.
In this case, to signal that they possess entrepreneurial qualities, individuals engage in
entrepreneurship, whether they possess the symbolic attributes or not. The characteristics of the
attribute are also related to positive reputation when the signal valence is positive. In an effort to
increase their own status and reputation, therefore, individuals may engage in counter-signaling
behavior indicative of the attributes. The conclusion is that there are the two primary mechanisms
through which the interaction of valence and signal attributes influence behavior - 1) social
desirability of possessing the attribute, 2) status and reputation of the underlying quality signaled
by the attribute. As in the case of frequency, however, the presence of positive valence signals
alone will not serve any sort of discrimination function among receivers of the signal.

67
Negative valence signals, however, may serve this discriminatory function of ensuring
the appropriate receivers engage in the signal. Negative valence signals about the signal attribute
or the underlying quality will be expected to lower the social desirability of both possessing
the symbolic attribute and engaging in the activity correlated to the attribute. Individuals who
genuinely possess the attribute may actually be discouraged from pursuing the correlated activity,
except in cases where they have strong motivation or believe they have superior information
that would result in success. Similarly, negative valence signals about the activity would also be
expected to reduce the perceived status and reputation of the activity and accompanying status or
reputation gains of pursuing it. Thus:
H3c: Signal valence moderates the positive relationship between signal attributes and new venture formation, such that the more positive (negative) the signal valence, the stronger (weaker) the relationship between signal attributes and new venture formation.
Positive signals would not discriminate between appropriate and inappropriate receivers,
encouraging all individuals who seek socially desirable activities, reputation, or status to pursue
entrepreneurship with equal strength. As such, positive valence of signals would be expected to
strengthen the relationship between signal attributes and firm failures as increased numbers of
unqualified individuals engage in entrepreneurship. In such a case, the perceived social benefits
to the individual would outweigh the perceived cost, resulting in honest counter-signaling by
qualified receivers and cheating by unqualified receivers, however actual costs would be higher
than the social benefits, leading to the increase failures. Because negative valence increases the
perception of the social costs of the activity, it leads to fewer individuals engaging entrepreneurship.
As the negative signal valence increases, the perceived costs increase and thus only individuals
who perceive greater benefits than signal costs will engage in entrepreneurship. Such individuals
must believe they possess superior information or be more highly motivated in order to pursue a
behavior that would incur greater costs. These individuals, because of their perceived superior
knowledge, might also be more likely to pursue the venture longer, in the face of potential failure,
to attempt to avoid the loss of reputation or status that would accompany failure and force them to
incur the cost, as opposed to delaying it by continuing in operation. Thus:
H3d: Signal valence moderates the positive relationship between signal attributes and firm failure, such that the more positive (negative) the signal valence, the stronger (weaker) the relationship between signal attributes and firm failures.

68
Industry Diversity
Industry diversity describes the number of industries in a geographic region and the
dispersion of economic activities across these industries (Dissart, 2003). Researchers have
examined the impact of industry diversity on economies of scale (Henderson, 1974), knowledge
spillovers (Lucas, 1988), wages (Mason & Howard, 2010), and labor market productivity (Hanson,
2001), among other outcomes of interest. This research supports the conclusion that the degree of
industry diversity or industry specialization matters (Hanson, 2001; Dissart, 2003). The primary
benefit of the degree of specialization has been identified as economies of scale (Henderson, 1974;
Hanson, 2001; Mason & Howard, 2010), through a promotion of learning and an exchange of ideas
(Marshall, 1920; Hanson, 2001), although the specific mechanism through which this occurs is
not explicit (Hanson, 2001). Social evolutionary theory combined with signaling theory offer
insight. SET provides the motivation for firms to communicate, to induce cooperative behaviors,
and to ensure survival (Nowak, 2006). Signaling theory explains how they send signals to one
another, resulting in the learning and the exchange of ideas, a particular cooperative behavior.
Industry diversity, for an individual, is a characteristic of the environment in which they
operate. As such, and consistent with other research using signaling theory, industry diversity
would be expected to moderate the relationship between signal and desired behavior. Industry
diversity does this through altering the signal cost, visibility of a particular signal, altering the
fit of a signal between the unobserved quality and outcome, through increasing demands on
receiver attention, and by increasing the distortion of a given signal in the signaling environment
(Connelly et al., 2011).
At one end of the continuum of diversity is the specialized ecosystem. In such an ecosystem,
signaling costs to induce cooperation are relatively low for firms because of shared markets and
assumptions, which reduce information asymmetry and limit the amount of information that must
be transmitted between signalers and receivers. Signals in such an environment are also likely
to be relatively visible and consistent between signalers, that is, they are likely to use the same
type of signals and encode them similarly. Further, the fit between the signal and the unobserved
quality (likelihood of success) will be higher, because the paths to success are fewer. In addition,
the demands on the attention of a receiver to identify and interpret signals will be lower, because
the signal attributes are all likely to be similar, with higher calibration. Finally, because of the

69
specialized nature of firms in the environment, and the similarity between other signalers and
external referents, there is likely to be lower distortion of the signal.
At the opposite end of the continuum is a highly diversified ecosystem, where economic
activity is dispersed across many industries. As the industry diversity increases, all of the
previously identified characteristics influencing the signal reception and interpretation are subject
to change. Signal costs change because information asymmetry between industries increases
and the information that must be transmitted to reduce the asymmetry increases as well. Signal
visibility may decrease as well, as different industries may not share the same repertoire of signals.
Researchers have identified a wide variety of signals, from firm name (Lee, 2001) to reputation
(Coff, 2002) to board structure (Certo et al., 2001) to number of patents (McGrath & Nerkar,
2004). A signal attribute that constitutes an effective signal in one industry may be meaningless
and undecipherable by a receiver in another industry that is unrelated, because context matters for
calibration (Connelly et al., 2011). Similarly, signal fit may not be the same across industries. That
is, a particular attribute representative of success in one industry may not be indicative of success
in another. The attention demand on receivers, who are limited in their information processing
ability (Simon, 1955), increases with the number of industries as they must monitor, identify,
and process signals and attempt to maintain calibration among multiple industries which could
affect them. Finally, as diversification increases, the signaling environment grows increasingly
complex with a multitude of signals and many external referents who are less likely to share
signal repertoires, and this complexity will lead to increasing signal distortion, adding more
noise and making signaling more difficult.
Research in the area of regional diversification has shown that some diversification is
beneficial to the regional growth (Hanson, 2001). While the above argumentation addresses the
two extremes, prior research thus suggests that there is some optimal level of diversification
between pure specialization and pure (complete) diversification, and signaling theory can be used
to explain this as well. All of the above characteristics contribute to the cost of sending a signal.
Signals, however, are instrumental in reducing search costs by signalers and receivers in need of
partners for opportunities (Basdeo et al., 2006). As the industry diversity grows more complex,
however the number of opportunities for synergistic cooperative relationships increase, and these
relationships provide some benefit to the partners, or else they would not, by definition, send

70
signals (Connelly et al., 2011). As long as diversity continues to create more opportunities, and
the benefits of these opportunities outweigh the search and signaling costs, increasing industrial
diversity will result in more entrepreneurial ventures. At some point, the benefits no longer exceed
costs and industrial diversity will result in fewer ventures.
As noted above, however, industry diversity is not likely to operate on the signal-new
venture relationship directly, but rather through the interaction of the industry diversity with the
frequency of signals. Higher industry diversity requires signalers to provide more information
in order to reduce information asymmetry and calibrate signaling attributes and repertoires with
receivers, to influence their perceptions and interpretations successfully. Thus:
H4a: Industry diversity moderates the positive relationship between signal frequency and new venture formation such that it creates an inverted-U shape curve, as industry diversity strengthens the relationship between signal frequency and new venture formation initially, and then attenuates the relationship between signal frequency and new venture formation.
Resources
Resources are the strategic factors of production needed to produce the goods and services
actors in the environment will use to create goods or services that enable them to compete, offer
the potential to develop cooperative relationships, and ultimately, to ensure their survival through
competitive and cooperative actions. The conditions of the environment as to resource access are
an important component of social evolutionary theory, which incorporates resource availability as
one of the reasons that actors compete and therefore might choose to cooperate (Nowak, 2006).
Resource scarcity, under SET logic, would indicate a greater need to induce cooperative behaviors
and to reduce search costs for individuals. Signaling theory contributes to this understanding through
identifying the mechanisms that actors can use to communicate the desire for cooperation and how
the difficulty of inducing cooperation might differ across conditions of resource availability.
Researchers have theorized that munificence of resources in the ecosystem affects the
signaling behavior of actors, both signalers and receivers (Ndofor & Levitas, 2004) and limited
research has investigated this phenomenon, finding a relationship between environmental
munificence and the types of signals receivers expect (Park & Mezias, 2005) and changing
the perceptions of actors about the uncertainty of the environment (Janney & Folta, 2006). An
uncertain environment, in signaling theory language, has higher information asymmetry between
71
signalers and receivers. In order to overcome the information asymmetry, signalers must alter their
signaling behaviors accordingly to induce cooperation from receivers.
According to signaling theory, resource abundance would be expected to result in changes
to the signal through the mechanisms of the signal attributes, receiver attention and interpretation,
as well as altering the nature of feedback and signal distortion (Connelly et al., 2011). At low
levels of resource abundance, that is to say, under conditions of resource scarcity which increase
environmental uncertainty, the signal cost would be expected to be higher and more important for
survival, because each signal reduces information asymmetry to all receivers about the resource
and increases competition for the scarce resource (Connelly et al., 2011; Ndofor & Levitas, 2004).
Under this condition, signal observability is also likely to be more influential, as signals will have
increased strength, would be expected to require better clarity to target receivers, and would
need to be more visible to reduce the information asymmetry between signalers and receivers
(Connelly et al., 2011; Ndofor & Levitas, 2004). Resource scarcity would also influence receiver
attention, as they would need to be more aware of signals in an uncertain environment and devote
more attention to environmental conditions to overcome the uncertainty. Interpretation would be
different as well, because receiver calibration with the signal determines successful transmission.
Environmental distortion would also have a stronger effect in conditions of resource scarcity as the
importance and cost of filtering out noise for signalers would increase (Connelly et al. 2011).
As resource abundance increases, the weighting and importance of these characteristics
would be expected to decrease, because there is more room for actors to make mistakes and the
need for cooperation is less pressing. Signal costs decrease because increased competition does
not limit resource access as stringently. Signal observability becomes less important as reaching a
potential receiver becomes less important to the signaler. Receiver attention would shift away from
signal identification, likely more focused on the resources available in the environment than on
signals being transmitted. Similarly, the importance of calibration decreases, because the signals
are no longer the focus or the best basis for survival, rather the environment may be. Finally, the
importance of environmental distortion would likely decrease, but environmental counter-signals
would increase in importance.
Signaling theory research has identified the influence of environmental characteristics
such as resource abundance to be one of moderation, such that the environment influences aspects
72
of the signal and the interpretation or effectiveness, rather than directly changing the outcome.
Consistent with these findings, the two mechanisms most likely to interact with the environment
are signal frequency and signal attributes and their influence on firm failure rates (Janney &
Folta, 2006; Ndofor & Levitas, 2004). Resource scarcity is likely to serve a distinguishing or
discriminatory role for signals, such that more actors who possess underlying qualities associated
with the outcome of success will act under these conditions.
Resource availability influences the interpretation and value of signals between signalers
and receivers. When resources are scarce, signalers must be efficient and each signal transmitted is
important for reducing information asymmetry between signalers and receivers. Scarce resources
also increase the importance of cooperation for efficient use of available resources for survival
(Nowak, 2006). As resource availability increases, the importance of each individual signal, the
cost of signaling, and the importance of cooperation for survival decrease. Under conditions of
resource scarcity, signaling theory would predict that fewer signals would be transmitted and each
would have more information and value. Under conditions of resource abundance, more frequent
signals would be sent and the importance of each signal would be lower. Because signals are limited
in the amount of information they can transmit and the reduction in information asymmetry each
can reduce, actors make decisions under conditions of resource scarcity with less information and
this leads to more failures.
H5a: Resource availability moderates the positive relationship between signal frequency and firm failure, such that more (less) resource availability strengthens (weakens) the relationship between signal frequency and failure.
Similarly, the signal attributes are more important under conditions of resource scarcity
because fewer signals are able to be sent, due to cost and each signal must be better calibrated to
the receivers. The cost of a signal with poor fit is higher, signal fit being the extent to which the
underlying quality of success and survival is correlated to the signal (Connelly et al., 2011). As
resource abundance increases, the importance of the signal attributes decreases and the actors
have more room for error as environments with higher resource abundance are more forgiving of
mistakes (Ndofor & Levitas, 2004) and thus signalers and receivers can afford to take more time
to reach calibration as the signal attributes.
73
H5b: Resource availability moderates the positive relationship between signal attributes and firm failure, such that more (less) resource availability strengthens (weakens) the relationship between signal attributes and failure.
As resource availability increases, the importance of cooperation for survival becomes
less important to signalers and to receivers. Under these situations, potential entrepreneurs may
be better served by turning their attention to the environment directly and by directly accessing
resources, rather than seeking interpreting signals. As such, when resource availability is higher,
potential entrepreneurs may perceive more opportunities in the environment, directly leading
to increased new venture formation. Signals may become virtually irrelevant under extreme
conditions of resource abundance, such that no relationship exists between signals and new venture
starts, because receivers do not spare limited attention for signals.
H5c: Resource availability moderates the positive relationship between signal frequency and new venture starts, such that resource abundance attenuates the positive relationship between signal frequency and more new venture starts.
Similarly, under conditions of resource abundance, receivers (potential entrepreneurs)
do not spare attention for signal attributes, because they are better served by focusing attention
directly on the resources available in the environment for starting new ventures. Further, when
signals are received, because they are not sparing attention for calibration, the signals are likely to
be misinterpreted or disregarded. As such, even highly visible signals may be of little importance
to potential entrepreneurs in these conditions. Thus:
H5d: Resource abundance attenuates the positive relationship between signal attributes and more new venture starts.
Chapter Summary
In this chapter, I proposed a model for signaling behavior in entrepreneurial ecosystems
using insights from SET and signaling theory to explain how signaling behavior impacts the
formation and failure of firms. The model implies that potential entrepreneurs rely on signals
from other social actors in the entrepreneurial ecosystem to reduce information asymmetry and
inform their actions as far as creating a new firm or terminating operations of a going concern.
The model suggests that the frequency of signals, as well as their attributes, and valence inform

74
the actions of potential entrepreneurs. Additionally, the model suggests the mechanisms of action
through which environmental factors shape perceptions and interpretations of the signals.
I argue in the chapter that social evolutionary theory and signaling theory offer
complementary approaches to explaining behavior or potential entrepreneurs in the entrepreneurial
ecosystem. While SET provides processes for change and logics for cooperation, signaling
theory provides the mechanisms for communication that induce cooperation. The theories jointly
imply the importance of reducing information asymmetry for cooperation. This is of particular
importance for potential entrepreneurs in entrepreneurial ecosystems, individuals who rely on
signals to inform their activities. Table 3.1 summarizes the hypotheses, while Figure 3.1 depicts
the proposed model in graphical form.

75
CHAPTER 4: METHODS
Chapter Overview
In this chapter, I describe the methods I used to test the model proposed in Chapter 3. I
describe the sample frame and the selection of the level of aggregation and why it is appropriate
for entrepreneurial ecosystems (EE) and is consistent with prior research in the area. I also explain
the collection of data and the creation of all variables used in the analysis. Finally, I describe the
analytical techniques, tests, and report the results of the necessary tests. The study utilized archival
data matched from several sources, including the Dow-Jones Factiva Database, the U.S. Bureau of
Labor and Statistics (BLS), and data collected and provided by the Kauffman Foundation.
Sample Frame and Data Collection
Sample Frame and Selection
For the purpose of this dissertation, an entrepreneurial ecosystem is defined as a
Metropolitan Statistical Area (MSA). MSAs are defined by the U.S. Census Bureau as geographic
entities, consisting of a core urban area with a population of at least 50,000 people and encompassing
cities or counties with a high degree of social and economic integration measured by commuting
to the urban core, for use in collecting, aggregating, and reporting statistical information (BLS.
gov). Past research in areas related to EE have used the MSA as a unit of analysis, including
work in population ecology (Yang & Aldrich, 2012), economics (Beaudry & Schiffauerova, 2009),
political science (Bartik, 2015), and entrepreneurship policy (Audretsch et al., 2007). Consistent
with the definition of an EE used in this study, the MSA encompasses sufficient area to include
the entire population of organizations that are part of the co-evolving system of technological,
normative, and regulatory regimes (Aldrich, 1999) of an EE. Aggregating at the city level would
unnecessarily eliminate social and economic actors who are otherwise part of the MSA and who
commute to the urban core.
For sampling, I first matched data on population with the statistical data on business
formations and failures at the MSA level. Then, I identified ecosystems of high and low formation
and failure rates base on quartiles. The upper quartile was composed of MSAs with populations over
1 million. I then randomly sampled 15 MSAs from the 50-75 percentile range and matched them
76
with MSAs in the same state from the lower percentile range, where possible, to control for state-
level effects. Table 4.1 lists the MSAs that were ultimately selected from this process. Population has
an important impact on the formation of firms in the ecosystem, because as population increases,
human capital, investment capital, and entrepreneurial activity are likely to increase as well (Florida,
2002; Aldrich & Martinez, 2010; Motoyama & Bell-Masterson, 2014). In an effort to control for
this, and consistent with sampling techniques used in prior MSA studies (Rubin, 2006), the MSAs
were also selected to be as close in population as possible and distance, whenever possible. Where
no matching state MSA was available, an MSA that was geographically close was identified. MSAs
are identified by a the U.S. Census Bureau’s Core Based Statistical Area code and with an MSA
name that may include up to three major cities, depending on the dispersion of economic activity
in the MSA. However, the Census Bureau does not provide an inclusive list of cities within each
ecosystem, but rather provides a list of counties constituting the geographic area. Using the core
cities provided by the U.S. Census Bureau on each MSA, I used Google Maps to determine the
distance between the principal cities of the MSAs not in the same states.
The sampling frame covers a ten year period from 2001 to 2010. I selected this time period
and range for three reasons. First, there are limitations on the availability of data, because the
BLS has only made MSA-level data available through 2012 (BLS.gov). Second, other work in the
area has similarly examined a ten-year span (Motoyama & Bell-Masterson, 2014). Finally, when
examining patterns of economic activity at the MSA level, ten years is a logical period over which
to observe changes that may result, while shorter periods may be insufficient to see these patterns.
Data Collection and Research Procedures
Using the previously identified sample, articles related to entrepreneurship were gathered
from these MSAs using the Dow-Jones Factiva Database. Factiva is a database owned and
maintained by Dow Jones of international news sources, covering 36000 sources worldwide
(proquest.libguide.com/factiva). The database has been used in a number of business studies as
a data source (Johal, 2009; Abu-Laban & Garner, 2005; Peck, 2012). Factiva provides access to a
large range of media sources in each of the MSAs, sources which serve as information channels
for signals from numerous social actors. Research has shown that many social actors actively

77
seek to control and manage media coverage (Ahern & Sosyura, 2014). Further, media sources are
highly visible signals for receivers in the EE.
Once the MSAs were identified, collection of articles began by identifying the appropriate
key words. The search term “entrepreneur*” was used to (1) collect information on entrepreneurs
and entrepreneurship and (2) differentiate from articles mentioning only small businesses.
Searches of the Factiva database were filtered by region (e.g. U.S. Southwest) and state (e.g.
California). To ensure that the coverage was limited to the MSA, the three largest cities identified
above were used as keywords because articles in the Factiva database have the city of publication
included in the text as part of the byline. Some MSAs in the U.S. are already identified with
multiple principal cities, but the Census Bureau limits the identification to three cities. Thus, to
be consistent across all MSAs, identifying the three large population centers in the MSA ensured
all ecosystems were treated equally. With the aid of research assistants, I identified all of the
counties comprising each ecosystem. From this list, we then identified the largest population
centers in each of the counties. We compared them and narrowed the list to the three largest
population centers for each MSA selected to assist in the collection of data.
Articles were collected annually, thus the search criteria were limited by date ranges of
January 1 to December 31 for each search. For example, searching for articles for the Riverside,
California MSA for 2003 used the date restriction of January 1-December 31, 2003, the keywords:
entrepreneur* AND (Riverside or San Bernardino or Ontario – the three largest cities in that MSA)
and were filtered to the Southwest region and the U.S. State of California. Because Factiva draws
from multiple databases, the decision was made to filter for identical articles as well, to avoid
having the same article multiple times. The only source exclusion was to remove legal findings,
which were easily identified because of their database (e.g., LegAlert) and generally large size
(i.e., 50,000-150,000+ words), often more than the total word count of all other articles identified
for an observation. All companies, industries, and subjects were included in the searches, which
were limited to English language publications because English is the official language of the U.S.
For the collection, the research assistants and I jointly collected 5 MSAs until we arrived at 100%
agreement in the articles downloaded, and then they independently searched and downloaded the
articles from the remaining MSAs.
78
Once downloaded, the articles were matched to the data from the BLS and from the
Kauffman Foundation to create an annual panel data set covering ten years and 30 MSAs. The
Kauffman data set included variables such as educational attainment, investment funding available
in the MSA collected from Crunchbase, patent filings of firms in the MSA, Small Business
Innovation Research (SBIRs) grants awarded to firms in the MSA, and National Institute of Health
(NIH) grants awarded to firms in the MSA. The BLS data included firm formations and failure
rates, number of firms by industry in the MSA, and population of the MSA.
An initial examination of the data identified an outlier in the Lancaster-York MSA in
Lancaster, PA. It was removed from the dataset after the preliminary analysis of descriptive
statistics identified it as an extreme outlier with up to 1500 articles per year. Lancaster was later
identified as the home of QVC, and this likely contributes to explaining the extreme difference in
coverage and why there are so many more articles in Lancaster, irrespective of MSA size, business
formation, and firm failures.
The following section details the variables used in the analysis, their collection and
calculation. The section concludes with the analytical techniques used in the dissertation and
reports the results of all tests performed on the data to obtain the results.
Independent Variables
Signal Frequency
A variety of signals have been identified in the literature on signaling theory, from top
management team members (Higgins & Gulati, 2006) to patents (McGrath & Nerkar, 2004).
While the diversity of measures of the signal itself has varied, the measure of signal frequency has
been consistent as either a count of the number of signals (Janney & Folta, 2003) or as the rate of
signals per time period (Baum & Korn, 1999). Other signaling studies have used counts of media
articles or press releases as a measure of signal frequency (Carter, 2006). Research into media
effects has used a similar variable, volume of coverage (Pollock & Rindova, 2003).
Consistent with past research in both signaling theory and media effects, I operationalize
signal frequency as the annual count of articles about entrepreneurs or entrepreneurship in a
particular signal area. The signal frequency variable ranged between 1 and 203 articles per year
per MSA. The signal frequency variable was not normally distributed and was log-transformed
79
to correct for this. All news coverage was collected, including news articles, letters to editors,
editorials, and columns, as long as they were available in the Factiva database, consistent with
prior research in the area of media studies (Deephouse, 2000). As previously mentioned, legal
findings were excluded. Aggregation of the articles to an annual frequency is based on both the
nature of the dependent variable, which is available only annually, and on past research which has
found that the limited time lag between media coverage and action does not adversely influence
the ability to make inferences from annual data (Brown & Deegan, 1998; Deephouse, 2000).
Signal Attributes
Signal attributes cover a wide range of possible measures and are specific to the context and
phenomenon being studied. Prior signaling theory research has identified many signal attributes,
such as the reputation of a Venture Capitalist (VC) in the context of securing VC funding (Gulati
& Higgins, 2003), and earnings claims by franchisors for attracting franchisees (Michael, 2009).
Research at the individual level of analysis has gone further to categorize these attributes into two
types and to identify instrumental attributes such as job demands in hiring signals (Ryan et al., 2000)
and symbolic attributes including as job and organizational reputation (Highhouse et al., 2007).
Because symbolic attributes have been demonstrated to have a stronger effect under
conditions of information asymmetry, I measured these symbolic signal attributes as coverage
of Entrepreneurial Orientation (EO), a general set of attributes that correspond to the underlying
characteristic of success of new ventures. A well-researched and validated construct exists for
assessing dimensions of entrepreneurship in the form of entrepreneurial orientation (EO) (Miller,
1983; Lumpkin & Dess, 1996). Defined as strategy-processes influencing managers and individuals
in their decision-making and actions, EO has been used to explain firm level performance in over
100 studies (Rauch, Wiklund, Lumpkin, & Frese, 2009).
Early work identified three dimensions of EO: innovativeness, risk taking, and proactiveness
(Miller, 1983). Later, the dimensions of autonomy and competitive aggressiveness were included
(Lumpkin & Dess, 1996). Innovativeness addresses creativity and willingness to experiment.
Risk taking relates to the how firms deal with uncertainty. Future-orientation, searching for new
opportunities, and anticipating the future all characterize proactiveness. Competitive aggressiveness
assesses strategic posture and responses to rivals. Autonomy includes the freedom of leaders and
80
teams to engage in independent activity. EO has been measured using a validated dictionary of
entrepreneurial orientation (EO) (Short, Broberg, & Cogliser, 2009).
Using the QDA Miner software suite developed by Provalis Research, word counts of each
dimension of the EO construct were created, after using the validated dictionaries to create the search
terms for the software. All of the five sub-dimension dictionaries identified by previous research
(Miller, 1983; Lumpkin & Dess, 1996; Short et al., 2009) were used in QDA Miner, separately, to
generate word counts by dimension. Additionally, prior work has identified a subset of words that do
not factor into the specific dimensions identified, but which are nonetheless part of the EO construct,
and these additional words were also collected as a sub-dimension of the final scale. Afterward, these
dimensional word counts were aggregated to create a continuous measure. The EO measure for the
analysis using the dictionaries for all six dimensions had a Cronbach’s alpha of .8667, indicating
good reliability (Mallery, 2003). This measure corresponds to the coverage of EO words in an
entrepreneurial ecosystem, rather than measuring the EO of a particular individual or firm. While
there are articles about individuals and about firms, there are also articles that talk about policy
and entrepreneurship, more generally. Thus, this particular construct actually measures the level
of EO attributes in the collection of signals, the pattern of EO, or the Ecosystem Entrepreneurial
Orientation (EEO). The level of aggregation and the level of analysis of the study mean that it is
difficult to measure the particular signals that an individual receiver weighs, however the pattern of
signals, including the EEO would be something visible to all potential receivers in the ecosystem.
Moderators
Signal Valence
Signaling theory research examining the construct of signal valence has been largely
theoretical (Fischer & Reuber, 2007; Perkins & Hendry, 2005) due to assumptions that signaling
theory makes as to the content of signals and the purpose, which is to induce cooperation. However,
related research on media and intangible assets provides a guide and justification for measuring
signal valence in media content. Media effects research has operationalized tenor, a variable
theoretically consistent with signal valence, as affective content (e.g., Deephouse, 2003; Jonnson &
Buhr, 2011; Pfarrer, Pollock, & Rindova, 2010; Pollock & Rindova, 2003).

81
Using existing measurement techniques from these studies, I measured signal valence for
all articles for each MSA-year observation. While this measure does not capture the valence of
each individual signal, it is consistent with theoretical and empirical work in signaling theory
suggesting that the overall pattern of signals, rather than any individual signal, is important (Balboa
& Marti, 2007). I use the Linguistic Inquiry and Word Count (LIWC) dictionary of affective
words validated by previous research on affect in media coverage (Pennebaker et al., 2007) in
QDA Miner to generate a word count of the total positive affective words and the total negative
affective words for each MSA-year observation in the data set.
To create a continuous variable from these two word counts, I calculated the Janis-Fadner
Coefficient of Imbalance, consistent with prior research on media tenor (Janis & Fadner, 1943;
Pollock & Rindova, 2003; Deephouse, 1996). The Janis-Fadner was calculated using the following
formula, which generates an index variable between 0 and 1, with higher values indicating more
positive coverage, while a value of 0 would be a neutral pattern, with equal positive and negative
valence (Janis & Fadner, 1943; Deephouse, 1996). In the final data set of ten years and 30 MSAs,
the J-F ranges from 0.051 to .796 with a mean value of .396 (std. dev. of .123). Because the count of
positive valence words was higher than the negative valence across the sample, this indicates that
an increase in the variable corresponds to more imbalance between positive valence words and
negative valence words in each observation.
The Janis-Fadner valence variable was calculated using the following formula, consistent
with prior research:
The Janis-Fadner valence variable was calculated using the following formula, consistent with prior research:
("#$" % )"'% # 𝑖𝑖𝑖𝑖𝑖𝑖 > 𝑢𝑢𝑂𝑂𝑂𝑂 ("(%)$"#)
("'%)#𝑖𝑖𝑖𝑖𝑢𝑢 > 𝑖𝑖
where f is the positive coverage and u is the negative coverage.
; where f is the positive coverage and u is the
negative coverage.
Industry Diversity
Prior research in social evolutionary theory and signaling theory have not examined
ecosystem level phenomena, however regional studies literature and economics literature have
studied the relationship between industry diversity and unemployment rates (Siegel, Johnson, &
Alwang, 1995), regional stability (Bahl, Farstine, & Phares, 1971), and income (Wagner & Deller,
1998). This literature provides insight into the appropriate measure of diversity and has found that
certain measures of diversity strongly influence the analysis of data (Kort, 1981), thus choosing the
appropriate measure is particularly important for regional studies (Dissart, 2003).
82
Consistent with findings and recommendations in the regional studies literature, this study
used the Shannon-Weaver Diversity Index (Shannon & Weaver, 1948). The S-W Index ranges
between 0 and 1, where 0 is an ecosystem with only a single industry and 1 is perfect diversity
(Shannon & Weaver, 1948; Nissan & Carter, 2010). To calculate the index, the relative frequency of
the economic activity of each industry was calculated, then multiplied by the log of the frequency
and then the negative sum of these numbers was used to calculate the index. Data were available
at the MSA level through the BLS and U.S. Census Bureau about the number of firms active in an
MSA by 2-digit North American Industry Classification System (NAICS) codes. Thus, to calculate
the index, I needed the total number of firms in the ecosystem, the total number of industries, and
the total number of firms in each industry in the ecosystem. The formula for the Shannon-Weaver
Index is shown here: 𝐻𝐻 = − 𝑝𝑝% ln 𝑝𝑝%(%)* , where pi is the number of firms in an industry and n is
the number of industries.
Resource Availability
Resource availability, as a construct, has been measured in several different ways, depending
on the area of research. Studies of individual entrepreneurs, for example, used subjective, perceptual
measures (Tang, 2008; Chandler & Hanks, 1994; Krueger & Carsrud, 2000), while other studies
measure the construct objectively, as the availability of strategic factors of production, including
financial capital (Keuschnigg & Nilesen, 2003) and human capital (Martin et al., 2013).
In this dissertation, I measured both financial and human capital. The measure of financial
capital available for entrepreneurship was gathered from the Crunchbase, a free website of venture
capital activity and start-up activity, on an annual basis over a ten year period. Crunchbase has
been used in previous research into venture capital funding (Block & Sandner 2011; Waldner et al.,
2012; Motoyama & Bell-Masterson, 2014). Crunchbase contains self-report data from firms and
venture capitalists, which includes angel investment and crowdfunding investment only when the
reporting firms include them. For human capital, consistent with past research, data from the BLS
on educational attainment about high school completion, college attendance, and college completion
for each MSA were collected and an aggregate measure computed (Barro & Lee, 2013; Motoyama
& Bell-Masterson, 2014). This approach is also consistent with other MSA level research in the areas
of regional studies (Beine et al., 2008) and economic development (Benhabib & Spiegel, 1994).

83
Dependent Variables
New Venture Formation
New venture formation has been studied as an outcome in many entrepreneurial studies
and across a number of levels of analysis, including the decisions of individuals to become
entrepreneurs (Townsend et al., 2010; Delmar & Shane, 2003), entrepreneurial networks (De
Carolis et al., 2009), as an outcome for regions (Davidsson & Wiklund, 1997; Fritsch & Mueller,
2004), as well as for countries (Malecki, 1997; Reynolds et al., 1994; Aldrich & Ruef, 2006).
Consistent with other research in this area, new venture formation is collected from the BLS at the
MSA level about new firm births (Stangler & Kedrosky, 2010).
Firm Failures
Prior studies have operationalized firm failure in a number of ways, either at the individual
level when a venture goes defunct and self-reports the failure (Lohr, 2009), at the population
level using publicly available data to create a variable such as a count of failures (Nystrom and
Starbuck, 1981), or even hazard rates to represent the probability of failure over time (Bruederl
et al., 1992). Unlike the new venture formation variable, the firm failure data in the BLS is not
limited solely to new ventures. The BLS does not make the data about new firm failure rates
publicly available in the aggregated statistics. This measure is consistent with research in the
population ecology literature and should not present any unusual issues in analysis (Yang &
Aldrich, 2012). Additionally, the measure of failures, overall, is consistent with the definition of
productive entrepreneurship used to define the entrepreneurial ecosystem, in that firm failures,
whether new or old, may contribute to the economic growth of the ecosystem because of the net
increase in value, such as through releasing resources previously tied to failing ventures (Baumol,
1993; Stam, 2015; Aldrich & Martinez, 2010).
Analytical Methodology
The nature of the research question dictates the methodology used for testing the
hypotheses proposed in Chapter 3. The research question of this study seeks to answer is what
effect signals about entrepreneurship have on the behavior of potential entrepreneurs. This requires
84
the comparison of signaling and entrepreneurial activity between entrepreneurial ecosystems over
time, indicating a cross-sectional time-series dataset, also known as panel data (Torres-Reyna,
2013). Panel data allows for researchers to control for unobserved and unmeasured variables, such
as differences in policies between ecosystems or historical path dependencies unique to each
ecosystem, that is, any variable that might change over time, but would not vary across entities,
accounting for individual heterogeneity (Baltagi, 2008). Disadvantages of panel data include
difficulties in sampling and correlation between entities, cross-sectional dependence, and temporal
dependence, however there are tests to identify whether issues exist in the data (Baltagi, 2008;
Torres-Reyna, 2007; Hoechle, 2007).
In the analysis of panel data, an important decision was to determine whether to use
fixed-effects or random-effects (Green, 2008). Fixed-effects (FE) analysis is appropriate when the
variables of interest vary over time, but not between entities. FE assumes that some unmeasured
or unobserved variable exists within each entity that affects or biases the outcome variable and
then controls for this variable (Torres-Reyna, 2013). In the FE assumption, the time-invariant
factor is unique to each individual and must not be correlated with the factor across individuals,
or else FE is not the appropriate method and estimates will be incorrect (Baltagi, 2008). In such a
case, random-effects (RE) would be appropriate. RE assumes that the variance across entities is
random and uncorrelated with the independent variables (Torres-Reyna, 2007). When variations
across entities should influence the outcome, RE is more appropriate, although problems can arise
because of omitted variables which cannot be specified as RE requires (Baltagi, 2008; Torres-
Reyna, 2013). To empirically determine whether FE or RE is appropriate, the Hausman test was
used, testing for whether the errors were correlated with the regressor variables (Torres-Reyna,
2013). To calculate the statistic for the Hausman test, a fixed-effects model was estimated with the
data, along with a random-effects model. Then the estimates were compared using the Hausman
test under the null hypothesis that the difference in the coefficients was not systematic, resulting in
a test statistic of .9848, indicating that there was no evidence to reject the null hypothesis and that
random effects would be the more appropriate model. Thus, there are likely unobserved variables
that differ between the ecosystems.
In addition to testing for FE or RE as the appropriate model, tests for cross-sectional
dependence, heteroskedasticity, and serial correlation are recommended best practices for panel
85
data (Baltagi, 2008). Cross-sectional dependence, mutual dependencies between cross-sectional
units (i.e. ecosystems), is usually only present in macro-level panels over long time periods of
20-30 years (Hoechle, 2007). The logic espoused to explain why cross-sectional dependence is
observed, especially in social sciences research, is that unobserved common factors of spatial or
temporal nature arise, examples of which may include social norms and psychological behaviors
(Hoechle, 2007). These types of factors may exist in the panel for the current study, even though
the panel covers fewer years and MSAs than those in which these effects are usually observed.
Regional dependencies related to social norms about entrepreneurship, or psychological behaviors
related to the signal attributes might exist, indicating that testing for cross-sectional dependence
is particularly important to ensure reliable, unbiased estimates (Hoechle, 2007). The Pesaran
Cross-sectional Dependence test was used to determine whether the residuals are correlated
across entities in the panel (Hoechle, 2007; Torres-Reyna, 2013). Cross-sectional independence
was indicated by the test and cross-sectional dependence was addressed when the regression was
estimated (Hoechle, 2007; Driscoll & Kraay, 1998).
Heteroskedasticity exists when the variance of a variable across the values of a second
variable changes (Newey & West, 1986). Because an assumption of linear regression is that the
distribution of variables and errors is homoskedastic, invariant across values, the presence of
heteroskedastic error terms violates the assumptions and biases the estimates, which are based on
standard errors that do not account for the variance (Wooldridge, 2010; Baltagi, 2008). A likelihood
ratio test was used to test for heteroskedasticity, and the resulting test-statistic between the estimates
was significant, indicating heteroskedasticity. Huber-White standard errors can be used to provide
a robust estimate (Huber, 1967; Torres-Reyna, 2013). Serial correlation typically occurs in panels
with long time series and results in artificial inflation of R-square values (Wooldridge, 2010; Torres-
Reyna, 2013). Using the Wooldridge test for autocorrelation in panel data (Wooldridge, 2010),
there was evidence to suggest first-order autocorrelation for both dependent variables. When the
model was estimated, this autocorrelation was taken into account.
An additional test for the presence of a unit root was run on the data as well (Torres-Reyna,
2007; Dickey & Fuller, 1979). A unit root indicates that a series has more than one trend (Dickey
& Fuller, 1979) and this violates the assumption of stationarity, that the mean and variance do not
change over time or follow any trends (Wooldridge, 2010). In economic modeling, time series data
86
often violate the assumption, for example because of seasonal or cyclic trends that explain changes
in the data in addition to the independent variables of interest, and so transformations of the data
are required to deal with this non-stationarity (Torres-Reyna, 2013; Baltagi, 2008; Enders, 2010).
The Dickey-Fuller test for stationarity can be used to identify the presence of a unit root (Dickey
& Fuller, 1979; Torres-Reyna, 2013). All tests indicated that there were no unit roots present,
although a transformation of the data using first-differencing has been demonstrated as a viable
method of adjusting for the stationarity (Dickey & Fuller, 1979; Baltagi, 2008).
Once the analyses were run, a final test to determine causality was used. Testing Granger
causality begins with a regression of past values of the dependent variable and controls on the
dependent variable (Granger, 1969; Seth, 2007). Then, the independent variables that are being
tested as causes of the dependent variable are also regressed on the dependent variable and if
the explanatory power of the independent variables on the past values of the dependent variable
contain more information, then the independent variables are said to Granger-cause the dependent
variable (Granger, 1969; Seth, 2007). The data must have certain characteristics for the test to be
run effectively, including linearity and stationarity of the covariances (Seth, 2007). In practice,
Stata provides a post-estimation test to determine whether specific variables Granger-cause the
dependent variable (Stock & Watson, 2007; Green, 2008; Torres-Reyna, 2013). There are difficulties
in using the test with panel data, however, because causality may differ between panels. One
method of testing for Granger causality in panel data is to test each of the panels, individually,
to determine whether further testing is needed (Sadraoui, Ali, & Deguachi, 2014). This testing
indicated that Granger causality did not exist within the present study and that causation could not
be verified through this testing method.
The panel data were collected over a 10-year period, during which a recession occurred
and publicly available information suggests that the levels of both firm formation and firm failures
changed dramatically, possibly as a result of general economic conditions related to the annual
observations (BLS.gov; Stangler & Kedrosky, 2010). While including a time-fixed effect dummy
variable would be appropriate if a FE model is indicated, another test is available to determine
whether a break occurs in the regression coefficients (Torres-Reyna, 2013; Chow, 1960). In order
to test whether the regression coefficients are the same pre-2008 and post-2008, a dummy variable
was created for both groups and then the Chow test was used to determine whether the coefficients

87
of the variables are the same for both groups (Chow, 1960). The Chow test indicated a structural
break in the data at the start of 2008.
Finally, with time series data, identifying whether a lag effect exists and what the
appropriate lag should be for analysis is an important question. In the context of entrepreneurship,
there is considerable evidence suggesting that the time it takes for individuals to realize their
entrepreneurial intentions is non-negligible. Prior empirical studies in the area have suggested
that the time delay between deciding to engage and realizing the intention can take upwards of
ten years, although in one study, 90% had a gestation period of three years or fewer (Reynolds &
Miller, 1992). Past research has estimated that only about ten percent of nascent entrepreneurs are
able to realize a venture within 14 to 18 months (Reynolds, 1994), although activity on the part
of nascent entrepreneurs appears, at least in some studies, to steady between two and three years
from the original decision point (Carter, Gartner, & Reynolds, 1996). Studies that have examined
characteristics of nascent entrepreneurs suggest that in some cases, waiting, rather than beginning
immediately, has benefits for the entrepreneur (Parker & Belghitar, 2006). Other studies have found
that in a given year, the population of young, small firms might involve those making decisions to
enter up to four years prior to the date of the analysis (Mueller, 2006). Other research examining
the difference in start-up gestation periods has empirically identified a mean of 67 months, with a
median of 30 (Liao & Welsch, 2008).
Applying the findings of these studies suggests that the appropriate lag between signals
and firm starts should be three years. Given that the dependent variable has been aggregated at the
end of the calendar year, this should capture the majority of nascent entrepreneurs motivated by
signals in a particular year, consistent with the median age of 30 months (Liao & Welsch, 2008),
stability of entrepreneurial pursuit activities between 2 and 3 years (Carter et al., 1996), as well as
the findings that 90% of gestations windows are three years and under (Reynolds & Miller, 1992).
Most entrepreneurial firms fail within the first year of operation (Shane, 2009). Because I used a
three-year lag between the signal and the new firm starts, adding an additional year to the lag should
be the best estimate for the effect of the signal on firm failures, given that it takes three years to get
the firm started and the majority of firms will fail within the first year. Thus a four-year lag between
the signal and firm failure variable was used. In addition to the three-year lag for firm starts and the
four-year lag for firm failures, I also examined the effect of the signals on same year firm starts. I

88
justified this because signalers may base their behaviors on immediate returns, and because 10% of
entrepreneurs are able to begin in the first year.
To summarize, a number of tests were run to determine characteristics of the data to
improve analysis. The Hausman test indicated that a random effects model should be estimated.
The Dickey-Fuller test for stationarity indicated that no unit root was present in the data and
thus, no first-difference transformations were needed. The Chow test for structural breaks
suggested that there was a structural difference in the estimates before and after 2008. The LR test
indicated that heteroskedasticity was a concern. The Pesaran test for cross-sectional dependence
additionally indicated that cross-sectional dependence does exist between panels. The Wooldridge
test for autocorrelation indicated first order autocorrelation in the data. In addition, the nature of
the sample being from a single country and the sampling method of collecting geographically
neighboring ecosystems suggests the possibility of spatial cross-correlations between the panels
might be an issue. Finally, time-series cross-sectional data with small number of panels, N, relative
to time periods, T, have been demonstrated in past research to have poor fit and estimates when
using certain estimation techniques, notably Feasible General Least Squares (FGLS) due to the
manner of estimation. When the number of panels is greater than the number of periods, the
estimation results are based on a generalized inverse of a singular matrix, thus the results are not
valid (Beck & Katz, 1995). However, an alternative estimation method exists that is robust to all
of the potential problems identified in the tests of the data, specifically that the data are serially
correlated, heteroskedastic, and have cross-sectional dependence between the panels. Using Pooled
Ordinary Least Squares (POLS) and the Driscoll-Kraay standard errors allows for estimates that
are robust to all of these problems and also generally robust to both temporal and spatial cross-
correlations (Hoechle, 2007). This estimation method, using the Driscoll-Kraay standard errors is
included in the Stata package xtscc (Hoechle, 2007). The results of the analyses using POLS and
Driscoll-Kraay standard errors are presented in Chapter 5.
Chapter Summary
In this chapter, I explained how I tested the hypotheses presented in Chapter 3 using a
single study design. I described the sample frame and selection, the collection of data and how
I matched data from multiple sources. I also explained how I created each of the variables using

89
the data sources and how this is consistent with prior research in streams of research related to
entrepreneurial ecosystems and signaling theory. I identified potential problems with the data and
tested for them, presenting my test results and the corrections applied where appropriate. Table 4.2
summarizes the variables, measures, and data sources used for the study.

90
CHAPTER 5: RESULTS
Chapter Overview
In this chapter, I describe, discuss, and summarize the results of the analyses. First, I
briefly describe the data and provide descriptive statistics and correlations. Then, I review the
results of the analyses organized by dependent variable, the entry of new firms (DV1), then the
exit of firms (DV2), and finally the robustness checks using an alternate measure of new firms
(DV3). The results generally support the role of signals and signal attributes in the entrepreneurial
ecosystem context as predicted in Chapter 3. The results remain consistent with SET and Signaling
Theory, confirming that signals transmit information to receivers and then the receivers act on the
information using their individual interpretations. The actions of the receivers, at least insofar as
founding new establishments in entrepreneurial ecosystems, are consistent with SET logic which
suggests individuals will choose cooperative or competitive behaviors based on their perceptions
of the environment and how best to compete in it. In what follows in this chapter, I summarize
the results and compare them to the hypotheses. In Chapter 6, I examine the reasons why some
relationships were opposite of those predicted.
Descriptive Statistics
The study used a sample of thirty MSAs from which data were collected from 2001-
2010, resulting in 330 MSA-year observations. Table 5.1 shows the descriptive statistics for the
dependent, independent, moderator, control, and interaction variables used to test the hypotheses
presented in Chapter 3. The data presented in Table 5.1 reflects non-standardized variables. Per the
selection criteria, none of the MSAs had populations over one million, with the largest MSA in the
sample having a population of 842,813, while the smallest was 160,576.
New Firms
The hypotheses can generally be separated into two groups, based on the dependent
variable of interest. The first set of hypotheses is related to the establishment of new firms in
an entrepreneurial ecosystem. Table 5.3 summarizes the effects related to new firms. These
hypotheses can be further categorized by independent variable and associated moderators. The
91
first independent variable is signal frequency. Hypothesis 1a predicted a direct and positive effect
of signal frequency on new firm creation. Hypothesis 1a, signal frequency, was supported (β=.623,
p=.000). In practical terms, a one percent increase in the number of articles about entrepreneurship
results in 2.6 new firms, on average. In addition to the direct effect, several moderators were
proposed, including signal valence, industry diversity, and resources. Hypothesis 3a, predicting
a positive interaction between signal frequency and signal valence was not supported. The
relationship was significant, but opposite the predicted direction (β=-1.084, p=.012). Because
the valence variable range was positive across the sample, the interpretation of the interaction
involves positive valence and increasingly unbalanced valence in the positive direction. Figure 5.1
depicts the positive relationship between signal frequency and new firms. As coverage becomes
increasingly positive, the sign of the relationship flips and higher signal frequency results in fewer
new firms. Thus, this result is opposite the prediction and signal valence attenuates the positive
relationship between signal frequency and new firm formation. I discuss this result further in
Chapter 6. Hypothesis 4a predicted an interaction between industry diversity and signal frequency.
It was not supported (β=-.118, p=.430). Hypothesis 5c predicted that resources would attenuate
the relationship between signal frequency and new firms. Hypothesis 5c was not supported. The
interaction was significant but opposite the direction predicted (β=3.32E-09, p=.000). Figure 5.2
depicts the positive relationship between signal frequency and new firms. As resources increase,
the positive relationship between signal frequency and new firms is strengthened. Although the
interaction is significant, the practical effect is small across the range of the sample.
A second set of hypotheses examines the relationship between content attributes of the
signals and new firm formation. Hypothesis 2a predicted a direct and positive effect of signal
content on the creation of new firms. The hypothesis was not supported. The relationship was
significant in the model of independent variables, but was not supported in the full model (Table
5.3, Model 2: β=-.320, p=.000; Model 3: β=-.388, p=.472). In both models, the direction of the effect
was opposite predictions. Hypothesis 3c predicted that signal valence would strengthen the positive
relationship between signal content and new firms. This hypothesis was not supported (β=.007,
p=.659). Hypothesis 5a predicted that that resources would strengthen the positive relationship
between signal content and new firms. Hypothesis 5a was not supported (β=-1.47E-09, p=.184).
In addition to the hypothesized relationships, valence, industry diversity, and resource availability

92
were found to have significant direct effects. Valence was marginally significant, exhibiting a
positive direct effect on new firm establishments (β=.164, p=.065). The effect of industry diversity
was negative and significant (β=-.458, p=.004). Finally resource availability exhibited a direct,
negative effect (β=-.309, p=.003).
Firm Failures
The second broad set of hypotheses examines the failure of firms in entrepreneurial
ecosystems. Table 5.4 summarizes the relationships related to firm failures. These hypotheses
can be broken into two subsets around the independent variables predicting direct effects. The
first subset of hypotheses predicts the effect of signal frequency on firm failures. Hypothesis 1b
predicted a positive relationship between the frequency of signals and the number of firm failures.
This hypothesis was supported (β=.429, p=.001). In practical terms, this means that a one percent
increase in the number of articles about entrepreneurship increases the number of firm failures by
1.5 firms, on average. Hypothesis 3b predicted that signal valence would strengthen the relationship
between signal frequency and firm failures. The hypothesis was not supported. The relationship
was marginally significant and negative (β=-.591, p=.067), but opposite the predicted direction.
Figure 5.3 depicts the moderating effect of signal valence on the positive relationship between signal
frequency and firm failures. As coverage becomes increasingly positive, the sign of the relationship
flips and higher signal frequency results in fewer firm failures. This result is opposite the prediction
and signal valence attenuates the positive relationship between signal frequency and firm failures.
This finding is consistent with the result of hypothesis 3a, above. Hypothesis 5d predicted that
resources would attenuate the relationship between signal frequency and firm failures. Hypothesis
5d was not supported. The relationship was positive and significant (β=2.44E-08, p=.000), which is
opposite the predicted direction. Figure 5.4 depicts the moderating effect of resources on the positive
relationship between signal frequency and firm failures. As resources increase, this strengthens the
positive relationship between signal frequency and firm failures. The effect of the interaction is
significant, however the practical effect is small across the range of the sample.
The second subset of hypotheses about firm failure predicts the effect of signal attributes
on firm failures. Hypothesis 2b predicted that signal attributes of entrepreneurial orientation would
lead to more firm failures. This hypothesis was not supported. The relationship was significant in
93
the model of independent variables, however it was not significant in the full model (Table 5.4 Model
2: β=-.141, p=.046; Model 3: β=-.157, p=.637). In both models, the effect was opposite the direction
predicted and consistent with the results for hypothesis 2a. Hypothesis 3d predicted that signal
valence would strengthen the positive relationship between signal attributes and firm failures. This
hypothesis was not supported (β=.002, p=.866). Hypothesis 5b predicted that resources would
strengthen the positive relationship between signal attributes and firm failures. Hypothesis 5b
was not supported. The relationship was significant and negative, which is opposite the prediction
(β=-2.93E-08, p=.000). Figure 5.5 graphically depicts the moderating effect of resources on the
negative relationship between signal attributes and firm failures graphically. As resources increase,
the negative relationship between signal attributes and firm failures becomes stronger. As with the
interaction effects between resources and other variables found in the results, hypothesis 5b, while
significant, appears to have a small practical effect across the range of the sample. Finally, the
model also revealed that valence and resources had direct and significant effects on firm failures.
Valence exhibited a positive direct effect (β=.179, p=.039), along with resources, which also had a
positive direct effect on firm failures (β=.315, p=.001).
Robustness Checks
As a test of the robustness of the analysis and results, I also ran the analyses for firm starts
using a different data source from the Business Dynamics Statistics to calculate an alternative
measure for new firms. The measure is the count of all establishments in the MSA considered
to have an age of zero, meaning that these firms had no employees during the previous year.
This measure should represent the same population as new establishment entries. In addition, the
BLS has corrected the measure for left-truncation of the data. Left truncation occurs because the
aggregated annual reports do not account for firms that start and fail within the same reporting
period in most databases (Yang & Aldrich, 2012). Ordinarily, a firm that was founded in 2000 and
failed in 2000 would not be included in the dataset, thus resulting in a bias in the results because
the data are left-censored. The results for the alternate measure of new firms are summarized
in Table 5.5. The results of the analyses were consistent with those of the primary analysis. The
effect magnitudes differed, however they were all in the same directions as the primary analyses,
suggesting that across the DVs, they are consistent.
94
In addition to this DV, I was also able to identify a subset of firms that were new and small
sized (1-4 employees). I performed two analyses on this subset of firms, one using a three year
lag as in the primary analyses and a second one using the same year predictors (no lag). The logic
behind this test is that new, small firms may be able to move faster and organize resources quicker,
because they have fewer needs. They would also correspond to the 10% of firms able to start in
the same year (Reynolds & Miller, 1992) and could represent a different audience of firms for the
same signal. The new, small firms may represent a subset population with higher entrepreneurial
intentions and also a population consistently targeted by signalers attempting to encourage
entrepreneurship. The results of the analyses for new, small firms are presented in Table 5.6. The
analyses indicate consistency across the subset and with the primary analyses. A notable difference
is that hypothesis 2a, predicting a direct and positive effect between signal attributes and new firm
creation, while still not supported, becomes marginally significant in the same year in the analysis
of new, small firms (Table 5.6, Model 3: β=-.449, p=.093). Hypothesis 5a is not supported in the
robustness checks, either. However, the interaction between signal attributes and resources becomes
significant for new, small firms (Table 5.6, Model 3: β= -3.30E-09, p=.003). This is opposite the
direction of the prediction, however the signal attributes relationship is also opposite predictions.
Thus, the interaction makes the negative relationship between signal attributes and new, small firm
formations even more negative in the presence of resources. I discuss this in Chapter 6.
Chapter Summary
Chapter 5 described and explained the findings of the analyses. Table 5.7 summarizes
the support, partial support, or lack of support for each hypothesis tested. Consistent with
expectations, signal frequency appears to be a significant predictor of both new firms and firm
failures. There was evidence to suggest signal frequency remains important with the interactions
for both valence and resources, although the interaction with valence was opposite predictions.
Signal attributes were found to have significant direct effects on both new firms and firm failures,
although the direction was opposite predictions. In addition, the signal attribute direct effect
became non-significant in the presence of interactions. The interaction between signal attributes
and resources was significant for firm failures in the primary analysis and for new, small firms
in the same-year analysis. All of the signal attribute coefficients were in the opposite direction as

95
predicted, which warrants some discussion and explanation in Chapter 6. The effects observed
were consistent across DVs, with direct effects in the same direction and interaction effects
exhibiting the same general shape.
96
CHAPTER 6: DISCUSSION AND CONCLUSION
Chapter Overview
In this chapter, I discuss the contributions and implications of the dissertation. I begin with
a brief review of the results of the dissertation, organized by main effects and interactions, then
discuss the findings using the lenses of SET and signaling theory. Next, I identify the boundary
conditions of the present study and explore paths for future research. Then, I highlight implications
for research, practice, and policy. Finally, I conclude with evidence of how I met each of the
research objectives in Chapter 1.
General Discussion
Signal Frequency and New Firms
Signal Frequency and New Firms. The first set of hypotheses links signal frequency to new
firm starts and include hypotheses 1a, 3a, 4a, and 5c. Hypothesis 1a predicted a direct and positive
relationship between signal frequency and new firm formations. Support was found for a direct
effect of signal frequency in the analysis, suggesting that signal frequencies are important for the
formation of new firms. As argued, an increase in signal frequency should reduce information
asymmetry and then the reduction in information asymmetry provides potential entrepreneurs
in the ecosystem a more accurate picture of the environment, in turn motivating potential
entrepreneurs to engage in entrepreneurial activities. This is consistent with the SET perspective,
in that signals about the competitive environment should motivate cooperative or competitive
behaviors among and between individuals in an ecosystem (Nowak, 2006).
Hypothesis 3a predicted that signal valence would strengthen the positive relationship
between signal frequency and firm formations. Hypothesis 3a was partially supported, although
the finding suggests that the relationship is more complex that predicted. Higher signal frequency
in the presence of moderately positive signal valence corresponded to an increase in new firms. The
range of the valence variable was positive in the sample, and thus the positivity increased across
the sample as it became increasingly unbalanced in the direction of positive valence. Increasingly
positive valence interacted with increasing signal frequency in such a way as to correspond to
fewer new firms, suggesting that signal valence plays a critical role in the signal interpretation by
potential entrepreneurs. Individuals with higher entrepreneurial intentions may be more willing to

97
act on only a few very positive signals, for example. When there are many positive signals, even
individuals with high entrepreneurial intentions may re-evaluate the signals being sent. The shape
of the interaction, combined with signaling theory concepts, suggests that an increasing frequency
of increasingly positive valence articles may begin to lose credibility with the receivers, perhaps
because they perceive bias from the signalers (Connelly et al., 2011).
In such a case, the receivers may not believe that the signals are reducing information
asymmetry as well, consistent with research in the area of communication that has found that
negative words convey more information than positive words (Garcia, Garas, & Schweitzer, 2012).
A moderately positive valence of signals, on the other hand, suggests that there are also more
negative valence articles and that the signals being sent are less biased and more credible. The
combination may be perceived as reducing information asymmetry better. This is consistent with
research in signaling theory identifying the importance of both signaler honesty (Arthurs et al.,
2008) and signaler credibility (Busenitz et al., 2005) as important dimensions for the signal, as
discussed in Chapter 3. Thus, a better reduction in information asymmetry, represented by the
interaction of balanced valence and higher signal frequency results in more individuals choosing
to pursue entrepreneurship, consistent with the SET argument that they can more accurately
choose between cooperative and competitive behaviors. Potential entrepreneurs may believe that
too much positive coverage of entrepreneurship in an ecosystem is an indication of a situation that
is simply too good to be true.
Hypothesis 4a predicted that industry diversity would moderate the relationship between
signal frequency and firm starts, such that under conditions with fewer signals and many signals,
there would be fewer starts, while a moderate number of signals would result in more starts. This
hypothesis was not supported in the primary analysis. The subset analysis found only a marginal
relationship here. Thus, it appears that industry diversity does not have a significant moderating
effect on the relationship between frequency and firm formations.
Hypothesis 5c predicted that resource availability would weaken the effect between signal
frequency and firm starts. This effect was not supported in the primary analysis. Instead, it was
found to be opposite, such that greater resource availability strengthened the effect between
signal frequency and new firm starts. This suggests that signal frequency is more important under
conditions where resources are available.

98
Considered together, the results of these hypotheses suggest that signal frequency is a
necessary condition to encourage new venture formation in entrepreneurial ecosystems. For the
signal, itself, the valence matters, such that more balanced signals are more important than many
positive signals, which indeed, appear to have a negative effect on the perception of the signal.
Resource availability appears to moderate the relationship such that higher resource availability
in the presence of more signals has a stronger effect than either alone. A likely explanation for
this is that under conditions of resource abundance, more potential entrepreneurs are receptive to
signals about entrepreneurship. By SET logic, this interaction makes sense, because a resource
abundant environment would mean that individuals would be less motivated to work together to
acquire resources and more motivated to compete for the resources amongst themselves (West et
al., 2007). As a result, fewer individuals would remain with their existing firms, they would not be
as motivated to seek out partnerships, and would seek to start new firms instead.
These results present an interesting extension of SET. Specifically, the definition and
meaning of cooperative and competitive behaviors may differ between levels of analysis. As
an example, consider the case of mutualism, which SET identifies as one possible relationship
between social actors. In mutualism, both actors incur a cost to cooperate and both benefit
from the relationship. At the ecosystem level of analysis, new firm creation is an example of
mutualism because several social actors (suppliers, financiers, politicians, entrepreneurs) engage
in cooperative behaviors that incur costs and result in mutually beneficial relationships among
the actors. At the individual level, mutualism could, alternatively, also be working for another
firm. This cooperative behavior at the individual level would not be directly observable, although
it would impact the results of this study. Also at the individual level, starting a firm might be
viewed as a more competitive behavior whereas starting a firm would be viewed as a cooperative
behavior (joining the ecosystem) at the ecosystem level. When individuals choose to strike out on
their own, especially when forgoing partnerships with other individuals or firms, this action would
likely be viewed, at the individual-level, as more competitive than cooperative. This may also be
the case because potential entrepreneurs do not appreciate the full range of relationships that must
be developed and maintained as a new firm. This would be consistent with work suggesting that
media coverage might provide the motivation to start new firms, but does not provide the necessary
know-how or details on how to make them successful (Aldrich & Yang, 2012). Thus, starting a

99
new firm with partners would be a cooperative behavior from the individual perspective which
would reduce the overall number of starts in an ecosystem when compared to each individual
starting on his or her own. Although the current study data are not nuanced enough to measure
this outcome in finer detail, the logic here is consistent with an extension of SET to the individual
level of analysis and warrants examination in future research.
Signal Frequency and Firm Failures
The second set of hypotheses links signal frequency to firm failure and includes hypotheses
1b, 3b, and 5d. Hypothesis 1b predicted a direct and positive relationship between signal frequency
and firm failures and was supported. The logic of the hypotheses was that firm failures are
likely to increase because additional unqualified individuals start firms. Signaling theory logic
predicts that the signal frequency will reduce the information asymmetry in the ecosystem, while
SET logic predicts that individuals will then choose the appropriate cooperative or competitive
behavior based on this information. The support for hypothesis 1b suggests that signal frequency
motivates potential entrepreneurs to start firms, although consistent with the logic in the hypothesis
development, it also indicates that more of the new firms may have been founded by those without
the necessary qualifications.
Hypothesis 3b predicted that signal valence would strengthen the positive relationship
between signal frequency and firm failures. Hypothesis 3b was partially supported in the primary
analysis. However, opposite the logic of the hypothesis, and consistent with the finding in
hypothesis 3a, the direction of the effect was opposite predictions. This means that increasingly
unbalanced, positive valence of signals corresponds interacts with the increasing frequency to
result in fewer firm failures. The second proposed moderation for the relationship between signal
frequency and firm failures was hypothesis 5d, which predicted that resource availability would
weaken the positive effect between signal frequency and firm failures. The logic behind the
hypothesis was that increasing resource availability would prolong the life of nascent ventures that
might otherwise fail. Contrary to the prediction, increasing resource availability strengthened the
relationship between signal frequency and firm failures. Across the range of the sample, the effect
was statistically significant, though practically small.

100
Considered together, these hypotheses suggest that signal frequency influences the failure of
firms as predicted in Chapter 3. Potential entrepreneurs are motivated to start firms by the frequency
of signals; however the signals do not discriminate between those with higher potential for success.
The pattern of results between the new firm starts and firm failure DVs are largely consistent, in
terms of shape of the effects, though the magnitudes differed. This may provide evidence of an
alternative model linking signal frequency, firm starts, and firm failures. The lag of three years
selected to analyze the effect of the signaling behavior on firm formation was consistent with past
empirical work. Similarly, because a firm has to have started in order to fail, a four year lag was
selected for the firm failure analysis. The logic behind these lag selections may suggest an alternative
model of signaling behavior on firm failures, one in which the signals are mediated by firm starts.
There are direct effects between signaling frequency and firm failures, which may indicate a partial
mediation. As a result, an avenue for future research may be to test this alternate model.
Signal Content and New Firms
The third set of hypotheses links signal content, specifically E.O. content, to new firm
starts and includes hypotheses 2a, 3c, and 5a. Hypothesis 2a predicted a positive relationship
between E.O. content and firm starts with more E.O. content leading to more firms in the
ecosystem. The logic behind this hypothesis was that E.O. content would be representative of
the entrepreneurial orientation of the entrepreneurial ecosystem and the coverage of the content
would encourage potential entrepreneurs to pursue entrepreneurial ventures. In the analyses, the
effect of E.O. content varied in terms of statistical significance, but the effect always reflected
a negative relationship between E.O. content and new firm starts, contrary to the prediction of
hypothesis 2a. This suggests that entrepreneurs may be interpreting E.O. content differently than
the logic articulated for hypothesis 2a. Specifically, some entrepreneurs may view E.O. content
as an undesirable, rather than desirable, signal for new starts. Instead of promoting individual-
level competitive behaviors (starting new ventures), E.O. content may stimulate individual-
level cooperative behaviors (continuing with existing firms or jobs; partnering with others
rather than starting an independent venture). One possible reason for this is that many of the
words associated with the E.O. construct are oriented towards competition and how to compete,
including competitive aggressiveness, proactiveness, and innovation. When covered in the media,
101
signals about these topics may be indicative of the competitive environment or dynamics in the
ecosystem, rather than the mindset of the ecosystem as a whole. According to SET, signals about
increasing competitiveness should lead to more cooperative, rather than competitive behaviors,
because cooperation offers an evolutionary advantage over competition in these cases.
Hypothesis 3c predicted that signal valence would strengthen the positive relationship
between E.O. content and new firm starts based on the logic that E.O. content represented the
mindset of the ecosystem pertaining to entrepreneurship and that positive signals about it would
encourage potential entrepreneurs to believe it was a valued pursuit and thus they should start
their own firms. This hypothesis was not supported in the analysis. Hypothesis 5a, predicted that
resource availability would strengthen the positive relationship between E.O. content and new firm
starts based on the logic that additional resources would incentivize potential entrepreneurs to
pursue new ventures. This relationship was not significant. However using the subset analysis of
new, small firms, there was evidence to suggest the interaction was significant, although as with
other resource interactions, the effect was practically small. The finding in the subsample still
suggests that under certain circumstances, such as in the presence of resource availability, content
signals may are important for the formation of new firms, particularly for new, small firms, those
most likely to be in need of resources. These same firms may also be particularly attentive to the
E.O. content of signals as well.
In considering the logic behind why the E.O. content relationship with new firm
starts is opposite what was predicted, I have identified two possible explanations. First, the
construct of entrepreneurial orientation at the ecosystem level and applied to media coverage
of entrepreneurship may be interpreted differently than when used in the context of letters to
shareholders in which the dictionary used was developed. Specifically, the dimensions of E.O.,
when used by companies, suggest a certain competitive mindset characterized by autonomy,
innovativeness, proactiveness, risk-taking, and competitive aggressiveness (Lumpkin & Dess,
1996). When used as signaling attributes in letters to shareholders, these words and their
unobservable associated characteristics are selling points.
However, when used as signaling attributes about the entrepreneurial ecosystem, different
elements may be highlighted and are subject to a different interpretation by receivers. Risk-taking
and competitive aggressiveness, for example, may be viewed by individuals as negative attributes

102
of an ecosystem - it might be too risky to start a firm there or the competition could be perceived as
too fierce. Indeed, prior research demonstrates that when density levels are high (a large number of
firms are competing in an industry), entrepreneurs rate all potential opportunities as less attractive
(Wood, McKelvie, & Haynie, 2014). Additionally, individuals with lower entrepreneurial intentions
might be equally deterred by signals about the need for innovation or proactiveness, leading them
to choose the pursuit of other career opportunities, instead. Thus, the meaning of the construct
in context changes, and the relationship proves to be opposite expectations. Table 6.1 provides a
selection of exemplar quotations taken from the text of articles used in this study. These quotes
are suggestive of how the E.O. content of the articles might have a different meaning than if they
were used in the context of letters to shareholders. For example, “If you’re more productive, you’re
better able to compete and survive and expand and grow.” Note the emphasis on competition
and challenges, even survival, that could drive potential entrepreneurs with lower entrepreneurial
intentions to seek other options than self-employment. The nature of the construct suggests that it
may serve to eliminate those who are less dedicated to the idea from those that are more passionate.
Second, using the lens of SET, this finding remains consistent with the logic of the theory,
when the construct at the ecosystem level signals higher levels of competition. SET predicts that
under such conditions, individuals will seek cooperative relationships in order to improve their
competitive positions. Even among the individuals with higher levels of entrepreneurial intentions,
a highly competitive environment would be more likely to lead them to seek out partnerships.
Instead of starting an entrepreneurial venture alone, two or more potential entrepreneurs would
be subsumed into a single firm, and this would create a negative relationship between the E.O.
content coverage and actual firm formations as well. The same logic holds true for firm failures as
well (see next section), predicting why the findings suggest that higher E.O. leads to fewer failures
- potential entrepreneurs either choose not to start a business or they hedge their risk by finding
cooperative relationships that allow them to survive longer. This is consistent with literature in the
area of opportunity evaluation at the individual level which has found that higher risk perceptions
by potential entrepreneurs lead them to evaluate opportunities less favorably (Forlani & Mullins,
2000; Keh, Foo, & Lim, 2002).
These findings suggest that the signal content, in this case E.O. content, is an important
signal attribute linking the signaling pattern to new firm formations. The E.O. content does not

103
appear to be representative of the entrepreneurial mindset of the ecosystem, as conceptualized
in Chapter 3, but rather it would seem the E.O. content may be representative of underlying,
unverifiable dimensions of the competitive environment that influence potential entrepreneurs’
perceptions. In the presence of highly positive valence signals, entrepreneurs seem to view E.O.
content as a signal that existing firms are performing well, that the environment is competitive,
and that there is no place for the new firms they might have an interest in creating. On the other
hand, in the presence of balanced signals, E.O. content may be indicative of the existing firms
performing poorly, which creates the perception for potential entrepreneurs that opportunities may
exist for the venture ideas they would pursue. In the case of new, small firms, the availability of
resources also influences perceptions of the signal content, insofar as the interaction is significant,
although the practical effects are limited.
Signal Content and Firm Failure
The fourth and final set of hypotheses links signal content, again as E.O. content, to firm failures
and includes hypotheses 2b, 3d, and 5b. Hypothesis 2b predicted a positive relationship between
E.O. content and firm failures with more E.O. content leading to more failures in the ecosystem.
The results suggest that a relationship exists, but the direction is opposite what was predicted in the
hypotheses, consistent with the findings and discussion presented above about hypothesis 2a.
Hypothesis 3d predicted that signal valence would strengthen the positive relationship
between E.O. content and firm failures based on the logic that E.O. represented the ecosystem
mindset about entrepreneurship and that positive signals would indicate to potential entrepreneurs
that entrepreneurship was a desirable pursuit in the ecosystem. As discussed in the previous
section, the findings indicate E.O. content may not represent this at all, but rather describes to
potential entrepreneurs the competitive environment of the ecosystem. The interaction was not
found to be significant, and the hypothesis was not supported.
Hypothesis 5b predicted that resource availability would strengthen the positive relationship
between E.O. content and firm failures following the logic that E.O. content, as a mindset, combined
with the presence of resources with which to begin their endeavors, would encourage potential
entrepreneurs to found firms and that more of them would not be qualified as well, thus resulting
in more failures. The results suggest that resource availability weakens the negative relationship

104
between E.O. content and firm failure. As with all of the resource availability moderations, the
practical effects of the interaction are limited, with a significant, but negligible difference between
low and high resource availability.
These findings are consistent with the signal frequency hypotheses concerning signal
frequency and firm failure and the E.O. content concerning new firm starts. As with the hypotheses
about signal frequency and firm failure, these findings suggest that while there are some direct
effects, there may also be evidence for new firm formation as a mediator, an alternate model to
test in future research. Consistent with the E.O. content to new firm relationships, E.O. content
would seem to represent the competitive environment, rather than the mindset of the ecosystem
as conceptualized in the hypothesis development. SET logic suggests that signals to potential
entrepreneurs indicating a more competitive environment should lead to fewer firm failures. This
follows from the logic that a more competitive environment should influence individuals to engage
in cooperative behaviors, the most likely of which are to remain employed by another, operating
firm, or to find partners with whom to pursue a new venture. Both of these cooperative outcomes
result in fewer new firms in the entrepreneurial ecosystem, leading to fewer failures. In addition,
starting firms with partners may allow nascent entrepreneurs to hedge their risk and to survive
longer than an individual entrepreneur because of the support from multiple personal resource
networks. This would then lead to even fewer firm failures. Thus, these findings are consistent
with and support SET as applied to entrepreneurial ecosystems.
Boundary Conditions & Future Directions
The present study is not without limitations that may have influenced the results and
might restrict the generalizability of the findings. These limitations include the choice of signal
type, article selection, the population-level nature of the data used in the analysis, and the limited
time period of the study. Fortunately, each of the limitations also suggests future research and
opportunities to extend the present model. Finally, the findings of the dissertation opposite the
directions predicted also suggest avenues of study for future studies.
The choice to use printed news media articles to operationalize the signaling activity in
the ecosystem was justified by the highly visible nature of the media channel and by a vibrant
literature in communications (Bandura, 2001) and management on media studies (Pfarrer et

105
al., 2008). Media articles, as signals, are likely to reach all audiences in the ecosystem and be
recognized and accorded some degree of credibility, thus leading to their influence on behaviors.
In addition, the time period of the study, from 2001-2010, necessitates printed news media, because
social media did not begin to develop fully until after 2006. In a study exploring a new application
of theory, such as this one, a highly visible signal and strong expectations of a relationship are
ideal. However, as I have argued, there are many signalers in an entrepreneurial ecosystem, and
they send signals through many channels using a variety of means to reach the intended receivers.
Alternative channels to consider for signals could include television news, social media, or word of
mouth. In addition, other actions that pertinent signalers in an entrepreneurial ecosystem take are
signals to receivers, such as advertising, promotions, donations, and participation in trade groups
or entrepreneurship-oriented organizations. The broad coverage aspects of news print means that
a selection of these actions are already incorporated into the data, but less visible actions may
be missing. Indeed, the possibility exists that taking the action, rather than the news coverage
of it, might prove to be the more important signal. Future research could incorporate additional
channels to determine whether certain forms of communication alter the perception or importance
of the signals being sent. An alternative research idea would be to identify the signals being sent
directly by firms, independent of media and then to identify the differing impact of the direct
signals and media signals. Future researchers could also consider an inductive approach to this
question, in order to investigate which channels and signal attributes are more pertinent to potential
entrepreneurs when making the decision to undertake entrepreneurial endeavors.
Another limitation of the present study may be the selection criteria for articles used in
the analysis. While the selection of articles related to entrepreneurship is a logical decision for
this study, the narrower range of topics may limit the generalizability of the findings. It is possible
that an expansion in the scope of selection could provide additional insight into the way signal
frequency impacts firm formation and failure in entrepreneurial ecosystems. Future research
could randomly sample from all articles in the entrepreneurial ecosystem to determine whether
the broad coverage has a different effect. The present study did not examine the relative frequency
of entrepreneurship articles as compared to all articles in the ecosystem, which may, in future
research, provide insight into how important entrepreneurship is for an ecosystem as well as how
difficult it is for potential entrepreneurs to receive the signals about entrepreneurship from the

106
array of signals being sent. This might allow future research to make inferences about the attention
potential entrepreneurs give to signals about entrepreneurship. Alternatively, all business-related
articles could be collected, although the article selection in the present study suggests that such
an undertaking might be prohibitive in terms of time for data collection, space for storage
requirements, and even processing power because of the volume of articles.
The use of ecosystem-level data for the analysis allows the present study to identify patterns
of activity among potential entrepreneurs who decide to engage in some form of entrepreneurial
activity, however a limitation of this approach is that it is not possible to determine the effect
of signals on the entire population of potential entrepreneurs. Thus, there are nuances missing
from our understanding, and some of the inferences made from the analysis may be more tenuous
and might not apply to the population of potential entrepreneurs who do not engage in firm
creation. The population-level of analysis and the available data do not account for the movement
of individuals between ecosystems, for example, such that an entrepreneur may found a firm in
Ecosystem B, while the signals most pertinent for the decision and motivation were received
in Ecosystem A. The presence of a time-lag effect found in the analysis only complicates this
relationship further, such that the signal could have been received in Ecosystem A in time 0,
while the firm was founded in Ecosystem B at time 4. Future research in this area exploring these
relationships would probably benefit from access to the U.S. Census Bureau Research Data Centers,
which would allow them to follow specific cohorts of individuals and their spatial movement in
addition to their entrepreneurial activity. It would not be unreasonable to expect, for example,
that positive signals about entrepreneurship received by individuals in larger MSAs motivate
those potential entrepreneurs who receive them to actually found firms in smaller MSAs with less
coverage suggesting they would not be as highly competitive as a larger MSA might be. Such data
access would allow future research to make more fine-grained inferences and recommendations,
especially for practice and policy.
The ecosystem level of analysis also highlights the importance of the stock of existing
population and resources, consistent with past studies in population ecology (Aldrich, 1990) and
industry agglomeration (Krugman, 1991). The population of the entrepreneurial ecosystem appears
to be an important factor for entrepreneurial activity and is a significant predictor of future firm
formations. A limitation of the present study is that it did not consider the antecedents of increasing

107
population or the possible influence of population and agglomeration on the type of firm formed.
Future research could link the firm formations to industry or examine antecedents of population
in media signals as well, advancing similar research that has been done in economic development
policy literature (Florida et al., 2002) and linking it more specifically to entrepreneurship and
entrepreneurial ecosystem outcomes.
The time period of the study, from 2001-2010, because of the availability of data, may
be a limitation. There may be cultural variables at work linked to the characteristics of the
population and population turnover that have effects measurable only in a longer time series. Work
in entrepreneurial culture, for example, suggests that fifteen, twenty, or longer periods of time
may be necessary to observe the influence of entrepreneurial culture changes and their influence
on patterns of entrepreneurial activity (Beugelsdjik, 2007). The dissertation proposed that media
had a more direct effect on the decisions of potential entrepreneurs to engage in entrepreneurial
activity, however future research could look at the pattern of media and determine whether an
additional influence may exist in shifting entrepreneurial culture and attitudes or beliefs about
entrepreneurship in entrepreneurial ecosystems.
The findings concerning the signal attributes measurement in terms of the E.O. content
may suggest a direction for future research as well. While the effect of signal attributes was
significant, it was opposite the direction predicted. This suggests that the E.O. content at the level
of the entrepreneurial ecosystem, in terms of coverage in the media and pattern of coverage, may
not have the same meaning as at the firm level. However, future research could seek to identify the
content of signals that are indicative of the actual entrepreneurial orientation of the entrepreneurial
ecosystem. Past work in content analysis suggests that future researchers would begin with the
population of articles in the ecosystem and then develop a new dictionary from the content of
the articles, consistent with the way the E.O. dictionary was developed for letters to shareholders
(Short et al., 2009).
In concert with the limitations on the level of analysis, the findings also suggest that there
may be individual-level effects and that individual differences may play a role in the interpretation
of the signals sent. Again, prior research demonstrates as characteristics of the ecosystem change,
entrepreneurs rate potential opportunities differently (Wood et al., 2014). Prior research has
examined decisions about exploiting opportunities through intrapreneurship (working for an

108
employer) or entrepreneurship and has found that individual differences are important for the
outcome (Parker, 2011). Future research in this area could link individuals to specific decisions
to start or terminate and thus examine the role of individual differences for interpreting signals.
Linking the individual level of analysis to media coverage, prior work in social psychology
has utilized behavioral contagion theory (Wheeler, 1966) to explain the influence of media on
individual behaviors, including aggression (Phillips, 1986) and suicide (Gould, Jamieson, &
Romer, 2003). These studies have found that individuals with predispositions toward certain
behaviors who have never acted upon those predisposition may be triggered to act by media
coverage of similar acts (Gould et al., 2003). The same logic could be applied to the phenomenon
of media coverage in entrepreneurial ecosystems in future research to test whether behavioral
contagion theory might be a viable explanation. A study of competing hypotheses contrasting the
predictions of behavioral contagion theory and signaling theory might be an interesting direction
for a future study in this area.
Implications
Implications for Research
The research in this dissertation has several implications for researchers. First, I integrated
various definitions of EE across literatures to derive a single definition that encompasses the prior
definitions, acknowledges the dynamic nature of the actors and the outcomes, and emphasizes
the role of all members of the EE as social actors who engage in some form of communication
to coordinate activities (Stam, 2015; Aldrich & Martinez, 2010). Second, I contribute to our
understanding of how entrepreneurial ecosystems can develop differently over time, based on new
theory and explanations utilizing communication as a mechanism for change in EE and I answered
calls in previous theoretical work to empirically examine the role of media for entrepreneurial
ecosystems (Aldrich & Yang, 2012). Third, I brought SET into the management and entrepreneurship
literature to explain logics behind cooperative and competitive social behaviors among individuals
and organizations. Finally, I addressed a gap in SET to explain how social actors engage others
social actors to benefit from social relationships.
This dissertation integrated previous definitions of entrepreneurial ecosystems in such a
way as to motivate the use of social evolutionary theory (Margulis, 1971) in entrepreneurship
109
research and specifically applied it to the concept of the entrepreneurial ecosystem as an
explanation motivating cooperation and the logics behind cooperation. This builds on prior work
using evolutionary theory and the evolutionary approach in entrepreneurship research (Aldrich
& Ruef, 2006; Breslin, 2008). While past research has identified the types of relationships that
emerge, specifically cooperative and competitive (Aldrich & Martinez, 2010), social evolutionary
theory has specific logics for cooperation that enhance our understanding of the phenomenon.
The findings of the dissertation emphasize the role of media for explaining differences
in the development of entrepreneurial ecosystems over time, specifically in the patterns of firm
formations and firm failures in ecosystems. Empirically, the findings of this study support the
importance of the role of signals in entrepreneurial ecosystems and provide a clearer understanding
of the ways in which signals impact the pattern of new firm formations and failures in ecosystems.
Specifically, the frequency of signals, alone, may affect changes. Yet, consistent with SET and
signaling theory, the information conveyed in terms of signal content and valence, also influence
the outcomes of formation and failure. While the direction of the effects of content was not as
expected, it nonetheless supports the SET and signaling theory integration, because signals are
interpreted by the receivers, and the evidence suggests that the receivers choose cooperative or
competitive behaviors based on their interpretations - a potential entrepreneur choosing to remain
employed by another firm is selecting a cooperative behavior over a competitive one.
This finding also suggests an implication for researchers interested in the study of
entrepreneurial orientation, a construct which I have applied to media signals at the ecosystem
level. While E.O. held together as a single construct when applied at this alternate level of analysis,
the meaning and interpretation of the construct appears to be different in the context. Rather than
signaling the entrepreneurial mindset of a firm to organizational stakeholders, as it does when
used in the analysis of letters to shareholders, the same construct appears to signal meaningful
information about the competitive environment in the entrepreneurial ecosystem. This competitive
information influences potential entrepreneurs’ decisions to found new firms or choosing to give
up and fail. The empirical support for the implication is found in the result that entrepreneurial
orientation content, contrary to predictions that it would motivate individuals in the ecosystem
to found more firms because individuals would believe they possess associated characteristics,
instead appears to deter these individuals from pursuing entrepreneurial endeavors. As other

110
constructs are applied to this level of analysis, it is important for researchers to keep these findings
in mind and consider how the construct might have an alternate meaning when interpreted or used
in the specific new context.
An implication of the findings is that the effects of these logics, when applied at different levels
of analysis, may produce different cooperative or competitive relationships. From the ecosystem
perspective, cooperative behaviors involve forming relationships between other businesses in
a way that results in higher overall fitness for the population of firms in the ecosystem. More
firm starts at the ecosystem can also be viewed as cooperation by “joining” the entrepreneurial
ecosystem. At the individual level, cooperation involves behaviors that improve the individual’s
chance for survival. For example, SET identifies mutualism as one possible relationship between
social actors. At the ecosystem level of analysis, a new firm is a measurable form of mutualism,
where individuals form relationships among other members of the organization and also between
firms. At the individual level, mutualism could also be working for another firm, and in the present
study, would not be directly observable. However, this individual-level cooperative behavior
contributes to the results of the study. Thus, at the individual level, starting a firm might be a more
competitive behavior, as evidenced by the effect of the E.O. content variables. However, starting a
new firm with partners would be a cooperative behavior.
Integrating social evolutionary theory with signaling theory contributes to a clearer
theoretical understanding not just of the motivation for cooperation, but of the specific mechanisms
social actors can utilize, in the form of signals and communication, to induce cooperation (or
competition). Further, integrating elements of social evolutionary theory from evolutionary
anthropology highlights an underlying assumption of signaling theory that has not been as clearly
specified in management literature. Specifically, that the purpose of a signaler reducing information
asymmetry is to induce some desired cooperative behavior on the part of an intended receiver (Sosis
& Alcorta, 2003). In purely competitive environments, there would be no purpose to reducing
information asymmetry, because it would reduce competitive advantages of the signaler. With
this key assumption specified, the role of communication between social actors in entrepreneurial
ecosystems becomes clearer – coordinating activities (Stam, 2015). An important implication of
the use of SET is for researchers to remember, when making predictions about behaviors among
social actors in the environment, that SET operates at multiple levels of analysis simultaneously.
111
This implication finds support through some of the results in the dissertation which might seem
surprising at the ecosystem level, but which can be explained by behaviors at the individual level.
One such result is the finding that the interaction of many signals under conditions of resource
scarcity would lead to fewer firm failures. At the population level, logically, many signals about the
environment would suggest that the firms would be aware of how few resources are available and
thus, how bleak the situation might appear, which should lead to more failures, rather than fewer.
SET logic, however, suggests individuals in the firms would be motivated to seek out cooperative
relationships under these conditions, in order to ensure their survival, and solves issues caused by
pluralistic ignorance at the individual level.
Implications for Practice
The present study highlights the role and importance of communication for social actors
as signalers within entrepreneurial ecosystem. The findings of the present study suggest that
those social actors who have an interest in encouraging more entrepreneurial activity in the
form of firm creation and who also want to see more successful firms can influence this activity
through the appropriate use of signaling behavior. Social actors who ignore communication
place themselves at risk of both losing potential partners and missing important signals about
the EE itself. The results of this dissertation suggest that signalers should consider: 1) What they
say (content), 2) How they say it (valence), and 3) How often they say it (frequency), at least in
respect to how they say it.
Addressing the first point for signalers, proper calibration matters. The question signalers
need to ask of themselves is whether what they are saying accurately conveys the appropriate
information to the receivers, in this case potential entrepreneurs. As the results show, talking
about autonomy, proactiveness, innovativeness, competitive aggressiveness, and risk-taking in
media coverage of entrepreneurship may have the opposite effect on the potential entrepreneurs
in the ecosystem than expected. While the ecosystem-level social actors may want to get as many
new ventures founded as possible, and are willing to see new entrepreneurs taking risks, being
innovative, and being aggressive competitors, the individuals who are receiving those messages
may not feel the same way when they are the ones expected to exhibit those characteristics and
behaviors. From a practical standpoint, then, signalers should be careful to be accurate about
112
the environment in terms of entrepreneurial orientation, but should not over-emphasize it, or the
results suggest they will see a decline in new firm formation.
The second point addresses how they should talk about the content, in terms of valence,
positive or negative. It is not surprising to find that positive signals about entrepreneurship result in
more new firms being founded in entrepreneurial ecosystems. It is important to consider, however,
because coverage that is too unbalanced toward the positive can be harmful and signalers must
be cognizant of the valence of the signals they are sending to potential entrepreneurs. When
considering the importance of balanced valence signals, research has found that negative valence
articles are weighted approximately five times that of a positive article (Porter, Taylor, & Brinke,
2008) and that negative words actually convey more information than positive (Garcia et al., 2012).
Finally, the study suggests that how often signals are sent, especially when combined with
valence, makes a difference. When signalers send many positive signals, firm formations decrease,
and the effect of the frequency and valence interacts to make the effect stronger than either alone.
A few positive signals, and a balanced pattern of valence, produce more firm formations than
many positive signals do. This suggests that an important practical implication would be to take
the time to ensure that the signals sent are carefully calibrated, accurate, and balanced. In addition,
controlling the frequency of signals wherever possible is important for ensuring ecosystem
development. In summary, content, valence, and frequency of the signals being sent are important
for signalers interested in fostering entrepreneurship in their ecosystems.
Implications for Policy
Communication matters, and this is especially true for those engaged in the formulation
of policy. The same aspects of the signal apply to policymakers engaged in developing
entrepreneurship as they do to other signalers in the environment - content matters, positivity of
the signal matters, and the frequency of the signal matters in conjunction with positivity. The study
demonstrates that sending the signal has an impact, however there are significant interactions
that affect the impact of signal frequency. Signals must be consistent, calibrated in terms of
signal attributes and valence, and frequent enough to successfully reach the receivers with the
message intact. Policymakers, additionally, need to consider the broader population-level aspects
of the signals being sent, especially the aspects related to time and how long it might take for

113
potential entrepreneurs to engage in activities. This is particularly important when one considers
how policymaker might gauge the effectiveness of interventions they have put in place. The study
suggests that while some signals may be immediately effective, it could take up to three years to
see the results. Policymakers dealing with pressing concerns, such as re-election, and the desire
to see and report immediate results might be frustrated when results fail to materialize within the
same year the signal has been sent. Policymakers need to be aware of this lag effect and to build
it into their interventions in advance so that a lack of immediate results does not lead them to
terminate an otherwise successful intervention because they failed to wait long enough to see it to
fruition. Policymakers should also be aware of the potential impact across ecosystems, such that
signals sent in one may have an impact on their neighbors.
Conclusion
Objectives of this Research
• Objective 1: To develop a comprehensive and inclusive definition of entrepreneurial
ecosystems incorporating past research, one that emphasizes a multi-theoretical
approach to the phenomenon;
In Chapter 2, I identified a number of definitions that researchers have used to define the
nebulous construct of the entrepreneurial ecosystem. I integrated the most appropriate definitions
to emphasize the social nature of the entrepreneurial ecosystem, along with changing nature,
and the need for communication among social actors. Thus, incorporating the work of Aldrich
& Ruef (2006), Baumol (1993), and Stam (2015), I defined an entrepreneurial ecosystem as a co-
evolving population of interdependent social actors and factors coordinated (cooperating) through
communication in such a way that they enable productive entrepreneurship (Baumol, 1993; Aldrich
& Ruef, 2006; Stam, 2015).
• Objective 2: To integrate social evolutionary and signaling theory in the context
of entrepreneurial ecosystems to explain not just why cooperation occurs, but also the
mechanisms used to induce cooperation;

114
Using social evolutionary theory as my primary lens of analysis and interpretation, I was
able to integrate aspects of signaling theory into SET to explain the mechanisms that induce
cooperative behaviors between and among individuals. In Chapter 3, the hypothesis development
strongly relied upon the ecosystem level of analysis to define and explain cooperative and
competitive behaviors. In the ecosystem context, entrepreneurial activities, such as starting
new firms, involve cooperation, such as finding resources, seeking out information, and finally
engaging in business operations that involve dealing with suppliers, partners, customers, and
other stakeholders. The results of the study suggest that the individual level of analysis should
not be overlooked or under-emphasized, because cooperation and competition may be perceived
differently by individuals. Individuals confronted with signals about the highly competitive nature
of an ecosystem, for example, appear to choose cooperative behaviors that are consistent with SET,
such as remaining employed with other firms. Looked at from the ecosystem level, such behaviors
result in resources, human capital in this case, remaining locked within firms, and slow down the
speed of change, according to SET.
• Objective 3: To explore and understand the role of signals and communication in
entrepreneurial ecosystems;
Signals convey information to individuals within the entrepreneurial ecosystem and the
findings of the present study suggest that the frequency of the signals, their valence, and content
are important for inducing individual behavior. Aspects of the environment separate from the
signals appear to matter for their interpretation and importance as well, particularly the resource
availability in the ecosystem. Of particular interest, however, is the behavior of valence as it
interacts with the signal frequency. Rather than increasing numbers of positive signals resulting
in even more firms being formed, it appears that the communication pattern in the ecosystem
associated with a more balanced valence, containing both positive and negative signals, actually
encourages the formation of new firms. This is consistent with recent findings that negative words
actually provide more information (Garcia, Garas, & Schweitzer, 2012). Thus, the information
asymmetry between signalers and potential entrepreneurs may not be reduced in the presence of
universally positive signal valence.

115
• Objective 4: To provide support for the entrepreneurial ecosystem as an appropriate
level of analysis for entrepreneurship research;
For stakeholders in ecosystems interested in fostering more entrepreneurship and better
targeting their efforts at communication, the ecosystem level of analysis provides insights. A
takeaway from the present study regarding the aggregated level of analysis, however, is that
individual interpretation and behavior is still important to consider when making predictions about
the influence and reception of signals and their contents in communication. Methodologically,
the ecosystem level of analysis, especially in the U.S., but also globally, suffers from spatial
and temporal cross-correlation. There are psychological, cultural, and demographic variables,
such as culture or population movement, that alter the way the ecosystems influence one
another. Generally, the benefits of using the entrepreneurial ecosystem as a level of analysis
provides information about patterns of behavior in the ecosystem, as opposed to the behavior
of individuals, as evidenced by the present study and thus, under the right conditions, supports
using the ecosystem as a level of analysis.
Chapter Summary
In this chapter, I reviewed the results of the hypothesis testing, discussed the contributions
and implications of the findings for SET and signaling theory, and identified the boundary
conditions of the research, as well as a selection of directions for future research. I highlighted
implications for research, practice, and policy. Finally, I concluded the chapter and the dissertation
with a review of the research objectives set forth in Chapter 1 and identified how the dissertation
addressed each of these objectives.

116
LIST OF REFERENCES
117
Acs, Z., & Szerb, L. 2007. Entrepreneurship, Economic Growth and Public Policy. Small Business Economics, 28(2-3): 109-122.
Acs, Z. J., & Armington, C. 2006. Entrepreneurship, geography, and American economic growth: Cambridge University Press.
Ács, Z. J., Autio, E., & Szerb, L. 2014. National systems of entrepreneurship: Measurement issues and policy implications. Research Policy, 43(3): 476-494.
Acs, Z. J., Braunerhjelm, P., Audretsch, D. B., & Carlsson, B. 2009. The knowledge spillover theory of entrepreneurship. Small Business Economics, 32(1): 15-30.
Acs, Z. J., Estrin, S., Mickiewicz, T., & Szerb, L. 2014. The Continued Search for the Solow Residual: The Role of National Entrepreneurial Ecosystem.
Ahern, K. R., & Sosyura, D. 2014. Who writes the news? Corporate press releases during merger negotiations. The Journal of Finance, 69(1): 241-291.
Akerlof, G. 1970. The Market for Lemons: Quality Uncertainty and the Market Mechanism. Quarterly Journal of Economics, 89.
Aldrich, H. 1999. Organizations evolving: Sage.Aldrich, H., McKelvey, B., & Ulrich, D. 1984. Design strategy from the population perspective.
Journal of Management, 10(1): 67-86.Aldrich, H. E. 1990. Using an ecological perspective to study organizational founding rates.
Entrepreneurship Theory and practice, 14(3): 7-24.Aldrich, H. E., & Martinez, M. A. 2001. Many are Called, but Few are Chosen: An Evolutionary
Perspective for the Study of Entrepreneurship. Entrepreneurship: Theory & Practice, 25(4): 41.
Aldrich, H. E., & Martinez, M. A. 2010. Entrepreneurship as social construction: a multilevel evolutionary approach, Handbook of entrepreneurship research: 387-427: Springer.
Aldrich, H. E., & Yang, T. 2012. Lost in translation: Cultural codes are not blueprints. Strategic Entrepreneurship Journal, 6(1): 1-17.
Aldrich Howard, E., & Ruef, M. 2006. Organizations evolving: TJ International Ltd.–Padstow, Cornwell.
Alvarez, S. A., & Barney, J. B. 2007. Discovery and creation: Alternative theories of entrepreneurial action. Strategic entrepreneurship journal, 1(1‐2): 11-26.
Alvarez, S. A., & Busenitz, L. W. 2001. The entrepreneurship of resource-based theory. Journal of management, 27(6): 755-775.
Ardichvili, A., Cardozo, R., & Ray, S. 2003. A theory of entrepreneurial opportunity identification and development. Journal of Business venturing, 18(1): 105-123.
Arruda, C., Nogueira, V. S., Cozzi, A., & Costa, V. 2015. The Brazilian Entrepreneurial Ecosystem of Startups: An Analysis of Entrepreneurship Determinants in Brazil and the Perceptions Around the Brazilian Regulatory Framework, Entrepreneurship in BRICS: 9-26: Springer.
Arthur, W. B. 1989. Competing technologies, increasing returns, and lock-in by historical events. The economic journal, 99(394): 116-131.
118
Arthur, W. B. 1990. ‘Silicon Valley’locational clusters: when do increasing returns imply monopoly? Mathematical social sciences, 19(3): 235-251.
Audretsch, B. 1998. Agglomeration and the location of innovative activity. Oxford review of economic policy, 14(2): 18-29.
Audretsch, D., Dohse, D., & Niebuhr, A. 2009. Cultural diversity and entrepreneurship: a regional analysis for Germany. The Annals of Regional Science, 45(1): 55-85.
Audretsch, D., & Keilbach, M. 2004. Entrepreneurship capital and economic performance. Regional studies, 38(8): 949-959.
Audretsch, D. B. 1991. New-firm survival and the technological regime. The Review of Economics and Statistics: 441-450.
Audretsch, D. B., Bönte, W., & Keilbach, M. 2008. Entrepreneurship capital and its impact on knowledge diffusion and economic performance. Journal of Business Venturing, 23(6): 687-698.
Audretsch, D. B., & Feldman, M. P. 1996. R&D spillovers and the geography of innovation and production. The American economic review, 86(3): 630-640.
Audretsch, D. B., Grilo, I., & Thurik, A. R. 2007. Explaining entrepreneurship and the role of policy: a framework. The handbook of research on entrepreneurship policy: 1-17.
Audretsch, D. B., & Keilbach, M. 2005. Entrepreneurship capital and regional growth. The Annals of Regional Science, 39(3): 457-469.
Audretsch, D. B., & Keilbach, M. 2007. The Theory of Knowledge Spillover Entrepreneurship*. Journal of Management Studies, 44(7): 1242-1254.
Ausubel, J. H., & Langford, H. D. 1997. Technological trajectories and the human environment: National Academies Press.
Bahl, R. W., Firestine, R., & Phares, D. 1971. Industrial diversity in urban areas: Alternative measures and intermetropolitan comparisons. Economic Geography, 47(3): 414-425.
Bahrami, H., & Evans, S. 1995. Flexible re-cycling and high-technology entrepreneurship. California Management Review, 37(3): 62-89.
Balboa, M., & Martí, J. 2007. Factors that determine the reputation of private equity managers in developing markets. Journal of Business Venturing, 22(4): 453-480.
Baltagi, B. 2008. Econometric analysis of panel data: John Wiley & Sons.Bandura, A. 2001. Social cognitive theory of mass communication. Media psychology, 3(3): 265-
299.Baptista, R. 2000. Do innovations diffuse faster within geographical clusters? International
Journal of industrial organization, 18(3): 515-535.Barnett, W. P., & Carroll, G. R. 1987. Competition and mutualism among early telephone companies.
Administrative Science Quarterly: 400-421.Barney, J. 1991. Firm resources and sustained competitive advantage. Journal of management,
17(1): 99-120.

119
Barro, R. J., & Lee, J. W. 2013. A new data set of educational attainment in the world, 1950–2010. Journal of development economics, 104: 184-198.
Bartik, T. J. 1991. Boon or Boondoggle? The debate over state and local economic development policies.
Bartik, T. J. 2011. Including jobs in benefit-cost analysis. Annual Review of Resource Economics, Forthcoming.
Bartik, T. J. 2015. The social value of job loss and its effect on the costs of US environmental regulations. Review of Environmental Economics and Policy, 9(2): 179-197.
Basdeo, D. K., Smith, K. G., Grimm, C. M., Rindova, V. P., & Derfus, P. J. 2006. The impact of market actions on firm reputation. Strategic Management Journal, 27(12): 1205-1219.
Baum, J. A., & Korn, H. J. 1999. Dynamics of dyadic competitive interaction. Strategic Management Journal, 20(3): 251-278.
Baumol, W. J. 1990. Entrepreneurship: Productive, Unproductive, and Destructive. Journal of Political Economy, 98(5): 893-921.
Baumol, W. J. 1993. Formal entrepreneurship theory in economics: Existence and bounds. Journal of business venturing, 8(3): 197-210.
Baumol, W. J. 1996. Entrepreneurship: Productive, unproductive, and destructive. Journal of Business Venturing, 11(1): 3-22.
Beaudry, C., & Schiffauerova, A. 2009. Who’s right, Marshall or Jacobs? The localization versus urbanization debate. Research policy, 38(2): 318-337.
Beine, M., Docquier, F., & Rapoport, H. 2008. Brain drain and human capital formation in developing countries: Winners and losers*. The Economic Journal, 118(528): 631-652.
Bell, R. G., Moore, C. B., & Al‐Shammari, H. A. 2008. Country of origin and foreign IPO legitimacy: Understanding the role of geographic scope and insider ownership. Entrepreneurship Theory and Practice, 32(1): 185-202.
Belleflamme, P., Picard, P., & Thisse, J.-F. 2000. An economic theory of regional clusters. Journal of Urban Economics, 48(1): 158-184.
Benhabib, J., & Spiegel, M. M. 1994. The role of human capital in economic development evidence from aggregate cross-country data. Journal of Monetary economics, 34(2): 143-173.
Beugelsdijk, S. 2007. The regional environment and a firm’s innovative performance: a plea for a multilevel interactionist approach. Economic Geography, 83(2): 181-199.
Beugelsdijk, S., Maseland, R., & Van Hoorn, A. 2013. Are Hofstede’s Culture Dimensions Stable Over Time? A Generational Cohort Analysis. A Generational Cohort Analysis (October 7, 2013).
Bhappu, A. D. 2000. The Japanese family: An institutional logic for Japanese corporate networks and Japanese management. Academy of Management Review, 25(2): 409-415.
Birchler, U., & Bütler, M. 2007. Information economics: Routledge.

120
Bird, R. B., Smith, E., Alvard, M., Chibnik, M., Cronk, L., Giordani, L., Hagen, E., Hammerstein, P., Neiman, F., & Bird, R. 2005. Signaling theory, strategic interaction, and symbolic capital 1. Current anthropology, 46(2): 221-248.
Block, J. H., & Sandner, P. 2011. Venture capital funding in the middle of the year 2011: are we back to pre‐crisis boom levels? Strategic Change, 20(5‐6): 161-169.
Bosma, N., & Holvoet, T. 2015. The Role of Culture in Entrepreneurial Ecosystems: An Investigation for European Regions. Paper presented at the 6th Annual George Washington University (GWU)-International Council for Small Business (ICSB) Global Entrepreneurship Research and Policy Conference.
Braunerhjelm, P., & Carlsson, B. 1999. Industry Clusters in Ohio and Sweden, 1975--1995. Small Business Economics, 12(4): 279-293.
Breslin, D. 2008. A review of the evolutionary approach to the study of entrepreneurship. International Journal of Management Reviews, 10(4): 399-423.
Brown, N., & Deegan, C. 1998. The public disclosure of environmental performance information—a dual test of media agenda setting theory and legitimacy theory. Accounting and business research, 29(1): 21-41.
Bruederl, J., Preisend, Peter, & Ziegler, R. 1992. Survival Chances of Newly Founded Business Organizations. American Sociological Review, 57(2): 227-242.
Bruton, G. D., Ahlstrom, D., & Li, H. L. 2010. Institutional theory and entrepreneurship: where are we now and where do we need to move in the future? Entrepreneurship Theory and Practice, 34(3): 421-440.
Busenitz, L. W., Fiet, J. O., & Moesel, D. D. 2005. Signaling in Venture Capitalist—New Venture Team Funding Decisions: Does It Indicate Long‐Term Venture Outcomes? Entrepreneurship Theory and Practice, 29(1): 1-12.
Buss, D. M. 2009. How can evolutionary psychology successfully explain personality and individual differences? Perspectives on Psychological Science, 4(4): 359-366.
Carree, M., Van Stel, A., Thurik, R., & Wennekers, S. 2007. The relationship between economic development and business ownership revisited. Entrepreneurship & regional development, 19(3): 281-291.
Carree, M. A., & Thurik, A. R. 2003. The impact of entrepreneurship on economic growth, Handbook of entrepreneurship research: 437-471: Springer.
Carroll, G. R., & Hannan, M. T. 1989. Density delay in the evolution of organizational populations: A model and five empirical tests. Administrative Science Quarterly: 411-430.
Carroll, G. R., & Wade, J. 1991. Density dependence in the organizational evolution of the American brewing industry across different levels of analysis. Social Science Research, 20(3): 271-302.
Carsrud, A. L., & Johnson, R. W. 1989. Entrepreneurship: a social psychological perspective. Entrepreneurship & Regional Development, 1(1): 21-31.
Carter, S. M. 2006. The Interaction of Top Management Group, Stakeholder, and Situational Factors on Certain Corporate Reputation Management Activities*. Journal of Management Studies, 43(5): 1145-1176.

121
Certo, S. T. 2003. Influencing initial public offering investors with prestige: Signaling with board structures. Academy of management review, 28(3): 432-446.
Certo, S. T., Covin, J. G., Daily, C. M., & Dalton, D. R. 2001. Wealth and the effects of founder management among IPO‐stage new ventures. Strategic management journal, 22(6‐7): 641-658.
Chandler, G. N., & Hanks, S. H. 1994. Founder competence, the environment, and venture performance. Entrepreneurship: Theory and Practice, 18(3): 77-90.
Chow, G. C. 1960. Tests of equality between sets of coefficients in two linear regressions. Econometrica: Journal of the Econometric Society: 591-605.
Chung, W., & Kalnins, A. 2001. Agglomeration effects and performance: A test of the Texas lodging industry. Strategic Management Journal, 22(10): 969-988.
Cochrane, D., & Orcutt, G. H. 1949. Application of least squares regression to relationships containing auto-correlated error terms. Journal of the American Statistical Association, 44(245): 32-61.
Coff, R. W. 2002. Human capital, shared expertise, and the likelihood of impasse in corporate acquisitions. Journal of Management, 28(1): 107-128.
Connelly, B. L., Certo, S. T., Ireland, R. D., & Reutzel, C. R. 2011. Signaling theory: A review and assessment. Journal of Management, 37(1): 39-67.
Crook, T. R., Ketchen, D. J., Combs, J. G., & Todd, S. Y. 2008. Strategic resources and performance: a meta‐analysis. Strategic management journal, 29(11): 1141-1154.
Daneke, G. A. 1985. Small business policy amid state level economic development planning. Policy Studies Journal, 13(4): 722-728.
Darwin, C. 1859. On the origin of species by means of natural selection, or the preservation of favoured races in the struggle for life. New York, NY: D. Appleton and Company.
Davidsson, P. 1995. Determinants of entrepreneurial intentions.Davidsson, P. 2005. What is Entrepreneurship? Researching Entrepreneurship: 1-16.Davidsson, P., & Honig, B. 2003. The role of social and human capital among nascent entrepreneurs.
Journal of business venturing, 18(3): 301-331.Davidsson, P., & Wiklund, J. 1997. Values, beliefs and regional variations in new firm formation
rates. Journal of Economic psychology, 18(2): 179-199.Davis, G. F. 2010. Do theories of organizations progress? Organizational Research Methods.De Carolis, D. M., Litzky, B. E., & Eddleston, K. A. 2009. Why networks enhance the progress
of new venture creation: The influence of social capital and cognition. Entrepreneurship theory and practice, 33(2): 527-545.
DeCarolis, D. M., & Deeds, D. L. 1999. The impact of stocks and flows of organizational knowledge on firm performance: An empirical investigation of the biotechnology industry. Strategic management journal, 20(10): 953-968.
Deephouse, D. L. 1996. Does isomorphism legitimate? Academy of management journal, 39(4): 1024-1039.

122
Deephouse, D. L. 2000. Media reputation as a strategic resource: An integration of mass communication and resource-based theories. Journal of management, 26(6): 1091-1112.
Deephouse, D. L., & Heugens, P. P. 2009. Linking social issues to organizational impact: The role of infomediaries and the infomediary process. Journal of Business Ethics, 86(4): 541-553.
Delgado, M., Ketels, C., Porter, M. E., & Stern, S. 2012. The determinants of national competitiveness: National Bureau of Economic Research.
Delgado, M., Porter, M. E., & Stern, S. 2010. Clusters and entrepreneurship. Journal of Economic Geography: lbq010.
Delgado, M., Porter, M. E., & Stern, S. 2014. Clusters, convergence, and economic performance. Research Policy, 43(10): 1785-1799.
Delmar, F., & Shane, S. 2003. Does business planning facilitate the development of new ventures? Strategic management journal, 24(12): 1165-1185.
Dickey, D. A., & Fuller, W. A. 1979. Distribution of the estimators for autoregressive time series with a unit root. Journal of the American statistical association, 74(366a): 427-431.
DiMaggio, P. J., & Powell, W. W. 1983. The iron cage revisited: Institutional isomorphism and collective rationality in organizational fields. American sociological review: 147-160.
Dissart, J. C. 2003. Regional economic diversity and regional economic stability: research results and agenda. International Regional Science Review, 26(4): 423-446.
Djankov, S., Qian, Y., Roland, G., & Zhuravskaya, E. 2006. Entrepreneurship in China and Russia compared. Journal of the European Economic Association, 4(2‐3): 352-365.
Driscoll, J. C., & Kraay, A. C. 1998. Consistent covariance matrix estimation with spatially dependent panel data. Review of economics and statistics, 80(4): 549-560.
Duval-Couetil, N., & Hutcheson, S. 2015. Nurturing an entrepreneurial ecosystem in the Midwest of the United States. Entrepreneurship and Knowledge Exchange, 7: 217.
Ehrenfeld, J., & Gertler, N. 1997. Industrial ecology in practice: the evolution of interdependence at Kalundborg. Journal of industrial Ecology, 1(1): 67-79.
Ehrenfeld, J. R. 2000. Industrial Ecology Paradigm Shift or Normal Science? American Behavioral Scientist, 44(2): 229-244.
Ehrhart, K. H., & Ziegert, J. C. 2005. Why are individuals attracted to organizations? Journal of management, 31(6): 901-919.
Enders, W. 2008. Applied econometric time series: John Wiley & Sons.Esty, D. C., & Porter, M. E. 1998. Industrial ecology and competitiveness. Journal of Industrial
Ecology, 2(1): 35-43.Feld, B. 2012. Startup communities: Building an entrepreneurial ecosystem in your city: John
Wiley & Sons.Feldman, M. P. 1999. The new economics of innovation, spillovers and agglomeration: Areview of
empirical studies. Economics of innovation and new technology, 8(1-2): 5-25.Feldman, M. P. 2000. Location and innovation: the new economic geography of innovation,
spillovers, and agglomeration. The Oxford handbook of economic geography: 373-394.

123
Filatotchev, I., & Bishop, K. 2002. Board composition, share ownership, and ‘underpricing’of UK IPO firms. Strategic Management Journal, 23(10): 941-955.
Fischer, E., & Reuber, R. 2007. The good, the bad, and the unfamiliar: The challenges of reputation formation facing new firms. Entrepreneurship Theory and Practice, 31(1): 53-75.
Fishman, E. A., O’SHEA, R. P., & ALLEN, T. 2014. Creating the MIT entrepreneurial ecosystem. Building Technology Transfer within Research Universities: An Entrepreneurial Approach: 60.
Flora, C. B., & Flora, J. L. 1993. Entrepreneurial social infrastructure: A necessary ingredient. The Annals of the American Academy of Political and Social Science, 529(1): 48-58.
Flora, J. L., Sharp, J., Flora, C., & Newlon, B. 1997. Entrepreneurial social infrastructure and locally initiated economic development in the nonmetropolitan United States. The Sociological Quarterly, 38(4): 623-645.
Florida, R. 1994. Agglomeration and industrial location: An econometric analysis of Japanese-affiliated manufacturing establishments in automotive-related industries. Journal of Urban Economics, 36(1): 23-41.
Florida, R. 2002. The rise of the creative class. And how it’s transforming work, leisure and everyday life: New York: Basic Books.
Fombrun, C., & Shanley, M. 1990. What’s in a name? Reputation building and corporate strategy. Academy of management Journal, 33(2): 233-258.
Fombrun, C. J. 1996. Reputation: Realizing value from the corporate image: Harvard Business Press.
Friedland, R., & Alford, R. R. 1991. Bringing society back in: Symbols, practices and institutional contradictions.
Fritsch, M., & Mueller, P. 2004. Effects of new business formation on regional development over time. Regional Studies, 38(8): 961-975.
Frosch, R. A., & Gallopoulos, N. E. 1989. Strategies for manufacturing. Scientific American, 261(3): 144-152.
Gallopoulos, N. E. 2006. Industrial ecology: an overview. Progress in Industrial Ecology, an International Journal, 3(1-2): 10-27.
Gartner, W. B. 2001. Is there an elephant in entrepreneurship? Blind assumptions in theory development. Entrepreneurship: Theory and practice, 25(4): 27-40.
Gilbert, B. A., Audretsch, D. B., & McDougall, P. P. 2004. The emergence of entrepreneurship policy. Small Business Economics, 22(3-4): 313-323.
Gilbert, B. A., McDougall, P. P., & Audretsch, D. B. 2006. New venture growth: A review and extension. Journal of management, 32(6): 926-950.
Glaeser, E. L., Kallal, H. D., Scheinkman, J. A., & Shleifer, A. 1992. Growth in cities: National Bureau of Economic Research.
Gould, M., Jamieson, P., & Romer, D. 2003. Media contagion and suicide among the young. American Behavioral Scientist, 46(9): 1269-1284.

124
Granger, C. W. 1969. Investigating causal relations by econometric models and cross-spectral methods. Econometrica: Journal of the Econometric Society: 424-438.
Granger, C. W. 1988. Some recent development in a concept of causality. Journal of econometrics, 39(1): 199-211.
Granger, C. W., & Huang, L.-L. 1997. Evaluation of Panel Data Models: Some suggestions from time series.
Granovetter, M. S. 1973. The strength of weak ties. American journal of sociology: 1360-1380.Green, W. H. 2008. Discrete choice modelling. Handbook of Econometrics, 2.Gulati, R., & Higgins, M. C. 2003. Which ties matter when? The contingent effects of
interorganizational partnerships on IPO success. Strategic Management Journal, 24(2): 127-144.
Gunther McGrath, R., & Nerkar, A. 2004. Real options reasoning and a new look at the R&D investment strategies of pharmaceutical firms. Strategic Management Journal, 25(1): 1-21.
Hannan, M. T., & Freeman, J. 1977. The population ecology of organizations. American journal of sociology: 929-964.
Hanson, G. H. 2001. Scale economies and the geographic concentration of industry. Journal of Economic Geography, 1(3): 255-276.
Haveman, H. A., & Rao, H. 1997. Structuring a theory of moral sentiments: institutional and organizational coevolution in the early thrift industry 1. American Journal of Sociology, 102(6): 1606-1651.
Hawley, A. H. 1986. Human ecology: A theoretical essay: University of Chicago Press.Hayek, F. A. 1945. The use of knowledge in society. The American economic review: 519-530.Haynie, M., & Shepherd, D. A. 2009. A measure of adaptive cognition for entrepreneurship
research. Entrepreneurship Theory and Practice, 33(3): 695-714.Hayward, M. L., Rindova, V. P., & Pollock, T. G. 2004. Believing one’s own press: The causes and
consequences of CEO celebrity. Strategic Management Journal, 25(7): 637-653.Hayward, M. L., Shepherd, D. A., & Griffin, D. 2006. A hubris theory of entrepreneurship.
Management Science, 52(2): 160-172.Hechavarria, D. M., & Ingram, A. 2014. A Review of the Entrepreneurial Ecosystem and
the Entrepreneurial Society in the United States: An Exploration with the Global Entrepreneurship Monitor Dataset. Journal of Business and Entrepreneurship, 26(1): 1.
Henderson, J. V. 1974. The sizes and types of cities. The American Economic Review, 64(4):640-656.Henderson, J. V. 2003. Marshall’s scale economies. Journal of urban economics, 53(1): 1-28.Henrekson, M., & Stenkula, M. 2010. Entrepreneurship and public policy, Handbook of
entrepreneurship research: 595-637: Springer.Higgins, M. C., & Gulati, R. 2006. Stacking the deck: The effects of top management backgrounds
on investor decisions. Strategic Management Journal, 27(1): 1-25.Highhouse, S., Thornbury, E. E., & Little, I. S. 2007. Social-identity functions of attraction to
organizations. Organizational Behavior and Human Decision Processes, 103(1): 134-146.

125
Hindle, K., & Klyver, K. 2007. Exploring the relationship between media coverage and participation in entrepreneurship: Initial global evidence and research implications. International entrepreneurship and management journal, 3(2): 217-242.
Hochwarter, W. A., Ferris, G. R., Zinko, R., Arnell, B., & James, M. 2007. Reputation as a moderator of political behavior-work outcomes relationships: A two-study investigation with convergent results. Journal of Applied Psychology, 92(2): 567-576.
Hoechle, D. 2007. Robust standard errors for panel regressions with cross-sectional dependence. Stata Journal, 7(3): 281.
Hofstede, G. H., & Hofstede, G. 2001. Culture’s consequences: Comparing values, behaviors, institutions and organizations across nations: Sage.
Holtz-Eakin, D. 2000. Public Policy Toward Entrepreneurship. Small Business Economics, 15(4): 283-291.
Huber, P. J. 1967. The behavior of maximum likelihood estimates under nonstandard conditions. Paper presented at the Proceedings of the fifth Berkeley symposium on mathematical statistics and probability.
Isaksen, A., & Onsager, K. 2010. Regions, networks and innovative performance: The case of knowledge-intensive industries in Norway. European Urban and Regional Studies, 17(3): 227-243.
Isenberg, D. J. 2010. How to start an entrepreneurial revolution. Harvard Business Review, 88(6): 40-50.Jackall, R. 1988. Moral mazes: The world of corporate managers. International Journal of Politics,
Culture, and Society, 1(4): 598-614.Jacobs, J. 1969. The economy of cities. Vintage, New York.Jain, B. A., Jayaraman, N., & Kini, O. 2008. The path-to-profitability of Internet IPO firms. Journal
of Business Venturing, 23(2): 165-194.Janis, I. L., & Fadner, R. H. 1943. A coefficient of imbalance for content analysis. Psychometrika,
8(2): 105-119.Janney, J. J., & Folta, T. B. 2003. Signaling through private equity placements and its impact on the
valuation of biotechnology firms. Journal of Business Venturing, 18(3): 361-380.Janney, J. J., & Folta, T. B. 2006. Moderating effects of investor experience on the signaling value
of private equity placements. Journal of Business Venturing, 21(1): 27-44.Jenkins, H. 2006. Convergence culture: Where old and new media collide: NYU press.Keller, K. L. 1993. Conceptualizing, measuring, and managing customer-based brand equity. the
Journal of Marketing: 1-22.Ketels, C., Lindqvist, G., & Sölvell, Ö. 2012. Strengthening clusters and competitiveness in Europe.
The role of cluster organisations. Stockholm: Center for Strategy and Competitiveness.Keuschnigg, C., & Nielsen, S. B. 2003. Tax policy, venture capital, and entrepreneurship. Journal
of Public Economics, 87(1): 175-203.Kim, L., & Nugent, J. 1999. Korean SMEs and their support mechanisms, Fulfilling the Export
potential of small and medium Firms: 115-167: Springer.
126
King, A. W. 2007. Disentangling interfirm and intrafirm causal ambiguity: A conceptual model of causal ambiguity and sustainable competitive advantage. Academy of Management Review, 32(1): 156-178.
Kirzner, I. M. 1997. Entrepreneurial discovery and the competitive market process: An Austrian approach. Journal of economic Literature, 35(1): 60-85.
Knight, F. H. 1921. Risk, uncertainty and profit. New York: Hart, Schaffner and Marx.Kogut, B., & Zander, U. 1993. Knowledge of the firm and the evolutionary theory of the multinational
corporation. Journal of international business studies: 625-645.Konczal, J. 2013. The Most Entrepreneurial Metropolitan Area? Available at SSRN 2357701.Korhonen, J. 2001. Four ecosystem principles for an industrial ecosystem. Journal of Cleaner
Production, 9(3): 253-259.Korhonen, J. 2004. Industrial ecology in the strategic sustainable development model: strategic
applications of industrial ecology. Journal of Cleaner Production, 12(8): 809-823.Kort, J. R. 1981. Regional economic instability and industrial diversification in the US. Land
Economics, 57(4): 596-608.Krueger, N., Reilly, M., & Carsrud, A. 2000. Entrepreneurial intentions: A competing models
approach. Journal of Business Venturing, 15(5/6): 411-432.Krueger, N. F. 2012. Markers of a Healthy Entrepreneurial Ecosystem. Available at SSRN 2056182.Krugman, P. R. 1991. Geography and trade: MIT press.Kukalis, S. 2009. Agglomeration economies and firm performance: the case of industry clusters.
Journal of Management.Lam, C. F., Liang, J., Ashford, S. J., & Lee, C. 2015. Job insecurity and organizational citizenship
behavior: Exploring curvilinear and moderated relationships. Journal of Applied Psychology, 100(2): 499.
Lampel, J., & Shamsie, J. 2000. Critical push: Strategies for creating momentum in the motion picture industry. Journal of Management, 26(2): 233-257.
Laws, D. 2010. A Company of Legend;: The Legacy of Fairchild Semiconductor.Lerner, J. 1999. The Government as Venture Capitalist: The Long-Run Impact of the SBIR
Program*. The Journal of Business, 72(3): 285-318.Lichtenstein, G. A., & Lyons, T. S. 2001. The entrepreneurial development system: Transforming
business talent and community economies. Economic Development Quarterly, 15(1): 3-20.Lievens, F., & Highhouse, S. 2003. The relation of instrumental and symbolic attributes to a
company’s attractiveness as an employer. Personnel Psychology, 56(1): 75-102.Lifset, R., & Graedel, T. E. 2002. Industrial ecology: goals and definitions. A handbook of
industrial ecology: 3-15.Lindqvist, G. 2009. Disentangling clusters: agglomeration and proximity effects.Lomi, A. 1995. The population ecology of organizational founding: Location dependence and
unobserved heterogeneity. Administrative Science Quarterly: 111-144.
127
Lounsbury, M. 2002. Institutional transformation and status mobility: The professionalization of the field of finance. Academy of Management Journal, 45(1): 255-266.
Lounsbury, M., & Glynn, M. A. 2001. Cultural entrepreneurship: Stories, legitimacy, and the acquisition of resources. Strategic management journal, 22(6‐7): 545-564.
Low, M. B., & MacMillan, I. C. 1988. Entrepreneurship: Past research and future challenges. Journal of management, 14(2): 139-161.
Lowe, E. A., & Evans, L. K. 1995. Industrial ecology and industrial ecosystems. Journal of cleaner production, 3(1): 47-53.
Lucas, R. E. 1988. On the mechanics of economic development. Journal of monetary economics, 22(1): 3-42.
Lumpkin, G. T., & Dess, G. G. 1996. Clarifying the entrepreneurial orientation construct and linking it to performance. Academy of management Review, 21(1): 135-172.
Malecki, E. J. 1997. Technology and economic development: the dynamics of local, regional, and national change. University of Illinois at Urbana-Champaign’s Academy for Entrepreneurial Leadership Historical Research Reference in Entrepreneurship.
Manimala, M. J., & Wasdani, K. P. 2015. Emerging Economies: Muddling Through to Development, Entrepreneurial Ecosystem: 3-53: Springer.
Margulis, L. 1971. The Origin of Plant and Animal Cells: The serial symbiosis view of the origin of higher cells suggests that the customary division of living things into two kingdoms should be reconsidered. American scientist: 230-235.
Markusen, A. 2013. How cities can nurture cultural entrepreneurs. Available at SSRN 2357724.Marshall, A. 1920. Principles of economics: an introductory volume.Martin, B. C., McNally, J. J., & Kay, M. J. 2013. Examining the formation of human capital in
entrepreneurship: A meta-analysis of entrepreneurship education outcomes. Journal of Business Venturing, 28(2): 211-224.
Martin, R., & Sunley, P. 2003. Deconstructing clusters: chaotic concept or policy panacea? Journal of economic geography, 3(1): 5-35.
Martinez, M. A., & Aldrich, H. E. 2011. Networking strategies for entrepreneurs: balancing cohesion and diversity. International Journal of Entrepreneurial Behavior & Research, 17(1): 7-38.
Mason, S., & Howard, D. 2010. Regional industry diversity and its impact on regional unemployment.McCann, B. T., & Folta, T. B. 2008. Location matters: where we have been and where we might go
in agglomeration research. Journal of Management, 34(3): 532-565.McCombs, M. 1978. Agenda setting function of mass media. Public Relations Review, 3(4): 89-95.McCombs, M. E., & Shaw, D. L. 1972. The agenda-setting function of mass media. Public opinion
quarterly, 36(2): 176-187.McGregor, P. K., & Peake, T. M. 2000. Communication networks: social environments for receiving
and signalling behaviour. Acta ethologica, 2(2): 71-81.

128
McKelvey, B., & Aldrich, H. 1983. Populations, natural selection, and applied organizational science. Administrative Science Quarterly: 101-128.
McKeon, T. K. 2013. A College’s Role in Developing and Supporting an Entrepreneurship Ecosystem. Journal of Higher Education Outreach and Engagement, 17(3): 85-90.
McMullen, J. S., & Shepherd, D. A. 2006. Entrepreneurial action and the role of uncertainty in the theory of the entrepreneur. Academy of Management review, 31(1): 132-152.
Meyer, J. W., Rowan, B., Powell, W., & DiMaggio, P. 1991. The new institutionalism in organizational analysis. The new institutionalism in organizational analysis.
Michael, S. C. 2009. Entrepreneurial signaling to attract resources: the case of franchising. Managerial and Decision Economics, 30(6): 405-422.
Miller, D. 1983. The correlates of entrepreneurship in three types of firms. Management science, 29(7): 770-791.
Miller, D. 2011. Miller (1983) revisited: A reflection on EO research and some suggestions for the future. Entrepreneurship Theory and Practice, 35(5): 873-894.
Miller, D., Breton‐Miller, L., & Lester, R. H. 2011. Family and lone founder ownership and strategic behaviour: Social context, identity, and institutional logics. Journal of Management Studies, 48(1): 1-25.
Minniti, M., & Lévesque, M. 2008. Recent developments in the economics of entrepreneurship. Journal of Business venturing, 23(6): 603-612.
Moss, T. W., Neubaum, D. O., & Meyskens, M. 2015. The effect of virtuous and entrepreneurial orientations on microfinance lending and repayment: A signaling theory perspective. Entrepreneurship Theory and Practice, 39(1): 27-52.
Motoyama, Y., & Bell-Masterson, J. 2014. Beyond metropolitan startup rates: Regional factors associated with startup growth. Ewing Marion Kauffman Foundation.
Motoyama, Y., Konczal, J., Bell-Masterson, J., & Morelix, A. 2014. Think locally, act locally: Building a robust entrepreneurial ecosystem. Act Locally: Building a Robust Entrepreneurial Ecosystem (April 2014).
Navis, C., & Glynn, M. A. 2010. How new market categories emerge: Temporal dynamics of legitimacy, identity, and entrepreneurship in satellite radio, 1990–2005. Administrative Science Quarterly, 55(3): 439-471.
Nayyar, P. R. 1990. Information asymmetries: A source of competitive advantage for diversified service firms. Strategic Management Journal, 11(7): 513-519.
Ndofor, H. A., & Levitas, E. 2004. Signaling the strategic value of knowledge. Journal of Management, 30(5): 685-702.
Newey, W. K., & West, K. D. 1986. A simple, positive semi-definite, heteroskedasticity and autocorrelationconsistent covariance matrix: National Bureau of Economic Research Cambridge, Mass., USA.
Nicholls, A. 2010. The Legitimacy of Social Entrepreneurship: Reflexive Isomorphism in a Pre‐Paradigmatic Field. Entrepreneurship Theory and Practice, 34(4): 611-633.

129
Nissan, E., & Carter, G. 2010. Shannon Measure of Industrial Specialization at the State Level. Southwestern Economic Review, 37(1): 29-45.
Nowak, M., & Sigmund, K. 1993. A strategy of win-stay, lose-shift that outperforms tit-for-tat in the Prisoner’s Dilemma game. Nature, 364(6432): 56-58.
Nowak, M. A. 2006. Five rules for the evolution of cooperation. science, 314(5805): 1560-1563.Nowak, M. A., & May, R. M. 1992. Evolutionary games and spatial chaos. Nature, 359(6398):
826-829.Nowak, M. A., & Sigmund, K. 1998. Evolution of indirect reciprocity by image scoring. Nature,
393(6685): 573-577.Ocasio, W., & Thornton, P. H. 1999. Institutional logics and the historical contingency of power
in organizations: Executive succession in the higher education publishing industry, 1958-1990. Amer. J. Sociology, 105(3): 801-843.
Park, N. K., & Mezias, J. M. 2005. Before and after the technology sector crash: The effect of environmental munificence on stock market response to alliances of e‐commerce firms. Strategic Management Journal, 26(11): 987-1007.
Parker, S. C. 2004. The economics of self-employment and entrepreneurship: Cambridge University Press.
Parker, S. C. 2008. The economics of formal business networks. Journal of Business Venturing, 23(6): 627-640.
Pennebaker, J. W., Booth, R. J., & Francis, M. E. 2007. LIWC2007: Linguistic inquiry and word count. Austin, Texas: liwc. net.
Perkins, S. J., & Hendry, C. 2005. Ordering Top Pay: Interpreting the Signals*. Journal of Management Studies, 42(7): 1443-1468.
Pfarrer, M. D., Smith, K. G., Bartol, K. M., Khanin, D. M., & Zhang, X. 2008. Coming forward: The effects of social and regulatory forces on the voluntary restatement of earnings subsequent to wrongdoing. Organization Science, 19(3): 386-403.
Phillips, D. P. 1986. Natural experiments on the effects of mass media violence on fatal aggression: Strengths and weaknesses of a new approach. Advances in experimental social psychology, 19: 207-250.
Pitelis, C. 2012. Clusters, entrepreneurial ecosystem co-creation, and appropriability: a conceptual framework. Industrial and Corporate Change: dts008.
Pollock, T. G., & Rindova, V. P. 2003. Media legitimation effects in the market for initial public offerings. Academy of Management Journal, 46(5): 631-642.
Porter, M. E. 1981. The Contributions of Industrial Organization to Strategic Management. The Academy of Management Review, 6(4): 609-620.
Porter, M. E. 1990. The competitive advantage of notions. Harvard business review, 68(2): 73-93.Porter, M. E. 1996. Competitive advantage, agglomeration economies, and regional policy.
International regional science review, 19(1-2): 85-90.

130
Porter, M. E. 2000. Location, competition, and economic development: Local clusters in a global economy. Economic development quarterly, 14(1): 15-34.
Porter, M. E. 2003. The Economic Performance of Regions. Regional Studies, 37(6/7): 545.Porter, M. E., & Porter, M. P. 1998. Location, Clusters, and the” New” Microeconomics of
Competition. Business Economics: 7-13.Powell, W. W. 1995. Cultivating an institutional ecology of organizations: Comment on Hannan,
Carroll, Dundon, and Torres. American sociological review, 60(4): 529-538.Priem, R. L., & Butler, J. E. 2001. Is the resource-based “view” a useful perspective for strategic
management research? Academy of management review, 26(1): 22-40.Puelz, R., & Snow, A. 1994. Evidence on adverse selection: Equilibrium signaling and cross-
subsidization in the insurance market. Journal of Political Economy: 236-257.Ragozzino, R., & Reuer, J. J. 2007a. Initial public offerings and the acquisition of entrepreneurial
firms. Strategic Organization, 5(2): 155-176.Ragozzino, R., & Reuer, J. J. 2007b. Mind the information gap: Putting new selection criteria and
deal structures to work in M&A. Journal of Applied Corporate Finance, 19(3): 82.Rao, H. 1994. The social construction of reputation: Certification contests, legitimation, and the
survival of organizations in the American automobile industry: 1895–1912. Strategic management journal, 15(S1): 29-44.
Reed, R., & DeFillippi, R. J. 1990. Causal ambiguity, barriers to imitation, and sustainable competitive advantage. Academy of management review, 15(1): 88-102.
Reigeluth, G., Wolman, H., & Reinhard, R. 1980. Fiscal consequences of changes in a community’s economic base. Washington DC: The Urban Institute.
Reynolds, P., Storey, D. J., & Westhead, P. 1994. Cross-national comparisons of the variation in new firm formation rates. Regional Studies, 28(4): 443-456.
Rindova, V. P., Pollock, T. G., & Hayward, M. L. 2006. Celebrity firms: The social construction of market popularity. Academy of Management Review, 31(1): 50-71.
Rosenthal, S. S., & Strange, W. C. 2003. Geography, industrial organization, and agglomeration. review of Economics and Statistics, 85(2): 377-393.
Rothschild, M., & Stiglitz, J. 1976. Equilibrium in competitive insurance markets: An essay on the economics of imperfect information, Foundations of Insurance Economics: 355-375: Springer.
Ryan, A. M., Sacco, J. M., McFarland, L. A., & Kriska, S. D. 2000. Applicant self-selection: Correlates of withdrawal from a multiple hurdle process. Journal of applied psychology, 85(2): 163.
Sanders, W., & Boivie, S. 2004. Sorting things out: Valuation of new firms in uncertain markets. Strategic Management Journal, 25(2): 167-186.
Saxenian, A. 1994. Regional networks: industrial adaptation in Silicon Valley and route 128.Saxenian, A. 1996. Regional advantage: Harvard University Press.

131
Schumpeter, J. A. 1934. The theory of economic development: An inquiry into profits, capital, credit, interest, and the business cycle: Transaction publishers.
Scott, S. G., & Lane, V. R. 2000. A Stakeholder Approach to Organizational Identity. The Academy of Management Review, 25(1): 43-62.
Scott, W. R. 1987. The adolescence of institutional theory. Administrative science quarterly: 493-511.
Scott, W. R. 1990. Symbols and organizations: from Barnard to the institutionalists. Organization theory: from Chester Barnard to the present and beyond: 38-55.
Scott, W. R. 2007. Institutions and organizations: Ideas and interests: Sage Publications, Incorporated.
Shane, S., & Venkataraman, S. 2000. The promise of entrepreneurship as a field of research. Academy of management review, 25(1): 217-226.
Shannon, C., & Weaver, W. 1948. Biodiversity measurements. Mathematical Theory of Communication: 117-127.
Shaver, J. M., & Flyer, F. 2000. Agglomeration economies, firm heterogeneity, and foreign direct investment in the United States. Strategic Management Journal, 21(12): 1175-1194.
Shepherd, D. A., & Zacharakis, A. 2001. The venture capitalist-entrepreneur relationship: control, trust and confidence in co-operative behaviour. Venture Capital: an international journal of entrepreneurial finance, 3(2): 129-149.
Short, J. C., Broberg, J. C., Cogliser, C. C., & Brigham, K. C. 2009. Construct validation using computer-aided text analysis (CATA): An illustration using entrepreneurial orientation. Organizational Research Methods.
Siegel, P. B., Johnson, T. G., & Alwang, J. 1995. Regional economic diversity and diversification. Growth and Change, 26(2): 261-284.
Simon, H. A. 1955. A behavioral model of rational choice. The quarterly journal of economics: 99-118.
Sine, W. D., Haveman, H. A., & Tolbert, P. S. 2005. Risky business? Entrepreneurship in the new independent-power sector. Administrative Science Quarterly, 50(2): 200-232.
Sirmon, D. G., Hitt, M. A., & Ireland, R. D. 2007. Managing firm resources in dynamic environments to create value: Looking inside the black box. Academy of management review, 32(1): 273-292.
Sirmon, D. G., Hitt, M. A., Ireland, R. D., & Gilbert, B. A. 2011. Resource orchestration to create competitive advantage breadth, depth, and life cycle effects. Journal of Management, 37(5): 1390-1412.
Socolow, R. 1994. Six perspectives from industrial ecology. Industrial ecology and global change: 3-16.
Sorenson, O., & Audia, P. G. 2000. The social structure of entrepreneurial activity: Geographic concentration of footwear production in the United States, 1940–19891. american Journal of Sociology, 106(2): 424-462.

132
Sosis, R., & Alcorta, C. 2003. Signaling, solidarity, and the sacred: The evolution of religious behavior. Evolutionary anthropology: issues, news, and reviews, 12(6): 264-274.
Sosis, R., & Bressler, E. R. 2003. Cooperation and commune longevity: A test of the costly signaling theory of religion. Cross-cultural research, 37(2): 211-239.
Spence, A. M. 1974. Market signaling: Informational transfer in hiring and related screening processes: Harvard Univ Pr.
Spence, M. 1973. Job market signaling. The quarterly journal of Economics: 355-374.Spence, M. 2002. Signaling in retrospect and the informational structure of markets. The American
Economic Review, 92(3): 434-459.Srivastava, J. 2001. The role of inferences in sequential bargaining with one-sided incomplete
information: Some experimental evidence. Organizational behavior and human decision processes, 85(1): 166-187.
St-Jean, E., LeBel, L., & Audet, J. 2010. Entrepreneurial orientation in the forestry industry: a population ecology perspective. Journal of Small Business and Enterprise Development, 17(2): 204-217.
Stam, E. 2015. Entrepreneurial ecosystems and regional policy: a sympathetic critique. European Planning Studies, 23(9): 1759-1769.
Stangler, D., & Bell-Masterson, J. 2015. Measuring an Entrepreneurial Ecosystem. Kauffman Foundation. March.
Stangler, D., & Kedrosky, P. 2010. Exploring firm formation: Why is the number of new firms constant? Available at SSRN 1585380.
Starbuck, W. H., & Nystrom, P. C. 1981. Designing and understanding organizations. Handbook of organizational design, 1: 9-22.
Stiglitz, J. E. 2000. The contributions of the economics of information to twentieth century economics. Quarterly Journal of economics: 1441-1478.
Stock, J. H., Watson, M. W., & Addison-Wesley, P. 2007. Introduction to econometrics.Suchman, M. C. 1995. Managing legitimacy: Strategic and institutional approaches. Academy of
management review, 20(3): 571-610.Szerb, L., Acs, Z. J., Ortega-Argilés, R., & Komlosi, E. 2015. The Entrepreneurial Ecosystem: The
Regional Entrepreneurship and Development Index. Available at SSRN 2642514.Tallman, S., Jenkins, M., Henry, N., & Pinch, S. 2004. Knowledge, clusters, and competitive
advantage. Academy of management review, 29(2): 258-271.Tang, J. 2008. Environmental munificence for entrepreneurs: entrepreneurial alertness and
commitment. International Journal of Entrepreneurial Behavior & Research, 14(3): 128-151.
Tervo, H. 2006. Regional unemployment, self-employment and family background. Applied Economics, 38(9): 1055-1062.

133
Thornton, & Ocasio, W. 1999. Institutional logics and the historical contingency of power in organizations: Executive succession in the higher education publishing industry, 1958-1990 1. American Journal of Sociology, 105(3): 801-843.
Thornton, Ocasio, W., & Lounsbury, M. 2012. The institutional logics perspective: A new approach to culture, structure, and process: Oxford University Press.
Thornton, P. H. 2002. The rise of the corporation in a craft industry: Conflict and conformity in institutional logics. Academy of Management Journal, 45(1): 81-101.
Thornton, P. H., & Ocasio, W. 2008. Institutional logics. The Sage handbook of organizational institutionalism, 840.
Thurik, A. 2009. Entreprenomics: entrepreneurship, economic growth and policy. Entrepreneurship, growth and public policy: 219-249.
Tolbert, P. S., David, R. J., & Sine, W. D. 2011. Studying choice and change: The intersection of institutional theory and entrepreneurship research. Organization Science, 22(5): 1332-1344.
Torres-Reyna, O. 2007. Panel data analysis fixed and random effects using Stata (v. 4.2). Data & Statistical Services, Priceton University.
Torres-Reyna, O. 2013. Time series. Data and statistical services. Princeton University. http:// www. princeton. edu/ ~ otorres/ TS101. pdf. Accessed, 14.
Townley, B. 2002. The role of competing rationalities in institutional change. Academy of Management Journal, 45(1): 163-179.
Turban, D. B., Forret, M. L., & Hendrickson, C. L. 1998. Applicant attraction to firms: Influences of organization reputation, job and organizational attributes, and recruiter behaviors. Journal of Vocational Behavior, 52(1): 24-44.
Tversky, A., & Kahneman, D. 1973. Availability: A heuristic for judging frequency and probability. Cognitive psychology, 5(2): 207-232.
Van Stel, A., Storey, D. J., & Thurik, A. R. 2007. The effect of business regulations on nascent and young business entrepreneurship. Small Business Economics, 28(2-3): 171-186.
Vaughn, R., Pollard, R., & Dyer, B. 1985. Confusing job creation with economic development. Entrepreneurial Economy, 11: 2-6.
Venkataraman, S. 1997. The distinctive domain of entrepreneurship research. Advances in entrepreneurship, firm emergence and growth, 3(1): 119-138.
Venkataraman, S., Sarasvathy, S. D., Dew, N., & Forster, W. R. 2012. Reflections on the 2010 AMR decade award: Whither the promise? Moving forward with entrepreneurship as a science of the artificial. Academy of Management Review, 37(1): 21-33.
Wagner, J. E., & Deller, S. C. 1998. Measuring the effects of economic diversity on growth and stability. Land Economics: 541-556.
Warrington, M. H., McDonald, P. G., Rollins, L. A., & Griffith, S. C. 2014. All signals are not equal: acoustic signalling of individuality, sex and breeding status in a cooperative breeder. Animal Behaviour, 93: 249-260.

134
West, S. A., Griffin, A. S., & Gardner, A. 2007. Social semantics: altruism, cooperation, mutualism, strong reciprocity and group selection. Journal of evolutionary biology, 20(2): 415-432.
West, S. A., Griffin, A. S., Gardner, A., & Diggle, S. P. 2006. Social evolution theory for microorganisms. Nature Reviews Microbiology, 4(8): 597-607.
Wiggins, R. R., & Ruefli, T. W. 2002. Sustained competitive advantage: Temporal dynamics and the incidence and persistence of superior economic performance. Organization Science, 13(1): 81-105.
Wood, M. S., McKelvie, A., & Haynie, J. M. 2014. Making it personal: Opportunity individuation and the shaping of opportunity beliefs. Journal of Business Venturing, 29(2): 252-272.
Wooldridge, J. M. 2010. Econometric analysis of cross section and panel data: MIT press.Yang, T., & Aldrich, H. E. 2012. Out of sight but not out of mind: Why failure to account for left
truncation biases research on failure rates. Journal of Business Venturing, 27(4): 477-492.Zahavi, A. 1975. Mate selection—a selection for a handicap. Journal of theoretical Biology, 53(1):
205-214.Zahavi, A. 1987. The theory of signal selection and some of its implications. Paper presented at
the International symposium of biological evolution.Zahra, S. A., & Wright, M. 2011. Entrepreneurship’s next act. The Academy of Management
Perspectives, 25(4): 67-83.Zavyalova, A., Pfarrer, M., Reger, R., & Shapiro, D. 2012. Managing the message: the effects of
firm actions and industry spillovers on media coverage following wrongdoing. Academy of Management Journal, 55(5): 1079-1101.
Zucker, L. G. 1989. Combining institutional theory and population ecology: No legitimacy, no history. American Sociological Review, 54(4): 542-545.

135
APPENDIX
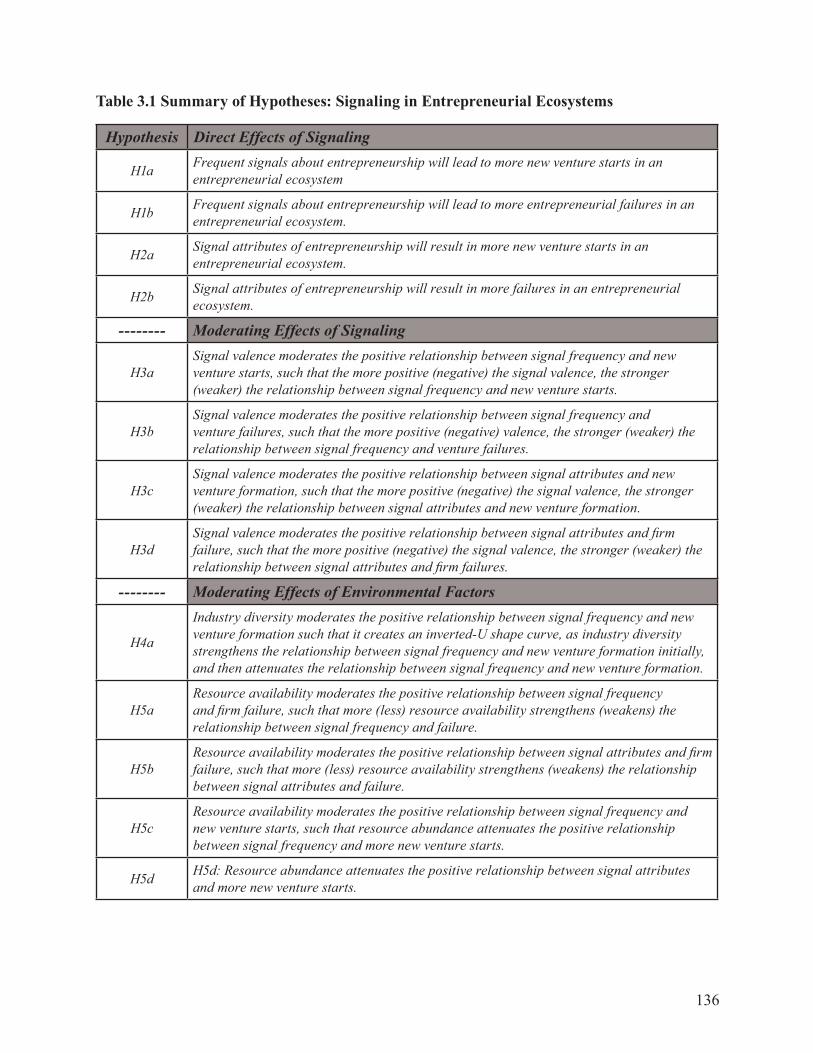
136
Table 3.1 Summary of Hypotheses: Signaling in Entrepreneurial Ecosystems
Hypothesis Direct Effects of Signaling
H1a Frequent signals about entrepreneurship will lead to more new venture starts in an entrepreneurial ecosystem
H1b Frequent signals about entrepreneurship will lead to more entrepreneurial failures in an entrepreneurial ecosystem.
H2a Signal attributes of entrepreneurship will result in more new venture starts in an entrepreneurial ecosystem.
H2b Signal attributes of entrepreneurship will result in more failures in an entrepreneurial ecosystem.
-------- Moderating Effects of Signaling
H3aSignal valence moderates the positive relationship between signal frequency and new venture starts, such that the more positive (negative) the signal valence, the stronger (weaker) the relationship between signal frequency and new venture starts.
H3bSignal valence moderates the positive relationship between signal frequency and venture failures, such that the more positive (negative) valence, the stronger (weaker) the relationship between signal frequency and venture failures.
H3cSignal valence moderates the positive relationship between signal attributes and new venture formation, such that the more positive (negative) the signal valence, the stronger (weaker) the relationship between signal attributes and new venture formation.
H3dSignal valence moderates the positive relationship between signal attributes and firm failure, such that the more positive (negative) the signal valence, the stronger (weaker) the relationship between signal attributes and firm failures.
-------- Moderating Effects of Environmental Factors
H4a
Industry diversity moderates the positive relationship between signal frequency and new venture formation such that it creates an inverted-U shape curve, as industry diversity strengthens the relationship between signal frequency and new venture formation initially, and then attenuates the relationship between signal frequency and new venture formation.
H5aResource availability moderates the positive relationship between signal frequency and firm failure, such that more (less) resource availability strengthens (weakens) the relationship between signal frequency and failure.
H5bResource availability moderates the positive relationship between signal attributes and firm failure, such that more (less) resource availability strengthens (weakens) the relationship between signal attributes and failure.
H5cResource availability moderates the positive relationship between signal frequency and new venture starts, such that resource abundance attenuates the positive relationship between signal frequency and more new venture starts.
H5d H5d: Resource abundance attenuates the positive relationship between signal attributes and more new venture starts.

137
Table 4.1 Selected MSAs
MSA State Population (2000) Nearby MSA(s)Fayetteville AR 463204 Springfield
Prescott AZ 211033 YumaYuma AZ 195751 Prescott
Bakersfield CA 839631 Modesto, VisaliaModesto CA 514453 Bakersfield, Santa RosaOxnard CA 823318 Bakersfield, Visalia
Santa Rosa CA 483878 ModestoVisalia CA 368627 Bakersfield, Modesto
Boulder CO 294567 GreeleyGreeley CO 252825 BoulderNaples FL 321520 OcalaOcala FL 331298 Naples, Pensacola
Pensacola FL 413086 Lafayette, OcalaHouma LA 208178 Lafayette
Lafayette LA 273738 Houma, PensacolaPortland ME 514098 Manchester
Flint MI 425790 LansingLansing MI 464036 Flint
Springfield MO 436712 FayettevilleWilmington NC 362315 Myrtle BeachManchester NH 400721 Portland
Reno NV 425417 ProvoCanton OH 404422 Toledo, YorkToledo OH 651429 CantonYork PA 434972 Canton
Charleston SC 550916 Myrtle BeachHickory SC 365497 Spartanburg
Myrtle Beach SC 269291 Charleston, WilmingtonSpartanburg SC 284307 Hickory
Provo UT 526810 Reno

138
Table 4.2 Summary of Variables and Measures
Dependent Variables Measure Data Source
Firm Formations Count of firm starts Business Employment Dynamics- BLS.gov
Firm Failures Count of firm failures Business Employment Dynamics- BLS.gov
Age 0 Firms Count of Age 0 firmsBusiness Dynamics Statistics - Longitudinal Business Database, census.gov
Independent Variables
Signal Frequency Count of Media Articles Factiva Database
Signal Attributes Word Count of Entrepreneurial Orientation Words
Factiva Database for articles - QDA Miner for word count using Short et al., 2009 E.O. dictionary
Signal Valence Janis-Fadner Coefficient Factiva Database for articles -
Industry Diversity Shannon-Weaver Index Business Dynamics Statistics - BLS.gov
Resource Availability Investment in MSA Kauffman FoundationCrunchbase.com
Control Variables
Population Continuous variable Metropolitan Statistical Area Population Estimates - Census.gov
Education Standardized variable combining all levels of education
Kauffman Foundation from Census.gov
Patents Number of patents issued Kauffman Foundation
SBIRs Number of SBIRs awarded Kauffman Foundation
NIH Grants Number of NIH grants awarded Kauffman Foundation
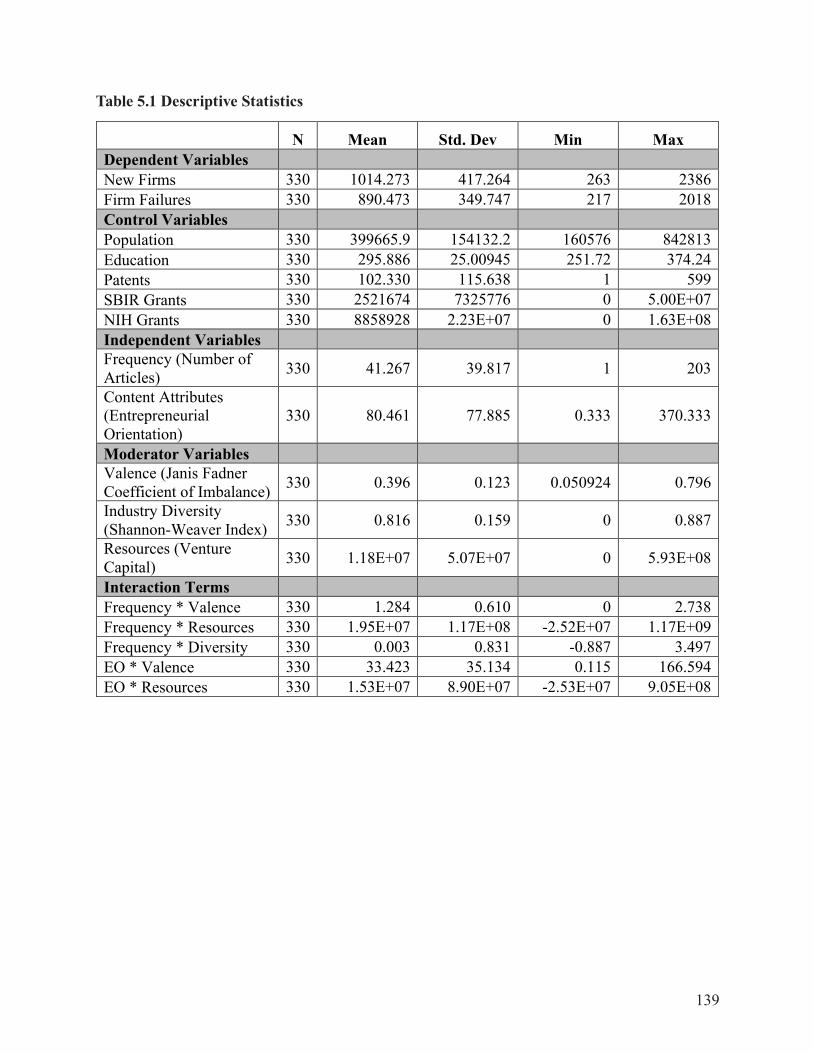
139
Table 5.1 Descriptive Statistics
N Mean Std. Dev Min Max Dependent Variables New Firms 330 1014.273 417.264 263 2386 Firm Failures 330 890.473 349.747 217 2018 Control Variables Population 330 399665.9 154132.2 160576 842813 Education 330 295.886 25.00945 251.72 374.24 Patents 330 102.330 115.638 1 599 SBIR Grants 330 2521674 7325776 0 5.00E+07 NIH Grants 330 8858928 2.23E+07 0 1.63E+08 Independent Variables Frequency (Number of Articles) 330 41.267 39.817 1 203
Content Attributes (Entrepreneurial Orientation)
330 80.461 77.885 0.333 370.333
Moderator Variables Valence (Janis Fadner Coefficient of Imbalance) 330 0.396 0.123 0.050924 0.796
Industry Diversity (Shannon-Weaver Index) 330 0.816 0.159 0 0.887
Resources (Venture Capital) 330 1.18E+07 5.07E+07 0 5.93E+08
Interaction Terms Frequency * Valence 330 1.284 0.610 0 2.738 Frequency * Resources 330 1.95E+07 1.17E+08 -2.52E+07 1.17E+09 Frequency * Diversity 330 0.003 0.831 -0.887 3.497 EO * Valence 330 33.423 35.134 0.115 166.594 EO * Resources 330 1.53E+07 8.90E+07 -2.53E+07 9.05E+08

140
Table 5.2 Correlations
New Firms Firm Failure Frequency EOContent Valence Diversity Ind Resources Population
------------ --------- --------- --------- --------- --------- --------- --------- ---------
New Firms 1
Firm Failures 0.977*** 1
Frequency 0.705*** 0.748*** 1
EO Content 0.610*** 0.674*** 0.888*** 1
Valence -0.066 -0.051 0.185 0.291 1
Diversity Index -0.163 -0.176 0.040 0.016 -0.127 1
Resources 0.322* 0.291 0.470*** 0.544*** 0.140 -0.129 1
Population 0.716*** 0.761*** 0.577*** 0.489*** -0.065 -0.039 0.036 1
Education 0.312* 0.330* 0.511*** 0.594*** 0.242 -0.097 0.656*** 0.023
Patents 0.495*** 0.520*** 0.587*** 0.646*** 0.016 -0.230 0.681*** 0.299
SBIR 0.278 0.282 0.392*** 0.552*** -0.002 -0.011 0.694*** 0.005
NIH 0.376** 0.384** 0.439** 0.485*** 0.102 0.150 0.215 0.226
Freq*Resources 0.266 0.231 0.425** 0.554*** 0.199 -0.041 0.955 -0.023
Freq*Valence 0.607*** 0.646*** 0.958*** 0.889*** 0.433 0.017 0.463** 0.516
EO*Resources 0.276 0.247 0.433** 0.567*** 0.185 -0.057 0.954*** -0.014
EO*Valence .570*** 0.629*** 0.870*** 0.991*** 0.384 0.019 0.528 0.465*
Freq*Diversity 0.166 0.193 0.459** 0.717*** 0.358* 0.081 0.674*** 0.003**
Education Patents SBIR NIH Freq*Res Freq*Val EO*Res EO*Val Freq*Div
------------ --------- --------- --------- --------- --------- --------- --------- --------- ---------
New Firms
Firm Failures
Frequency
EO Content
Valence
Diversity Index
Resources
Population
Education 1
Patents 0.666*** 1
SBIR 0.659*** 0.748*** 1
NIH 0.296 0.214 0.422** 1
Freq*Resources 0.649*** 0.641*** 0.790*** 0.281 1
Freq*Valence 0.525* 0.528 0.346 0.416 .442** 1
EO*Resources 0.659*** 0.660*** 0.812*** 0.297 0.999*** 0.444** 1
EO*Valence 0.592 0.603 0.508 0.470 .545 0.905*** 0.553 1
Freq*Diversity 0.695*** 0.519*** 0.733*** 0.494*** 0.776*** 0.525*** 0.780*** 0.733*** 1
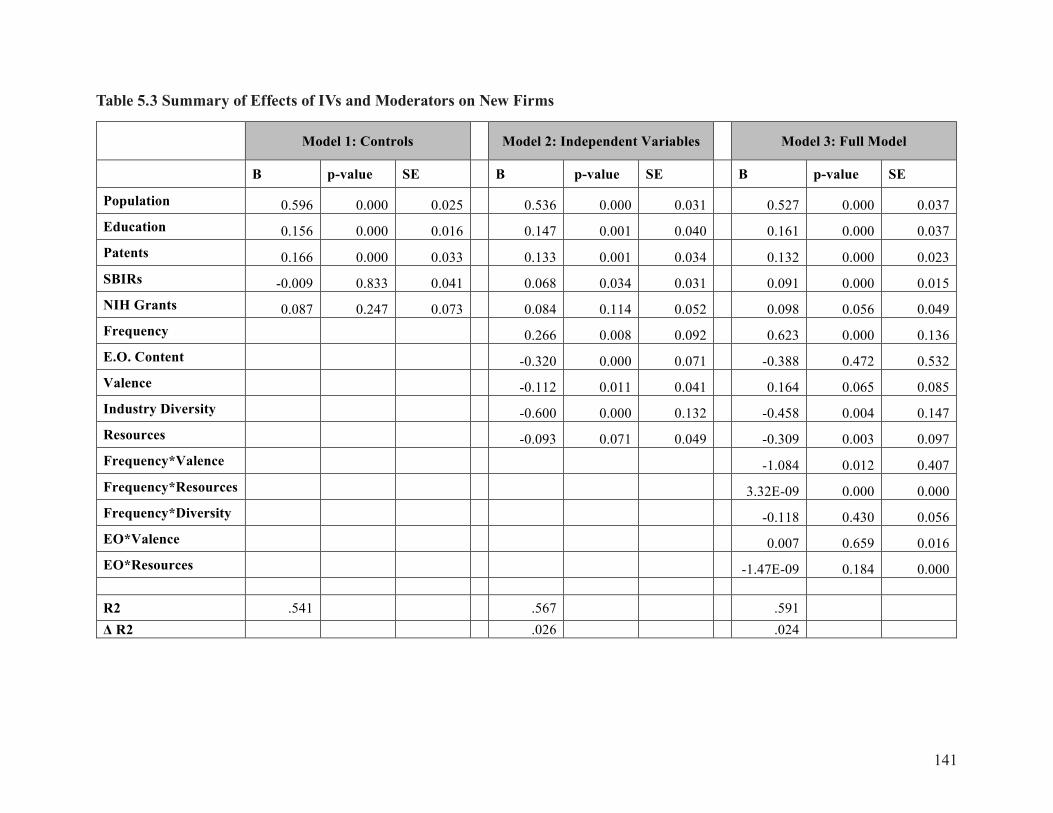
141
Model 1: Controls
Model 2: Independent Variables
Model 3: Full Model
B p-value SE B p-value SE B p-value SE
Population 0.596 0.000 0.025 0.536 0.000 0.031 0.527 0.000 0.037 Education 0.156 0.000 0.016 0.147 0.001 0.040 0.161 0.000 0.037 Patents 0.166 0.000 0.033 0.133 0.001 0.034 0.132 0.000 0.023 SBIRs -0.009 0.833 0.041 0.068 0.034 0.031 0.091 0.000 0.015 NIH Grants 0.087 0.247 0.073 0.084 0.114 0.052 0.098 0.056 0.049 Frequency 0.266 0.008 0.092 0.623 0.000 0.136 E.O. Content -0.320 0.000 0.071 -0.388 0.472 0.532 Valence -0.112 0.011 0.041 0.164 0.065 0.085 Industry Diversity -0.600 0.000 0.132 -0.458 0.004 0.147 Resources -0.093 0.071 0.049 -0.309 0.003 0.097 Frequency*Valence -1.084 0.012 0.407 Frequency*Resources 3.32E-09 0.000 0.000 Frequency*Diversity -0.118 0.430 0.056 EO*Valence 0.007 0.659 0.016 EO*Resources -1.47E-09 0.184 0.000 R2 .541 .567 .591 Δ R2 .026 .024
Table 5.3 Summary of Effects of IVs and Moderators on New Firms

142
Model 1: Controls Model 2: Independent Variables Model 3: Full Model
B p-value SE B p-value SE B p-value SE
Population 0.643 0.000 0.017 0.582 0.000 0.026 0.579 0.000 0.026
Education 0.160 0.000 0.016 0.099 0.000 0.006 0.087 0.000 0.018
Patents 0.209 0.000 0.012 0.151 0.000 0.015 0.133 0.000 0.019
SBIRs -0.052 0.057 0.026 -0.002 0.836 0.009 0.022 0.474 0.031
NIH Grants 0.138 0.001 0.038 0.088 0.000 0.020 0.096 0.000 0.021
Frequency 0.225 0.000 0.043 0.429 0.001 0.112
E.O. Content -0.141 0.046 0.068 -0.157 0.637 0.329
Valence 0.022 0.475 0.031 0.179 0.039 0.083
Resources 0.115 0.002 0.034 0.315 0.001 0.081
Frequency*Valence -0.591 0.067 0.310
Frequency*Resources 2.44E-08 0.000 0.000
EO*Valence 0.002 0.866 0.011
EO*Resources -2.93E-08 0.000 0.000 R2 .659 .666 .676
Δ R2 .007 .010
Table 5.4 Summary of Effects of IVs and Moderators on Firm Failures
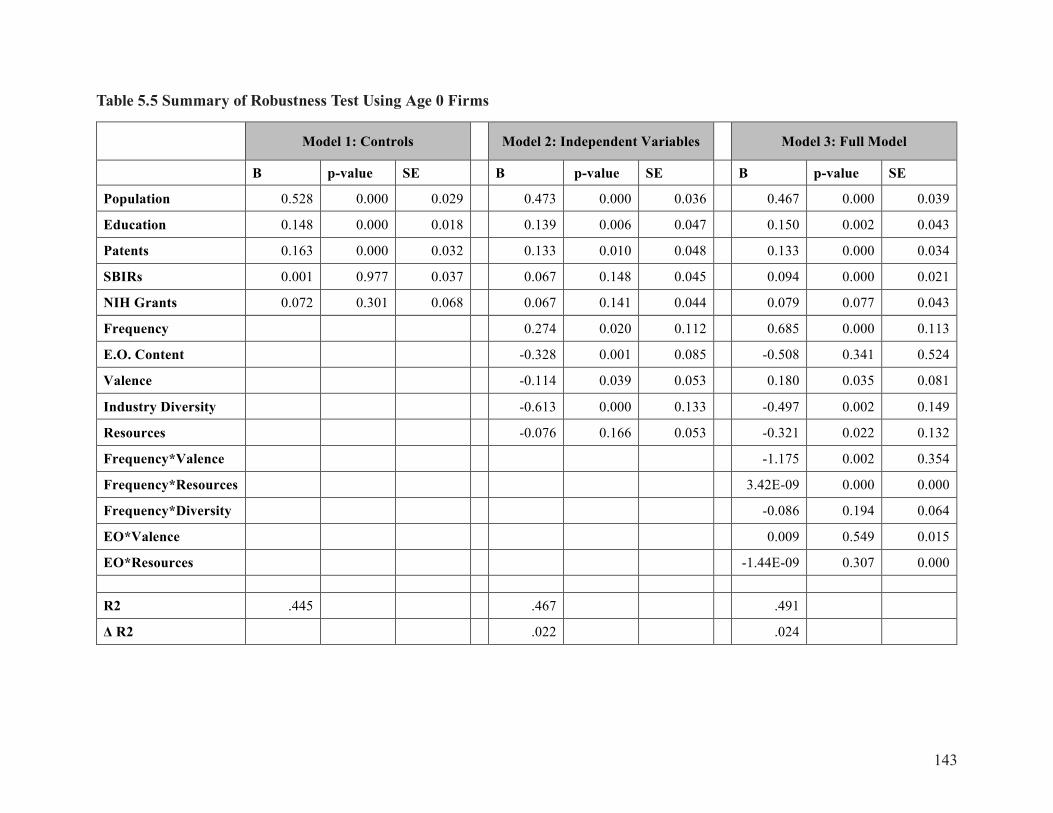
143
Table 5.5 Summary of Robustness Test Using Age 0 Firms
Model 1: Controls Model 2: Independent Variables Model 3: Full Model
B p-value SE B p-value SE B p-value SE
Population 0.528 0.000 0.029 0.473 0.000 0.036 0.467 0.000 0.039
Education 0.148 0.000 0.018 0.139 0.006 0.047 0.150 0.002 0.043
Patents 0.163 0.000 0.032 0.133 0.010 0.048 0.133 0.000 0.034
SBIRs 0.001 0.977 0.037 0.067 0.148 0.045 0.094 0.000 0.021
NIH Grants 0.072 0.301 0.068 0.067 0.141 0.044 0.079 0.077 0.043
Frequency 0.274 0.020 0.112 0.685 0.000 0.113
E.O. Content -0.328 0.001 0.085 -0.508 0.341 0.524
Valence -0.114 0.039 0.053 0.180 0.035 0.081
Industry Diversity -0.613 0.000 0.133 -0.497 0.002 0.149
Resources -0.076 0.166 0.053 -0.321 0.022 0.132
Frequency*Valence -1.175 0.002 0.354
Frequency*Resources 3.42E-09 0.000 0.000
Frequency*Diversity -0.086 0.194 0.064
EO*Valence 0.009 0.549 0.015
EO*Resources -1.44E-09 0.307 0.000 R2 .445 .467 .491
Δ R2 .022 .024

144
Table 5.6 Summary of Robustness Test Using Age 0 Firms, Size 1-4
Model 1: Controls Model 2: Full Model, 3-Year Lag Model 3: Full Model, Same Year
B p-value SE B p-value SE B p-value SE
Population 0.504 0.000 0.027 0.438 0.000 0.040 0.427 0.000 0.035
Education 0.142 0.000 0.017 0.140 0.002 0.041 0.113 0.010 0.041
Patents 0.164 0.000 0.032 0.131 0.003 0.041 0.083 0.000 0.020
SBIRs 0.025 0.479 0.036 0.112 0.000 0.024 0.084 0.001 0.022
NIH Grants 0.062 0.363 0.067 0.065 0.133 0.042 0.081 0.007 0.028
Frequency 0.652 0.000 0.114 0.525 0.000 0.086
E.O. Content -0.410 0.454 0.539 -0.449 0.093 0.259
Valence 0.156 0.066 0.081 0.112 0.077 0.061
Industry Diversity -0.523 0.002 0.155 -0.467 0.003 0.145
Resources -0.291 0.042 0.137 0.028 0.365 0.030
Frequency*Valence -1.038 0.007 0.357 -0.684 0.005 0.223
Frequency*Resources 3.12E-09 0.000 0.000 3.29E-09 0.000 0.000
Frequency*Diversity -0.076 0.261 0.066 -0.113 0.100 0.031
EO*Valence 0.006 0.713 0.016 0.011 0.221 0.009
EO*Resources -1.34E-09 0.357 0.000 -3.3E-09 0.003 0.000 R2 .422 .469 .481
Δ R2 .047 .012

145
Table 5.7 Summary of Results of Primary Analysis Direct Effects Hypothesis IV Prediction DV Result 1 a Signal Frequency (+) New Firms Supported 1 b Signal Frequency (+) Firm Failures Supported 2 a Content Attributes (+) New Firms Partial Support 2 b Content Attributes (+) Firm Failures Partial Support Interactions Hypothesis IV Prediction DV Result 3 a Frequency * Valence (+) New Firms Partial Support 3 b Frequency * Valence (+) Firm Failures Partial Support 3 c Content Attributes * Valence (+) New Firms Not Supported 3 d Content Attributes * Valence (+) Firm Failures Not Supported 4 a Frequency * Industry Diversity U New Firms Not Supported 5 a Content Attributes * Resources (+) Firm Starts Not Supported 5 b Content Attributes * Resources (+) Firm Failures Partial Support 5 c Frequency * Resources (-) Firm Starts Partial Support 5 d Frequency * Resources (-) Firm Failures Partial Support

146
Table 6.1 Exemplar Quotations from Articles for E.O. Content
"We want to identify markets where competition exists, where entry is likely in the near future, and where competition once existed but failed." Aspen Publishers, 2006
"There probably is enough business for everyone, but she expects tougher competition ahead." Coleman, 2007
"There's nothing more depressing than spending $2 million on the streets and seeing empty stores." Umlauf-Garneau, 2001
"Don't feel threatened by competition." Bair, 2006
"Such real-world lessons, painful as they may be, are a driving force behind the downtown center's efforts." Zwahlen, 2002
"I loved the challenge of running my own company." Toledo Business Journal, 2004
"If you're more productive, you're better able to compete and survive and expand and grow."
Bell & Howard Information & Learning Company, 2004
"We want entrepreneurs who inspire others through intense vision, who have built and maintained a growing business, who have created jobs." Hindustan Times, 2006
"That competitive price explains why the industry is so attractive for so many."
Energy Weekly News, 2010
"We need to consider this idea in relation to today's business climate: a highly competitive one."
Associated Press Newswire, 2010
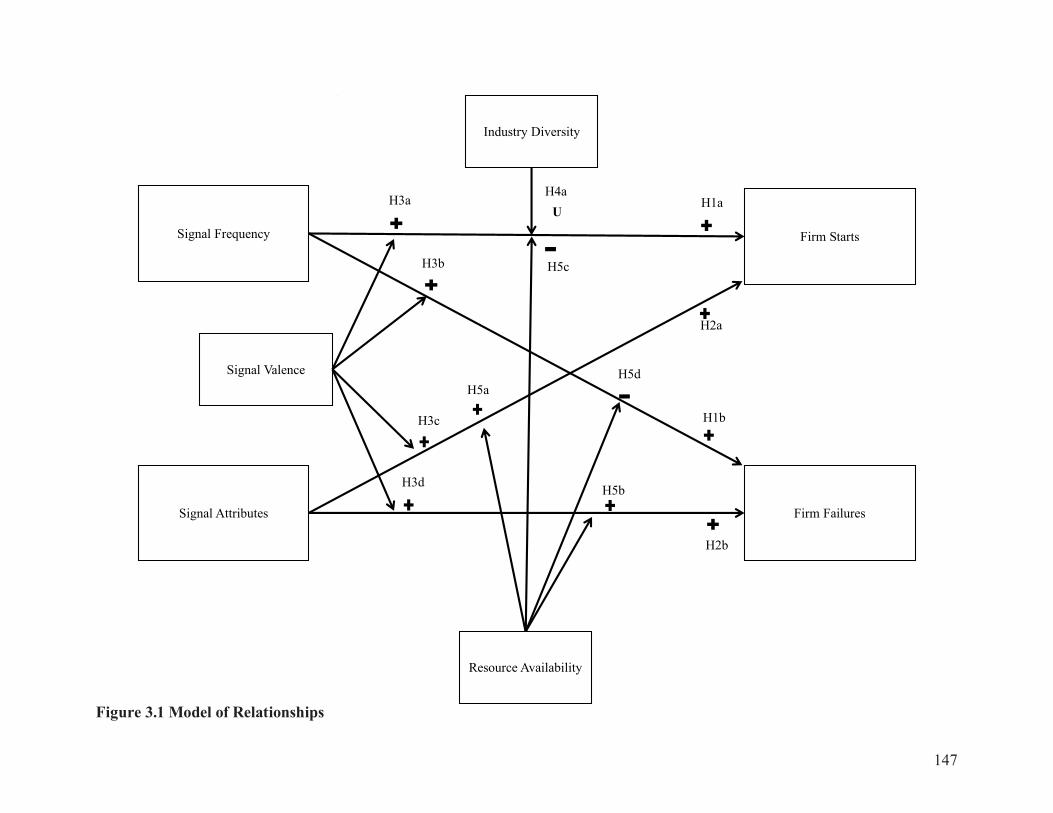
147
Signal Frequency
Signal Attributes
Signal Valence
Firm Starts
Firm Failures
Figure 3.2 – Model of Relationships
H1a
H1b
H2a
H2b
H3b
H3c
H3d
H3a H4a
H5a
H5b
H5c
H5d
U
Industry Diversity
Resource Availability
Figure 3.1 Model of Relationships
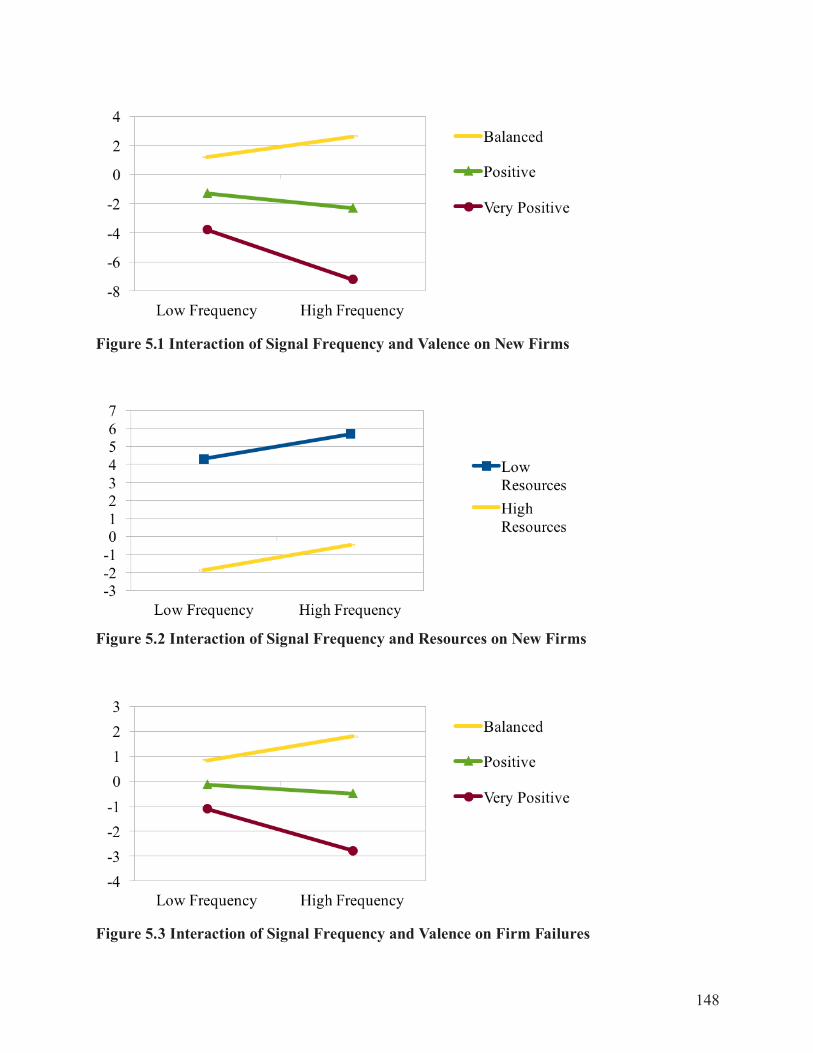
148
Figure 5.1 Interaction of Signal Frequency and Valence on New Firms
Figure 5.2 Interaction of Signal Frequency and Resources on New Firms
Figure 5.3 Interaction of Signal Frequency and Valence on Firm Failures

149
Figure 5.4 Interaction of Signal Frequency and Resources on Firm Failures
Figure 5.5 Interaction of E.O. Content and Resources on Firm Failures

150
VITA
Jason Strickling is from Decatur, Alabama and graduated from Randolph School in
Huntsville, Alabama in 1998. He graduated from Davidson College with a Bachelors of Arts
degree in German in 2002 and from The University of Alabama in Huntsville with a Master of
Business Administration in 20012. He joined the Organizations and Strategy PhD Program at the
University of Tennessee in 2012. During his time at the University of Tennessee, his research was
published in the International Journal of Management and Enterprise Development and presented
at the annual meetings of the Academy of Management, the Southern Management Association,
and the Babson College Entrepreneurship Research Conference. The University of Tennessee
conferred his Doctor of Philosophy degree in the fall of 2016.
Related Documents