Developing an Improved Heat Transfer Correlation for Applications in SCWR A Thesis Submitted to the Department of NUCLEAR ENGINEERING SCHOOL OF NUCLEAR AND ALLIED SCIENCES UNIVERSITY OF GHANA BY Luqman Usman, (10430968) BSc (KNUST), 2009 In Partial fulfilment of the Requirements for the Degree of MASTER OF PHILOSOPHY In COMPUTATIONAL NUCLEAR SCIENCES AND ENGINEERING July, 2015 University of Ghana http://ugspace.ug.edu.gh

Welcome message from author
This document is posted to help you gain knowledge. Please leave a comment to let me know what you think about it! Share it to your friends and learn new things together.
Transcript

Developing an Improved Heat Transfer Correlation for Applications in SCWR
A Thesis Submitted to the Department of
NUCLEAR ENGINEERING
SCHOOL OF NUCLEAR AND ALLIED SCIENCES
UNIVERSITY OF GHANA
BY
Luqman Usman, (10430968)
BSc (KNUST), 2009
In Partial fulfilment of the Requirements for the Degree of
MASTER OF PHILOSOPHY
In
COMPUTATIONAL NUCLEAR SCIENCES AND ENGINEERING
July, 2015
University of Ghana http://ugspace.ug.edu.gh

i
DECLARATION
I hereby declare that with the exception of references to other people’s work which have
duly been acknowledged, this Thesis is the result of my own research work and no part of
it has been presented for another degree in this University or elsewhere.
……………………………………… ………………………………
LUQMAN USMAN Date
(Candidate)
I hereby declare that the preparation of this project was supervised in accordance with the
guidelines of the supervision of Thesis work laid down by the University of Ghana.
………………………………… …………………………………..
Seth Kofi Debrah, Ph.D Vincent Yao Agbodemegbe, Ph.D
(PRINCIPAL SUPERVISOR) (CO-SUPERVISOR)
………………………………… ………………………………….
Date Date
University of Ghana http://ugspace.ug.edu.gh
ii
ABSTRACT
This thesis work seeks to complement ongoing research works on heat transfer from
heated surface to supercritical water in the SCWR. The study was inspired by ongoing
efforts directed at obtaining a correlation that predict supercritical-water heat transfer
more accurately, especially with the identification of the SCWR concept as one of the six
Generation IV nuclear reactors. The thesis focuses on the development of an improved
heat transfer correlation for supercritical water flowing through a vertical heater in a
natural circulation loop which is basically a bare vertical heater tube made of Inconnel-
625, having an overall heating length of 1.37m and internal diameter of 4.62m. The study
involves the investigation of some existing empirical heat transfer correlations for both
forced and natural convections and then subsequently comparing their results to that of
the Chen Yuzhou et al experimental dataset in order to notice their extent of deviations
from the experimental data. Finally, one of the correlations considered for this study is
used as a baseline to developing a more improved correlation. The parameters used for
computing the selected heat transfer correlations and also developing an improved
correlation are based on the wall and bulk temperatures obtained from the Supercritical-
water heat-transfer dataset. The experiment for the dataset was performed in a natural
circulation loop at the China Institute of Atomic Energy, China (CIAE) having pressure
kept within the range of 24.2-25.2MPa, a heating power ranging from 0 to 18kW or heat
flux from 0 to 0.91 MW/ , and the maximum water temperature of up to 402 oC. A
physical parametric sensitivity analysis was the technique used to develop and propose an
improved Modified Churchill-Chu correlation with a reasonable agreement with the
University of Ghana http://ugspace.ug.edu.gh

iii
experimental data, having the least root mean square error of about 24% better than the
investigated existing correlations.
University of Ghana http://ugspace.ug.edu.gh

iv
DEDICATION
This research is dedicated to
my parents for their support, advice, love and prayers
and my beloved late grandmother (Hajia Hawa) who departed in February, 2015.(May
her gentle soul rest in the perfect abode of the Almighty Allah)
University of Ghana http://ugspace.ug.edu.gh

v
ACKNOWLEDGEMENTS
First of all, I thank Almighty Allah for guiding me throughout this program and making
this research work possible.
I would like to say a very big thank you to my Parents (Mr. Usman Goro Mateli and
Madam Hajara Dauda), Dr. (Rtd Major) Mustapha Ahmed, Mr. Raphael Annorba Sarpei
and Mr. Zubair Mohammed for their support, advice and motivation.
My gratitude also goes to the School of Nuclear and Allied Sciences, University of
Ghana under the leadership of Prof. Yaw Serfo-Armah for giving me the glorious honour
to pursue my M.Phil program in this noble institution.
I would also like to acknowledge the Lecturers of the Department of Nuclear Engineering
who have given me support in diverse ways. Mentioning a few, I thank Dr. S. K Debrah
and Dr. V. Agbodemegbe for their wonderful contributions and insightful direction
towards the successful completion of this thesis work. I extend my heartfelt gratitude to
the Senior Lecturers of the Department; Nana (Prof.) Ayensu Gyeabour I, Prof. Emeritus
Edward H K Akaho and Dr. K A Danso for the training and fatherly counseling they
offered me. I also thank the Head of Department Dr. Emmanuel Ampomah-Amoako for
his patience and understanding in the manner he handled my colleagues and I.
I sincerely thank Prof. Ing. Walter Ambrosini of the University of Pisa and the China
Institute of Atomic Energy who have made it possible to obtain data for this work.
I wish to also put on record my deep appreciation of the diverse and invaluable
contributions of my colleagues, particularly Mr. Sidique Gawusu.
University of Ghana http://ugspace.ug.edu.gh
vi
TABLE OF CONTENTS
DECLARATION ................................................................................................................. i
ABSTRACT ........................................................................................................................ ii
DEDICATION ................................................................................................................... iv
ACKNOWLEDGEMENTS ................................................................................................ v
TABLE OF CONTENTS ................................................................................................... vi
LIST OF FIGURES ............................................................................................................ x
LIST OF TABLES ............................................................................................................ xii
LIST OF ABBREVIATIONS .......................................................................................... xiii
NOMENCLATURE ......................................................................................................... xv
CHAPTER ONE: INTRODUCTION ............................................................................. 1
1.1 BACKGROUND ....................................................................................................... 1
1.2 Generation IV International Forum (GIF) ................................................................. 2
1.2.1 Goals for Generation IV Reactor Concepts ........................................................ 3
1.3 FEATURES OF SUPERCRITICAL WATER-COOLED REACTOR .................... 4
1.3.1 Supercritical Pressure Water .............................................................................. 6
1.4 PROBLEM STATEMENT ....................................................................................... 7
1.5 JUSTIFICATION ...................................................................................................... 8
1.6 OBJECTIVE.............................................................................................................. 9
1.6.1 Specific Objectives ............................................................................................. 9
1.7 SCOPE OF RESEARCH .......................................................................................... 9
1.8 ORGANIZAION OF THESIS ................................................................................ 11
CHAPTER TWO: LITERATURE REVIEW .............................................................. 13
2.1 INTRODUCTION ................................................................................................... 13
2.2 PHYSICAL PROPERTIES AT SUPERCRITICAL PRESSURES ....................... 13
2.3 DIMENSIONLESS PARAMETERS IN HEAT TRANSFER ............................... 15
2.3.1 Significance of Dimensionless Numbers in Heat Transfer .............................. 15
University of Ghana http://ugspace.ug.edu.gh
vii
2.3.1.1 Reynolds Number (Re)…………………………………………………...16
2.3.1.2 Reyleigh Number (Ra)................................................................................17
2.3.1.3 Prandtl Number (Pr)………………………………………………………18
2.3.1.4 Nusselt Number (Nu)…………………………………………………......19
2.3.1.5 Grashof Number (Gr)…………………………………………………......21
2.3.1.6 Eckert Number (E)………………………………………………………..22
2.4 CONVECTION ....................................................................................................... 23 2.4.1 Natural Convection ........................................................................................... 23
2.4.2 Buoyancy and its Effects in Convection Heat Transfer ................................... 24
2.4.3 FORCED CONVECTION ............................................................................... 24
2.4.3.1 Mechanism of Forced Convection………………………………………...25
2.5 HEAT TRANSFER CORRELATIONS ................................................................. 26
2.5.1 Natural Convection Correlations ...................................................................... 26
2.5.1.1 Churchill and Chu Correlation…………………………………………….27
2.5.1.2 The Schmidt Correlation…………………………………………………..28
2.5.2 Forced Convection Correlations for Supercritical Fluids ................................ 29
2.5.2.1 The Dittus-Boelter Correlation……………………………………………29
2.5.2.2 Dittus-Boelter Equation beyond the Critical Pressure…………………….31
2.5.2.3 The Sieder-Tate Correlation………………………………………………32
2.5.2.4 Miropolski and Shitsman……………………………………………...…..34
2.5.2.5 Petukhov et al Correlation………………………………………………...35
2.5.2.6 The Bishop Correlation………………………………………………...….36
2.5.2.7 The Swenson Correlation…………………………………………………37
2.5.2.8 Yamagata Correlation…………………………………………………….38
2.5.2.9 Churchill and Bernstein Correlation……………………………………....41
2.5.3 Nusselt number for Forced Convection ............................................................ 41
2.6 RESEARCH WORKS ON CORRELATION COMPARISONS ........................... 43
2.7 EXPERIMENTAL DATASET OF CHEN YUZHOU ET AL ............................... 48
2.7.1 Experimental Facility and Procedure of Chen Yuzhou et al., .......................... 48
2.7.2 Experimental Results ........................................................................................ 51
2.7.2.1 Heating Power…………………………………………………………….51
2.7.2.2 Temperature………………………………………………………………51
2.7.2.3 Flow rate……………………………………………………………….....52
2.7.2.4 Heat transfer………………………………………………………………53
2.7.2.5 Comparison of Experimental Results with Existing Correlations………..54
2.7.2.3 Flow rate .................................................................................................... 52
University of Ghana http://ugspace.ug.edu.gh
viii
CHAPTER THREE: METHODOLOGY .................................................................... 57
3.1 INTRODUCTION ................................................................................................... 57
3.2 DEVELOPING IMPROVED CORRELATION FOR NUSSELT ......................... 57
3.2.1 Some local parameters ...................................................................................... 60
3.2.2 Thermophysical properties of water ................................................................. 61
3.2.3 Experimental Analysis ...................................................................................... 62
3.2.3.1 Obtaining the Experimental Nusselt Number……………………………….62
3.3 HEAT TRANSFER CORRELATIONS ................................................................. 64
3.3.1 Using NCLoop For The Computation of the Correlations ............................... 64
3.3.2 Evaluation of Correlations with In-house FORTRAN Program ...................... 65
3.4 GEOMETRY DESCRIPTION ................................................................................ 66
3.4.1 Setting up the loop for Computation using the NCLoop .................................. 66
3.4.2 The Vertical Heating Section ........................................................................... 69
3.5 PHYSICS CONDITIONS ....................................................................................... 69
3.6 Transport Equations for the NCLoop ...................................................................... 69
3.6.1 Mass Balance in the Fluid ................................................................................ 70
3.6.2 Momentum balance in a staggered mesh scheme ............................................. 70
3.6.3 Energy Balance in the Fluid ............................................................................. 71
3.7 PARAMETRIC SENSITIVITY ANALYSIS ......................................................... 71
3.7.1 Sensitivity Analysis: Step I............................................................................... 72
3.7.2 Sensitivity Analysis: Step II ............................................................................. 74
3.7.3 Sensitivity Analysis: Step III ............................................................................ 75
3.7.4 Sensitivity Analysis: Step IV ............................................................................ 75
3.7.5 Sensitivity Analysis: Step V ............................................................................. 77
3.8 ERROR ANALYSIS ............................................................................................... 81
CHAPTERFOUR: RESULTS AND DISCUSSIONS .................................................. 83
4.1 INTRODUCTION ................................................................................................... 83
4.2 VALIDATION OF MASS FLOW RATE DATA .................................................. 83
4.3 NUSSELT NUMBER COMPARISONS ................................................................ 85
CHAPTER FIVE: CONCLUSIONS AND RECOMMENDATIONS ..................... 102
5.1 CONCLUSION ..................................................................................................... 102
University of Ghana http://ugspace.ug.edu.gh

ix
5.2 RECOMMENDATIONS ...................................................................................... 103
REFERENCES ............................................................................................................... 105
APPENDICES ................................................................................................................ 114
University of Ghana http://ugspace.ug.edu.gh
x
LIST OF FIGURES
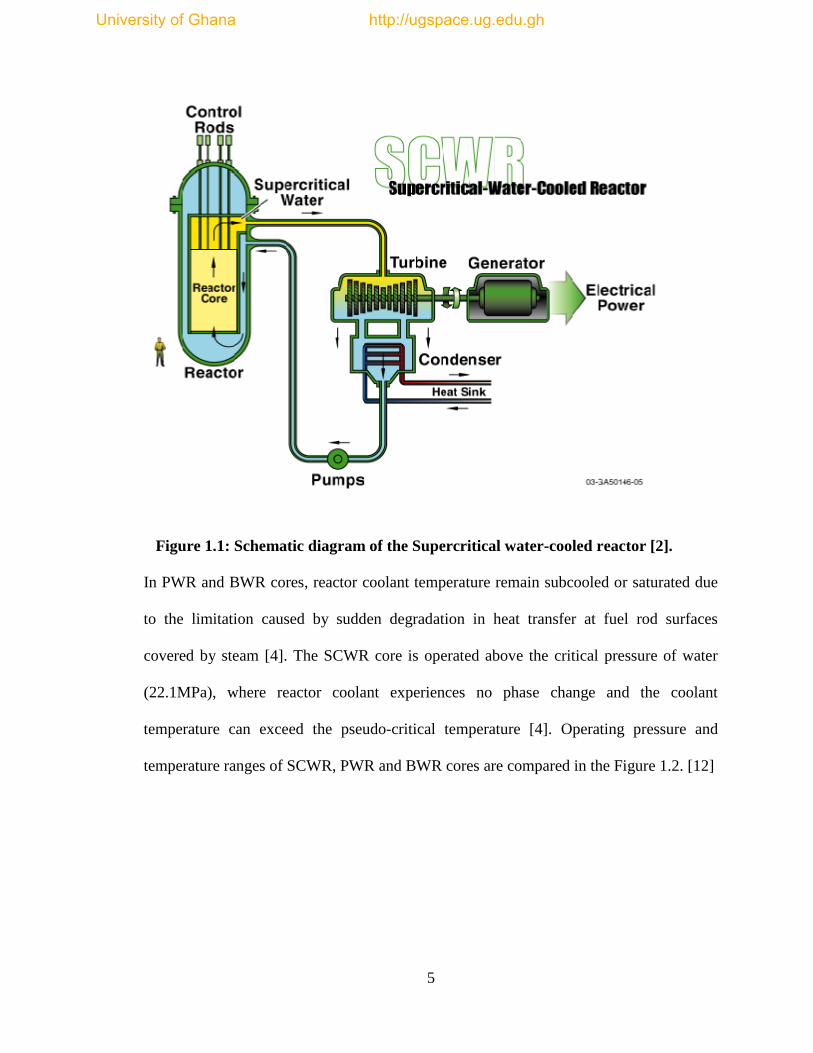
Figure 1.1: Schematic diagram of the Supercritical water-cooled reactor. ......................... 5
Figure 1.2: Operating conditions of SCWR, PWR and BWR cores .................................. 6
Figure 1.3: Phase diagram for water ................................................................................... 7
Figure 1.4: Schematic of The Sectioned Natural Circulation Loop (Not To Scale). ........ 11
Figure 2.1: Specific heat versus temperature at two different pressures .......................... 14
Figure 2.2: Density versus temperature at two different pressures .................................. 14
Figure 2.3: Comparison of Nusselt numbers .................................................................... 33
Figure 2.4: Experimental data compared with Yamagata et al correlation ....................... 39
Figure 2.5: Comparison of the predictions of various correlations with experimental
data .................................................................................................................................... 40
Figure 2.6: Heat Transfer Coefficient According to Different Correlations ................... 45
Figure 2.7(a): Comparison of HTC values calculated with Sarah Mokry proposed
correlation………………………………………………………………………………..47
Figure 2.7(b): Comparison of HTC values calculated with Sarah Mokry proposed
correlation ……………………………………………………………………………….47
Figure 2.8: Schematic of natural circulation loop……………………………………….50
Figure 2.9: History of Heating Power…………………………………………………...51
Figure 2.10: Variation of the Inlet And Outlet Water Temperature……………………. 52
Figure 2.11: Variation of the Flow Rate with Power ………………………………........52
Figure 2.12: Variation of Tw,I And Tb With Power(Z = 1.27 m) ..................................... 54
Figure 2.13. Ratio of NuM/NuC versus power for different correlations ......................... 55
Figure 3.1: Comparison Between the Regular and Averaged Specific Heat Capacity
Values……………………………………………………………………………………75
Figure 3.2: Comparison between the Regular and Averaged Specific Heat Capacity
Values……………………………………………………………………………………76
Figure 4.1: Validation of Mass Flow Rate with CIAE Data. ........................................... 84
Figure 4.2: Nusselt number Comparisons Between Churchill-Chu, Dittus-Boelter and
Experimental. .................................................................................................................... 86
Figure 4.3: A Plot of Nusselt number versus Power for Churchill-Chu,Dittus-Boelter
correlation and experimental data. .................................................................................... 88
University of Ghana http://ugspace.ug.edu.gh
xi
Figure 4.4: Comparisons of the Modified Churchill-Chu (1) and Original Churchill-Chu
Correlations with the Experimental Data. ......................................................................... 90
Figure 4.5: Comparisons of the Modified Churchill-Chu (2) and Original Churchill-Chu
Correlations with the Experimental Data………………………………………………...90
Figure 4.6: Comparisons of the Modified Churchill-Chu (1&2), Bishop and Original
Churchill-Chu Correlations with the Experimental Data.................................................. 93
Figure 4.7: Comparisons of the Modified Churchill-Chu (3) and Original Churchill-Chu
Correlations with the Experimental Data. ......................................................................... 95
Figure 4.8: Comparison of the Modified Churchill-Chu (4) and Original Churchill-Chu
Correlations with the Experimental Data. ......................................................................... 96
Figure 4.9: Comparison of Modified Churchill-Chu(5) correlations with Experimental
Data. .................................................................................................................................. 98
Figure 4.10:Comparison of Original and Modified Churchill-Chu Correlations with
Experimental. .................................................................................................................... 99
University of Ghana http://ugspace.ug.edu.gh
xii
LIST OF TABLES
Table 2.1: Selected Correlations of Heat Transfer Coefficient ........................................ 44
Table 3.1: List of Empirical Heat Convection Correlations Investigated. ........................ 58
Table 3.2: List of dimensionless numbers used in calculating the correlations. ............... 59
Table 3.3: Local parameters and their relations. ............................................................... 60
Table 3.4: Dataset Test Matrix.......................................................................................... 63
Table 3.5: Number of Nodes, Length And Area of Each Pipe of the NCL. ..................... 68
Table 3.6 List of the preliminary modified correlations ................................................... 79
Table 3.7: List of correlations with their dimensionless numbers. ................................... 80
Table 4.1: Error Estimation for the prediction by Dittus-Boelter and Churchill-Chu. ..... 87
Table 4.2: List of Errors in the Churchill-Chu and Bishop Correlations. ......................... 89
Table 4.3: List of newly modified correlations. .............................................................. 100
Table 4.4: List of Errors for the Modified Churchill-Chu (1-4) correlations. ................ 100
University of Ghana http://ugspace.ug.edu.gh

xiii
LIST OF ABBREVIATIONS
BWR Boiling Water Reactor
CC Churchill-Chu
CIAE China Institute of Atomic Energy
DB Dittus-Boelter
GFR Gas-cooled Fast Reactor
GIF Generation-IV International Forum
HTC Heat Transfer Coefficient
HTD Heat Transfer Deterioration
HTE Heat Transfer Enhancement
HWR Heavy Water Reactor
IAEA International Atomic Energy Agency
LFR Lead-cooled Fast Reactor
LWR Light Water Reactor
MCC Modified Churchill-Chu
ME Mean Error
University of Ghana http://ugspace.ug.edu.gh

xiv
MSR Molten Salt Reactor
NPP Nuclear Power Plants
PCR Pseudocritical Region
PWR Pressurised Water Reactor
R&D Research and Development
RMSE Root Mean Square Error
SCFPPs Supercritical Fossil Power Plants
SFR Sodium-cooled Fast Reactor
SCWR Supercritical Water-Cooled Reactor
VHTR Very-High-Temperature Reactor
University of Ghana http://ugspace.ug.edu.gh
xv
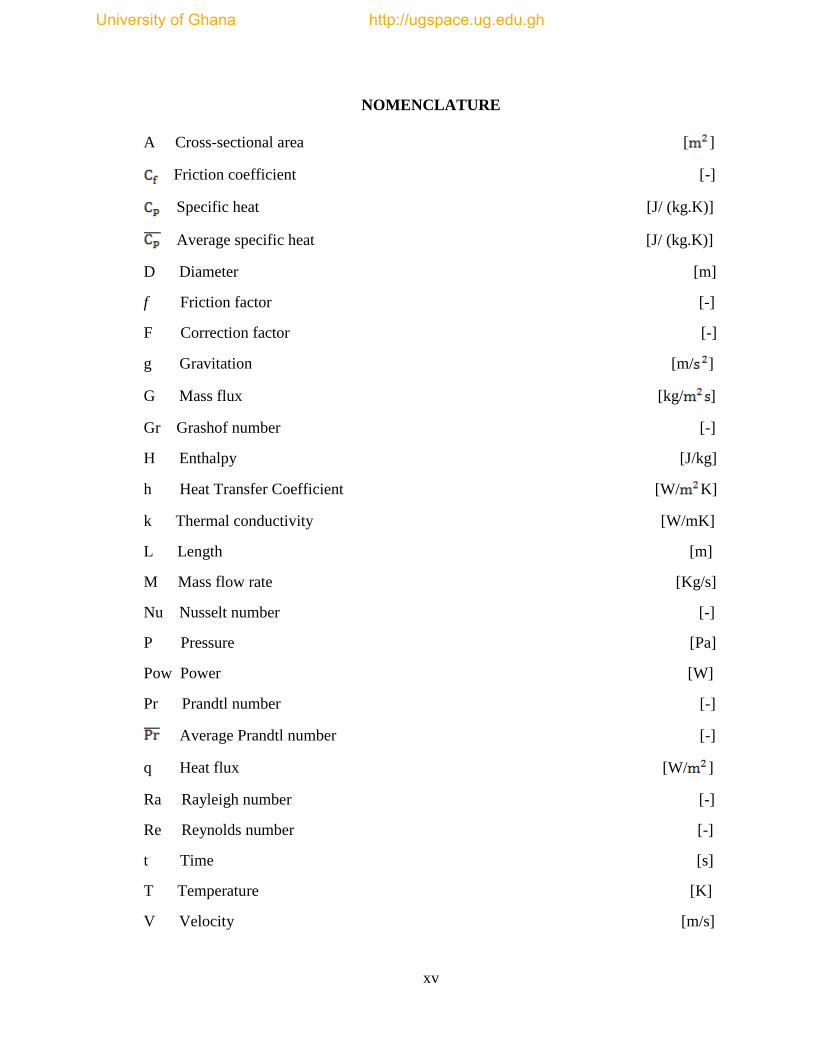
NOMENCLATURE
A Cross-sectional area [ ]
Friction coefficient [-]
Specific heat [J/ (kg.K)]
Average specific heat [J/ (kg.K)]
D Diameter [m]
f Friction factor [-]
F Correction factor [-]
g Gravitation [m/ ]
G Mass flux [kg/ ]
Gr Grashof number [-]
H Enthalpy [J/kg]
h Heat Transfer Coefficient [W/ K]
k Thermal conductivity [W/mK]
L Length [m]
M Mass flow rate [Kg/s]
Nu Nusselt number [-]
P Pressure [Pa]
Pow Power [W]
Pr Prandtl number [-]
Average Prandtl number [-]
q Heat flux [W/ ]
Ra Rayleigh number [-]
Re Reynolds number [-]
t Time [s]
T Temperature [K]
V Velocity [m/s]
University of Ghana http://ugspace.ug.edu.gh

xvi
Greek symbols
α Thermal Diffusivity [m2/s]
β Average film mean temperature [ ]
µ Dynamic viscosity [kg/ (m s)]
ρ Density [kg/ ]
ν Kinematic viscosity/viscous diffusion rate [m2/s]
Subscripts
b Bulk
w Wall
Pc Pseudocritical
min Minimum between wall and bulk value
University of Ghana http://ugspace.ug.edu.gh
1
CHAPTER ONE: INTRODUCTION
1.1 BACKGROUND
The expectation for nuclear power has been rising due to concerns about energy supply
security and global climate change. The demand for energy is estimated to increase by 45
percent between the years 2006 and 2030. And since the demand is expected to further
increase and diversify even after 2030, nuclear energy is one of the areas given much
attention [1].The renewed interest for heat transfer and fluid flow analysis in supercritical
fluids has been established since the supercritical water cooled reactor (SCWR) has been
identified as one of the six Generation-IV nuclear reactors by Generation-IV International
Forum (GIF) [2].
The SCWR is a high-temperature, high-pressure water-cooled reactor supposed to
operate above the critical pressure of water (22.1MPa) and critical temperature of water
(374ºC). The SCWR concept aims at a high thermal efficiency and considerable
reduction of the capital cost with an estimated construction cost of $900 per kilowatt
which is over three times cheaper than the estimated overnight cost of advanced nuclear
reactors ($3100 per kilowatt) estimated by the US department of energy [2].
The SCWR is considered very promising due to its advantages. The advantages of the
SCWR over the Pressurized Water Reactor (PWR) and Boiling Water Reactor (BWR)
include:
High thermal efficiency of around 44% compared to the existing 33-35% for
LWR’s [3].
University of Ghana http://ugspace.ug.edu.gh
2
Avoidance from the boiling crisis (Since the supercritical fluid is single phase
coolant) [4].
Plant simplification or compact plant system and close proximity to the proven
technology for supercritical fossil power plants (SCFPPs) [5].
Because the supercritical water has characteristics of higher enthalpy, it makes it
an effective coolant as it needs lower mass flow rate per unit core thermal power.
This results in the reduction in the size of pumps, piping, associated equipment
and pumping power as well. As the supercritical condition ensures single phase
flow dynamics, the needs for steam separators, recirculation pumps and steam
generators are also eliminated [5].
Although the supercritical fluid present some advantages, the sharp changes in fluid
properties like density produces prominent buoyancy effects and sharp increase in
thermal expansion coefficient resulting in large acceleration effects. These two effects
combined with the large property changes near pseudocritical region (PCR) may cause
decrease in the heat transfer coefficient. This phenomenon is referred as heat transfer
deterioration (HTD) which results in an increase in the wall temperature.
Heat transfer at supercritical pressures is influenced by significant changes in thermal-
physical properties at these conditions. The most significant properties variations occur
within critical and pseudocritical points [6].
1.2 Generation IV International Forum (GIF)
To meet the challenges of nuclear energy for future societies, ten countries came together
in 2001 to initiate the GIF to collaboratively develop the next generation of nuclear-
University of Ghana http://ugspace.ug.edu.gh
3
energy systems, which will provide competitively-priced and reliable energy in a safe and
sustainable manner.
The Generation IV International Forum’s primary objective is to conduct collaborative
Research and Development (R&D) that will lead to the development of fourth generation
or Generation IV nuclear energy systems.
Over 100 potential nuclear reactor concepts were reviewed by an international panel of
experts. Upon the review, six (6) reactor concepts that best matched the Generation IV
objectives of sustainability, economics, safety and reliability, proliferation resistance and
physical protection, were selected in 2002 [2].
These include:
1) Very-High-Temperature Reactor (VHTR),
2) Sodium-cooled Fast Reactor (SFR),
3) Supercritical Water-cooled Reactor (SCWR),
4) Gas-cooled Fast Reactor (GFR),
5) Lead-cooled Fast Reactor (LFR), and
6) Molten Salt Reactor (MSR).
1.2.1 Goals for Generation IV Reactor Concepts
Goals for Generation IV Reactors, as presented by GIF are [7]:
Sustainability – In terms of sustainability, Generation IV nuclear-energy systems will run
bearable energy generation that meets clean-air objectives and stimulates long-term
availability of systems and effective fuel utilization for worldwide energy production. In
addition, Generation IV nuclear-energy systems will minimize and manage their nuclear
University of Ghana http://ugspace.ug.edu.gh

4
waste as it shall notably lessen the long-term stewardship burden, thereby improving
protection for public health and the environment at large.
Economic Benefits – Generation IV nuclear-energy systems will have a clear lifecycle
cost advantage over other energy sources. Despite Generation IV nuclear-energy systems
having a level of financial risk, its economic benefits supersede other energy projects
comparatively.
Safety and Reliability – Safety and reliability of operations will be highly achieved with
Generation IV nuclear-energy system. These systems will have a very low likelihood and
degree of reactor-core damage and will eliminate the need for offsite emergency
response.
Proliferation Resistance and Physical Protection – Enhanced proliferation resistance
and physical protection (PR&PP) is one of the technology goals for advanced nuclear
concepts. Generation IV nuclear energy systems will increase the assurance that they are
a very unattractive, unappealing and the least desirable route for diversion or theft of
weapons-usable materials, and provide increased physical protection against acts of
terrorism [2].
1.3 FEATURES OF SUPERCRITICAL WATER-COOLED REACTOR
The SCWR is the only GIF concept that uses water as coolant, as it adopts natural
evolution of current advanced water-cooled reactor technologies for cooling. It is
designed using the successfully deployed pressure-vessel or pressure-tube reactor
technologies. The schematic diagram of the SCWR system is shown in the Figure 1.1.
University of Ghana http://ugspace.ug.edu.gh
5
Figure 1.1: Schematic diagram of the Supercritical water-cooled reactor [2].
In PWR and BWR cores, reactor coolant temperature remain subcooled or saturated due
to the limitation caused by sudden degradation in heat transfer at fuel rod surfaces
covered by steam [4]. The SCWR core is operated above the critical pressure of water
(22.1MPa), where reactor coolant experiences no phase change and the coolant
temperature can exceed the pseudo-critical temperature [4]. Operating pressure and
temperature ranges of SCWR, PWR and BWR cores are compared in the Figure 1.2. [12]
University of Ghana http://ugspace.ug.edu.gh
6
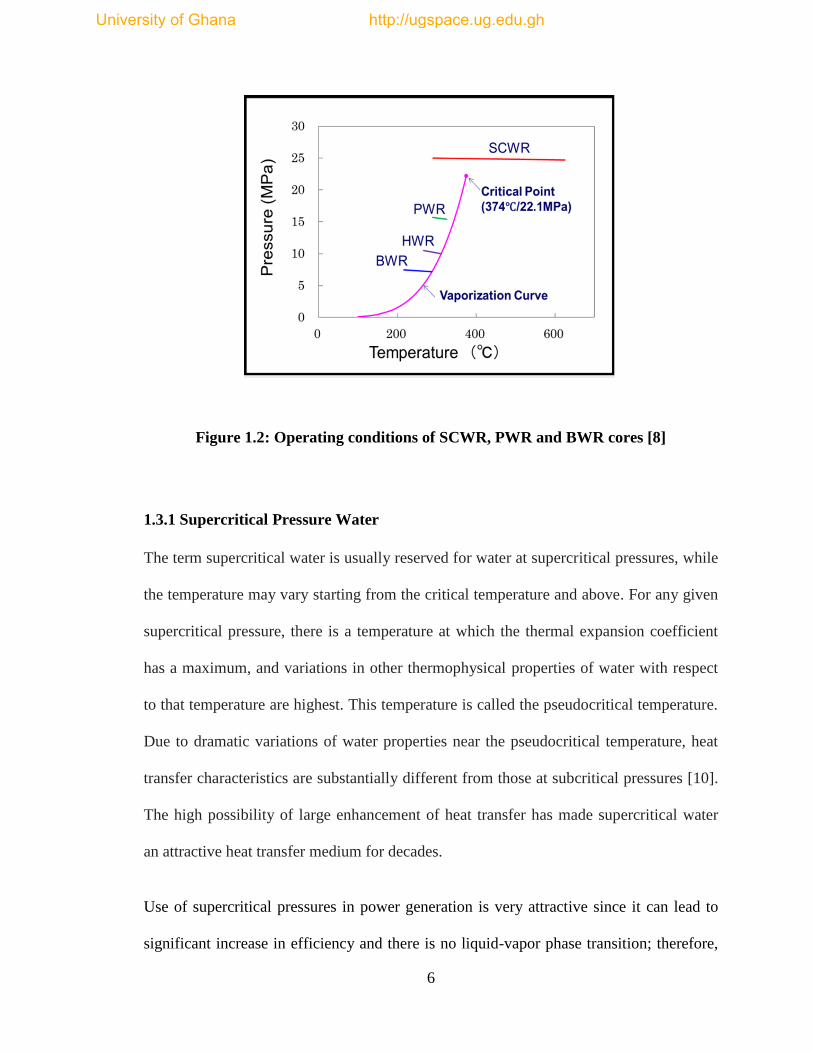
Figure 1.2: Operating conditions of SCWR, PWR and BWR cores [8]
1.3.1 Supercritical Pressure Water
The term supercritical water is usually reserved for water at supercritical pressures, while
the temperature may vary starting from the critical temperature and above. For any given
supercritical pressure, there is a temperature at which the thermal expansion coefficient
has a maximum, and variations in other thermophysical properties of water with respect
to that temperature are highest. This temperature is called the pseudocritical temperature.
Due to dramatic variations of water properties near the pseudocritical temperature, heat
transfer characteristics are substantially different from those at subcritical pressures [10].
The high possibility of large enhancement of heat transfer has made supercritical water
an attractive heat transfer medium for decades.
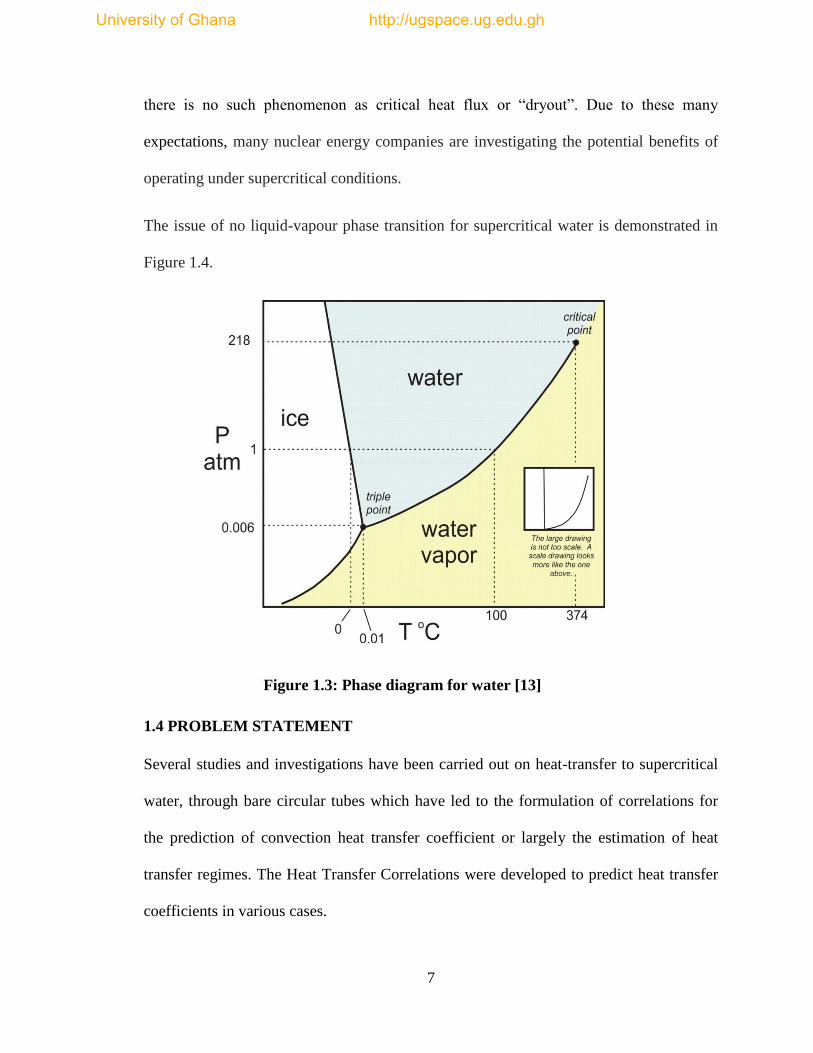
Use of supercritical pressures in power generation is very attractive since it can lead to
significant increase in efficiency and there is no liquid-vapor phase transition; therefore,
University of Ghana http://ugspace.ug.edu.gh
7
there is no such phenomenon as critical heat flux or “dryout”. Due to these many
expectations, many nuclear energy companies are investigating the potential benefits of
operating under supercritical conditions.
The issue of no liquid-vapour phase transition for supercritical water is demonstrated in
Figure 1.4.
Figure 1.3: Phase diagram for water [13]
1.4 PROBLEM STATEMENT
Several studies and investigations have been carried out on heat-transfer to supercritical
water, through bare circular tubes which have led to the formulation of correlations for
the prediction of convection heat transfer coefficient or largely the estimation of heat
transfer regimes. The Heat Transfer Correlations were developed to predict heat transfer
coefficients in various cases.
University of Ghana http://ugspace.ug.edu.gh
8
However, there are still some uncertainties and deficiencies in the accurate prediction of
supercritical fluid heat transfer coefficient due to the large and fast variations of fluid
properties in the pseudocritical region [14].
A number of empirical generalized correlations have been proposed to calculate the Heat-
transfer in forced convection for various fluids including water at supercritical pressures.
However, differences in calculated heat-transfer correlations values can be up to several
hundred percent [15].
A comparison of selected supercritical-water heat-transfer correlations has shown
deviation in results from one another by more than 200%. The high degree of variance in
the prediction by the existing correlations bring to fore the need to develop suitable
supercritical-water heat-transfer correlation [16].
1.5 JUSTIFICATION
Although many empirical correlations for heat transfer coefficients of supercritical water
have been proposed, their prediction accuracy is not satisfactory due to investigated cases
of significant underestimation or overestimation of experimental Nusselt as reported in
previous research works. Thus, the development of more accurate correlations, as well as
the review of available correlations in relation to experimental data is necessary. This is
to provide a sound basis for safety code developers to estimate more accurately, the heat
transfer coefficient involving supercritical fluids.
University of Ghana http://ugspace.ug.edu.gh
9
1.6 OBJECTIVE
The main aim of this study is to develop an improved heat transfer correlations for
Supercritical Pressure Water as a basis to reactor safety in a natural circulation loop.
1.6.1 Specific Objectives
In order to achieve the objective set for this study, the following specific objectives have
been outlined:
Compute and compare the results of a standard Dittus-Boelter correlation with
experimental data to investigate how accurate the Dittus-Boelter correlation
predicts the experimental Nusselt number.
Compute and compare the results of the Churchill-Chu (1977) Correlation with
experimental data in order to investigate its measure of accuracy in the estimation
of the experimental Nusselt number.
Compute and compare the Bishop Correlation with experimental data to discover
its degree of accuracy in predicting the experimental data.
Based on the results of Dittus-Boelter, Bishop and Churchill-Chu correlations in
this work develop an improved correlation suited for SCWR.
Compare the newly improved correlation with the existing correlations and
experimental data to assess its suitability.
1.7 SCOPE OF RESEARCH
This research work focuses on the supercritical-water heat-transfer in a vertical heating
section of a rectangular Natural Circulation Loop having an upward flow.
University of Ghana http://ugspace.ug.edu.gh
10
The experimental data for this study was an experiment performed at the China Institute
of Atomic Energy (CIAE) [17]. The experimental setup is basically a rectangular natural
circulation loop of supercritical water under transient conditions, with a heating section at
a vertical side and an annular heat exchanger at the top horizontal side. Natural
circulation loop was considered for the research because in various evolutional and
innovative water-cooled reactors, the passive safety systems are designed to work in
natural circulation.
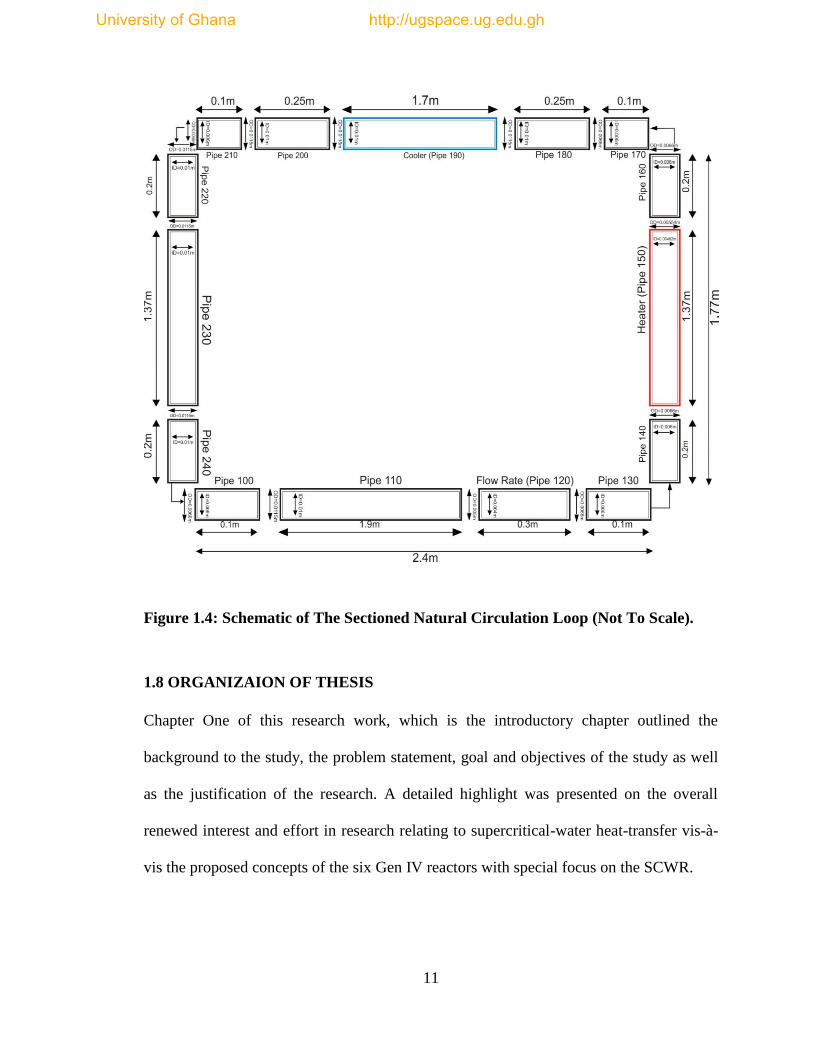
The heat transfer analysis for this study is limited to the heating section (tube) of the
natural circulation loop, having a length of 1.37 m and an inner circular diameter of
0.00462 m.
The thermophysical properties of water and other parameters for calculations in this work
were therefore obtained based on the results of the above mentioned experiment.
Comparison of the mass flow rates for the correlations and the experimental data were
run using a FORTRAN code, NCLoop developed by Walter Ambrosini.
Other heat transfer characteristics computations, such as the calculations of Nusselt
numbers for the considered heat transfer correlations were done using an in-house
FORTRAN code developed (provided in appendices J-M). The schematic diagram of the
rectangular tube with the dimensions of the various subsections of the loop is provided
below.
University of Ghana http://ugspace.ug.edu.gh
11
Figure 1.4: Schematic of The Sectioned Natural Circulation Loop (Not To Scale).
1.8 ORGANIZAION OF THESIS
Chapter One of this research work, which is the introductory chapter outlined the
background to the study, the problem statement, goal and objectives of the study as well
as the justification of the research. A detailed highlight was presented on the overall
renewed interest and effort in research relating to supercritical-water heat-transfer vis-à-
vis the proposed concepts of the six Gen IV reactors with special focus on the SCWR.
University of Ghana http://ugspace.ug.edu.gh
12
Chapter Two present a literature review on the general behavior of supercritical water,
basic parameters (both dimensional and non-dimensional) used in heat convection
problems and reviews of previous works on heat transfer correlations for both natural and
forced convections.
Chapter Three discusses the systematic methodology developed and employed in this
work to the realization of an improved correlation for the prediction of heat transfer
coefficient for applications in SCWR.
In the Chapter Four, the results obtained as a result of computations of various
correlations and their comparisons with the experimental data were discussed thoroughly.
Based on the deviations noticed from the comparisons, parametric sensitivity analysis
was conducted to form the basis for the development of an improved correlation
In Chapter Five, the findings in this work in the form of conclusions and recommendation
for future work are presented here. It is shown that the objectives set forth for this work
have been met successfully.
The background and general features of the SCWR concept was successfully explained in
this opening Chapter with its advantages. The problems associated with Heat transfer
correlations have been spelt out.
The justification, scope and objectives of the study area were also clearly discussed in
separate sections of the Chapter.
The next chapter presents a literature review of the various heat transfer correlations (for
both forced and natural convection) used in SCWR’s simulation.
University of Ghana http://ugspace.ug.edu.gh
13
CHAPTER TWO: LITERATURE REVIEW
2.1 INTRODUCTION
This section presents a literature review of heat transfer correlations and fluid flow at
supercritical conditions. The areas of studies to be reviewed shall include Theoretical,
Experimental and Computational.
Most of the correlations in the literature were derived empirically based on experimental
results. Several correlations were derived or verified for heat transfer in supercritical
water and in circular tubes. To the knowledge of most present authors or researchers,
there are no correlations developed for flow channels other than circular tubes.
This chapter again presents explanations to some basic principles and key terminologies
related to fluid flow and heat transfer, and also outline some reviews of research works
conducted with empirical correlations of heat transfer for supercritical fluids.
The experiment from which data for this work was obtained was also presented in details
in the final section of this Chapter.
2.2 PHYSICAL PROPERTIES AT SUPERCRITICAL PRESSURES
Heat transfer at supercritical pressure is mainly characterized by the thermal-physical
properties which vary strongly.
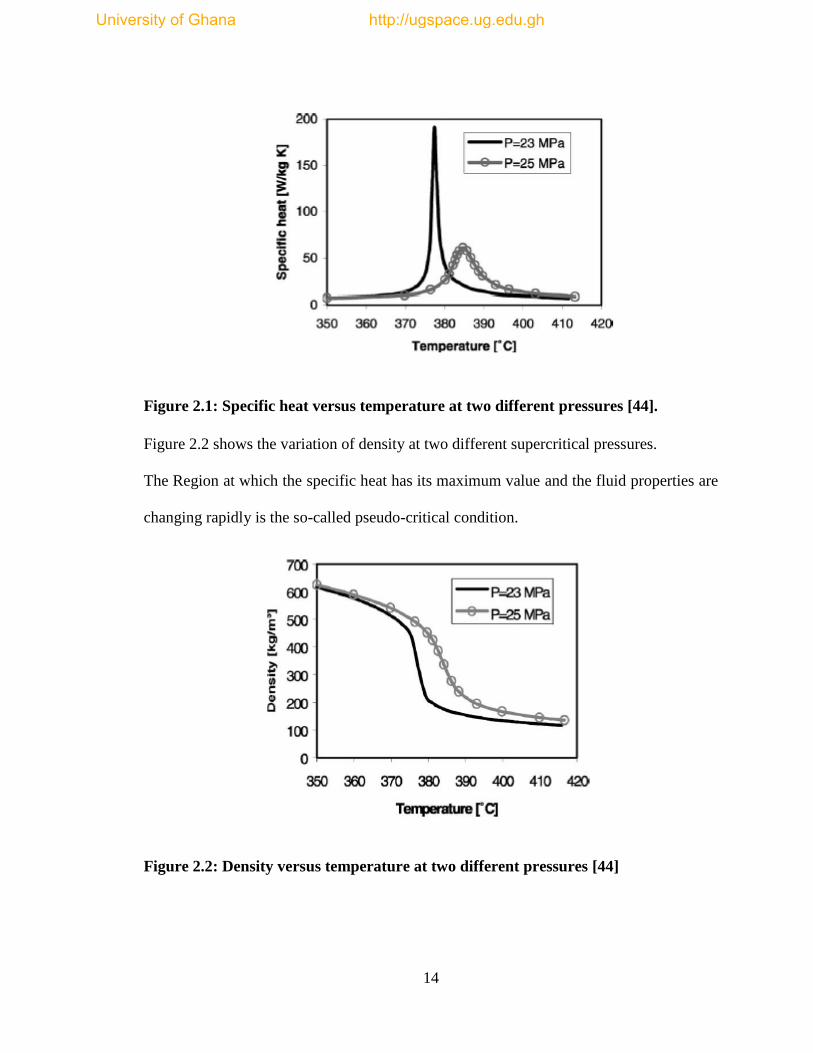
Figure 2.1 shows the variation of specific heat at two different supercritical pressures
University of Ghana http://ugspace.ug.edu.gh
14
Figure 2.1: Specific heat versus temperature at two different pressures [44].
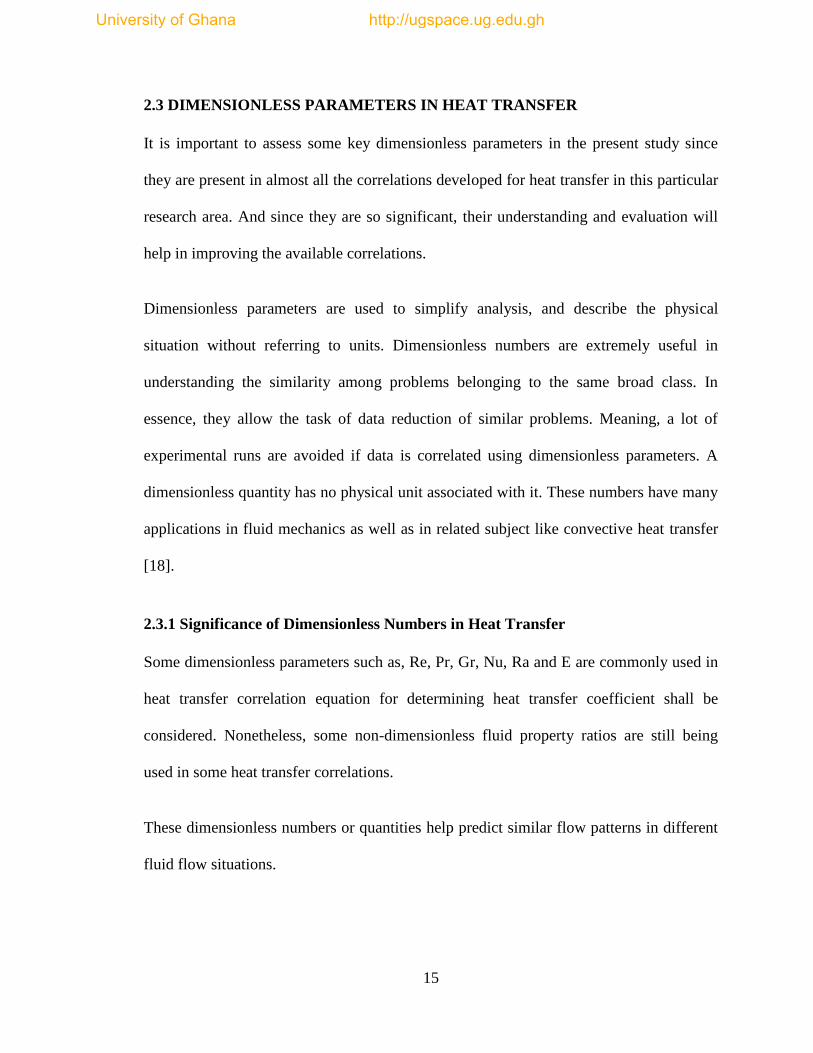
Figure 2.2 shows the variation of density at two different supercritical pressures.
The Region at which the specific heat has its maximum value and the fluid properties are
changing rapidly is the so-called pseudo-critical condition.
Figure 2.2: Density versus temperature at two different pressures [44]
University of Ghana http://ugspace.ug.edu.gh
15
2.3 DIMENSIONLESS PARAMETERS IN HEAT TRANSFER
It is important to assess some key dimensionless parameters in the present study since
they are present in almost all the correlations developed for heat transfer in this particular
research area. And since they are so significant, their understanding and evaluation will
help in improving the available correlations.
Dimensionless parameters are used to simplify analysis, and describe the physical
situation without referring to units. Dimensionless numbers are extremely useful in
understanding the similarity among problems belonging to the same broad class. In
essence, they allow the task of data reduction of similar problems. Meaning, a lot of
experimental runs are avoided if data is correlated using dimensionless parameters. A
dimensionless quantity has no physical unit associated with it. These numbers have many
applications in fluid mechanics as well as in related subject like convective heat transfer
[18].
2.3.1 Significance of Dimensionless Numbers in Heat Transfer
Some dimensionless parameters such as, Re, Pr, Gr, Nu, Ra and E are commonly used in
heat transfer correlation equation for determining heat transfer coefficient shall be
considered. Nonetheless, some non-dimensionless fluid property ratios are still being
used in some heat transfer correlations.
These dimensionless numbers or quantities help predict similar flow patterns in different
fluid flow situations.
University of Ghana http://ugspace.ug.edu.gh
16
2.3.1.1 Reynolds Number (Re)
The Reynolds number is defined as the ratio of inertial forces to viscous forces (which
are the two forces that influence the behavior of fluid flow in the boundary layer) and
consequently quantifies the relative importance of these two types of forces for given
flow condition [19].
Inertial forcesRe
Viscous forces (2.1a)
2VInertial forces
L
(2.1b)
2
VViscous forces
L
(2.1c)
2 2V L VLRe
L V
(2.1d)
where:
ρ is density of the flowing fluid.
μ is viscosity of the flowing fluid.
L is a characteristic length of the problem. For pipe flow L=D, where D is the pipe
diameter.
V is a characteristic velocity of the problem. For pipe flow V= , where is the mean
velocity (obtained by dividing the volumetric flow rate by the cross-sectional area).
The Reynolds Number can be used to determine if flow is laminar, transient or turbulent.
The flow is considered as;
University of Ghana http://ugspace.ug.edu.gh
17
laminar when Re < 2300
transient when 2300 < Re < 4000
turbulent when Re > 4000
The Reynolds number is considered the most important dimensionless number in fluid
mechanics, since it is an input parameter for all forced flows and a criterion used for
classifying the laminar and turbulent regimes.
2.3.1.2 Reyleigh Number (Ra)
The Rayleigh number is defined as the product of the Grashof and Prandtl numbers. It is
interpreted as the ratio of buoyant field by a vertically displaced particle and the energy
consumed by viscous dissipation during this displacement [45]. It described
mathematically as:
3
S Bg T T LRa Gr Pr
(2.2)
where
g = Acceleration due to gravity
β = Thermal expansion coefficient
= Surface temperature
= Bulk temperature
L = Length of tube
v = Kinematic Viscosity
α = Thermal diffusivity
University of Ghana http://ugspace.ug.edu.gh
18
2.3.1.3 Prandtl Number (Pr)
The Prandtl Number is a dimensionless number approximating the ratio of momentum
diffusivity (kinematic viscosity) and thermal diffusivity [19]. Momentum and thermal are
two important physical parameters responsible for the growth of boundary layers. The
ratio of the relative thickness between them, that is, momentum diffusivity and thermal
diffusivity gives the Prandtl number.
Prandtl number is a property of the fluid (and not of the flow situation) which represents
the ease at which the fluid is able to transfer momentum or shear forces to the ease by
which the fluid can transfer heat.
Molecular diffusivity of momentum Kinematic viscosity
Molecular diffusivity of heat Thermal diffusiviPr
t
(2.2a)
Kinematic Viscosity
(2.2b)
p
Thermal diffusivityC
(2.2c)
p pC CPr
(2.2d)
Where:
μ is viscosity of the flowing fluid
is the constant-pressure specific heat of the flowing fluid.
k is the thermal conductivity of the flowing fluid.
University of Ghana http://ugspace.ug.edu.gh
19
ρ is the density of the flowing fluid.
The Prandtl Number is often used in heat transfer, and free and forced convection
calculations and depends on the following fluid properties.
gases - Pr ranges (0.7 - 1.0)
water - Pr ranges (1 – 10)
liquid metals - Pr ranges (0.001 - 0.03)
oils - Pr ranges (50 – 2000)
Pr = 1, means the boundary layers coincide (the ratio of velocity boundary layer to
thermal boundary layer). When Pr is small, it means that heat diffuses very quickly
compared to the velocity (momentum).
The larger the Prandtl number, the thicker will be the momentum boundary layer
compared to the thermal boundary layer. The physical significance of the Prandtl number
is, thus, very strong, since it is the only required dimensionless parameter that relates the
thermal and momentum boundary layer thickness. Therefore, the Prandtl number presents
the understanding of the two boundary layers, that is, the hydrodynamic boundary layer
and the thermal boundary layer.
2.3.1.4 Nusselt Number (Nu)
The Nusselt number is a dimensionless heat transfer coefficient and is applied when
dealing with convection. It, therefore, provides a measure of the convection heat transfer
at the surface.
University of Ghana http://ugspace.ug.edu.gh
20
The Nusselt number in heat transfer at a boundary within a fluid is the ratio
of convective to conductive heat transfer across the boundary [19]. The conductive
component is measured under the same conditions as the heat convection but with a
hypothetically stagnant fluid. The Nusselt number represents the relative importance of
conduction thermal resistance to the convective thermal resistance.
Convective heat transferNu
Conductive heat transfer (2.3a)
Convective heat transfer = hA [20]. (2.3b)
A TConductive heat =
L
(2.3c)
Nusselt becomes: hA T hL
NuA T / L
(2.3d)
Where:
h is the convective heat transfer coefficient.
L is a characteristic length of the problem. For pipe flow L = D, where D is the
pipe diameter.
k = thermal conductivity of the fluid
A high Nusselt number represents a very good convection situation, since a high
convective force to low conduction result in a high Nusselt number. In a situation where
forced convection is significant, we expect the convective heat transfer coefficient to be
high and hence the resistance to convection which is the denominator to be low.
University of Ghana http://ugspace.ug.edu.gh
21
Typically, for free convection, the average Nusselt number is expressed as a function of
the Rayleigh number and the Prandtl number, written as: Nu = f (Ra, Pr).
Conversely, for forced convection, the Nusselt number is generally a function of
the Reynolds number and the Prandtl number, or Nu = f (Re, Pr).
Several empirical correlations of the Nusselt form have been developed for the estimation
of heat transfer and fluid flow.
2.3.1.5 Grashof Number (Gr)
The Grashof number, Gr is a dimensionless number in fluid dynamics and heat transfer
which approximates the ratio of the buoyancy to viscous force acting on a fluid [19]. It
frequently arises in systems involving natural convection. Grashof number is used in
analyzing the velocity distribution in free convection systems. Free convection is the
natural tendency of a substance to migrate due to some driving force. In free convection,
the driving force is a buoyancy force caused by a temperature gradient; therefore the fluid
should be at rest in the absence of temperature variations. The Grashof number can be
said to be analogous to the Reynolds number in forced convection.
Buoyancy forceGr
Viscous force (2.4a)
3
2
g TLGr
(2.4b)
3
2
g TLGr
(2.4c)
Where
University of Ghana http://ugspace.ug.edu.gh
22
β is the thermal expansion coefficient or the inverse of the film (mean) temperature.
ρ is the density evaluated at the mean temperature.
g is the gravitational constant.
ΔT is the temperature difference between wall surface temperature and the bulk
temperature.
L is the distance between regions of high temperature and low temperature.
is the kinematic viscosity of the fluid.
In free convection, buoyancy driven flow sometimes dominates the flow inertia,
therefore, the Nusselt number is a function of the Grashof number and the Prandtl
number alone: Nu = f (Gr, Pr). Reynolds number will be important if there is an
external flow.
2.3.1.6 Eckert Number (E)
The Eckert number (E) is a dimensionless parameter defined as the Kinetic energy of the
flow relative to the boundary layer enthalpy difference. It is very useful in determining
the relative importance of kinetic energy of a flow in heat transfer situation [31].
Mathematically it is described as:
2
p
uE
C T
(2.5)
Where:
u= is the local flow velocity of the continuum
= Specific heat capacity
University of Ghana http://ugspace.ug.edu.gh
23
ΔT= Difference between the wall and local temperature.
2.4 CONVECTION
Convection is the mechanism of heat transfer through a fluid in the presence of bulk fluid
motion. It involves the movement of molecules within fluids and is one of the major
modes of heat and mass transfer in liquids and gas [20].
Convection is classified as natural (or free) and forced convection depending on how the
fluid motion is initiated and sustained.
Convection heat transfer takes place whenever a fluid is in contact with a solid surface
that is at a different temperature than the fluid.
2.4.1 Natural Convection
Natural Convection or Free Convection occurs due to temperature differences affecting
density which result in buoyancy (more or less dense) [21]. This leads to bulk fluid
movement. It also leads to a more rapid movement between two fluids of large density
differences and could consequently lead to a larger acceleration.
In natural convection, the fluid motion occurs by natural means such as buoyancy. Since
the fluid velocity associated with natural convection is relatively low, the heat transfer
coefficient encountered in natural convection is also low.
Whenever two bodies in contact move relative to each other, a frictional force develops at
the contact surface in the direction opposite to that of the motion [21].
University of Ghana http://ugspace.ug.edu.gh
24
2.4.2 Buoyancy and its Effects in Convection Heat Transfer
Buoyancy is an upward acting force exerted by a fluid that opposes an object's
weight.Buoyancy equals weight of displaced fluid.
The effect of buoyancy was not thoroughly accounted for in some earlier studies [22].
Thus, many experimental results reporting forced convection heat transfer were really
forced-convection heat transfer with tangible buoyancy effects.
In fact, in many studies, the effect of buoyancy was assumed to be negligible before it
was even investigated [22]. As such, most experimental results intended to represent
solely forced convection heat transfer were likely mixed convection situations.
The vast majority of analytical and experimental studies in this respect were developed
for vertical flows. Very few criteria have been suggested in the literature to detect the
buoyancy-free region of a horizontal supercritical fluid flow. [23]
T. S. Chen and F. A. Strobel [24] report that, generally, it has been discovered that the
wall shear stress and the surface heat and mass transfer rates increase with increasing
thermal buoyancy force. These quantities are further increased when the buoyancy force
from mass diffusion assists the thermal buoyancy force, but are decreased when it
opposes the thermal buoyancy force.
2.4.3 FORCED CONVECTION
In forced convection, the fluid is forced to flow over a surface or in a tube by external
means such as a pump, blower or fan.
University of Ghana http://ugspace.ug.edu.gh
25
Forced convection is an efficient means of heat energy transport and therefore often
encountered by engineers during designs of pipe flow. This makes it an important area of
study in heat transfer and fluid flow.
2.4.3.1 Mechanism of Forced Convection
Convection heat transfer is complicated since it involves fluid motion as well as heat
conduction. The fluid motion enhances heat transfer (the higher the velocity the higher
the heat transfer rate). [25]
The rate of convection heat transfer is expressed by Newton’s law of cooling: [20]
(W/ ) (2.6)
(W) (2.7)
Where, q or Q = thermal energy (in Joules); h=heat transfer coefficient; = surface
temperature; = ambient temperature.
The convective heat transfer coefficient, h strongly depends on the fluid properties and
roughness of the solid surface, and the type of the fluid flow, whether laminar or
turbulent.
It is assumed that the velocity of the fluid is zero at the wall; this assumption is called
‘noslip’ condition. As a result, the heat transfer from the solid surface to the fluid layer
adjacent to the surface is by pure conduction, since the fluid is motionless.
The convection heat transfer coefficient, in general, varies along the flow direction. The
mean or average convection heat transfer coefficient for a surface is determined by
(properly) averaging the local heat transfer coefficient over the entire surface.
University of Ghana http://ugspace.ug.edu.gh
26
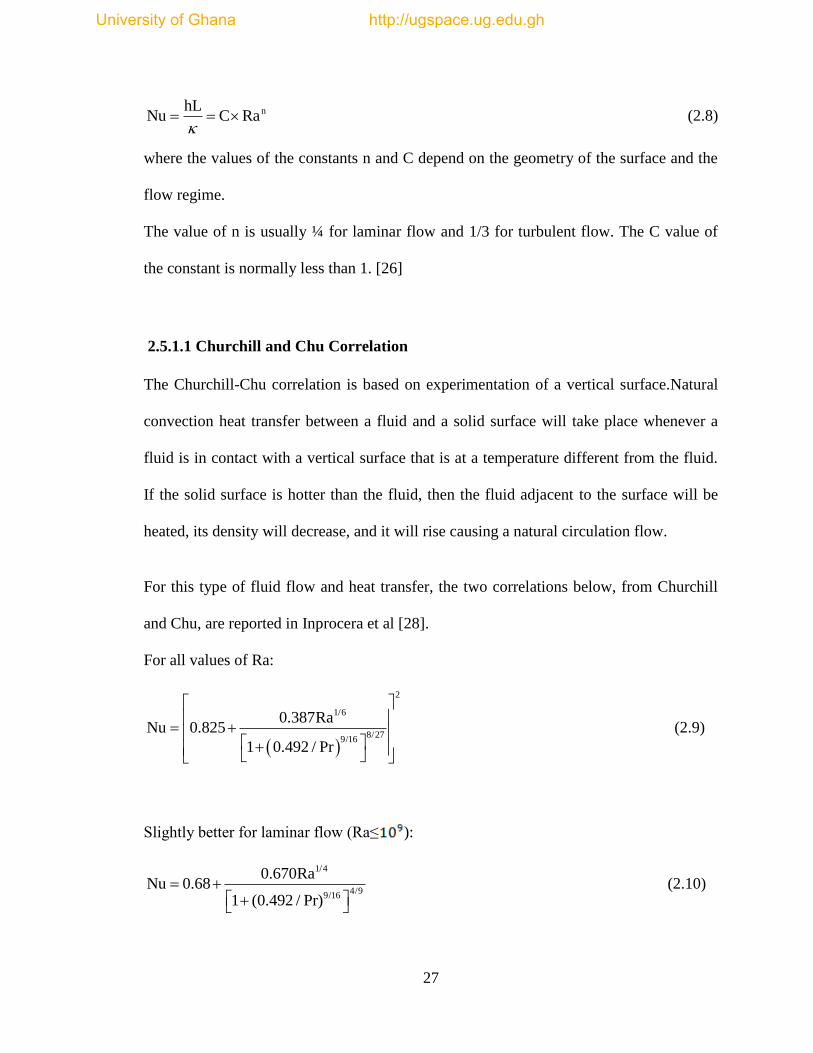
2.5 HEAT TRANSFER CORRELATIONS
Heat transfer correlations are developed to express the Nusselt number in several forms
for the prediction or estimation of heat transfer coefficient [26]. They are mostly
developed experimentally with considerations to the following:
1. The geometry of the channel (example, circular tube, flat plate, around an object,
etc.)
2. The existence of phase change (Single-phase, Two-phase)
3. The type of flow regime (Laminar, transition or turbulent)
4. Whether the heat transfer is by natural convection, forced convection or mixed.
5. If the fluid involved during heating conditions is subcritical, critical or
supercritical.
It must be noted though that most of the experimental works available in the open
literature for supercritical water are mainly restricted to circular tube geometry [27]. Few
of these correlations are presented in this section.
2.5.1 Natural Convection Correlations
The complexities of the fluid flow make it very difficult to obtain simple analytical
relations for natural convection. Thus, most of the relationships in natural convection are
based on experimental correlations.
Nusselt number which represent the heat transfer term, is expressed in following form for
natural convection:
University of Ghana http://ugspace.ug.edu.gh
27
nhLNu C Ra
(2.8)
where the values of the constants n and C depend on the geometry of the surface and the
flow regime.
The value of n is usually ¼ for laminar flow and 1/3 for turbulent flow. The C value of
the constant is normally less than 1. [26]
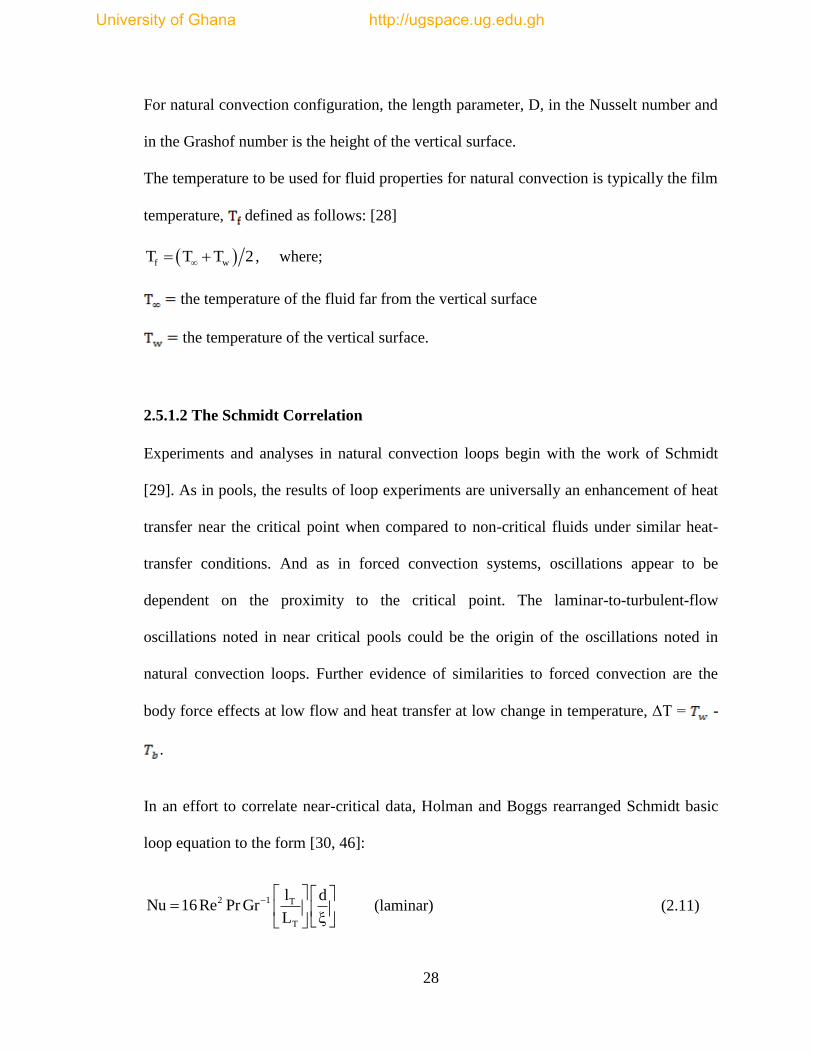
2.5.1.1 Churchill and Chu Correlation
The Churchill-Chu correlation is based on experimentation of a vertical surface.Natural
convection heat transfer between a fluid and a solid surface will take place whenever a
fluid is in contact with a vertical surface that is at a temperature different from the fluid.
If the solid surface is hotter than the fluid, then the fluid adjacent to the surface will be
heated, its density will decrease, and it will rise causing a natural circulation flow.
For this type of fluid flow and heat transfer, the two correlations below, from Churchill
and Chu, are reported in Inprocera et al [28].
For all values of Ra:
2
1/6
8/279/16
0.387RaNu 0.825
1 0.492 / Pr
(2.9)
Slightly better for laminar flow (Ra≤ ):
1/4
4/99/16
0.670RaNu 0.68
1 (0.492 / Pr)
(2.10)
University of Ghana http://ugspace.ug.edu.gh
28
For natural convection configuration, the length parameter, D, in the Nusselt number and
in the Grashof number is the height of the vertical surface.
The temperature to be used for fluid properties for natural convection is typically the film
temperature, defined as follows: [28]
f wT T T 2 , where;
the temperature of the fluid far from the vertical surface
the temperature of the vertical surface.
2.5.1.2 The Schmidt Correlation
Experiments and analyses in natural convection loops begin with the work of Schmidt
[29]. As in pools, the results of loop experiments are universally an enhancement of heat
transfer near the critical point when compared to non-critical fluids under similar heat-
transfer conditions. And as in forced convection systems, oscillations appear to be
dependent on the proximity to the critical point. The laminar-to-turbulent-flow
oscillations noted in near critical pools could be the origin of the oscillations noted in
natural convection loops. Further evidence of similarities to forced convection are the
body force effects at low flow and heat transfer at low change in temperature, ΔT = -
.
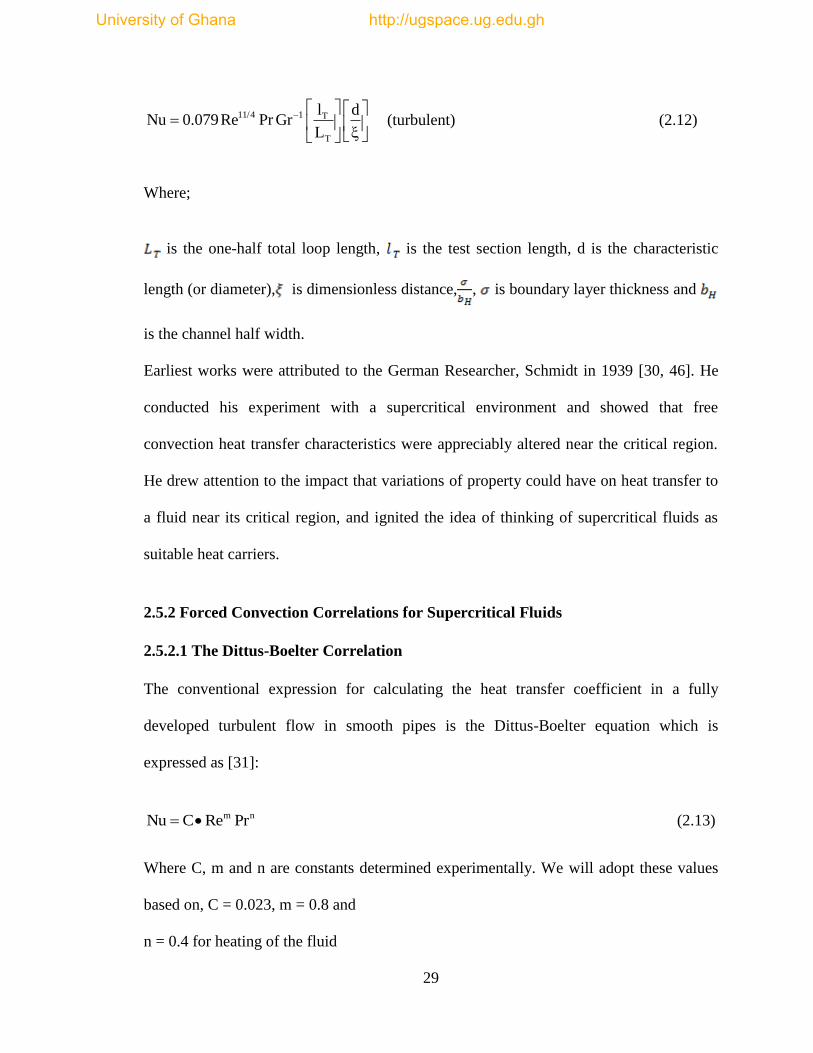
In an effort to correlate near-critical data, Holman and Boggs rearranged Schmidt basic
loop equation to the form [30, 46]:
2 1 T
T
l dNu 16Re Pr Gr
L
(laminar) (2.11)
University of Ghana http://ugspace.ug.edu.gh
29
11/4 1 T
T
l dNu 0.079Re Pr Gr
L
(turbulent) (2.12)
Where;
is the one-half total loop length, is the test section length, d is the characteristic
length (or diameter), is dimensionless distance, , is boundary layer thickness and
is the channel half width.
Earliest works were attributed to the German Researcher, Schmidt in 1939 [30, 46]. He
conducted his experiment with a supercritical environment and showed that free
convection heat transfer characteristics were appreciably altered near the critical region.
He drew attention to the impact that variations of property could have on heat transfer to
a fluid near its critical region, and ignited the idea of thinking of supercritical fluids as
suitable heat carriers.
2.5.2 Forced Convection Correlations for Supercritical Fluids
2.5.2.1 The Dittus-Boelter Correlation
The conventional expression for calculating the heat transfer coefficient in a fully
developed turbulent flow in smooth pipes is the Dittus-Boelter equation which is
expressed as [31]:
m nNu C Re Pr (2.13)
Where C, m and n are constants determined experimentally. We will adopt these values
based on, C = 0.023, m = 0.8 and
n = 0.4 for heating of the fluid
University of Ghana http://ugspace.ug.edu.gh
30
n = 0.3 for cooling of the fluid.
And;
VDRe
(2.14)
PCPr
(2.15)
hDNu
(2.16)
The Dittus-Boelter (1930) correlation is the most widely used heat-transfer correlation at
subcritical pressures for forced convection [16]. The Dittus-Boelter correlation for
forced-convective heat transfer in turbulent flows at subcritical pressures is presented in
the following form: [16]
0.8 0.4Nu 0.023Re Pr (2.17)
However, it was noted that the equation might produce unrealistic results within some
flow conditions, especially, near the critical and pseudocritical points, because it is very
sensitive to properties variations.
The properties of this relation have been calculated at the average fluid bulk
temperatures. The relation is valid for a single phase heat transfer in fully developed
turbulent flows in smooth pipes for fluids with Prandtl number ranging from 0.6 to 100 at
low heat fluxes. At high fluxes the fluid properties changes resulting in higher errors.
University of Ghana http://ugspace.ug.edu.gh
31
Substituting the expressions for equations 2.14, 2.15 and 2.16 into equation 2.17 and
solving for the heat transfer coefficient, h, we have:
0.8 0.4
PCVDh 0.023
D
(2.18)
This is one method used to calculate the heat transfer coefficient. The methods of energy
balance and computer simulation are also available to calculate the heat transfer
coefficient.
2.5.2.2 Dittus-Boelter Equation beyond the Critical Pressure
Recalling the Dittus-Boelter equation in subsection 2.5.2.1,
0.8 0.3Nu 0.023R e Pr ,
for turbulent water flow, the heat transfer coefficient shows a strong change, when the
temperature approaches the pseudo-critical value. [27]
The Closer the pressure to the critical point is, the higher is the peak of the heat transfer
coefficient.
The real heat transfer coefficient however deviates from the Dittus-Boelter equation
especially near the pseudo-critical condition. [32]
At low heat fluxes, the heat transfer coefficient is higher than the values predicted by the
Dittus-Boelter equation. This Phenomenon is called the ‘heat transfer deterioration’.
In the literature, there is still no unique definitions for the onset of heat transfer
deterioration, because the reduction in the heat transfer coefficient, or the increase in the
University of Ghana http://ugspace.ug.edu.gh
32
wall temperature behaves rather smoothly, compared to the behavior of a boiling crisis in
PWR and BWR, at which much sharper increase in the wall temperature occurs.
2.5.2.3 The Sieder-Tate Correlation
The Sieder-Tate equation is used to reduce the error experienced in using the Dittus-
Boelter equation, making it more accurate especially at higher heat fluxes. It takes into
account the change in viscosity ( and ) due to temperature change between the bulk
fluid average temperature and the wall surface temperature, respectively. [33]
0.14
0.8 0.3
s
Nu 0.027 Re Pr
(2.19)
For 0.7 ≤ Pr ≤ 16700 and Re ≥ 10,000.
When using the Sieder-Tate equation, all the physical properties must be evaluated at
arithmetic average of the bulk average temperatures of the fluid with the exception of ,
which appears in the viscosity ratio and is evaluated at the wall temperature[33].
In an investigation [34], three values of Nusselt number (experimental, Dittus-Boelter
and Sieder-Tate) were plotted as a function of time for each thermocouple location for
each tube. One consistent feature of the Nusselt number comparisons for all of the
thermocouples on all of the tubes was that the experimental Nusselt number in the
beginning of every test most closely resembled the Dittus-Boelter correlation. At some
point during the test however, as the heat flux was increased, the experimental Nusselt
number transitioned from the Dittus-Boelter correlation to the Sieder-Tate correlation.
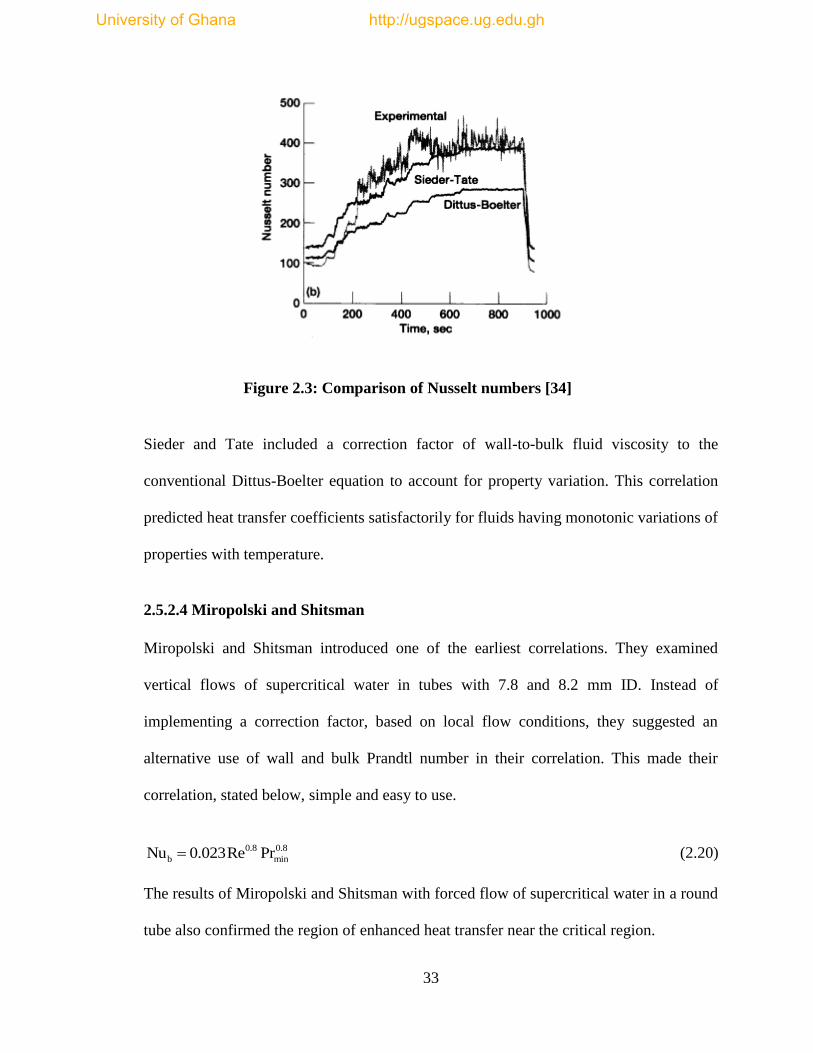
Figure 2.3 illustrates the comparison of the heat transfer correlations with the
experimental data. [34]
University of Ghana http://ugspace.ug.edu.gh
33
Figure 2.3: Comparison of Nusselt numbers [34]
Sieder and Tate included a correction factor of wall-to-bulk fluid viscosity to the
conventional Dittus-Boelter equation to account for property variation. This correlation
predicted heat transfer coefficients satisfactorily for fluids having monotonic variations of
properties with temperature.
2.5.2.4 Miropolski and Shitsman
Miropolski and Shitsman introduced one of the earliest correlations. They examined
vertical flows of supercritical water in tubes with 7.8 and 8.2 mm ID. Instead of
implementing a correction factor, based on local flow conditions, they suggested an
alternative use of wall and bulk Prandtl number in their correlation. This made their
correlation, stated below, simple and easy to use.
0.8 0.8
b minNu 0.023Re Pr (2.20)
The results of Miropolski and Shitsman with forced flow of supercritical water in a round
tube also confirmed the region of enhanced heat transfer near the critical region.
University of Ghana http://ugspace.ug.edu.gh
34
They recommended a modified empirical correlation to predict heat transfer during
turbulent forced convection flows. It was the first time an empirical relationship was
offered to fit experimental data. The form of their correlation was simple and was
obtained by making minimum changes to the Dittus-Boelter correlation. [23]
Weight was given to the Prandtl number, , which is the lesser(smaller) of the Prandtl
number at the wall and in bulk was used instead of the bulk Prandtl number only. It
appeared that the suggested correlation provided a better prediction of heat transfer
coefficient compared to some of the more complicated correlations developed later.
Miropolski and Shitsman clarified, however, that their proposed correlation was good
only for fluids with Prandtl number around unity.
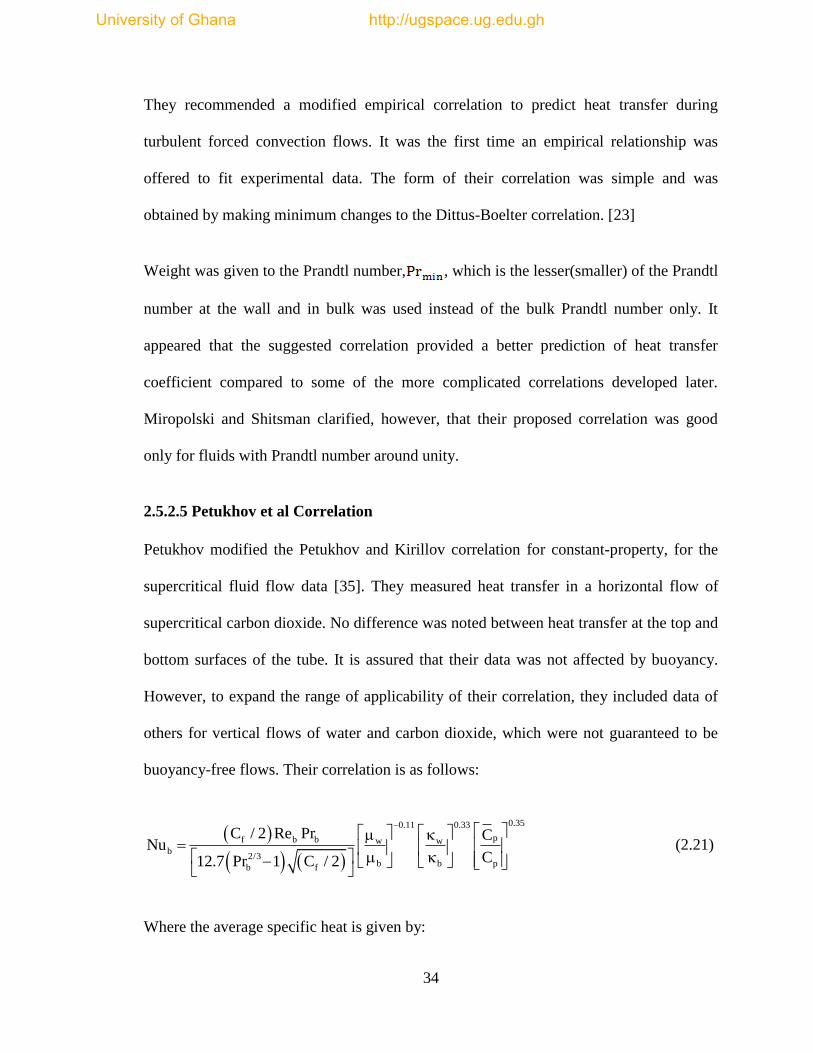
2.5.2.5 Petukhov et al Correlation
Petukhov modified the Petukhov and Kirillov correlation for constant-property, for the
supercritical fluid flow data [35]. They measured heat transfer in a horizontal flow of
supercritical carbon dioxide. No difference was noted between heat transfer at the top and
bottom surfaces of the tube. It is assured that their data was not affected by buoyancy.
However, to expand the range of applicability of their correlation, they included data of
others for vertical flows of water and carbon dioxide, which were not guaranteed to be
buoyancy-free flows. Their correlation is as follows:
0.350.11 0.33
pf b b w wb
2/3b b pb f
C / 2 Re Pr CNu
C12.7 Pr 1 C / 2
(2.21)
Where the average specific heat is given by:
University of Ghana http://ugspace.ug.edu.gh
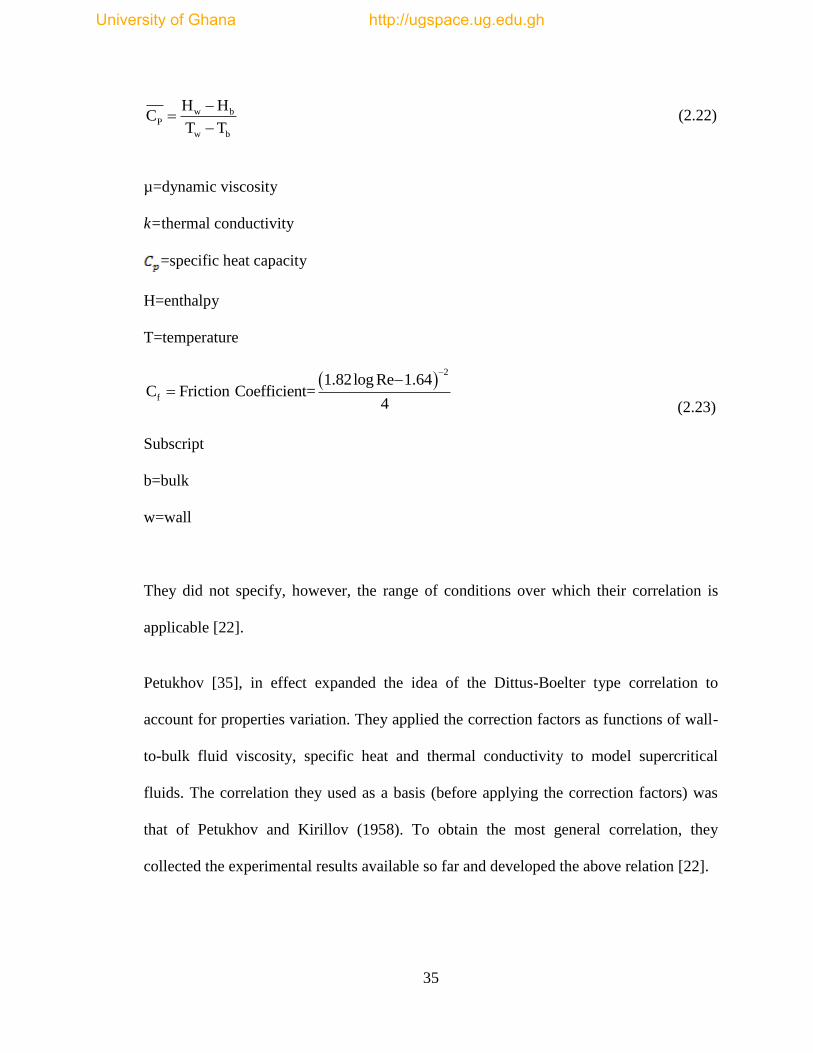
35
w bP
w b
H HC
T T
(2.22)
µ=dynamic viscosity
k=thermal conductivity
=specific heat capacity
H=enthalpy
T=temperature
2
f
1.82log Re 1.64C Friction Coefficient=
4
(2.23)
Subscript
b=bulk
w=wall
They did not specify, however, the range of conditions over which their correlation is
applicable [22].
Petukhov [35], in effect expanded the idea of the Dittus-Boelter type correlation to
account for properties variation. They applied the correction factors as functions of wall-
to-bulk fluid viscosity, specific heat and thermal conductivity to model supercritical
fluids. The correlation they used as a basis (before applying the correction factors) was
that of Petukhov and Kirillov (1958). To obtain the most general correlation, they
collected the experimental results available so far and developed the above relation [22].
University of Ghana http://ugspace.ug.edu.gh
36
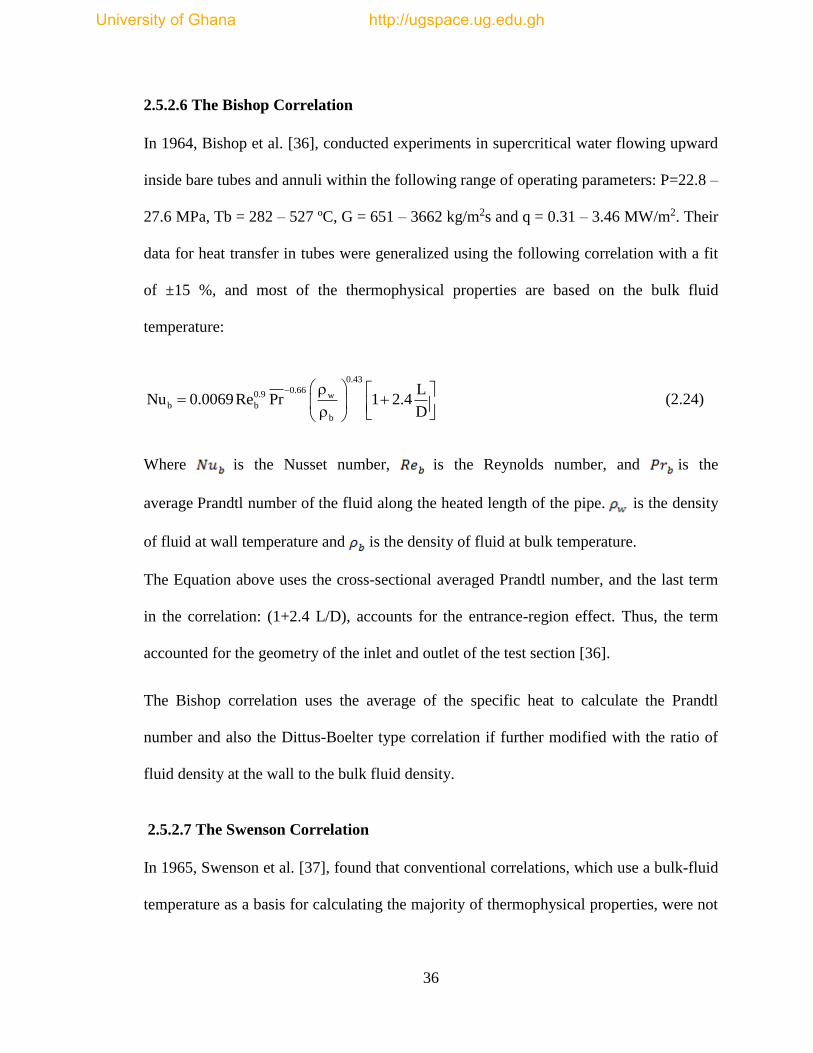
2.5.2.6 The Bishop Correlation
In 1964, Bishop et al. [36], conducted experiments in supercritical water flowing upward
inside bare tubes and annuli within the following range of operating parameters: P=22.8 –
27.6 MPa, Tb = 282 – 527 ºC, G = 651 – 3662 kg/m2s and q = 0.31 – 3.46 MW/m2. Their
data for heat transfer in tubes were generalized using the following correlation with a fit
of ±15 %, and most of the thermophysical properties are based on the bulk fluid
temperature:
0.43
0.660.9 wb b
b
LNu 0.0069Re Pr 1 2.4
D
(2.24)
Where is the Nusset number, is the Reynolds number, and is the
average Prandtl number of the fluid along the heated length of the pipe. is the density
of fluid at wall temperature and is the density of fluid at bulk temperature.
The Equation above uses the cross-sectional averaged Prandtl number, and the last term
in the correlation: (1+2.4 L/D), accounts for the entrance-region effect. Thus, the term
accounted for the geometry of the inlet and outlet of the test section [36].
The Bishop correlation uses the average of the specific heat to calculate the Prandtl
number and also the Dittus-Boelter type correlation if further modified with the ratio of
fluid density at the wall to the bulk fluid density.
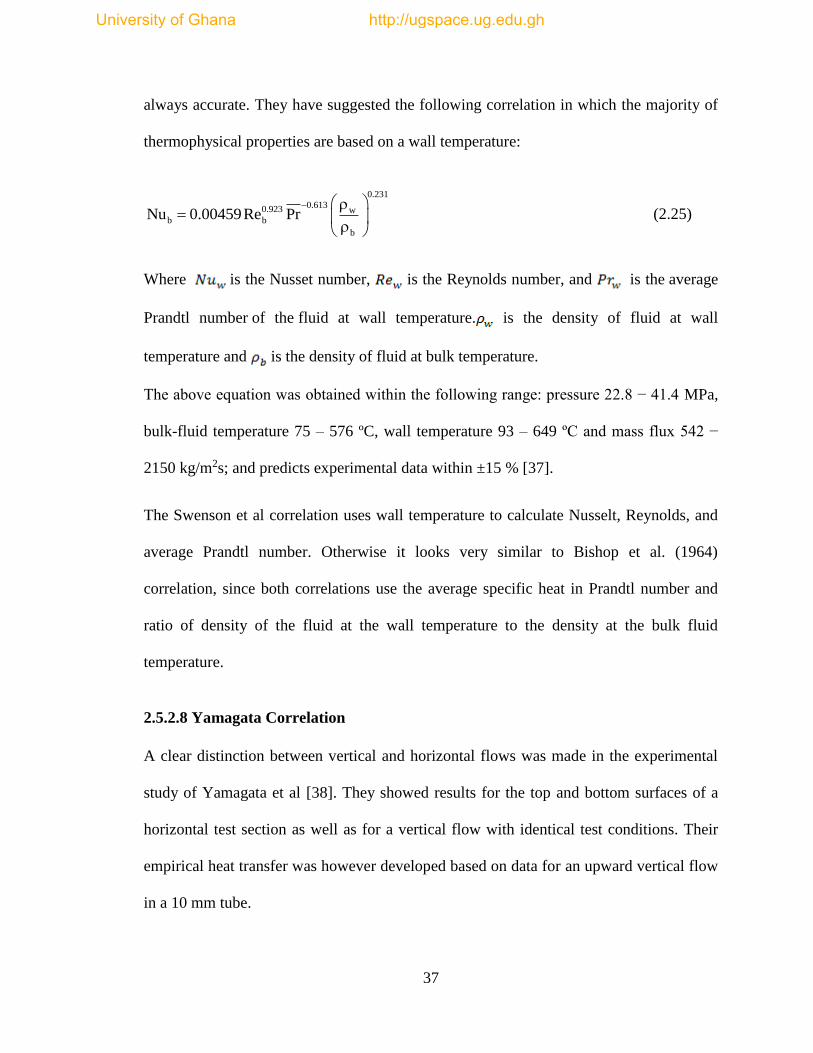
2.5.2.7 The Swenson Correlation
In 1965, Swenson et al. [37], found that conventional correlations, which use a bulk-fluid
temperature as a basis for calculating the majority of thermophysical properties, were not
University of Ghana http://ugspace.ug.edu.gh
37
always accurate. They have suggested the following correlation in which the majority of
thermophysical properties are based on a wall temperature:
0.231
0.6130.923 wb b
b
Nu 0.00459Re Pr
(2.25)
Where is the Nusset number, is the Reynolds number, and is the average
Prandtl number of the fluid at wall temperature. is the density of fluid at wall
temperature and is the density of fluid at bulk temperature.
The above equation was obtained within the following range: pressure 22.8 − 41.4 MPa,
bulk-fluid temperature 75 – 576 ºC, wall temperature 93 – 649 ºC and mass flux 542 −
2150 kg/m2s; and predicts experimental data within ±15 % [37].
The Swenson et al correlation uses wall temperature to calculate Nusselt, Reynolds, and
average Prandtl number. Otherwise it looks very similar to Bishop et al. (1964)
correlation, since both correlations use the average specific heat in Prandtl number and
ratio of density of the fluid at the wall temperature to the density at the bulk fluid
temperature.
2.5.2.8 Yamagata Correlation
A clear distinction between vertical and horizontal flows was made in the experimental
study of Yamagata et al [38]. They showed results for the top and bottom surfaces of a
horizontal test section as well as for a vertical flow with identical test conditions. Their
empirical heat transfer was however developed based on data for an upward vertical flow
in a 10 mm tube.
University of Ghana http://ugspace.ug.edu.gh
38
In the Yamagata et al., correlation, three regimes are clearly distinguished by a
dimensionless parameter, Eckert number E defined by the equation;
pc b
w b
T TE
T T
(2.26)
where is the pseudocritical temperature, and are the wall and bulk temperatures
respectively.
When:
E>1 the fluid is considered to be liquid (over a cross-section)
E<0 the fluid considered to be vapour, and
0 E 1 the fluid is considered to be vapour near the wall, and liquid in the core.
By taking account of the , evaluated at the pseudocritical temperature, the correlation
of Yamagata et al presented below is obtained and , is used to define the correction
factor, ,
0.85 0.8
b b cNu 0.0135Re Pr F
(2.27)
Where;
cF 1.0 for E > 0 (2.28a)
1
b
n
0.05 PC Pc
P
CF 0.67 Pr
C
; for 0 ≤ E≤ 1 (2.28b)
University of Ghana http://ugspace.ug.edu.gh
39
2
b
n
PC
P
CF
C
; (2.28c)
1 pcn 0.77(1 1/ Pr ) 1.49 (2.29a)
2 pcn 1.44(1 1/ Pr ) 0.53 (2.29b)
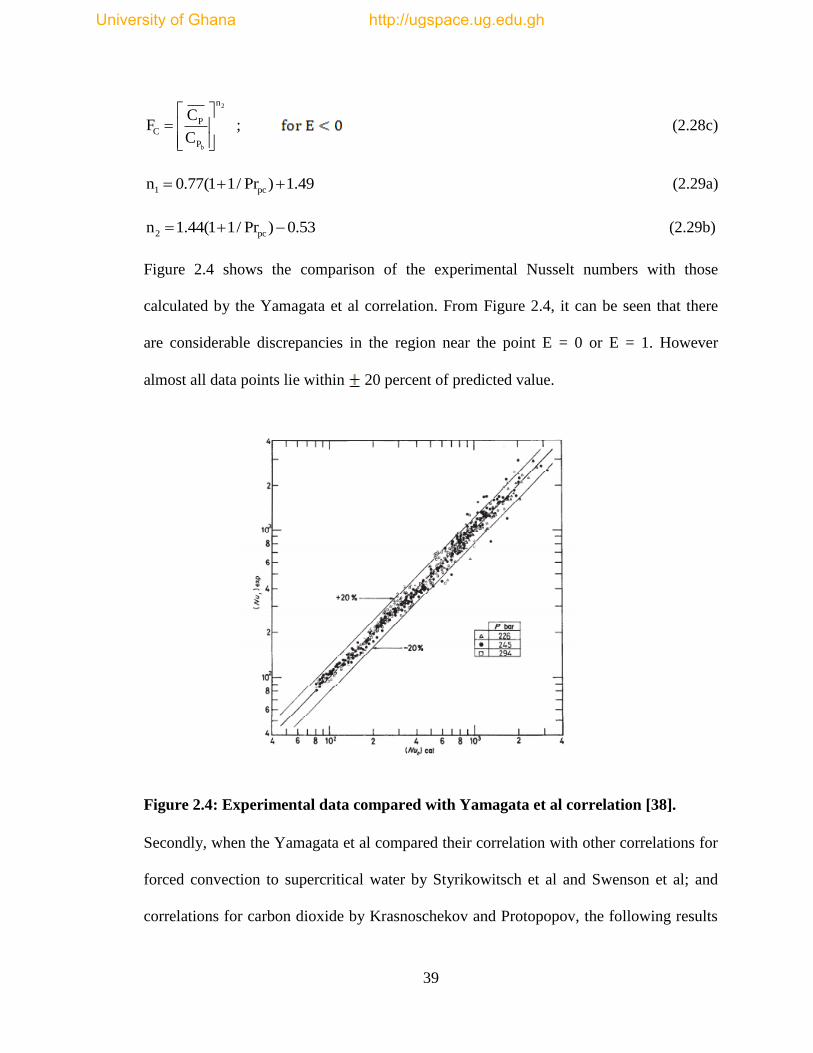
Figure 2.4 shows the comparison of the experimental Nusselt numbers with those
calculated by the Yamagata et al correlation. From Figure 2.4, it can be seen that there
are considerable discrepancies in the region near the point E = 0 or E = 1. However
almost all data points lie within 20 percent of predicted value.
Figure 2.4: Experimental data compared with Yamagata et al correlation [38].
Secondly, when the Yamagata et al compared their correlation with other correlations for
forced convection to supercritical water by Styrikowitsch et al and Swenson et al; and
correlations for carbon dioxide by Krasnoschekov and Protopopov, the following results
University of Ghana http://ugspace.ug.edu.gh
40
in the figure below was obtained [38].The results of the comparison is presented in
Figure 2.4.
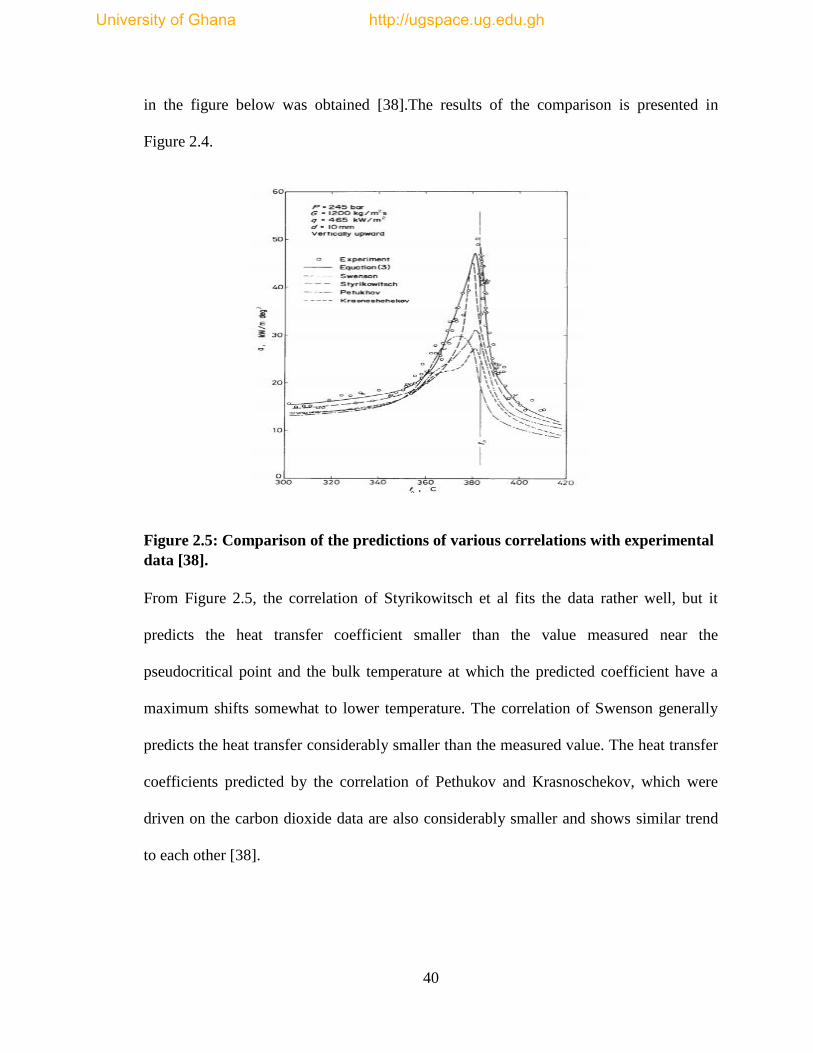
Figure 2.5: Comparison of the predictions of various correlations with experimental
data [38].
From Figure 2.5, the correlation of Styrikowitsch et al fits the data rather well, but it
predicts the heat transfer coefficient smaller than the value measured near the
pseudocritical point and the bulk temperature at which the predicted coefficient have a
maximum shifts somewhat to lower temperature. The correlation of Swenson generally
predicts the heat transfer considerably smaller than the measured value. The heat transfer
coefficients predicted by the correlation of Pethukov and Krasnoschekov, which were
driven on the carbon dioxide data are also considerably smaller and shows similar trend
to each other [38].
University of Ghana http://ugspace.ug.edu.gh
41
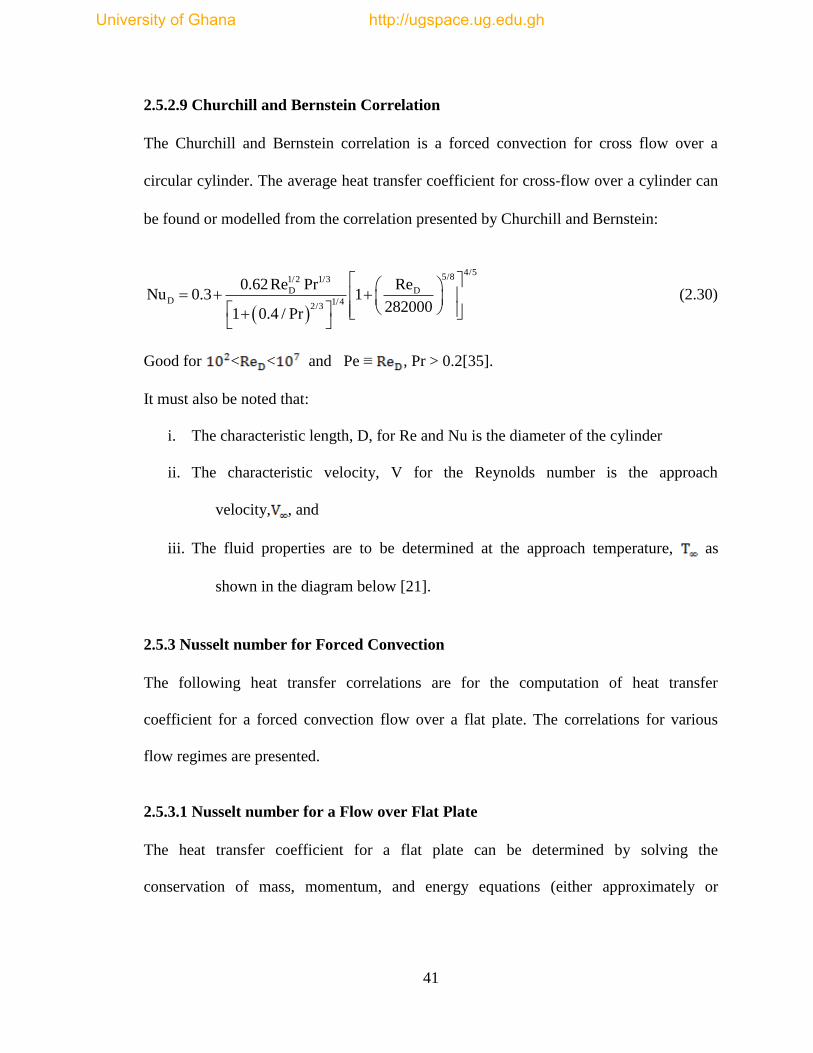
2.5.2.9 Churchill and Bernstein Correlation
The Churchill and Bernstein correlation is a forced convection for cross flow over a
circular cylinder. The average heat transfer coefficient for cross‐flow over a cylinder can
be found or modelled from the correlation presented by Churchill and Bernstein:
4/55/81/2 1/3
D DD 1/4
2/3
0.62Re Pr ReNu 0.3 1
2820001 0.4 / Pr
(2.30)
Good for < < and Pe ≡ , Pr > 0.2[35].
It must also be noted that:
i. The characteristic length, D, for Re and Nu is the diameter of the cylinder
ii. The characteristic velocity, V for the Reynolds number is the approach
velocity, , and
iii. The fluid properties are to be determined at the approach temperature, as
shown in the diagram below [21].
2.5.3 Nusselt number for Forced Convection
The following heat transfer correlations are for the computation of heat transfer
coefficient for a forced convection flow over a flat plate. The correlations for various
flow regimes are presented.
2.5.3.1 Nusselt number for a Flow over Flat Plate
The heat transfer coefficient for a flat plate can be determined by solving the
conservation of mass, momentum, and energy equations (either approximately or
University of Ghana http://ugspace.ug.edu.gh
42
numerically). They can also be measured experimentally. It is found that the Nusselt
number can be expressed as:
m n
L
hLNu C Re Pr
(2.31)
where C, m, and n are constants and L is the length of the flat plate. The properties of the
fluid are usually evaluated at the film temperature defined as [25]:
sf
T TT
2
(2.32)
For a laminar flow, the local Nusselt number, Nu at the location x for laminar flow over a
flat plate is:
1/2 1/3
x x
hLNu 0.332Re Pr
Pr ≥ 0.6 (2.33)
where x is the distant from the leading edge of the plate and Rex
V x
.
For a turbulent flow, the local Nusselt number, Nu at location x for turbulent flow over a
flat isothermal plate is: [25]
4/5 1/3
x x
hLNu 0.332Re Pr
0.6 ≤ Pr ≤ 60 5 7
L5 10 Re 10 (2.34)
However, if the plate is sufficiently long for the flow to become turbulent (and not long
enough to disregard the laminar flow region), the average values for Nusselt number
which is provided below is used, [25].
cr
cr
x L
x,La minar x,Turbulent0 x
1h h dx h dx
L
(2.53)
After the integrations and simplifications, the Nusselt number is given by:
University of Ghana http://ugspace.ug.edu.gh
43
4/5 1/3
x x
hLNu 0.037Re 871 Pr
0.6≤Pr≤60 ≤ ≤ (2.36)
The above relationships have been obtained for the case of isothermal surfaces, but could
also be used approximately for the case of non‐isothermal surfaces. In such cases assume
the surface temperature to be constant at some average value.
For isoflux (uniform heat flux) plates, the local Nusselt number for laminar and turbulent
flow can be found from:
0.5 1/3
x x
hLNu 0.453Re Pr
Laminar (isoflux plate) (2.37)
0.8 1/3
x x
hLNu 0.0308Re Pr
Turbulent (isoflux plate) (2.38)
The isoflux relationships give values that are 36% higher for laminar and 4% for
turbulent flows relative to isothermal plate case [25].
2.6 RESEARCH WORKS ON CORRELATION COMPARISONS
Many researchers have conducted extensive works in comparing various existing
empirical heat transfer correlations. Few of these works are being looked at in the present
study, especially those involving supercritical fluids heat transfer in circular tubes.
In a research work by X.cheng, T. and Schulenberg [27] some empirical correlations with
flow parameters under the condition of a Supercritical Light water reactor were
developed to try to predict the heat transfer coefficient and the onset of heat transfer
deterioration. These include: Bishop et al [36], Swenson et al [37], Yamagata et al [38],
and Griem et al.
University of Ghana http://ugspace.ug.edu.gh
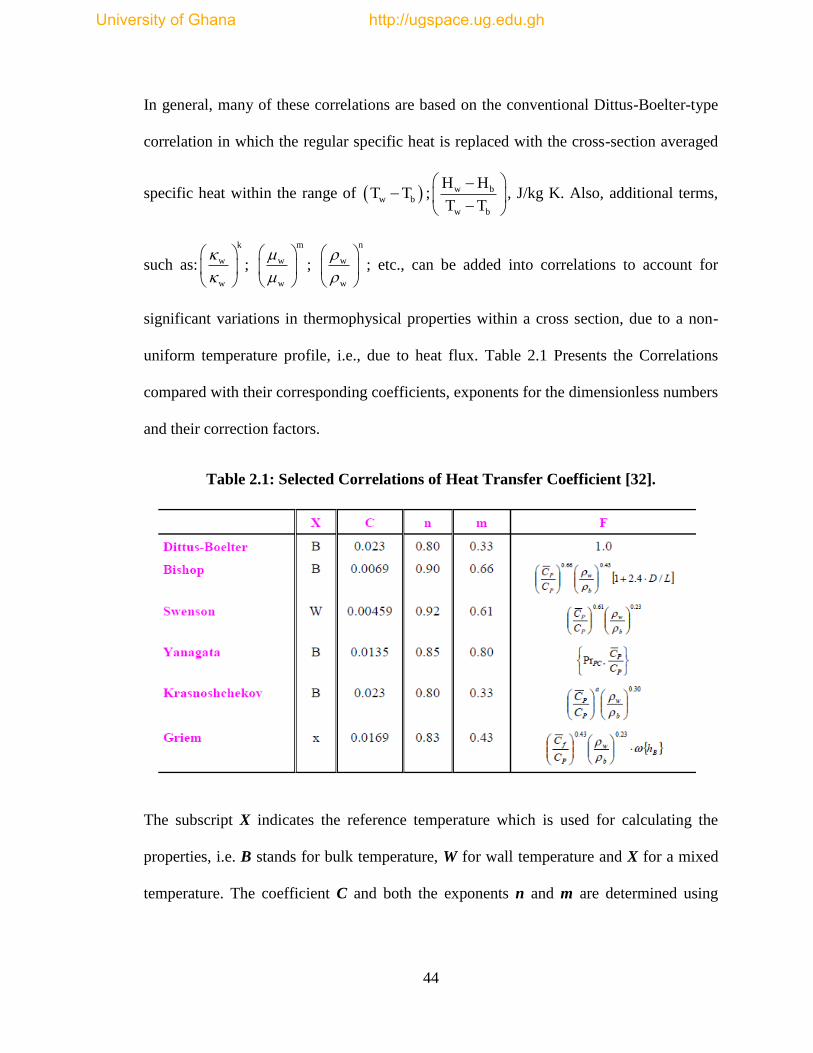
44
In general, many of these correlations are based on the conventional Dittus-Boelter-type
correlation in which the regular specific heat is replaced with the cross-section averaged
specific heat within the range of w bT T ; w b
w b
H H
T T
, J/kg K. Also, additional terms,
such as:
k
w
w
;
m
w
w
;
n
w
w
; etc., can be added into correlations to account for
significant variations in thermophysical properties within a cross section, due to a non-
uniform temperature profile, i.e., due to heat flux. Table 2.1 Presents the Correlations
compared with their corresponding coefficients, exponents for the dimensionless numbers
and their correction factors.
Table 2.1: Selected Correlations of Heat Transfer Coefficient [32].
The subscript X indicates the reference temperature which is used for calculating the
properties, i.e. B stands for bulk temperature, W for wall temperature and X for a mixed
temperature. The coefficient C and both the exponents n and m are determined using
University of Ghana http://ugspace.ug.edu.gh
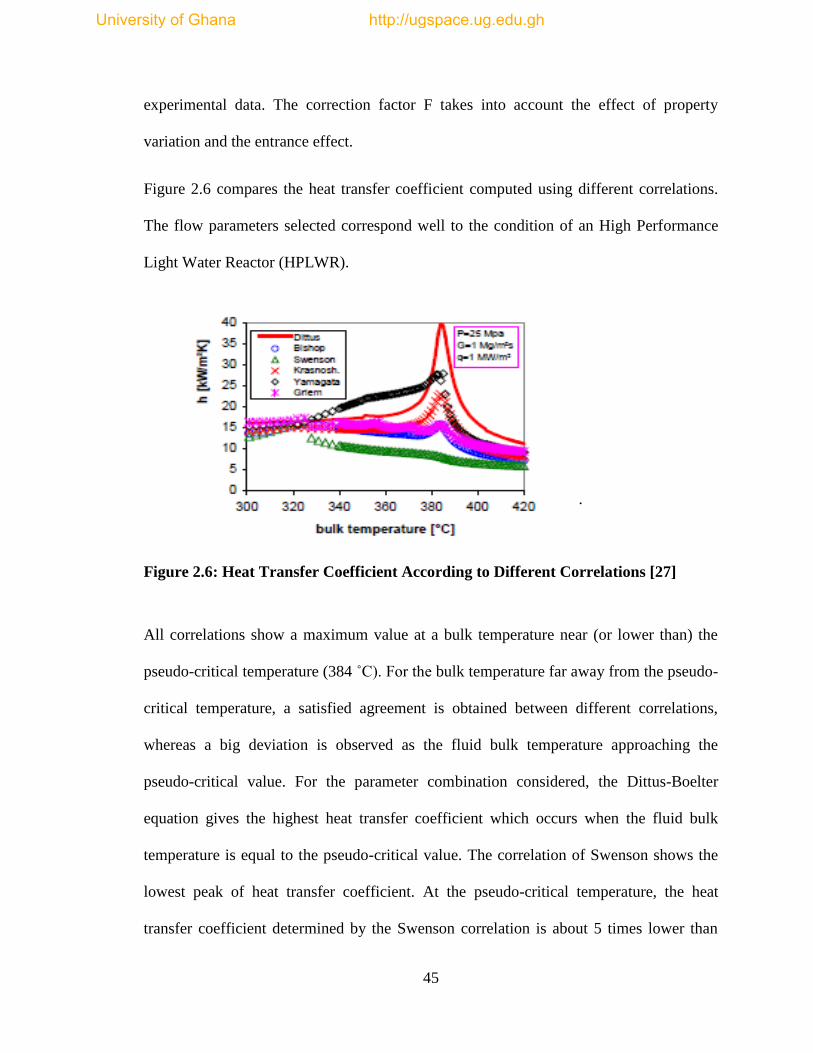
45
experimental data. The correction factor F takes into account the effect of property
variation and the entrance effect.
Figure 2.6 compares the heat transfer coefficient computed using different correlations.
The flow parameters selected correspond well to the condition of an High Performance
Light Water Reactor (HPLWR).
.
Figure 2.6: Heat Transfer Coefficient According to Different Correlations [27]
All correlations show a maximum value at a bulk temperature near (or lower than) the
pseudo-critical temperature (384 ˚C). For the bulk temperature far away from the pseudo-
critical temperature, a satisfied agreement is obtained between different correlations,
whereas a big deviation is observed as the fluid bulk temperature approaching the
pseudo-critical value. For the parameter combination considered, the Dittus-Boelter
equation gives the highest heat transfer coefficient which occurs when the fluid bulk
temperature is equal to the pseudo-critical value. The correlation of Swenson shows the
lowest peak of heat transfer coefficient. At the pseudo-critical temperature, the heat
transfer coefficient determined by the Swenson correlation is about 5 times lower than
University of Ghana http://ugspace.ug.edu.gh
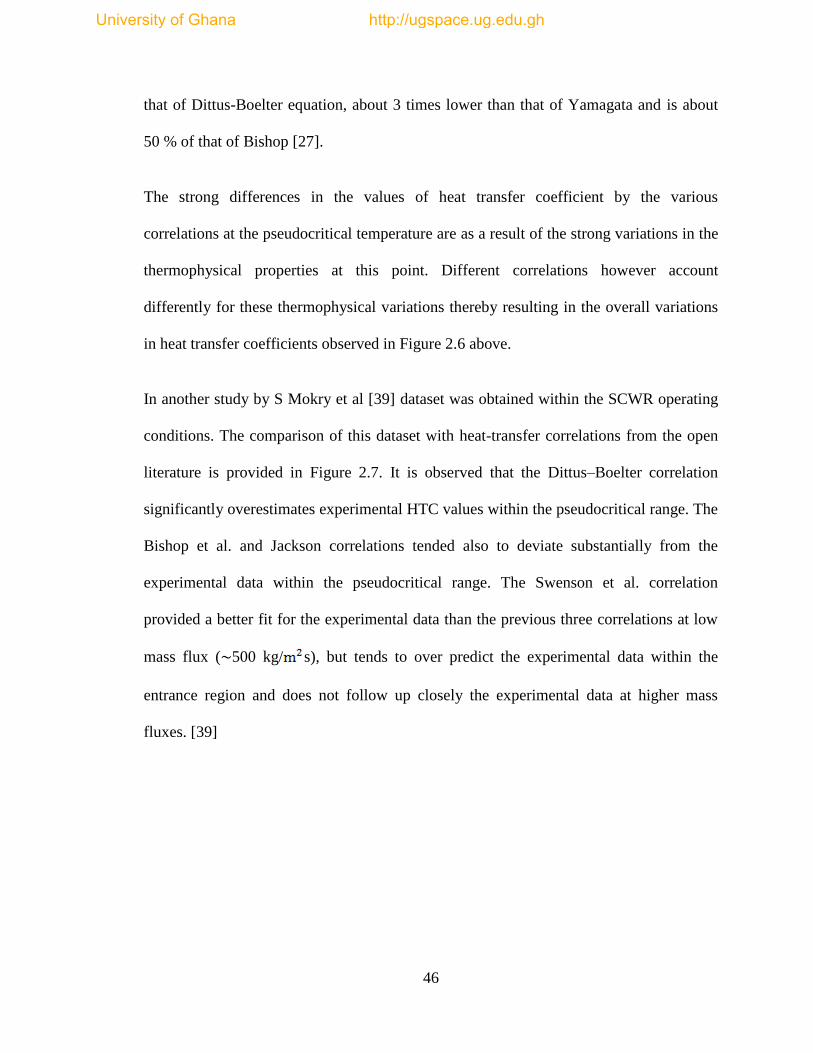
46
that of Dittus-Boelter equation, about 3 times lower than that of Yamagata and is about
50 % of that of Bishop [27].
The strong differences in the values of heat transfer coefficient by the various
correlations at the pseudocritical temperature are as a result of the strong variations in the
thermophysical properties at this point. Different correlations however account
differently for these thermophysical variations thereby resulting in the overall variations
in heat transfer coefficients observed in Figure 2.6 above.
In another study by S Mokry et al [39] dataset was obtained within the SCWR operating
conditions. The comparison of this dataset with heat-transfer correlations from the open
literature is provided in Figure 2.7. It is observed that the Dittus–Boelter correlation
significantly overestimates experimental HTC values within the pseudocritical range. The
Bishop et al. and Jackson correlations tended also to deviate substantially from the
experimental data within the pseudocritical range. The Swenson et al. correlation
provided a better fit for the experimental data than the previous three correlations at low
mass flux (∼500 kg/ s), but tends to over predict the experimental data within the
entrance region and does not follow up closely the experimental data at higher mass
fluxes. [39]
University of Ghana http://ugspace.ug.edu.gh
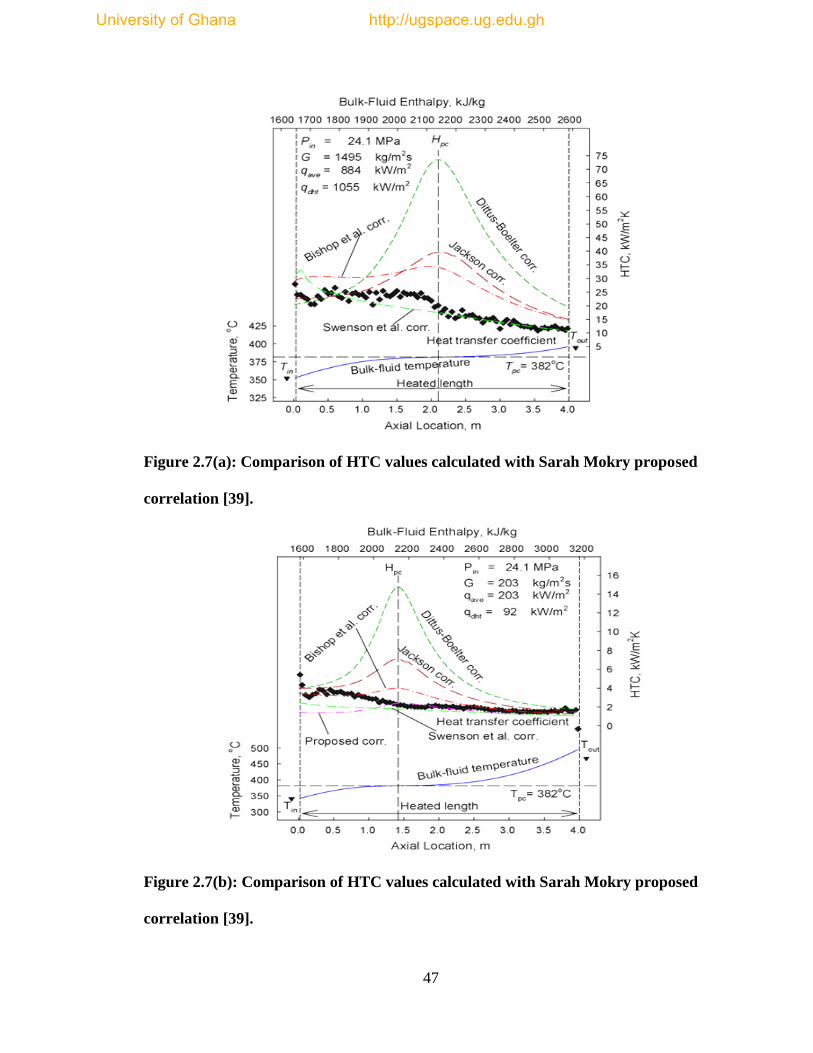
47
Figure 2.7(a): Comparison of HTC values calculated with Sarah Mokry proposed
correlation [39].
Figure 2.7(b): Comparison of HTC values calculated with Sarah Mokry proposed
correlation [39].
University of Ghana http://ugspace.ug.edu.gh
48
The above Figures shows the variations of heat transfer coefficients for the correlations
of Dittus-Boelter, Bishop et al., Jackson and Swenson et al. along a 4m long circular tube
under an inlet pressure of 24.1 MPa, a mass flux of 1495 kg/ s for figure 2.7(a) and a
mass flux value of 203 kg/ s for figure 2.7 (b). Apart from the huge variations of heat
transfer coefficient that occurs at the pseudocritical point, the figures also illustrate the
differences along the axial position for the point of strong differences in the values of
heat transfer coefficients for the correlations considered, based on the differences in
physical properties such as the mass flux and heat flux under the same pressure and the
same circular tube geometry.
2.7 EXPERIMENTAL DATASET OF CHEN YUZHOU ET AL
The experimental dataset for this thesis work was obtained from the experimental work
performed by Chen Yuzhou et al of the China Institute of Atomic Energy, China and
published in a paper titled “An experiment on flow and heat transfer characteristics in
Natural Circulation of Supercritical water”[40].
The experimental runs were carried out under steady-state operating conditions, at natural
water circulation, with vertical upward flow in the test section.
2.7.1 Experimental Facility and Procedure of Chen Yuzhou et al.,
The natural circulation facility is shown in the Figure 2.8 schematically. It is a
rectangular loop installed vertically with wideness of 2.4 m and height of 1.77 m. The
heating section, located at a vertical side, is made of an Inconel-625 tube of 4.62 mm ID,
6.46 mm OD and 1.37 m in heating length. An annular heat exchanger, located
University of Ghana http://ugspace.ug.edu.gh
49
horizontally at the top side, is made of stainless-steel tubes with hot water flowing in the
inner tube and cooling water in the annulus. The inner tube is 10 mm ID and 13 mm OD,
and the outer tube is 16 mm ID, 20 mm OD and 1.7 m in length. The other parts of the
loop are made of stainless-steel tubes of 10 mm ID, except for a section of 4 mm ID and
300 mm in length at the bottom side for obtaining the flow rate by measurement of
frictional pressure drop. The loop is connected to a pressurizer, and the pressure is
established by a three-head piston pump.
Major measurements of parameters in the loop include: the inlet and outlet water
temperature and the wall temperatures of heating section by K-type thermocouples, the
pressure by a pressure transducer (DC1151), the pressure drop on flow rate section by a
differential pressure transducer (DC1151) and the current and voltage across the heating
section. In addition, in the second side the flow rate, the inlet and outlet water
temperatures are measured.
Flow rate can be obtained from the pressure drop on section 4. It can also be obtained
from heat balance equation in connection with the heating power and the water
temperature difference between the inlet and outlet of heating section, . For
oscillation condition both methods give oscillated characteristic around the average line,
but they can’t provide accurate instantaneous values of the flow rate. The latter one is
relatively simple, and for stable condition it can provide accurate flow rate due to great
temperature difference. This method is used in the present experiment.
During experiment the primary pressure and the flow rate of tap water in the secondary
side of heat exchange were kept basically constant, except for the near-end stage when
University of Ghana http://ugspace.ug.edu.gh
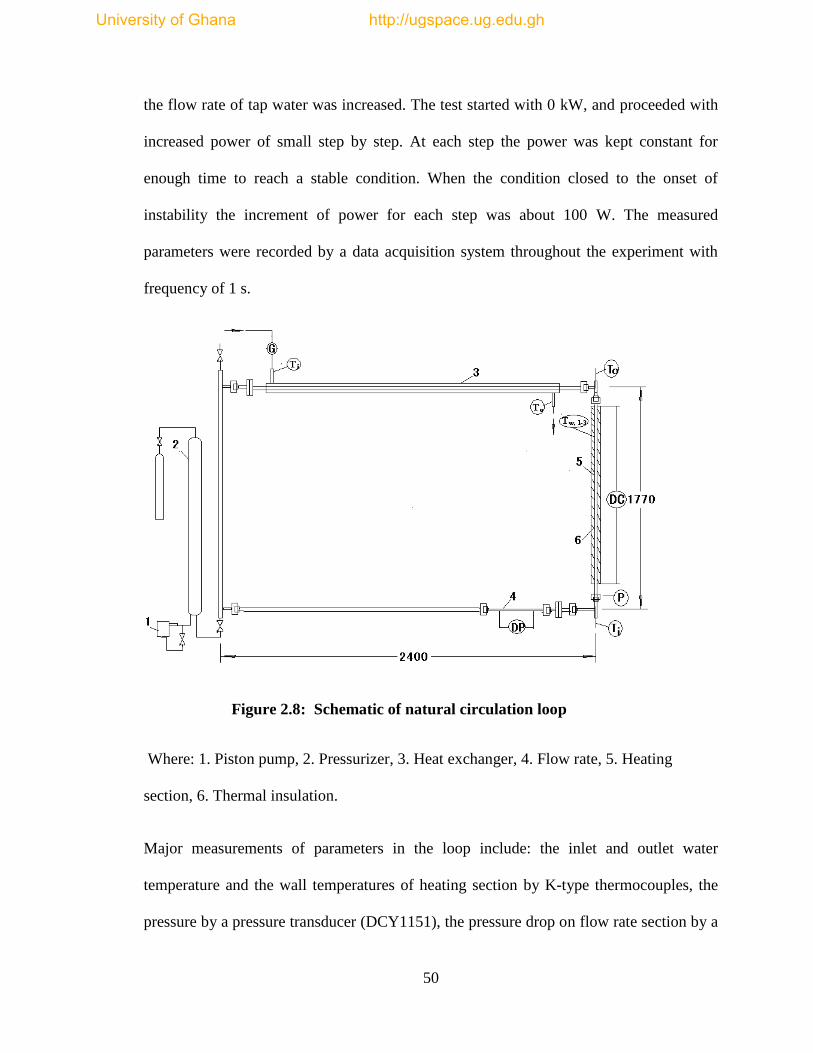
50
the flow rate of tap water was increased. The test started with 0 kW, and proceeded with
increased power of small step by step. At each step the power was kept constant for
enough time to reach a stable condition. When the condition closed to the onset of
instability the increment of power for each step was about 100 W. The measured
parameters were recorded by a data acquisition system throughout the experiment with
frequency of 1 s.
Figure 2.8: Schematic of natural circulation loop
Where: 1. Piston pump, 2. Pressurizer, 3. Heat exchanger, 4. Flow rate, 5. Heating
section, 6. Thermal insulation.
Major measurements of parameters in the loop include: the inlet and outlet water
temperature and the wall temperatures of heating section by K-type thermocouples, the
pressure by a pressure transducer (DCY1151), the pressure drop on flow rate section by a
University of Ghana http://ugspace.ug.edu.gh
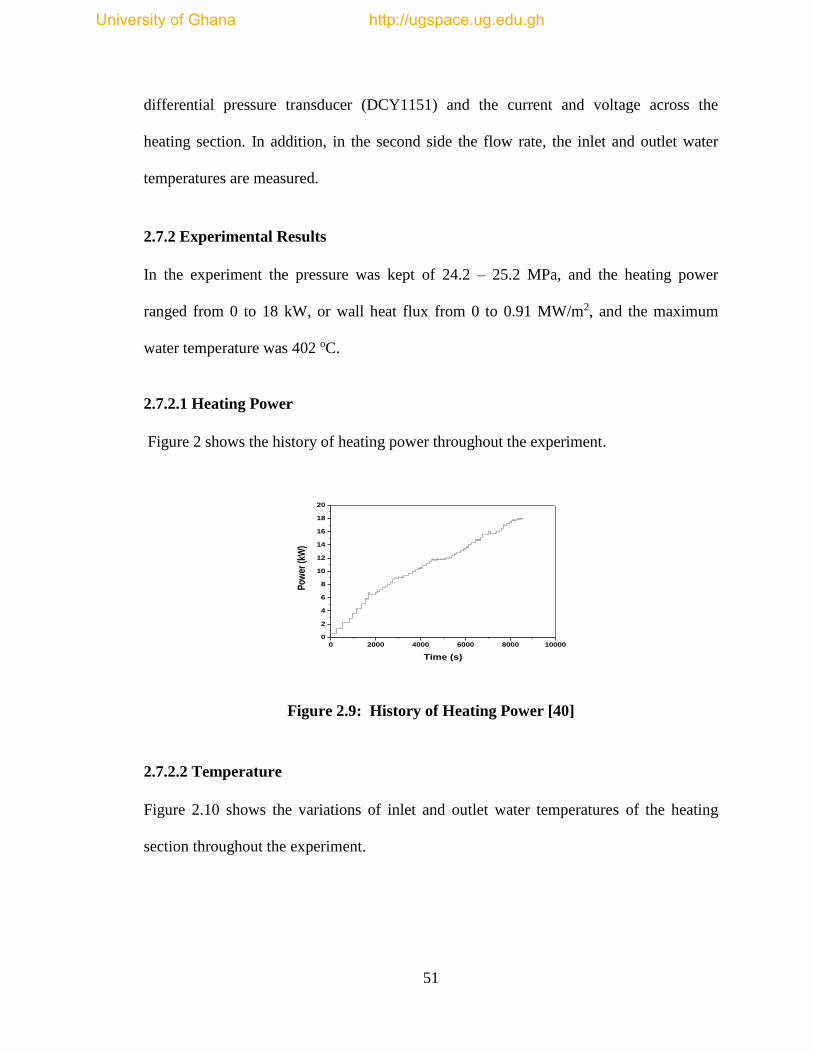
51
differential pressure transducer (DCY1151) and the current and voltage across the
heating section. In addition, in the second side the flow rate, the inlet and outlet water
temperatures are measured.
2.7.2 Experimental Results
In the experiment the pressure was kept of 24.2 – 25.2 MPa, and the heating power
ranged from 0 to 18 kW, or wall heat flux from 0 to 0.91 MW/m2, and the maximum
water temperature was 402 oC.
2.7.2.1 Heating Power
Figure 2 shows the history of heating power throughout the experiment.
0 2000 4000 6000 8000 10000
0
2
4
6
8
10
12
14
16
18
20
Po
wer
(kW
)
Time (s)
Figure 2.9: History of Heating Power [40]
2.7.2.2 Temperature
Figure 2.10 shows the variations of inlet and outlet water temperatures of the heating
section throughout the experiment.
University of Ghana http://ugspace.ug.edu.gh
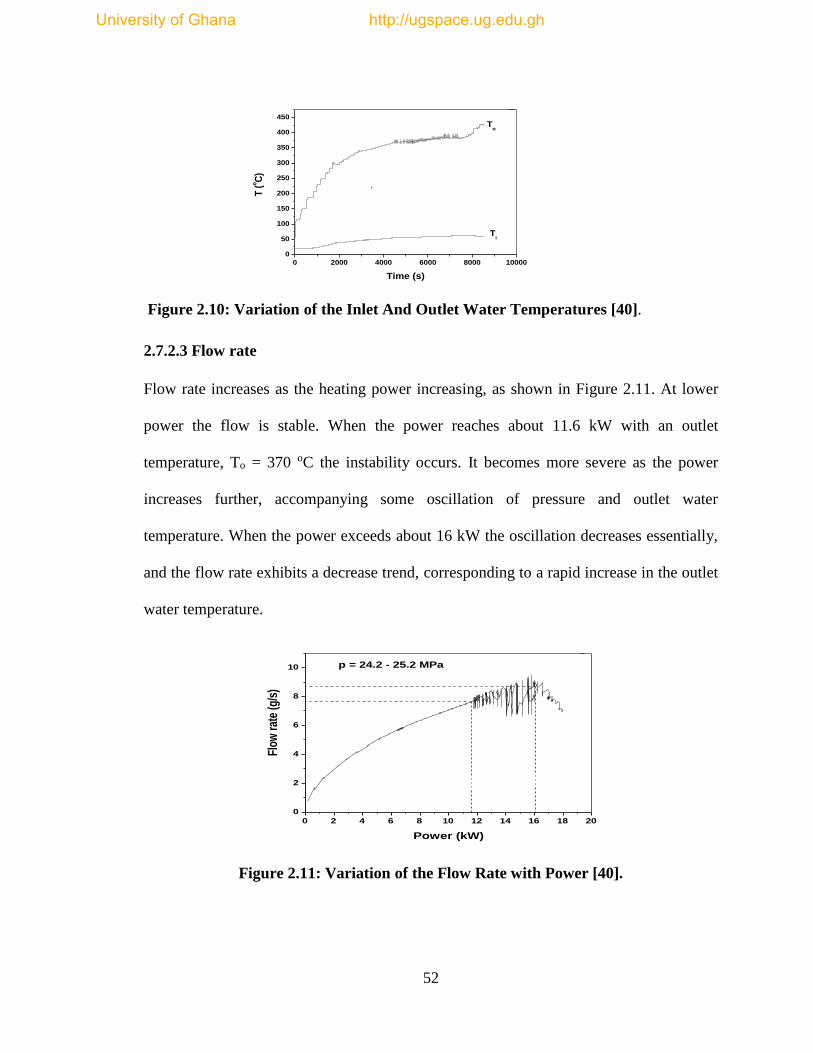
52
0 2000 4000 6000 8000 10000
0
50
100
150
200
250
300
350
400
450
Ti
To
T (
oC
)
Time (s)
Figure 2.10: Variation of the Inlet And Outlet Water Temperatures [40].
2.7.2.3 Flow rate
Flow rate increases as the heating power increasing, as shown in Figure 2.11. At lower
power the flow is stable. When the power reaches about 11.6 kW with an outlet
temperature, To = 370 oC the instability occurs. It becomes more severe as the power
increases further, accompanying some oscillation of pressure and outlet water
temperature. When the power exceeds about 16 kW the oscillation decreases essentially,
and the flow rate exhibits a decrease trend, corresponding to a rapid increase in the outlet
water temperature.
0 2 4 6 8 10 12 14 16 18 20
0
2
4
6
8
10 p = 24.2 - 25.2 MPa
Flow
rat
e (g
/s)
Power (kW)
Figure 2.11: Variation of the Flow Rate with Power [40].
University of Ghana http://ugspace.ug.edu.gh
53
2.7.2.4 Heat transfer
Figure 2.12 shows the variation of wall temperature, Tw, and bulk temperature Tb with
power for z = 1.27 m.At lower power the wall temperature increase steadily as the power
increases. Flow instability occurs when the power exceeds 11.6 kW with mass flux of
460 kg/m2s, resulting in severe oscillation of wall temperature. In this period the wall
temperature tends to decrease as the power increases. For power > 16 kW, when the
outlet water temperature exceeds the pseudo-critical point, the oscillation is not
appreciable, and the flow rate exhibits a decreasing trend as the power increases,
associated with a rapid increase in wall temperature.
The heat transfer coefficient, h, is evaluated by:
w
w,i b
qh
T T
(2.39)
where qw is the wall heat flux, Tw, i is the inner wall temperature, evaluated by the
average of outer surface temperatures measured by three thermocouples at z = 1.27 m,
minus the temperature drop across the wall, Tb is the local bulk temperature, evaluated
from heat balance equation in connection with the inlet and outlet water temperatures.
University of Ghana http://ugspace.ug.edu.gh
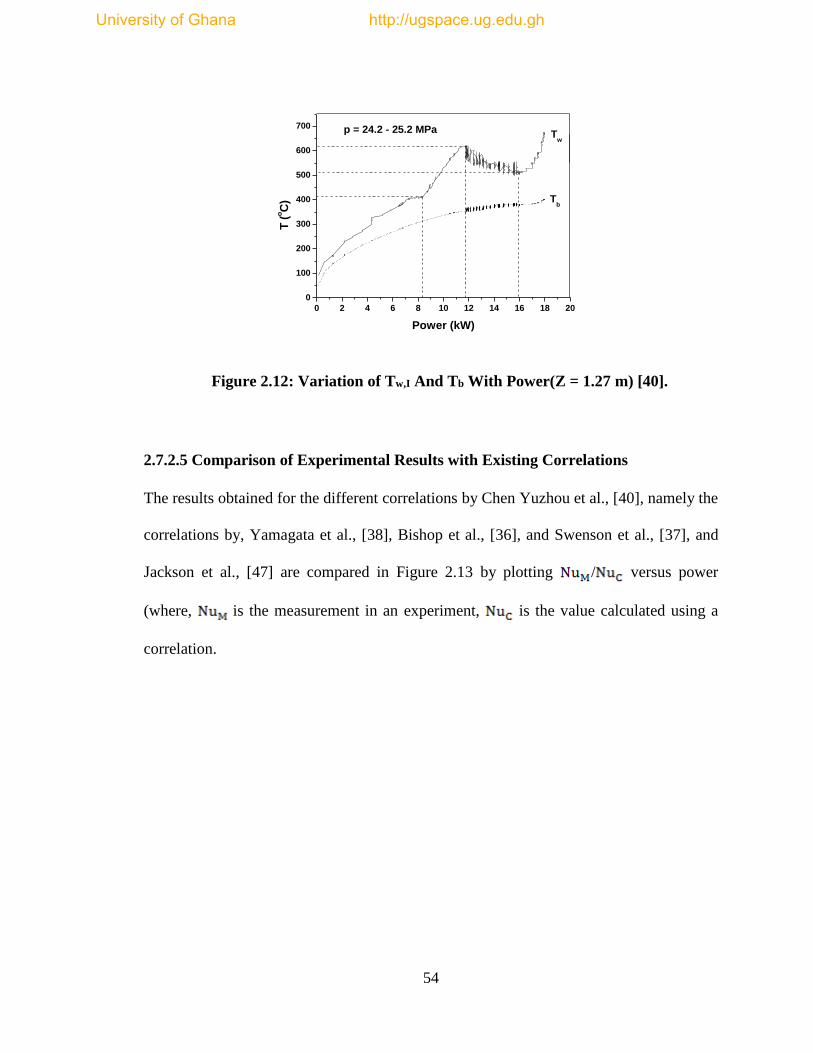
54
0 2 4 6 8 10 12 14 16 18 20
0
100
200
300
400
500
600
700 p = 24.2 - 25.2 MPa
Tb
Tw
T (
oC
)
Power (kW)
Figure 2.12: Variation of Tw,I And Tb With Power(Z = 1.27 m) [40].
2.7.2.5 Comparison of Experimental Results with Existing Correlations
The results obtained for the different correlations by Chen Yuzhou et al., [40], namely the
correlations by, Yamagata et al., [38], Bishop et al., [36], and Swenson et al., [37], and
Jackson et al., [47] are compared in Figure 2.13 by plotting / versus power
(where, is the measurement in an experiment, is the value calculated using a
correlation.
University of Ghana http://ugspace.ug.edu.gh
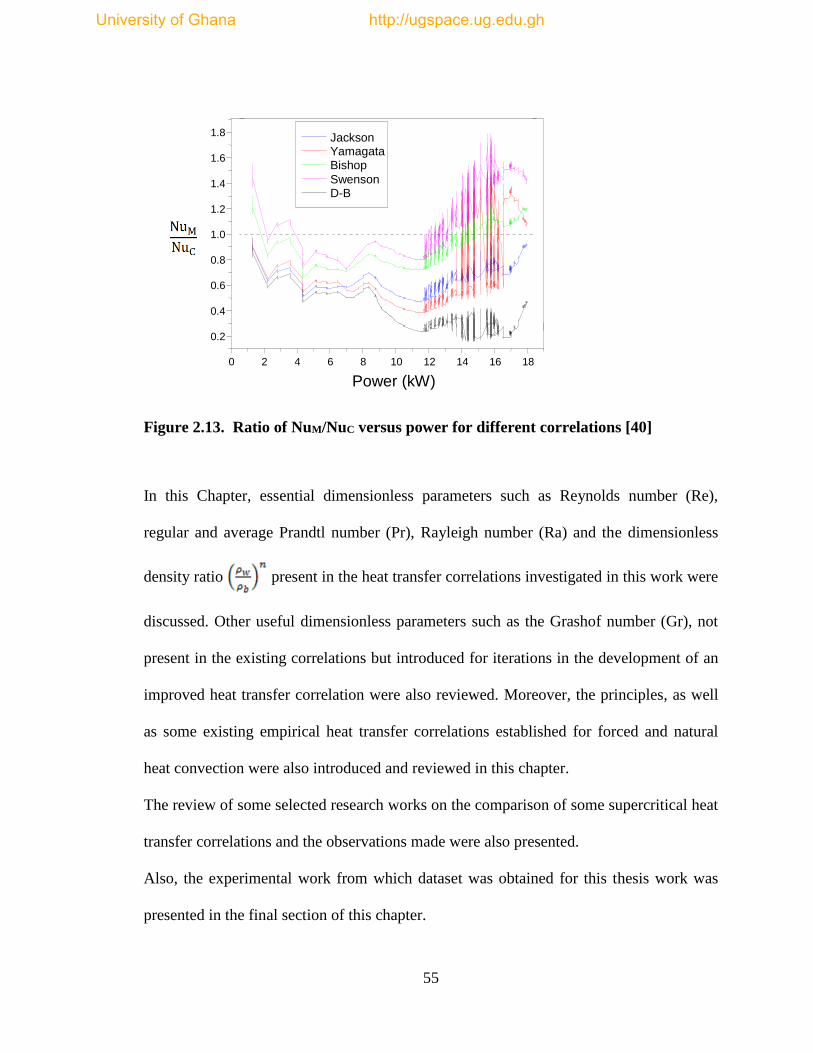
55
Figure 2.13. Ratio of NuM/NuC versus power for different correlations [40]
In this Chapter, essential dimensionless parameters such as Reynolds number (Re),
regular and average Prandtl number (Pr), Rayleigh number (Ra) and the dimensionless
density ratio present in the heat transfer correlations investigated in this work were
discussed. Other useful dimensionless parameters such as the Grashof number (Gr), not
present in the existing correlations but introduced for iterations in the development of an
improved heat transfer correlation were also reviewed. Moreover, the principles, as well
as some existing empirical heat transfer correlations established for forced and natural
heat convection were also introduced and reviewed in this chapter.
The review of some selected research works on the comparison of some supercritical heat
transfer correlations and the observations made were also presented.
Also, the experimental work from which dataset was obtained for this thesis work was
presented in the final section of this chapter.
0 2 4 6 8 10 12 14 16 18
0.2
0.4
0.6
0.8
1.0
1.2
1.4
1.6
1.8
Power (kW)
Jackson Yamagata Bishop Swenson D-B
University of Ghana http://ugspace.ug.edu.gh

56
The next Chapter presents the detailed methodology for the development of an improved
correlation for the prediction of heat transfer.
University of Ghana http://ugspace.ug.edu.gh
57
CHAPTER THREE: METHODOLOGY
3.1 INTRODUCTION
In the previous Chapter, a review of literature was presented on the general behavior of
supercritical water, dimensional and non-dimensional parameters involved in heat
convection problems and discussions on previous existing empirical heat transfer
correlations was also provided.
In this Chapter however, the method of solution employed to develop an improved
correlation for the Nusselt number applicable in SCWR is presented. Sensitivity and error
analysis conducted for dimensionless numbers and the developed correlations are also
presented.
3.2 DEVELOPING IMPROVED CORRELATION FOR NUSSELT
As discussed in the previous section of the literature review, many correlations for
estimating Nu are available. However, of great interest to the present work are the
correlations of Dittus-Boelter, Bishop and Curchill-Chu which are expressed respectively
in Table 3.1.
University of Ghana http://ugspace.ug.edu.gh
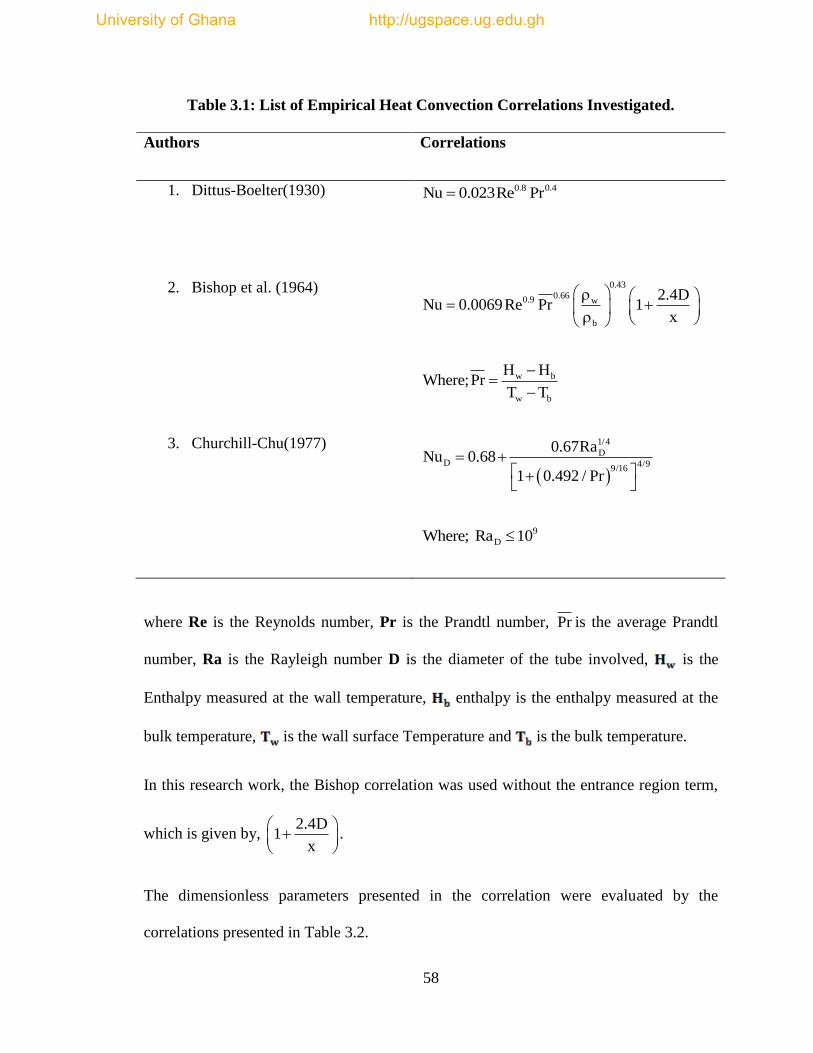
58
Table 3.1: List of Empirical Heat Convection Correlations Investigated.
Authors Correlations
1. Dittus-Boelter(1930) 0.8 0.4Nu 0.023Re Pr
2. Bishop et al. (1964)
0.43
0.660.9 w
b
2.4DNu 0.0069Re Pr 1
x
w b
w b
H HWhere;Pr
T T
3. Churchill-Chu(1977)
1/4
DD 4/9
9/16
0.67RaNu 0.68
1 0.492 / Pr
9
DWhere; Ra 10
where Re is the Reynolds number, Pr is the Prandtl number, Pr is the average Prandtl
number, Ra is the Rayleigh number D is the diameter of the tube involved, is the
Enthalpy measured at the wall temperature, enthalpy is the enthalpy measured at the
bulk temperature, is the wall surface Temperature and is the bulk temperature.
In this research work, the Bishop correlation was used without the entrance region term,
which is given by, 2.4D
1x
.
The dimensionless parameters presented in the correlation were evaluated by the
correlations presented in Table 3.2.
University of Ghana http://ugspace.ug.edu.gh
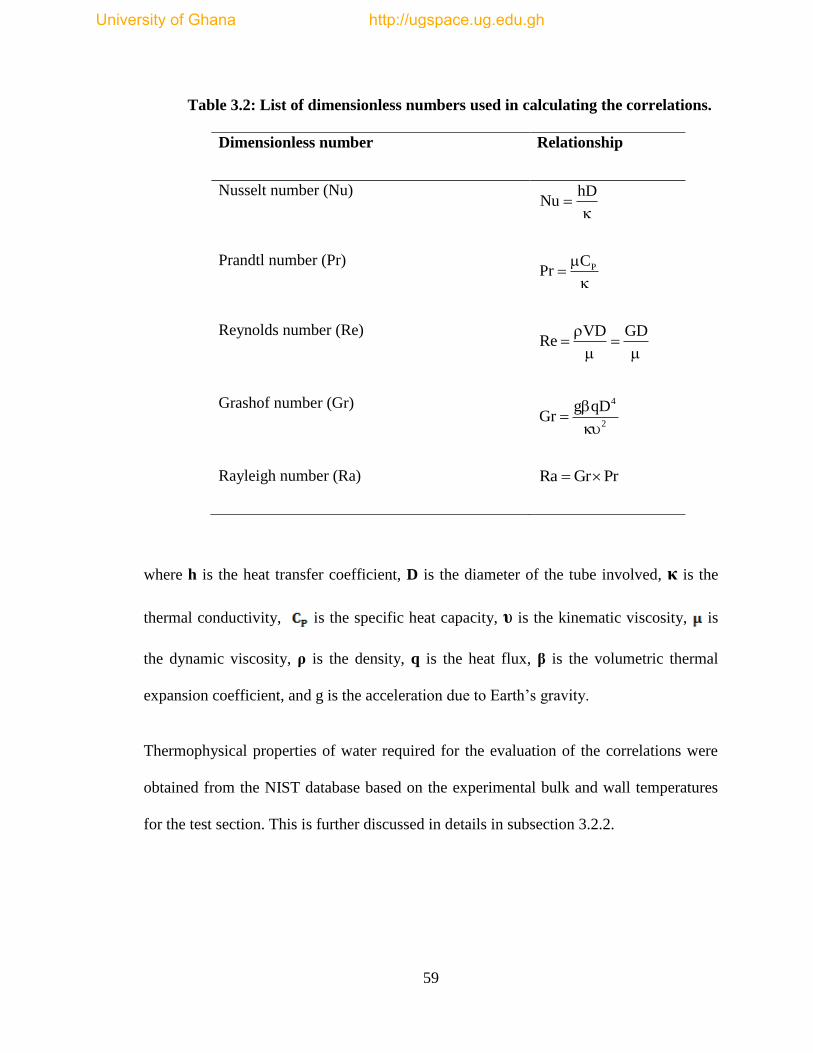
59
Table 3.2: List of dimensionless numbers used in calculating the correlations.
Dimensionless number Relationship
Nusselt number (Nu) hDNu
Prandtl number (Pr) PC
Pr
Reynolds number (Re) VD GDRe
Grashof number (Gr) 4
2
g qDGr
Rayleigh number (Ra) Ra Gr Pr
where h is the heat transfer coefficient, D is the diameter of the tube involved, κ is the
thermal conductivity, is the specific heat capacity, υ is the kinematic viscosity, is
the dynamic viscosity, ρ is the density, q is the heat flux, β is the volumetric thermal
expansion coefficient, and g is the acceleration due to Earth’s gravity.
Thermophysical properties of water required for the evaluation of the correlations were
obtained from the NIST database based on the experimental bulk and wall temperatures
for the test section. This is further discussed in details in subsection 3.2.2.
University of Ghana http://ugspace.ug.edu.gh
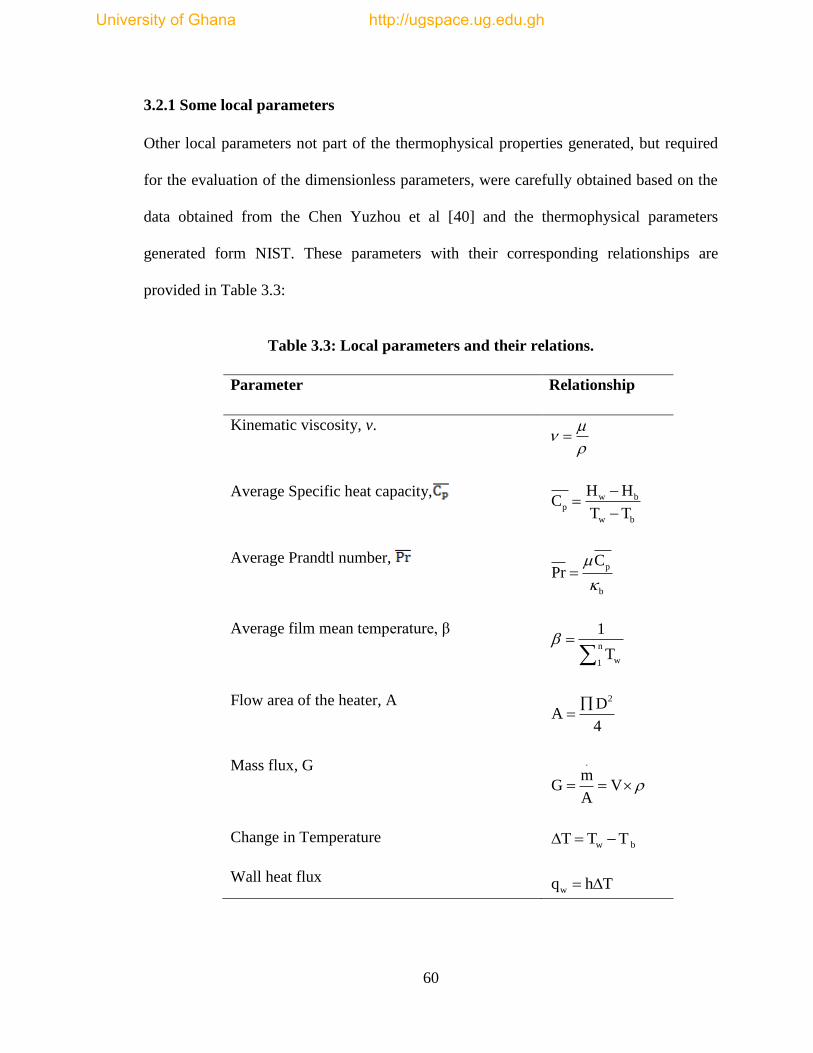
60
3.2.1 Some local parameters
Other local parameters not part of the thermophysical properties generated, but required
for the evaluation of the dimensionless parameters, were carefully obtained based on the
data obtained from the Chen Yuzhou et al [40] and the thermophysical parameters
generated form NIST. These parameters with their corresponding relationships are
provided in Table 3.3:
Table 3.3: Local parameters and their relations.
Parameter
Relationship
Kinematic viscosity, v.
Average Specific heat capacity,
w bp
w b
H HC
T T
Average Prandtl number,
p
b
CPr
Average film mean temperature, β
n
w1
1
T
Flow area of the heater, A
2D
A4
Mass flux, G
.
mG V
A
Change in Temperature
Wall heat flux
w bT T T
wq h T
University of Ghana http://ugspace.ug.edu.gh

61
where is the wall enthalpy, is the bulk enthalpy, is the wall temperature, is
the bulk temperature, is the mass flow rate, is the dynamic viscosity, is the
density, is the bulk viscosity, is the bulk thermal conductivity, D is the diameter, V
is the velocity.
The diameter, D and the cross-sectional area, A of the test tube which fall under
geometry description is discussed in details in sub-sections 3.2.4 and 3.2.4.2.
3.2.2 Thermophysical properties of water
Two sets of thermophysical properties corresponding to the wall and bulk temperatures
respectively, at cross-sections along the heating section were obtained. Thus, one set of
thermophysical properties were calculated according to the bulk-fluid temperature, and
the other set, according to the wall temperature.
The properties for the fluid flow in the 1.27 m heater were obtained under an isobaric
pressure condition of water flowing at 24.7 MPa.
The thermophysical properties were generated using the NIST software (NIST
WebBook) under the conditions stated in Table 3.4.
The thermophysical properties generated include:
Density, ρ (kg/m3);
Heat capacity at constant pressure, Cp(J/kgK);
Enthalpy, H (kJ/kg);
Viscosity, µ (Pa.s);
Thermal conductivity, k (W/mK).
University of Ghana http://ugspace.ug.edu.gh
62
The trends of these thermophysical properties of water at 24.7 MPa are presented in
Appendix D-H.
3.2.3 Experimental Analysis
The experimental dataset used in this work was acquired at the China Institute of Atomic
Energy. The experiment conducted by Chen Yuzhou et al., [40], was performed in a
natural circulation loop with a heating section at a vertical side and an annular heat
exchanger at the top horizontal size. The experimental conditions, selected based on the
operating conditions of the SCWR are provided in Table 3.4.
The detailed description of the experimental facility and procedure, as well as the major
results of the experiment obtained are provided in Section 2.7.
The data acquired from the experiment provided the baseline data used to derive other
parameters necessary for the evaluation of the correlations and also used for the
validation of computed correlations. These data include:
Variation of the mass flow rate with power.
Variation of wall temperature, Tw,i and bulk temperature, Tb with power.
Variation of heat transfer coefficients with power for Tw > TPC.
Variations of the ratio of Experimental Nu to the Nu calculated with selected
correlations against power.
University of Ghana http://ugspace.ug.edu.gh
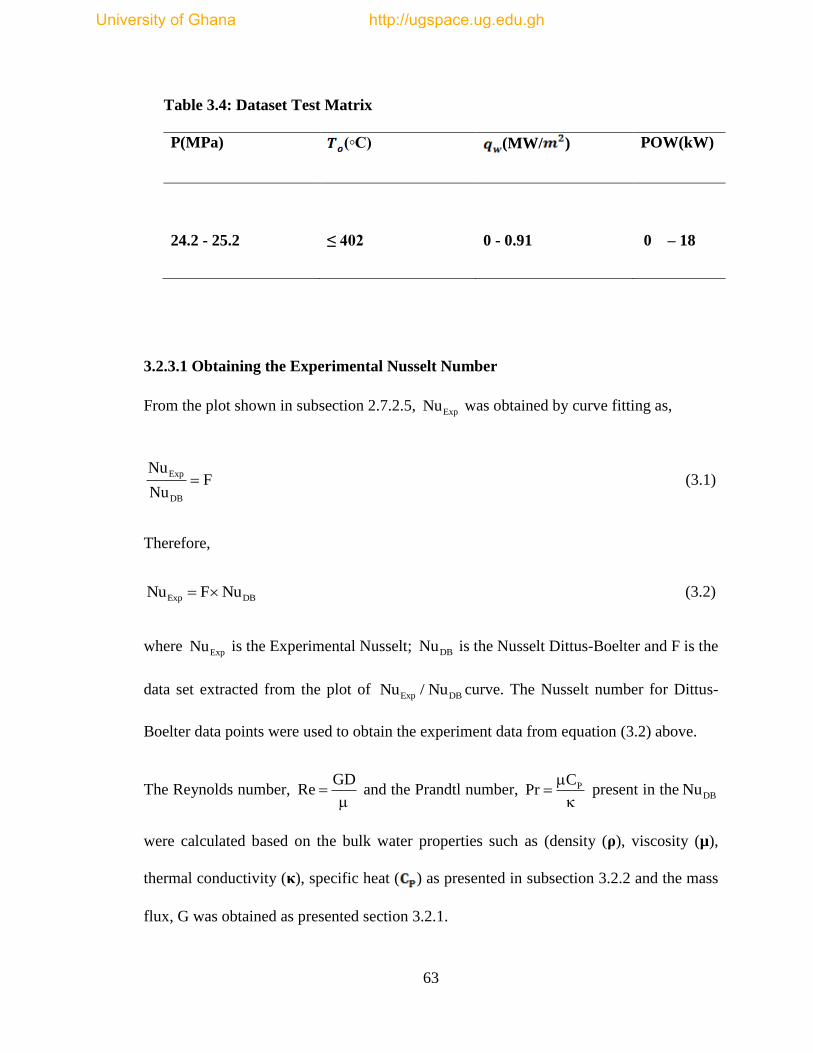
63
Table 3.4: Dataset Test Matrix
P(MPa) (◦C) (MW/ ) POW(kW)
24.2 - 25.2
≤ 402
0 - 0.91
0 – 18
3.2.3.1 Obtaining the Experimental Nusselt Number
From the plot shown in subsection 2.7.2.5, ExpNu was obtained by curve fitting as,
Exp
DB
NuF
Nu (3.1)
Therefore,
Exp DBNu F Nu (3.2)
where ExpNu is the Experimental Nusselt; DBNu is the Nusselt Dittus-Boelter and F is the
data set extracted from the plot of Exp DBNu / Nu curve. The Nusselt number for Dittus-
Boelter data points were used to obtain the experiment data from equation (3.2) above.
The Reynolds number, GD
Re
and the Prandtl number, PCPr
present in the DBNu
were calculated based on the bulk water properties such as (density (ρ), viscosity (µ),
thermal conductivity (κ), specific heat ( ) as presented in subsection 3.2.2 and the mass
flux, G was obtained as presented section 3.2.1.
University of Ghana http://ugspace.ug.edu.gh
64
3.3 HEAT TRANSFER CORRELATIONS
Two methods were employed in calculating the heat transfer characteristics of
supercritical water flowing in the natural circulation loop, especially in the vertical heater
(heating section). Selected correlations such as Dittus-Boelter, Churchill-Chu, etc were
used for the purpose of this research.
These methods are: The use of NCLoop FORTRAN code and then the use of a developed
code and an in-house FORTRAN Program for the computations and the analysis of the
correlations.
3.3.1 Using NCLoop For The Computation of the Correlations
NCLoop code with a multiple function of computing heat transfer characteristics as well
as stability analysis, was employed to compute the mass flow rate through the vertical
heated section of a Natural Circulation loop using the selected heat transfer correlations
based on the details of the tube geometry.
For the purpose of this work, the code was set up to compute the Churchill-Chu
correlation, to give an output of mass flow rate for a subsequent comparison with the
CIAE experimental data.
To implement the NCLoop code, the geometric details and boundary conditions of each
tube in the natural circulation loop under consideration are supplied in the program.
For each tube, the information to be provided is categorized into sections. These include;
the geometric data, general data and the heat structure data sections. In the geometric data
section, the following geometric information for each tube in the NCL was provided:
University of Ghana http://ugspace.ug.edu.gh
65
Diameter and Length of the pipe. Within the general pipe data category, the following
information about each pipe were provided: Start angle, End angle, number of nodes, End
of pipe pressure drop (Forward and Reverse). In the heat structure data section, the
following information were provided for each pipe: Thickness (given by the difference
between the outside and inside diameter of a pipe), Power, Thermal conductivity, ρ ,
Fluid temperature, Wall Temperature and Outer and inner heat transfer coefficient.
The properties for the pipe depends on the material make of the pipe and in this case the
pipes were typical of a stainless steel. The angles of inclination are 0º and 180º for
horizontal pipes and 90º and 270º for vertical pipes. For the pipes at the bends, the
forward and the reverse pressure drops were fixed at 0.05, whereas the remaining pipes
were assigned pressure drops of 0.
After setting all the various parameters in the code with the desired heat transfer
correlation selected in the correlation section, the code is then executed with the output
result presenting list of inlet and outlet mass flow rate and temperature with their
corresponding power for each tube in the NCL. The result for the test section (pipe) under
study is then chosen.
3.3.2 Evaluation of Correlations with in-house FORTRAN Program
In-house FORTRAN programs were developed and used for heat transfer characteristics
computations, such as the calculations of Nusselt numbers for the considered heat
transfer correlations (these codes are provided in appendices J-M). The results of the
computed Nusselt numbers based on the selected heat transfer correlations were then
analysed and compared with experimental data.
University of Ghana http://ugspace.ug.edu.gh
66
The Excel Workbook was employed in the calculation of some derived heat transfer
parameters, dimensionless numbers which were used in the computations of the selected
heat transfer correlations.
3.4 GEOMETRY DESCRIPTION
The geometry selected for this study is based on the natural circulation loop (NCL)
presented in detail in Section 2.7. As mentioned in the section 2.7, the facility was
established at the China Institute of Atomic Energy as part of projects to investigate the
thermal-hydraulic behavior of the SCWR. The NCL is a rectangular loop installed
vertically with wideness of 2.4 m and height of 1.77 m [40]. However, this study focuses
on the vertical heating section of this natural circulation loop. Further geometry
description of the vertical heater tube is presented in subsection 3.2.4.2. The next
subsection discusses the procedure for preparing the NCL for implementation in a
software code.
3.4.1 Setting up the loop for Computation using the NCLoop
In order to apply the heat transfer correlations calculations on the natural circulation loop
(NCL), the rectangular loop is first set-up into sections. The sections consist of the Heater
(heated) section as shown in Figure 3.1. Thus, the loop is sectioned into 15-tubes or units,
not necessarily evenly spaced, but having the original dimensions (Length, Breadth, and
Diameters) of the NCL.
Subsequently, the node size of approximately 0.02 for each node is obtained using the
formula;
University of Ghana http://ugspace.ug.edu.gh
67
Length of each tube
Number of nodes per tubeNode size Volume size
(3.3)
The schematic diagram of the loop showing the various subsections with their
corresponding geometry or dimensions is provided Figure 1.4 under the scope of study
subheading.
The Heat transfer analysis done using the NCLoop was conducted under transient state
condition. The total length of the loop considered for this research is 8.34 m. The
thermal-physical properties inputted in the code include: thermal conductivity, density
and specific heat capacity which were chosen such that they are typical of a stainless
steel.
The output result of each sub tube of the natural circulation loop is computed according
to the specific heat transfer correlation inputted into the NCLoop code. For this study, the
Churchill-Chu correlation was used to compute the mass flow rate of the various tubes.
Using the NCLoop code, the result of the vertical heating section of the loop computed
with the Churchill-Chu correlation was presented in Figure 4.1 of Section 4.2. Since the
heater test section is the main focus of this study which is discussed in extensive details
in subsection 3.4.2. Table 3.5 shows some geometry details of each section of the natural
circulation loop.
University of Ghana http://ugspace.ug.edu.gh
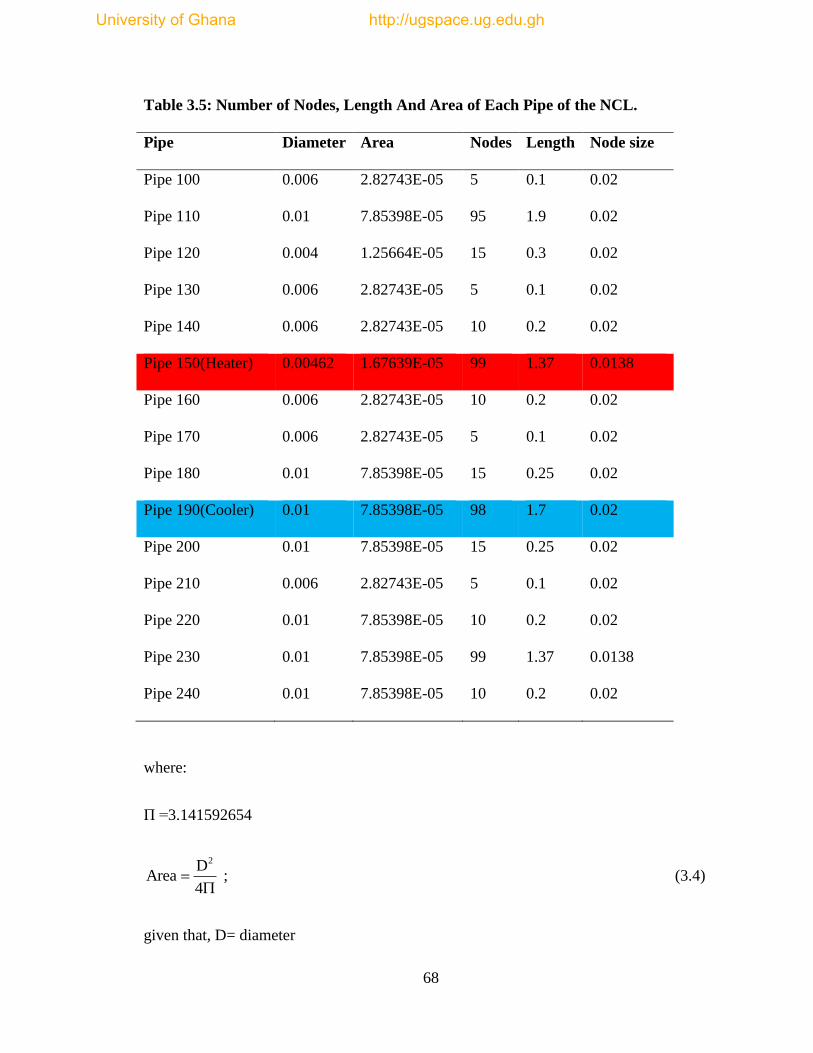
68
Table 3.5: Number of Nodes, Length And Area of Each Pipe of the NCL.
Pipe Diameter Area Nodes Length Node size
Pipe 100 0.006 2.82743E-05 5 0.1 0.02
Pipe 110 0.01 7.85398E-05 95 1.9 0.02
Pipe 120 0.004 1.25664E-05 15 0.3 0.02
Pipe 130 0.006 2.82743E-05 5 0.1 0.02
Pipe 140 0.006 2.82743E-05 10 0.2 0.02
Pipe 150(Heater) 0.00462 1.67639E-05 99 1.37 0.0138
Pipe 160 0.006 2.82743E-05 10 0.2 0.02
Pipe 170 0.006 2.82743E-05 5 0.1 0.02
Pipe 180 0.01 7.85398E-05 15 0.25 0.02
Pipe 190(Cooler) 0.01 7.85398E-05 98 1.7 0.02
Pipe 200 0.01 7.85398E-05 15 0.25 0.02
Pipe 210 0.006 2.82743E-05 5 0.1 0.02
Pipe 220 0.01 7.85398E-05 10 0.2 0.02
Pipe 230 0.01 7.85398E-05 99 1.37 0.0138
Pipe 240 0.01 7.85398E-05 10 0.2 0.02
where:
Π =3.141592654
2DArea
4
; (3.4)
given that, D= diameter
University of Ghana http://ugspace.ug.edu.gh
69
3.4.2 The Vertical Heating Section
The heating section is the main test section under study in this research. It is located at
the right vertical side of the natural circulation loop. The heater is made of an Inconel-
625 tube, having an internal diameter (ID) of 4.62 mm, outer diameter (OD) of 6.46 mm,
and 1.37 m in heating length. It therefore has a thickness of 1.82mm. The position of the
heater in the NCL is provided in Figure 3.1. The cross-sectional area of the heating
section is computed using the mathematical relation provided in equation 3.4.
3.5 PHYSICS CONDITIONS
In this section, the Physics conditions applied to the geometry under study are vividly
described. The heater tube is supplied by direct current (DC) as a source of heating power
with a capacity of 70V x 6750 A. The outer surface temperature was obtained from the
thermocouples connected to the heater.
Heating power of the heating section was ranged from 0-18kW and wall heat flux from 0
to 0.9 MW/ . The initial power used in the experiment for the heater section was 0 kW.
This value was increased stepwise. At each step of power, both the inlet and outlet
temperatures were measured, with the corresponding time(s) also recorded. Throughout
the experiment, water entering the heater was at a temperature range of ≈ 24 ºC – 50 ºC,
whereas the corresponding outlet water temperature ranged between ≈ 95 ºC – 402 ºC.
3.6 Transport Equations for the NCLoop
The Mass, Momentum and Energy balance equations implemented in the NCLoop are
presented in this section.
University of Ghana http://ugspace.ug.edu.gh
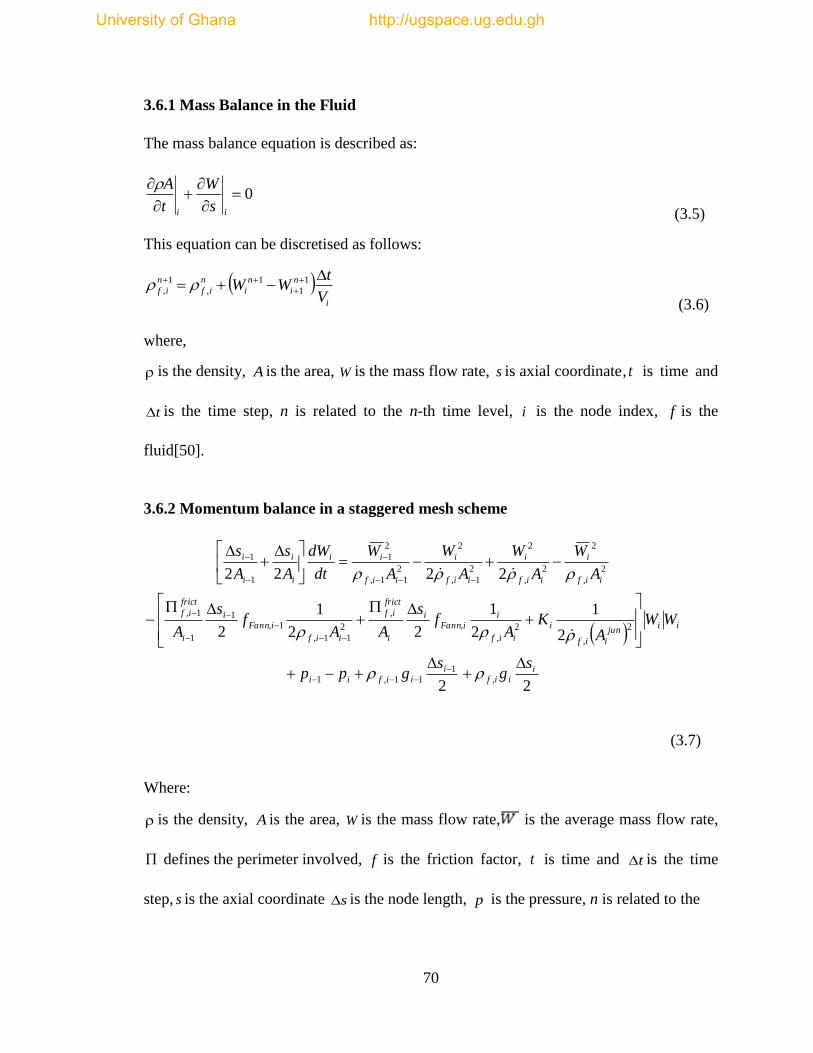
70
3.6.1 Mass Balance in the Fluid
The mass balance equation is described as:
0
ii s
W
t
A
(3.5)
This equation can be discretised as follows:
i
n
i
n
i
n
if
n
ifV
tWW
1
1
1
,
1
,
(3.6)
where,
is the density, A is the area, W is the mass flow rate, s is axial coordinate , t is time and
t is the time step, n is related to the n-th time level, i is the node index, f is the
fluid[50].
3.6.2 Momentum balance in a staggered mesh scheme
22
2
1
2
1
22
1
2
2222
,1
11,1
2
,
2
,
,
,
2
11,
1,1
1
1,
2
,
2
2
,
2
2
1,
2
2
11,
2
1
1
1
iiif
iiifii
iijun
iif
i
iif
iiFann
i
i
frict
if
iif
iFanni
i
frict
if
iif
i
iif
i
iif
i
iif
ii
i
i
i
i
sg
sgpp
WWA
KA
fs
AAf
s
A
A
W
A
W
A
W
A
W
dt
dW
A
s
A
s
(3.7)
Where:
is the density, A is the area, W is the mass flow rate, is the average mass flow rate,
defines the perimeter involved, f is the friction factor, t is time and t is the time
step, s is the axial coordinate s is the node length, p is the pressure, n is related to the
University of Ghana http://ugspace.ug.edu.gh
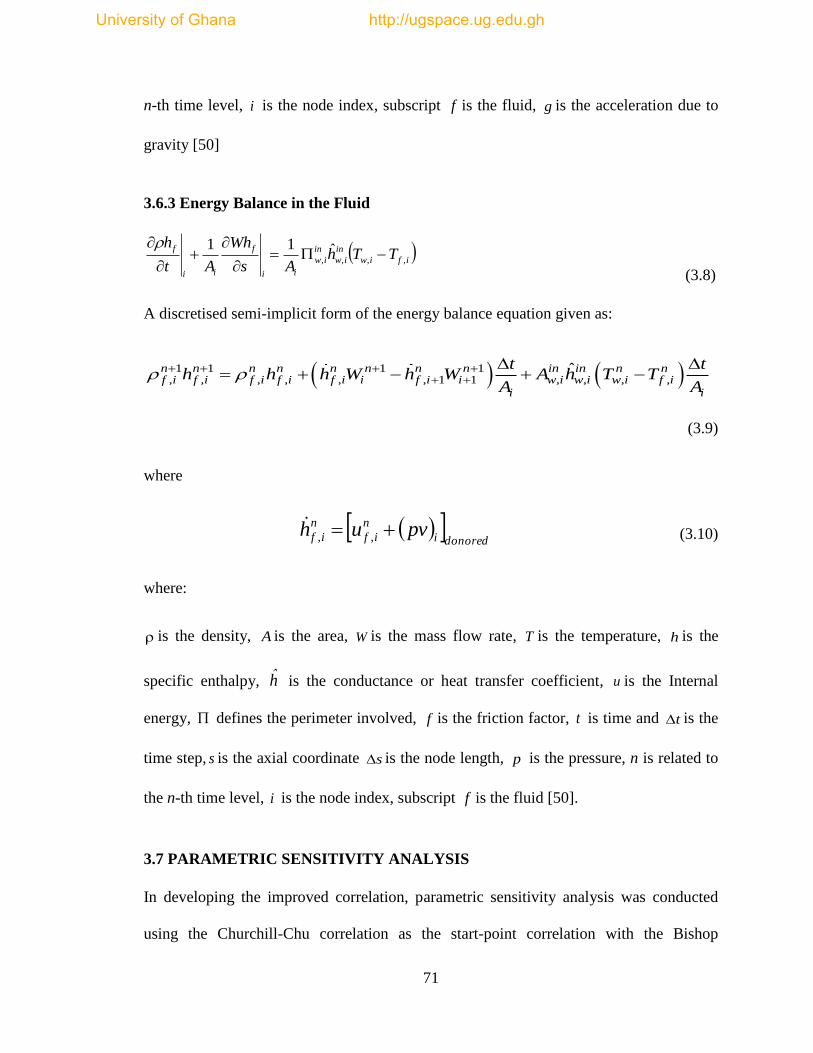
71
n-th time level, i is the node index, subscript f is the fluid, g is the acceleration due to
gravity [50]
3.6.3 Energy Balance in the Fluid
ifiw
in
iw
in
iw
ii
f
ii
fTTh
As
Wh
At
h,,,,
ˆ11
(3.8)
A discretised semi-implicit form of the energy balance equation given as:
1 1 1 1, , , , , , 1 1 , , , ,
ˆn n n n n n n n in in n nf i f i f i f i f i i f i i w i w i w i f i
i i
t th h h W h W A h T T
A A
(3.9)
where
donoredi
n
if
n
if pvuh ,,
(3.10)
where:
is the density, A is the area, W is the mass flow rate, T is the temperature, h is the
specific enthalpy, h is the conductance or heat transfer coefficient, u is the Internal
energy, defines the perimeter involved, f is the friction factor, t is time and t is the
time step, s is the axial coordinate s is the node length, p is the pressure, n is related to
the n-th time level, i is the node index, subscript f is the fluid [50].
3.7 PARAMETRIC SENSITIVITY ANALYSIS
In developing the improved correlation, parametric sensitivity analysis was conducted
using the Churchill-Chu correlation as the start-point correlation with the Bishop
University of Ghana http://ugspace.ug.edu.gh
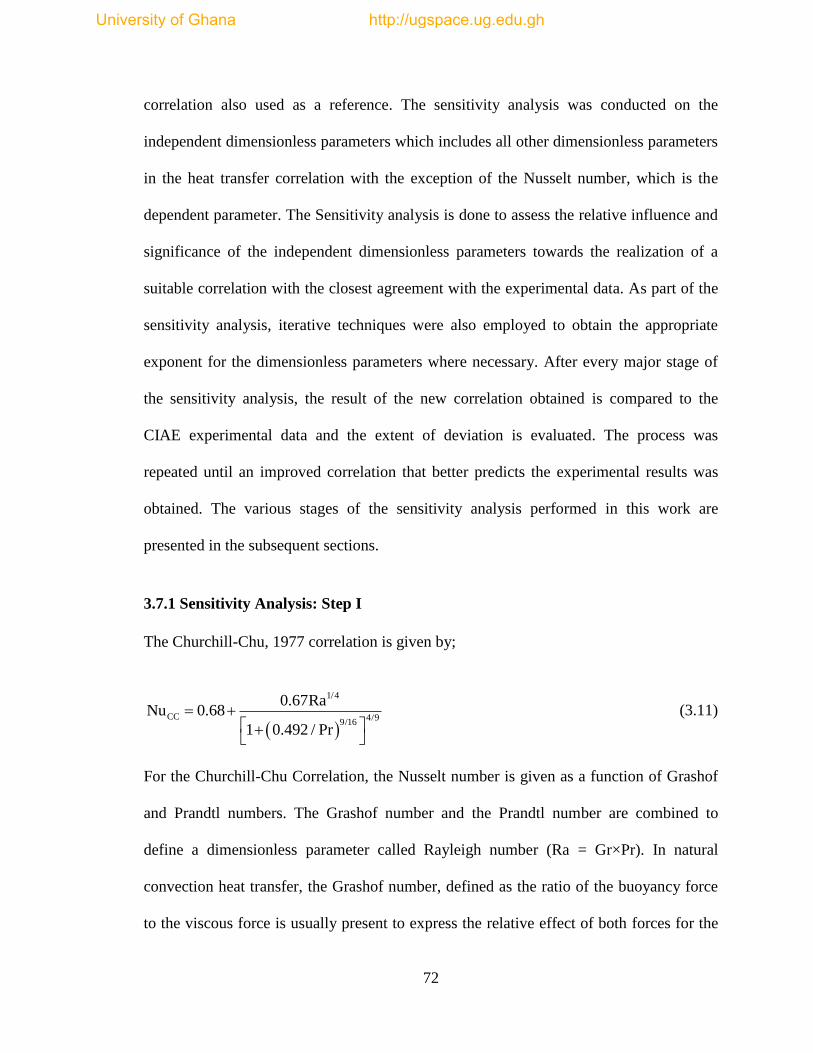
72
correlation also used as a reference. The sensitivity analysis was conducted on the
independent dimensionless parameters which includes all other dimensionless parameters
in the heat transfer correlation with the exception of the Nusselt number, which is the
dependent parameter. The Sensitivity analysis is done to assess the relative influence and
significance of the independent dimensionless parameters towards the realization of a
suitable correlation with the closest agreement with the experimental data. As part of the
sensitivity analysis, iterative techniques were also employed to obtain the appropriate
exponent for the dimensionless parameters where necessary. After every major stage of
the sensitivity analysis, the result of the new correlation obtained is compared to the
CIAE experimental data and the extent of deviation is evaluated. The process was
repeated until an improved correlation that better predicts the experimental results was
obtained. The various stages of the sensitivity analysis performed in this work are
presented in the subsequent sections.
3.7.1 Sensitivity Analysis: Step I
The Churchill-Chu, 1977 correlation is given by;
1/4
CC 4/99/16
0.67RaNu 0.68
1 0.492 / Pr
(3.11)
For the Churchill-Chu Correlation, the Nusselt number is given as a function of Grashof
and Prandtl numbers. The Grashof number and the Prandtl number are combined to
define a dimensionless parameter called Rayleigh number (Ra = Gr×Pr). In natural
convection heat transfer, the Grashof number, defined as the ratio of the buoyancy force
to the viscous force is usually present to express the relative effect of both forces for the
University of Ghana http://ugspace.ug.edu.gh
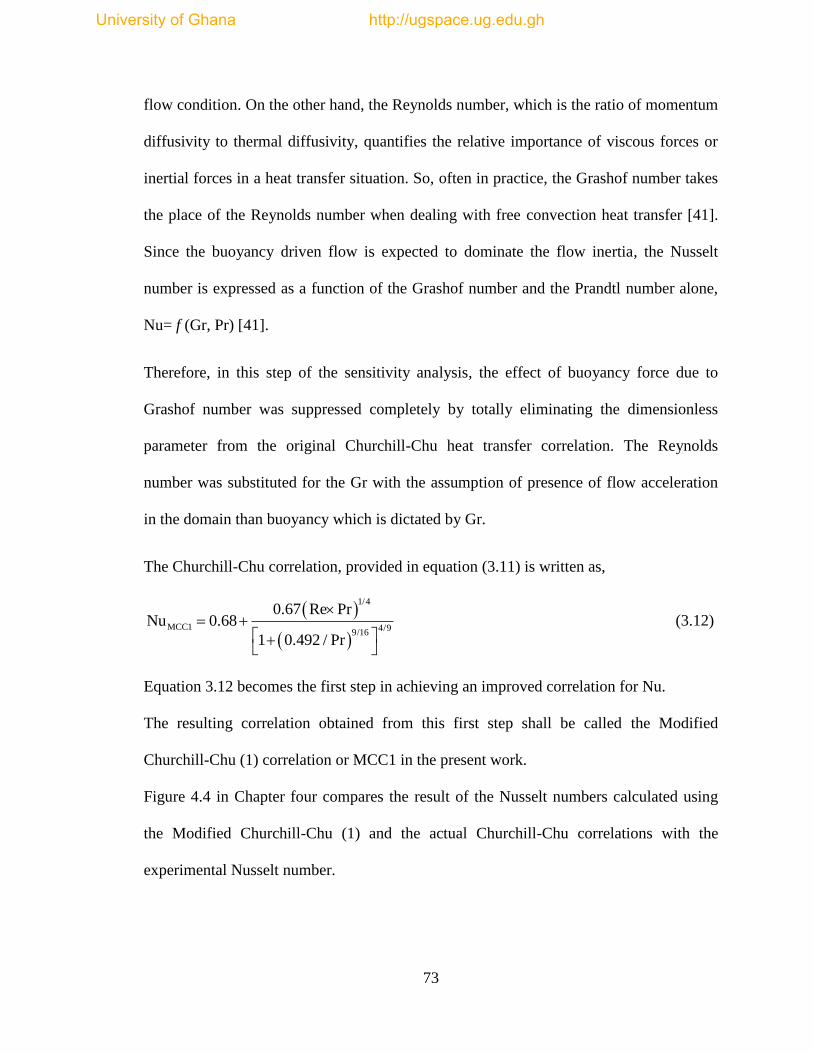
73
flow condition. On the other hand, the Reynolds number, which is the ratio of momentum
diffusivity to thermal diffusivity, quantifies the relative importance of viscous forces or
inertial forces in a heat transfer situation. So, often in practice, the Grashof number takes
the place of the Reynolds number when dealing with free convection heat transfer [41].
Since the buoyancy driven flow is expected to dominate the flow inertia, the Nusselt
number is expressed as a function of the Grashof number and the Prandtl number alone,
Nu= f (Gr, Pr) [41].
Therefore, in this step of the sensitivity analysis, the effect of buoyancy force due to
Grashof number was suppressed completely by totally eliminating the dimensionless
parameter from the original Churchill-Chu heat transfer correlation. The Reynolds
number was substituted for the Gr with the assumption of presence of flow acceleration
in the domain than buoyancy which is dictated by Gr.
The Churchill-Chu correlation, provided in equation (3.11) is written as,
1/4
MCC1 4/99/16
0.67 Re PrNu 0.68
1 0.492 / Pr
(3.12)
Equation 3.12 becomes the first step in achieving an improved correlation for Nu.
The resulting correlation obtained from this first step shall be called the Modified
Churchill-Chu (1) correlation or MCC1 in the present work.
Figure 4.4 in Chapter four compares the result of the Nusselt numbers calculated using
the Modified Churchill-Chu (1) and the actual Churchill-Chu correlations with the
experimental Nusselt number.
University of Ghana http://ugspace.ug.edu.gh
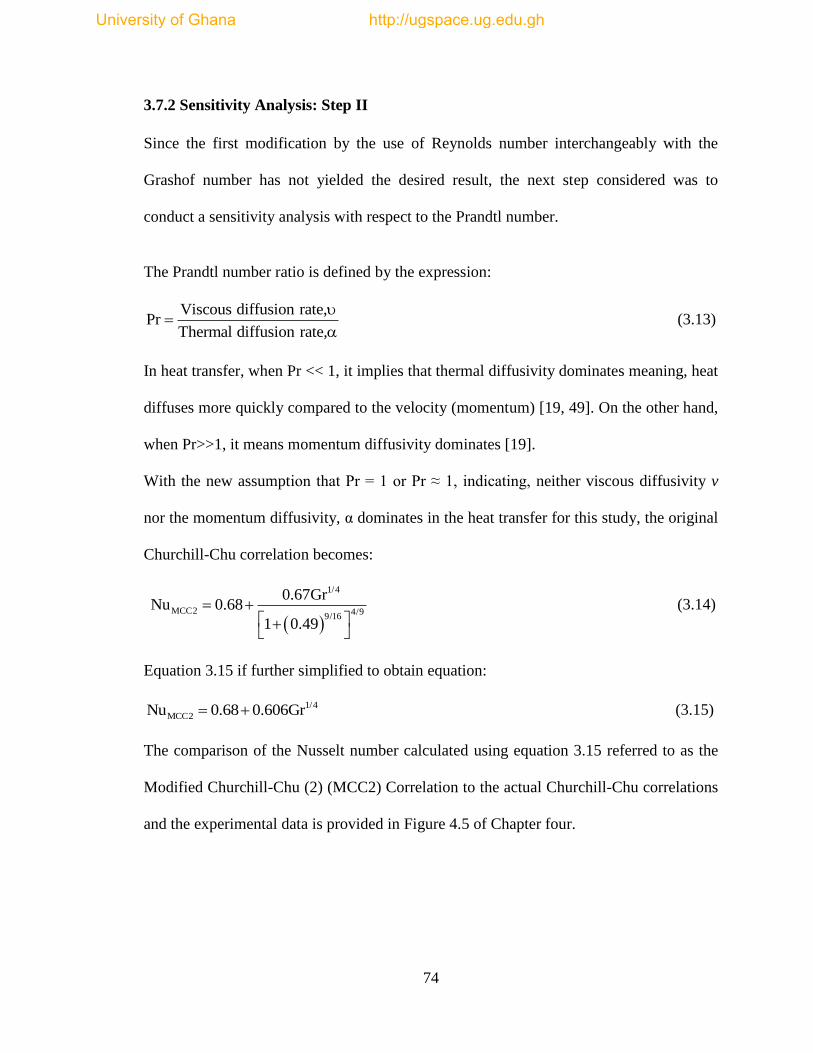
74
3.7.2 Sensitivity Analysis: Step II
Since the first modification by the use of Reynolds number interchangeably with the
Grashof number has not yielded the desired result, the next step considered was to
conduct a sensitivity analysis with respect to the Prandtl number.
The Prandtl number ratio is defined by the expression:
Viscous diffusion rate,Pr
Thermal diffusion rate,
(3.13)
In heat transfer, when Pr << 1, it implies that thermal diffusivity dominates meaning, heat
diffuses more quickly compared to the velocity (momentum) [19, 49]. On the other hand,
when Pr>>1, it means momentum diffusivity dominates [19].
With the new assumption that Pr = 1 or Pr ≈ 1, indicating, neither viscous diffusivity v
nor the momentum diffusivity, α dominates in the heat transfer for this study, the original
Churchill-Chu correlation becomes:
1/4
MCC2 4/99/16
0.67GrNu 0.68
1 0.49
(3.14)
Equation 3.15 if further simplified to obtain equation:
1/4
MCC2Nu 0.68 0.606Gr (3.15)
The comparison of the Nusselt number calculated using equation 3.15 referred to as the
Modified Churchill-Chu (2) (MCC2) Correlation to the actual Churchill-Chu correlations
and the experimental data is provided in Figure 4.5 of Chapter four.
University of Ghana http://ugspace.ug.edu.gh
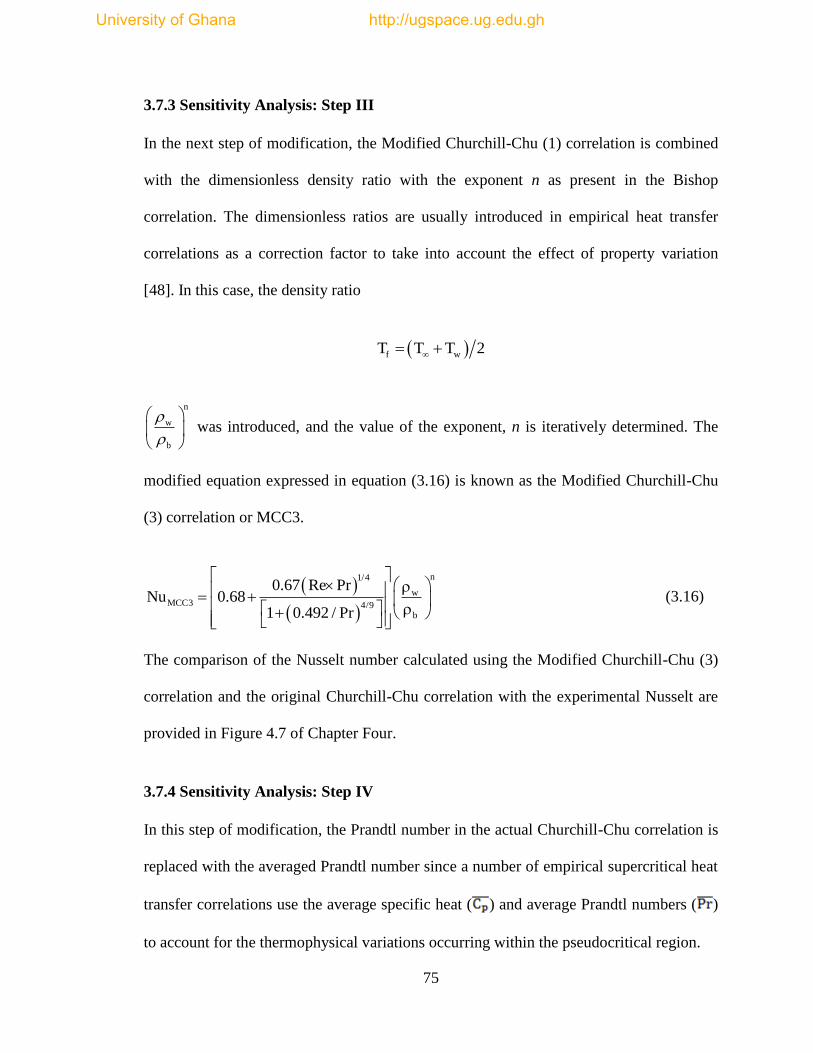
75
3.7.3 Sensitivity Analysis: Step III
In the next step of modification, the Modified Churchill-Chu (1) correlation is combined
with the dimensionless density ratio with the exponent n as present in the Bishop
correlation. The dimensionless ratios are usually introduced in empirical heat transfer
correlations as a correction factor to take into account the effect of property variation
[48]. In this case, the density ratio
f wT T T 2
n
w
b
was introduced, and the value of the exponent, n is iteratively determined. The
modified equation expressed in equation (3.16) is known as the Modified Churchill-Chu
(3) correlation or MCC3.
n1/4
wMCC3 4/9
b
0.67 Re PrNu 0.68
1 0.492 / Pr
(3.16)
The comparison of the Nusselt number calculated using the Modified Churchill-Chu (3)
correlation and the original Churchill-Chu correlation with the experimental Nusselt are
provided in Figure 4.7 of Chapter Four.
3.7.4 Sensitivity Analysis: Step IV
In this step of modification, the Prandtl number in the actual Churchill-Chu correlation is
replaced with the averaged Prandtl number since a number of empirical supercritical heat
transfer correlations use the average specific heat ( ) and average Prandtl numbers ( )
to account for the thermophysical variations occurring within the pseudocritical region.
University of Ghana http://ugspace.ug.edu.gh
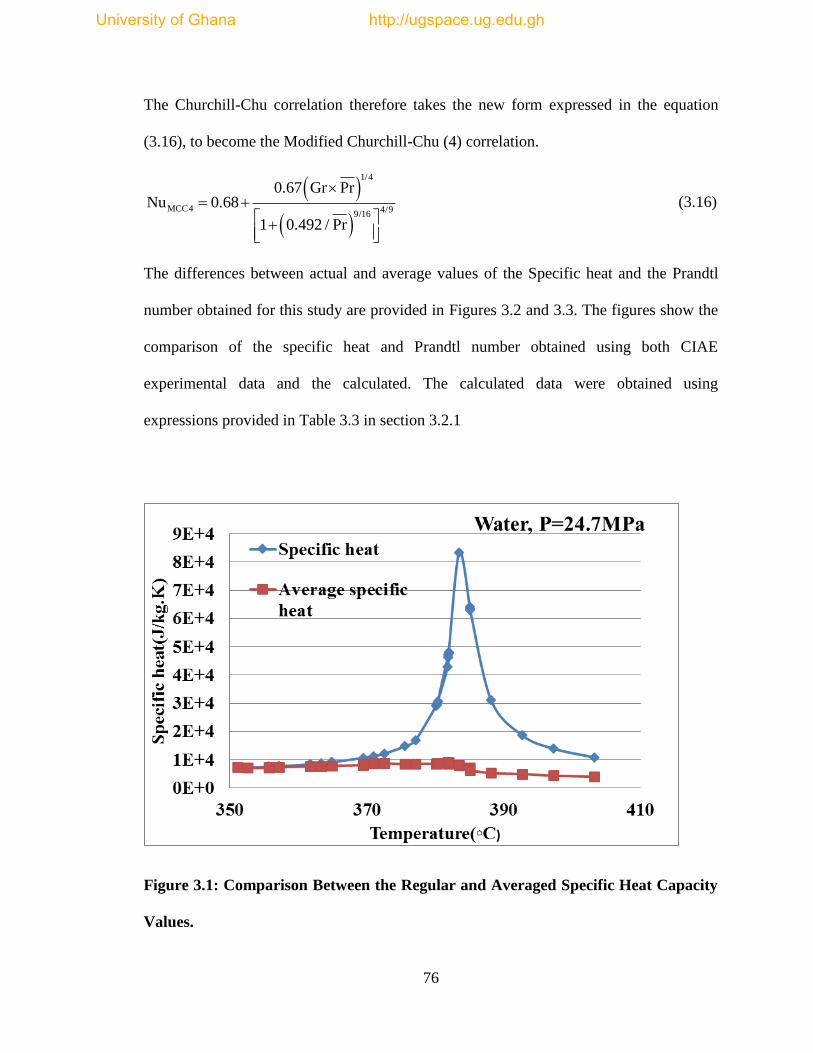
76
The Churchill-Chu correlation therefore takes the new form expressed in the equation
(3.16), to become the Modified Churchill-Chu (4) correlation.
1/4
MCC4 4/99/16
0.67 Gr PrNu 0.68
1 0.492 / Pr
(3.16)
The differences between actual and average values of the Specific heat and the Prandtl
number obtained for this study are provided in Figures 3.2 and 3.3. The figures show the
comparison of the specific heat and Prandtl number obtained using both CIAE
experimental data and the calculated. The calculated data were obtained using
expressions provided in Table 3.3 in section 3.2.1
Figure 3.1: Comparison Between the Regular and Averaged Specific Heat Capacity
Values.
University of Ghana http://ugspace.ug.edu.gh
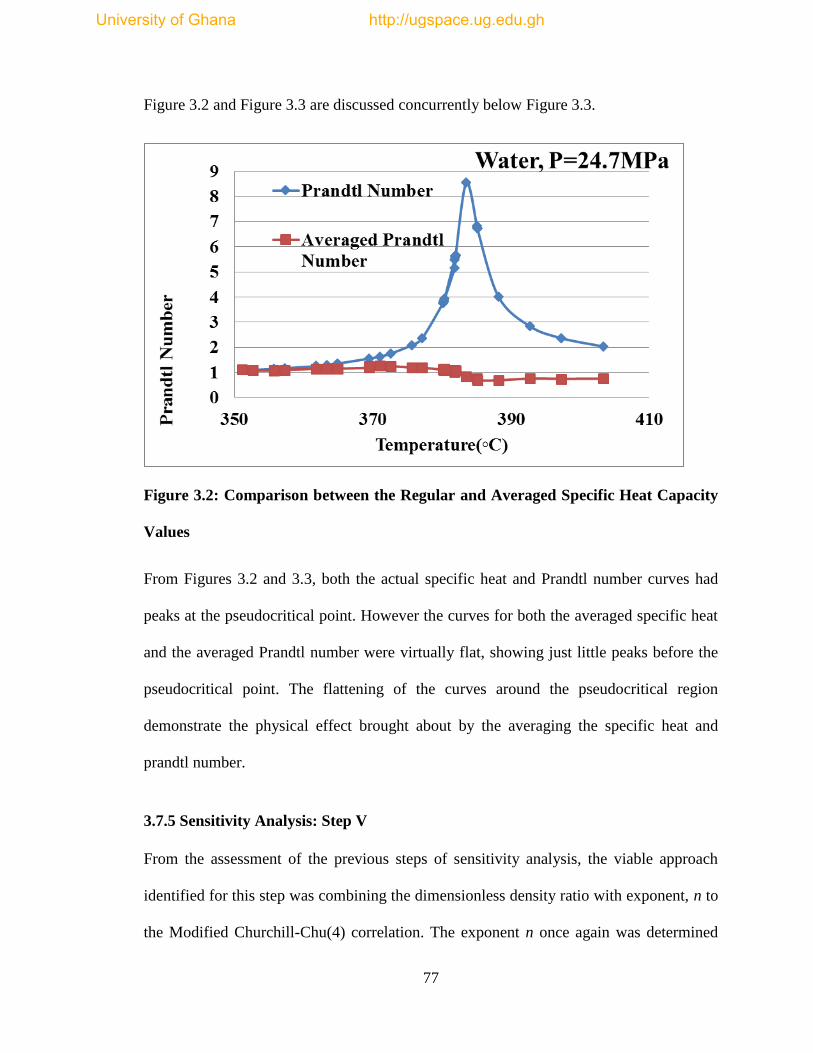
77
Figure 3.2 and Figure 3.3 are discussed concurrently below Figure 3.3.
Figure 3.2: Comparison between the Regular and Averaged Specific Heat Capacity
Values
From Figures 3.2 and 3.3, both the actual specific heat and Prandtl number curves had
peaks at the pseudocritical point. However the curves for both the averaged specific heat
and the averaged Prandtl number were virtually flat, showing just little peaks before the
pseudocritical point. The flattening of the curves around the pseudocritical region
demonstrate the physical effect brought about by the averaging the specific heat and
prandtl number.
3.7.5 Sensitivity Analysis: Step V
From the assessment of the previous steps of sensitivity analysis, the viable approach
identified for this step was combining the dimensionless density ratio with exponent, n to
the Modified Churchill-Chu(4) correlation. The exponent n once again was determined
University of Ghana http://ugspace.ug.edu.gh
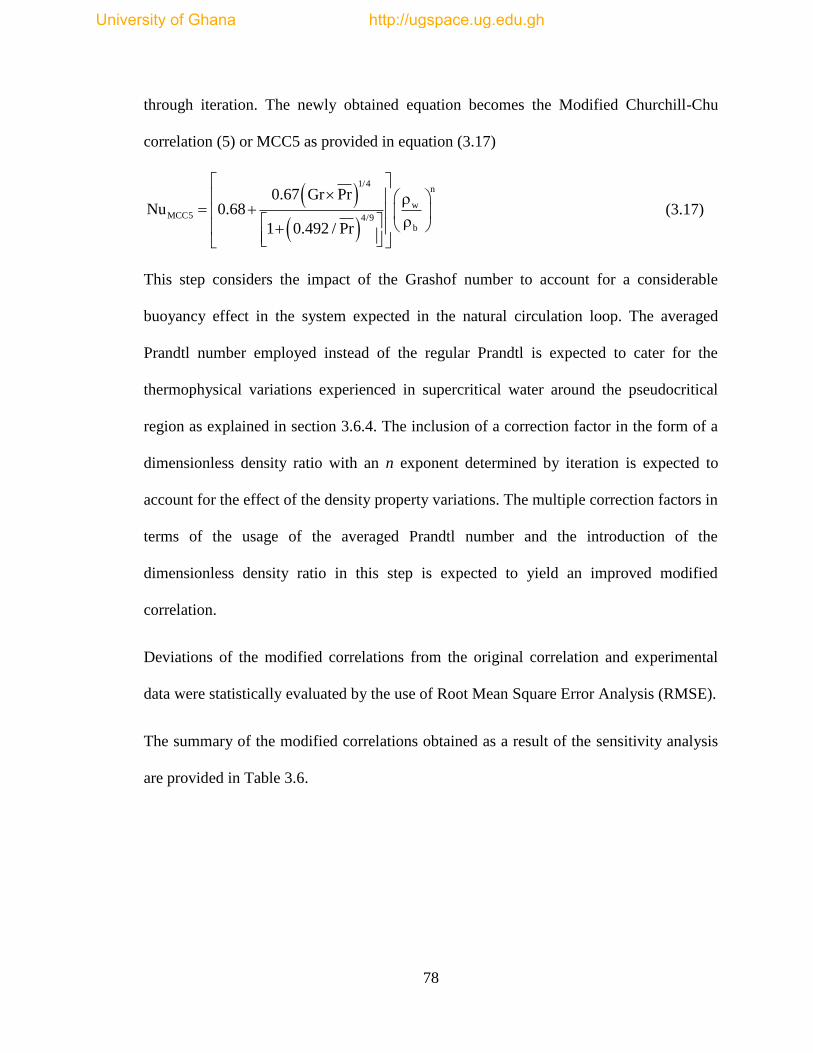
78
through iteration. The newly obtained equation becomes the Modified Churchill-Chu
correlation (5) or MCC5 as provided in equation (3.17)
1/4n
wMCC5 4/9
b
0.67 Gr PrNu 0.68
1 0.492 / Pr
(3.17)
This step considers the impact of the Grashof number to account for a considerable
buoyancy effect in the system expected in the natural circulation loop. The averaged
Prandtl number employed instead of the regular Prandtl is expected to cater for the
thermophysical variations experienced in supercritical water around the pseudocritical
region as explained in section 3.6.4. The inclusion of a correction factor in the form of a
dimensionless density ratio with an n exponent determined by iteration is expected to
account for the effect of the density property variations. The multiple correction factors in
terms of the usage of the averaged Prandtl number and the introduction of the
dimensionless density ratio in this step is expected to yield an improved modified
correlation.
Deviations of the modified correlations from the original correlation and experimental
data were statistically evaluated by the use of Root Mean Square Error Analysis (RMSE).
The summary of the modified correlations obtained as a result of the sensitivity analysis
are provided in Table 3.6.
University of Ghana http://ugspace.ug.edu.gh
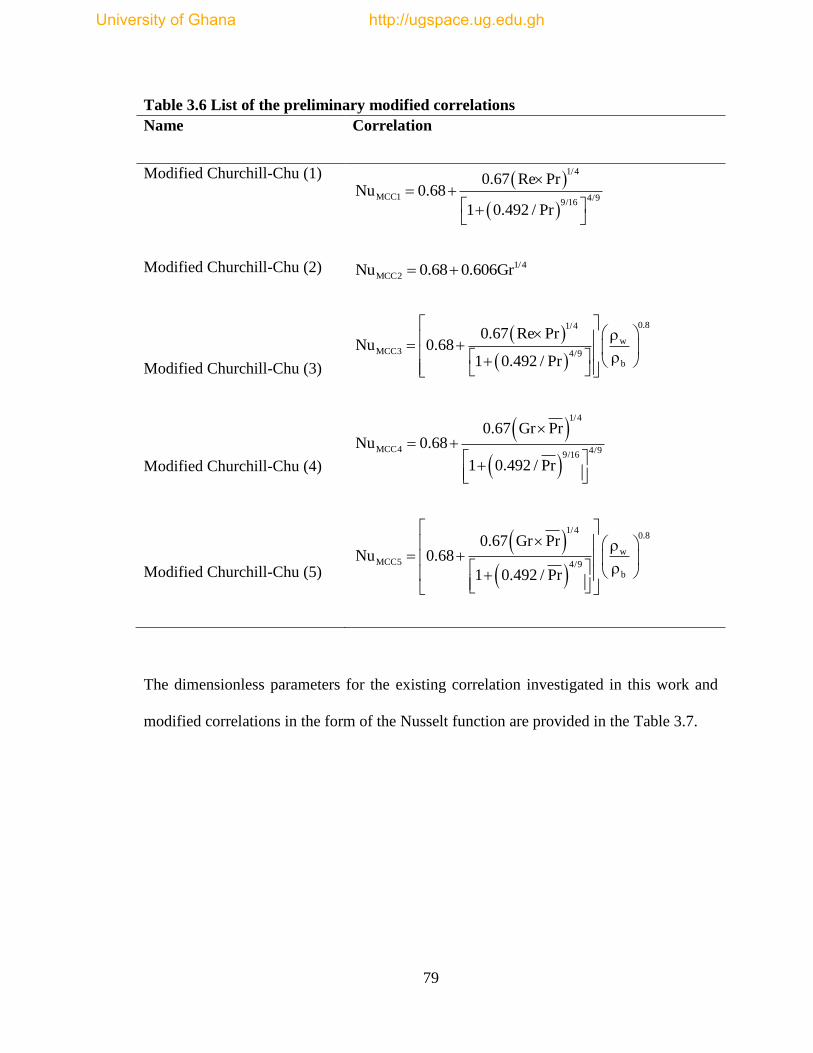
79
Table 3.6 List of the preliminary modified correlations
Name Correlation
Modified Churchill-Chu (1)
1/4
MCC1 4/99/16
0.67 Re PrNu 0.68
1 0.492 / Pr
Modified Churchill-Chu (2) 1/4
MCC2Nu 0.68 0.606Gr
Modified Churchill-Chu (3)
0.81/4
wMCC3 4/9
b
0.67 Re PrNu 0.68
1 0.492 / Pr
Modified Churchill-Chu (4)
1/4
MCC4 4/99/16
0.67 Gr PrNu 0.68
1 0.492 / Pr
Modified Churchill-Chu (5)
1/40.8
wMCC5 4/9
b
0.67 Gr PrNu 0.68
1 0.492 / Pr
The dimensionless parameters for the existing correlation investigated in this work and
modified correlations in the form of the Nusselt function are provided in the Table 3.7.
University of Ghana http://ugspace.ug.edu.gh
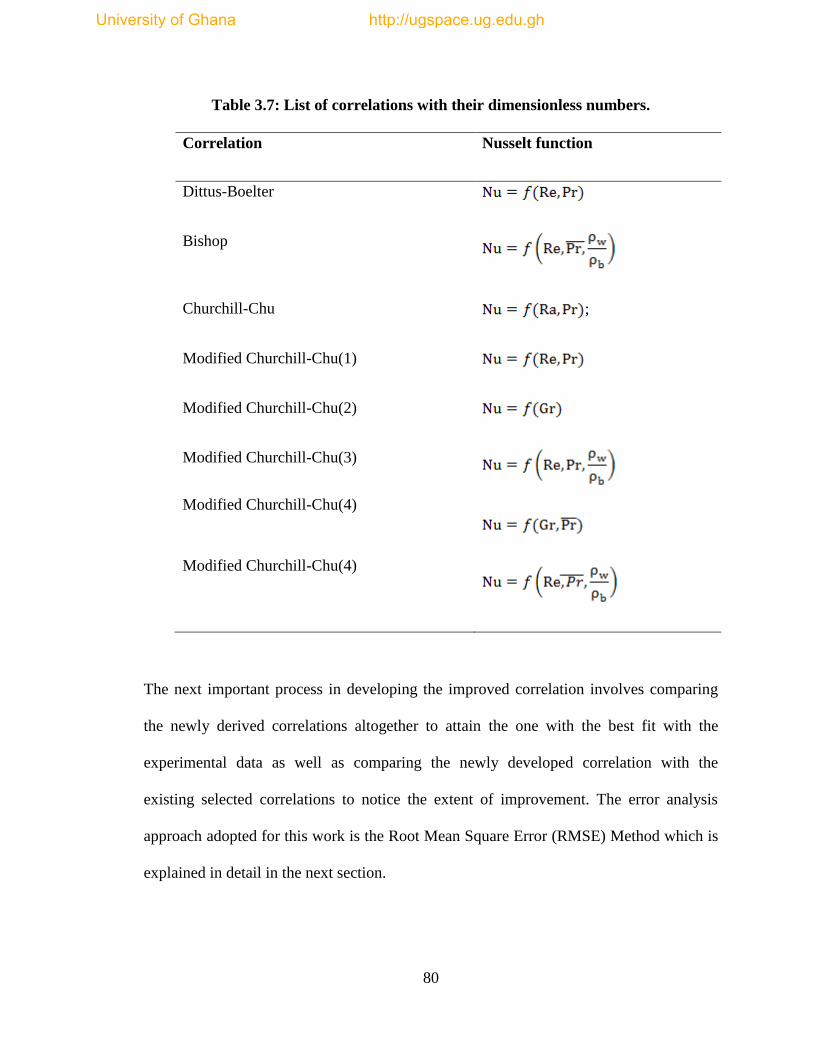
80
Table 3.7: List of correlations with their dimensionless numbers.
Correlation Nusselt function
Dittus-Boelter
Bishop
Churchill-Chu ;
Modified Churchill-Chu(1)
Modified Churchill-Chu(2)
Modified Churchill-Chu(3)
Modified Churchill-Chu(4)
Modified Churchill-Chu(4)
The next important process in developing the improved correlation involves comparing
the newly derived correlations altogether to attain the one with the best fit with the
experimental data as well as comparing the newly developed correlation with the
existing selected correlations to notice the extent of improvement. The error analysis
approach adopted for this work is the Root Mean Square Error (RMSE) Method which is
explained in detail in the next section.
University of Ghana http://ugspace.ug.edu.gh
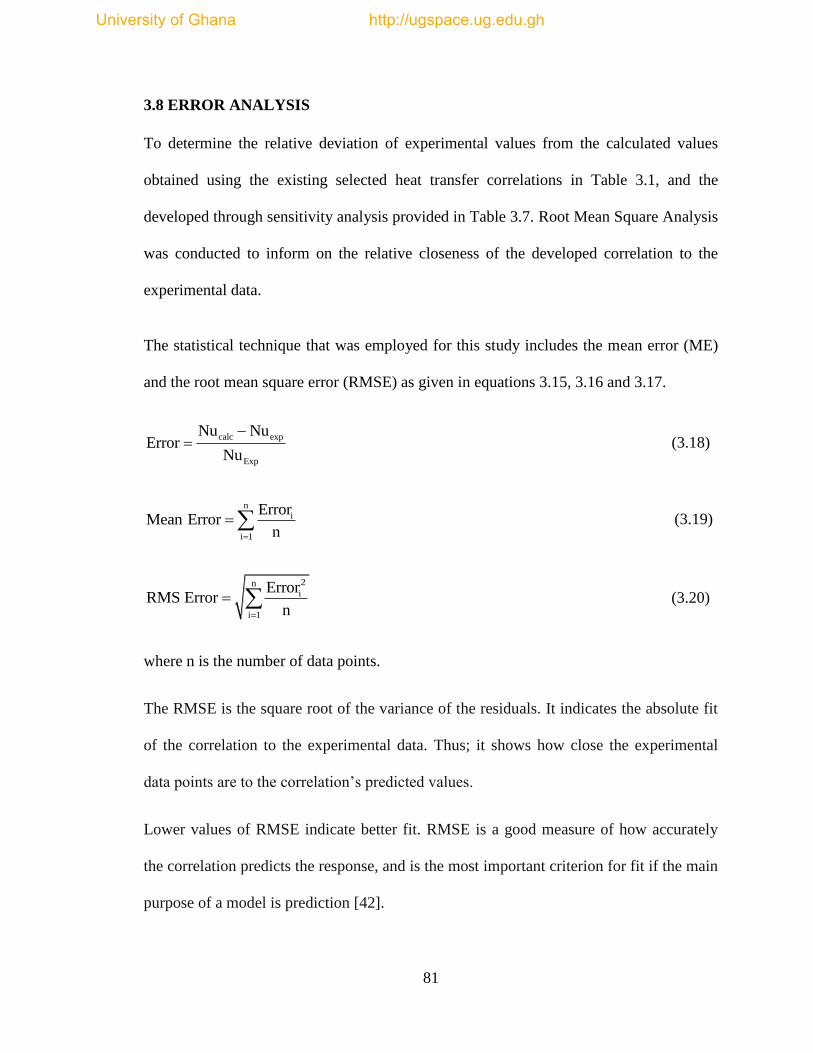
81
3.8 ERROR ANALYSIS
To determine the relative deviation of experimental values from the calculated values
obtained using the existing selected heat transfer correlations in Table 3.1, and the
developed through sensitivity analysis provided in Table 3.7. Root Mean Square Analysis
was conducted to inform on the relative closeness of the developed correlation to the
experimental data.
The statistical technique that was employed for this study includes the mean error (ME)
and the root mean square error (RMSE) as given in equations 3.15, 3.16 and 3.17.
calc exp
Exp
Nu NuError
Nu
(3.18)
ni
i 1
ErrorMean Error
n
(3.19)
2ni
i 1
ErrorRMS Error
n
(3.20)
where n is the number of data points.
The RMSE is the square root of the variance of the residuals. It indicates the absolute fit
of the correlation to the experimental data. Thus; it shows how close the experimental
data points are to the correlation’s predicted values.
Lower values of RMSE indicate better fit. RMSE is a good measure of how accurately
the correlation predicts the response, and is the most important criterion for fit if the main
purpose of a model is prediction [42].
University of Ghana http://ugspace.ug.edu.gh
82
The results of the error analysis are provided in Chapter four. This consequently led to
selection of the final proposed newly improved correlation for a circular vertical tube
with supercritical water flowing through it.
In this Chapter, the systematic approach developed and employed in developing an
improved heat transfer correlation useful in the accurate prediction of heat transfer in
vertical tubes in the SCWR under natural circulation was clearly described.
The next Chapter presents discussions and the results obtained in following through the
methodology outlined in this Chapter.
University of Ghana http://ugspace.ug.edu.gh
83
CHAPTERFOUR: RESULTS AND DISCUSSIONS
4.1 INTRODUCTION
The results of the heat transfer correlations calculated using the selected existing heat
transfer correlations provided in Table 3.1 of section 3.2 and the modified correlations
presented in Table 3.6 of sub-section 3.4.5 are plotted and discussed in this Chapter. The
computed results from correlations in Table 3.1 were compared with experimental data
and the outcome of the comparison became the basis for parametric sensitivity analysis
that was conducted using the Churchill-Chu correlation as a start-point for the developed
improved correlation in the present work. The results of the Nusselt numbers computed
from the successive modified Churchill-Chu correlations are also presented.
The error analysis results which were provided in various Tables in this chapter made it
possible to identify the correlation with the best fit, and hence selected as the proposed
modified correlation.
4.2 VALIDATION OF MASS FLOW RATE DATA
The mass flow rate of the supercritical pressure water that was calculated using the
Churchill-Chu correlation was compared with the mass flow rate obtained from the
experiment by Chen Yuzhou et al., 2012 [40]. After running the NCLoop FORTRAN
code [50] using the Churchill-Chu correlation, the results of the outlet mass flow rate was
validated with the experimental mass flow obtained from the CIAE dataset. The
comparison is provided in Figure 4.1.
University of Ghana http://ugspace.ug.edu.gh
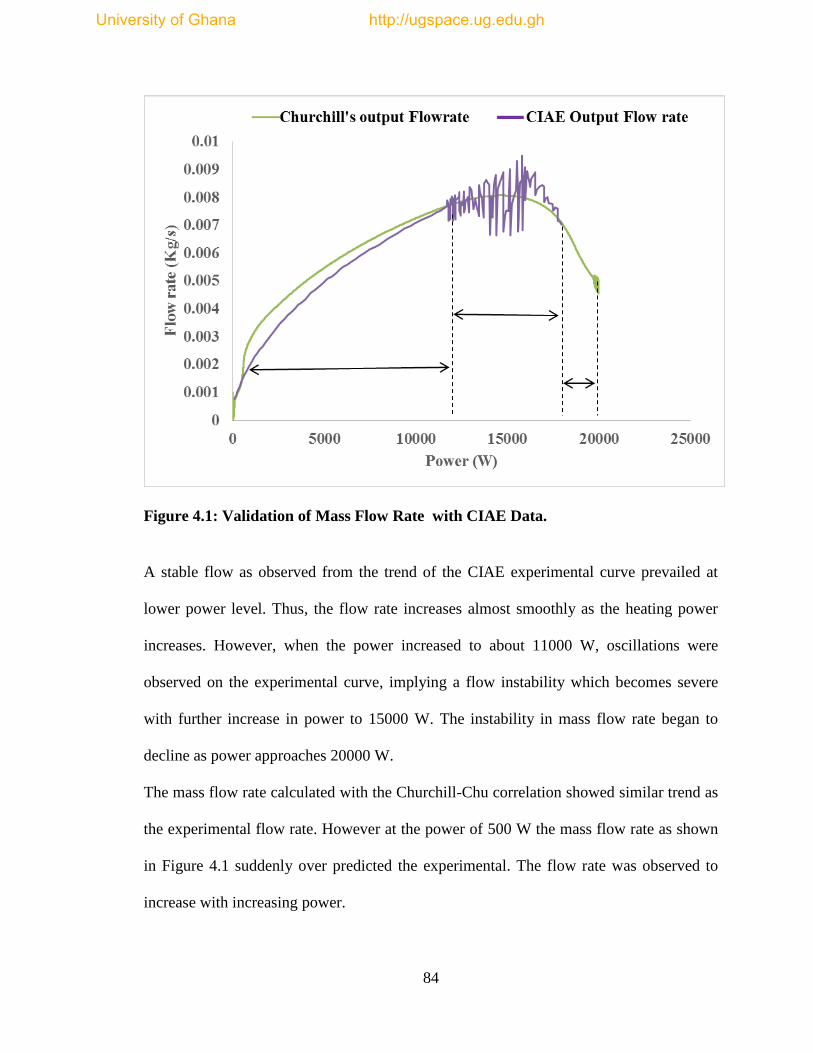
84
Figure 4.1: Validation of Mass Flow Rate with CIAE Data.
A stable flow as observed from the trend of the CIAE experimental curve prevailed at
lower power level. Thus, the flow rate increases almost smoothly as the heating power
increases. However, when the power increased to about 11000 W, oscillations were
observed on the experimental curve, implying a flow instability which becomes severe
with further increase in power to 15000 W. The instability in mass flow rate began to
decline as power approaches 20000 W.
The mass flow rate calculated with the Churchill-Chu correlation showed similar trend as
the experimental flow rate. However at the power of 500 W the mass flow rate as shown
in Figure 4.1 suddenly over predicted the experimental. The flow rate was observed to
increase with increasing power.
University of Ghana http://ugspace.ug.edu.gh
85
The range of oscillation observed in the experimental trend was absent in the Churchill-
Chu curve. A form of oscillation in mass flow rate around a power of 20000 W was
however noticed.
In general, a good agreement of the prediction of mass flow rate by Churchill-Chu
correlation with the experimental data was observed from the trend in Figure 4.1.
4.3 NUSSELT NUMBER COMPARISONS
The Nusselt number calculated using the correlations of Dittus-Boelter, Churchill-Chu
and Bishop for the case studied were compared and validated with the Nusselt number
obtained from the experiment by Chen Yuzhou et al., [40]. This is done to verify the
extent of prediction of the experimental data by the two correlations.
Figure 4.2 shows the trends of the Nusselt number curves obtained using Churchill-Chu
and Dittus-Boelter Correlations, together with the experimental Nusselt over a heating
power range.
University of Ghana http://ugspace.ug.edu.gh
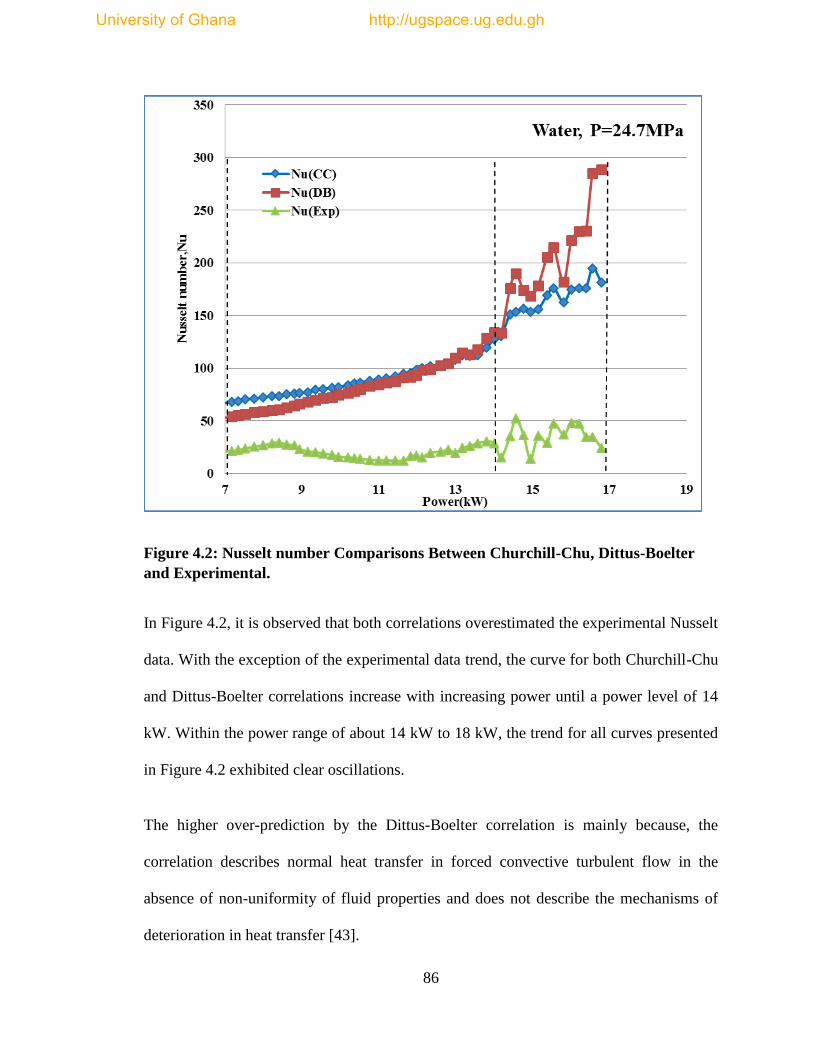
86
Figure 4.2: Nusselt number Comparisons Between Churchill-Chu, Dittus-Boelter
and Experimental.
In Figure 4.2, it is observed that both correlations overestimated the experimental Nusselt
data. With the exception of the experimental data trend, the curve for both Churchill-Chu
and Dittus-Boelter correlations increase with increasing power until a power level of 14
kW. Within the power range of about 14 kW to 18 kW, the trend for all curves presented
in Figure 4.2 exhibited clear oscillations.
The higher over-prediction by the Dittus-Boelter correlation is mainly because, the
correlation describes normal heat transfer in forced convective turbulent flow in the
absence of non-uniformity of fluid properties and does not describe the mechanisms of
deterioration in heat transfer [43].
University of Ghana http://ugspace.ug.edu.gh
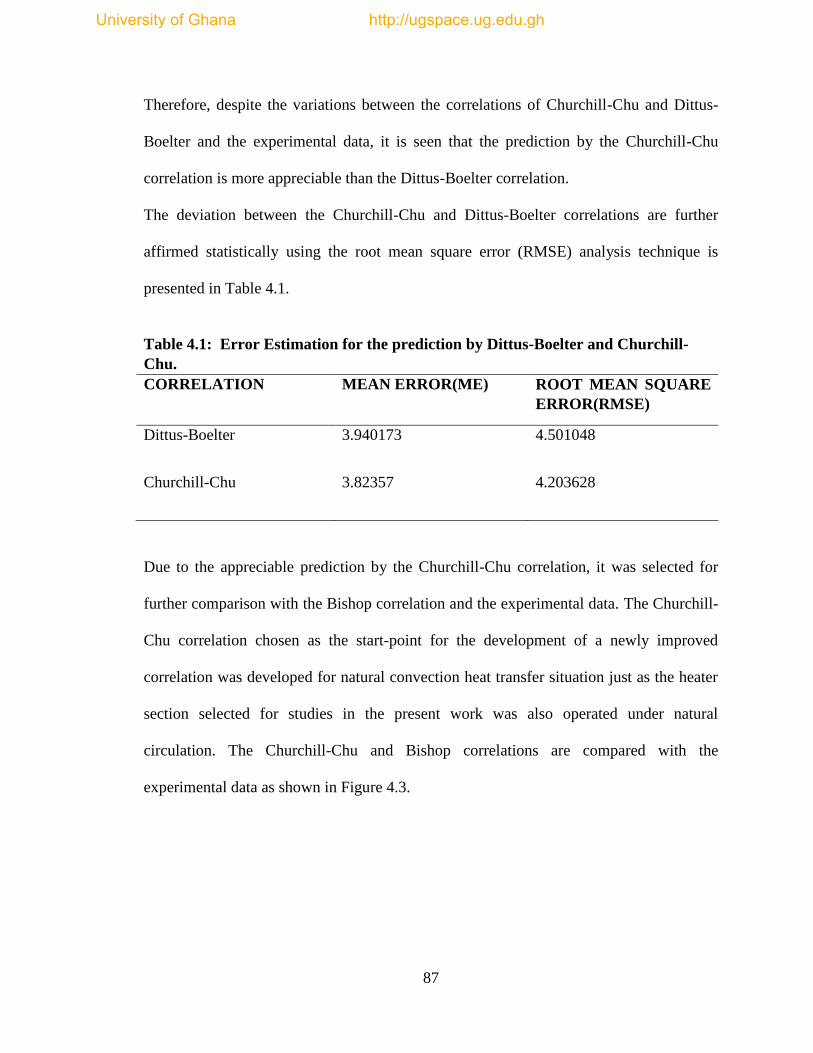
87
Therefore, despite the variations between the correlations of Churchill-Chu and Dittus-
Boelter and the experimental data, it is seen that the prediction by the Churchill-Chu
correlation is more appreciable than the Dittus-Boelter correlation.
The deviation between the Churchill-Chu and Dittus-Boelter correlations are further
affirmed statistically using the root mean square error (RMSE) analysis technique is
presented in Table 4.1.
Table 4.1: Error Estimation for the prediction by Dittus-Boelter and Churchill-
Chu.
CORRELATION MEAN ERROR(ME) ROOT MEAN SQUARE
ERROR(RMSE)
Dittus-Boelter 3.940173 4.501048
Churchill-Chu 3.82357 4.203628
Due to the appreciable prediction by the Churchill-Chu correlation, it was selected for
further comparison with the Bishop correlation and the experimental data. The Churchill-
Chu correlation chosen as the start-point for the development of a newly improved
correlation was developed for natural convection heat transfer situation just as the heater
section selected for studies in the present work was also operated under natural
circulation. The Churchill-Chu and Bishop correlations are compared with the
experimental data as shown in Figure 4.3.
University of Ghana http://ugspace.ug.edu.gh
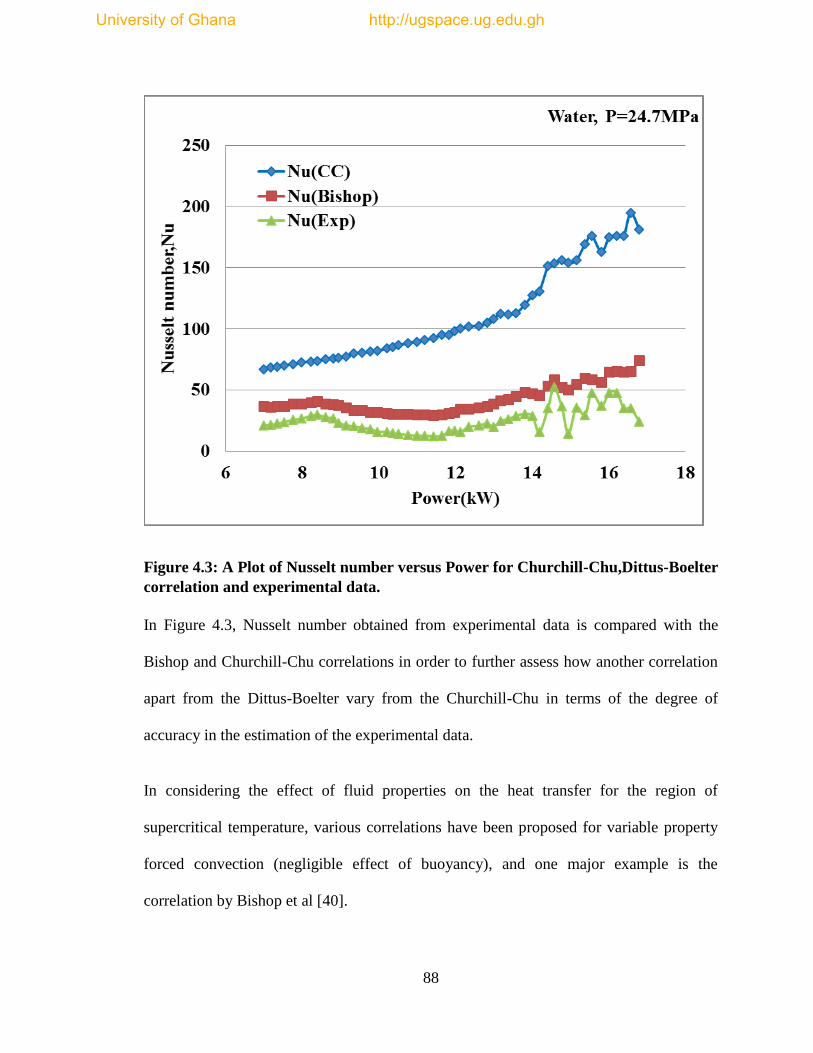
88
Figure 4.3: A Plot of Nusselt number versus Power for Churchill-Chu,Dittus-Boelter
correlation and experimental data.
In Figure 4.3, Nusselt number obtained from experimental data is compared with the
Bishop and Churchill-Chu correlations in order to further assess how another correlation
apart from the Dittus-Boelter vary from the Churchill-Chu in terms of the degree of
accuracy in the estimation of the experimental data.
In considering the effect of fluid properties on the heat transfer for the region of
supercritical temperature, various correlations have been proposed for variable property
forced convection (negligible effect of buoyancy), and one major example is the
correlation by Bishop et al [40].
University of Ghana http://ugspace.ug.edu.gh
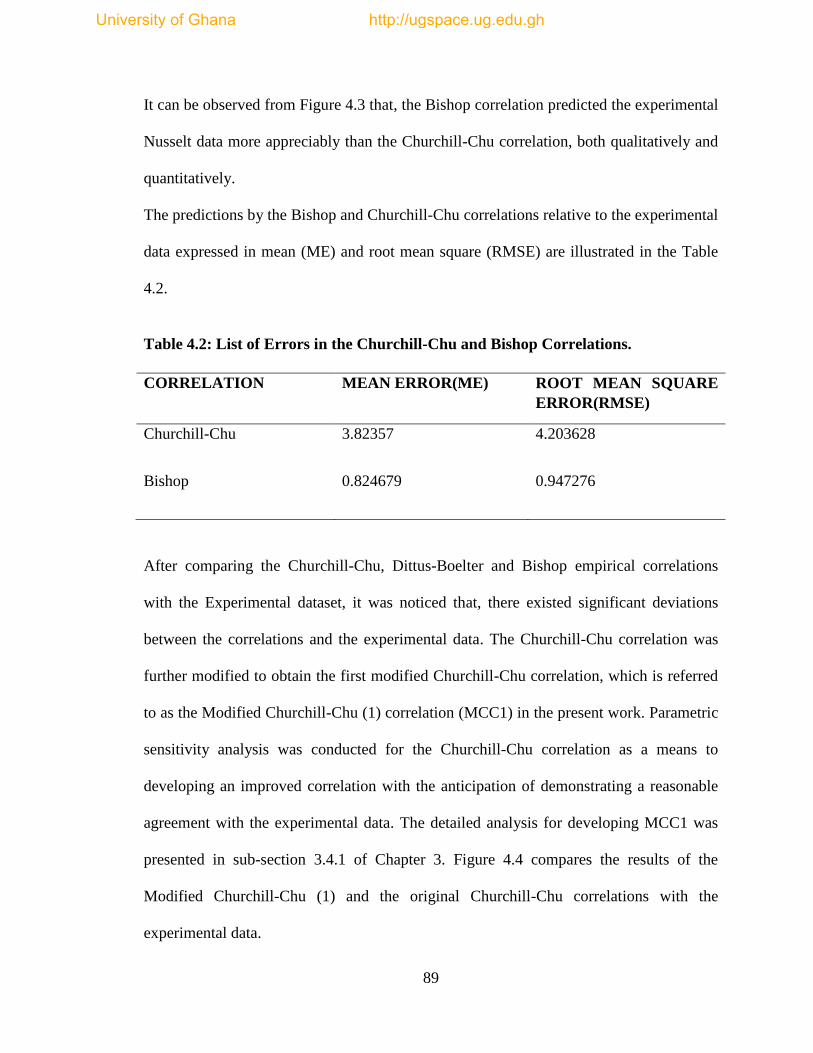
89
It can be observed from Figure 4.3 that, the Bishop correlation predicted the experimental
Nusselt data more appreciably than the Churchill-Chu correlation, both qualitatively and
quantitatively.
The predictions by the Bishop and Churchill-Chu correlations relative to the experimental
data expressed in mean (ME) and root mean square (RMSE) are illustrated in the Table
4.2.
Table 4.2: List of Errors in the Churchill-Chu and Bishop Correlations.
CORRELATION MEAN ERROR(ME) ROOT MEAN SQUARE
ERROR(RMSE)
Churchill-Chu 3.82357 4.203628
Bishop 0.824679 0.947276
After comparing the Churchill-Chu, Dittus-Boelter and Bishop empirical correlations
with the Experimental dataset, it was noticed that, there existed significant deviations
between the correlations and the experimental data. The Churchill-Chu correlation was
further modified to obtain the first modified Churchill-Chu correlation, which is referred
to as the Modified Churchill-Chu (1) correlation (MCC1) in the present work. Parametric
sensitivity analysis was conducted for the Churchill-Chu correlation as a means to
developing an improved correlation with the anticipation of demonstrating a reasonable
agreement with the experimental data. The detailed analysis for developing MCC1 was
presented in sub-section 3.4.1 of Chapter 3. Figure 4.4 compares the results of the
Modified Churchill-Chu (1) and the original Churchill-Chu correlations with the
experimental data.
University of Ghana http://ugspace.ug.edu.gh
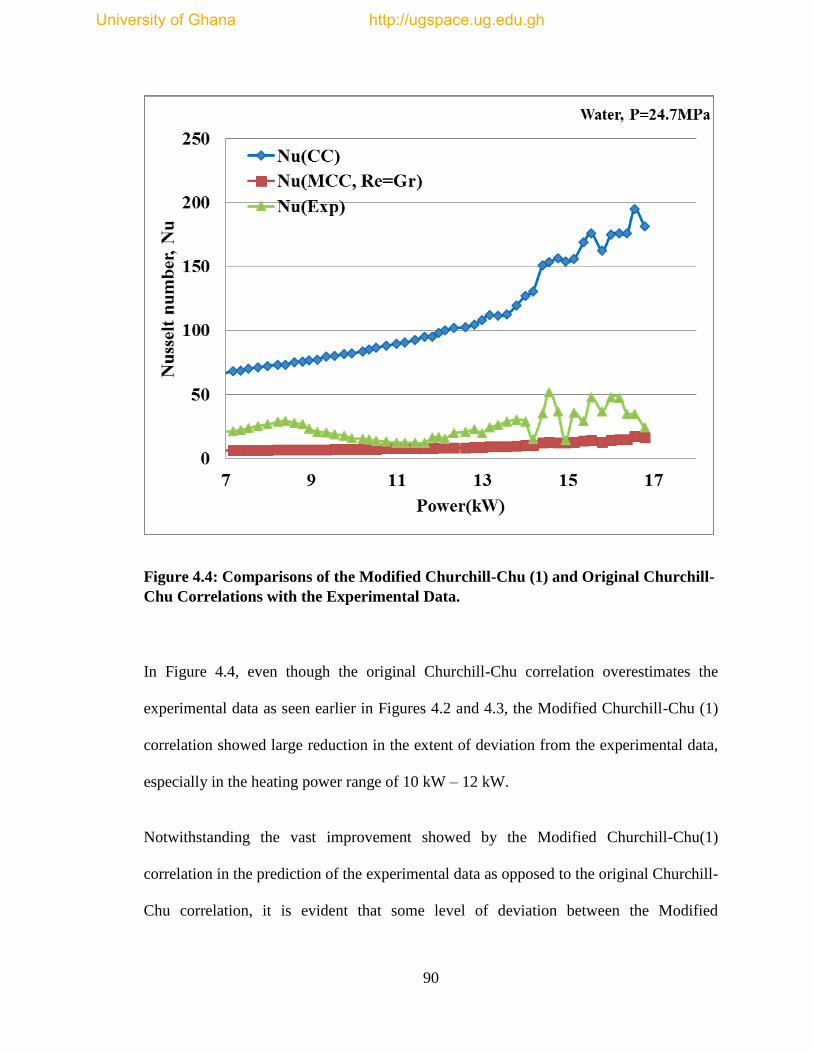
90
Figure 4.4: Comparisons of the Modified Churchill-Chu (1) and Original Churchill-
Chu Correlations with the Experimental Data.
In Figure 4.4, even though the original Churchill-Chu correlation overestimates the
experimental data as seen earlier in Figures 4.2 and 4.3, the Modified Churchill-Chu (1)
correlation showed large reduction in the extent of deviation from the experimental data,
especially in the heating power range of 10 kW – 12 kW.
Notwithstanding the vast improvement showed by the Modified Churchill-Chu(1)
correlation in the prediction of the experimental data as opposed to the original Churchill-
Chu correlation, it is evident that some level of deviation between the Modified
University of Ghana http://ugspace.ug.edu.gh
91
Churchill-Chu (1) correlation and the experimental data still exist and need to be
addressed.
The deviation exhibited by the MCC1 informed the next stage of modification that led to
the realization of the Modified Churchill-Chu (2) correlation or MCC2. The procedure
for the development of the MCC2 was provided in details in sub-section 3.4.2 of Chapter
3.
The comparison of the Nusselt Number computed with the Modified Churchill-Chu (2)
and the actual Churchill-Chu correlations with the experimental data are presented in
Figure 4.5.
Figure 4.5: Comparisons of the Modified Churchill-Chu (2) and Original Churchill-
Chu Correlations with the Experimental Data.
University of Ghana http://ugspace.ug.edu.gh
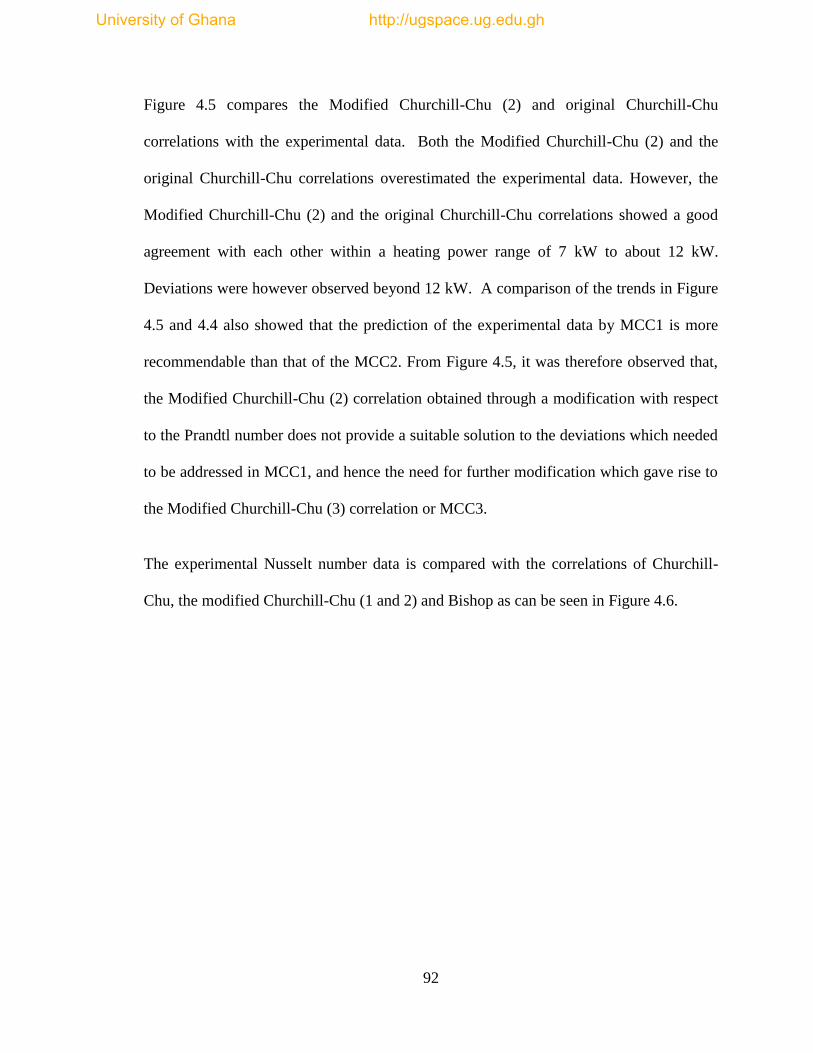
92
Figure 4.5 compares the Modified Churchill-Chu (2) and original Churchill-Chu
correlations with the experimental data. Both the Modified Churchill-Chu (2) and the
original Churchill-Chu correlations overestimated the experimental data. However, the
Modified Churchill-Chu (2) and the original Churchill-Chu correlations showed a good
agreement with each other within a heating power range of 7 kW to about 12 kW.
Deviations were however observed beyond 12 kW. A comparison of the trends in Figure
4.5 and 4.4 also showed that the prediction of the experimental data by MCC1 is more
recommendable than that of the MCC2. From Figure 4.5, it was therefore observed that,
the Modified Churchill-Chu (2) correlation obtained through a modification with respect
to the Prandtl number does not provide a suitable solution to the deviations which needed
to be addressed in MCC1, and hence the need for further modification which gave rise to
the Modified Churchill-Chu (3) correlation or MCC3.
The experimental Nusselt number data is compared with the correlations of Churchill-
Chu, the modified Churchill-Chu (1 and 2) and Bishop as can be seen in Figure 4.6.
University of Ghana http://ugspace.ug.edu.gh
93
Figure 4.6: Comparisons of the Modified Churchill-Chu (1&2), Bishop and Original
Churchill-Chu Correlations with the Experimental Data.
As observed in Figure 4.5, the Bishop Correlation best predicts the behavior pattern of
the experimental curve and in terms of agreement with the experimental Nusselt curve,
the Modified-Churchill-Chu (1) correlation is the closest.
Therefore the Modified-Churchill-Chu (1) correlation is further considered for correction
to better predict the experimental data. In this step, some parameters of the Bishop
correlation were also considered since the Bishop correlation also exhibited some level of
agreement with the experimental data, despite the deviation it showed from the
experimental data. The new correlation obtained as a result of sensitivity analysis in the
University of Ghana http://ugspace.ug.edu.gh
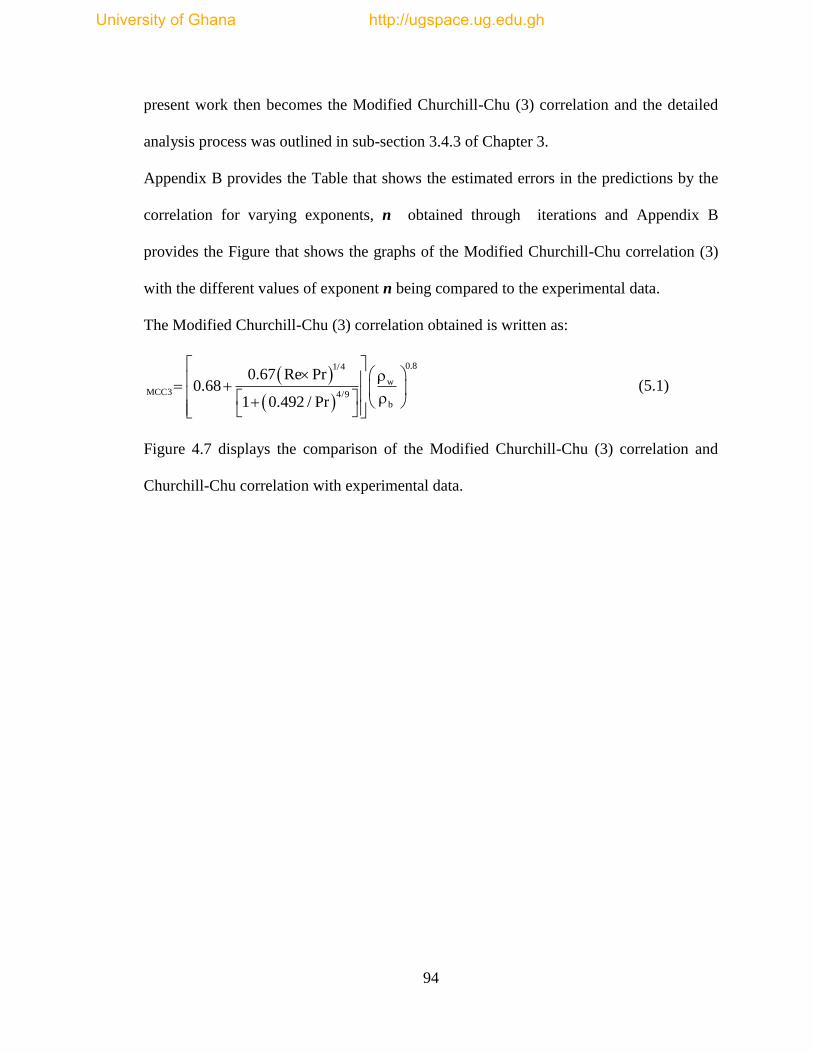
94
present work then becomes the Modified Churchill-Chu (3) correlation and the detailed
analysis process was outlined in sub-section 3.4.3 of Chapter 3.
Appendix B provides the Table that shows the estimated errors in the predictions by the
correlation for varying exponents, n obtained through iterations and Appendix B
provides the Figure that shows the graphs of the Modified Churchill-Chu correlation (3)
with the different values of exponent n being compared to the experimental data.
The Modified Churchill-Chu (3) correlation obtained is written as:
0.81/4
wMCC3 4/9
b
0.67 Re Pr0.68
1 0.492 / Pr
(5.1)
Figure 4.7 displays the comparison of the Modified Churchill-Chu (3) correlation and
Churchill-Chu correlation with experimental data.
University of Ghana http://ugspace.ug.edu.gh
95
Figure 4.7: Comparisons of the Modified Churchill-Chu (3) and Original Churchill-
Chu Correlations with the Experimental Data.
From Figure 4.6, it can be seen that the Modified Churchill-Chu (3) correlation shows a
very good agreement with the experimental data better than the Modified correlations
(1&2), as well as the existing correlations of Churchill-Chu, Bishop and Dittus-Boelter in
the present work. It is however noteworthy that, the oscillatory portion of the
experimental trend still remains unaccounted for in the MCC3.
In the next step of modification, the Prandtl number in the actual Churchill-Chu
correlation is replaced with the averaged Prandtl number as was explained in details in
University of Ghana http://ugspace.ug.edu.gh
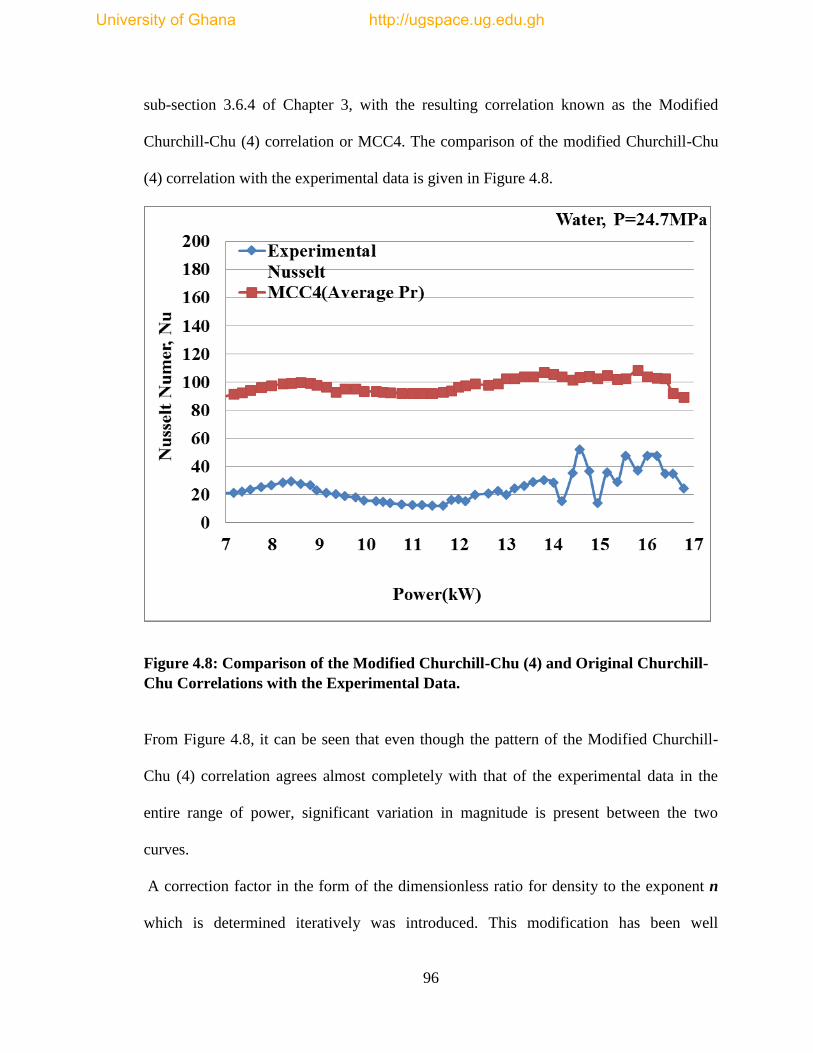
96
sub-section 3.6.4 of Chapter 3, with the resulting correlation known as the Modified
Churchill-Chu (4) correlation or MCC4. The comparison of the modified Churchill-Chu
(4) correlation with the experimental data is given in Figure 4.8.
Figure 4.8: Comparison of the Modified Churchill-Chu (4) and Original Churchill-
Chu Correlations with the Experimental Data.
From Figure 4.8, it can be seen that even though the pattern of the Modified Churchill-
Chu (4) correlation agrees almost completely with that of the experimental data in the
entire range of power, significant variation in magnitude is present between the two
curves.
A correction factor in the form of the dimensionless ratio for density to the exponent n
which is determined iteratively was introduced. This modification has been well
University of Ghana http://ugspace.ug.edu.gh
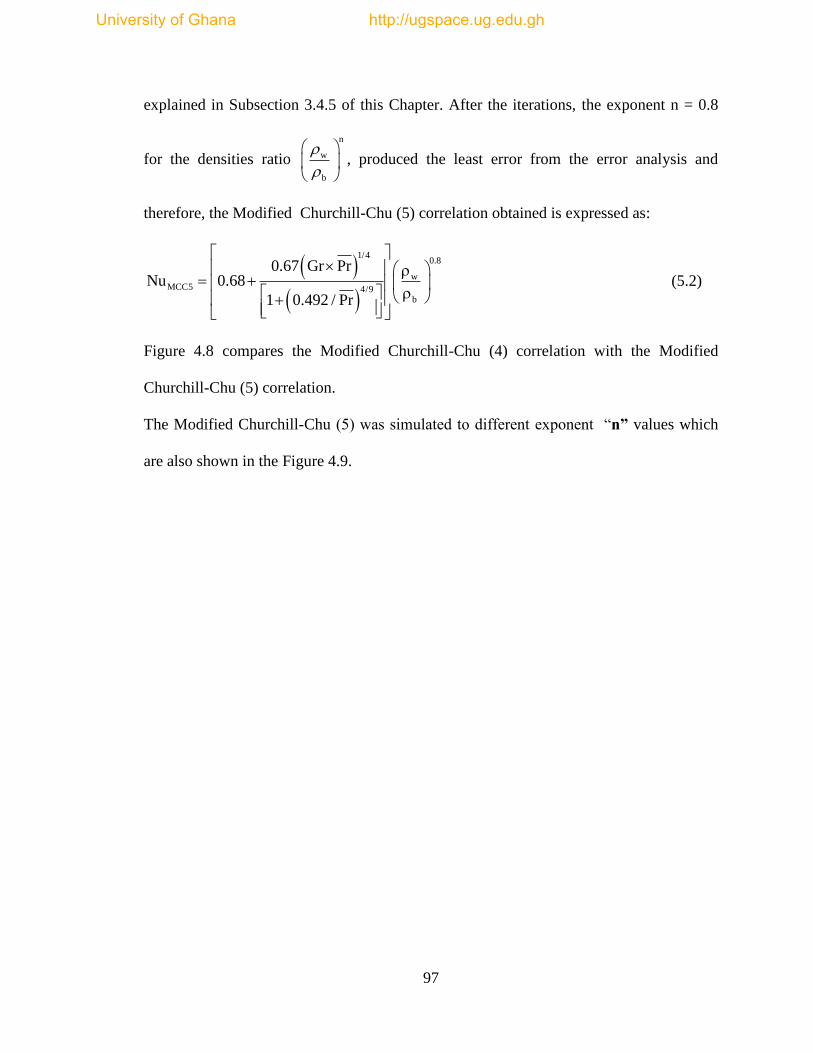
97
explained in Subsection 3.4.5 of this Chapter. After the iterations, the exponent n = 0.8
for the densities ratio
n
w
b
, produced the least error from the error analysis and
therefore, the Modified Churchill-Chu (5) correlation obtained is expressed as:
1/40.8
wMCC5 4/9
b
0.67 Gr PrNu 0.68
1 0.492 / Pr
(5.2)
Figure 4.8 compares the Modified Churchill-Chu (4) correlation with the Modified
Churchill-Chu (5) correlation.
The Modified Churchill-Chu (5) was simulated to different exponent “n” values which
are also shown in the Figure 4.9.
University of Ghana http://ugspace.ug.edu.gh
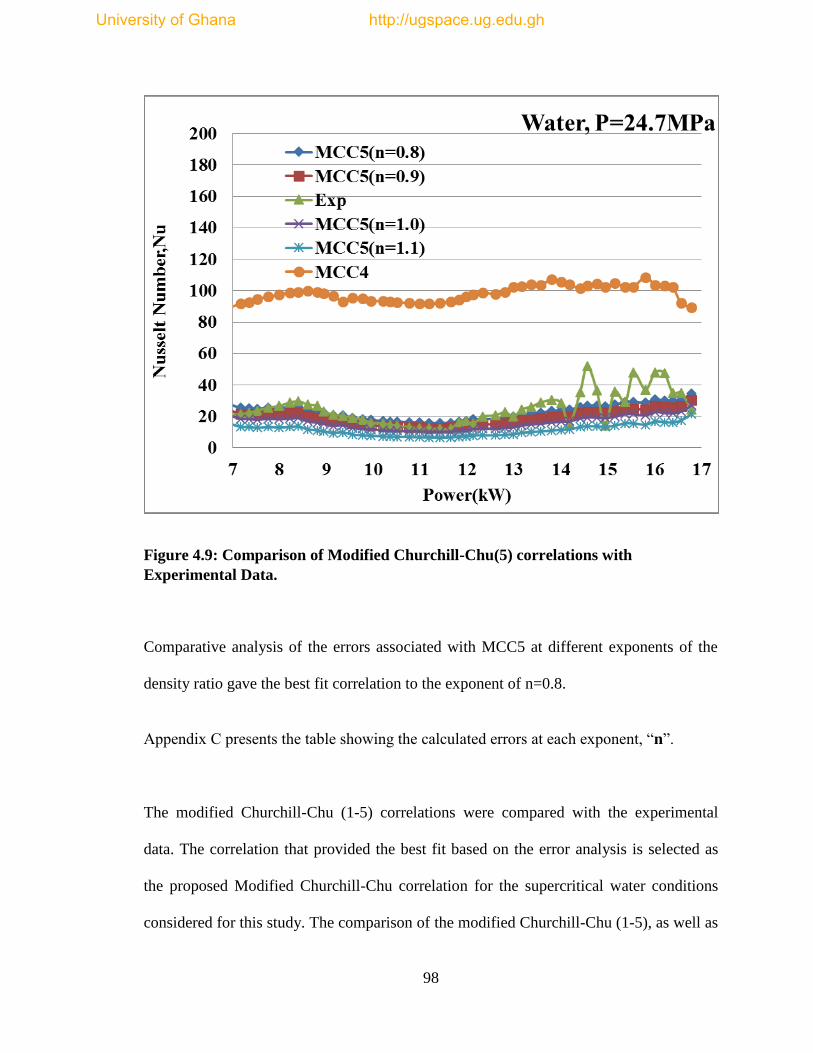
98
Figure 4.9: Comparison of Modified Churchill-Chu(5) correlations with
Experimental Data.
Comparative analysis of the errors associated with MCC5 at different exponents of the
density ratio gave the best fit correlation to the exponent of n=0.8.
Appendix C presents the table showing the calculated errors at each exponent, “n”.
The modified Churchill-Chu (1-5) correlations were compared with the experimental
data. The correlation that provided the best fit based on the error analysis is selected as
the proposed Modified Churchill-Chu correlation for the supercritical water conditions
considered for this study. The comparison of the modified Churchill-Chu (1-5), as well as
University of Ghana http://ugspace.ug.edu.gh
99
the original Churchill-Chu correlation ith the Experimental data is provided in the Figure
4.10.
Figure 4.10:Comparison of Original and Modified Churchill-Chu Correlations with
Experimental.
From Figure 4.11, the proposed Correlation based on best fit of the experimental data is
expressed as:
1/40.8
wMCC5 4/9
b
0.67 Gr PrNu 0.68
1 0.492 / Pr
University of Ghana http://ugspace.ug.edu.gh
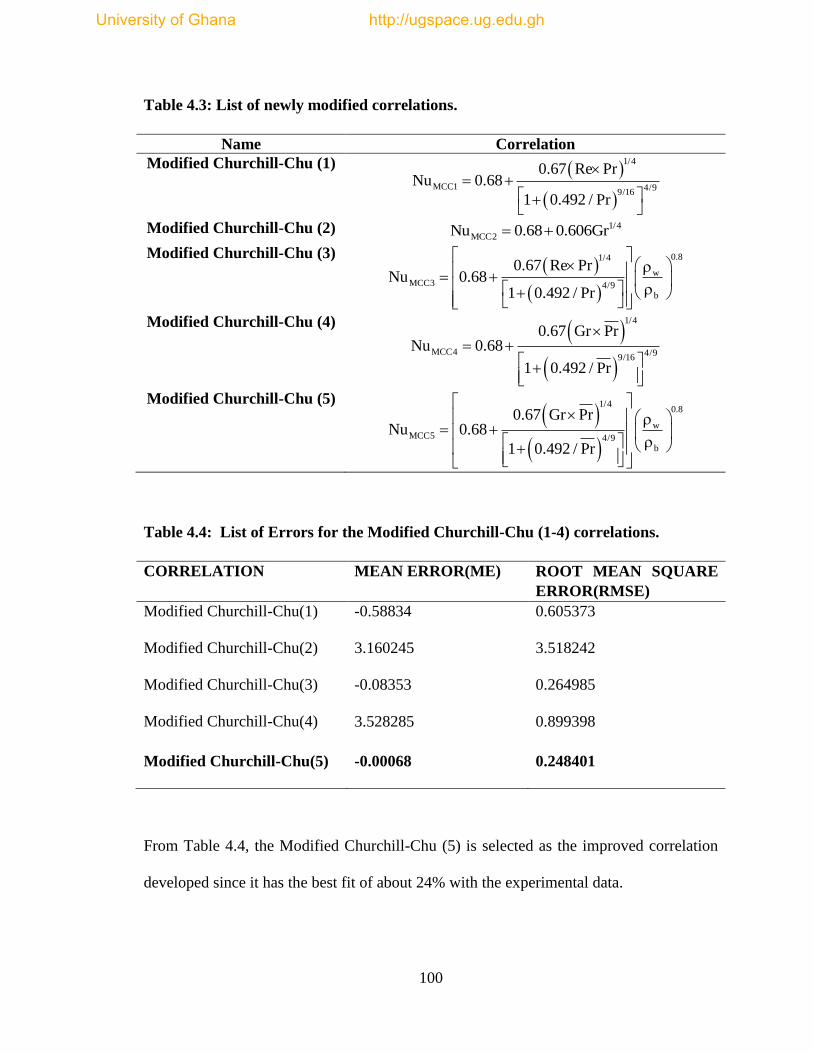
100
Table 4.3: List of newly modified correlations.
Name Correlation
Modified Churchill-Chu (1)
1/4
MCC1 4/99/16
0.67 Re PrNu 0.68
1 0.492 / Pr
Modified Churchill-Chu (2) 1/4
MCC2Nu 0.68 0.606Gr
Modified Churchill-Chu (3)
0.81/4
wMCC3 4/9
b
0.67 Re PrNu 0.68
1 0.492 / Pr
Modified Churchill-Chu (4)
1/4
MCC4 4/99/16
0.67 Gr PrNu 0.68
1 0.492 / Pr
Modified Churchill-Chu (5)
1/40.8
wMCC5 4/9
b
0.67 Gr PrNu 0.68
1 0.492 / Pr
Table 4.4: List of Errors for the Modified Churchill-Chu (1-4) correlations.
CORRELATION MEAN ERROR(ME) ROOT MEAN SQUARE
ERROR(RMSE)
Modified Churchill-Chu(1) -0.58834 0.605373
Modified Churchill-Chu(2) 3.160245 3.518242
Modified Churchill-Chu(3)
Modified Churchill-Chu(4)
-0.08353
3.528285
0.264985
0.899398
Modified Churchill-Chu(5) -0.00068 0.248401
From Table 4.4, the Modified Churchill-Chu (5) is selected as the improved correlation
developed since it has the best fit of about 24% with the experimental data.
University of Ghana http://ugspace.ug.edu.gh
101
In this Chapter, the results obtained in the form of plots and tables were thoroughly
discussed. The modified correlations obtained as a result of parametric analysis discussed
in details in Chapter three, were plotted and compared with the correlations of Churchill-
Chu, Dittus-Boelter and Bishop to assess their extent of improvement from these selected
existing correlations. The results obtained also included the validation of the modified
correlations obtained with the experimental data and having the best modified correlation
selected as a result of the error results provided in Table 4.4.
University of Ghana http://ugspace.ug.edu.gh
102
CHAPTER FIVE: CONCLUSIONS AND RECOMMENDATIONS
5.1 CONCLUSION
The supercritical-water heat-transfer dataset obtained from an experiment performed in a
natural circulation loop at the China Institute of Atomic Energy, China [40] was used for
the improvement of heat-transfer correlation for applications in SCWR.
In the experiment, the pressure was kept within the range of pressure 24.2-25.2 MPa and
the heating power ranged from 0 to 18 kW or heat flux from 0 to 0.91 MW/ , and
maximum water temperature was 402 oC.
The data selection for the improvement of the correlation was based on the heat transfer
to supercritical water in a bare vertical heater section of the natural circulation loop at
isobaric pressure of, P = 24.7 MPa and heat flux of up to 0.9 MW/ .
Results of Nusselt numbers calculated using some existing supercritical forced
convection heat transfer correlations such as Dittus-Boelter (1930) and Bishop et al
(1965) correlations deviated significantly from the experimental data.
Similar deviation was observed when the Nusselt number calculated with the original
Churchill-Chu correlation was compared with the experimental data.
To reduce the extent of these deviations, the Churchill-Chu correlation was selected as a
start-point for successive improvement through parametric sensitivity analysis which
involved the analytical variations of dimensionless parameters, coefficients and
exponents, as well as the introduction of correction factors in the form of dimensionless
ratios.
Five modified Churchill-Chu correlations were obtained from successive improvement of
the original Churchill-Chu correlation. The best fit correlation chosen as the proposed
University of Ghana http://ugspace.ug.edu.gh
103
improved heat transfer correlation among the Modified Churchill-Chu correlations
produced the least root mean square error of about 24 % and better predicts the
experimental data than the original Churchill-Chu correlation and the Bishop correlation.
Therefore, the proposed improved correlation can be used for the Nusselt number or heat
transfer coefficient calculations in SCWR where the heat transfer characteristics is with
respect to the normal natural convection which therefore exhibit double the effects of
buoyancy force and variation of fluid properties within the pseudocritical region.
It has been discovered from this studies that, it is important to distinguish between
natural-convection cases without significant buoyancy effects and natural-convection
cases with buoyancy effect. The proposed correlation suggests the convection process in
test tube section considered within the natural circulation loop is a forced convection with
buoyancy effect.
The set forth objectives for this studies have therefore been met successfully.
5.2 RECOMMENDATIONS
The aim of the proposed improved correlation is to closely agree and represent the
experimental data especially for a vertical circular tube with supercritical water flowing
through it.
Even though, the improved correlation demonstrated the best prediction of the data for
the test section studied, some challenges as regards to the sufficiency of the experimental
data available were encountered.
University of Ghana http://ugspace.ug.edu.gh

104
It is therefore recommended that, further verification, of the improved correlation be
conducted with much larger independent experimental datasets.
Moreover, to test the applicability of the proposed correlation, its suitability should be
tested with the experimental data of varying flow conditions within the SCWR operating
conditions. The newly improved correlation can further be refined for accuracy based on
the outcome of comparison with larger dataset for further accuracy.
University of Ghana http://ugspace.ug.edu.gh

105
REFERENCES
[1] Trevor Findlay (2010). In: Book title: (The Future of Nuclear Energy to 2030 and its
implications for Safety, Security and Non-proliferation: The Future of Nuclear Energy to
2030). Part 1, pp10. The Center for International Governance Innovation (CIGI),
Waterloo, Ontario, Canada.
[2] U.S. DOE, Nuclear Energy Research Advisory Committee and Generation IV
International Forum (2002).A Technology Roadmap for Generation IV Nuclear Energy
System (GIF-002- 00).91 pages.
[3] Victor Hugo Sanchez-Espinoza, Wolfgang Hering (2003).Investigations of the
Appropriateness of RELAP5/MOD3 for the Safety Evaluation of an Innovative Reactor
Operating at Thermodynamically supercritical Conditions. Forschungszentrum Karsruhe
FZKA 6749
[4] T. Schulenberg, J. Starflinger, N. Aksan, D. Bittermann, L.Heikinheimo (2006).
Supercritical water reactor research in the GIF context: Current status and future
prospects with emphasis on European activities.
[5] Rohit Maitri (2014). A CFD Control System Design for Supercritical Water Cooled
Reactor,Masters Dissertation, University of Western Ontario, London, Ontario, Canada.
University of Ghana http://ugspace.ug.edu.gh

106
[6] Pioro, I.L. and Duffey, R.B. (2007). In: Book title: (Heat Transfer and Hydraulic
Resistance at Supercritical Pressures in Power Engineering Applications). Publisher:
ASME Press, New York, NY, USA. DOI:10.1115/1.802523.
[7] European Commission (Energy Research).Retrieved on 4th November, 2014 from
Research and Innovation Portal on the World Wide Web:
http:/www/europa.eu.com/research/energy.
[8] Toshiba (2011).Status report 71 - Japanese Supercritical Water-Cooled Reactor
(JSCWR), last updated 01-04-2011.
[9] Attila Vertes, Sandor Nagy, Zoltan Klencsar, Rezso G. Lovas, Frank Rosch (2011).
Handbook of Nuclear Chemistry: Vol.1: Basics of Nuclear Science,p2727.Second
Edition, Springer.
[10] Majid Bazargan, Daniel Frazer and Vijay Chatoorgan (2005). Effect of Buoyancy on
Heat Transfer in Supercritical Water Flow in a Horizontal Round Tube. Journal of Heat
Transfer, Volume 127, Issue 8 , Research Paper-897-902.
[11] Romney B. Duffey and Laurence Leung. Advanced Cycle Efficiency: generating
40% more power from the nuclear fuel. Paper presented at World Energy Congress
(WEC), 12-16 September 2010, Montreal, Canada.
University of Ghana http://ugspace.ug.edu.gh
107
[12] Department of Energy, DOE (2009). Materials for Ultra-Supercritical Steam
Turbines, ORNL and NETL. Retrieved on 4th November, 2014 from the World Wide
Web : www.ms.ornl.gov.
[13] David Mogk (2012), Montana State University. Retrieved on 5th November, 2014
from the World Wide Web: http://serc.carleton.edu
[14] Cuicui Wang & Huixiong Li (2014). Evaluation of the Heat Transfer Correlations for
Supercritical Pressure Water in Vertical Tubes. Heat Transfer Engineering, Volume 35,
Issue 6-8.
[15] Sarah Mokry, Igor Pioro.(2013) Investigation of Characteristic-Temperature
Approaches for Heat-Transfer Correlations at Supercritical Conditions. Paper presented
at the 21st International Conference on Nuclear Engineering, 2013.
[16] Pioro, I.L. and Duffey, R.B. (2007).In book Title (Heat Transfer and Hydraulic
Resistance at Supercritical Pressures in Power Engineering Applications). Publisher:
ASME Press, New York, NY, USA. DOI:10.1115/1.802523.
[17] Chen Yuzhou, Zhao Minfu, Yang Chunsheng, Bi Keming, Du Kaiwen (2012). An
Experiment on Flow and Heat Transfer Characteristics in Natural Circulation of
Supercritical Water. Paper presented at the 3rd China-Canada Joint Workshop on
supercritical-Water-Cooled Reactors, CCSC-2012, April 18-20, 2012, Xi’an, China.
University of Ghana http://ugspace.ug.edu.gh
108
[18] Wikibooks (2014).Dimensionless numbers. Retrieved on 5th December, 2015 from
the World Wide Web:https://en.wikibooks.org
[19] Frank P. Incropera and David P. Dewit (2007). Physical Interpretation of the
Dimensionless Parameters. In: Book title: Introduction to Heat Transfer (Sixth Edition).
pp400-410. Wiley and Sons Publishers, United States of America.
[20] Zenit, Augustus Alejandro Miranda, John Rick Marfil, Justine Jay Nerbes, Arjan
Mandapat, Marc Kevin. Fluid Convection Experiment. Submitted to the College of
Science , Bicol University.
[21] M. Bahrami (2014). Forced Convection Heat Transfer- Flow across Cylinders and
Spheres, Simon Fraser University, British Columbia, Canada. Retrieved on20th
December, 2015from the World Wide Web:http://www.sfu.ca/
[22] Majid Bazargan, Daniel Frazer and Vijay Chatoorgn (2005. Effect of Buoyancy on
Heat Transfer in Supercritical Water Flow in a Horizontal Round Tube. Journal of Heat
Transfer-127(8),897-902, Volume 127,Issue 8 , Research Paper.
[23] Bo Zhang, Jianqiang Shan and Jing Jiang (2009). Numerical Analysis of
Supercritical Water Heat Transfer in Horizontal Circular Tube. ASME, ICONE 17-7541.
University of Ghana http://ugspace.ug.edu.gh
109
[24] T. S. Chen and F. A. Strobel (2007). Buoyancy Effects on Heat and Mass Transfer in
Boundary Layer on a Continuous, Moving Horizontal plate. Numerical Heat Transfer, 21
may 2007, doi:10.1080/01495728008961750.
[25] M. Bahrami (2014). Forced Convection Heat Transfer, Simon Fraser University,
British Columbia, Canada. Retrieved on20th December, 2015from the World Wide
Web:http://www.sfu.ca/
[26] L. F. Crabtree, R. L. Dommett and J. G. Woodley R.A.E. Farnborough (1965).
Estimation of Heat Transfer to Flat Plates,Cones and Blunt Bodies. Reports and
Memoranda No. 3637" July, 1965.
[27] X. Cheng and T. Schulenberg (2001). Heat Transfer at Supercritical Pressures-
Literature Review and Application to an HPLWR. Forschungstzentrum Karlstruhe
GombH, Karlstruhe,2001.
[28] Harlan H. Bengston (2015).Convection Heat Transfer Coefficient Estimation.
Retrieved on20th January, 2015from the World Wide Web: http://s3.amazonaws.com
[29] Walter Frost. Heat Transfer in Free and Natural Convection Systems. In: Book title:
Heat Transfer at Low Temperature.pp63-66 .Springer Science & Business Media.
University of Ghana http://ugspace.ug.edu.gh
110
[30] Majid Bazargan (2001). Forced Convection Heat Transfer to Turbulent Flow of
Supercritical Water in a Round Horizontal Tube. PhD Dissertation, The University of
British Columbia, Canada.
[31] Goldstein, Richard J. (Thermopedia). Retrieved on7th December, 2015from the
World Wide Web:http://www.thermopedia.com/
[32] Igor Pioro and Sarah Mokry (2011). Heat Transfer to fluids at Supercritical
Pressures. InTech Europe University Campus, STeP Ri Slavka Krautzeka 83/A 51000
Rijeka, Croatia.
[33] Qaiser Abbas, M. Mahabat Khan, Rizwan Sabir, Yasir Mehmood Khan, Zafar Ullah
Koreshi(2010). Numerical Simulation and Experimental Verification of Air Flow through
a Heated Pipe. International Journal of Mechanical & Mechatronics Engineering IJMME-
IJENS Vol: 10 No: 02, April, 2010.
[34] Diane L. Linne and Michael L. Meyer (1997). Evaluation of Heat Transfer and
Thermal Stability of Supercritical JP-7 Fuel. Prepared for the 33rd Joint Propulsion
Conference and Exhibit cosponsored by AIAA, ASME, SAE, and ASEE Seattle,
Washington, July 6-9, 1997, United States of America.
[35] Petukhov, B. J. ,Kirillov, V. V. , and Maidenik, V. N. (1966) Heat Transfer
Experimental Research for Turbulent Gas Flow in Pipes at High Temperature Difference
University of Ghana http://ugspace.ug.edu.gh
111
Between Wall and Bulk Fluid Temperature. Proceedings of the Third International Heat
Transfer Conference, Chicago, Aug. 7-12, 1966.
[36] Bishop A, Sandberg R, Tong L(1964). Forced Convection heat Transfer to Water at
Near-critical Temperaturea and Supercritical Pressures.WCAP-2056, 1964.
[37] Swenson H S, Carver J H, Karkarala C R. Heat Transfer to Supercritical Water in
Smooth Bore Tubes. Journal of Heat Transfer, 87(4): 477-484, 1965.
[38] Yamagata K, Nishigawa K, Hasegawa S, Fuju T, Yoshida S.(1972). Forced
Convective Heat Transfer to Supercritical Water flowing in tubes. Internation Journal of
Heat and Mass Transfer, 15(12):2575-2593, 1972.
[39] Sarah Mokry, Igor Pioro, Amjad Farah, Krysten King, Sahil Gupta, Wargha Peiman,
Pavel Kirillov (2011). Development of supercritical water heat-transfer correlation for
vertical bare tubes. Elsevier- Nuclear Engineering and Design 241 (2011) 1126–1136
[40] Chen Yuzhou, Zhao Minfu, Yang Chunsheng, Bi Keming, Du Kaiwen. An
experiment on flow and heat transfer characteristics in natural circulation of Supercritical
Water. Paper presented at the 3rd China-Canada Joint Workshop on supercritical-Water-
Cooled Reactors,CCSC-2012, April 18-20, 2012, Xi’an, China.
University of Ghana http://ugspace.ug.edu.gh

112
[41] Clifford K. Ho., Stephen W. Webb (2006) Theory and Applications of Transport in
Porous Media. In: Book title (Gas Transport in Porous Media), Volume 20.Springer,
Netherlands.
[42] Karen (2008-2015), Assessing the Fit of Regression Models-The Analysis Factor
877-272-8096. Retrived July 15,2015 from the World Wide
Web:http://www.theanalysisfactor.com
[43] Andrew D. Chiasson (2007). Simulation and Design of Hybrid Geothermal Heat
Pump Systems. In a book title:(Simulation and Design of Hybrid Geothermal Heat Pump
Systems). UMI , Ann Abor, Michigan, US.
[44] National Institute of Standards and Technology (2015).Standard Reference Data.
Retrieved on 7Th March, 2015 from the World Wide Web: http://webbook.nist.gov/
[45] V. Eswaran(2002).Introduction to turbulence: Rayleigh-Bernard Convection. In:
Booktitle: Turbulent Flows: Fundamentals, Experiments and Modeling. CRC Press, 2002.
[46] K D Timmerhaus(2013).Survey of Heat Transfer to Near-Critical Fluids. In: Book title:
Advances in Cryogenic Engineering: Procedings of the 1969 Cryogenic Engineering Conference,
University of California at Los Angeles, June 16-18,1969.pp209-214.Springer Science and
Business Media.
University of Ghana http://ugspace.ug.edu.gh
113
[47] J.D. Jackson, M.A. Cotton and B.P. Axcell, (1989). ‘Studies of mixed convection in
vertical tubes - A review’. International Journal of Heat and Fluid Flow, Vol. 10, No. 1,
pp 2-15.
[48] X. Cheng, B. Kuang and Y. H. Yang(2006).Numerical analysis of heat transfer in
supercritical water cooled flow channels. Elsevier, Nuclear Engineering and Design
237(2007) 240-252.
[49]CoolingZone(2015). Dimnsionless numbers n heat transfer. Data. Retrieved on 5Th
July, 2015 from the World Wide Web: http://www.coolingzone.com
[50] Walter Ambrosini(2012). Linear and Non-linear Stability Analysis of Natural
Circulation with Supercritical fluids. Department of Civil and Industrial Engineering.
University of Pisa (Unpublished).
University of Ghana http://ugspace.ug.edu.gh
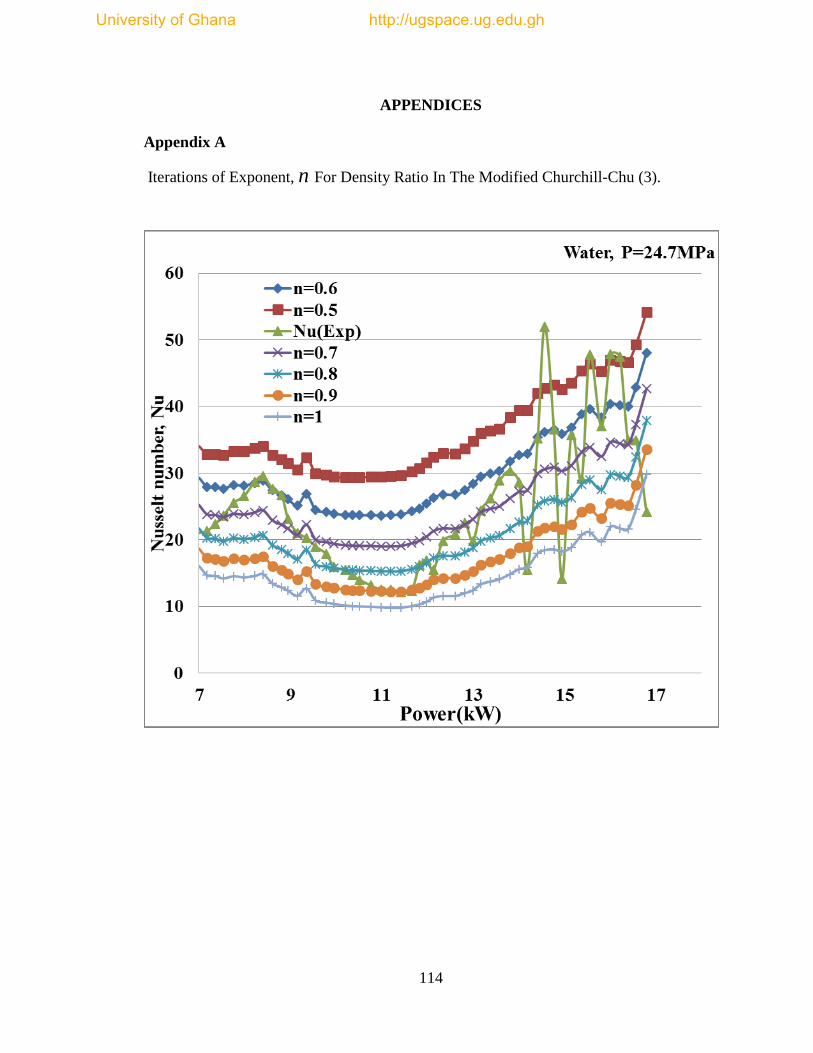
114
APPENDICES
Appendix A
Iterations of Exponent, n For Density Ratio In The Modified Churchill-Chu (3).
University of Ghana http://ugspace.ug.edu.gh
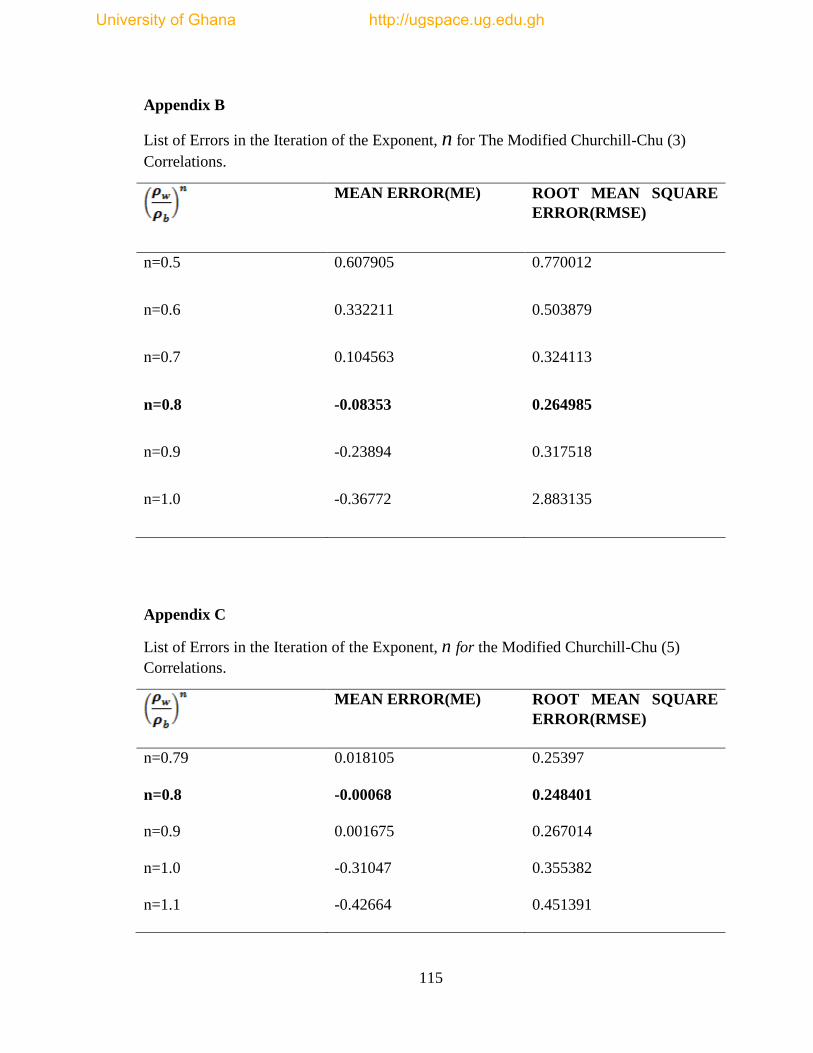
115
Appendix B
List of Errors in the Iteration of the Exponent, n for The Modified Churchill-Chu (3)
Correlations.
MEAN ERROR(ME) ROOT MEAN SQUARE
ERROR(RMSE)
n=0.5 0.607905 0.770012
n=0.6 0.332211 0.503879
n=0.7 0.104563 0.324113
n=0.8 -0.08353 0.264985
n=0.9 -0.23894 0.317518
n=1.0 -0.36772 2.883135
Appendix C
List of Errors in the Iteration of the Exponent, n for the Modified Churchill-Chu (5)
Correlations.
MEAN ERROR(ME) ROOT MEAN SQUARE
ERROR(RMSE)
n=0.79 0.018105 0.25397
n=0.8 -0.00068 0.248401
n=0.9 0.001675 0.267014
n=1.0 -0.31047 0.355382
n=1.1 -0.42664 0.451391
University of Ghana http://ugspace.ug.edu.gh
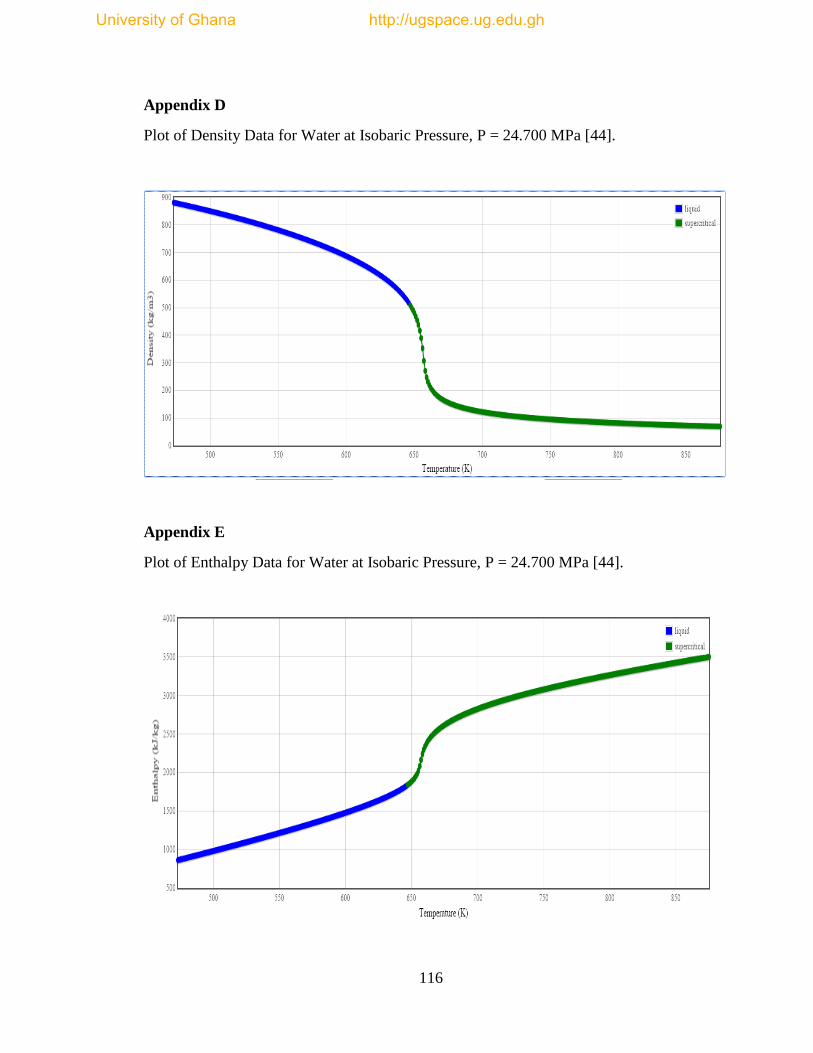
116
Appendix D
Plot of Density Data for Water at Isobaric Pressure, P = 24.700 MPa [44].
Appendix E
Plot of Enthalpy Data for Water at Isobaric Pressure, P = 24.700 MPa [44].
University of Ghana http://ugspace.ug.edu.gh
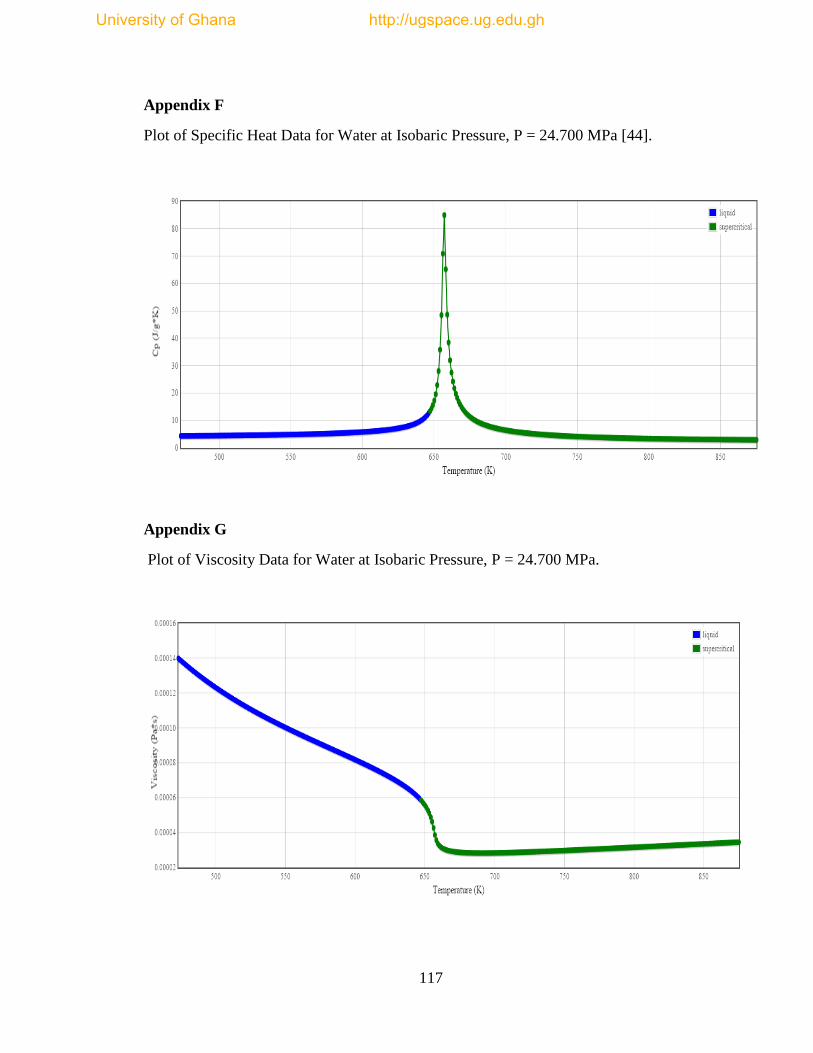
117
Appendix F
Plot of Specific Heat Data for Water at Isobaric Pressure, P = 24.700 MPa [44].
Appendix G
Plot of Viscosity Data for Water at Isobaric Pressure, P = 24.700 MPa.
University of Ghana http://ugspace.ug.edu.gh
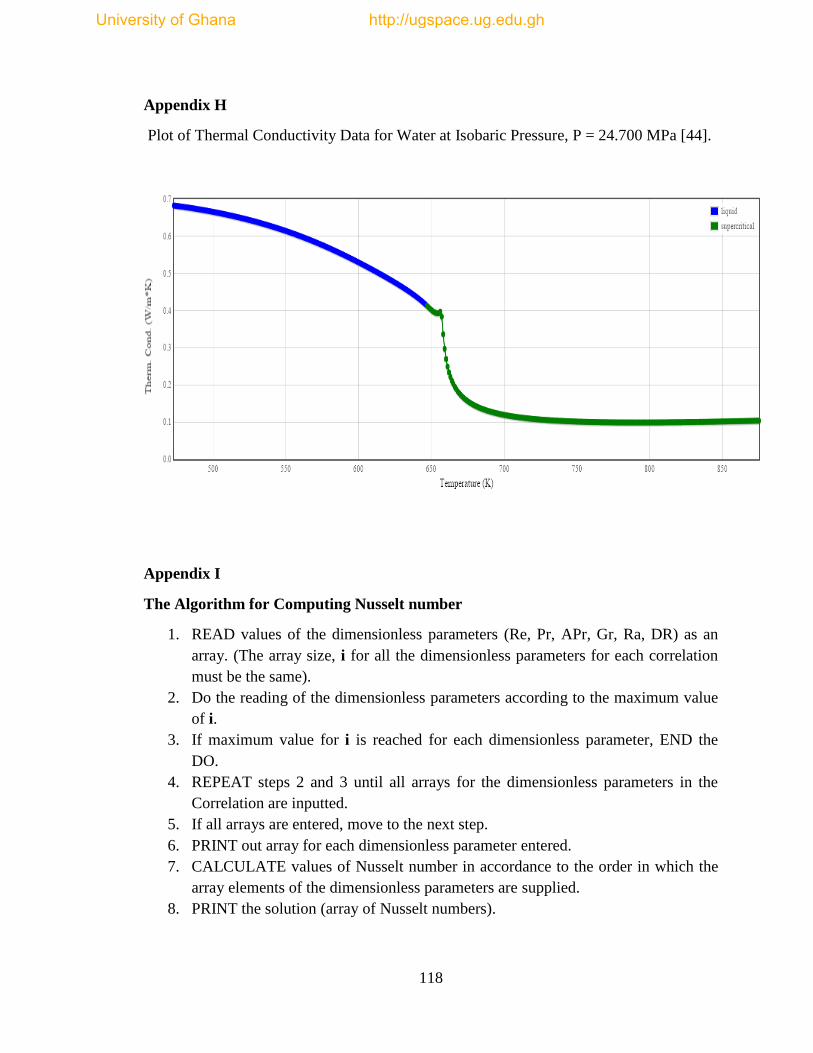
118
Appendix H
Plot of Thermal Conductivity Data for Water at Isobaric Pressure, P = 24.700 MPa [44].
Appendix I
The Algorithm for Computing Nusselt number
1. READ values of the dimensionless parameters (Re, Pr, APr, Gr, Ra, DR) as an
array. (The array size, i for all the dimensionless parameters for each correlation
must be the same).
2. Do the reading of the dimensionless parameters according to the maximum value
of i.
3. If maximum value for i is reached for each dimensionless parameter, END the
DO.
4. REPEAT steps 2 and 3 until all arrays for the dimensionless parameters in the
Correlation are inputted.
5. If all arrays are entered, move to the next step.
6. PRINT out array for each dimensionless parameter entered.
7. CALCULATE values of Nusselt number in accordance to the order in which the
array elements of the dimensionless parameters are supplied.
8. PRINT the solution (array of Nusselt numbers).
University of Ghana http://ugspace.ug.edu.gh
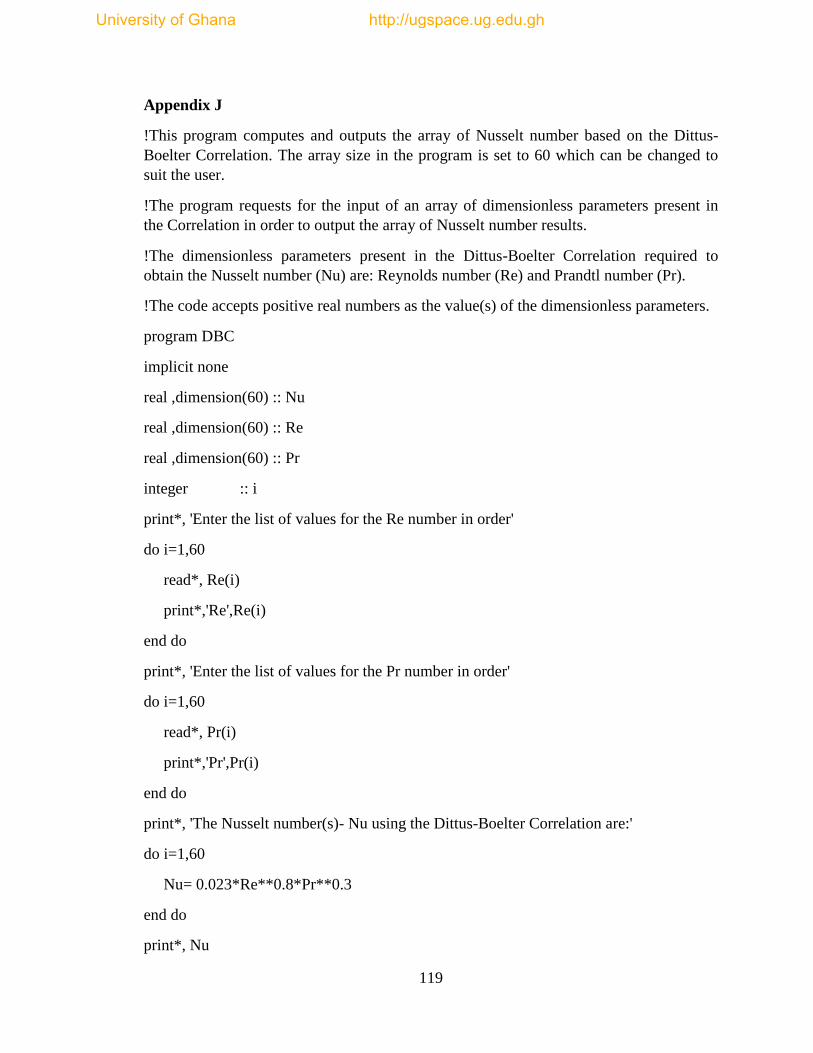
119
Appendix J
!This program computes and outputs the array of Nusselt number based on the Dittus-
Boelter Correlation. The array size in the program is set to 60 which can be changed to
suit the user.
!The program requests for the input of an array of dimensionless parameters present in
the Correlation in order to output the array of Nusselt number results.
!The dimensionless parameters present in the Dittus-Boelter Correlation required to
obtain the Nusselt number (Nu) are: Reynolds number (Re) and Prandtl number (Pr).
!The code accepts positive real numbers as the value(s) of the dimensionless parameters.
program DBC
implicit none
real ,dimension(60) :: Nu
real ,dimension(60) :: Re
real ,dimension(60) :: Pr
integer :: i
print*, 'Enter the list of values for the Re number in order'
do i=1,60
read*, Re(i)
print*,'Re',Re(i)
end do
print*, 'Enter the list of values for the Pr number in order'
do i=1,60
read*, Pr(i)
print*,'Pr',Pr(i)
end do
print*, 'The Nusselt number(s)- Nu using the Dittus-Boelter Correlation are:'
do i=1,60
Nu= 0.023*Re**0.8*Pr**0.3
end do
print*, Nu
University of Ghana http://ugspace.ug.edu.gh
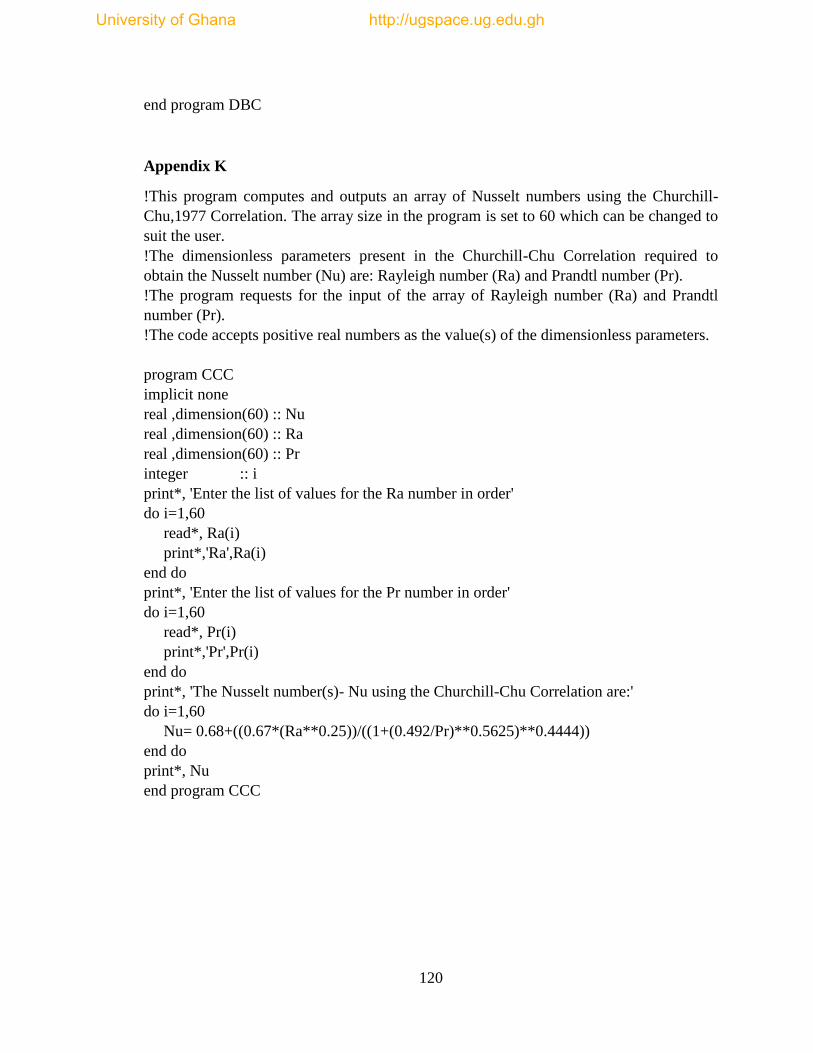
120
end program DBC
Appendix K
!This program computes and outputs an array of Nusselt numbers using the Churchill-
Chu,1977 Correlation. The array size in the program is set to 60 which can be changed to
suit the user.
!The dimensionless parameters present in the Churchill-Chu Correlation required to
obtain the Nusselt number (Nu) are: Rayleigh number (Ra) and Prandtl number (Pr).
!The program requests for the input of the array of Rayleigh number (Ra) and Prandtl
number (Pr).
!The code accepts positive real numbers as the value(s) of the dimensionless parameters.
program CCC
implicit none
real ,dimension(60) :: Nu
real ,dimension(60) :: Ra
real ,dimension(60) :: Pr
integer :: i
print*, 'Enter the list of values for the Ra number in order'
do i=1,60
read*, Ra(i)
print*,'Ra',Ra(i)
end do
print*, 'Enter the list of values for the Pr number in order'
do i=1,60
read*, Pr(i)
print*,'Pr',Pr(i)
end do
print*, 'The Nusselt number(s)- Nu using the Churchill-Chu Correlation are:'
do i=1,60
Nu= 0.68+((0.67*(Ra**0.25))/((1+(0.492/Pr)**0.5625)**0.4444))
end do
print*, Nu
end program CCC
University of Ghana http://ugspace.ug.edu.gh
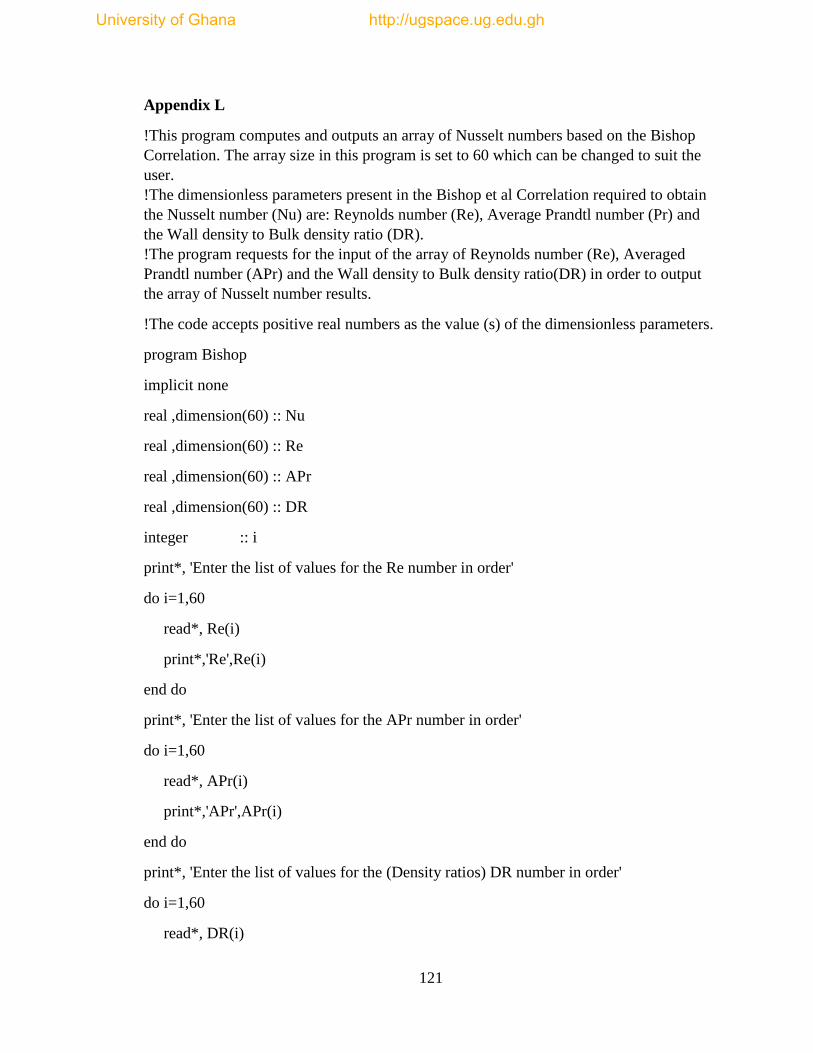
121
Appendix L
!This program computes and outputs an array of Nusselt numbers based on the Bishop
Correlation. The array size in this program is set to 60 which can be changed to suit the
user.
!The dimensionless parameters present in the Bishop et al Correlation required to obtain
the Nusselt number (Nu) are: Reynolds number (Re), Average Prandtl number (Pr) and
the Wall density to Bulk density ratio (DR).
!The program requests for the input of the array of Reynolds number (Re), Averaged
Prandtl number (APr) and the Wall density to Bulk density ratio(DR) in order to output
the array of Nusselt number results.
!The code accepts positive real numbers as the value (s) of the dimensionless parameters.
program Bishop
implicit none
real ,dimension(60) :: Nu
real ,dimension(60) :: Re
real ,dimension(60) :: APr
real ,dimension(60) :: DR
integer :: i
print*, 'Enter the list of values for the Re number in order'
do i=1,60
read*, Re(i)
print*,'Re',Re(i)
end do
print*, 'Enter the list of values for the APr number in order'
do i=1,60
read*, APr(i)
print*,'APr',APr(i)
end do
print*, 'Enter the list of values for the (Density ratios) DR number in order'
do i=1,60
read*, DR(i)
University of Ghana http://ugspace.ug.edu.gh
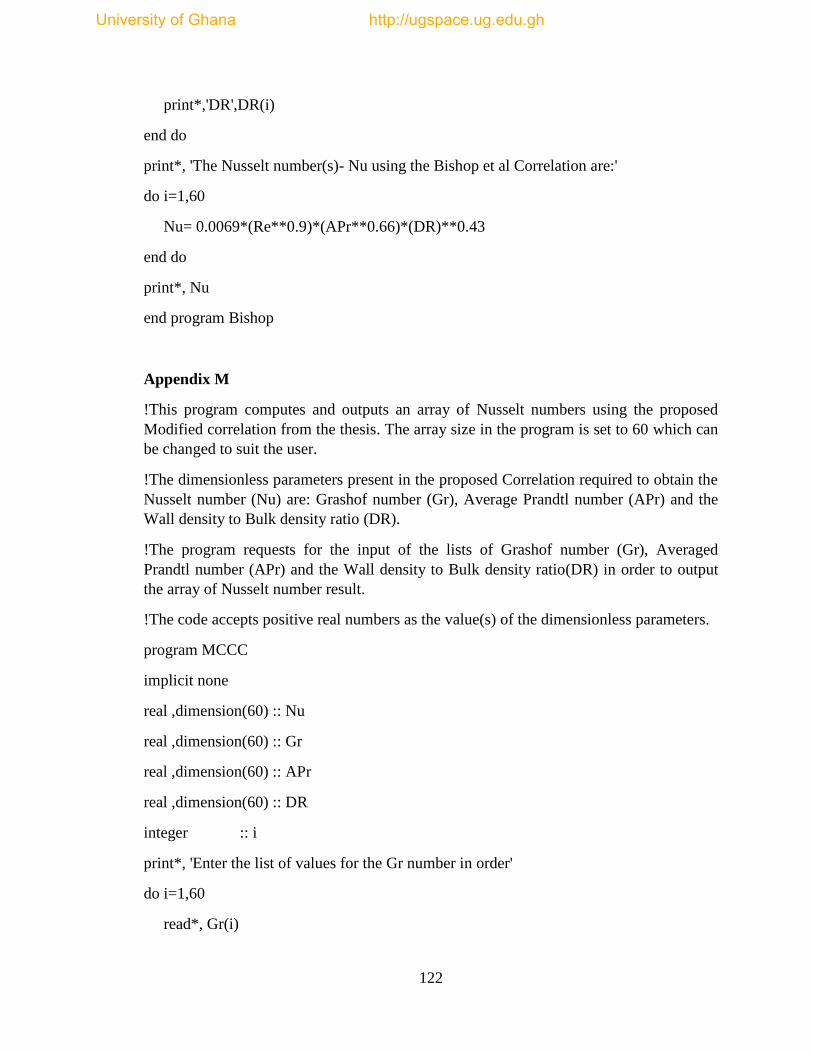
122
print*,'DR',DR(i)
end do
print*, 'The Nusselt number(s)- Nu using the Bishop et al Correlation are:'
do i=1,60
Nu= 0.0069*(Re**0.9)*(APr**0.66)*(DR)**0.43
end do
print*, Nu
end program Bishop
Appendix M
!This program computes and outputs an array of Nusselt numbers using the proposed
Modified correlation from the thesis. The array size in the program is set to 60 which can
be changed to suit the user.
!The dimensionless parameters present in the proposed Correlation required to obtain the
Nusselt number (Nu) are: Grashof number (Gr), Average Prandtl number (APr) and the
Wall density to Bulk density ratio (DR).
!The program requests for the input of the lists of Grashof number (Gr), Averaged
Prandtl number (APr) and the Wall density to Bulk density ratio(DR) in order to output
the array of Nusselt number result.
!The code accepts positive real numbers as the value(s) of the dimensionless parameters.
program MCCC
implicit none
real ,dimension(60) :: Nu
real ,dimension(60) :: Gr
real ,dimension(60) :: APr
real ,dimension(60) :: DR
integer :: i
print*, 'Enter the list of values for the Gr number in order'
do i=1,60
read*, Gr(i)
University of Ghana http://ugspace.ug.edu.gh

123
print*,'Gr',Gr(i)
end do
print*, 'Enter the list of values for the APr number in order'
do i=1,60
read*, APr(i)
print*,'APr',APr(i)
end do
print*, 'Enter the list of values for the (Density ratios) DR number in order'
do i=1,60
read*, DR(i)
print*,'DR',DR(i)
end do
print*, 'The Nusselt number(s)- Nu using the proposed Correlation are:'
do i=1,60
Nu=
(0.68+((0.67*((Gr*APr)**0.25))/((1+(0.492/APr)**0.5625)**0.4444)))*(DR)**0.8
end do
print*, Nu
end program MCCC
University of Ghana http://ugspace.ug.edu.gh
Related Documents