Developing a Sustainable Foods Business Cluster Roadmap for Cuyahoga County FINAL REPORT May 2014 Completed on behalf of The City of Cleveland Mayor’s Office of Sustainability, Ohio State University Extension, Cuyahoga County, and the Cleveland-Cuyahoga County Food Policy Coalition Funding for this roadmap was provided by The Cleveland Foundation, The George Gund Foundation, and Saint Luke’s Foundation

Welcome message from author
This document is posted to help you gain knowledge. Please leave a comment to let me know what you think about it! Share it to your friends and learn new things together.
Transcript
Developing a Sustainable Foods Business Cluster
Roadmap for Cuyahoga County
FINAL REPORT
May 2014
Completed on behalf of The City of Cleveland Mayor’s Office of Sustainability, Ohio State University Extension,
Cuyahoga County, and the Cleveland-Cuyahoga County Food Policy Coalition
Funding for this roadmap was provided by The Cleveland Foundation, The George Gund Foundation, and Saint Luke’s
Foundation
1
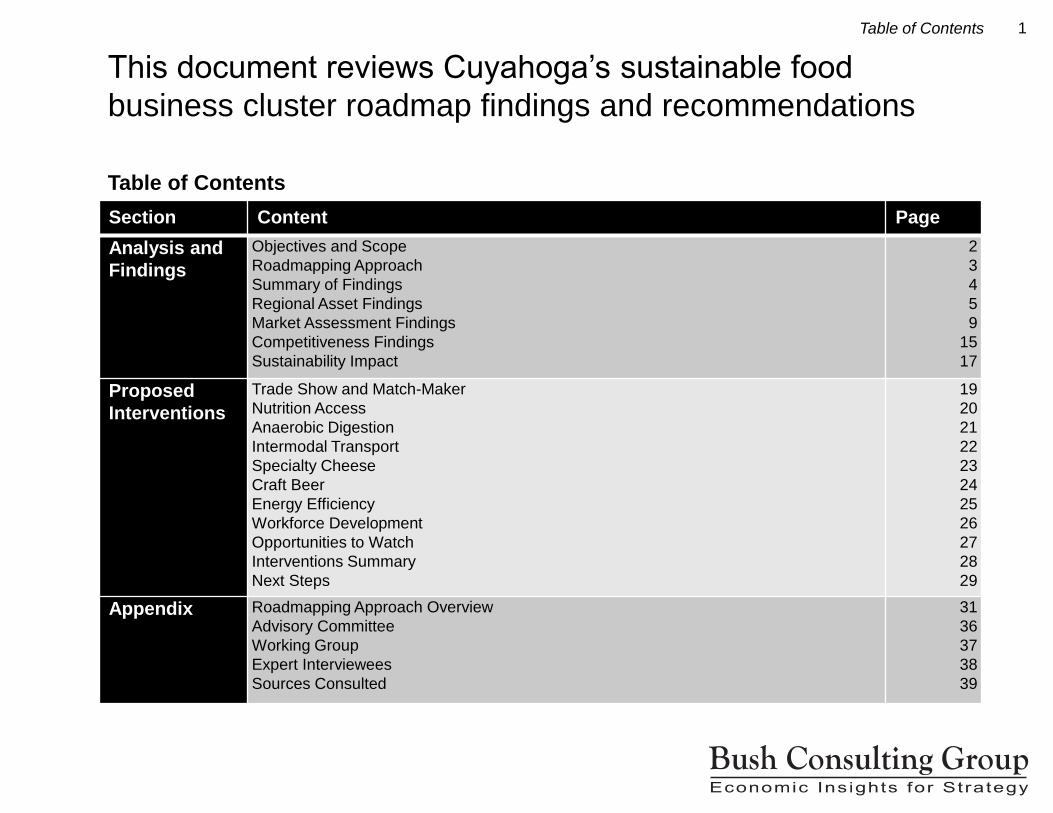
This document reviews Cuyahoga’s sustainable food
business cluster roadmap findings and recommendations
Table of Contents
Table of Contents
Section Content Page
Analysis and
Findings
Objectives and Scope
Roadmapping Approach
Summary of Findings
Regional Asset Findings
Market Assessment Findings
Competitiveness Findings
Sustainability Impact
2
3
4
5
9
15
17
Proposed
Interventions
Trade Show and Match-Maker
Nutrition Access
Anaerobic Digestion
Intermodal Transport
Specialty Cheese
Craft Beer
Energy Efficiency
Workforce Development
Opportunities to Watch
Interventions Summary
Next Steps
19
20
21
22
23
24
25
26
27
28
29
Appendix Roadmapping Approach Overview
Advisory Committee
Working Group
Expert Interviewees
Sources Consulted
31
36
37
38
39

2
Objective
The City of Cleveland Mayor’s Office of Sustainability,
Ohio State University Extension, Cuyahoga County,
and the Cleveland-Cuyahoga County Food Policy
Coalition have developed a sustainable food cluster
roadmap in Cuyahoga county, with a core objective to
increase regional jobs, revenue, and sustainability by
supporting local food and beverage businesses.
This roadmap is a five-year plan, centered on competitively
advantaged clusters, or “geographic concentrations of
interconnected businesses, suppliers, service providers,
and associated institutions in a particular sector.”1 A
dedicated Advisory Committee and Working Group helped
to narrow focus to specific industries within the food sector
where potential advantage was deemed the greatest,
based on a deep understanding of regional assets,
regional and national market dynamics, and Northeast
Ohio’s competitive standing relative to other regions.
Bush Consulting Group, specialists in industry driven
economic development strategies, was engaged to
determine exactly what Cuyahoga County and Northeast
Ohio’s food businesses need to be more competitive. The
targeted actions recommended are based in financial
analysis and have been heavily vetted with regional
experts and industry leaders.2
Scope
Bush Consulting Group has identified actions to leverage
specific regional food business strengths or remove
regional barriers in each of the following areas:
Replacing Imported Products: Meeting more of the
region’s food and beverage demand with Northeast
Ohio products.
Expanding Exported Products: Increasing the
export of certain food and beverage products out of
Northeast Ohio to a broader US market.
Sustainable Economic Development: Improving the
regional food businesses’ environmental and social
impact in ways that strengthen their financial
performance as well as the region’s attractiveness as
a business climate.
This roadmap articulates a role for Cuyahoga County
industry leaders as part of a broader Northeast Ohio food
sector. Recommended interventions assume
implementation and impact concentrated within the county,
but target food and beverage businesses strengths to
benefit both Cuyahoga and the larger 16-county region.
The roadmap builds on a broader regional assessment of
ag-bioscience cluster opportunities completed in 2013.3
1Brookings Institution Metropolitan Policy Program, Clusters and Competitiveness: A New Federal Role for
Stimulating Regional Economies, 2008
2The report Appendix contains additional information about the roadmapping process, based on InSeven by
NorTech®, as well as a full list of the individuals and sources which informed these recommendations. 3Fund for Our Economic Future, Defining Northeast Ohio Cluster Opportunities in the Ag-Bioscience Sector,
2013
The objective of this roadmap is to increase regional jobs,
revenue, and sustainability by supporting local food business
Objective and Scope

3
Targeted interventions were narrowed based on existing
assets, champions, market opportunity and competitiveness
Criteria for Focusing Regional Cluster Development Interventions
Roadmapping Approach
Potential Industry
Focus Areas
Investment-Worthy Portfolio
of Opportunities
Company
Champions
Competitive
Advantage
Scale/
Concentration
Source of Growth
1The report Appendix contains additional information about the roadmapping process, and full
acknowledgement of the Working Group, Advisory Committee, expert interviewees, and secondary sources
which informed these recommendations.
The Advisory Committee and Working Group1 used the data analysis
summarized in this report to answer the following questions:
#1 Scale and Concentration
Is there enough regional activity to drive growth?
Is the activity represented by more than 1 company?
General Rule: should represent 1% or more of sector activity from at
least 2 companies
#2 Company Champions Are companies within potential focus area willing to participate?
Needed: at least one company within a focus area committed to
participate
#3 Source of Growth
Is potential focus area growth outpacing the sector and economy?
Is growth likely to come from local or non-local sales?
Desired: High potential growth; mix of import and export businesses
preferred
#4 Competitive Advantage
Do strengths confer differentiated position for region?
How will the region’s products compete for greater market share?
Can regional intervention increase the sustainability of growth?
Seeking: Potential advantage in one or more bases of competition
4
1The analysis and sources behind these findings are explained in the remainder of this report, and cited fully in
the Appendix.
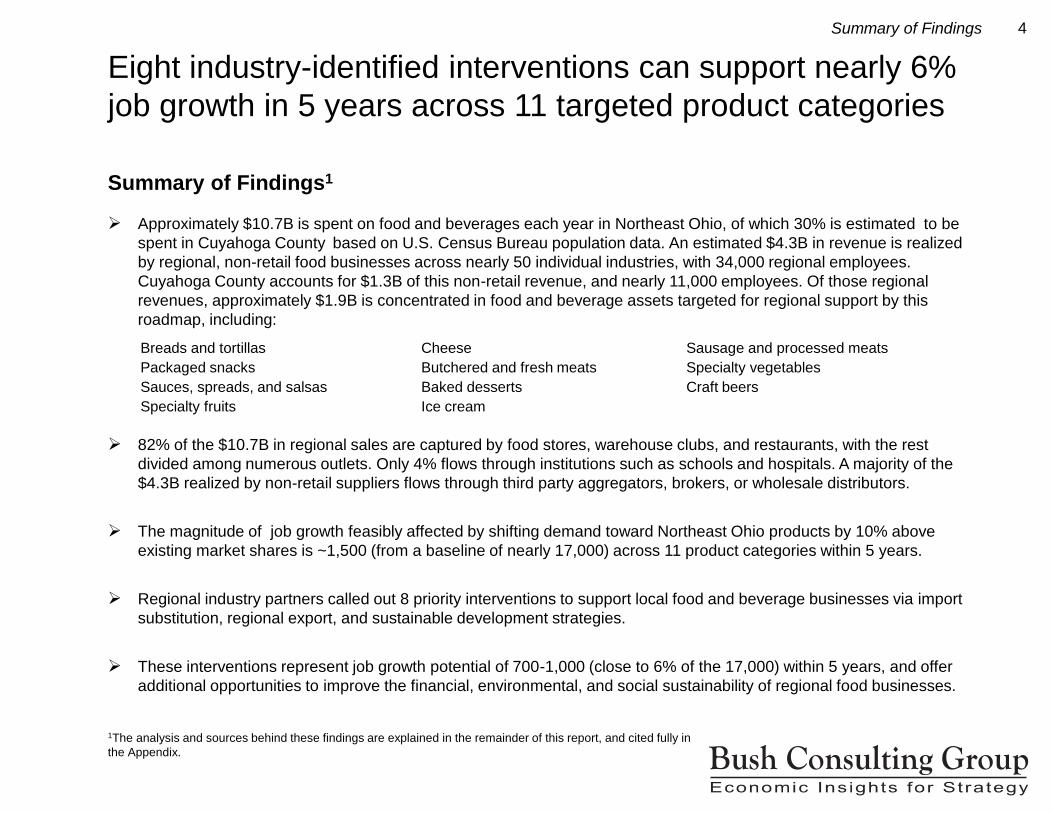
Eight industry-identified interventions can support nearly 6%
job growth in 5 years across 11 targeted product categories
Approximately $10.7B is spent on food and beverages each year in Northeast Ohio, of which 30% is estimated to be
spent in Cuyahoga County based on U.S. Census Bureau population data. An estimated $4.3B in revenue is realized
by regional, non-retail food businesses across nearly 50 individual industries, with 34,000 regional employees.
Cuyahoga County accounts for $1.3B of this non-retail revenue, and nearly 11,000 employees. Of those regional
revenues, approximately $1.9B is concentrated in food and beverage assets targeted for regional support by this
roadmap, including:
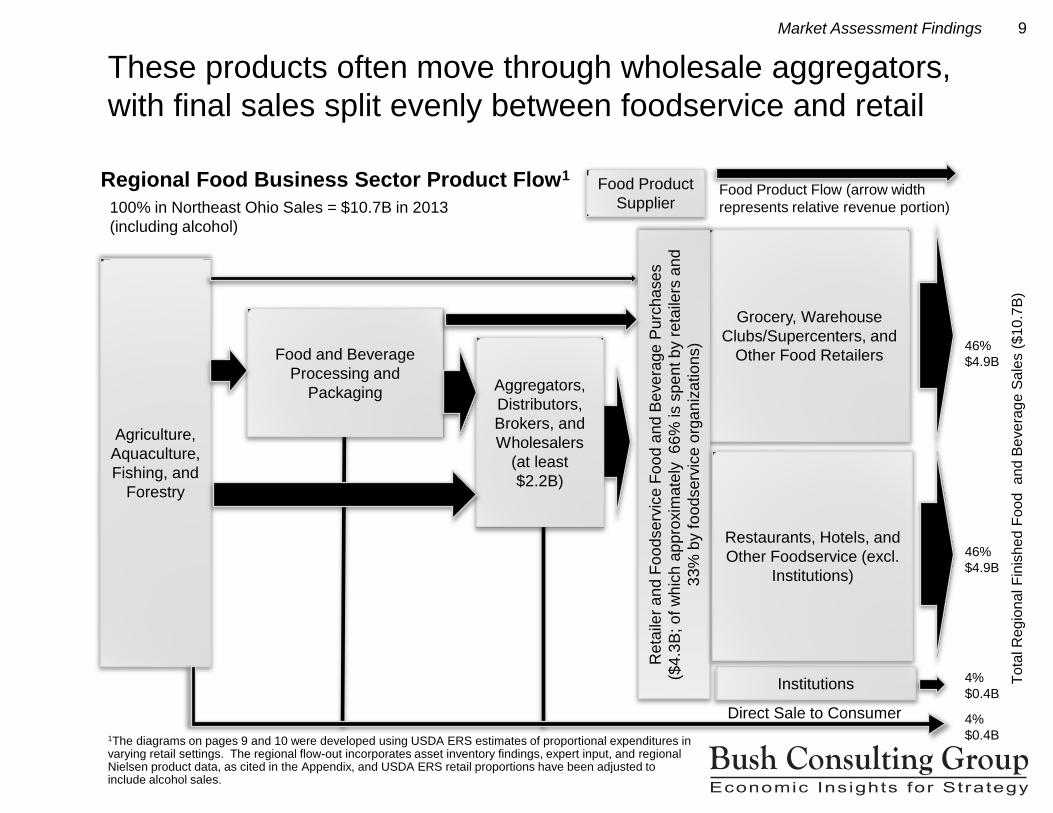
82% of the $10.7B in regional sales are captured by food stores, warehouse clubs, and restaurants, with the rest
divided among numerous outlets. Only 4% flows through institutions such as schools and hospitals. A majority of the
$4.3B realized by non-retail suppliers flows through third party aggregators, brokers, or wholesale distributors.
The magnitude of job growth feasibly affected by shifting demand toward Northeast Ohio products by 10% above
existing market shares is ~1,500 (from a baseline of nearly 17,000) across 11 product categories within 5 years.
Regional industry partners called out 8 priority interventions to support local food and beverage businesses via import
substitution, regional export, and sustainable development strategies.
These interventions represent job growth potential of 700-1,000 (close to 6% of the 17,000) within 5 years, and offer
additional opportunities to improve the financial, environmental, and social sustainability of regional food businesses.
Summary of Findings1
Summary of Findings
Breads and tortillas Cheese Sausage and processed meats
Packaged snacks Butchered and fresh meats Specialty vegetables
Sauces, spreads, and salsas Baked desserts Craft beers
Specialty fruits Ice cream
5
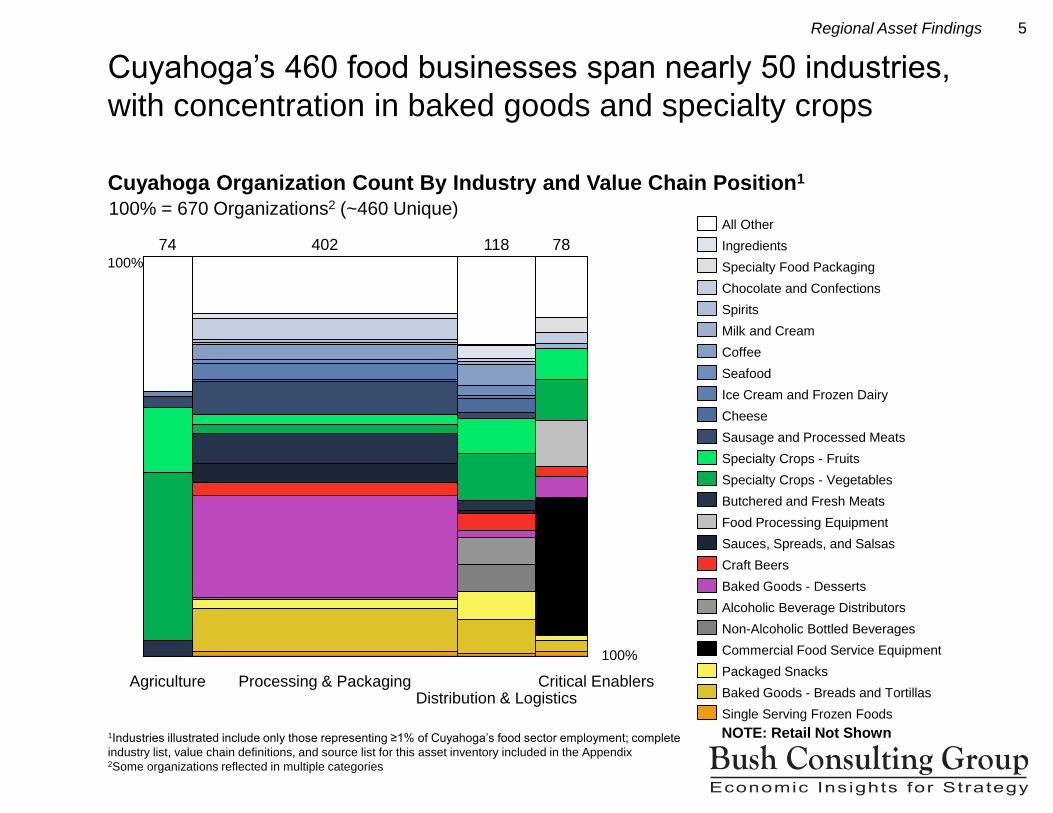
1Industries illustrated include only those representing ≥1% of Cuyahoga’s food sector employment; complete
industry list, value chain definitions, and source list for this asset inventory included in the Appendix 2Some organizations reflected in multiple categories
Cuyahoga’s 460 food businesses span nearly 50 industries,
with concentration in baked goods and specialty crops
Cuyahoga Organization Count By Industry and Value Chain Position1
Regional Asset Findings
Processing & Packaging
402
Agriculture
74
Distribution & Logistics
118
Critical Enablers
78
Butchered and Fresh Meats
Specialty Crops - Vegetables
Specialty Crops - Fruits
Sausage and Processed Meats
Single Serving Frozen Foods
Baked Goods - Breads and Tortillas
Packaged Snacks
Commercial Food Service Equipment
Non-Alcoholic Bottled Beverages
Alcoholic Beverage Distributors
Baked Goods - Desserts
Craft Beers
Sauces, Spreads, and Salsas
Food Processing Equipment
Cheese
Ice Cream and Frozen Dairy
Milk and Cream
Seafood
Spirits
Chocolate and Confections
Specialty Food Packaging
Ingredients
All Other
Coffee
100% = 670 Organizations2 (~460 Unique)
NOTE: Retail Not Shown
100%
100%

6
1Industries illustrated include only those representing ≥1% of Cuyahoga’s food sector employment; complete
industry list, value chain definitions, and source list for this asset inventory included in the Appendix 2If an organization participates in multiple categories, an estimated % of relevant employment is allocated to
each
The largely urban county’s commercial food employment is
concentrated in processing, packaging, and distribution
Cuyahoga Employee Headcount by Industry and Value Chain Position1
Regional Asset Findings
1,185
Distribution & Logistics
4,420
Processing & Packaging
4,949
Agriculture
71
Critical Enablers
Chocolate and Confections
Specialty Food Packaging
Ingredients
All Other
Spirits
Baked Goods - Desserts
Craft Beers
Sauces, Spreads, and Salsas
Food Processing Equipment
Butchered and Fresh Meats
Specialty Crops - Vegetables
Specialty Crops - Fruits
Sausage and Processed Meats
Cheese
Ice Cream and Frozen Dairy
Seafood
Coffee
Milk and Cream
Single Serving Frozen Foods
Baked Goods - Breads and Tortillas
Packaged Snacks
Commercial Food Service Equipment
Non-Alcoholic Bottled Beverages
Alcoholic Beverage Distributors
100% = 10,600 FTE2 (representing ~$1.3B in revenue)
Industries Targeted for Intervention = 4,470 FTE (~$560MM revenue)
NOTE: Retail Not Shown
100%
100%

7
116-county region including Ashland, Ashtabula, Carroll, Columbiana, Cuyahoga, Geauga, Lake, Lorain, Mahoning, Medina, Portage, Richland, Stark, Summit, Trumbull, and Wayne 2Industries illustrated include only those representing ≥1% of regional food sector employment; complete industry list, value chain definitions, and source list for this asset inventory included in the Appendix 3Some organizations reflected in multiple categories
The broader region’s 4,400 food suppliers include a more
substantial agricultural base from which Cuyahoga can draw
Northeast Ohio1 Organization Count By Industry and Value Chain Position2
Regional Asset Findings
Critical Enablers
266 427
Processing & Packaging
1,286
Agriculture
3,927
Distribution & Logistics Baked Goods - Breads and Tortillas
Single Serving Frozen Foods
Packaged Snacks
Non-Alcoholic Bottled Beverages
Milk and Cream
Specialty Crops - Fruits
Sausage and Processed Meats
Specialty Crops - Vegetables
Baked Goods - Desserts
Commodity Crops
Cheese
Commercial Food Service Equipment
Butchered and Fresh Meats
Alcoholic Beverage Distributors
Poultry
Chocolate and Confections
Ice Cream and Frozen Dairy
Sauces, Spreads, and Salsas
Specialty Food Packaging
All Other
Coffee
Craft Beers
Food Processing Equipment
100% = 5,910 Organizations3 (~4,400 Unique)
NOTE: Retail Not Shown
100%
100%

8
116-county region including Ashland, Ashtabula, Carroll, Columbiana, Cuyahoga, Geauga, Lake, Lorain,
Mahoning, Medina, Portage, Richland, Stark, Summit, Trumbull, and Wayne 2Industries illustrated include only those representing ≥1% of regional food sector employment; complete
industry list, value chain definitions, and source list for this asset inventory included in the Appendix 3An estimated % of relevant employment is allocated to each category in which an organization participates
Regional food and beverage assets targeted for intervention
represent nearly 17,000 employees and $1.9B revenue
Northeast Ohio1 Employee Headcount by Industry and Value Chain Position2
Regional Asset Findings
Critical Enablers
2,643
Distribution & Logistics
10,895
Processing & Packaging
14,387
Agriculture
5,786
Specialty Crops - Vegetables
All Other
Baked Goods - Breads and Tortillas
Single Serving Frozen Foods
Packaged Snacks
Specialty Food Packaging
Non-Alcoholic Bottled Beverages
Milk and Cream
Specialty Crops - Fruits
Sausage and Processed Meats
Baked Goods - Desserts
Commodity Crops
Cheese
Commercial Food Service Equipment
Butchered and Fresh Meats
Alcoholic Beverage Distributors
Poultry
Sauces, Spreads, and Salsas
Chocolate and Confections
Coffee
Craft Beers
Food Processing Equipment
Ice Cream and Frozen Dairy
100% = 33,711 FTE3 (representing ~$4.3B revenue)
Industries Targeted for Intervention = 16,770 FTE (~$1.9B revenue)
NOTE: Retail Not Shown
100%
100%
9
These products often move through wholesale aggregators,
with final sales split evenly between foodservice and retail
Regional Food Business Sector Product Flow1
1The diagrams on pages 9 and 10 were developed using USDA ERS estimates of proportional expenditures in varying retail settings. The regional flow-out incorporates asset inventory findings, expert input, and regional Nielsen product data, as cited in the Appendix, and USDA ERS retail proportions have been adjusted to include alcohol sales.
Market Assessment Findings
Agriculture,
Aquaculture,
Fishing, and
Forestry
Food and Beverage
Processing and
Packaging
Food Product Flow (arrow width
represents relative revenue portion)
Food Product
Supplier
Aggregators,
Distributors,
Brokers, and
Wholesalers
(at least
$2.2B)
Grocery, Warehouse
Clubs/Supercenters, and
Other Food Retailers
Reta
iler
an
d F
oo
dse
rvic
e F
oo
d a
nd
Be
ve
rage
Pu
rcha
ses
($4
.3B
; o
f w
hic
h a
pp
roxim
ate
ly 6
6%
is s
pe
nt b
y r
eta
ilers
an
d
33
% b
y f
oo
dserv
ice o
rga
niz
atio
ns)
Institutions
100% in Northeast Ohio Sales = $10.7B in 2013
(including alcohol)
46%
$4.9B
4%
$0.4B
4%
$0.4B
Direct Sale to Consumer
Restaurants, Hotels, and
Other Foodservice (excl.
Institutions)
46%
$4.9B
To
tal R
eg
iona
l F
inis
hed
Foo
d a
nd
Be
ve
rag
e S
ale
s (
$10
.7B
)

10
Federal expenditure data identify grocery stores, restaurants,
and warehouse clubs as critical food channels
US Food Business Sector Product Flow1
Market Assessment Findings
Agriculture,
Aquaculture,
Fishing, and
Forestry
Food and Beverage
Processing and
Packaging
Grocery/Supermarket (≥$2MM)
Convenience Stores
Other Grocery (<$2MM)
Specialty Food Stores
Warehouse Clubs/Supercenters
Mass Merchandisers
Other Stores
Home Delivered/Mail Order
Aggregators,
Distributors,
Brokers, and
Wholesalers
Full-service Restaurants
Limited-service Eating Places
Hotels and Motels
Schools and Colleges
Stores, Bars, and Vending Machines
Recreational Places
Others, incl. Military Outlets
Reta
iler
an
d F
oo
dse
rvic
e C
ha
nn
els
18.0%
15.5%
1.8%
3.1%
2.0%
1.8%
1.1%
36.2%
1.4%
0.8%
1.3%
8.8%
0.3%
2.8%
1.7%
3.3%
To
tal U
S F
inis
hed
Foo
d S
ale
s (
$1,4
09
B)
Food Product Flow (arrow width
represents relative revenue portion)
Food Product
Supplier 100% in US Sales = $1,409B in 2013
(excluding alcohol)
1The diagrams on pages 9 and 10 were developed using USDA ERS estimates of proportional expenditures in varying retail settings. Total U.S. food sales are from recently released 2013 historical food sales data, while the retail flow-out is based on 2012 data. The US flow-out excludes alcohol, allowing a more detailed understanding of various retail types.
Direct Sale to Consumer

11
Source: Bush Consulting Group analysis; aggregate across value chain informed by business-oriented (not
consumer-oriented) customer interviews in which some customers ranked categories, while others offered
qualitative insight
Local sourcing falls behind quality, price, and availability in
its influence on businesses’ food purchasing decisions
Relative Rank by Influence On Business Food Purchasing Decisions
Market Assessment Findings
Quality Price
Availability Freshness
Healthfulness Convenience
3rd Party Certification
Variety Local Branding
Environmental Impact
Price Quality
Healthfulness
Environmental Impact Variety
3rd Party Certification Convenience
Local Branding
Freshness Availability
Processors/
Packagers
Aggregators/
Distributors
Institutions Consumer-
Facing Retail
and
Foodservice
Strength of Influence on Purchasing Decisions
“We are willing and
able to source local
product when our
customers demand
and are willing to
pay the added cost
for it.”
“Price is always
key, but I may be
willing to pay a bit
extra for higher
quality product.”
“Certain consumers are
willing to pay more for
local product, but no
one is willing to
sacrifice quality.”
“Institutional purchasing
decisions are highly cost-
driven; price increases
must be justified by quality
and/or healthfulness
improvement.”
Bars reflect scale of 1 (lowest influence) to 10 (strongest)

12
Sources: Bush Consulting Group Analysis using Asset Inventory data, MarketLine and IBISWorld Industry reports, Nielsen Cleveland Market point of sale data, and Cleveland State University QCEW data 1Range reflects impact of local distribution, which may or may not be of locally sourced items 1,3Share calculated as 2013 local revenue (from asset inventory data) divided by total 2013 market (extrapolated from Nielsen point of sale data), using an assumption for each industry about the percentage of Northeast Ohio product sold regionally vs. exported to a “rest of US” market 2Certain industries were not evaluated for export given the likelihood of most regional suppliers focusing on a mostly regional market 4Compound Annual Growth Rate represents projected year over year growth of the US market for each industry
Health snacks, craft beers, and specialty cheeses stand out
as category leaders and represent high growth opportunities
Summary of Market Data and Assumptions for Targeted Industries
Market Assessment Findings
Industries
Targeted for
Intervention
Regional
Employ-
ment
(FTE)
2013
Regional
Market
($MM)
2018
Regional
Market
($MM)
Current
Regional
Share1
(%)
2013
Rest of
US
Market
($MM)2
2018
Rest of
US
Market
($MM)2
Current
Rest of
US
Share
(%)3
CAGR4
2013-2018
(%)
Average
Produc-
tion Wage
in NEO ($)
Breads/Tortillas 2,940 720 850 17-22% 28,500 33,680 0.8 3.4 31,600
Packaged
Snacks
2,770 1,020 1,290 4-8% 53,210 67,200 0.6 4.8 (7.8
health)
37,200
Craft Beers 490 100 190 34-49% 1,680 3,050 1.0 12.6 34,900
Baked Desserts 1,430 250 260 40-43% 1.0 31,600
Sauce/Spread/
Salsas
680 620 700 7% 29,840 33,760 0.1 2.5 49,000
Fresh Meats 1,120 110 120 24-25% 1.3 41,000
Vegetables 2,300 1,410 1,640 10% 3.0 56,800
Fruits 1,740 930 1,080 10-11% 3.0 56,800
Processed Meats 1,590 860 930 10-12% 1.5 41,000
Cheese 1,310 700 820 11-13% 36,420 42,430 0.2 3.1 (led by
specialty)
60,600
Ice Cream 400 260 290 13-15% 16,360 18,230 0.1 2.2 53,400
TOTAL 16,770 6,980 8,170 11-14% 166,010 198,350 0.4 3.6 43,700

13
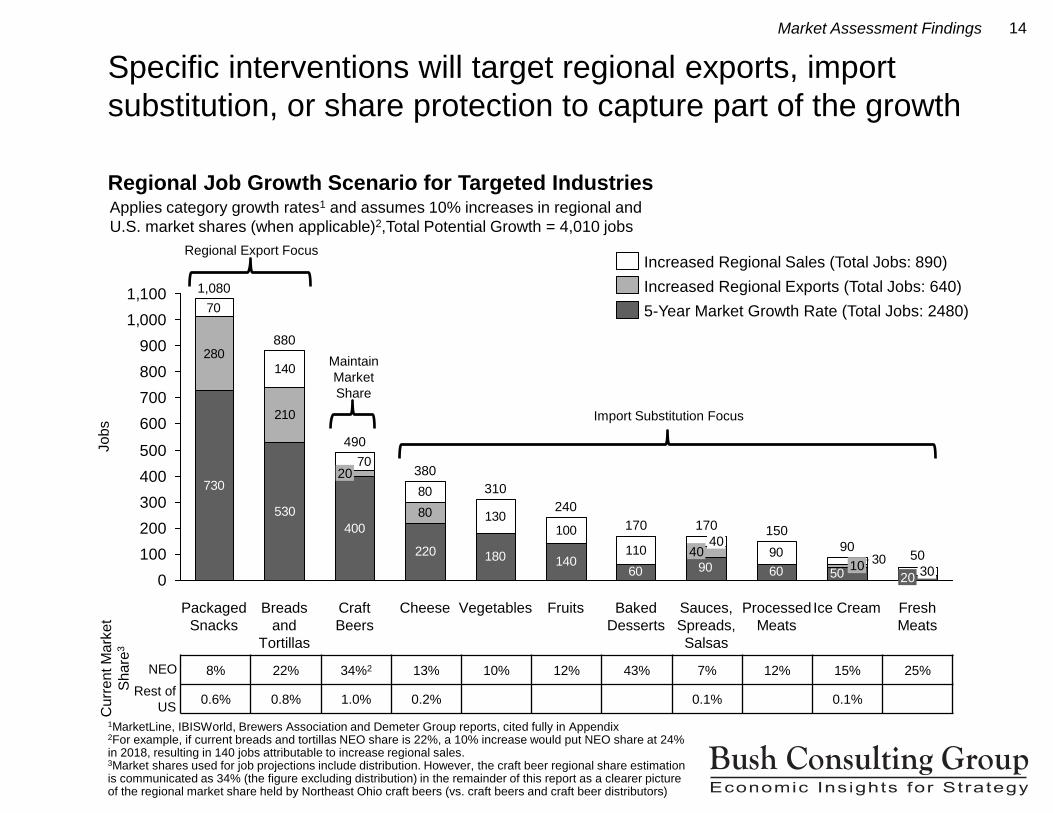
1MarketLine, IBISWorld, Brewers Association and Demeter Group reports, cited fully in Appendix
2For example, if current breads and tortillas NEO share is 22%, a 10% increase would put NEO share at 24% in 2018, resulting in 140 jobs attributable to increase regional sales. 3Market shares used for job projections include distribution. However, the craft beer regional share estimation is communicated as 34% (the figure excluding distribution) in the remainder of this report as a clearer picture of the regional market share held by Northeast Ohio craft beers (vs. craft beers and craft beer distributors)
Projected market growth for targeted industries will drive job
growth more than plausible increases in market share
Regional Job Growth Scenario for Targeted Industries
Market Assessment Findings
Applies category growth rates1 and assumes 10% increases in regional and
U.S. market shares (when applicable)2,Total Potential Growth = 4,010 jobs
0
100
200
300
400
500
600
700
800
900
1,000
1,100
Sauces,
Spreads,
Salsas
Baked
Desserts
Fruits Vegetables Cheese Processed
Meats
Jo
bs
Fresh
Meats
Ice Cream Craft
Beers
Breads
and
Tortillas
Packaged
Snacks
5-Year Market Growth Rate (Total Jobs: 2480)
Increased Regional Sales (Total Jobs: 890)
Increased Regional Exports (Total Jobs: 640)
8% 22% 34%2 13% 10% 12% 43% 7% 12% 15% 25%
0.6% 0.8% 1.0% 0.2% 0.1% 0.1%
Cu
rre
nt M
ark
et
Sh
are
3
NEO
Rest of
US
14
1MarketLine, IBISWorld, Brewers Association and Demeter Group reports, cited fully in Appendix
2For example, if current breads and tortillas NEO share is 22%, a 10% increase would put NEO share at 24% in 2018, resulting in 140 jobs attributable to increase regional sales. 3Market shares used for job projections include distribution. However, the craft beer regional share estimation is communicated as 34% (the figure excluding distribution) in the remainder of this report as a clearer picture of the regional market share held by Northeast Ohio craft beers (vs. craft beers and craft beer distributors)
Specific interventions will target regional exports, import
substitution, or share protection to capture part of the growth
Regional Job Growth Scenario for Targeted Industries
Market Assessment Findings
Applies category growth rates1 and assumes 10% increases in regional and
U.S. market shares (when applicable)2,Total Potential Growth = 4,010 jobs
730
530
400
220 180 140
70
140
80
130100
110 90
50609060
80
210
280
30
70
0
100
200
300
400
500
600
700
800
900
1,000
1,100
Jo
bs
Fresh
Meats
50
20 30
Ice Cream
90
10
Processed
Meats
150
Sauces,
Spreads,
Salsas
170
40 40
Baked
Desserts
170
Fruits
240
Vegetables
310
Cheese
380
Craft
Beers
490
20
Breads
and
Tortillas
880
Packaged
Snacks
1,080 Increased Regional Exports (Total Jobs: 640)
Increased Regional Sales (Total Jobs: 890)
5-Year Market Growth Rate (Total Jobs: 2480)
8% 22% 34%2 13% 10% 12% 43% 7% 12% 15% 25%
0.6% 0.8% 1.0% 0.2% 0.1% 0.1%
Cu
rre
nt M
ark
et
Sh
are
3
NEO
Rest of
US
Regional Export Focus
Maintain
Market
Share
Import Substitution Focus
15
Wholesome Wave Double
Value Coupon Program
Bridgeport, CT Provides incentives that match
the value of federal nutrition
benefits (SNAP, WIC, FMNP)
used to purchase fresh, local
produce at participating farm-to-
retail venues
Sustainable Business Network
of Massachusetts Local Food
Trade Show
Boston, MA Targeting restaurants and
institutional buyers
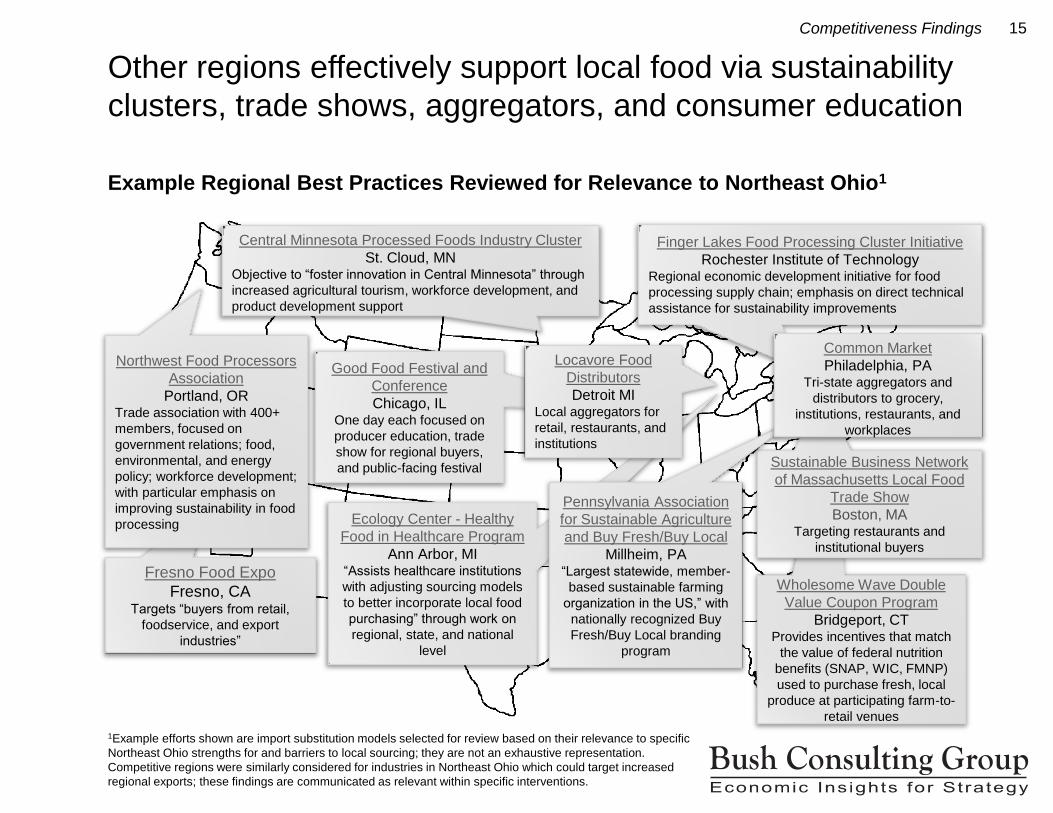
Other regions effectively support local food via sustainability
clusters, trade shows, aggregators, and consumer education
Fresno Food Expo
Fresno, CA Targets “buyers from retail,
foodservice, and export
industries”
Example Regional Best Practices Reviewed for Relevance to Northeast Ohio1
1Example efforts shown are import substitution models selected for review based on their relevance to specific
Northeast Ohio strengths for and barriers to local sourcing; they are not an exhaustive representation.
Competitive regions were similarly considered for industries in Northeast Ohio which could target increased
regional exports; these findings are communicated as relevant within specific interventions.
Competitiveness Findings
Central Minnesota Processed Foods Industry Cluster
St. Cloud, MN Objective to “foster innovation in Central Minnesota” through
increased agricultural tourism, workforce development, and
product development support
Finger Lakes Food Processing Cluster Initiative
Rochester Institute of Technology Regional economic development initiative for food
processing supply chain; emphasis on direct technical
assistance for sustainability improvements
Northwest Food Processors
Association
Portland, OR Trade association with 400+
members, focused on
government relations; food,
environmental, and energy
policy; workforce development;
with particular emphasis on
improving sustainability in food
processing Ecology Center - Healthy
Food in Healthcare Program
Ann Arbor, MI “Assists healthcare institutions
with adjusting sourcing models
to better incorporate local food
purchasing” through work on
regional, state, and national
level
Good Food Festival and
Conference
Chicago, IL One day each focused on
producer education, trade
show for regional buyers,
and public-facing festival
Locavore Food
Distributors
Detroit MI Local aggregators for
retail, restaurants, and
institutions
Pennsylvania Association
for Sustainable Agriculture
and Buy Fresh/Buy Local
Millheim, PA “Largest statewide, member-
based sustainable farming
organization in the US,” with
nationally recognized Buy
Fresh/Buy Local branding
program
Common Market
Philadelphia, PA Tri-state aggregators and
distributors to grocery,
institutions, restaurants, and
workplaces

16
1Asset categories listed represent at least 1% of food sector employment in Cuyahoga and 16-county
Northeast Ohio region; listed from highest to lowest Cuyahoga County employment; while frozen foods and
milk & cream were not selected as initial areas of focus or sized for growth opportunity, the interventions
identified may benefit established regional businesses in these industries as well 2Based on projected US market and associated regional job growth from protecting or capturing market share 3Opportunities to leverage strengths or remove barriers specific to Northeast Ohio businesses in target
industries/markets
Industry leaders prioritized a portfolio of eight interventions to
meet Northeast Ohio’s specific competitiveness objectives
Summary of Analysis Supporting Strategic Intervention
Competitiveness Findings
Frozen foods
Breads & tortillas
Packaged snacks
Baked desserts
Craft beers
Sauces, spreads, &
salsas
Fresh meats
Vegetables
Fruits
Processed meats
Cheese
Ice cream
Milk & cream
Regional Asset
Concentration1
Regional Exports to Rest of US Market
Frozen foods, including breads & tortillas
Craft beers
Specialty & artisan cheese
Northeast Ohio Market Import Substitution
Opportunity to support small- and mid-sized
regional producers
Consumer interest in “healthy” offerings
Product-neutral; can leverage any product
made in Northeast Ohio
Market Opportunities2
Assess frozen food intermodal facility
feasibility
Support craft beer and cheese industry
associations
Reduce production workforce turnover
Partner with anaerobic digestion technology
cluster
Promote financing for efficiency upgrades
Ways to Boost Regional
Competitiveness3
Establish regional trade show and match-
maker
Expand local nutrition access programs
Support craft beer and cheese industry
associations
Regional Sustainability
Pre- & post-consumer food waste recovery
Energy efficiency

17
1Based on average productivity of $128,000 per FTE, as calculated from 2013 regional job and revenue data 2These do not have a measurable value in aggregate, as they will vary by organizational sourcing decisions
and efficiency improvements made. In addition, some organizations choose to source locally due to a
revenue opportunity or commitment to the broader sustainability value, even if costs will increase for the
organization. Cost reduction should be viewed as a potential upside, rather than a net quantifiable benefit for
regional organizations.
These Cuyahoga-based interventions will support broader
regional job growth and food business sustainability
Economic:
Revenue growth of $90-128MM supporting 700-1,000 new jobs over the next five years1;
plus any reduced costs which may attributable to local sourcing and efficiency measures2
Social:
Promotion of healthful, local food and beverage products; stabilization of existing jobs;
potential job opportunity development for difficult-to-place populations
Environmental:
Food waste recovery, energy and water efficiency, alternative energy generation, and
transportation efficiency
Summarized Sustainability Impacts of Recommended Interventions
Sustainability Impact

Proposed Interventions

19
Regional Strengths to Leverage:
Range of food businesses increasingly sourcing locally
High-quality producers in growing categories of craft beer,
specialty cheese, value-added produce, and health snacks
Large scale production of apples, sweet corn, organic milk,
processed meats, ice cream, and broiler chickens
Early stage food business incubators
Media buzz around local foods movement
Availability of regional food supply data which could be best
leveraged by an individual tasked with relationship building
Regional Barriers to Remove:
Communication barrier between food suppliers seeking
channels to market and retailers looking for differentiated
local offerings
Vetting needed for early stage food businesses to
demonstrate commercial readiness
Seasonality and available land limits production of fresh,
local produce
Awareness of smaller businesses having competitive
product and financing or scale-up needs of available
regional resources
Timeline:
By 2015, hire a seasoned food procurement professional
to act as regional match-maker between Northeast Ohio
food and beverage producers and customers; this
professional will also be positioned to connect regional
organizations to other implemented interventions
By 2017, establish a self-sustaining, annual regional
trade show1 for Northeast Ohio food and beverage
producers and customers
Recommended Implementation Partners:
ECDI and the Cleveland Culinary Launch + Kitchen
Institutions (e.g., UH and Cleveland Clinic)
Financing community
Regional ag-bioscience efforts (e.g., JumpStart,
OARDC)
Retailers (e.g., Heinen’s, Whole Foods, Chipotle)
Other working group members
Associated Opportunities to Watch:
Expo expansion to include a public-facing festival
Institutional demand aggregation
Data collection for better tracking of local sourcing
Intervention 1: Establish NEO Food Expo and regional match-maker to help shift
$100 million in regional food business spend (2% of total) to local producers.
Industry leaders cited a regional trade show and full time
match-maker as most critical
Trade Show and Match-Maker
Impact: 300-400 new jobs at food and beverage businesses
Anticipated Investment: $1.25MM over 5 years (including the trade show and match-maker)
Estimated Return: ~$3,600 invested per incremental job
1Explore Chicago’s Good Food Festival and Conference and Boston’s Sustainable Business Network of
Massachusetts as best practice examples. The first trade show can be launched at a smaller scale in the
nearer term, but the objective is for the show to have a self-sustaining revenue stream by 2017.
20
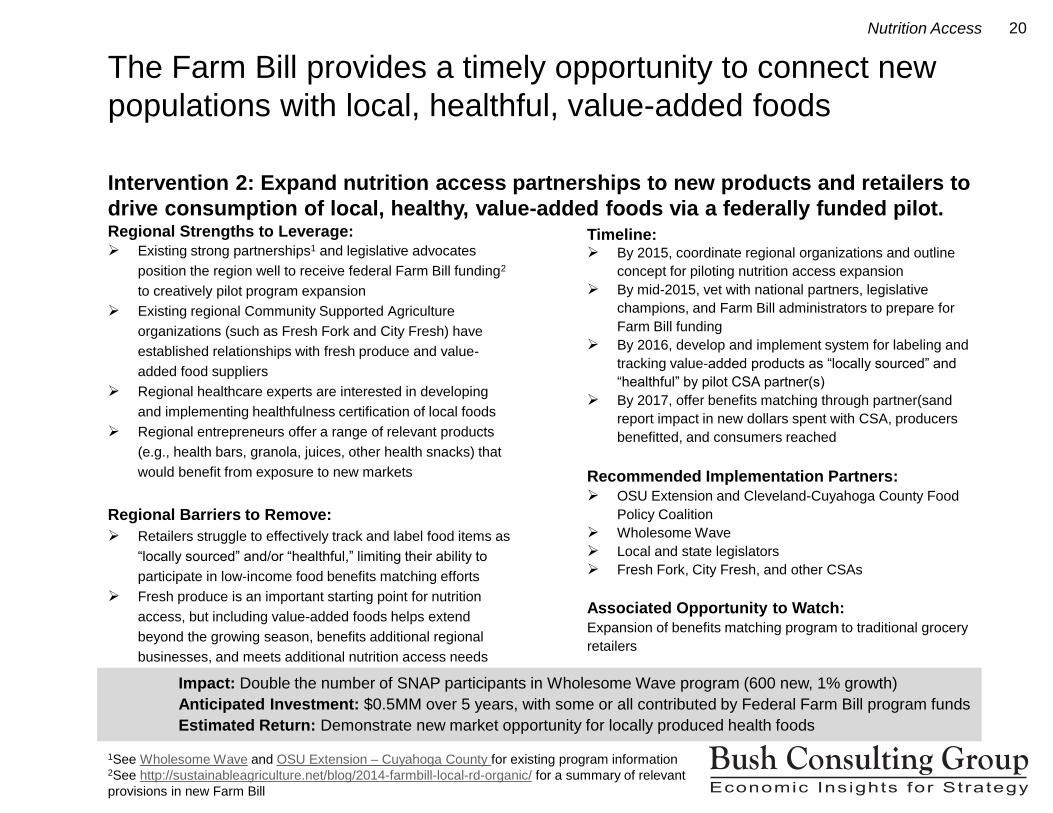
Regional Strengths to Leverage:
Existing strong partnerships1 and legislative advocates
position the region well to receive federal Farm Bill funding2
to creatively pilot program expansion
Existing regional Community Supported Agriculture
organizations (such as Fresh Fork and City Fresh) have
established relationships with fresh produce and value-
added food suppliers
Regional healthcare experts are interested in developing
and implementing healthfulness certification of local foods
Regional entrepreneurs offer a range of relevant products
(e.g., health bars, granola, juices, other health snacks) that
would benefit from exposure to new markets
Regional Barriers to Remove:
Retailers struggle to effectively track and label food items as
“locally sourced” and/or “healthful,” limiting their ability to
participate in low-income food benefits matching efforts
Fresh produce is an important starting point for nutrition
access, but including value-added foods helps extend
beyond the growing season, benefits additional regional
businesses, and meets additional nutrition access needs
Timeline: By 2015, coordinate regional organizations and outline
concept for piloting nutrition access expansion
By mid-2015, vet with national partners, legislative
champions, and Farm Bill administrators to prepare for
Farm Bill funding
By 2016, develop and implement system for labeling and
tracking value-added products as “locally sourced” and
“healthful” by pilot CSA partner(s)
By 2017, offer benefits matching through partner(sand
report impact in new dollars spent with CSA, producers
benefitted, and consumers reached
Recommended Implementation Partners:
OSU Extension and Cleveland-Cuyahoga County Food
Policy Coalition
Wholesome Wave
Local and state legislators
Fresh Fork, City Fresh, and other CSAs
Associated Opportunity to Watch:
Expansion of benefits matching program to traditional grocery
retailers
Intervention 2: Expand nutrition access partnerships to new products and retailers to
drive consumption of local, healthy, value-added foods via a federally funded pilot.
The Farm Bill provides a timely opportunity to connect new
populations with local, healthful, value-added foods
Nutrition Access
Impact: Double the number of SNAP participants in Wholesome Wave program (600 new, 1% growth)
Anticipated Investment: $0.5MM over 5 years, with some or all contributed by Federal Farm Bill program funds
Estimated Return: Demonstrate new market opportunity for locally produced health foods
1See Wholesome Wave and OSU Extension – Cuyahoga County for existing program information
2See http://sustainableagriculture.net/blog/2014-farmbill-local-rd-organic/ for a summary of relevant
provisions in new Farm Bill

21
Regional Strengths to Leverage:
NEO has differentiated waste and biomass-to-energy
technology cluster and anaerobic digestion supply chain;
less energy intensive, odorous, and water polluting
technology than commercial-scale composting
Previously successful partnerships between cluster and
regional food processors, institutions, and public agencies to
manage pre- and post-consumer organic waste
Regional Barriers to Remove:
Larger food processors seek to reduce organic waste to
avoid water treatment and landfill tipping fees
High initial investment of anaerobic digestion systems
Challenges with post-consumer food waste management
Economic payback for smaller-scale digesters
Sustainability Opportunity:
Organic landfill waste accounts for 16% of U.S. methane
emissions1, and burdens local water sources and sewer
systems through stormwater runoff and infiltration
Anaerobic digestion can generate energy from this waste
Timeline: By 2016, determine available food waste recovery
capacity of existing regional anaerobic digestion
facilities, and match with appropriate pre-consumer food
waste sources
By 2017, assess requirements for additional anaerobic
digestion capacity, appropriate food waste partners,
and/or necessary changes to waste management
practices
By 2020, complete food waste recovery capacity
expansion
Recommended Implementation Partners: NorTech and relevant cluster members
UH and Cleveland Clinic
Mid-sized and larger food processors
Other working group members
Logistics coordinators
Associated Opportunity to Watch: Composting may be a viable alternative to consider for added
capacity
Intervention 3: Develop an anaerobic digestion partnership for food waste recovery
to divert 20% of annual business food waste.
Unique regional technology assets can be wielded to ad-
dress commercial-scale food waste management challenges
1NRDC Issue Paper, Wasted: How America is losing Up to 40 Percent of Its Food from Farm to
Fork, August 2012
Anaerobic Digestion
Impact: 45,000 tons of eliminated waste; 1.3MW incremental renewable power generation; 20 to 30 direct jobs
Anticipated Investment: $6.0MM over 7 years + ongoing Operations and Maintenance costs
Estimated Return: Predominantly environmental
22
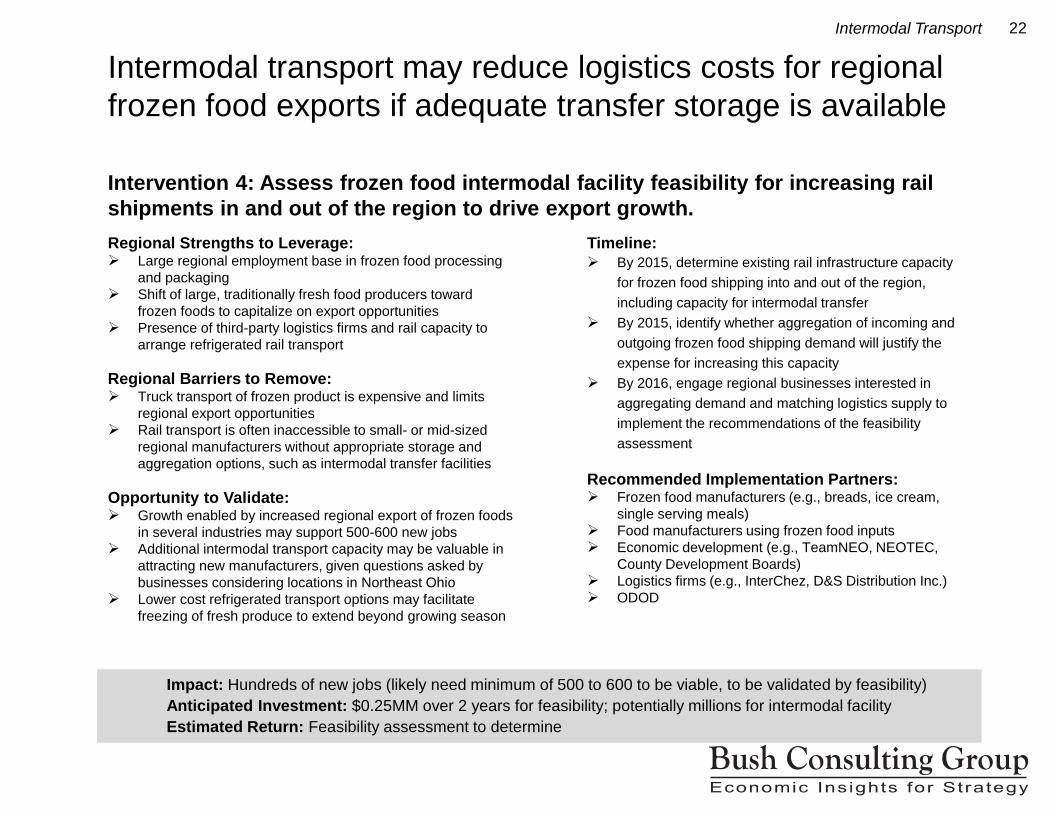
Regional Strengths to Leverage: Large regional employment base in frozen food processing
and packaging
Shift of large, traditionally fresh food producers toward
frozen foods to capitalize on export opportunities
Presence of third-party logistics firms and rail capacity to
arrange refrigerated rail transport
Regional Barriers to Remove: Truck transport of frozen product is expensive and limits
regional export opportunities
Rail transport is often inaccessible to small- or mid-sized
regional manufacturers without appropriate storage and
aggregation options, such as intermodal transfer facilities
Opportunity to Validate: Growth enabled by increased regional export of frozen foods
in several industries may support 500-600 new jobs
Additional intermodal transport capacity may be valuable in
attracting new manufacturers, given questions asked by
businesses considering locations in Northeast Ohio
Lower cost refrigerated transport options may facilitate
freezing of fresh produce to extend beyond growing season
Timeline:
By 2015, determine existing rail infrastructure capacity
for frozen food shipping into and out of the region,
including capacity for intermodal transfer
By 2015, identify whether aggregation of incoming and
outgoing frozen food shipping demand will justify the
expense for increasing this capacity
By 2016, engage regional businesses interested in
aggregating demand and matching logistics supply to
implement the recommendations of the feasibility
assessment
Recommended Implementation Partners: Frozen food manufacturers (e.g., breads, ice cream,
single serving meals)
Food manufacturers using frozen food inputs
Economic development (e.g., TeamNEO, NEOTEC,
County Development Boards)
Logistics firms (e.g., InterChez, D&S Distribution Inc.)
ODOD
Intervention 4: Assess frozen food intermodal facility feasibility for increasing rail
shipments in and out of the region to drive export growth.
Intermodal transport may reduce logistics costs for regional
frozen food exports if adequate transfer storage is available
Intermodal Transport
Impact: Hundreds of new jobs (likely need minimum of 500 to 600 to be viable, to be validated by feasibility)
Anticipated Investment: $0.25MM over 2 years for feasibility; potentially millions for intermodal facility
Estimated Return: Feasibility assessment to determine

23
Regional Strengths to Leverage: Miceli’s, a major supplier to regional grocery, restaurants,
and food processors, HQ and manufacturing operation in
Cleveland
Several nascent NEO artisan cheeses are high quality,
award-winning, and viewed as on par with European
premium cheeses
The Ohio Cheese Guild has organized and engaged industry
leaders to tackle the specific needs of specialty cheese
producers – such as assistance with regulatory
requirements, scaling, or branding
Regional Barriers to Remove:
Specialty and artisan cheese markets continue to become
crowded, though they drive cheese market growth rates
Stringent dairy industry regulations result in high barriers to
entry and high costs of expansion
Goat milk is a very costly input for artisan cheese
Anticipated Investment and Timeline: To Be
Determined. The organization is modeled after other best
practice cheese guilds in Vermont, Oregon, and California.
By collaborating with these guilds through the American
Cheese Society, the Ohio Cheese Guild works to “broaden
exposure for the region and keep its finger on the pulse of
trends and issues on a national level.”1 Board elections
were held in April, and the guild plans to participate in
numerous regional events in the coming year, such as the
Garlic Festival in Northeast Ohio.
Associated Opportunity to Watch: Connection to
Ohio Cheese Guild through the Food Expo and Regional
Match-Maker, Nutrition Access Program, and Food Waste
Recovery efforts.
Intervention 5: Support strategic initiatives of the Ohio Cheese Guild, as roughly 70
new jobs can result from each additional point of attained regional market share.
The recently formed Ohio Cheese Guild is organizing to
promote local, high quality specialty cheese producers
Specialty Cheese
Impact: Each incremental share point above current 13% share of local cheese is worth about 70 new jobs
Anticipated Investment: TBD, dependent on initiative
Estimated Return: TBD, dependent on initiative
1Statement from the Ohio Cheese Guild board.

24
Regional Strengths to Leverage: Great Lakes Brewing Co. is 19th largest craft brewer in the
US; recognized regional sustainability leader
Two dozen regional brewers offer beer on site or distribute
around the region
OSU Extension hops research offers unique, but early stage,
local sourcing potential
Craft beer has been a well-publicized part of neighborhood
revitalization in Cleveland
Brewers cite Lake Erie water as important, high quality beer
input
Association has organized to promote Ohio Craft Beers in a
crowded national landscape; is addressing appropriate
state-level policy needs (such as the ability to sell craft beers
at local farmers’ markets)
Regional Barriers to Remove:
Crowded market with beers and regions working to
differentiate themselves and compete for market share
Market saturation driving some local brewers to diversify
beyond beer, creating risk via diminished focus
Anticipated Investment and Timeline: To Be
Determined - recently hired Executive Director has been
tasked with establishing the group’s strategic plan
Associated Opportunities to Watch: Multiple opportunities cited as benefiting from a regional
craft brewer sustainability network, such as: using
brewers’ spent grains for local farming fertilizer to grow
specialty beer ingredients; measuring and
communicating environmental, social, and financial
impact to demonstrate differentiating regional
collaboration; and other peer learning opportunities to
facilitate water reuse, heat recovery, etc.
OSU South Centers and OARDC in Wooster are
conducting research and business case development for
local hops production, which is of interest to local craft
brewers, and may merit future investment or partnership
Connection to Ohio Craft Brewers Association through
the Food Expo and Regional Match-Maker, and possibly
food waste recovery efforts
Intervention 6: Support strategic initiatives of the Ohio Craft Brewers Association to
help maintain currently high regional market share of local craft beer.
The Ohio Craft Brewers Association will meet many of the
stated needs of local craft brewers in a crowded market
Craft Beer
Impact: Each incremental share point above current 34% share of local craft beer is worth about 20 new jobs;
maintaining high share of local beers will generate 300 incremental jobs through market growth
Anticipated Investment: TBD, dependent on initiative
Estimated Return: TBD, dependent on initiative

25
Food processors and retailers, like many businesses,
have financial impetus to improve their energy efficiency,
but may need financing or funding for initial capital
investments. Many regional and state sources of this
capital exist, and the Cleveland Mayor’s Office of
Sustainability is already developing a “one stop shop” to
ensure businesses know and can access the resources
applicable to them.
Associated Opportunity to Watch: Expansion of
financing options to include water efficiency upgrades,
which are particularly salient to food and beverage
manufacturing.
Example Energy Efficiency Financing Sources
and Programs to Leverage
(Illustrative, not exhaustive)
Council of Smaller Enterprises energy
assessments
DOE State Energy Program/Ohio Advanced
Energy Fund Energy Efficiency Program
Ohio Development Services Agency Energy Loan
Fund
Energy Services Company energy savings
performance contracts
DOE Independent Assessment Centers audits
(University of Michigan and Morgantown centers
cover part of Northeast Ohio region)
Cleveland-Cuyahoga County Port Authority
Manufacturers’ Assistance Program
PACE and Energy Special Improvement Districts
(status in Northeast Ohio to be determined)
Intervention 7: Refer manufacturers to existing regional energy efficiency financing
resources.
Regional energy efficiency financing resources can be
leveraged to support food manufacturers
Energy Efficiency
These opportunities may be identified and leveraged as part of implementing other priority interventions.

26
The food and beverage sector represents a diversity of
businesses and associated employment opportunities –
from family farms, to entrepreneurial small businesses, to
larger manufacturing settings with jobs in higher
quantities but pathways beginning with lower wages.
This roadmap’s recommendations will influence the full
range of these diverse opportunities. However, one
critical need has been made clear by both employers and
those representing prospective employees – to improve
retention in food processing jobs in order to reduce
turnover costs and strengthen those positions as
pathways to family-sustaining employment.
OhioMeansJobs Cleveland-Cuyahoga County (formerly
Employment Connection) helps food businesses in all
parts of the value chain find qualified local employees, as
well as identify strategies to address high turnover rates
associated with food processing and other low-wage
manufacturing and retail positions. These turnover rates
are costly, given average training costs of $3,000-$6,0001
per food production worker.
Associated Opportunities to Watch:
Partnership between local food processors and
OhioMeansJobs to explore relaxing criminal
background and/or GED requirements for certain
entry level production jobs, providing pathways to
stable income for workers who are difficult to
place.
Cost-analysis of non-wage benefits (including
education support) which may make low-wage
jobs more attractive to processing employees.
Additional training specific to food manufacturing,
especially when new food safety regulations are
clarified.
Intervention 8: Refer manufacturers to existing regional workforce development
efforts to improve employee retention.
Regional workforce development efforts can support career
pathways and reduced turnover in food processing
1Based on average value of OhioMeansJobs on-the-job-training matches.
Workforce Development
These opportunities may be identified and leveraged as part of implementing other priority interventions.

27
Several interventions common to other regions exist already
in Northeast Ohio or are valuable opportunities to watch
Northeast Ohio Context Behind Prioritization Decision
Opportunities to Watch
Already in Place
Community kitchens and food incubators
in Northeast Ohio, such as:
Cleveland Culinary Launch and Kitchen
Shaker Launch House
Economic and Community Development
Institute (ECDI) – Cleveland
Local food aggregators and distributors
serving a range of customers, including
institutions, such as:
Fresh Fork Market
Produce Packaging
Sirna & Sons
Sysco Local Crop
Examples not exhaustive.
Need Stronger Business Case
Specific co-packing facilities
At present, sufficient regional demand for
any single co-packing type does not exist to
warrant additional investment. Regional
processors often make extra capacity
available to local producers for a fee, which
can be identified by local resources.
Institutional demand aggregation
Demand aggregation has been most
successfully pursued in larger geographic
regions to source healthy food products in
response to regulation. The case for local
sourcing is largely built within institutions, in
partnership with existing suppliers, to find
healthful, cost-competitive options. This
report’s recommendations will help connect
regional institutions, aggregators, and
producers to facilitate local sourcing to the
extent that it drives purchasing decisions.

28
Each intervention’s anticipated return supports a portfolio
approach or could be implemented independently
Portfolio of Priority Interventions
Interventions Summary
Intervention
Competitive-
ness Strategy
Anticipated
Investment
Invest-
ment
Timeline
(yrs)
Job
Growth
Additional Sustainability Impact?
(beyond job growth)
Financial Environmental Social
Regional Food Trade Show &
Match-Maker
Import
Substitution $1.25MM 5 300-400
Expanded Nutrition Access
Programs
Import
Substitution;
Sustainability
$0.5MM 5 Minimal
Anaerobic Digestion Partnership Sustainability $6MM 7 20-30
Frozen Food Intermodal
Feasibility Study Export
$0.25MM
(study)
$MMs
(facility)
<2
(study)
TBD
(facility)
N/A
(study)
500-600
(facility)
Ohio Cheese Guild Import
Substitution;
Export
TBD TBD 100-200
Ohio Craft Brewers Association Import
Substitution;
Export
TBD TBD 300
Energy Efficiency Referrals Sustainability
Workforce Development Referrals Sustainability
? ?
? ?
?
?

29
Available resources will determine final prioritization of the
interventions and their implementation
A dedicated Advisory Committee, industry-led Working Group, and dozens of food and
beverage industry experts contributed to the findings and recommendations in this roadmap
– please see the Appendix for a list of their names. Prioritization for implementation of
these recommendations will be determined in the coming months based on resource
availability. While recommended implementation partners have been listed based on
expressed interest or expert reference, each priority will require participation of a range of
regional stakeholders to succeed.
Please watch http://cccfoodpolicy.org/ for information about, and opportunities to engage
with, implementation of the recommended interventions.
Next Steps
Next Steps

Appendix
Roadmapping Approach Overview
Advisory Committee Members
Working Group Members
Expert Interviewees
Sources Consulted

31
The roadmapping approach followed here has its roots in
technology-based cluster development work with NorTech
The process – developed in 2010 as InSeven by NorTech® – is a systematic approach to accelerating economic growth and job creation in industry clusters, centering on a data-driven understanding of a region’s competitive advantage. Having applied this strategic roadmapping technique to eight technology sectors in Ohio already, results have been extremely positive; the Brookings Institute called it out as a best practice in one of its recent publications. One of the keys to its success has been its ability to facilitate buy-in from the business community, who cite its focus on specific, actionable outcomes; consensus-building among organizations with disparate financial motivations; and credible, fact-based conclusions specific to the region as benefits of the approach.
Bush Consulting Group partnered with NorTech to develop the InSeven® approach, and is now exclusively licensed to deliver the methodology to regions across the country. The firm also completed a foundational investigation of Northeast Ohio’s ag-bioscience activity for The Fund for Our Economic Future to help inform this effort.
For Northeast Ohio’s sustainable foods business cluster roadmap, the process answers the questions: “What focus areas make the most sense for a sustainable foods business cluster?” “What is the potential opportunity to be captured?” and “What priority investments and interventions will most effectively leverage regional strengths or remove barriers to the growth of this cluster?” This effort develops an extensive analysis of focus areas of critical mass, regional market opportunity, and competitiveness within those areas. The analysis is used to articulate clear business cluster priorities for the city, county, and region, and relevant roles in implementing these recommendations.
Bush Consulting Group’s Roadmapping Approach
Approach Overview
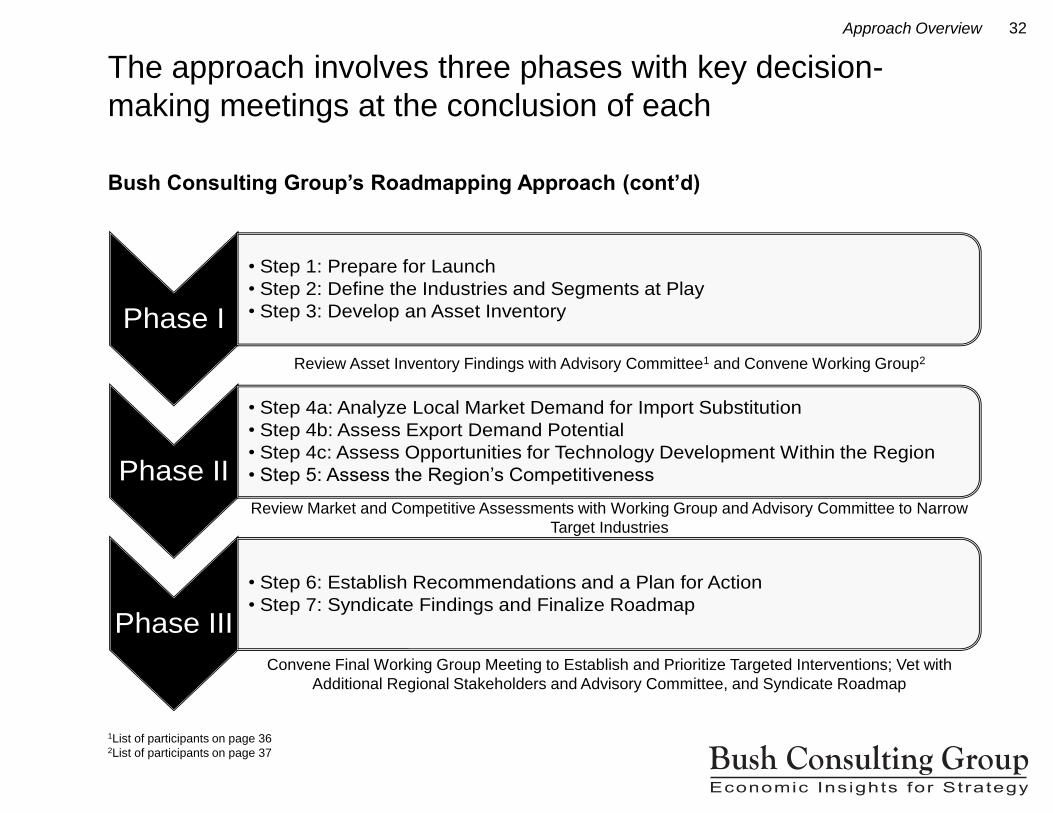
32
The approach involves three phases with key decision-
making meetings at the conclusion of each
Bush Consulting Group’s Roadmapping Approach (cont’d)
1List of participants on page 36 2List of participants on page 37
Approach Overview
Phase I
• Step 1: Prepare for Launch
• Step 2: Define the Industries and Segments at Play
• Step 3: Develop an Asset Inventory
Phase II
• Step 4a: Analyze Local Market Demand for Import Substitution
• Step 4b: Assess Export Demand Potential
• Step 4c: Assess Opportunities for Technology Development Within the Region
• Step 5: Assess the Region’s Competitiveness
Phase III
• Step 6: Establish Recommendations and a Plan for Action
• Step 7: Syndicate Findings and Finalize Roadmap
Review Asset Inventory Findings with Advisory Committee1 and Convene Working Group2
Review Market and Competitive Assessments with Working Group and Advisory Committee to Narrow
Target Industries
Convene Final Working Group Meeting to Establish and Prioritize Targeted Interventions; Vet with
Additional Regional Stakeholders and Advisory Committee, and Syndicate Roadmap

33
To quantify activity, food sector organizations are classified
by their activity in one or more parts of the value chain
Agriculture: Produces raw material through farming, forestry, or aquaculture
Processing and Packaging: Converts raw material or ingredients into value-added food
product
Distribution and Logistics: Aggregates, transports, or stores food products before
shipping them to another organization for processing or retail; includes all shipping
systems, whether product is shipped to another organization or the consumer
Retail: Sells or provides food directly to the consumer; retail activity categorized as
processing when a farmer/manufacturer sells immediately to the customer (e.g., farm
stands, retail bakeries, butchers)
Critical Enabler: Provides a product or service which is not physically part of the food
product, but significantly contributes to its production, value, or sales (e.g., food
processing or safety equipment, farming equipment or inputs, breeding services)
Value Chain Definitions
Approach Overview

34
Food sector organizations are also classified according to
their industry or potential focus area
Food Sector Industries/Potential Focus Areas (Organized Alphabetically)
Approach Overview
Agricultural Equipment Agricultural Inputs Alcoholic Beverage Distributors Baked Goods - Breads and Tortillas Baked Goods – Desserts Baked Goods – Donuts Baked Goods – Pierogi Baked Goods – Unclassified Butchered and Cut Meats Cheese Chocolate and Confections Coffee Commercial Food Service Equipment Commodity Crops Craft Beers Eggs Food Processing Equipment Food Safety/Testing Equipment Food Service Distributor/Wholesale Granola Snacks and Health Bars Honey Ice Cream and Frozen Dairy Ingredients
Maple Syrup
Milk and Other Dairy Mushrooms Neutraceuticals Non-Alcoholic Bottled Beverages Pastas Poultry Salty Snacks Sauces, Spreads, and Salsas Sausage and Processed Meats Seafood Single Serving Frozen Foods Single Serving Refrigerated Foods Soups, Salads, and Sides Specialty Crops - Fruits Specialty Crops - Garlic and Herbs Specialty Crops - Grains Specialty Crops - Vegetables Specialty Food Packaging Specialty Transport and Storage Spirits Teas Wines

35
Non-profits, educators, and key influencers are not quantified
here, but will likely be important to implementation
Non-Profits, Educators, and Key Influencers
Approach Overview
Ag Success Team of Wayne County
Ag-Bio Industry Cluster Leadership Council
Ag-Link Agricultural Linked Deposit Program (Ag-LINK)
Agricultural Technical Institute
Bainbridge Area Food For Friends
Beginning Entrepreneurs in Agricultural Networks (BEAN)
Bread of Life Food Pantry
Bridgeport Café & CornUcopia Community Kitchen
Case Western Reserve University - Cleveland Corner Store
Chef 2 Chef Foods
City of Cleveland Mayor's Office of Sustainability
City of Cleveland Planning Department
City of Macedonia Parks & Recreation
City Rising Farms (Hough)
Cleveland Clinic
Cleveland Culinary Launch and Kitchen
Cleveland Department of Public Health
Cleveland Foodbank
CMHA Refugee Response Program
Cleveland State Northeast Ohio Regional Food Congress
Cleveland Urban Agriculture Incubator Pilot Project
Cleveland Urban Design Collaborative
Cleveland-Cuyahoga County Food Policy Coalition
Common Wealth Farmer's Market
Countryside Conservancy
Crown Point Ecology Center
Cuyahoga Community College
Cuyahoga County Board of Health
Cuyahoga County Health and Land-Use Initiative
Cuyahoga County Land Bank
Cuyahoga Valley National Park Association
Double Harvest, Inc.
Eden Project, The
Edible Schoolyard
EDWINS Leadership & Restaurant Inst.
Farm Bureau
Farm Link Program
FDA
Flying High
Future Farmers of America
Galleria Gardens Under Glass
Gardening for Greenbacks
Gather 'round Farm
Gennesareth II Orchard
Goodness Grows
Grow Youngstown
Growhio
Highhopeshightunnels
Hummingbird Project, The
IBH Garden CSA
Innovative Farmers of Ohio
Intergenerational School
Jim Fry
John Hay HS Fresh Food Collaborative
Kelvin Egner
Kent State Cleveland Urban Design Ctr
Kiwanis Food Pantry
Lakewood Earth and Food Community
LAND Studio
Lorain County Community College
Mahoning Valley Organizing Collab
MetroHealth
Neighborhood Progress Inc.
NEO Food Tours
New Agrarian Center
North Union Farmers Market
Oberlin Project, The
Oberlin Student Cooperative Association
Ohio Agricultural Research and Dev’t Center
Ohio City Near West Development Corp
Ohio Dept of Ag - Office of Sustainable Ag
Ohio Ecological Food and Farm Association
Ohio Food Policy Advisory Council
Ohio Proud
Ohio State University Extension Agencies
Ohio Wine Producers Association
Old Hushers Farm
Prevention Res Ctr for Healthy Neighborhoods
Rising Harvest Farms
Sharon Glaspie
Slow Food Northern Ohio
Small Farm Institute
STEM Program in Cleveland
Steps to a Healthier Cleveland
StrawVille
Sustainable Street Food Pilot Program
Terra Local, LLC
University Hospitals
USDA
Watterson-Lake School garden
West Side Market, The
Wooster College
Youngstown Neighborhood Development Corp
4H

36
An advisory committee of regional leaders provided critical
support and oversight to the roadmap’s development
Advisory Committee Members
Advisory Committee
Name and Title Organization
Floyd Davis, Owner The Red Basket Farm
Randy DeMers, Regional Vice President Bon Appétit Management Company
Shilpa Kedar, Program Director for Economic Development The Cleveland Foundation
Jenita McGowan, Chief of Sustainability City of Cleveland Mayor’s Office of Sustainability
John Mitterholzer, Senior Program Officer for the Environment The Gund Foundation
Emily Garr Pacetti, Director of Research and Evaluation The Fund for Our Economic Future
Mary Helen Petrus, Outreach Manager Federal Reserve Bank of Cleveland
Carrie Rosenfelt, VP Community Development Relationship Manager,
Northeast Ohio
Huntington Bank
Kevin Schmotzer, Executive Small Business Development City of Cleveland Economic Development
Morgan Taggart, Extension Education, Community Development Ohio State University Extension, Cuyahoga County
Walter Wright, Project Director, Greater University Circle Community
Wealth Building Initiative
The Cleveland Foundation

37
An industry-led working group vetted the analysis and drove
development of recommendations for regional intervention
Working Group Participants
Working Group
Perspective Name and Title Organization
Processing Daniel Holan, VP Administration Orlando Baking Company
Carolyn Priemer, Director Cleveland Culinary Launch & Kitchen
Specialty
Logistics and
Aggregation
Greg Fritz, President Produce Packaging
Robert Stockham, Marketing and Communications Manager Fresh Fork Market
Retail Dan Farrell, District Manager Bon Appetit Management Company
Amanda Dempsey, Executive Director The West Side Market
Aparna Bole, Sustainability Director University Hospitals
Greg Sotka, Director, Category Management Heinen’s
Regional
Perspective
Brian Gwin, FFEF Portfolio Manger Wayne County and Regional Agriculture Activity
Brad Masi, Regional Expert Oberlin Activity and Past Studies
Policy Morgan Taggart, Extension Education, Community
Development
Morgan Bulger, Research Associate
OSU Extension – Cuyahoga County and Cleveland-
Cuyahoga County Food Policy Coalition
Jenita McGowan, Chief of Sustainability
Cathi Lehn, Sustainable Cleveland Coordinator
Joanne Neugebauer, Sustainable Cleveland Assistant
City of Cleveland Mayor’s Office of Sustainability
Dan Milo, Food Safety Supervisor Ohio Department of Agriculture
38
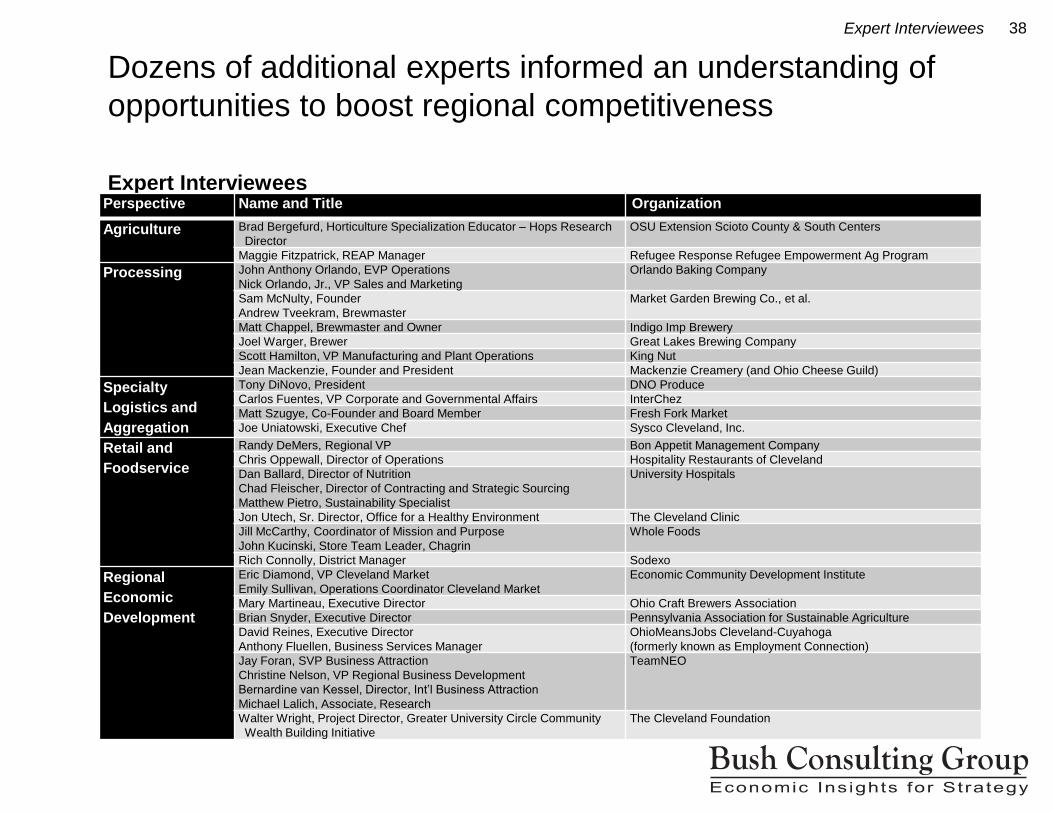
Dozens of additional experts informed an understanding of
opportunities to boost regional competitiveness
Expert Interviewees
Expert Interviewees
Perspective Name and Title Organization
Agriculture Brad Bergefurd, Horticulture Specialization Educator – Hops Research
Director
OSU Extension Scioto County & South Centers
Maggie Fitzpatrick, REAP Manager Refugee Response Refugee Empowerment Ag Program
Processing John Anthony Orlando, EVP Operations
Nick Orlando, Jr., VP Sales and Marketing
Orlando Baking Company
Sam McNulty, Founder
Andrew Tveekram, Brewmaster
Market Garden Brewing Co., et al.
Matt Chappel, Brewmaster and Owner Indigo Imp Brewery
Joel Warger, Brewer Great Lakes Brewing Company
Scott Hamilton, VP Manufacturing and Plant Operations King Nut
Jean Mackenzie, Founder and President Mackenzie Creamery (and Ohio Cheese Guild)
Specialty
Logistics and
Aggregation
Tony DiNovo, President DNO Produce
Carlos Fuentes, VP Corporate and Governmental Affairs InterChez
Matt Szugye, Co-Founder and Board Member Fresh Fork Market
Joe Uniatowski, Executive Chef Sysco Cleveland, Inc.
Retail and
Foodservice
Randy DeMers, Regional VP Bon Appetit Management Company
Chris Oppewall, Director of Operations Hospitality Restaurants of Cleveland
Dan Ballard, Director of Nutrition
Chad Fleischer, Director of Contracting and Strategic Sourcing
Matthew Pietro, Sustainability Specialist
University Hospitals
Jon Utech, Sr. Director, Office for a Healthy Environment The Cleveland Clinic
Jill McCarthy, Coordinator of Mission and Purpose
John Kucinski, Store Team Leader, Chagrin
Whole Foods
Rich Connolly, District Manager Sodexo
Regional
Economic
Development
Eric Diamond, VP Cleveland Market
Emily Sullivan, Operations Coordinator Cleveland Market
Economic Community Development Institute
Mary Martineau, Executive Director Ohio Craft Brewers Association
Brian Snyder, Executive Director Pennsylvania Association for Sustainable Agriculture
David Reines, Executive Director
Anthony Fluellen, Business Services Manager
OhioMeansJobs Cleveland-Cuyahoga
(formerly known as Employment Connection)
Jay Foran, SVP Business Attraction
Christine Nelson, VP Regional Business Development
Bernardine van Kessel, Director, Int’l Business Attraction
Michael Lalich, Associate, Research
TeamNEO
Walter Wright, Project Director, Greater University Circle Community
Wealth Building Initiative
The Cleveland Foundation

39
Hundreds of secondary resources were reviewed as part of
the asset inventory, market, and competitiveness analysis
Abraham, Lisa. The Akron Beacon Journal. “Bessemer Farms calls it quits, says new farm rules too cumbersome.” July 7, 2013.
Alexander, Dan. Forbes. “Beer Entrepreneurs Fuel Comeback of Struggling Cleveland Neighborhood.” November 26, 2013.
ACI Financial Advisors, "Jobs & Investment Bond Fund & Property Assessed Clean Energy (PACE)." November 2013.
Ag Decision Maker. “Romace vs. Reality: Hard Lessons Learned in a Grass-Fed Beef Marketing Cooperative.” Reprint from Agricultural Marketing
Resource Center, Iowa State University. April 2010.
Agri-Food Canada: International Markets Bureau, "American Eating Trends Report." October 2012.
Aguero, Tom. Queen City Drinks, "Ohio Hop Farm Research." August 19, 2013.
Aguero, Ton. Queen City Drinks, "3 Tier System: Distributors." September 18, 2013.
Akron Beacon Journal. “Bear Treasure Map.” 2013.
AIB International, "White Bread Statistics and Trends." October 24, 2013.
Alaskan Brewing Co., "Sustainable Brewing." 2013.
American Grassfed Association. “Producer-Profiles.” November 2013.
Ames Carr, Kathy. Crain's Cleveland Business, "Taking Stock of the Food Economy." November 6, 2011.
Appalachian Mountain Brewery, "Stewardship." 2014.
Armstrong, Peggy. International Dairy Foods Association, "Ice Cream Sales & Trends." 2014.
Azteca Foods, Inc., "Our History." 2014.
Baird Market Analysis. “Health, Nutrition & Fitness Report: Growth Opportunities Presented by the Current Focus on Healthier Living.” Spring 2012.
Barnes, Steve. Times Union, "Shmaltz tastes regional success." July 31, 2013.
Barr, Alistair. USA Today. “Amazon said to launch Pantry to take on Costco, Sam’s” December 12, 2013.
Barrow, Olivia. Dayton Business Journal. “Investors buy former SuperValu Warehouse for $4.3M.” December 19, 2013.
Beer Institute. “Beer Industry Economic Impact in Ohio.” 2013.
Beer Institute, "Beer Resource Center." 2014.
Beer Institute, "Brewer's Almanac 2013." March 28, 2013.
Bell's Brewery, Inc., "Sustainability." 2013.
Bimbo Bakeries USA, "Our History." 2014.
Blue Diamond Growers, "Blue Diamond Growers: Our Centennial Celebration." 2014.
Blue Point Brewing Company, "Blue is the New Green: Sustainability Report." 2014.
BOMA International, "BOMA Energy Performance Contracting Model." September 2013.
Bona, Marc. The Plain Dealer, "Craft Brewers Affected By Federal Government Shutdown." October 9, 2013.
Bona, Marc. The Plain Dealer. “The Bruery offers Autumn Maple – Crack One Open.” November 5, 2013.
Boston Beer Company. “2013 Annual Report.” 2014.
Boston Local Food Festival, "Boston Local Food Festival Presented by Sustainable Business Network of Massachusetts.” 2014.
Sources Consulted
Sources Consulted

40
Hundreds of secondary resources were reviewed as part of
the asset inventory, market, and competitiveness analysis
Boston Local Food, "SBN Local Food Trade Show." 2013.
Boulevard Brewing Company, "Sustainability." 2013.
Brewers Association. “2012 Stewardship Report.” 2013.
Brewers Association, "Brewer's Almanac 2013." 2013.
Brewers Association, "Craft Brewing Facts." 2013.
Brewers Association, "Dollar Growth Up 14% in First Six Months of 2012; Total Brewery Count Hits 125-Year High." August 6, 2012.
Brewers Association. Export Development Program. “New Quality Control Guide Released.” November 2013.
Bricker & Eckler, "Property Assessed Clean Energy (PACE) Financing: The Ohio Story." February 18, 2011.
Brookings Institution Metropolitan Policy Program, “Clusters and Competitiveness: A New Federal Role for Stimulating Regional Economies.” 2008.
Bulger, Morgan. Cleveland-Cuyahoga County Food Policy Coalition, "Cleveland Metropolitan School District and the FPC Explore School
Gardening and Local Procurement for the Farm to School Initiative." August 19, 2013.
Business Wire, "Fresno Food Expo, Nation’s Largest Regional Food Show Opens Registration for July 24 Expo, Inclusion of 2,500 Fresh Produce
Growers and Packers in California’s San Joaquin Valley." January 29, 2014.
Buzalka, Mike. Food Management. “Food Hubs Help Solve Local Sourcing Issues.” March 20, 2014.
Byard, Katie. Akron Beacon Journal. “Schwebel bakery in Cuyahoga Falls to close.” November 7, 2013.
California Craft Brewer's Association, "Who We Are." 2013.
California FreshWorks Fund, "California FreshWorks Fund: What the California FreshWorks Fund Can Mean to Our State." 2012.
Canning, Patrick, Ainsley Charles, Sonya Huang, Karen Polenske, and Arnold Waters. United States Department of Agriculture, "Energy Use in the
U.S. Food System." June 2010.
Carr, Kathy Ames. Crain’s Cleveland Business. “Local scene appealing to national audience.” October 31-November 6, 2011.
Carr, Kathy Ames. Crain’s Cleveland Business. “Market Garden brewmaster blends ‘art and science’ at Ohio City pub.” December 8, 2013.
Carr, Kathy Ames. Crain’s Cleveland Business. “Ohio’s craft brewers are a productive lot.” October 14, 2013.
Chase, Craig. Leopold Center for Sustainable Agriculture, Iowa State University Extension & Outreach. “Local Food & Farm Program: Preliminary
Report to the Iowa Legislature.” January 2012.
Chavez, Jon. The Blade, "Return of Wonder, Hostess Brands to Region Uncertain." November 18, 2013.
Chris, Kick. "Ohio Specialty Crop Hops Could Make a Return." Farm and Dairy. September 23, 2013.
Christie, Margaret. Community Involved in Sustaining Agriculture, "Scaling Up Local Food Investing in Farm & Food Systems Infrastructure in the
Pioneer Valley." October 17, 2011.
City of Cleveland. “Application Summary – Miceli-Lograsso Development Company III Expansion Project.” 2013.
Clark, Jill K., Shoshanah Inwood, and Jeff S. Sharp. Ohio State University Department of Agricultural, Environmental, and Development Economics
and Social Responsibility Initiative. “Scaling-up Connections between Regional Ohio Specialty Crop Producers and Local Markets: Distribution as
the Missing Link.” August 1, 2011.
Sources Consulted
Sources Consulted

41
Hundreds of secondary resources were reviewed as part of
the asset inventory, market, and competitiveness analysis
Cleveland Clinic Wellness, "Go! Healthy Foods for You." 2014.
Cleveland Independents. “Restaurants.” September 2013.
Cleveland Land Lab at the Cleveland Urban Design Collaborative, Kent State University. “Re-Imagining a More Sustainable Cleveland: Citywide
Strategies for Reuse of Vacant Land.” December 19, 2008.
Cleveland Land Lab at the Cleveland Urban Design Collaborative, Kent State University. “Re-Imagining Cleveland: Ideas to Action Resource Book.”
January 2011.
Clifford, Stephanie. The New York Times. “Wal-Mart to Buy More Local Produce: The local-and-sustainable food movement has spread to the
nation’s largest retailer.” October 14, 2010.
CNBC Consumer Staples. “Food Fight: Wal-Mart Vows to Guarantee Groceries, Buy Local.” June 3, 2013.
Coalition of Ohio Land Trusts, Ohio Ecological Food and Farm Association, and Ohio State University Sustainable Agriculture Team. “The 2013
Ohio Sustainable Farm Tour and Workshop Series.” 2013.
Colyn, Joe. Originz, LLC and Sysco/H.A. Wallace Center. “Success for Family Farms Project.” Webinar for National Good Food Network. July
2009.
Common Market Philadelphia Website. December 2013.
Community Science. “SNAP Healthy Food Incentives Cluster Evaluation: 2013 Final Report.” December 2013.
Companies and Markets, "US Craft Beer Production Market to Reach $4.1 Billion." 2013.
Congressional Research Service, "The Role of Local Food Systems in U.S. Farm Policy." January 20, 2012.
Connelly, Karen. "Recipe For Success: Food-Based Startups Face Unique Challenges." freshwatercleveland.com (blog), October 10, 2013.
Coolidge, Alexander. Cincinnat!com. “Kroger execs talk deals, data and private labels.” October 30, 2013.
Council of Smaller Enterprises (COSE), "Energy Efficiency Program." 2014.
Countryside Conservancy. “Countryside Farmers’ Markets.” November 2013.
Craft Beer Analytics. “Beer Research and Insights.” Issue 2: April 2012.
Craft Brew Alliance. “Investor Presentation.” August 2013.
Crain’s Cleveland Business. “Crain’s Directory of NE Ohio’s Food Economy.” August 2013.
Crowell, Chris. Craft Brewing Business. “Craft beer distribution: Study the market, distributors, and your own operations.” September 10, 2013.
Crowell, Chris. Craft Brewing Business, "Craft Beer Market Strong, Getting Stronger Says Investment Bank Report." March 1, 2013.
Culinary Incubator, "The Source in Shared Part Time Commercial Kitchens." October 2013.
Cuyahoga County Board of Developmental Disabilities. “Growing in so many ways.” November 2013.
Day, Jennifer, Justin Dahlmeimer, and Jeffrey Schmedeke. St. Cloud Area Economic Development Partnership, "Central Minnesota Processed
Foods Industry Cluster Report." May 2010.
Deller, Steven, and David Williams. The University of Wisconsin-Extension, Cooperative Extension Program Areas of Agriculture and Natural
Resources, and Community, Natural Resource and Economic Development, "The Economic Impacts of Agriculture in Wisconsin Counties."
Sources Consulted
Sources Consulted

42
Hundreds of secondary resources were reviewed as part of
the asset inventory, market, and competitiveness analysis
Demeter Group Investment Bank. “Craft Beer Industry 2011 Mid-Year Review and Outlook.” 2011.
Demeter Group Investment Bank. “State of the Craft Beer Industry.” 2013.
Demeter Group Investment Bank. “State of the Spirits Industry.” 2013.
Demeter Group Investment Bank. “State of the Wine Industry.” 2013.
Demeter Group Investment Bank. “Why Craft Beer is Next.” April 25, 2013.
D’Innocenzio, Anne. Huffington Post Business. “Walmart to Purchase Produce Directly from Local Growers.” September 16, 2013.
Diamond Foods. “FY2013 Annual Report.” 2014.
Dunnhumby. “Consumer Centricity Index: US Food Service Retailers.” June 2013.
Durkay, Jocelyn. National Conference of State Legislatures, "State Energy Savings Performance Contracting." November 15, 2013.
Deschutes Brewery, "Sustainability." 2013.
Dsire: Database of State Incentives for Renewables and Efficiency, "Ohio Incentives/Policies for Renewables and Efficiency." February 18, 2014.
Eatwild.com. “Pastured Products Directory – Ohio.” November 2013.
Ecology Center. “Healthy Food in Health Care. Promising Approaches: A Food Prescription Presentation.” February 5, 2013.
Ecology Center Ann Arbor Michigan, "Signing the Pledge." October 2012.
Edible Cleveland Magazine. Summer 2013 Issue.
Energy Star Building Manual. "Financing." Chapter 4. 2007.
Eng, Dinah. Fortune Magazine. “Jim Koch: Samuel Adams’s Beer Revolutionary.” March 21, 2013.
EPD News “Sidebar: Sustainable Craft Brewers." October 3, 2013.
Fabulous Food Show: I-X Center, "Fabulous Food Show." 2013.
FamilyFarmed and the Wallace Center, "Webinar: The Business of Food Hubs: Planning Successful Regional Produce Aggregation Facilities."
November/December 2013.
FamilyFarmed, "Good Food Festival and Conference Chicago." 2013.
Farm to Consumer Foundation, "The Grand Splash of Craft Beer in America." July 18, 2013.
Farmanddairy.com. “Ohio Markets.” May 2013.
Farms Reach, "Building Regional Produce Supply Chains: Helping Farms Access & Sell to Multiple Channels, Helping Large Volume Buyers
Access Regional Foods.” August 2011.
Feast Local Food Network, "FEAST Local Food Network." 2013.
Fisk, John. "Starting A Food Hub: Successful Hubs Share Their Stories." Wallace Center at Winrock International Recorded May 16 2013. National
Good Food Network.
Fletcher Allen Health Care: In Alliance with the University of Vermont, "Fletcher Allen Wins National Awards for Sustainable Food Leadership."
October 11, 2011.
Flower Foods, "About Flowers Foods." 2014.
Sources Consulted
Sources Consulted
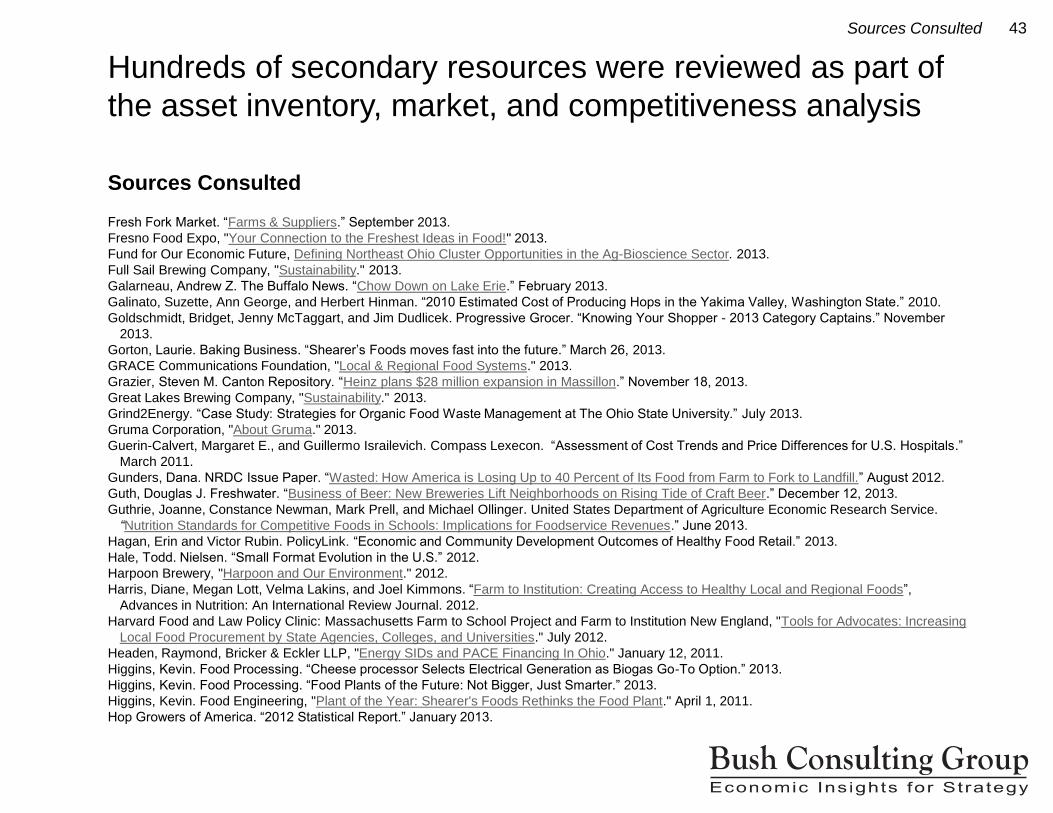
43
Hundreds of secondary resources were reviewed as part of
the asset inventory, market, and competitiveness analysis
Fresh Fork Market. “Farms & Suppliers.” September 2013.
Fresno Food Expo, "Your Connection to the Freshest Ideas in Food!" 2013.
Fund for Our Economic Future, Defining Northeast Ohio Cluster Opportunities in the Ag-Bioscience Sector. 2013.
Full Sail Brewing Company, "Sustainability." 2013.
Galarneau, Andrew Z. The Buffalo News. “Chow Down on Lake Erie.” February 2013.
Galinato, Suzette, Ann George, and Herbert Hinman. “2010 Estimated Cost of Producing Hops in the Yakima Valley, Washington State.” 2010.
Goldschmidt, Bridget, Jenny McTaggart, and Jim Dudlicek. Progressive Grocer. “Knowing Your Shopper - 2013 Category Captains.” November
2013.
Gorton, Laurie. Baking Business. “Shearer’s Foods moves fast into the future.” March 26, 2013.
GRACE Communications Foundation, "Local & Regional Food Systems." 2013.
Grazier, Steven M. Canton Repository. “Heinz plans $28 million expansion in Massillon.” November 18, 2013.
Great Lakes Brewing Company, "Sustainability." 2013.
Grind2Energy. “Case Study: Strategies for Organic Food Waste Management at The Ohio State University.” July 2013.
Gruma Corporation, "About Gruma." 2013.
Guerin-Calvert, Margaret E., and Guillermo Israilevich. Compass Lexecon. “Assessment of Cost Trends and Price Differences for U.S. Hospitals.”
March 2011.
Gunders, Dana. NRDC Issue Paper. “Wasted: How America is Losing Up to 40 Percent of Its Food from Farm to Fork to Landfill.” August 2012.
Guth, Douglas J. Freshwater. “Business of Beer: New Breweries Lift Neighborhoods on Rising Tide of Craft Beer.” December 12, 2013.
Guthrie, Joanne, Constance Newman, Mark Prell, and Michael Ollinger. United States Department of Agriculture Economic Research Service.
“Nutrition Standards for Competitive Foods in Schools: Implications for Foodservice Revenues.” June 2013.
Hagan, Erin and Victor Rubin. PolicyLink. “Economic and Community Development Outcomes of Healthy Food Retail.” 2013.
Hale, Todd. Nielsen. “Small Format Evolution in the U.S.” 2012.
Harpoon Brewery, "Harpoon and Our Environment." 2012.
Harris, Diane, Megan Lott, Velma Lakins, and Joel Kimmons. “Farm to Institution: Creating Access to Healthy Local and Regional Foods”,
Advances in Nutrition: An International Review Journal. 2012.
Harvard Food and Law Policy Clinic: Massachusetts Farm to School Project and Farm to Institution New England, "Tools for Advocates: Increasing
Local Food Procurement by State Agencies, Colleges, and Universities." July 2012.
Headen, Raymond, Bricker & Eckler LLP, "Energy SIDs and PACE Financing In Ohio." January 12, 2011.
Higgins, Kevin. Food Processing. “Cheese processor Selects Electrical Generation as Biogas Go-To Option.” 2013.
Higgins, Kevin. Food Processing. “Food Plants of the Future: Not Bigger, Just Smarter.” 2013.
Higgins, Kevin. Food Engineering, "Plant of the Year: Shearer's Foods Rethinks the Food Plant." April 1, 2011.
Hop Growers of America. “2012 Statistical Report.” January 2013.
Sources Consulted
Sources Consulted
44
Hundreds of secondary resources were reviewed as part of
the asset inventory, market, and competitiveness analysis
Hoovers, A D&B Company. Full Business Database. October 2013-March 2014.
Hudson Valley Economic Development Corporation, "Best Cheese Corporation Joins Hudson Valley Food & Beverage Alliance." May 1, 2012.
Huntrods, Diane. Agricultural Marketing Resource Center, "A National Information Resource for Value-Added Agriculture." April 2013.
IBISWorld. “BBQ Sauce Production in the US: Market Research Report.” December 2013.
IBISWorld. “Fruit and Vegetable Markets in the US: Market Research Report. March 2014.
IBISWorld. “Hot Sauce Production in the US: Market Research Report.” March 2014.
IBISWorld. “Pre-Made Salsa Production in the US: Market Research Report.” December 2012.
IBISWorld. “Seasoning, Sauce and Condiment Production in the US: Market Research Report.” December 2013.
Ingredients and Innovative Delivery Formats. “The Bar Market Is Blurring the Line Between Meals and Snacks.” October 2013.
Innovation Center for U.S. Dairy. “Welcome to Cleveland! Diverting Food Waste from Landfills to Produce Sustainable Energy and Natural
Fertilizer.” 2013.
Innovative Farmers of Ohio. “Annual Conference.” December 2013.
Inside Business. “2013 Weatherhead 100 – List.” December 2013.
International Markets Bureau. “Consumer Trends Salty Snack Food in the United States.” April 2011.
ISWM-TINOS. “Development and implementation of a demonstration system on Integrated Solid Waste Management for Tinos in line with the
Waste Framework Directive.” December 2011.
Joannides, Jan. Southern Minnesota Initiative Foundation and the McKnight Foundation, "Local Food Systems as Regional Economic Drivers in
Southern Minnesota." June 2012.
John Dunham and Associates and the Ohio Grocers Association. “The Grocery Retail Industry in Ohio – Impact Study.” March 2, 2011.
Johnson, Allen. The Columbus Dispatch, "Kasich Plans to Privatize Food Service at Prisons." February 8, 2013.
http://www.dispatch.com/content/stories/local/2013/02/08/kasich-plans-to-privatize-food-service-at-prisons.html.
Johnson, Renee, Randy Alison Aussenberg, and Tadlock Cowan. Congressional Research Service. “The Role of Local Food Systems in U.S. Farm
Policy.” March 12, 2013.
Jones, Lester. Beer Institute. “Beer Institute Research – Draft Beer Industry Update.” 2012.
Joseph Campione, "Authentic Hearth Baked Garlic Bread and Texas Toast." March 2014.
Kema Nut Company, "About Krema." 2014.
King, Robert P., et al. United States Department of Agriculture Economic Research Service. “Comparing the Structure, Size, and Performance of
Local and Mainstream Food Supply Chains.” ERS Report Number 99. June 2010.
KPMG LLP, "2013 Food and Beverage Industry Outlook Survey." 2013.
Kyle, Sharp. "Locally Grown Hops a Possibility for Ohio’s Booming Microbreweries." OSU Extension. September 7, 2012.
La Tortilla Factory, "Products." 2012.
Lagunitas Brewing Co. "No Farm. No Beer. From Volatile to Sustainable." 2013.
Sources Consulted
Sources Consulted

45
Hundreds of secondary resources were reviewed as part of
the asset inventory, market, and competitiveness analysis
Larrick, Don. Policy Research and Strategic Planning, Ohio Department of Development, "Gross Domestic Product From Ohio." August 2012.
Legislative Information Systems, "Senate Bill 58." 2014.
Lindsey, Timothy C. Illinois Department of Commerce and Economic Opportunity et al. “Building Successful Food Hubs: A Business Planning
Guide for Aggregating and Processing Local Food in Illinois.” January 2012.
Local Food Cleveland. “Local Food Guide.” May 2012.
Local Harvest Website. November 2013.
Local Roots Wooster. “Food Cooperative Producer Members.” October 2013.s
Mailler, Carl. American Farmland Trust and the Community Involved in Sustaining Agriculture. “Increasing Local Milk Processing Capacity: Benefits
to Pioneer Valley Consumers and Communities.” January 2011.
Major, Meg. Progressive Grocer. “Crunching the numbers.” 2013.
Major, Meg and Jim Dudlicek. Progressive Grocer. “Swirling Fortunes: While retail sales gains remain the focus of the main course, economic agita
simmers as grocers seek new ingredients to keep the pot steaming.” April 2013.
Maplehurst Bakeries, LLC, "Maplehurst Bakeries the Bakery Specialists." 2014.
Marketline Industry Profile, "Alcoholic Drinks in the United States." November 2013.
Marketline Industry Profile, "Baby Food in the United States." March 2013.
Marketline Industry Profile, “Beer in the United States.” August 2013.
Marketline Industry Profile, "Biscuits in the United States." March 2013.
Marketline Industry Profile, “Bread & Rolls in the United States.” August 2013.
Marketline Industry Profile, “Breakfast Cereals in the United States.” November 2013.
Marketline Industry Profile, "Canned Food in the United States." September 2013.
Marketline Industry Profile, "Chilled & Deli Food in the United States." August 2013.
Marketline Industry Profile, "Chocolate Confectionery in the United States." November 2013.
Marketline Industry Profile, "Dairy in the United States." September 2013.
Marketline Industry Profile, "Frozen Food in the United States." September 2013.
Marketline Industry Profile, "Ice Cream in the United States." January 2013.
Marketline Industry Profile, "Meat in the United States." January 2012.
Marketline Industry Profile, "Meat, Fish & Poultry in the United States." February 2013.
Marketline Industry Profile, "Milk in the United States." September 2013.
Marketline Industry Profile, "Organic Food in the United States." November 2012.
Marketline Industry Profile, "Potato Chips in the United States." August 2013.
Marketline Industry Profile, "Ready Meals in the United States." February 2013.
Marketline Industry Profile, "Savory Snacks in the United States." October 2013.
Sources Consulted
Sources Consulted
46
Hundreds of secondary resources were reviewed as part of
the asset inventory, market, and competitiveness analysis
Masanet, Eric, Peter Therkelsen, and Ernst Worrell. Ernest Orlando Lawrence Berkeley National Laboratory. “Energy Efficiency Improvement and
Cost Saving Opportunities for the Baking Industry.” December 2012.
Masi, Brad, Leslie Schaller, and Michael Shuman. Cleveland Foundation, ParkWorks, Kent State University Cleveland Urban Design Collaborative,
Neighborhood Progress Inc., and Cleveland-Cuyahoga County Food Policy Coalition, "THE 25% SHIFT The Benefits of Food Localization for
Northeast Ohio & How to Realize Them." December 2010.
Matts, Colleen, and Susan Schmidt. W. K. Kellogg Foundation Food & Community Program, "Institutional Food Purchasing: Michigan Good Food
Work Group Report Series." November 2010.
McCafferty, Rachel Abbey. Crain’s Cleveland Business. “Nestle USA to move pizza operations, 250 jobs to Solon.” October 30, 2013.
McFee, Michelle Jarboe. The Plain Dealer. “Walmart Supercenter in South Euclid aims to be retail giant’s first LEED-certified store.” October 17,
2013.
McLaughlin, Katy. Wall Street Journal Online. “Micro-Bakeries Offer Bread That’s Truly Fresh.” August 16, 2013.
Menashe, Jeff. Demeter Group, "State of the Craft Beer Industry 2013." 2013.
Meridian Pint, "About." 2013.
Meter, Ken. Crossroads Resource Center. “Ohio’s Food Systems – Farms At The Heart of It All.” March 30, 2011.
Metzger, Scott. The New Brewer. “What Does Your Beer Really Cost? Establishing an Effective Beer Costing Program in the Brewpub.”
January/February 2012.
Miller, Jay. Crain’s Cleveland Business. “Anatomy of a deal: Move of Nestle USA’s pizza division to Solon took thousands of hours of work.”
December 8, 2013.
Miller, Jay. Crain’s Cleveland Business. “Nestle keeps adding to Northeast Ohio empire.” December 8, 2013.
Mintel Group, Ltd., "Ice Cream and Frozen Novelties - US - July 2012.“
Nathan, Jason. Dunnhumby. “Ranging: The Economics of Customer-Oriented Product Ranging Decisions.” 2013.
National Center for Chronic Disease Prevention and Health Promotion, "The CDC Guide to Strategies to Increase the Consumption of Fruits and
Vegetables." 2012.
National Good Food Network. “Food Hub Center.” October 2013.
National Good Food Network. “Towards Local and Regional Sourcing: Chipotle and Sysco.” 2009.
National Institute for Animal Agriculture. White Paper. “Living in a World of Decreasing Resources and Increasing Regulation: How to Advance
Animal Agriculture.” March 2012.
National Restaurant Association. “2013 Restaurant Industry Pocket Factbook.” 2013.
National Restaurant Association. “Ohio: Restaurant Industry at a Glance.” 2013.
National Sustainable Agriculture Coalition. “2014 Farm Bill Drilldown: Local and Regional Food Systems, Healthy Food Access, and Rural
Development.” February 2014.
National Sustainable Agriculture Coalition. “Guide to USDA Funding for Local and Regional Food Systems.” First edition, April 2010.
Sources Consulted
Sources Consulted

47
Hundreds of secondary resources were reviewed as part of
the asset inventory, market, and competitiveness analysis
National University System Institute for Policy Research, "The Economic Impact of Craft Breweries in San Diego." 2012.
Natoli, Cori Anne. The (Wilmington, Del.) News Journal. “Wonder bread back on store shelves.” October 6, 2013.
Neiburg, Oliver. Bakery and Snacks, "Bimbo Bakeries to Build $75 M Factory in US." May 12, 2012.
NEO Advanced Energy District, "PACE." 2010.
New America Foundation – Markets, Enterprise, and Resiliency Initiative. “A King of Beers? Concentration of Power Over America’s Alcohol
Markets Is Bad for Consumers. It also Imperils Constitutional and Moral Balances.” December 2012.
New Belgium Brewing Company, "Sustainability." 2013.
New England Food Show, "New England Food Show Expo." 2013.
New Glarus Brewing Company Website. 2013.
New Seasons Market, "Our Story." 2014.
New Yorker, “Mapping the Rise of Craft Beer." March 2014.
Nielsen Product Data for Cleveland Region, Groceries larger than $2MM in Annual Revenue. November 2012-November 2013.
North Union Farmers Market. “About Our Markets.” November 2013.
Northern Nut Grower's Association, Inc. Website. September 7, 2013.
Northwest Food Processors Association, "History." 2013.
Northwest Food Processors Association, "NW Food Processors Expo and Conference." 2013.
Nutra Ingredients. “Top Selling Nutrition Bar Beats Giants.” November 01, 2001.
Ohio Craft Brewers Association. "The Official Site of the Ohio Craft Brewers Association." 2013.
Ohio Dairy Association. "Ohio’s Dairy Industry: An Essential Part of Our State’s Success." April 23, 2013.
Ohio Dairy Industry Online Resources Center. “Milk Haulers and Processers.” May 2012.
Ohio Development Services Agency, "Advanced Energy and Efficiency Programs." February 18, 2014.
Ohio Development Services Agency, "Advanced Energy and Efficiency Programs for Manufacturers." February 18, 2014.
Ohio Development Services Agency. "Energy Loan Fund." October 2013.
Ohio Department of Agriculture. “2010 Annual Report.” 2010.
Ohio Department of Agriculture. “2011 Annual Report.” 2011.
Ohio Department of Agriculture. “Ohio Aquaculture Industry Analysis.” 2010.
Ohio Department of Agriculture. “Office of Farmland Preservation Annual Report.” July 2012.
Ohio Department of Development and Ohio Department of Agriculture. “Ohio Agriculture and Food Processing Industry.” September 2012.
Ohio Department of Education. “School Funding by District.” 2013.
Ohio Department of Health, "Ohio Hospital Compare." July 6, 2011.
Ohio Ecological Food and Farm Association. “Good Earth Guide to Organic and Ecological Farms, Gardens and Related Businesses.” November
2013.
Sources Consulted
Sources Consulted

48
Hundreds of secondary resources were reviewed as part of
the asset inventory, market, and competitiveness analysis
Ohio Environmental Protection Agency, "Siting Criteria." August 2006.
Ohio Environmental Protection Agency, "State Composting Regulations." July 2013.
Ohio Environmental Protection Agency Division of Materials and Waste Management, "Odor Management Practices For Composting Facilities."
September 1999.
Ohio Environmental Protection Agency Division of Materials and Waste Management, "Ohio Food Scraps Composting Facilities." July 2012.
Ohio Farm Bureau. “Our Ohio Buying Local Directory.” September 2013.
Ohio Grape Industries Committee and MFK Research, LLC. “The Economic Impact of Wine and Winegrapes in the State of Ohio 2008.” 2008.
Ohio MarketMaker Website. November 2013.
Ohio Revised Code, "Chapter 6111: Water Pollution Control." October 2013.
Ohio State University Extension – Cuyahoga County. “Produce Perks.” April 2014.
Ohio Third Frontier. “Current Programs.” November 2013.
Ohio University, "Ohio University to Save an Estimated $38 Million Through Energy Performance Contract with Constellation”. September 27, 2014.
Ohio's Quarterly Census of Employment and Wages, 2007 and 2012 quarter 1
Organic Seed Alliance. “Seed Producers Database.” November 2013.
Owens, Nora, and Kelly Verel. Project for Public Spaces and Wholesome Wave, "SNAP/EBT at Your Farmers Market: Seven Steps to Success."
July 2010.
PACE Now, "Financing Energy Efficiency." 2012.
Pennsylvania Association for Sustainable Agriculture, "Pennsylvania Buy Fresh/Buy Local." 2013.
Pennsylvania Association for Sustainable Agriculture. Passages: Sustainable Food and Farming Systems. “The PASA Model Defined.” July/August
2012.
Pepperidge Farm, Inc., "Frozen Bread and Rolls." 2013.
Perez, Agnes and Kristy Plattner. United States Department of Agriculture Economic Research Service. “Fruit and Tree Nuts Outlook.” July 26,
2013.
Port of Cleveland, "Development Finance: Financing for Manufacturers." February 18, 2014.
PRNewswire, "Technomic to Explore Craft Beer and Cider Opportunity in Restaurants and Bars." November 21, 2013.
Progressive Grocer, "Crunching the Numbers." April 2011.
Project for Public Spaces and Wholesome Wave. “SNAP/EBT at Your Farmers Market: Seven Steps to Success.” July 2010.
PRWeb Online Visibility from Vocus, "Strong Pour: Craft Beer Production in the US Industry Market Research Report Now Available from
IBISWorld." February 11, 2014.
QSR Magazine, “Quick-Service Industry to Grow by 4.9 Percent in 2013.” December 11, 2012.
Reid, Neil and Michael C. Carroll. “Using Cluster-Based Economic Development to Enhance the Economic Competitiveness of Northwest Ohio’s
Greenhouse Nursery Industry.” 2009.
Sources Consulted
Sources Consulted

49
Hundreds of secondary resources were reviewed as part of
the asset inventory, market, and competitiveness analysis
Reinvestment Fund, The. “Understanding the Grocery Industry.” September 30, 2011.
Research and Markets, "Craft Beer Market in the US 2012-2016." August 01, 2013. Accessed 09/13/2013.
Research and Markets, "Craft Beer Market in the US 2012-2016." August 2013.
Research and Markets, "Ice Cream in the United States: Forecasts to 2016." April 11, 2013.
Researchmoz, "Craft Beer Market in the US 2012-2016." October 30, 2013.
Restaurant Hospitality. “Technomic: 10 Trends to Watch.” November 14, 2013.
Risley Schroeder, Alex. Massachusetts Workforce Alliance, "Local Food, Local Jobs: Job Growth and Creation in the Pioneer Valley Food System."
February 2013.
Robson, James. Cheese Market News. “Formula for the Future: Understanding the Growing Specialty Cheese Market.” March 16, 2012.
Rochester Institute of Technology, "Finger Lakes Food Processing Cluster Initiative." March 2013.
Rose, Maryanne. Restaurant Hospitalityl “10 tips to manage commodity cost swings.” August 8, 2012.
Rowe, Audrey. USDA Blog, "Expanding SNAP Farmers Market Access through Innovative Partnerships.” January 2014.
Rushing, John E. Department of Food Science. “Choosing and Using a Copacker.” October 2013.
Runyon, Luke. The Salt. “Forget Golf Courses: Subdivisions Draw Residents with Farms.” December 17, 2013.
Sanner, Anne. Seattle Times, "Prisons Look to Share Food Costs with Ohio State." March 25, 2011.
Scott-Thomas, Caroline. Food Navigator-USA, "US Ice Cream and Frozen Desert Market Tops $25bn." May 07, 2012.
Shearer’s. “Shearer Perfection: Innovation, expansion, and teamwork keep the company focused on its vision.” Fall 2011.
Shuman, Michael, Alissa Barron, and Wendy Wasserman. Wallace Center at Winrock International. “Community Food Enterprise: Local Success in
a Global Marketplace.” 2009.
Sierra Nevada Brewing Co., "Sustainability." 2013.
Slama, Jim, & Nyquist, Kathy. "Webinar: The Business of Food Hubs: Planning Successful Regional Produce Aggregation Facilities." Wallace
Center at Winrock International and the Business Alliance for Local Living Economies. Web Southeast Regional Fruit and Vegetable Conference,
"Southeast Regional Fruit and Vegetable Conference." 2013.
Slama, Jim, and Kathy Nyquist. FamilyFarmed and the Wallace Center, "Local Food System Assessment for Northern Virginia." August 2010.
Slow Food Northern Ohio Website. November 2013.
Smith, Chad. Ohio Development Services Agency, "Office of Energy: Technical and Financial Resources." October 2013.
Snack Food and Wholesale Bakery, "General Mills Nutritionally Improves Nearly Three-Quarters of Its U.S. Retail Sales Volume." November 6,
2013.
Snook, Debbi. The Plain Dealer at Cleveland.com. “Places selling pierogi available all year.” March 24, 2010.
Snook, Debbi. The Plain Dealer at Cleveland.com. “Tortilleria La Bamba satisfies Cleveland’s hunger for freshly made tortillas.” March 23, 2011.
Sodexo, "Sodexo’s Better Tomorrow Commitment to Local Sourcing." 2013.
Sporleder, Thomas L. “NEOHFOOD: A Northeast Ohio Food Industries Input-Output Model.” Version 1.0, December 2007.
Sources Consulted
Sources Consulted

50
Hundreds of secondary resources were reviewed as part of
the asset inventory, market, and competitiveness analysis
Sporleder, Thomas L. “OHFOOD: An Ohio Food Industries Input-Output Model.” Version 6.0, June 2003.
Standing Stone Brewery Co., "Sustainability." 2013.
State Board of Equalization, "Dining and Beverage Industry." July 2012.
Statistica: The Statistics Portal, "Sales of the Leading 10 Snack Nuts Brands Of the United States in 2012 (In Million U.S. Dollars)." 2014.
Stoessel, Eric. Restaurant Hospitality. “Local, local, and more local top NRA’s 2014 trends.” December 3, 2013.
Sustainable Cleveland 2019. “Action and Resources Guide: Building an Economic Engine to Empower a Green City on a Blue Lake.” September 8,
2010.
Swenson, Dave. Department of Economics, Iowa State University. “Selected Measures of Economic Values of Increased Fruit and Vegetable
Production and Consumption in the Upper Midwest.” March 2010.
Sysco Corporation. 2011 Sustainability Report. “Our Values: We do what is right to serve our customers, associates, investors and society.” 2011.
Taxel, Laura. Cleveland Magazine. “Hatching New Plans and Players.” May 29, 2013.
Technomic, Inc., "Technomic Top 15 Power Distributors." January 2014.
Technomic, Inc., "U.S. Foodservice Industry Forecast." January 2014.
Theiss, Evelyn. The Plain Dealer. “Cleveland-made Good Greens nutrition bars take off.” November 19, 2012.
Time Out New York, "New Beer Trends: Suds Experts Forecast Brew Guzzling For 2013." February 12, 2013.
Toops, Diane. Food Processing, "Snacking Could Be the Future of Eating Consumer Time and Health Push Snack Foods to the Forefront for Many
Packaged-Food Companies.” 2012.
Trattner, Douglas. Freshwater Cleveland. “La Bamba Tortilleria Cooks Up Fresh Tortillas, Local Jobs.” (Blog), December 2, 2010.
Tri-State Food Expo, "The Tradeshow for Tri-State Foodservice & Retail Professionals." 2013.
Trophy Nut, "About Trophy Nut." 2014.
United States Bureau of Labor Statistics. “Table 1800. Region of residence: Annual expenditure means, shares, standard errors, and coefficient of
variation, Consumer Expenditure Survey.” 2012.
United States Census Bureau, "Advanced Monthly Sales for Retail and Food Services." November 2013.
United States Census Bureau. “American FactFinder – Annual Population Estimates.” July 2013.
United States Census Bureau, "The 2012 Economic Census." 2013.
United States Department of Agriculture, "Choose My Plate." 2014.
United States Department of Agriculture, "Determining Product Eligibility for Purchase with SNAP Benefits." January 26, 2010.
United States Department of Agriculture, "EBT Learn About SNAP Benefits at Farmers' Markets." December 2013.
United States Department of Agriculture. “Farm Family Income.” September 2013.
United States Department of Agriculture. “Farmers Markets Search.” November 2014.
United States Department of Agriculture. “Grains & Oilseeds Outlook.” February 22, 2013.
United States Department of Agriculture. “Regional Food Hub Resource Guide.” April 2012.
Sources Consulted
Sources Consulted

51
Hundreds of secondary resources were reviewed as part of
the asset inventory, market, and competitiveness analysis
United States Department of Agriculture, "Retail Store Eligibility USDA Supplemental Nutrition Assistance Program." 2013.
United States Department of Agriculture, "Rural Cooperatives: Growing a Cleveland Renaissance." November/December 2013.
United States Department of Agriculture, "Supplemental Nutrition Assistance Program (SNAP) Eligible Food Items." March 2014.
United States Department of Agriculture, "Supplemental Nutrition Assistance Program (SNAP) Electronic Benefits Transfer (EBT) Fact Sheet for
New Retailers." July 2013.
United States Department of Agriculture, Agricultural Marketing Service. “World Agricultural Supply and Demand Estimates. WASDE – 523.
November 8, 2013.
United States Department of Agriculture, Economic Research Service. “Food Expenditure Data.” Tables 1-4; 14-15; and 36. February 2014.
United States Department of Agriculture, Economic Research Service. “Meat Price Spreads.” May 2014.
United States Department of Agriculture, Economic Research Service, "National School Lunch Program." July 23, 2013.
United States Department of Agriculture Economic Research Service. “Price Spreads from Farm to Consumer.” April 2014.
United States Department of Agriculture, Food and Nutrition Service, "Data and Statistics." 2013.
United States Department of Energy, "Advanced Manufacturing Office: Industrial Assessment Centers (IACs)." February 8, 2013.
United States Department of Energy: Energy Efficiency and Renewable Energy, "Building Technologies Program." 2014.
United States Department of Energy, "Industrial Assessment Centers Database." April 26, 2012.
United States Department of Energy, "Industrial Assessment Centers Field Manager: IAC Case Studies-Eaton Corporation." 2013.
United States Environmental Protection Agency, "Permitting Practices for Co-digestion Anaerobic Digester Systems." 2013.
University of New Mexico Sustainability Studies, "Local Food Festival and Field Day." October 13, 2013.
University of Purdue, "Office of University Sustainability: Food Systems." 2013.
University of Toledo Urban Affairs Center. “Sustainability Family Style: Documenting the Lives of Growers, Gardeners, and Family Farmers in
Northwest Ohio.” July 2009.
University of Wisconsin, "What Works for Health: Policies and Programs to Improve Wisconsin's Health." June 11, 2013.
Upland Brewing Company, "Team Upland Sustainable Cycling." 2013.
US Food and Drug Administration, "Guidance for Industry: A Food Labeling Guide." January 2013.
USASpending.gov Website. Accessed November 11, 2013.
Vanac, Mary. The Columbus Dispatch. “Colorado brewer New Belgium to roll Fat Tire, other craft beers into Ohio.” November 6, 2013.
Vanac, Mary. The Columbus Dispatch. “Researchers have high hopes for hops grown in Ohio.” June 23, 2013.
Vibrant NEO 2040. “NEO Regional Assets.” November 2013.
Victory Brewing Company, "Victory for the Environment: Green Initiatives." 2013.
Washington Artisan Cheesemakers Festival, "Washington Artisan Cheesemakers Festival." October 2013.
West Virginia Food and Farm Coalition, "Local Food Expo gets "Thumbs Up;" Huntington Buyer Grower Directory released." October 23, 2013.
West Side Market. “Market Vendors.” November 2013.
Sources Consulted
Sources Consulted

52
In addition to sources listed here, thousands of company websites were reviewed as a part of vetting
commercial organizations for inclusion in the asset inventory. It is impractical to list them all in this report, but
they are included in the asset inventory database on file with the Cleveland-Cuyahoga County Food Policy
Coalition.
Hundreds of secondary resources were reviewed as part of
the asset inventory, market, and competitiveness analysis
Western Montana Grower's Cooperative, "About." 2013.
Wholesome Wave, "Double Value Coupon Program: The Double Value Coupon Program Provides Consumers With Incentives That Match The
Value Of Their Federal Nutrition Benefits When Used To Purchase Fresh, Local Produce At Participating Farm-To-Retail Venues." 2013.
Wholesome Wave, "Maryland Hunger Solutions and Appalachian Sustainable Development win Wholesome Wave Partner Media Challenge." April
2012.
Wright, Kevin. CraftBeer.com. “Getting a Boot in the Brewhouse Door.” November 2012.
Wyatt, Sally Lyons. Symphony IRIGroup. “State of the Snack Industry.” 2013.
Sources Consulted
Sources Consulted
Related Documents