i Developing a participatory approach to the management of fishing activity in UK Marine Protected Areas WORKSHOP 3B – NORWICH – OUTPUTS - DRAFT

Welcome message from author
This document is posted to help you gain knowledge. Please leave a comment to let me know what you think about it! Share it to your friends and learn new things together.
Transcript
i
Developing a participatory approach to the management of fishing activity in UK Marine Protected Areas WORKSHOP 3B – NORWICH – OUTPUTS - DRAFT

ii
NFFO/JNCC Developing a participatory approach to the management of fishing activity in UK Marine Protected Areas Workshop 3b - Norwich - Outputs
VERSION DATE VERSION SUMMARY APPROVALS
RO V1 Principal authors: Anna Bullen
Approved by: Gerard Couper
R1 V2 Incorporating comments from project partners and stakeholders
Approved by: Anna Bullen
R2 Approved by:
R3 Approved by:
FOR DIRECT ENQUIRIES ABOUT THIS PROPOSAL: Dr Anna Bullen Partner CAG CONSULTANTS Mob: 07495 031247 Email: [email protected]
TO CONTACT CAG CONSULTANTS: CAG CONSULTANTS 150 Minories London EC3N 1LS Tel: 020 8555 6126 Fax: 020 7900 1868 [email protected] www.cagconsultants.co.uk
iii
CONTENTS
CONTENTS ........................................................................................................................................ iii
1 Introduction .......................................................................................................................... 1
1.1 Our approach .................................................................................................................... 1
1.2 Report structure ............................................................................................................... 1
2 Workshop participants .......................................................................................................... 2
3 Review of Model Scenarios ................................................................................................... 3
3.1 Scenario 1 ......................................................................................................................... 5
3.2 Scenario 2a ....................................................................................................................... 6
3.3 Scenario 2b ....................................................................................................................... 8
3.4 Scenario 3 ....................................................................................................................... 10
3.5 Scenario 4 ....................................................................................................................... 10
3.6 General comments about the model ............................................................................... 11
3.6.1 Other useful outputs to be considered ........................................................................ 12
3.6.2 Limitations of the model ............................................................................................. 13
3.6.3 Alternative uses of the model ..................................................................................... 13
4 Triggers for a management review ...................................................................................... 15
4.1 What other factors might trigger a review? ..................................................................... 15
4.1.1 What else could potentially trigger management review? ........................................... 16
4.1.2 Additional points to consider for triggers .................................................................... 16
4.2 How might stakeholders inform the ecological based review process? ............................ 18
5 Developing a governance framework for adaptive management ......................................... 20
5.1 Key discussion points ...................................................................................................... 21
5.2 North Norfolk Sandbanks Saturn Reef case study preferred option ................................. 21
5.2.1 A decentralised approach in NNSSR ............................................................................ 22
6 References .......................................................................................................................... 25
Appendix 1 Governance options ........................................................................................................ 1
1
1 Introduction A multi stakeholder workshop was held on 13th June 2019 in Norwich to bring together the project partners and North Norfolk Sandbank and Saturn Reef (NNSSR) SAC regional stakeholders to further the project process.
The primary aims of the workshop were to:
• Bring regional stakeholders together to design participatory management of MPAs • Further develop the proposed MPA management toolkit; • Consider the outcomes for the scenario modelling; • Consider triggers for a management review; • Develop a governance framework for adaptive management.
1.1 Our approach The outputs were gained through a series of presentations that were followed by discussion sessions, whereby questions were posed and discussed in detail, led by independent facilitators. Representatives from the project partners were part of the discussion groups, available to answer project specific and regulation questions.
The outputs of the workshop are summarised in this report. They will be used in the development of the final national workshops, within the project itself and to inform the wider process in developing participatory management of MPAs.
1.2 Report structure Section 2 of this report provides details of the workshop participants. The remainder of the report is set out according to the workshop sessions and specific questions asked and presents key discussion points. This report is not an analysis of the outputs but a representation of everyone’s input to the discussion, whilst also highlighting key themes that arose from those discussions.

2
2 Workshop participants
Figure 1 Workshop participants
Name Organisation Stakeholder category
Fishing industry
Conservation / NGO
Scientific / research
Other industry
Regulator
Project partners
Louisa Jones JNCC X
Declan Tobin JNCC X
Lowri Evans Bangor University X
Jan Hiddink Bangor University X
Viv Roberts Marine Management Organisation
X
Mike Quigley Natural England X
Dale Rodmell NFFO X
Project Advisory Group
David Reeves DEFRA X
Stakeholders
Euan Dunn RSPB X
John Hiskett North Norfolk Wildlife Trust
X
Sam Lew Wash & North Norfolk Marine Partnership
X X X X X
Stephen Thompson Eastern IFCA X
3
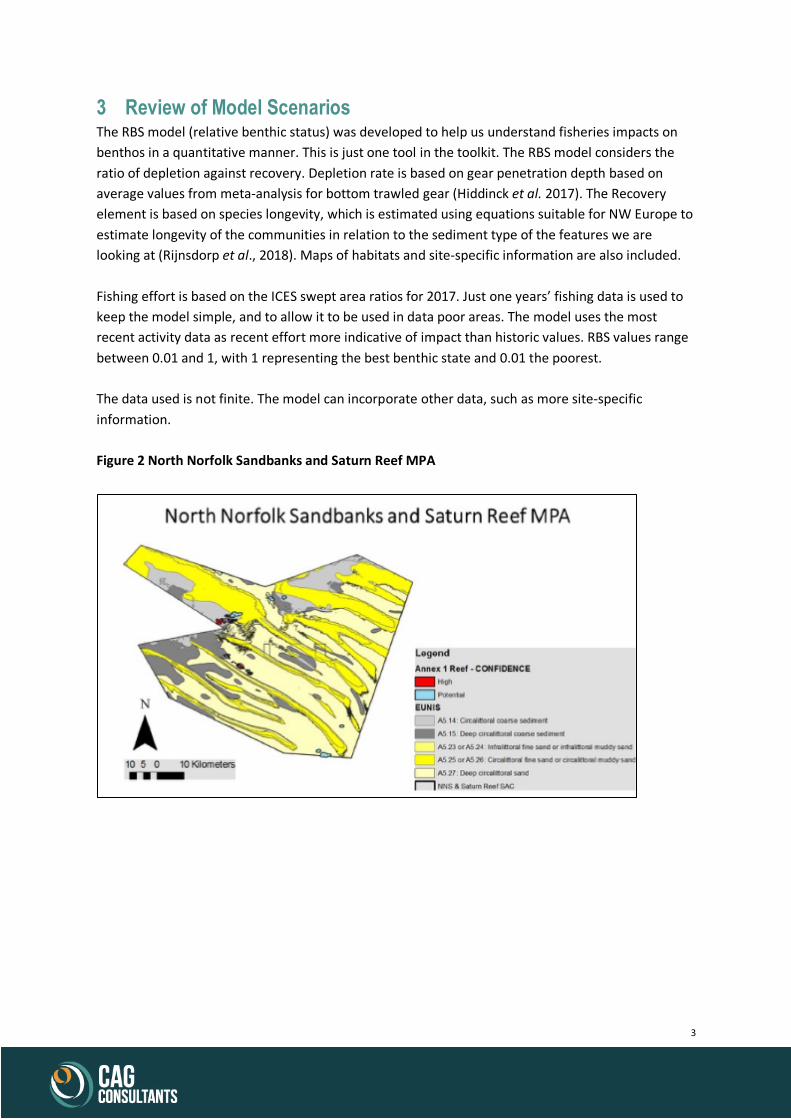
3 Review of Model Scenarios The RBS model (relative benthic status) was developed to help us understand fisheries impacts on benthos in a quantitative manner. This is just one tool in the toolkit. The RBS model considers the ratio of depletion against recovery. Depletion rate is based on gear penetration depth based on average values from meta-analysis for bottom trawled gear (Hiddinck et al. 2017). The Recovery element is based on species longevity, which is estimated using equations suitable for NW Europe to estimate longevity of the communities in relation to the sediment type of the features we are looking at (Rijnsdorp et al., 2018). Maps of habitats and site-specific information are also included. Fishing effort is based on the ICES swept area ratios for 2017. Just one years’ fishing data is used to keep the model simple, and to allow it to be used in data poor areas. The model uses the most recent activity data as recent effort more indicative of impact than historic values. RBS values range between 0.01 and 1, with 1 representing the best benthic state and 0.01 the poorest. The data used is not finite. The model can incorporate other data, such as more site-specific information. Figure 2 North Norfolk Sandbanks and Saturn Reef MPA

4
Figure 3 The conservation objectives for the North Norfolk Sandbanks and Saturn Reef SAC
Conservation Advice for North Norfolk Sandbanks and Saturn Reef SAC is available here. The Supplementary Advice on Conservation Objectives (SACO) provide the finer detail on whether the attributes of protected features should be restored or maintained. Figure 4 Relative Benthic Status

5
3.1 Scenario 1 Figure 5 Scenario 1: Gear modification
Grid size of VMS data used is the standard 0.05° x 0.05°. An overall decrease in RBS is observed in this scenario. The current status quo with regards to gear usage within the MPA is 70% pulse trawling and 30% traditional beam trawling. In order to understand what gear modifications may change within model outputs, the task for this scenario was to replace the pulse trawling effort with the traditional beam trawling effort, thereby the ‘after scenario’ being 100% of the fishing effort from the traditional beam trawl. Gear modification within the RBS model was conducted by modifying the depletion values within the equation. Depletion was calculated initially by the 70:30 fishing effort distribution, and after by the 100% traditional beam trawl. Dale Rodmell supplied penetration depth of a conventional beam trawl and a pulse wing beam trawl which was used to calculate the altered depletion value based on Hiddink et al., 2017. The scenario only includes the physical impacts of the gear e.g. pulse trawl electromagnetic effects are not included. The scenario was provided to highlight the positive effects of gear modifications. It can highlight the implications from management decisions and is useful to view the benthic pressures. The simplistic binary positive/negative change metric may bias the observer’s judgement of the extent of change in the Before-After map. It was suggested that the outputs could be more nuanced by using quartiles instead of positive/negative. It was noted that because we can chart the change in fishing behaviour within the site (from pulse trawling to traditional beam trawl) we could also use this scenario to predict the scale of change since swapping gears. We could also predict what the likely environmental response of the pulse ban might be. The scenario demonstrates the estimated change since pulse trawling has been introduced- 70% of fleet were noted as pulse trawl in 2017. Current data shows 2015 information. The condition in the site could be better now considering pulse trawling is used more than benthic

6
trawling, but there is a lack of data to show this. We might see more movement to fly shooting (seine netting) or move back to traditional beam trawling (use of chain mats may also be a popular choice). It would be possible to predict the effect on RBS of both potential outcomes using the model. The scenario output is considered useful as it still underlines the importance of gear modification as mitigation and could show the proportion of change that would bring change to the feature condition. Scenarios can help test changes to management in future and show their limitations. It is difficult to define and bench mark gear types, there can be a number of small scale modifications still considered the same gear type, which could have differing impacts. This information would be needed to assess the range of impacts. In establishing the Conservation Objective for the sites, SNCBs need to make general assumptions on the types of gear used within the site because fine scale information (e.g. whether they used pulse or standard beam trawl gear) was not captured in the standard gear coding. We still have to make generalised assumptions around impacts unless new and more accurate data becomes available. When iVMS comes in could there be a possibility to declare what gear type is used most of the time through a registration process? In order for this scenario to work gear modification must be made compulsory.
3.2 Scenario 2a Scenarios 2a and 2b do not factor in displacement. It is assumed that there is no displacement from the closed areas, the activity simply stops in these areas and remains the same in areas outside the closed sections. Figure 6 Scenario 2a Spatial Zoning – English proposal
This scenario is based on the current management proposal. There is a positive change in RBS within the closed areas. It was noted that it takes time to reach equilibrium state (e.g. stable community size structures etc) so despite the fact that RBS may be increasing, it can still take a long time to

7
return to a pristine-like state and benefits will be accrued through time. Features will also recover at varying speeds. Resources such as the Marine Evidence based Sensitivity Assessments (MarESA) may provide additional information on the recoverability of key species and/or biotopes in the feature. The Conservation Advice package provides this information on a site basis. The Conservation Objectives (set at a feature attribute level) use a vulnerability assessment approach, taking account of species sensitivity and exposure to pressures. This approach is not quantitative and uses expert judgement, but in lieu of more accurate data it is the best we currently have. If there are still some areas of high sensitivity exposed to an impacting level of activity within the site, then the conservation objective would remain ‘restore’ – use of precautionary approach. So, by protecting a small area it may not have an impact on our view of feature condition (i.e. it could still be unfavourable). The model was thought to provide more confidence as it is based on a quantitative approach. In the summary figures there is not a huge change in RBS considering the large area proposed for closure, however it is worth noting that for Reef there is a 20% increase in biomass, which when considered it is across the entire site is a significant increase. Sandbanks RBS hasn’t changed significantly because sandbanks within the site under the closed areas were closer to an unfished state and so removing fishing doesn’t result in a significant change. Also, the current summary figures do not account for any change in RBS for Sandbanks within the closed areas (as it was assumed these areas were only closed for Reef). Caveats to be associated with the model include the difficulty in detecting change and accounting for natural change in areas, especially when considering the ephemeral nature of Sabellaria
spinulosa reef. This scenario takes into account the relevance of closing areas which are currently fished quite lightly, a useful tool to select the least impacting options for better buy-in and consensus. It would be interesting to look at fishing activity in the surrounding area, outside the site, and consider relative displacement potential. An accurate capture of displacement effects would be critical to any assessment of management effectiveness. The use of a more participatory process for management might enable fishermen to inform how effort may be displaced in response to management. This information could be presented in the map, it would be difficult to model this kind of data due to high level of presumptions / unknowns. Paper on displacement using ICES rectangle scale (Greenstreet et al., 2009). Some issues with the model output maps were noted regarding the differences in pattern between before and after which didn’t make sense. This was thought to be a presentational error in not ensuring the colour schemes for legend were consistent across all maps. A corrected version of the after plot is present in Figure 7.

8
Figure 7 Scenario 2a- Modified ‘After’ plot post-workshop
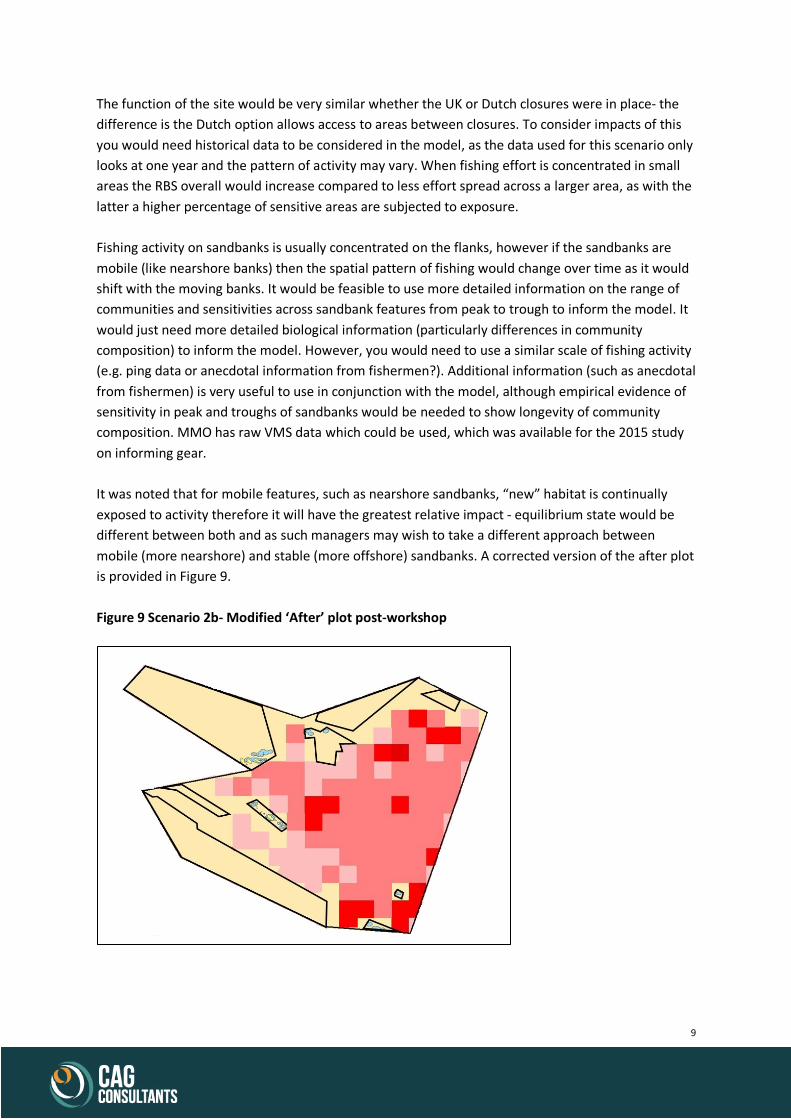
3.3 Scenario 2b Figure 8 Scenario 2b Spatial Zoning – Dutch proposal
As this scenario output was very similar to 2a the maps in 2b show an alternative way of presenting the information by removing areas of cells that crossed the closure boundary. So, the proportion RBS scores are considered providing a finer scale of detail for the results. The spaces between the Dutch closures showed very negligible change and as a large proportion of the cell was within the closure it was considered as an overall increase to RBS.
9
The function of the site would be very similar whether the UK or Dutch closures were in place- the difference is the Dutch option allows access to areas between closures. To consider impacts of this you would need historical data to be considered in the model, as the data used for this scenario only looks at one year and the pattern of activity may vary. When fishing effort is concentrated in small areas the RBS overall would increase compared to less effort spread across a larger area, as with the latter a higher percentage of sensitive areas are subjected to exposure. Fishing activity on sandbanks is usually concentrated on the flanks, however if the sandbanks are mobile (like nearshore banks) then the spatial pattern of fishing would change over time as it would shift with the moving banks. It would be feasible to use more detailed information on the range of communities and sensitivities across sandbank features from peak to trough to inform the model. It would just need more detailed biological information (particularly differences in community composition) to inform the model. However, you would need to use a similar scale of fishing activity (e.g. ping data or anecdotal information from fishermen?). Additional information (such as anecdotal from fishermen) is very useful to use in conjunction with the model, although empirical evidence of sensitivity in peak and troughs of sandbanks would be needed to show longevity of community composition. MMO has raw VMS data which could be used, which was available for the 2015 study on informing gear. It was noted that for mobile features, such as nearshore sandbanks, “new” habitat is continually exposed to activity therefore it will have the greatest relative impact - equilibrium state would be different between both and as such managers may wish to take a different approach between mobile (more nearshore) and stable (more offshore) sandbanks. A corrected version of the after plot is provided in Figure 9. Figure 9 Scenario 2b- Modified ‘After’ plot post-workshop
10
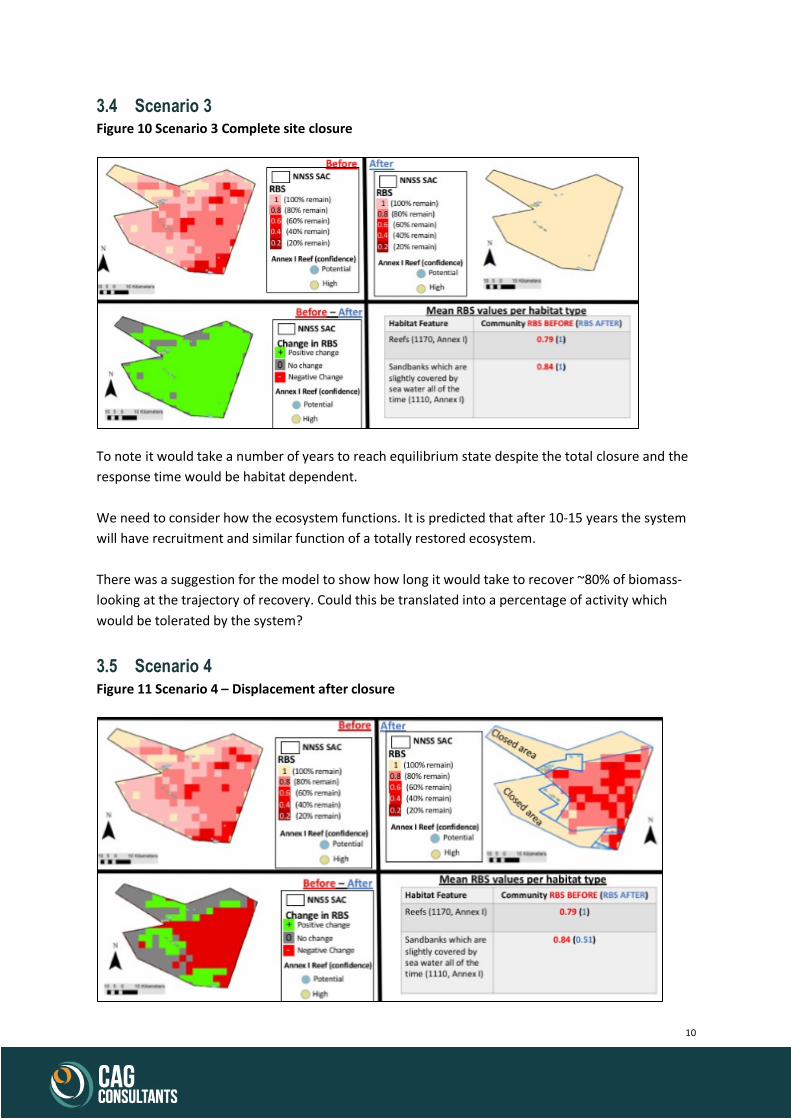
3.4 Scenario 3 Figure 10 Scenario 3 Complete site closure
To note it would take a number of years to reach equilibrium state despite the total closure and the response time would be habitat dependent. We need to consider how the ecosystem functions. It is predicted that after 10-15 years the system will have recruitment and similar function of a totally restored ecosystem. There was a suggestion for the model to show how long it would take to recover ~80% of biomass- looking at the trajectory of recovery. Could this be translated into a percentage of activity which would be tolerated by the system?
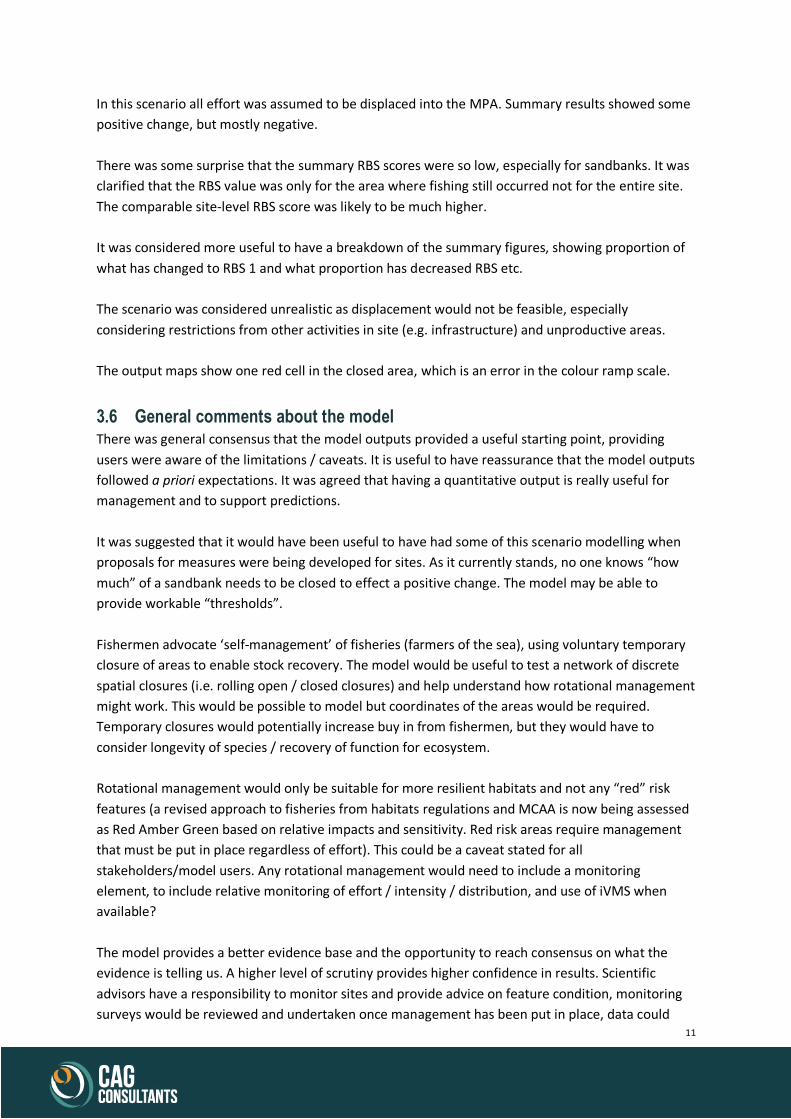
3.5 Scenario 4 Figure 11 Scenario 4 – Displacement after closure
11
In this scenario all effort was assumed to be displaced into the MPA. Summary results showed some positive change, but mostly negative. There was some surprise that the summary RBS scores were so low, especially for sandbanks. It was clarified that the RBS value was only for the area where fishing still occurred not for the entire site. The comparable site-level RBS score was likely to be much higher. It was considered more useful to have a breakdown of the summary figures, showing proportion of what has changed to RBS 1 and what proportion has decreased RBS etc. The scenario was considered unrealistic as displacement would not be feasible, especially considering restrictions from other activities in site (e.g. infrastructure) and unproductive areas. The output maps show one red cell in the closed area, which is an error in the colour ramp scale.
3.6 General comments about the model There was general consensus that the model outputs provided a useful starting point, providing users were aware of the limitations / caveats. It is useful to have reassurance that the model outputs followed a priori expectations. It was agreed that having a quantitative output is really useful for management and to support predictions. It was suggested that it would have been useful to have had some of this scenario modelling when proposals for measures were being developed for sites. As it currently stands, no one knows “how much” of a sandbank needs to be closed to effect a positive change. The model may be able to provide workable “thresholds”. Fishermen advocate ‘self-management’ of fisheries (farmers of the sea), using voluntary temporary closure of areas to enable stock recovery. The model would be useful to test a network of discrete spatial closures (i.e. rolling open / closed closures) and help understand how rotational management might work. This would be possible to model but coordinates of the areas would be required. Temporary closures would potentially increase buy in from fishermen, but they would have to consider longevity of species / recovery of function for ecosystem. Rotational management would only be suitable for more resilient habitats and not any “red” risk features (a revised approach to fisheries from habitats regulations and MCAA is now being assessed as Red Amber Green based on relative impacts and sensitivity. Red risk areas require management that must be put in place regardless of effort). This could be a caveat stated for all stakeholders/model users. Any rotational management would need to include a monitoring element, to include relative monitoring of effort / intensity / distribution, and use of iVMS when available? The model provides a better evidence base and the opportunity to reach consensus on what the evidence is telling us. A higher level of scrutiny provides higher confidence in results. Scientific advisors have a responsibility to monitor sites and provide advice on feature condition, monitoring surveys would be reviewed and undertaken once management has been put in place, data could

12
feed back into the model and improve the empirical data. Testing whether model predictions are validated by ground truthing supports the future use of the model. Other tools are in existence for similar functions; RBS may be the best or there could be others to show other results / information relevant to discussions. It may also be possible to use models in conjunction with each other as needed, however caution should be applied in relying on fully modelled data. Realism is needed for effective discussions. It is difficult to know how to pitch the model to stakeholders. It is clear that any outputs would need to be challenged and to do that some understanding of the model parameters and assumptions is required. It is important for users to be able to control the analysis, which raises questions regarding the extent to which individual stakeholders could use the model and how they could undertake the analytical process? It is important to have guidance material / training available on use of the model. Bangor University is developing a web page application for the Marine Stewardship Council, where users can use the model using a simple interface and input their own data. Within an effective participatory approach, it would need discussion (within the group / per site) on who would run the model and present the outputs. Consideration should be given to this within governance structure of the management group. A discussion was had on the level of detail available in the model regarding EUNIS levels of habitats. The model can highlight any habitat providing there are depletion values for gear types and for that habitat. Currently the model is using average values for gear types and depletion values for sand / mud / gravel. Therefore, the resolution of the model is relatively coarse as it is dependent on the resolution of the data. A discussion was had on whether there was any use for other biodiversity impacts rather than just biomass. Bangor University highlighted the strong relationship between benthic biomass and species richness, with links to primary production and bioturbation; and so biomass should be a good proxy for biodiversity.
3.6.1 Other useful outputs to be considered
• It would be interesting to see RBS values averaged over a period of years rather than just ‘before’ outputs based on one year of effort. This would allow for variation in the distribution and intensity of activities across years.
• It would be useful to show the output in the Before-After map on a gradient, rather than just positive or negative change
• Modify the model outputs to only consider the longest-lived species in an area to show the most precautionary output.
• A timeline trajectory would be useful to help with discussions around when management might be reviewed.
• It would be useful to provide a breakdown of the summary figures, showing proportion of what has changed to RBS 1 and what proportion has decreased RBS etc. Statistics broken down into more classes are useful as users can always aggregate for summaries.

13
• Is it possible to look at other pressures? Such as siltation rates etc. to include different pressures?
• Other examples of management scenarios, especially looking at wider displacement and incorporating nearby MPAs etc.
• Manipulate types of closed areas; effects of full closure in some areas and just closure of bottom trawling in other areas. Would this result in a finer gradient of RBS change?
• Higher resolution of relative distribution of fishing effort within a feature, especially when the feature is not homogenous and different areas are more susceptible to activity (e.g. sandbank flanks).
3.6.2 Limitations of the model
• The model is limited to the data used and so suitable caveats would have to be incorporated into the results ahead of discussions.
• It is important to remember that this is just one of the tools available to use in management discussions. We need to consider the other factors for example, in combination effects. Fishing is not the only pressure.
• The model doesn’t include other activities in assessing the RBS, however this information could be provided additionally (in maps etc.) and available for discussions; does it need to be incorporated into the model?
• Other models will also exist. It would be up to managers (and/or stakeholders) to decide whether to use in isolation or together.
• It can be misleading to rely too much on modelled outputs, we need to look at actual impacts from fishing using monitoring and baseline evidence collection, rather than just relying on the model.
• The impacts beyond those on benthic habitats may also need to be considered when coming to a management decision. For example, consideration of the wider impacts of gears is very important. An example was provided of excluding seine nets in Dogger Bank, where a more critical approach should have been taken to assess the wider effects of all the gears before agreeing on management.
• We are still not at the point where the model can inform “real” decisions. There are still lots of issues that need to be ironed out in developing a more participatory approach and that this model is merely a tool.
• The model just looks at one kind of pressure from gear types, i.e. penetration. Other pressures are associated with gear types that features would be sensitive to, such as siltation for Sabellaria spinulosa reef and pressures from pulse fishing.
3.6.3 Alternative uses of the model
• Development of wind farms and effects on displacement. • The model could be used to help design monitoring survey design – this could be much
more cost efficient. • There is potential for the model to be used regarding industry viability and impacts on
markets – explore closures impacts on conservation objectives and provide scenario impacts of industry viability, showing how to engage positively with the conservation

14
objectives whilst increasing understanding of the relative impact on industry viability. This is also linked to the move towards including Natural Capital information more in the scientific advice / management discussions.

15
4 Triggers for a management review Viv Roberts from the MMO gave a presentation on the management review triggers, which presented a schematic of the proposed review process for adaptive management. Importantly, it was noted that review does not mean revision. Under the revised approach, assessments are reviewed every two years, but for low risk sites the review period is aligned to broader review strategies and occurs every 5 years. This period is adapted for sensitive sites. For the adaptive management process, the period is also flexible and can be reviewed following a relevant trigger. The outcomes of reviews are available to the public. Currently the first tranche of assessment reviews is in progress and these will be published and available once complete. A schematic was presented which highlights the two main types of data which can be used to trigger a review – Ecological (largely informed through SNCBs) and Effort-based (VMS and logbook data; other vessel monitoring sources). Discussion was then encouraged to identify further triggers for review. Following are the key discussion points and proposed additional triggers. Figure 12 Adaptive management review trigger types
4.1 What other factors might trigger a review? The following edits to current text were suggested:
The factors which might trigger a revised assessment of the risks posed to MPAs; which could result
in new management measures being developed; include the following:
• New information on feature location (e.g. through SNCB survey work)
• New information on feature sensitivity (e.g. through new SNCB advice)
16
• Revised/updates on conservation objectives (provided as part of SNCBs statutory
obligation)
• Revised/updates on feature condition (as part of SNCBs statutory obligation)
• Change in fishing operation levels from that assumed in previous MPA assessments, for
example:
o Increase in activity levels
o Change in seasonal patterns and/or distribution of activity
o Change in gear type or gear modifications being used
• Statutory Nature Conservation Bodies: NE (0-12nm) and JNCC (12-200nm)
A discussion was had on why some points where ‘e.g. through SNCB…’ and others were ‘by SNCBs’; this was clarified that there is a legal requirement for SNCBs to provide updates on conservation objectives and feature condition, however this information then feeds into the other points, along with additional information from a variety of sources.
4.1.1 What else could potentially trigger management review? The annual review of sites was discussed and considered satisfactory considering this includes a review of VMS and other marine activities and is often quicker than waiting for legislation.
4.1.2 Additional points to consider for triggers
• New information regarding potential impacts o For example, working on the assumptions that certain types of fishing wouldn’t
impact but actually are. o It needs to be considered alongside other evidence (no dismissal of any information)
§ Impact monitoring / SeaSearch data / citizen science o Fishing predates all other marine sectors; however, the assessment of fishing
activity didn’t start until ~2012. There is a need to look at fishing specifically first and then how condition changes within other activities.
• New information of activities other than fishing could potentially be considered o Pressures of impacts can change the sensitivity of a feature. o Non-fishing related activities are considered through marine licensing with regard to
impact on fishing activity (In combination effects during MPA assessment). It would be difficult to use marine licensing to trigger reviews of MPA management as it is a separate process.
o This information wouldn’t instigate a change to revising fishing management, which should only focus on managing fisheries activities such that they do not preclude the achievement of the conservation objectives for the site.
o There is potential to look at activities in terms of pressures which apply, so these can be standardised and aggregated. To focus on singular activities (whether fishing in general or fishing gear) is a narrow-minded approach and limiting on features.
o There is a need to balance constraints on fishing with constraints on other activities; fishing should not have to compensate for the increased impacts of cumulative effects.
17
o Information would be useful to incorporate the effects on fishing displacement; for example, wind farm developments would reduce fishing areas / access to areas. Looking at socioeconomic impacts of fishing profitability would be relevant to site specific considerations such as feature extent and distribution. Is there potential use of the model to provide this information?
• Gear modification, could include additional kit added to activity - catch all for all possibilities. o Trawl speed o Additional changes to fishing activity o Mitigation measure in general o Any change in fishing operations, include gear modifications, gear type and other
ways fishing activity can be modified. o This factor addressed in amended wording of current trigger (see changes) - change
fishing activity to fishing operations • Long term changes, such as climate change?
o Changes in feature sensitivity, but this is not guaranteed, it could affect something else in the site (not attributes of the protected feature).
o You could use climate change as a proxy for expected change in feature distribution of site.
o If temperature increases this could lead to an increase in primary production which could increase resilience to fishing pressures due to increased productivity?
o The natural environment can change so much over time that it is difficult to encompass or record everything; how would it be effectively monitored to provide a trigger?
• Would it be appropriate to consider triggers from outside the site to review management of measures within the site? o It is difficult to consider scales in this and relate something happening outside the
site to impacts within a site. o It is not considered relevant to include at a site level, there is no legal obligation, but
whoever governs the site could decide to include it. o We can’t manage everything, but we need to consider the interaction, as it may
influence how fishing pressure relates to the site. § For example, Smelt are a protected feature in some sites but due to
temperature changes Smelt are moving outside of site boundaries. Fisheries management is still in place within the sites, but the protected feature is no longer affected, as it is no longer there. So, this would support Climate Change effects being used as a trigger, or would this be included in New Information on feature location?
§ Another example that illustrates the other side of the discussion was Spiny lobster; if we only apply fisheries measures within sites, recovery will not be guaranteed as a wider approach is needed.
§ Traditional fisheries management approach of managing at a wider / regional scale helps to deliver the conservation objectives of sites which sit within these regions. This encourages a more sustainable fisheries, so managing at this level (regionally) makes more sense than site by site.
18
o Moves beyond fisheries and how to balance? We need to accept some things we can manage, and others can’t be within the context of Fisheries management.
• Influence of public opinion, for example the ‘Blue Planet effect’ which has been responsible for some policies (e.g. plastics). Public opinion can trigger a policy review and the policy review could trigger a review of MPA management. o Unsure this would trigger a review of management; we need to be wary of societal
choice being a trigger. Policy shift should be expressed as a change in conservation objectives.
o Marine Planning is also driven by public pressure, particularly nearshore. • Triggers should be distinguished between a wider viewpoint and a seasonal or day-to-day
viewpoint. Triggers apply to wider management review process as well as a more local scale approach. There is a need to consider the aim of management; is it to manage the fisheries or manage the conservation objectives within the MPA? An operational management system within a site will manage the level of fishing effort over periods of time. o Idea for nested management i.e. MPA focused within IFCA byelaws. One can inform
the other. For example, changes in fisheries management parameters could be an indicator of underlying ecological change. Catch per Unit Effort (CPUE) of lobster could reflect relative condition of reef.
§ CPUE could also be related to economic situation not just feature’s status, so it would be difficult to distinguish the reasoning behind it.
§ In addition to monitoring the ecological factors relating to a given feature in order to assess condition, we should also consider the potential contribution of fisheries management parameters in any assessment.
§ CPUE is still useful to monitor, especially from a fisheries point of view and provides a key way that the fishing industry can contribute to a participatory approach in management.
o There could then be seasonal triggers for closures dependent on population statistics.
4.2 How might stakeholders inform the ecological based review process? In Norway a percentage of the fishing fleet are used as data collection vessels. There are other possible examples in operation within Iceland and Canada too. It is thought to be worth investigating in what way the Sentinel fleets are considered sentinel and how this is regulated. The Spurdog By-catch avoidance programme involved commercial fishing vessels operating in the Celtic Seas successfully reporting information on their spurdog by-catch in near real-time, every 24hours. Information was compiled and reported back to skippers of participating vessel using a RAG advisory traffic light system (Red= high significant spurdog by-catch) (Hetherington et al. 2018). The MPA management toolkit from this project should include these external connections to best practise. Perhaps UK need to incentivise how we enable the fishing industry to collect and deliver more data / information. NFFO (Dale Rodmell) stated this kind of increased interaction would be welcomed by the fishing industry; and constitute technical projects which just need delivering. Information could be empirical, for example finer resolution fishing effort data in MPAs, gear dimensions and penetration depths. Anecdotal information is also useful, such as the cause of
19
increase or decrease to fishing catch per unit effort (CPUE) of certain stock, particularly indicator species of feature condition. Anecdotal data would need to be effectively managed and structured to address certain aspects. More information on spatial distribution of fishing activity will become available through iVMS, however it is also useful to have fishermen input to explore reasons behind the patterns. More detailed information will be required on feature presence and distribution to match the level of resolution in fishing data / information and to increase our understanding of the interactions between feature and fishing pressures on an MPA scale. To enable the fishing industry to gather and share data it needs to be made clear how and when they can contribute. To incentivise this contribution / commitment measuring equipment could be provided to the fleet for collecting data, along with observers onboard, however feasibility and resource / funding of this would need to be identified. Being involved in data collection would improve stewardship and ownership within the project as well. Guidelines on defining the data and how the data will be used are needed, as it is important to be clear about the information from the start, defining the differences between fishing activity data collection, scientific data collection and citizen science data. There is an option for a discreet project to assess who and when additional data should be provided and to test control the data, establishing principles on what data is sufficient / meets the needs, is this potential follow on work from this project? ACTION for National workshop- think about issues related to data input and present examples of these at national workshop- sentinel fleets used to fill gaps in data collection etc- include pros / cons and things to discuss further. Earlier stakeholder engagement had discussions on what data to include (see Workshop 2 notes). The key question is on the quality of data and defining the principles applied to data quality. The Ecological Network Guidance provides guidance on assessing confidence in data submitted for the MCZ process. The guiding principles for ownership, use and custodianship of MCZ project data may also be a useful resource. Even when we do not know exactly where and how often fishing effort is taking place we need to accept that fishing will affect the condition of most features. Management and environmental condition are intrinsically linked. Aspirations of fisheries management is to enable maximum environmentally sustainable yield, whilst meeting legal obligations. The language we use, such as ‘acceptable damage’ or ‘thresholds’ is important as we cannot lose sight of legal obligations. We need to ensure the language used in the toolkit establishes what is applicable to fisheries management in MPAs in general and what is bespoke to this project, which focuses on benthic / sedimentary habitats. Language is part of moving forward in a proactive management decision but needs to be managed / modified to suit the group and not lose sight of legal obligations. Framing aspirations is important to focus and lead the way in management discussions- damage needs to be well defined (in particular within MPAs). A network of no take zones was discussed in relation to how to manage a decrease in impacts first and then review and measure cumulative effects.

20
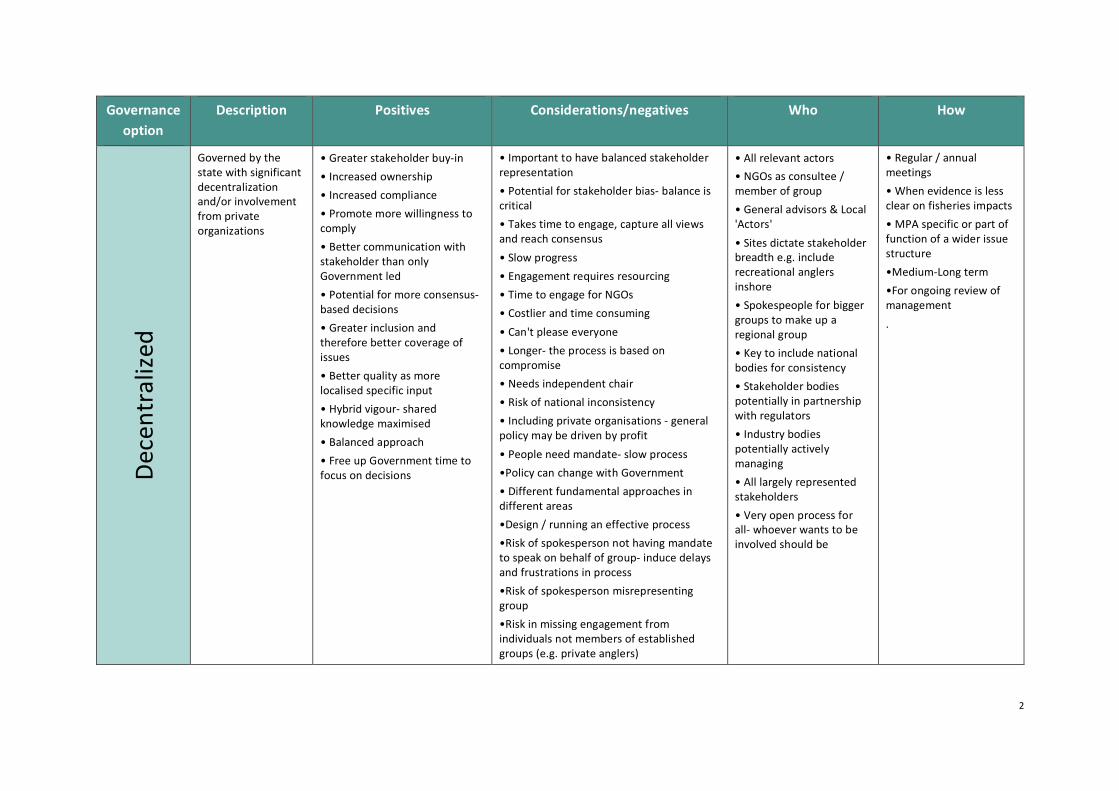
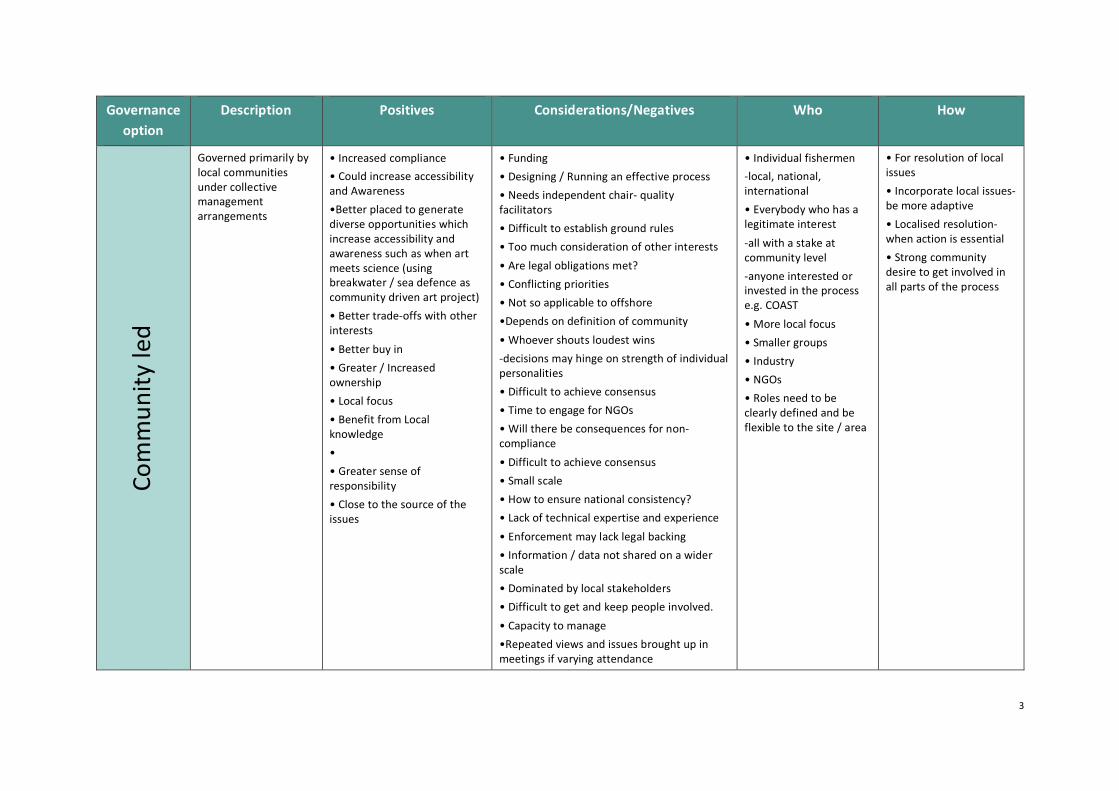
5 Developing a governance framework for adaptive management Handouts were provided to stakeholders at the workshop to give an overview of general governance options and details on the governance frameworks in operation in English MPAs. These handouts outline the difference between management and governance and introduced a scoping exercise to attendees to identify a suitable governance option for the WoW site. See appended table below for details of the governance options scoping exercise. Following the scoping exercise, attendees were asked to add markers to their preferred governance option. Each attendee was given three markers and split them among the options in whichever way they wanted. A decentralised approach was the favourite overall approach and also the favoured for the approach to this case study site. Government-led was the second favourite (for both overall and site specific) and Community led the least favoured. It is recognised that not one approach would be suitable for all sites; it depends on contentious levels, engagement levels and the variety of stakeholders (e.g. local / national / international). Levels of management may be effective- having management groups / regional groups. Figure 13 Developing a governance framework – workshop activity

21
5.1 Key discussion points
The stakeholder engagement process should operate at different levels. A successful example of community led involvement: Breakwater planned for development to minimise coastal erosion. There was initial discontent from some of the community due to the unsightly nature of the construction. The community was involved, and an opportunity generated for a competition to incorporate sculptures on the breakwater, which has now become a local attraction. Increased engagement led to popularity of the development and increased consensus. Advisory councils have suffered from chairs that are seen not to be even handed in their responses / decisions / facilitation. There are lessons to be learnt from the Dogger Bank process, including being open minded when coming to a meeting, to avoid negotiating / running into conflicts straight away. Expert facilitators are key in this to manage stakeholder engagement. One of the key outputs from advisory councils is the transference of knowledge from fishermen. It can be misleading to assume that a decentralised approach takes more time. It is still dependent on policy. Discussions around decision options may take time, however once the decision is made it would be quicker to implement and maintain as there will be greater consensus, although it is noted that there will always be unhappy / unsatisfied partners. Time is also relative considering the steps involved. For example, the Regional Seas process was three years with 18months of stakeholder engagement and felt relatively fast paced to work within, however, this was for designation. Management may require a different approach. There is a difference between finite processes and ongoing, and we need to retain engagement with those involved in initial (designation) stages to ensure consistency. Stakeholder engagement has improved but is still not considered to be great due to short notice of meetings and short discussions in government led process. A decentralised approach is considered more democratic.
5.2 North Norfolk Sandbanks Saturn Reef case study preferred option The decentralised option was preferred overall. This would enable fishermen’s local knowledge to be unlocked (not accessed in Government led approach). Time would be needed to get the most effective and democratic group. The ideal solution is to pick and choose the best options from the different approaches. Essential to balance stakeholders and ensure professional facilitation.

22
5.2.1 A decentralised approach in NNSSR Who should be involved?
• Dutch fishermen- although under CFP any state could declare an interest and become a stakeholder
• NGOs • Domestic fishers? (unsure of interest)- may not fish but have relevant interest and input
to discussion • Oil and gas operators • Aggregates (active dredge and disposal sites within MPA) • Wind farm / renewables (no wind farm in the site but planned cable crossing site within
proposed fisheries management areas) • UK Government
o SNCBs o Regulators
• EU Government • Crown estate • MOD • Seabed Users Development Group (SUDG) could act on behalf of industry (oil and gas and
renewables)- so as to ensure weighting of attendance relative to fisheries management in MPA and not bias towards other activities.
The key stakeholders for NNSSR are considered to be the fishing industry and NGOs.
How to engage the stakeholders?
It is important to note the focus of the group is MPA fisheries management and representation of stakeholder should be proportionate to the issues being discussed.
• The attendance of SUDG (or other activity focussed groups) would be to input on their activities affects to the management proposals- for example if wind farm cables were being developed within areas where fishing was / wasn’t allowed.
• Within the Dogger Bank example, it would have been beneficial for increased engagement with Forewind, so advisory council was aware of areas that could potentially be lost to feasible fishing activity due to windfarms in development / consents. Unfortunately, this did not get any traction as it was considered legally prejudicial because the information provided could be considered as consent to future development.
We need to define stakeholder within the Terms of Reference to establish any vested interest and commitment to the group. A clear set of objectives should be presented within the Terms of Reference.
Participatory approaches are often reliant on funding. If attendance is incentivised then commitments increase, but as soon as the money runs out attendance will likely decrease. This can then result in a weighting of the management group to be defined by wealth / available resources of the organisation. If applying for Government funding you need to prove the added value of

23
additional meetings (to those currently taking place). Some sites have more obvious benefits; if stakeholders are invested in attendance there would be benefits from compliance etc. Increased compliance would help to convince Government in the benefits of funding as less money would be required to enforce management measures. It is difficult to determine budget for the long term; is there a possibility to investigate external funding?
A stakeholder mapping exercise would be the first step; map by influence and interest, gauge the spread of key stakeholders required for an effective democratic group. The mapping exercise can then help define levels / scale of engagement across the group and preferred options for engagement (e.g. correspondence through email / phone / newsletter / webpage). It is possible to use existing groups, such as the Southern North Sea Network Group which currently meets every 6 months. We need to avoid repetitive meetings with the same people as this can stagnate discussions. Stakeholder engagement usually drops off after the initial interest; we need to focus on retaining membership. Current engagement is not always a two-way communication; stakeholders feed into consultations etc, but are not always kept updated of how their comments have been received and used.
A formal regional group could handle multiple sites, especially in regard to NNSSR where other SACs in the area have the same features and pressures. This would also encourage consistency across sites and effects of management proposals (i.e. displacement) to other MPAs (promote good use of the model). However, combining sites would need flexibility as it would lead to additional stakeholders not interested in every topic being discussed. An option was discussed to have satellite groups focussed on specific issues which feed into the regional group through elected spokespersons. However regional groups should remain open for anyone interested to attend; this more open approach would ensure more varied discussions / opinions.
Launching the group needs to be inviting (and cheerful). Visualisation tools including video footage etc. should be used to convey key points and spark conversation.
The Natural Capital approach is gaining traction; focussing on the value of habitats and features in and out of themselves. Options to balance natural capital benefits with cost of implementation.
When to engage?
Coordination of the group is a key component to ensure efficiency and successful participation. There may be potential to be run by local / county authorities? Must highlight the need to be aware of GDPR compliance. Project officers for the groups need to act as catalysts for engagement and meeting attendance / monitoring progress etc.
Decisions need to be made in accordance with the marine plan (as this covers more than marine licensing) and the 25Year Environmental Plan (25YEP). Within the drafting of the 25YEP we are starting to think more long term which affects when reviews would be needed and focus discussions on key drivers.
We are currently not being charged for non-compliance, however this may change with EU Exit (potentially no longer be relevant?). Links to policy makers and Government need to be up to date
24
with objectives / drivers of those currently in power and how this would affect discussions / topical issues.
At the review stage cumulative impacts should be accounted for, engagement could be staged to involve relevant stakeholders at this point. Satellite groups could be formed to feed into main group. Satellite groups can meet more regularly with an annual review of the main group?
Well managed can mean different things to different people, it is key to ensure meetings are regular to enable all stakeholders to voice opinions. Options could be adapted to suit available budgets, although this may impact efficiency.
Current proposals for NNSSR are due to be reviewed in 6years; is it likely anything will have changed in this time? If not, then we could stick to the current review schedule.
Through including a diverse range of stakeholders, the management group could potentially go beyond statutory duties that bring diversification, this would depend on the group, site and would need to be clearly defined in the Terms of Reference.
25
6 References
Greenstreet, S.P.R., Fraser, H.M., Piet, G.J., (2009) Using MPAs to address regional-scale ecological
objectives in the North Sea: modelling the effects of fishing effort displacement, ICES Journal of Marine Science, 66, No.1: pp90-100
Hiddink, J.G., Jennings, S., Sciberras, M., Szostek, C.L., Hughes, K.M., Ellis, N., Rijnsdorp, A.D. et al (2017) Global analysis of depletion and recovery of seabed biota after bottom trawling disturbance, Proceedings of the Natioal Academy of Sciences, 114, No.31, pp.8301-8306
Hetherington, S.J., Nicholson, R.E., Benall, V.A. (2018) Spurdog by-catch avoidance Programme 2: 12-
month progress update, Interi evaluation (Nov 2016-Oct 2017), Project report (Cefas), p.87
Rijnsdorp, A.D., Bolam, S.G., Garcia, C., Hiddink, J.G., Hintzen, N.T., Van Denderen, P.D., Van Kooten, T., (2018) Estimating sensitivity of seabed habitats to disturbance by bottom trawling based on the
longevity of benthic fauna, Ecological applications, 28, No.5, pp.1302-1312

1
Appendix 1 Governance options
Governance option
Description Positives Considerations/Negatives Who How
Gove
rnm
ent l
ed
Governed primarily by the state under a clear legal framework
• Should be quick / more efficient / timely process • Efficiency- less people involved means faster progress (in theory) • Works as well as the law is strong (so need strong) • Familiarity • Can call on advice from many experts • Better equipped for international negotiation, engagement and diplomacy • Policy driven • Should be objective / evidence supported • Improved capacity for decisions • Big scale = broader impact
• Not 'involving' or responsible to local considerations • Less inclusive and therefore possible compliance issues • Decreased stakeholder engagement reduces buy-in • lack of local buy in • A problem with scaling? Local Vs broad focus • Bad reputation of Governments • Only as good as Government ambition and legal underpinning • Financial burden is imposed on fishermen which has to be earnt over the gunnel and puts further strain on the environment •Policy can change with Government
• Government party in power the state and their policemen • Government led with some open consultation • Devolved administrations • SNCB's - co-ordinate stakeholder input • NGOs as consultee • Regulators • Policy advisors- consultation with stakeholders
• Continual • Guided by risk • Scheduled review / continual • To fix urgent / high risk issues • Define framework- identify issue, propose solution, implement action
2
Governance option
Description Positives Considerations/negatives Who How
Dece
ntra
lized
Governed by the state with significant decentralization and/or involvement from private organizations
• Greater stakeholder buy-in • Increased ownership • Increased compliance • Promote more willingness to comply • Better communication with stakeholder than only Government led • Potential for more consensus-based decisions • Greater inclusion and therefore better coverage of issues • Better quality as more localised specific input • Hybrid vigour- shared knowledge maximised • Balanced approach • Free up Government time to focus on decisions
• Important to have balanced stakeholder representation • Potential for stakeholder bias- balance is critical • Takes time to engage, capture all views and reach consensus • Slow progress • Engagement requires resourcing • Time to engage for NGOs • Costlier and time consuming • Can't please everyone • Longer- the process is based on compromise • Needs independent chair • Risk of national inconsistency • Including private organisations - general policy may be driven by profit • People need mandate- slow process •Policy can change with Government • Different fundamental approaches in different areas •Design / running an effective process •Risk of spokesperson not having mandate to speak on behalf of group- induce delays and frustrations in process •Risk of spokesperson misrepresenting group •Risk in missing engagement from individuals not members of established groups (e.g. private anglers)
• All relevant actors • NGOs as consultee / member of group • General advisors & Local 'Actors' • Sites dictate stakeholder breadth e.g. include recreational anglers inshore • Spokespeople for bigger groups to make up a regional group • Key to include national bodies for consistency • Stakeholder bodies potentially in partnership with regulators • Industry bodies potentially actively managing • All largely represented stakeholders • Very open process for all- whoever wants to be involved should be
• Regular / annual meetings • When evidence is less clear on fisheries impacts • MPA specific or part of function of a wider issue structure •Medium-Long term •For ongoing review of management .
3
Governance option
Description Positives Considerations/Negatives Who How
Com
mun
ity le
d Governed primarily by local communities under collective management arrangements
• Increased compliance • Could increase accessibility and Awareness •Better placed to generate diverse opportunities which increase accessibility and awareness such as when art meets science (using breakwater / sea defence as community driven art project) • Better trade-offs with other interests • Better buy in • Greater / Increased ownership • Local focus • Benefit from Local knowledge • • Greater sense of responsibility • Close to the source of the issues
• Funding • Designing / Running an effective process • Needs independent chair- quality facilitators • Difficult to establish ground rules • Too much consideration of other interests • Are legal obligations met? • Conflicting priorities • Not so applicable to offshore •Depends on definition of community • Whoever shouts loudest wins -decisions may hinge on strength of individual personalities • Difficult to achieve consensus • Time to engage for NGOs • Will there be consequences for non-compliance • Difficult to achieve consensus • Small scale • How to ensure national consistency? • Lack of technical expertise and experience • Enforcement may lack legal backing • Information / data not shared on a wider scale • Dominated by local stakeholders • Difficult to get and keep people involved. • Capacity to manage •Repeated views and issues brought up in meetings if varying attendance
• Individual fishermen -local, national, international • Everybody who has a legitimate interest -all with a stake at community level -anyone interested or invested in the process e.g. COAST • More local focus • Smaller groups • Industry • NGOs • Roles need to be clearly defined and be flexible to the site / area
• For resolution of local issues • Incorporate local issues- be more adaptive • Localised resolution- when action is essential • Strong community desire to get involved in all parts of the process

1
Related Documents


