Equality and Human Rights Commission Research report 119 Developing a national barometer of prejudice and discrimination in Britain Dominic Abrams 1 , Hannah Swift 1 and Diane Houston 2 1 University of Kent, Centre for the Study of Group Processes Equality and Human Rights Commission Published: October 2018 1

Welcome message from author
This document is posted to help you gain knowledge. Please leave a comment to let me know what you think about it! Share it to your friends and learn new things together.
Transcript

Equality and Human Rights CommissionResearch report 119
Developing a national barometer of prejudice and discrimination in Britain
Dominic Abrams1, Hannah Swift1 and Diane Houston2
1University of Kent, Centre for the Study of Group Processes2Birkbeck, University of London
Equality and Human Rights Commission Published: October 2018
1

October 2018
Equality and Human Rights Commission Published: October 2018
2

© 2018 Equality and Human Rights CommissionFirst published October 2018 ISBN 978-1-84206-763-5
Equality and Human Rights Commission Research Report Series
The Equality and Human Rights Commission Research Report Series publishes research carried out for the Commission by commissioned researchers.
The views expressed in this report are those of the authors and do not necessarily represent the views of the Commission. The Commission is publishing the report as a contribution to discussion and debate.
Please contact the Research Team for further information about other Commission research reports, or visit our website.
Post: Research Team Equality and Human Rights Commission Arndale HouseThe Arndale CentreManchester M4 3AQ
Email: [email protected] Telephone: 0161 829 8500
You can download a copy of this report as a PDF from our website. If you require this publication in an alternative format, please contact the Communications Team to discuss your needs at: [email protected]
Equality and Human Rights Commission Published: October 2018
3
Developing a national barometer of prejudice and discrimination in Britain
Contents
Acknowledgements.....................................................................................................6Foreword from our Chief Executive.............................................................................7Executive summary.....................................................................................................91 | Introduction..........................................................................................................12
1.1 Why do we need a ‘barometer’ to measure prejudice and discrimination?. .122 | Designing the survey............................................................................................15
2.1 Defining and measuring prejudice................................................................152.2 Experiences and perceptions of prejudice...................................................172.3 Prejudice......................................................................................................18
3 | Data collection......................................................................................................213.1 Data collection.............................................................................................213.2 Interpretation and significance testing..........................................................21
Table 3.1 Experience of discrimination in the last year (per cent) summary table ........................................................................................................22
4 | Survey findings.....................................................................................................234.1 Equality endorsement..................................................................................234.2 The prevalence of experiences of discrimination.........................................24
Table 4.1 Prevalence of prejudice (per cent) for respondents with protected characteristics (including boost data).................................................................24Table 4.2 Experiences of prejudice (per cent) based on age and sex by country ........................................................................................................25
4.3 Areas of life in which people experience discrimination...............................264.4 Perceived seriousness of discrimination .....................................................27
Figure 4.1 Perceived seriousness of discrimination.........................................274.5 Overtly positive and negative attitudes (feeling thermometer).....................29
Figure 4.2 Feelings towards people with each protected characteristic, excluding those who belong to the target protected characteristic.....................30Table 4.3 Negative feelings expressed (%) towards people with particular protected characteristics across England, Scotland and Wales.........................31
4.6 Stereotypes..................................................................................................32
Equality and Human Rights Commission Published: October 2018
4
Developing a national barometer of prejudice and discrimination in Britain
Figure 4.3 Evaluations of each protected characteristic group on warmth and competence.......................................................................................................33
4.7 Social distance.............................................................................................34Figure 4.4 How comfortable would you feel if a member of the relevant group was appointed as your boss?.............................................................................34Figure 4.5 How comfortable would you feel if a member of the relevant protected characteristic moved in next door to you?..........................................35Figure 4.6 How comfortable would you feel if a person with one of the relevant protected characteristics married one of your close relatives?..........................36
4.8 Equality endorsement for specific protected characteristics........................37Figure 4.7 Have attempts to give equal opportunities to the following groups gone too far or not far enough?..........................................................................37
4.9 Intergroup contact........................................................................................38Figure 4.8 Percentage of respondents that have friendships with different groups (excluding members of the target group)...............................................39
4.10 Motivation to control prejudice..................................................................404.11 Summary..................................................................................................41
5 | Insights from using the survey as a complete set of measures............................435.1 Contrasting the experiences of two different protected characteristics........44
Table 5.1 Case study measures of experiences of prejudice.........................445.2 Prejudiced attitudes.....................................................................................45
Table 5.3 Case study attitudes towards black people and disabled people with a physical impairment........................................................................................46
6 | Conclusions..........................................................................................................48References................................................................................................................52Appendix A: Summary of measures..........................................................................55
Table A.1 Overview of measures of prejudice.................................................55Appendix B: Questionnaire.......................................................................................58Appendix C: Data collection approach......................................................................73
C.1 Overview of the approach............................................................................73C.2 NatCen panel and ScotCen panel................................................................74C.3 Survey response to the NatCen and ScotCen panels..................................75
Table C.1 Survey response..........................................................................75Table C.2 Sample profile of the NatCen panel.........................................76Table C.3 Sample profile of the ScotCen panel.......................................77Table C.4 Profile of protected characteristics within survey respondents.....................................................................................................78
C.4 PopulusLive panel........................................................................................81C.5 Weighting and analysis................................................................................81
Equality and Human Rights Commission Published: October 2018
5
Developing a national barometer of prejudice and discrimination in Britain
C.6 Coding of domains.......................................................................................83Appendix D: Recommendations on usage of the survey..........................................84
D.1 Reliability and validity...................................................................................84D.2 Survey approach..........................................................................................86
Tables and figures
Tables
Table 3.1 Experience of discrimination in the last year (per cent) summary table 22Table 4.1 Prevalence of prejudice (per cent) for respondents with protected
characteristics (including boost data)....................................................24Table 4.2 Experiences of prejudice (per cent) based on age and sex by country. 25Table 4.3 Negative feelings expressed (%) towards people with particular
protected characteristics across England, Scotland and Wales............31Table 5.1 Case study measures of experiences of prejudice................................44Table 5.3 Case study attitudes towards black people and disabled people with a
physical impairment...............................................................................46Table A.1 Overview of measures of prejudice.......................................................55Table C.1 Survey response................................................................................75Table C.2 Sample profile of the NatCen panel...............................................76Table C.3 Sample profile of the ScotCen panel..............................................77Table C.4 Profile of protected characteristics within survey respondents 78
Figures
Figure 4.1 Perceived seriousness of discrimination...............................................27Figure 4.2 Feelings towards people with each protected characteristic, excluding
those who belong to the target protected characteristic........................30Figure 4.3 Evaluations of each protected characteristic group on warmth and
competence...........................................................................................33Figure 4.4 How comfortable would you be if a member of the relevant group was
appointed as your boss?.......................................................................34Figure 4.5 How comfortable would you be if a member of the relevant protected
characteristic moved in next door to you?.............................................35Figure 4.6 How comfortable would you be if a member of the relevant protected
characteristic married one of your close relatives?................................36Figure 4.7 Equal opportunities for protected characteristic groups.........................37Figure 4.8 Percentage of respondents that have friendships with different groups
(excluding members of the target group)...............................................39
Equality and Human Rights Commission Published: October 2018
6
Developing a national barometer of prejudice and discrimination in Britain
Acknowledgements
This research was designed by Dominic Abrams, Hannah Swift and Diane Houston at the University of Kent Centre for the Study of Group Processes and at Birkbeck, University of London. The survey implementation and summary data were provided by Hannah Morgan and Martin Wood at NatCen. We are grateful to collaborators at the Centre for the Study of Group Processes, University of Kent for the early stages of the development work and to Hazel Wardrop and Gwen Oliver at the Equality and Human Rights Commission for advice and comments on earlier drafts of the report.
Equality and Human Rights Commission Published: October 2018
7
Developing a national barometer of prejudice and discrimination in Britain
Foreword from our Chief Executive
How many times in the past year has someone shown you a lack of respect because of your race, impairment or sexual orientation? Would you feel comfortable if an immigrant lived next door, or if your boss had a mental health condition? These are some of the questions we asked in the first national survey of prejudice for over a decade – and often the answers are surprising.
Almost 3,000 people across Britain talked to us about their experiences of prejudice and their attitudes towards different groups. Forty-two per cent of all respondents said they had experienced prejudice in the last year, with this figure being higher among minority groups. This is a matter for concern, particularly as the survey also found that some people think efforts to provide equal opportunities for particular groups have ‘gone too far’.
Our work is framed by the principle that if everyone gets a fair chance in life, we all thrive. We therefore need to understand the nature and extent of prejudice and discrimination in Britain in order to tackle the barriers that are holding people back. This requires having robust data on people’s attitudes towards others and on people’s experiences of being disrespected, patronized, bullied or treated less well because of their race, sex, impairment or any other protected characteristic. By understanding the attitudes that underlie discrimination, we can ensure that efforts to tackle it are more likely to hit the mark.
We are therefore calling for the UK Government to fund a regular national survey, the findings of which would form a barometer showing the current state of prejudice and discrimination in Britain. This report sets out a workable model that could be carried forward by others. We also need social researchers, civil society and NGOs to continue to develop and test this set of questions with other protected groups, especially those who are hard to reach, to provide a comprehensive picture.
As part of our programme of work in this area, we have already examined the links between attitudes and behaviours, and worked with partners to strengthen our knowledge on ‘what works’ to tackle prejudice and discrimination. We will shortly be launching our three-yearly review of the state of equality and human rights in Britain.
Equality and Human Rights Commission Published: October 2018
8

Developing a national barometer of prejudice and discrimination in Britain
‘Is Britain Fairer? 2018’ will be an important counterpart to this survey, allowing us to see where prejudiced attitudes towards certain groups may be holding them back in life.
Taken together, these reports are a significant contribution to our bank of evidence on how people in Britain live and work together. We will use this data in our own work, and we hope policy-makers in general will use it in theirs – in order to drive lasting change. Britain has a proud history of tackling intolerance and prejudice and we must ensure that we continue to lead the way as we leave the European Union. We believe that justice, freedom and compassion should be the traits that define our nation into the future.
Equality and Human Rights Commission Published: October 2018
9
Developing a national barometer of prejudice and discrimination in Britain
Executive summary
This is the first national survey of prejudice for over a decade. It measures prejudice and discrimination in Britain experienced by people with a wide range of protected characteristics: age, disability, race, sex, religion or belief, sexual orientation, pregnancy and maternity, and gender reassignment.
Our report demonstrates the value of using a national survey of this type to measure prejudice and discrimination in Britain and to set out a benchmark for future surveys. The purpose of this research is to help establish a national ‘barometer’ for monitoring changes in the attitudes and experiences of the general population.
We were commissioned by the Equality and Human Rights Commission to design and run a national survey of prejudice, using a consistent set of measures across a range of protected characteristics. We surveyed 2,853 adults in Britain using the NatCen Panel surveys and carried out an additional survey to target minority groups that may otherwise not be well represented in the survey.
Our approach provides new insights into the form and prevalence of prejudice and discrimination in Britain. Measuring these issues in a consistent way across protected characteristics groups and across England, Scotland and Wales, gives us a uniquely recent and comparable overview. It enables us to look across a range of measures to paint a meaningful picture of the prejudice affecting a particular protected characteristic, rather than looking at individual measures on their own.
Although it does not yet provide a picture of prejudice and discrimination for all protected characteristics – which would require a larger and further-developed survey – it sets out a workable model for a future national instrument for monitoring these issues in Britain.
This report provides an overview of what we have found out about people’s experiences and expressions of prejudice in Britain.
Experiences of prejudice and discrimination
Equality and Human Rights Commission Published: October 2018
10

Developing a national barometer of prejudice and discrimination in Britain
42% of people in Britain said they had experienced some form of prejudice in the last 12 months.
Data from the combined representative panel survey and boost sample data indicated that experience of prejudice was higher in minority groups. This should be interpreted with some caution because of methodological differences from the main survey. In the last year:
- 70% of Muslims surveyed experienced religion-based prejudice
- 64% of people from a black ethnic background experienced race-based prejudice
- 61% of people with a mental health condition experienced impairment-based prejudice, and
- 46% of lesbian, gay or bisexual people experienced sexual orientation-based prejudice.
Ageism can be experienced by people at any age. In line with previous research, a higher proportion of British adults reported experiencing prejudice based on their age (26%) than on any other characteristic.
Attitudes
Nearly three-quarters of people in Britain (74%) agreed that there should be equality for all groups in Britain, but one in ten (10%) people surveyed disagreed.
More people expressed openly negative feelings towards some protected characteristics (44% towards Gypsies, Roma and Travellers, 22% towards Muslims, and 16% towards transgender people) than towards others (for example, 9% towards gay, lesbian or bisexual people, 4% towards people aged over 70, and 3% towards disabled people with a physical impairment).
A quarter expressed discomfort with having a person with a mental health condition as their boss (25%) or as a potential family member (29%). Around one-fifth of respondents said they would feel uncomfortable if either an immigrant or a Muslim person lived next door (19% and 18% respectively), and 14% said they would feel uncomfortable if a transgender person lived next door.
Around a third of British adults felt that efforts to provide equal opportunities had gone ‘too far’ in the case of immigrants (37%) and Muslims (33%). In contrast, nearly two-thirds thought that such efforts had ‘not gone far enough’ for people with a mental health condition (63%) or people with a physical impairment (60%).
Equality and Human Rights Commission Published: October 2018
11
Developing a national barometer of prejudice and discrimination in Britain
Developing a national barometer
We have identified some examples of how this survey generates useful insights when used as a complete set of measures:
People’s perceptions of the seriousness of discrimination in Britain in relation to different protected characteristics did not match levels of personal experiences of discrimination. For example, more than half (54%) thought that the issue of discrimination based on age was not at all or only slightly serious, despite more British adults reporting experiences of prejudice based on their age (26%) than any other protected characteristic.
People’s resistance to improving equal opportunities was greatest towards those groups that they considered to be less ‘friendly’ and more ‘capable’ (such as Muslims and immigrants) and least in relation to those they considered less ‘capable’ but more ‘friendly’ (such as disabled people).
Prejudices are likely to be quite specific, and there are differences in the ways that people express their prejudices towards people with different protected characteristics. Although similarly low numbers of people expressed negative feelings towards disabled people with a physical impairment and those with a mental health condition, fewer people were comfortable with the idea of having a person with a mental health condition as their boss or neighbour compared to a disabled person with a physical impairment.
The form and prevalence of prejudice may differ across regions of Britain. For example, the percentage of respondents who expressed negative feelings towards Muslims, immigrants and Gypsies, Roma and Travellers was lower in Scotland than in England.
Our report identifies a set of measures that can be repeated regularly to create a consistent evidence base on the form and prevalence of prejudice and discrimination in Britain. The survey can be adapted and extended to assess specific additional aspects of prejudice and discrimination, as well as affected groups and areas of life not covered in this report. The ongoing development of the survey measures is essential to ensure it remains an accurate, relevant and useful tool for seeking to understand prejudice and discrimination in Britain.
Equality and Human Rights Commission Published: October 2018
12

Developing a national barometer of prejudice and discrimination in Britain
1 | Introduction
This report presents evidence from the first national survey since 2006 to measure prejudice and discrimination in Britain using a consistent set of measures across a range of protected characteristics.
An important and distinctive feature of the survey is that it brings together a set of measures both of people’s experiences of prejudice and of people’s attitudes. This provides a more comprehensive picture of prejudice and discrimination in Britain than single measures allow, and helps us to understand the impact of prejudice on people’s lives.
A second important feature of the survey is that it measures these factors across multiple protected characteristics. This enables us to understand how people’s prejudiced attitudes and experiences of discrimination differ for different protected characteristics, although we were not able to measure all aspects of prejudice across all nine protected characteristics set out under the Equality Act 2010. The survey has been designed to be easy to use and to adapt for different protected characteristics.
This report demonstrates the use and value of a survey of this kind and provides a benchmark for assessing the prevalence of prejudice in Britain against which future evidence can be collected and compared to form a national ‘barometer’ of the changing landscape of prejudice and discrimination in Britain.
1.1 Why do we need a ‘barometer’ to measure prejudice and discrimination?
To tackle prejudice and discrimination faced by people because they share a particular protected characteristic, we first need to understand the levels of prejudice and discrimination in Britain and the forms they take. These forms of prejudice and discrimination may differ depending on which protected characteristics are involved.1
1 For an overview of hate crime legislation in Britain, see Walters, Brown and Wiedlitzka (2017).
Equality and Human Rights Commission Published: October 2018
13
Developing a national barometer of prejudice and discrimination in Britain
The Equality and Human Rights Commission (‘the Commission’) was established under the Equality Act 2006 to work towards the elimination of unlawful discrimination, to promote equality of opportunity, and to protect and promote human rights. The Equality Act 2010 provided a single legal framework to tackle disadvantage and protect people from discrimination. The Act prohibits discrimination against someone because of their perceived age, sex, race,2 disability, religion or belief (including lack of belief), sexual orientation, for being pregnant (or having a baby), being married or in a civil partnership, or being transgender.
In 2016, a review of the available data sources and indicators of prejudice and discrimination used in the last ten years identified a lack of up to date, consistent and comparable measures for understanding the prevalence of prejudice in Britain (Abrams, Swift and Mahmood, 2016). The review revealed that current evidence from Britain does not allow meaningful comparisons across protected characteristics or make it possible to comment on the rate of changes in the nature and extent of prejudice and discrimination.
This research provides a set of measures that can be used by the Commission and others to capture experiences of discrimination across different areas of life (EHRC, 2017), and that provides a picture of prejudice and related attitudes held towards different social groups in society. The survey can be used and extended by others to establish comparable evidence with which to regularly monitor national-level changes in prejudice and discrimination over time. Regularly collected comparable evidence of this type would form a national ‘barometer’ of prejudice and discrimination in Britain.
The set of indicators to measure prejudice used in this survey is based on social psychological theories of prejudice. It draws on questions used in an initial benchmarking study which was commissioned as preparation for the establishment of the Equality and Human Rights Commission, examining prejudices affecting six protected characteristics in 2005 (Abrams and Houston, 2006). We also drew on a database of items identified in the 2016 review (Abrams et al., 2016). The theory and measurement issues underpinning the current research, as well as implications for interventions, are extensively considered in the Commission’s 2010 report ‘Processes of Prejudice’ (Abrams, 2010). The set of measures in the barometer are outlined in chapter 2. The set is not exhaustive but provides sufficient breadth to capture core features of prejudice. What is new in this research is that we are using this set together for the first time since Abrams and Houston (2006), to capture
2 The protected characteristic of race refers to a group of people defined by their race, colour and nationality (including citizenship), ethnic or national origins.
Equality and Human Rights Commission Published: October 2018
14
Developing a national barometer of prejudice and discrimination in Britain
experiences and expressions of prejudice towards most of the protected characteristics. We are measuring these across the same representative sample of respondents (as well as additional samples of people with particular protected characteristics that tend to be under-represented in national surveys). This enables us to compare and draw conclusions about the state of prejudice and discrimination affecting many of the protected characteristics across much of Britain.
Equality and Human Rights Commission Published: October 2018
15

Developing a national barometer of prejudice and discrimination in Britain
2 | Designing the survey
2.1 Defining and measuring prejudice
There are many definitions of prejudice (for example, see Nelson, 2009). The definition we use here captures its primary feature – a bias that is based on whether or not people share membership of particular social categories with each other. Specifically, we define prejudice as:
‘Bias that devalues people because of their perceived membership of a social group.’ (Abrams, 2010)
The term ‘bias’ refers to a preference for or against, but either direction can have harmful consequences. The term ‘perceived membership’ underlines the importance of perception as distinct from any objective information – that is, when people judge or act towards other individuals based on assumptions about differences between groups, their application of these assumptions may well be misguided. Biases and perceptions are not always intentional, easy to recognise or control, but this does not reduce the need to establish their presence and impact.
People may show prejudiced attitudes in a variety of forms. The most obvious are direct and explicit statements of dislike or abuse, but there are also indirect and more subtle forms such as objections to equal rights for particular groups or patronising or ‘benevolent’ stereotypes about particular groups. Even a bias, or preference, in favour of someone based on their perceived group membership can be harmful to people from other groups because it might indirectly imply lower importance, value, status or level of deservingness to those other groups.
Prejudice has been measured in a variety of large surveys, such as research for the Cabinet Office Equalities Review (Abrams and Houston, 2006), surveys by Stonewall (2012; Cowan, 2007), the Scottish Social Attitudes Survey (SSAS) 2006 and 2010 and the British Social Attitudes Survey (BSAS) 2008-14 (NatCen, undated). However, measures vary across different types of research, for different protected characteristic groups, across regions of Britain and are not all conducted regularly enough to get a consistent or comparable picture of prejudice in Britain.
Equality and Human Rights Commission Published: October 2018
16
Developing a national barometer of prejudice and discrimination in Britain
Some key components of prejudice are routinely studied by social psychologists. Some feature occasionally in national surveys but rarely appear together.
These are:
views about equality and equal opportunities for different protected characteristics
the perceived seriousness of the issue of discrimination against different groups can provide insight into awareness and perceptions of the problem
directly expressed positive and negative attitudes towards the group (measured using a ‘feeling thermometer’)
stereotypes of warmth and competence that reflect the core elements of people’s understanding of how groups compare with one another across society
emotions that people feel towards members of different social groups
willingness to maintain ‘social distance’ or engage in social contact with members of other groups in important contexts
the extent of meaningful social contact that actually exists between members of different groups, and
norms and the perceived social acceptability of expressing prejudiced attitudes.
All of these components are well-suited for use in quantitative surveys and we have included them in the survey.3
This survey focused on aspects of prejudice that people are able to recognise or control. There are other forms of prejudice that are not easily measured by surveys, and other methods may be better suited to capture these. For the most part these are not appropriate for large scale evaluation and benchmarking.
We briefly introduce each component included in the survey and provide a summary of the set of the measures we have used in appendix table A.1. The specific items are provided in chapter 4.
3 For an in-depth review of theories of prejudice each measure pertains to, please see Abrams (2010) and Abrams et al. (2016). Other measures that are used in prejudice research include: how we categorise one another; values; political preferences; personality characteristics; their use of various forms of media; their perceptions that particular groups pose a threat to the livelihood or way of life of others; their exposure to certain forms of influence; and their willingness to engage in action to support disadvantaged groups (see Abrams and Houston, 2006). Although all of these are highly relevant to why people are prejudiced (Abrams, 2010), they are beyond the scope of the current work wherein we concentrated on measuring prejudice itself.
Equality and Human Rights Commission Published: October 2018
17

Developing a national barometer of prejudice and discrimination in Britain
2.2 Experiences and perceptions of prejudice
Experiences of prejudice and discrimination
To measure experiences of prejudice we used a measure developed in previous research with Age UK (see Abrams, Eilola and Swift, 2009; Ray, Sharp and Abrams, 2006), the Cabinet Office Equalities Review (Abrams and Houston, 2006) and the 2008 European Social Survey (see Bratt, Abrams, Swift, Vauclair and Marques, 2017). We conducted further pilot work for this survey to ensure that it was well-understood by respondents with different protected characteristics. We used a general measure to ask whether people have experienced prejudice against themselves: ‘In the last year, has anyone shown prejudice against you or treated you unfairly because of your (list of protected characteristics).’
Prejudice can be expressed and experienced in different ways. For example, sometimes it may be directly confrontational but it can also be more patronising or passive (for example, neglectful). Therefore, if people report they had experienced any prejudice, we asked them two further questions (see survey item summary in appendix A) to explore what type of prejudice they had experienced.
Discrimination can be experienced in different areas of life. Some areas of life may pose greater risks of discrimination for groups with a particular protected characteristic than others. Therefore, we asked a further question about the areas of life in which the experiences of prejudice occurred (Q1a).
Importance attached to equality and perceived seriousness of prejudice
We asked respondents to say how much importance they attached to equality, which can then be compared with their responses to other questions about their attitudes towards people with particular protected characteristics. In principle, we would expect most people to place equality very high on their list of value priorities. Similarly, they might be expected to view discrimination on the basis of all protected characteristics as equally serious (Abrams et al., 2015), and we captured this by asking people how serious they felt discrimination was when it was directed at people with particular protected characteristics.
These questions give us insight into whether people apply different standards when thinking about different groups, for example, by endorsing greater protection of equality or by regarding prejudice as a less serious problem in some cases rather than others.
Equality and Human Rights Commission Published: October 2018
18
Developing a national barometer of prejudice and discrimination in Britain
Comparing responses from these two questions with the responses from the experience of prejudice questions provides important information about whether the experiences of people with particular protected characteristics match the general population’s perceptions of how serious a problem prejudice against these groups is. For example, if very few people regard prejudice toward a certain group as being serious, but many members of that group have experienced prejudice, this could indicate that people do not attach much importance to the prejudice (for example, because it is seen as harmless), or aren’t aware of or don’t recognise the treatment as being based in prejudiced or discriminatory attitudes.
2.3 Prejudice
Feeling thermometer
To measure how directly people are willing to admit to feeling negatively about a particular group we based a question on the so-called ‘feeling thermometer’ that has been used in previous work (see Abrams and Houston, 2006; Pettigrew and Meertens, 1995). This is sometimes presented as a picture of a thermometer (ranging from 0 to 100 degrees), on which people are asked to indicate how they feel toward a social group by marking a position on the temperature scale. The measure used in the present research is a version on a five-point scale that asks people, even more directly, how positive or negative they feel about different groups in Britain.
Stereotypes and associated emotions
A stereotype is a shared image of a social category or group that is applied and generalised to members of the group as a whole regardless of their individual qualities. It may or may not be accurate, and stereotypes can sometimes be an important source of prejudice and discrimination because of the assumptions they reinforce and the feelings they arouse.
We used the Stereotype Content Model (Fiske et al., 2002) to examine the two central elements of stereotypes about some minority groups – their warmth and their competence. Different evaluations of warmth and competence tend to imply different emotions towards a given group. These emotions include pity (linked to high warmth and low competence), admiration (high warmth and high competence), contempt and anger (low warmth and low competence) and envy (low warmth and high competence) (Cuddy, Fiske and Glick, 2007). The model has received support from numerous national and international studies involving a very large number of
Equality and Human Rights Commission Published: October 2018
19
Developing a national barometer of prejudice and discrimination in Britain
different groups (Cuddy et al., 2009). Based on the model we also included perceptions of whether the groups are ‘moral’ and whether they are ‘receiving special treatment’, and the emotions of fear and disgust. These stereotypes and emotions are measured in a way that is slightly less direct than the feeling thermometer (asking how the respondent thinks other people view the groups, not how the respondent views them). This is a way of reducing people’s concerns about the social appropriateness of stating that they hold a stereotyped view themselves. But because most people assume others (broadly) share their own views, this is still quite a good measure of stereotypes across society (Robbins and Krueger, 2005).
Social distance
Following a long tradition of research on prejudice we included measures of ‘social distance’, the extent to which people would be comfortable with various degrees of closeness of relationship with members of different groups. This well-established measure is important because it reflects people’s actual behavioural inclination to engage with people with particular characteristics. We asked respondents to what extent they would feel comfortable if a member of the relevant group was their boss, moved in next door to them, or married (or formed a civil partnership) with a close relative (see tables E14-16).
Intergroup contact
The extensive literature on intergroup contact (see Pettigrew, 1998, and Pettigrew and Tropp, 2006 for a meta-analysis of over 500 studies) demonstrates that contact between members of different groups fosters positive intergroup attitudes if the contact also involves similarity, common goals, institutional support and equal status. Research suggests that a critical type of contact is friendship, more specifically the number of friends we have who belong to social groups different from ourselves. If we are friends with people from a different social group we are less likely to sustain prejudicial attitudes towards their group. Friendship builds trust and reduces anxiety about interacting with people from the other group. It also encourages us to take similar perspectives and increases our empathy with other members of their group. Using the measures we developed for research with Age UK and European Social Surveys we asked respondents about the number of friendships they have with people who share different protected characteristics.
Subtle prejudice
Equality and Human Rights Commission Published: October 2018
20

Developing a national barometer of prejudice and discrimination in Britain
An item that is partly a measure of ‘modern’ or ‘subtle prejudice’ is whether people think equality policies to support a particular group have gone too far. Previous research has shown equality is a principle that almost everyone endorses very strongly. Given that equality can only be achieved, not surpassed, people who think equality has gone too far are indirectly expressing prejudice or resentment towards that group. We included two questions on subtle prejudice in the survey: whether attempts to give equal opportunities to different groups in society have gone too far, or not far enough.
Motivation to control prejudice
Finally, expressions of prejudice may be affected by one’s own concerns or by social pressures. To the extent that people feel they do not want to, and do not want to be seen to express prejudice, this promotes a social norm that should gradually make prejudice less likely to emerge or spread. The extent to which such norms are taken on as personal standards for behaviour can therefore be a useful index of progress in tackling prejudice generally. In this research we use measures of ‘internal and external control’ over prejudice to assess these factors, asking people to what extent they act in a non-prejudiced way because it is important them, and to what extent they do so to avoid disapproval from others.
All the items included in the survey, and surveys in which the items have been fielded previously are included in appendix table A.1.
Equality and Human Rights Commission Published: October 2018
21
Developing a national barometer of prejudice and discrimination in Britain
3 | Data collection
3.1 Data collection
The aims of the survey were to gain a representative picture of prejudice and discrimination in Britain, provide insight into the experiences of some relatively small protected characteristic population subgroups, and look at findings separately for England, Scotland and Wales. A full overview of the measures included in the survey can be found in Appendices A and B.
To achieve these aims, the study collected data using the random probability NatCen and ScotCen Panels (which use a sequential online and CATI data collection approach) in combination with the non-probability PopulusLive Panel (which uses online data collection).
We used the PopulusLive panel to provide larger samples of some specific protected characteristic groups – black British people, lesbian, gay and bisexual people, Muslims, and people with mental health conditions – and to boost the size of the sample available in Wales. Non-probability panels provide an effective means of accessing small incidence populations that would be very costly to achieve via probability approaches, although findings should be considered indicative only and treated with caution.
As described in appendix C, probability and non-probability data have been brought together in this study to provide some indicative findings for these small incidence groups. In addition, the probability ScotCen panel was used to provide a sample of sufficient size for robust analysis in Scotland.
3.2 Interpretation and significance testing
Most of the findings in this report refer to the random probability NatCen and ScotCen panels. Where findings relate to data from the non-probability source, this is clearly stated. Statistical testing was applied to the findings that used the probability
Equality and Human Rights Commission Published: October 2018
22

Developing a national barometer of prejudice and discrimination in Britain
samples and differences discussed in the text are significant at the 95% level unless otherwise stated.
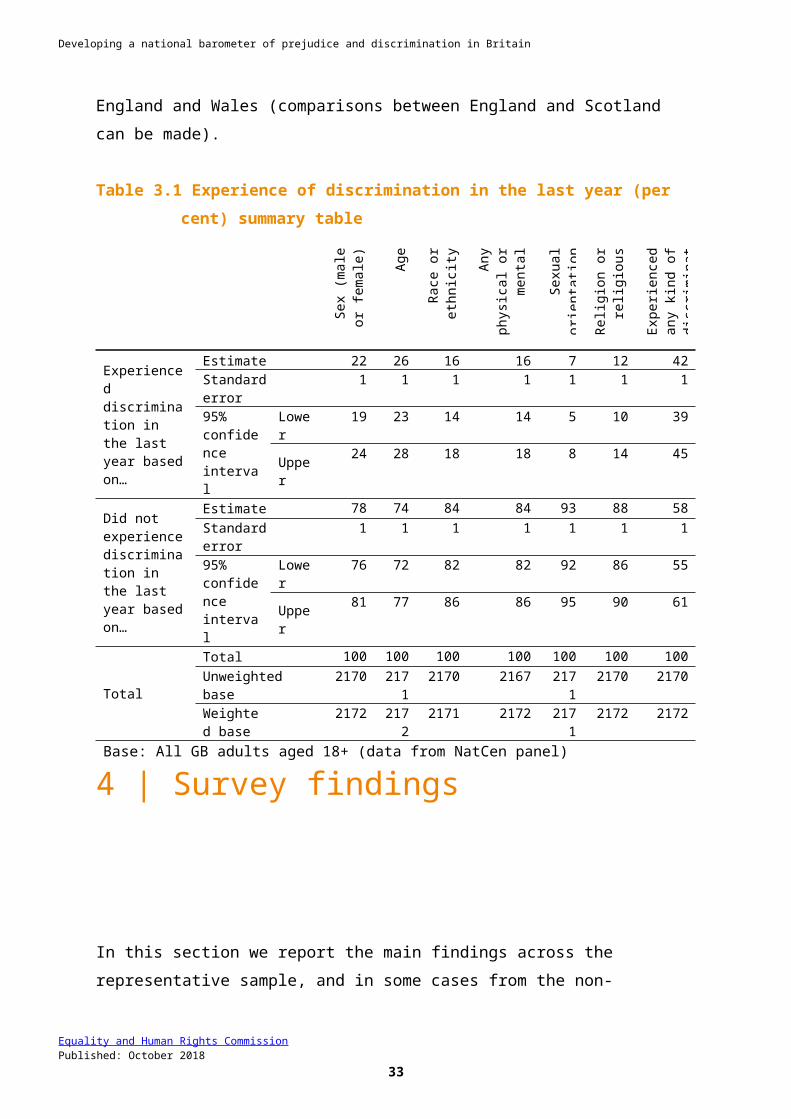
Table 3.1 illustrates the 95% confidence intervals for the key measure of experiences of discrimination.
Where estimates use data from the non-probability panel boosts for specific protected characteristics, these estimates should be considered indicative only and treated with caution. The low incidence of these populations coupled with the non-probability nature of the sample mean we cannot know how representative these samples are of the actual population subgroups.
In order to provide a sufficient number of cases for analysis of people in Wales, a non-probability boost was matched to the probability sample and a weight developed. For the English and Scottish analysis, only data from the probability panels were used. Whilst analysis can be carried out within the resulting Welsh sample, the different methodologies used for cases in Wales mean that direct comparisons should not be made between England and Wales (comparisons between England and Scotland can be made).
Table 3.1 Experience of discrimination in the last year (per cent) summary table
Sex
(mal
e or
fe
mal
e)
Age
Race
or
ethn
icity
Any
phys
ical
or m
enta
l he
alth
co
nditi
on y
ou
Sexu
al
orie
ntat
ion
Relig
ion
or
relig
ious
be
liefs
Expe
rienc
ed
any
kind
of
disc
rimin
atio
Experienced discrimination in the last year based on…
Estimate 22 26 16 16 7 12 42Standard error 1 1 1 1 1 1 195% confidence interval
Lower
19 23 14 14 5 10 39
Upper
24 28 18 18 8 14 45
Did not experience discrimination in the last year based on…
Estimate 78 74 84 84 93 88 58Standard error 1 1 1 1 1 1 195% confidence interval
Lower
76 72 82 82 92 86 55
Upper
81 77 86 86 95 90 61
Total
Total 100 100 100 100 100 100 100Unweighted base
2170 2171
2170 2167 2171
2170 2170
Weighted base 2172 217
22171 2172 217
12172 2172
Base: All GB adults aged 18+ (data from NatCen panel)
Equality and Human Rights Commission Published: October 2018
23

Developing a national barometer of prejudice and discrimination in Britain
4 | Survey findings
In this section we report the main findings across the representative sample, and in some cases from the non-probability boost samples, for individual measures of prejudice. Statistical testing was applied to the findings that used the probability samples and differences discussed in the text are significant at the 95% level.
4.1 Equality endorsement
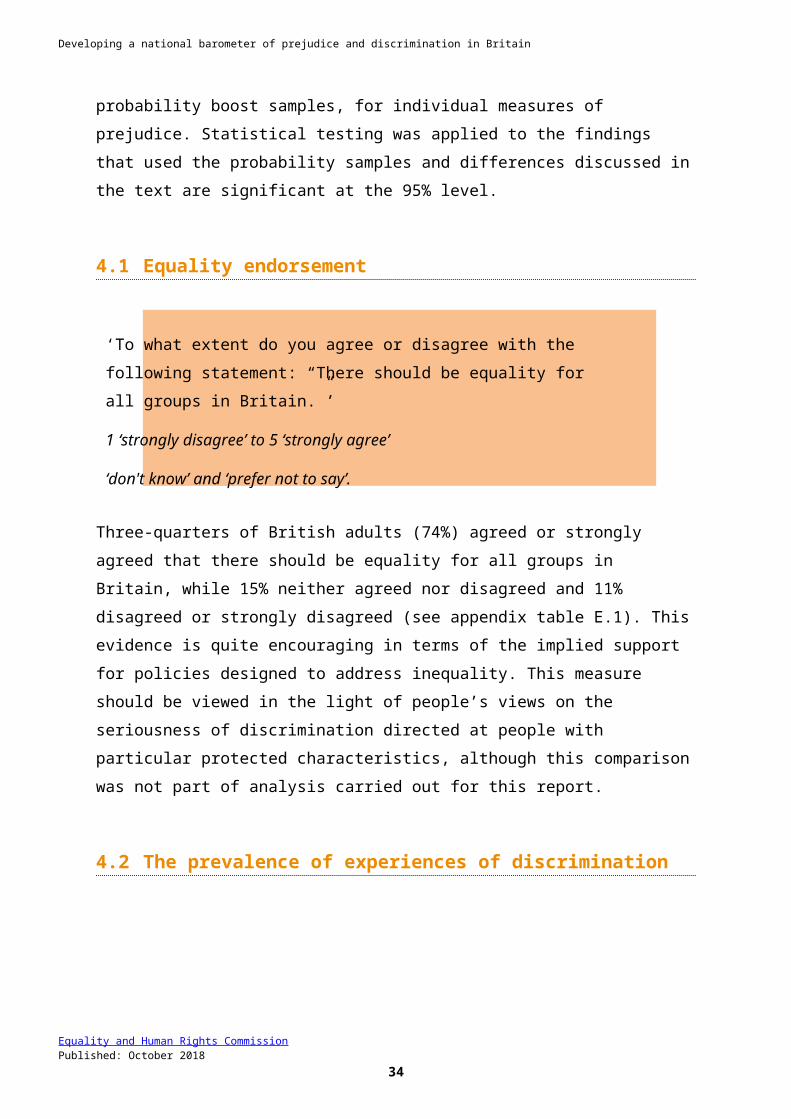
Three-quarters of British adults (74%) agreed or strongly agreed that there should be equality for all groups in Britain, while 15% neither agreed nor disagreed and 11% disagreed or strongly disagreed (see appendix table E.1). This evidence is quite encouraging in terms of the implied support for policies designed to address inequality. This measure should be viewed in the light of people’s views on the seriousness of discrimination directed at people with particular protected characteristics, although this comparison was not part of analysis carried out for this report.
Equality and Human Rights Commission Published: October 2018
24
‘To what extent do you agree or disagree with the following statement: “There should be equality for all groups in Britain.”’
1 ‘strongly disagree’ to 5 ‘strongly agree’
‘don't know’ and ‘prefer not to say’.

Developing a national barometer of prejudice and discrimination in Britain
4.2 The prevalence of experiences of discrimination
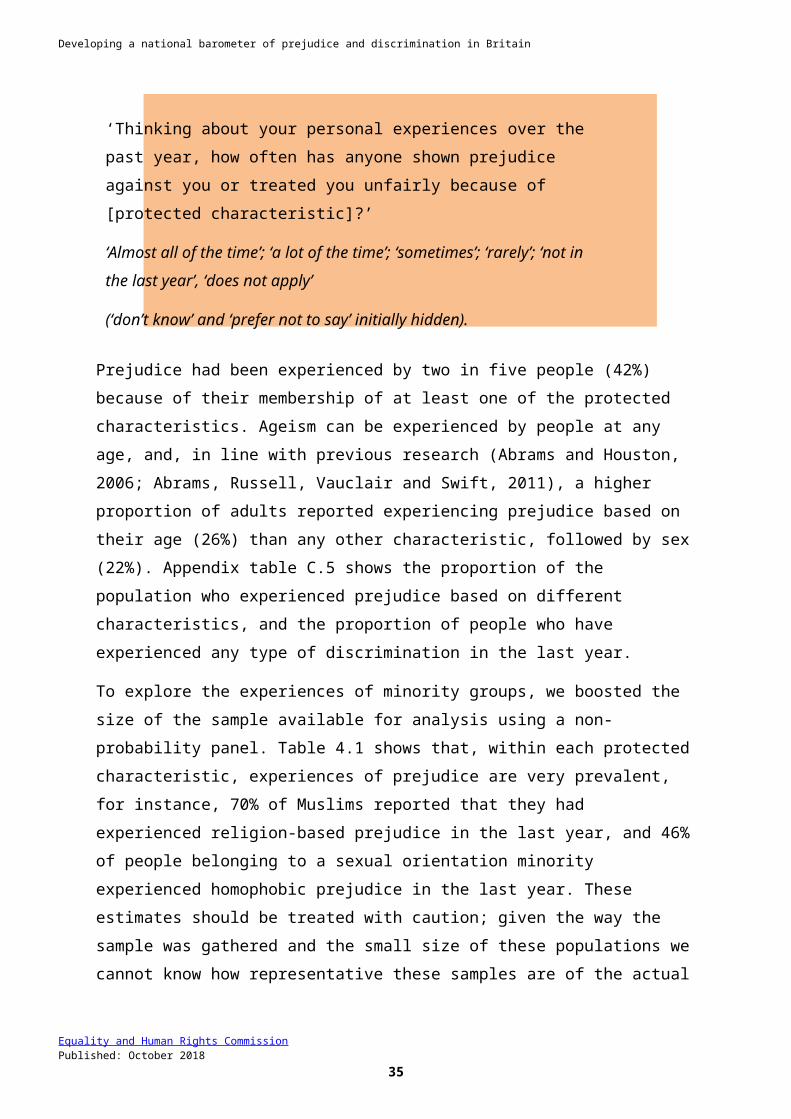
Prejudice had been experienced by two in five people (42%) because of their membership of at least one of the protected characteristics. Ageism can be experienced by people at any age, and, in line with previous research (Abrams and Houston, 2006; Abrams, Russell, Vauclair and Swift, 2011), a higher proportion of adults reported experiencing prejudice based on their age (26%) than any other characteristic, followed by sex (22%). Appendix table C.5 shows the proportion of the population who experienced prejudice based on different characteristics, and the proportion of people who have experienced any type of discrimination in the last year.
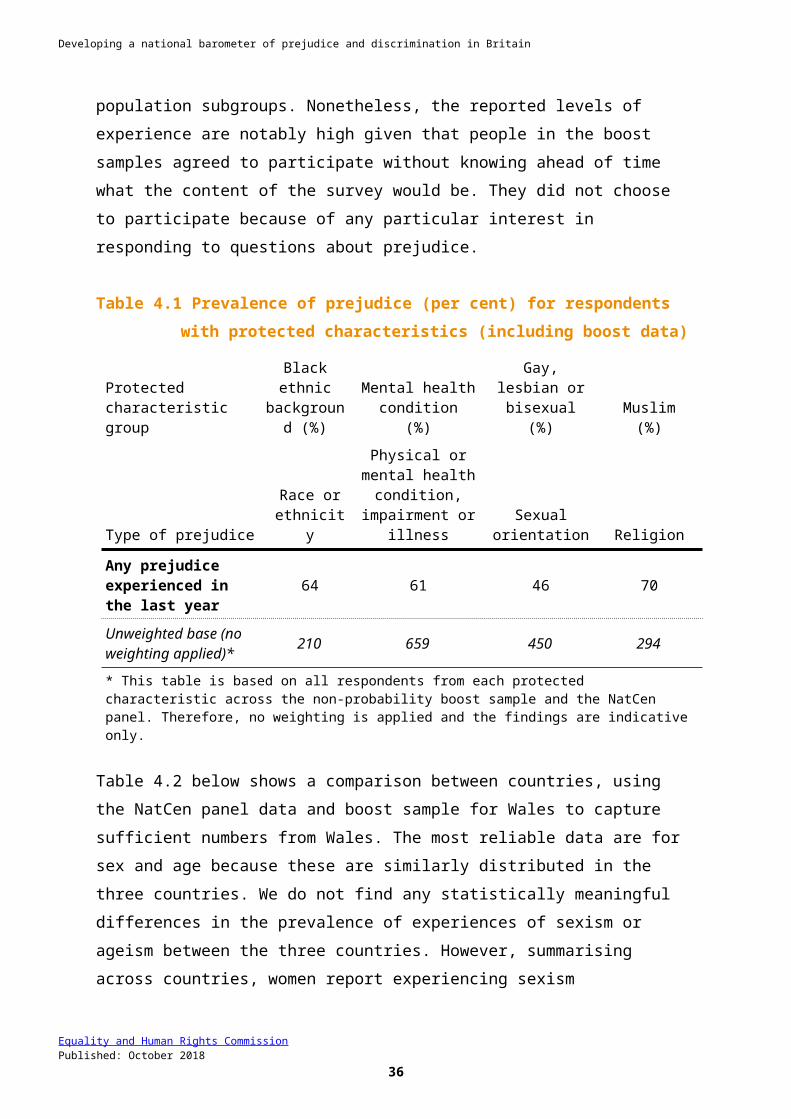
To explore the experiences of minority groups, we boosted the size of the sample available for analysis using a non-probability panel. Table 4.1 shows that, within each protected characteristic, experiences of prejudice are very prevalent, for instance, 70% of Muslims reported that they had experienced religion-based prejudice in the last year, and 46% of people belonging to a sexual orientation minority experienced homophobic prejudice in the last year. These estimates should be treated with caution; given the way the sample was gathered and the small size of these populations we cannot know how representative these samples are of the actual population subgroups. Nonetheless, the reported levels of experience are notably high given that people in the boost samples agreed to participate without knowing ahead of time what the content of the survey would be. They did not choose to participate because of any particular interest in responding to questions about prejudice.
Table 4.1 Prevalence of prejudice (per cent) for respondents with protected characteristics (including boost data)
Protected characteristic group
Black ethnic background
Mental health condition
Gay, lesbian or bisexual
Muslim (%)
Equality and Human Rights Commission Published: October 2018
25
‘Thinking about your personal experiences over the past year, how often has anyone shown prejudice against you or treated you unfairly because of [protected characteristic]?’
‘Almost all of the time’; ‘a lot of the time’; ‘sometimes’; ‘rarely’; ‘not in the last year’, ‘does not apply’
(‘don’t know’ and ‘prefer not to say’ initially hidden).

Developing a national barometer of prejudice and discrimination in Britain
(%) (%) (%)
Type of prejudiceRace or ethnicity
Physical or mental health condition,
impairment or illness
Sexual orientation Religion
Any prejudice experienced in the last year
64 61 46 70
Unweighted base (no weighting applied)* 210 659 450 294
* This table is based on all respondents from each protected characteristic across the non-probability boost sample and the NatCen panel. Therefore, no weighting is applied and the findings are indicative only.
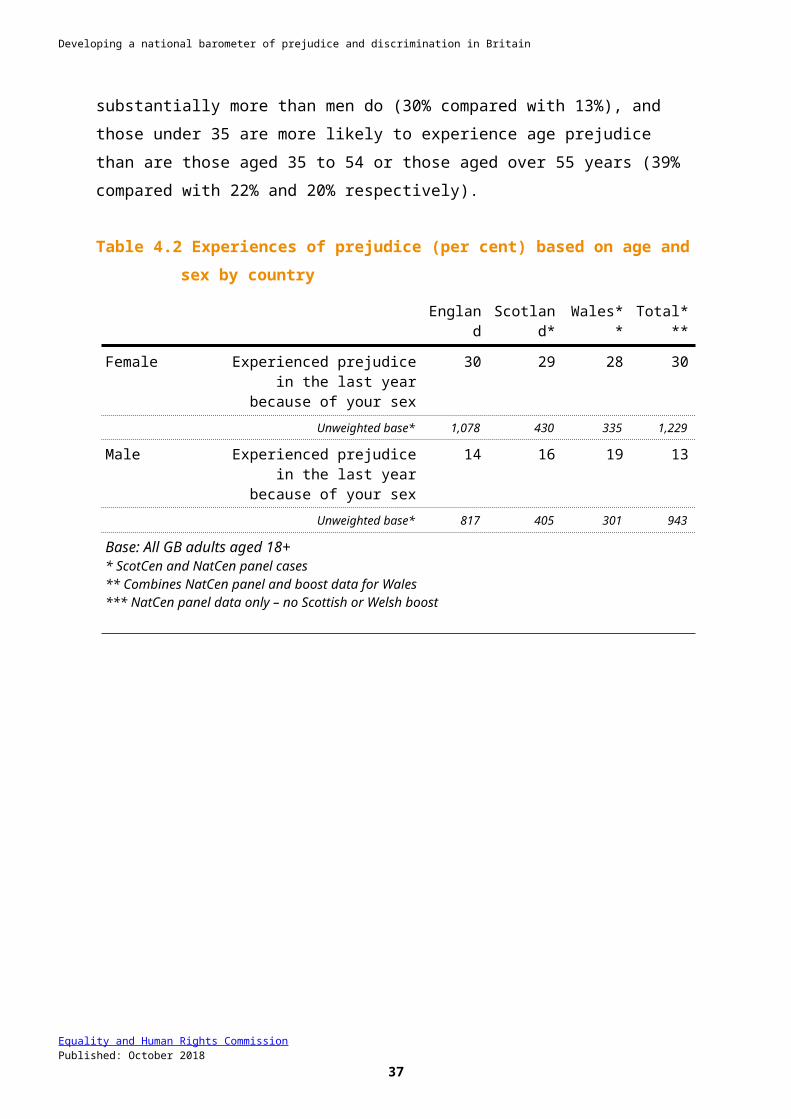
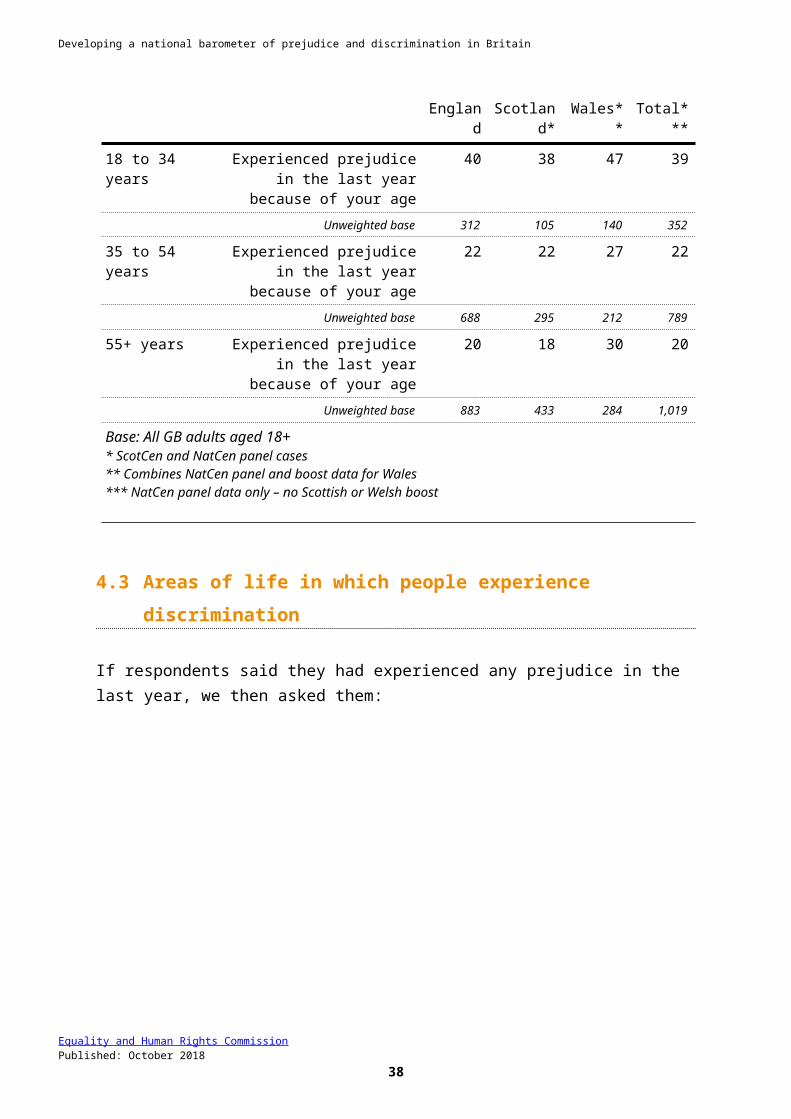
Table 4.2 below shows a comparison between countries, using the NatCen panel data and boost sample for Wales to capture sufficient numbers from Wales. The most reliable data are for sex and age because these are similarly distributed in the three countries. We do not find any statistically meaningful differences in the prevalence of experiences of sexism or ageism between the three countries. However, summarising across countries, women report experiencing sexism substantially more than men do (30% compared with 13%), and those under 35 are more likely to experience age prejudice than are those aged 35 to 54 or those aged over 55 years (39% compared with 22% and 20% respectively).
Table 4.2 Experiences of prejudice (per cent) based on age and sex by country
England Scotland* Wales** Total***
Female Experienced prejudice in the last year because of your sex
30 29 28 30
Unweighted base* 1,078 430 335 1,229
Male Experienced prejudice in the last year because of your sex
14 16 19 13
Unweighted base* 817 405 301 943
Base: All GB adults aged 18+ * ScotCen and NatCen panel cases** Combines NatCen panel and boost data for Wales *** NatCen panel data only – no Scottish or Welsh boost
Equality and Human Rights Commission Published: October 2018
26
Developing a national barometer of prejudice and discrimination in Britain
England Scotland* Wales** Total***
18 to 34 years Experienced prejudice in the last year because of your age
40 38 47 39
Unweighted base 312 105 140 352
35 to 54 years Experienced prejudice in the last year because of your age
22 22 27 22
Unweighted base 688 295 212 789
55+ years Experienced prejudice in the last year because of your age
20 18 30 20
Unweighted base 883 433 284 1,019
Base: All GB adults aged 18+ * ScotCen and NatCen panel cases** Combines NatCen panel and boost data for Wales *** NatCen panel data only – no Scottish or Welsh boost
4.3 Areas of life in which people experience discrimination
If respondents said they had experienced any prejudice in the last year, we then asked them:
Equality and Human Rights Commission Published: October 2018
27
‘In which area of your life did the experience of prejudice occur in relation to your age, sex (male or female), race or ethnicity, any physical or mental health condition, impairment or illness you may have, sexual orientation, religion or religious beliefs?’
‘access to or experience of education or training’
‘access to employment or experience at work’
‘access to or experience of health or social care’
‘access to or experience of the police or criminal justice system’ ‘access to housing or benefits’
‘access to or experience of public transport’
‘as a consumer (using shops or services)’
‘experience of a social situation, or with close peers or friends’
‘another area’

Developing a national barometer of prejudice and discrimination in Britain
The areas of life selected were not intended to cover every eventuality but were derived from the domains in the Equality and Human Rights Commission’s measurement framework for equality and human rights and analysis of previous UK research on people’s experiences of prejudice (Abrams et al., 2016).
Sixty per cent of those who had experienced prejudice said it arose in social situations or with close peers or friends, and nearly half (46%) had experienced prejudice or discrimination in employment or at work. Over a third (35%) had experienced it as a consumer, dealing with shops or services, while a quarter (25%) had done so when using some form of public transport (see table E.6 in appendix). Further analysis will be needed to know whether these differences are due to a person’s greater likelihood of having contact with or experiencing an area of life, or if they reflect genuine differences in the likelihood of a person with a particular protected characteristic experiencing prejudice when in that setting. The survey did not ask separately about online experiences, but this may be an important additional area to consider in future rounds of the survey.
4.4 Perceived seriousness of discrimination
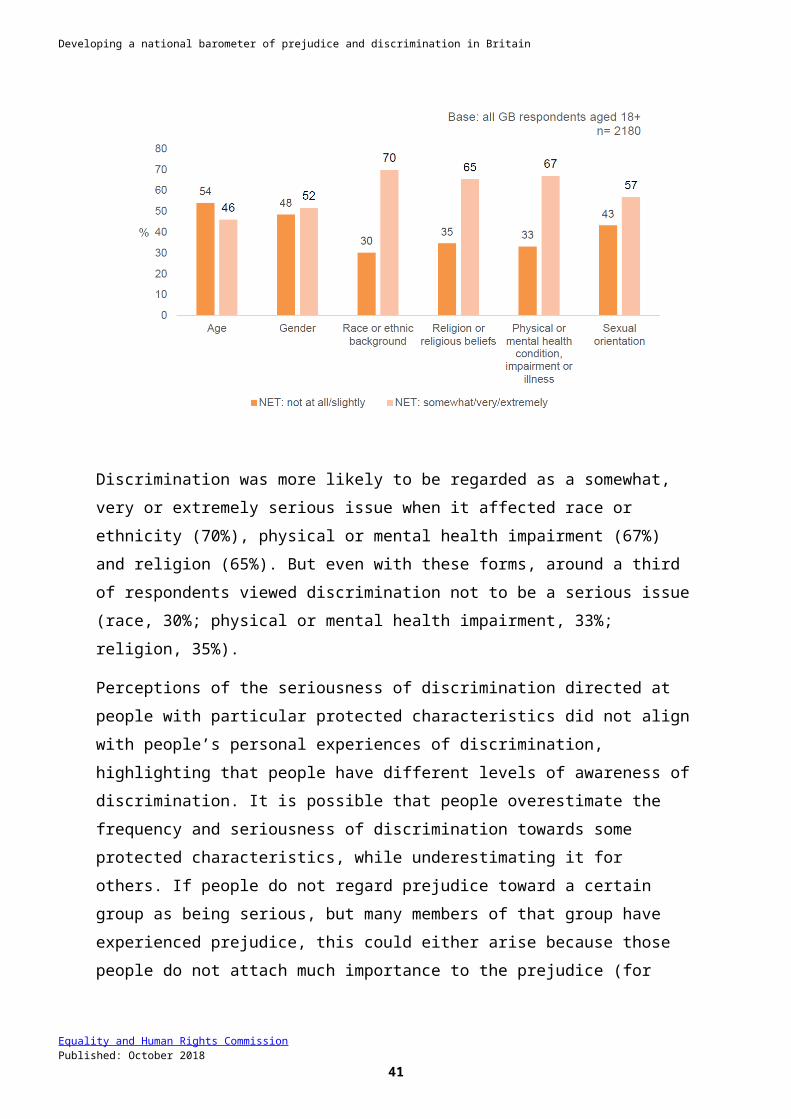
Figure 4.1 shows the percentage of people across Britain who reported the issue of discrimination to be very or extremely serious, somewhat, or only a slight or non-serious issue in the case of each protected characteristic. Note that we have included all respondents in this analysis as the aim is to capture the overall prioritisation of tackling prejudices across society. Future work should consider how these perceptions differ depending on people’s membership of different protected characteristics.
Figure 4.1 Perceived seriousness of discrimination
Equality and Human Rights Commission Published: October 2018
28
‘In this country nowadays, how serious is the issue of discrimination against people because of each of the following [protected characteristics listed]?’
‘not at all serious’, ‘slightly serious’, ‘somewhat serious’, ‘very serious’ or ‘extremely serious’
‘don't know’ and ‘prefer not to say’.

Developing a national barometer of prejudice and discrimination in Britain
Discrimination was more likely to be regarded as a somewhat, very or extremely serious issue when it affected race or ethnicity (70%), physical or mental health impairment (67%) and religion (65%). But even with these forms, around a third of respondents viewed discrimination not to be a serious issue (race, 30%; physical or mental health impairment, 33%; religion, 35%).
Perceptions of the seriousness of discrimination directed at people with particular protected characteristics did not align with people’s personal experiences of discrimination, highlighting that people have different levels of awareness of discrimination. It is possible that people overestimate the frequency and seriousness of discrimination towards some protected characteristics, while underestimating it for others. If people do not regard prejudice toward a certain group as being serious, but many members of that group have experienced prejudice, this could either arise because those people do not attach much importance to the prejudice (for example, because it is seen as harmless), or because people are unaware that treatment of the group is based on prejudicial biases. A question for future research and policy is whether more needs to be done to expand people’s understanding of the seriousness of prejudice and discrimination, including the societal implications as well as the personal implications.
An important area for future analysis of this data is the relationships between how seriously people view different types of prejudice and their support for equality for people that share particular protected characteristics.
Equality and Human Rights Commission Published: October 2018
29
Developing a national barometer of prejudice and discrimination in Britain
4.5 Overtly positive and negative attitudes (feeling thermometer)
It is important not to interpret feeling thermometer data at face value. The feelings are not ‘absolute’ in any sense but reflect how respondents feel about different groups relative to others.
The feeling thermometer question was asked about the following protected characteristic groups: men, women, people aged over 70, people aged under 30, black people, Muslims, immigrants, Gypsy, Roma and Travellers, gay, lesbian and bisexual people, transgender people and disabled people (physical impairment and mental health). The measure tells us about the extent to which different groups in society may be the target of overtly negative attitudes. But it also sheds light on the presence of more implicit forms of bias – the relative positivity to some groups rather than others. The thermometer measure also reflects the social conventions governing whether people feel able to express antipathy openly towards particular groups. The thermometer gives us insight into which groups are most likely to be vulnerable to expressions of direct hostility, but it is less sensitive to other forms of discrimination which can be directed at groups that attract ‘positive’ evaluations, such as older people, women and disabled people with physical impairment.
A simple way to illustrate the findings is the percentage that expressed a negative, neutral or positive feeling about the minority categories. This is depicted in figure 4.2, which excludes the respondents who themselves were a member of the relevant group (for example, we show men’s attitudes towards women and women’s attitudes towards men; we show the attitude of non-Muslims towards Muslims, etc.).
Equality and Human Rights Commission Published: October 2018
30
‘In general, how negative or positive do you feel towards each of the following groups in [Britain]?’
1 ‘very negative’ to 5 ‘very positive’
‘don’t know’; ‘prefer not to say’.

Developing a national barometer of prejudice and discrimination in Britain
Figure 4.2 Feelings towards people with each protected characteristic, excluding those who belong to the target protected characteristic
0
10
20
30
40
50
60
70
62 4 6 5
3 5
44
2227
16
9
44
38 3943 44
38
45
36
4439
47 4750
6057
51 51
59
50
20
35 3437
44
Net Negative Neither negative nor positive Net Positive
%
Base – all GB adults, excluding those belonging to the target group. Unweighted n: Men 1,231; women 945; people aged over 70 1,852; people aged under 30 1,979; people with a mental health condition 1,957; disabled people with a physical impairment 1,580; black people 2,129; Gypsy, Roma and Travellers 2,169; Muslims 2,123; immigrants 2,171; people who present their gender differently to the one they were assigned at birth 2,171; gay, lesbian and bisexual people 2,034.
Equality and Human Rights Commission Published: October 2018
31
Towards a national barometer of prejudice and discrimination in Britain
Openly positive feelings were expressed by more than half of respondents towards many protected characteristics. Gypsy, Roma and Travellers were the only protected characteristic group for which the most frequent response was openly negative (44%). Fewer than half of respondents expressed positive feelings towards Muslims, immigrants, gay, lesbian or bisexual people, and transgender people, and for these protected characteristics the most common response was neutral.
When respondents express a neutral view it may reflect genuinely that they feel neither positive nor negative feelings toward the group. But it is also possible that they feel ambivalent – positive about some members of the group, but negative about other members. A third possibility is that a neutral response reflects negative feelings that people feel inhibited from expressing, and so hide behind ‘no opinion’ responses (Berinsky, 2004). Therefore, the balance between neutral and positive evaluations is informative.
There are also differences in feeling thermometer scores between nations. Table 4.3, shows the percentage of all respondents from the NatCen panel and the Welsh boost sample who expressed negativity towards the different groups.
Table 4.3 Negative feelings expressed (%) towards people with particular protected characteristics across England, Scotland and Wales
Scotland % England % Wales* %
Men 4 5 3
Aged over 70 4 4 3
Women 2 2 2
Black people 4 5 6
People who present their gender differently to the one they were assigned at birth
15 16 19
Muslims 15 22 29
People with a mental health condition
4 5 5
Gay, lesbian or bisexual people 8 9 9
Immigrants 20 27 31
Disabled people with a physical impairment
2 3 3
Gypsy, Roma and Travellers 31 44 42
People aged under 30 5 6 7
Unweighted base 837 1903 636* Note: Base includes all respondents (including boost in Wales)
Equality and Human Rights Commission Published: October 2018 32
Towards a national barometer of prejudice and discrimination in Britain
It is noticeable that the percentage of respondents who express negativity is lower in Scotland than in England or Wales in relation to feelings towards Muslims, immigrants and Gypsy, Roma and Travellers. Further analysis could illuminate the reasons for this finding, and it should be interpreted in the context of, amongst other factors, the extent to which opportunities for contact between these minorities and other groups exist and occur in these different regions.
4.6 Stereotypes
The classification of several groups along dimensions of competence and warmth has been examined in several countries around the world (Fiske et al., 2002; Cuddy et al., 2009). Figure 4.3 shows evaluations of groups along these two dimensions. Whether a group is viewed as capable or friendly can affect the form of prejudice that emerges towards them. Because of this, it is important to consider these stereotypic evaluations relative to one another. For ease of comparison we have grouped characteristics that tend to share common stereotypical characteristics. This is simply for visual purposes and is not a statistically based grouping. According to this previous research, those viewed as being relatively high in competence (capability) and warmth (friendliness) are likely to be viewed with admiration. Here we find women were viewed most positively as high in competence and warmth, followed by gay, lesbian and bisexual people and black people.
Groups that are only evaluated highly on one dimension are typically perceived less favourably. People over 70 and disabled people with a physical impairment are perceived to be relatively warm but relatively less capable. These groups are likely to be viewed with pity. Immigrants, Muslims and people with a mental health condition are all perceived as the least warm groups, but they differ in terms of perceived competence. Groups that are perceived as less warm but as somewhat competent
Equality and Human Rights Commission Published: October 2018 33
‘To what extent are people viewed in the following ways:
As capable
As friendly’
1 ‘strongly disagree’ to 5 ‘strongly agree’
‘don't know’ and ‘prefer not to say’.
Towards a national barometer of prejudice and discrimination in Britain
are likely to experience envy from others, and envy generates dislike and hostility. Groups are perceived as being relatively low in both competence and warmth tend to be accorded lower social status and more likely to be viewed with contempt.
Figure 4.3 Evaluations of each protected characteristic group on warmth and competence
Equality and Human Rights Commission Published: October 2018 34
Towards a national barometer of prejudice and discrimination in Britain
4.7 Social distance
The responses to these questions can be assessed in various ways (for example, on how many of the items people say they would be uncomfortable with, or their average level of discomfort, etc.). As with the thermometer data it is also useful to compare social distance responses toward different protected characteristics. Figure 4.4 and figure 4.5 show, for example, that there is quite strong discomfort with the idea of connection to a person with a mental health condition, not only as a boss (25%), but also as a family member (29%). However, we did not apply all questions to all protected characteristics in this survey, both for practical and survey-length considerations.
Figure 4.4 How comfortable would you feel if a member of the relevant group was appointed as your boss?
Equality and Human Rights Commission Published: October 2018 35
‘How comfortable or uncomfortable do you think you would feel if a suitably qualified person was appointed as your boss if they were…’ [protected characteristics included are: a person with a mental health condition, a black person, a Muslim, a pregnant woman or new mother, a woman, a gay, lesbian or bisexual person, a disabled person with physical impairment, a person over 70]
‘How comfortable or uncomfortable do you think you would feel if someone married one of your close relatives (such as a brother, sister, child or re-married parent if they were…’ [protected characteristics included are: a person who represent their gender differently, an immigrant, a gay, lesbian or bisexual person, a Muslim]
‘How comfortable or uncomfortable do you think you would feel if someone moved in next door to you if they were…’ [protected characteristics included are: a black person, a person with a mental health condition, an immigrant, a disabled person]
1 ‘very comfortable’ to 5 ‘not very comfortable’
‘don't know’ and ‘prefer not to say’.
Towards a national barometer of prejudice and discrimination in Britain
0
10
20
30
40
50
60
70
80 7773 71 67
61 58
48
35
19 21 22 23
34 3337
40
4 6 8 95
915
25
Net: Comfortable Neither comfortable nor uncomfortableNet: Uncomfortable
%
Base – all GB respondents excluding target group: person with a mental health condition 933; a black person 1,027; a Muslim 1,031; a pregnant woman or new mother 1,123; a woman 482; a gay lesbian or bisexual person 1,057; a disabled person with a physical impairment 834; person aged over 70 900.
Figure 4.5 How comfortable would you feel if a member of the relevant protected characteristic moved in next door to you?
A person who presents their gender differently to the one
they were assigned at birth
An immigrant A gay, lesbian or bisexual person
A Muslim0
10
20
30
40
50
60
70
5248
63
45
34 3329
37
1419
8
18
Net: Comfortable Neither comfortable nor uncomfortableNet: Uncomfortable
%
Base – all GB adults aged 18+ excluding the target group: a person who presents their gender differently to the one they were assigned at birth 1,051; an immigrant 1,126; a gay, lesbian or bisexual person 1,058; a Muslim 1,033.
Equality and Human Rights Commission Published: October 2018 36
Towards a national barometer of prejudice and discrimination in Britain
Figure 4.6 shows that around one fifth of respondents said they would feel uncomfortable if either an immigrant or a Muslim person moved in next door.
Figure 4.6 How comfortable would you feel if a person with one of the relevant protected characteristics married one of your close relatives?
A blac
k per
son
A perso
n with
a menta
l hea
lth co
nditio
n
An immigr
ant
A disa
bled per
son w
ith a
physic
al im
pairm
ent
0
20
40
6059
35
5063
32 3630 29
9
2920
8
Net: Comfortable Neither comfortable nor uncomfortableNet: Uncomfortable
%
Base – all GB adults aged 18+ excluding the target group: a black person 1,032; a person with a mental health condition 938; an immigrant 1,124; a disabled person with a physical impairment 835.
Figure 4.6 and figure 4.8 also show that attitudes in relation to disability differs markedly depending on whether we ask about physical and mental conditions. It is worth recalling that the feeling thermometer revealed similarly (very) low numbers of respondents who expressed negative feelings toward either group (figure 4.2). Yet the social distance evidence highlights that prejudices are likely to be quite specific and can manifest differently for different types of protected characteristic. It also suggests that people with mental health conditions may be particularly vulnerable (relative to other protected characteristics) to stigmatisation and exclusion from social relationships if their condition is known.
Equality and Human Rights Commission Published: October 2018 37
Towards a national barometer of prejudice and discrimination in Britain
4.8 Equality endorsement for specific protected characteristics
Around a third of respondents thought equal opportunities efforts had gone ‘too far’ in the case of Muslims (33%) and immigrants (37%) (figure 4.7). In contrast, only 4% and 5% thought this in relation to people with mental health conditions or disabled people with physical impairments.
Around half of respondents thought attempts to give equal opportunities were ‘about right’ for black people (57%) and gay, lesbian and bisexual people (51%).
It is interesting to compare responses to this question with the stereotype responses reported in section 4.6. For example, it is clear that resistance to improving equal opportunities is greatest toward those groups that are seen as least warm and as having some competence (Muslims and immigrants). Conversely, those perceived to have least competence but quite high warmth are seen as deserving much more effort and support, with nearly two thirds agreeing that equal opportunities efforts had not gone far enough for people with a mental health condition (63%) and with a physical impairment (60%). The groups that tended to be viewed as having both relatively high competence and warmth are those that most respondents felt attempts to give equal opportunities to were ‘about right’.
Figure 4.7 Have attempts to give equal opportunities to the following groups gone too far or not far enough?
Equality and Human Rights Commission Published: October 2018 38
‘Now we want to ask your personal opinion about some changes that have been happening in this country over the years. Have attempts to give equal opportunities to each of the following groups gone too far or not far enough?’
Gone much too far, gone too far, about right, not gone far enough, not gone nearly far enough’
‘don't know’ and ‘refuse to respond’.

Towards a national barometer of prejudice and discrimination in Britain
0
20
40
60
411
33 37
5
2010 5
32
57
4133 35
51 50 49
63
32 27 30
60
3040
47
Net: gone too far About right Net: not gone far enough
%
Base – all GB adults aged 18+ excluding target group: people with a mental health condition 927; black people 1,024; Muslims 1,023; immigrants* 1,118; disabled people with a physical impairment 830; gay, lesbian or bisexual people 1,049; women 485; people aged over 70 889* It was not recorded whether respondents were immigrants so this column contains all respondents
4.9 Intergroup contact
The theories about inter-group contact show that positive personal relationships, especially friendship with members of other groups, are important determinants for reducing prejudice between different groups. Therefore, the type of contact we investigated was the number of friendships, but other research has investigated contact in other contexts such as family and work. The most important difference is between having no friends and having at least one friend because having any friends from another group is likely to have a positive effect. Figure 4.8 shows the
Equality and Human Rights Commission Published: October 2018 39
‘Of your friends or people you feel close to, how many are in any of the following groups? People aged over 70, people with a mental health condition, Black people, immigrants, Muslims, Disabled people (physical impairment) and sexual orientation.’
‘none’, ‘1’, ‘2–5’, 6–9’ or ’10 or more’
‘don't know’ and ‘prefer not to say’.

Towards a national barometer of prejudice and discrimination in Britain
percentage of participants who have no friends and those that have at least one friend from different groups.
Figure 4.8 Percentage of respondents that have friendships with different groups (excluding members of the target group)
0
10
20
30
40
50
60
70
80
90
100
3
2027 28
39 40
53 55
97
8073 72
61 60
47 45
NET: None NET: One or more
%
These results need to be interpreted carefully, considering the opportunities for contact. If only a small proportion of people have a certain protected characteristic then relatively small numbers of others could have them as friends (assuming most people have a fairly limited set of possible friendships). The sample size limits our capacity to comment on regional differences but there are obviously some regions and cities in which it is much less likely that one would find an immigrant or a Muslim person to befriend. However, evidence that over half of respondents have no friends who are immigrants or none who are Muslim (53% and 55% respectively) is also consistent with the earlier finding that social distance from these two groups tends to be highest. Future work will need to establish whether there are strong regional variations and whether regional and local residential integration yield more positive attitudinal changes (and vice versa) over time.
However, some findings cannot be attributed to the possibility that some people simply have no chance to meet certain groups (for example, due to geographical concentrations of particular protected characteristics). For example, given that older people and people with physical disabilities are likely to live throughout the country it
Equality and Human Rights Commission Published: October 2018 40
Towards a national barometer of prejudice and discrimination in Britain
is perhaps surprising that 20% of people have no friends who are aged over 70 and 40% have no friends with a physical impairment. Both of these findings might reflect local age segregation in social relationships.
4.10 Motivation to control prejudice
There are clear social norms against expressing prejudice. However, social psychological research shows that people’s internal or personal concern about being prejudiced is different from their external, or social, concern about being perceived by others as prejudiced (Monteith et al., 1998; Plant and Devine, 1998).
Of those surveyed, 76% agreed that they attempt to act in a non-prejudiced way towards other groups because it is personally important to them. A total of 44% of those who agreed it was personally important to them to control prejudice disagreed that they attempt to control prejudice in order to avoid disapproval from others. Eleven per cent said they felt neither motivation to avoid prejudice, and 22% said they had both motivations.
This shows the importance of assessing both types of motivation and not assuming that people limit their prejudices solely for one reason. The important implication of this evidence is that interventions that target one type of motivation may not necessarily affect the other. So, motivating people to be unprejudiced by highlighting the personal value of not being prejudiced may not be sufficient for them not to appear prejudiced in front of others. Therefore, their unconscious biases may persist. Conversely, targeting the appearance of behaviour may not reduce the underlying motivation to be non-prejudiced, and might even reinforce prejudices if people feel coerced into resisting their personally held attitudes.
Equality and Human Rights Commission Published: October 2018 41
‘To what extent do you agree or disagree with the following statement: “I attempt to act in non-prejudiced ways toward other groups because it is personally important to me.”
‘To what extent do you agree or disagree with the following statement: “I try to appear non-prejudiced toward other groups in order to avoid disapproval from others.”
1 ‘strongly disagree’ to 5 ‘strongly agree’
‘don't know’ and ‘refuse to respond’.
Towards a national barometer of prejudice and discrimination in Britain
4.11 Summary
It is striking that more than four in ten people (42%) said they had been the target of some form of prejudice or discrimination in the past 12 months. Across the population as a whole, age and gender discrimination were found to be the most commonly reported. As the largest population groups this is not necessarily surprising; it is important to consider the proportion of a population that is affected so as not to underestimate the experiences of minority groups. The survey revealed that some groups in Britain face particular challenges; 70% of Muslims sampled said they had experienced prejudice motivated by their religion or belief, and 46% of lesbian, gay or bisexual people sampled said they had experienced prejudice based on their sexual orientation, while a high portion of respondents expressed openly negative attitudes towards Gypsies, Roma and Travellers.
This survey demonstrates the useful insights that a barometer based on these measures could provide. By assessing not just whether but also where discrimination arises, these measures could provide useful insights into where interventions may be most urgently required. Respondents across all protected characteristics were most likely to report that these experiences of discrimination had happened to them in informal social situations. This is important as it is the only setting in the survey that is not regulated in some way, and which it would be difficult or impossible to regulate. The second most common area of life in which people’s experiences took place was employment. However, further analysis is needed to establish whether these findings reflect the frequency of contact a person has with these settings, or if prejudice is more likely to occur for these groups in these settings.
Most respondents said they value the principle of equality for all groups in Britain (only 11% did not), but it is also clear that some people do not regard this principle as something that should be applied equally strongly to all groups in society. Underpinning these differences is that respondents tend to regard some groups as more vulnerable or dependent than others, and it tends to be for these groups (for example older people and disabled people) that others consider that attempts to give equal opportunities had not gone far enough. Other groups, such as Gypsy, Roma and Travellers, are viewed by others as less warm, less deserving of equality and as a lower priority in terms of the seriousness of discrimination on the basis of race and ethnicity.
Equality and Human Rights Commission Published: October 2018 42
Towards a national barometer of prejudice and discrimination in Britain
Our findings suggest a lack of social contact even for those protected characteristics that are more evenly distributed geographically across the population. For example, one in five people aged under 70 have no friends who are aged over 70, and 40% of non-disabled respondents have no friends with a physical impairment. Lack of connection makes it harder to break down social barriers, or may even create greater resistance to forming new relationships. Nearly a fifth of respondents said they would be uncomfortable having a Muslim person move in next door. And about one in four respondents were uncomfortable with having someone with a mental health condition as a boss or as a new family member (in-law), suggesting that stigmatising social attitudes remain a significant issue for people with particular protected characteristics.
Equality and Human Rights Commission Published: October 2018 43
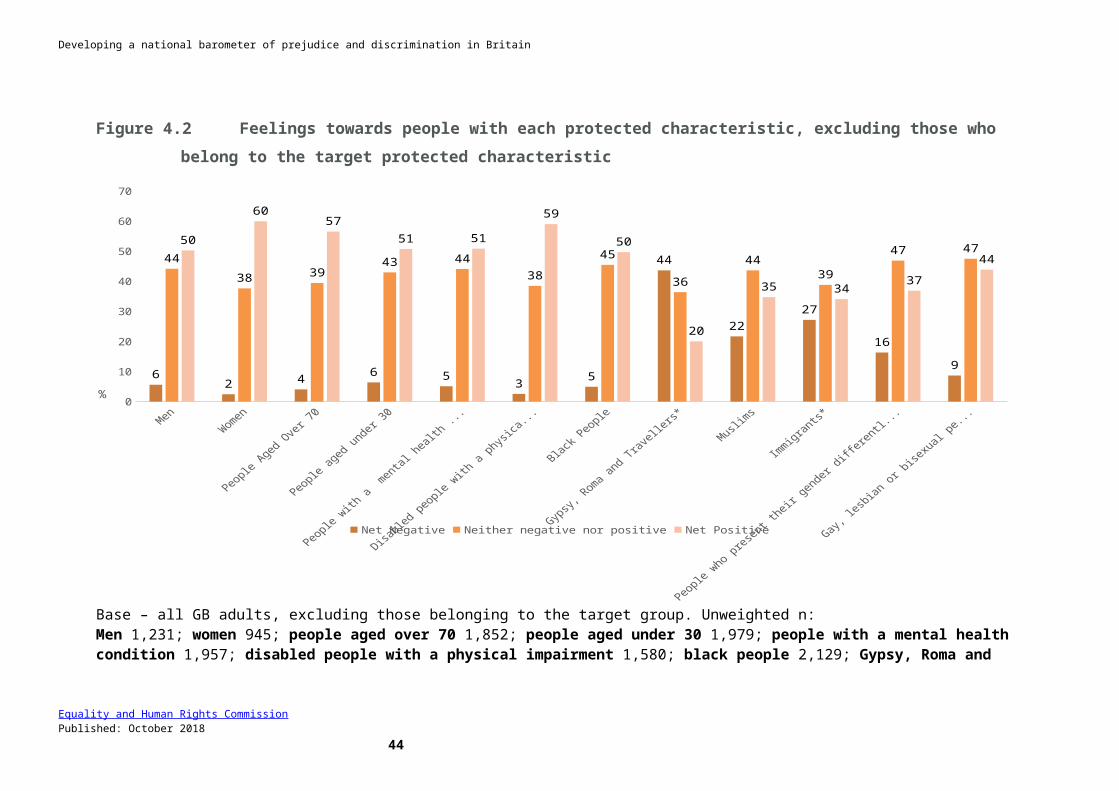
Towards a national barometer of prejudice and discrimination in Britain
5 | Insights from using the survey as a complete set of measures
In this section we explore how using the full set of measures in the survey can help to paint a meaningful picture of the prejudices affecting any particular protected characteristic, compared to looking at individual measures on their own. To illustrate this, we will now consider what the survey captures about prejudice and discrimination affecting black people and those with a physical health condition or impairment. We chose these two protected characteristics for this section of the report because we obtained complete data for each with good sample sizes from boost samples, and because they were the groups for which we had the best coverage of questions throughout the survey. We covered a smaller range of protected characteristics in the questions on experiences of prejudice, and so were not able to cover some groups (for example, transgender people, or Gypsies, Roma and Travellers) as a case study. We also felt it would be helpful to contrast the findings from the survey for two protected characteristics for which long-standing discrimination has been generally well-evidenced, and which often align with traditionally ‘hostile’ and ‘benevolent’ forms of prejudice, allowing us to demonstrate the survey’s ability to detect and explain a range of different forms of prejudice. Because this analysis uses data from the non-probability boost samples the figures are indicative only.
The case studies provide interesting contrasts but item-by-item comparisons are not appropriate: it is the pattern across the whole set of measures for each protected characteristic that provides a more complete picture. We also comment on how the prejudice experienced by each can be more readily interpreted in the context of evidence about the attitudes and beliefs held by others in the population.
Equality and Human Rights Commission Published: October 2018 44
Towards a national barometer of prejudice and discrimination in Britain
5.1 Contrasting the experiences of two different protected characteristics
In the main representative sample 54% of respondents who were from ethnic minorities (n=85) said they had been a victim of ethnic or racial prejudice in the last year (as compared with only 11% of people who classified themselves as white). In the boost sample, 64% of black people reported experiencing prejudice based on their race or ethnicity in the last year, although this is not comparable with the main sample as it cannot be confirmed to be representative (Table 5.1).
One in four (25%) disabled people with a physical impairment reported experiencing prejudice because of their impairment in the last year.
Table 5.1 Case study measures of experiences of prejudice
Black people*
People with a physical health
condition or disability**
Experienced any prejudice in last year(due to ethnicity / due to health condition or disability)
64% 25%
Base (unweighted): Black people; physically disabled (no mental health condition)
210 527
Of those experiencing prejudice, experienced being treated badly in last year (insulted, abused, refused service)
71% 64%
Of those experiencing prejudice, experienced being treated with a lack of respect (e.g. ignored or patronised)
81% 74%
Base (unweighted): Black/ physically disabled (no mental health condition) who experienced prejudice in the last year due to ethnicity/disability
135 131
* Figures are from the non-probability boost sample combined with the NatCen panel data – all respondents who identified as being from a black ethnic background – findings are therefore indicative only** Figures are from the NatCen panel data. Findings are representative of the population. Protected characteristics are described consistently unless the survey used for the data collection used a slightly different term, in which case we have replicated the term used in that survey to avoid misrepresenting the findings.
Equality and Human Rights Commission Published: October 2018 45
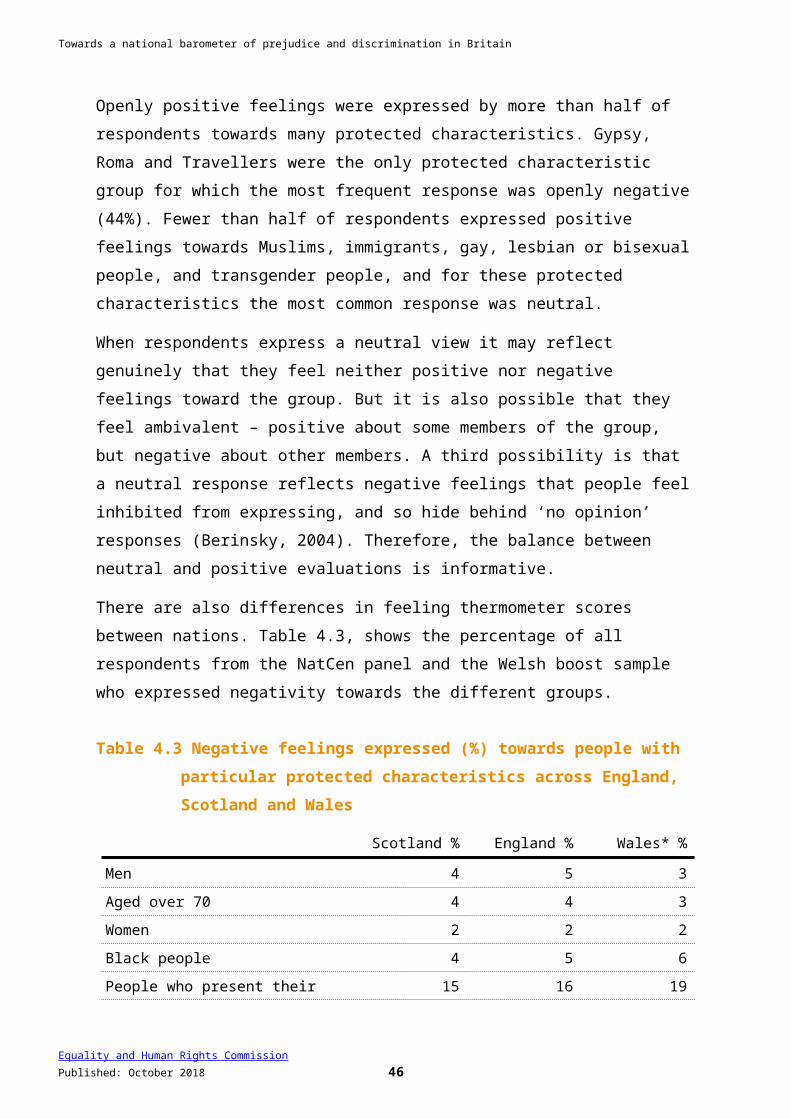
Towards a national barometer of prejudice and discrimination in Britain
Prejudice can arise in different forms. The survey focuses on hostile and paternalistic forms. Hostile prejudice is more likely to be overt and aggressive (for example, neglect, abuse, or mistreatment). Paternalistic prejudice can appear to be more benevolent but is nonetheless undermining (for example, patronising, showing lack of respect or using unnecessarily simplified and slow communication).
We asked those who said they had experienced prejudice two further questions to capture both hostile and benevolent or paternalistic forms of prejudice. The ‘hostile’ prejudice question asked respondents, ‘how often in the past year has someone treated you badly because of your [protected characteristic], for example, by insulting you, abusing you or refusing you services?’
The ‘benevolent’ prejudice question asked, ‘how often in the past year have you felt that someone showed you a lack of respect because of your [protected characteristic], for instance by ignoring or patronising you?’
As shown in Table 5.1, of those who had experienced prejudice, around two-thirds said that it had been expressed in a hostile form and over three-quarters said it had been expressed in a patronising form.
5.2 Prejudiced attitudes
The data on prejudiced attitudes shed more light on how and why the experiences of these different protected characteristics are qualitatively different (Table 5.3). Nearly a quarter of people who did not have a physical impairment regarded prejudice against physically disabled people to be a very or extremely serious issue (24%). Of respondents who identified as white, 33% regarded prejudice on the grounds of race as very or extremely serious (not surprisingly, a much higher proportion of respondents from an ethnic minority background (51%) judged race prejudice to be very or extremely serious).
These judgements of seriousness made by people who do not share a protected characteristic should be interpreted in the light of other evidence from this survey. People are more likely to feel pity towards disabled people with physical impairments than towards black people (34% compared with 2%) and less likely to be feel anger and resentment (3% compared with 11% for black people) or fear (3% compared with 14% for black people). Respondents regarded the (relatively more patronising) prejudice towards people with a physical impairment as less serious than the (relatively more hostile) prejudice towards black people This finding is consistent with the idea that people are more likely to view patronising forms of prejudice as
Equality and Human Rights Commission Published: October 2018 46

Towards a national barometer of prejudice and discrimination in Britain
relatively harmless, or as non-serious, and they might, therefore, be less vigilant or concerned to prevent it from happening.
The implications of paternalising prejudice toward physically disabled people are also revealed in the thermometer and stereotype evidence. People were more likely to view disabled people with physical impairment positively on the thermometer measure and as friendly on the stereotype measure than they were black people. However, people were much less likely to see disabled people with a physical impairment as capable (25%) compared to black people (58%), echoing findings from the ‘pity’ emotion measure.
We note a higher proportion of respondents felt that equal opportunities had ‘gone too far’ for black people (11%) than for disabled people with physical impairments (5%).
Two fifths of respondents had no friends from these protected characteristics, but we also observed greater resistance to elevated status for black people, as non-black respondents were less likely to view having a black boss positively (61%) than non-disabled people were to view having a physically disabled boss positively (71%). Respondents were also slightly less likely to feel comfortable with a black person as a close family member (59% rather than 63%).
Table 5.3 Case study attitudes towards black people and disabled people with a physical impairment
Base: non-black and non-physically disabled respondents, respectively
In relation to black people
(%)
In relation to those with physical health
condition or disability**
Discrimination viewed as very/extremely serious (race or ethnicity / physical or mental health condition)
33 24
Positive feelings towards the group 50 59
Viewed as friendly (usually/always)* 53 64
Viewed as capable (usually/always)* 58 25
Viewed with pity (usually/always)* 2 34
Viewed with anger/resentment (usually/always)* 11 3
Viewed with fear (usually/always)* 14 3
Equal opportunities gone too far 11 5
Comfortable with person as their boss 61 71
Comfortable with person as close family member 59 63
No friends in this group 39 40
Equality and Human Rights Commission Published: October 2018 47

Towards a national barometer of prejudice and discrimination in Britain
Unweighted base 2,129 1,580
*Base = all respondents
** Protected characteristics are described consistently unless the survey used for the data collection used a slightly different term, in which case we have replicated the term used in that survey to avoid misrepresenting the findings.
In summary, these case studies reveal patterns of evidence that are consistent with contemporary theories of prejudice. Whereas some groups in society tend to be targets of direct, hostile prejudices, others may suffer from forms that are harder to recognise, detect or report, such as paternalising prejudices. The two illustrative cases help to show how the different measures can be interpreted together to shed light on the particular problems of prejudice and discrimination that are faced by people with any particular protected characteristic.
These more nuanced and multidimensional pictures for any given protected characteristic are key to understanding the types of interventions that may be most useful. Comparisons among different pairs or sets of protected characteristics may also be informative for different types of policy question by shedding light on where particularly distinctive risks may occur.
Equality and Human Rights Commission Published: October 2018 48

Towards a national barometer of prejudice and discrimination in Britain
6 | Conclusions
This ‘barometer’ survey is the first national evidence since Abrams and Houston (2006) to evaluate prejudice and discrimination in Britain across a large set of protected characteristics using a consistent set of measures. It asks about nine aspects of prejudice, which together explore attitudes towards eight of the nine protected characteristics.4
An important and distinctive feature of the survey is the inclusion of measures both of experiences and expressions of prejudice. The questions capture the prevalence of experiences of discrimination across the population, the probability that it will be experienced by people who share particular protected characteristics and the different ways in which it is experienced, as well as the feelings, stereotypes, values and attitudes that respondents express toward people that share different protected characteristics. This provides a more comprehensive picture of prejudice and discrimination in Britain than single measures allow, and helps us to understand the impact of prejudice on people’s lives.
A second important feature of the survey is that it measures these factors across multiple protected characteristics. This enables us to understand how prejudice and experiences of discrimination differ for different protected characteristics, although we were not able to measure all aspects of prejudice across all nine protected characteristics.
The survey identified that prejudice is experienced across protected characteristics. Ageism can be experienced by people at any age, and ageism and sexism were the most commonly experienced forms of prejudice when exploring across the population as a whole. However, the probability of being discriminated against was higher for people who were members of groups who make up a smaller proportion of the population. Muslims, black people, those with a mental health condition and gay, lesbian and bisexual people were particularly likely to be affected by prejudice directed at that particular protected characteristic (chapter 4 section 2). Self-identified transgender respondents (those who represent their gender differently to the one they were assigned at birth) were very infrequently represented in the
4 Marriage and civil partnership were excluded.
Equality and Human Rights Commission Published: October 2018 49

Towards a national barometer of prejudice and discrimination in Britain
sample and protected characteristics were not assessed extensively (for example, pregnancy and maternity) owing to cost and survey space limitations but these certainly warrant attention in future research and with bespoke samples. The survey can readily be adapted for these purposes.
The types of prejudicial attitudes shown toward groups of people who share protected characteristics are likely to be linked to the different ways in which prejudice is expressed toward these groups, and the different ways in which they experience prejudice and discrimination. The survey revealed that people who did not share the relevant protected characteristic felt least positive towards Gypsy, Roma and Traveller groups, Muslims, immigrants, gay, lesbian or bisexual people, and transgender people. By comparison, most respondents expressed positive feelings towards women and younger people even though both of these groups reported high levels of experiences of prejudice against themselves (chapter 4 section 5). Analysis of other measures in the survey, such as the stereotyping items, provides insight into the different levels of progress made in addressing different aspects of prejudice. An example is the different stereotypes and emotions people hold about physical and mental health conditions, where it seems that there is still considerable stigma attached to mental health conditions (chapter 4, section 6).
With over four in ten people experiencing prejudice and discrimination there is clearly a substantial challenge for a society that wants acceptable levels of fairness and equality. An important insight from the survey is that the forms and texture of prejudices and discrimination are quite complex and different for different protected characteristics. It is not possible to declare that prejudice against one particular group is ‘worse’ than that against others. However, for social analysts, policy makers and practitioners, this more nuanced and comparative picture provides essential insights into where to concentrate efforts and which strategies might be most important.
By identifying not only the ‘who’ and ‘how much’ questions but also asking ‘in what ways’, ‘where’ and ‘when’ prejudice affects people, the survey provides a more sensitive and useful picture than single-measure approaches. Findings such as the consensual support for equality in general, and people’s general desire to be non-prejudiced invite interventions that build on these to strengthen an overall climate that bears down on prejudice across the board. These interventions might focus on wider social norms (such as challenging the acceptability of expressing attitudes in particular ways, and raising awareness that some types of attitude can be prejudicial, even if that was not the intent). However, where particular groups are experiencing high levels of discrimination, more intensive interventions may be needed, and these
Equality and Human Rights Commission Published: October 2018 50
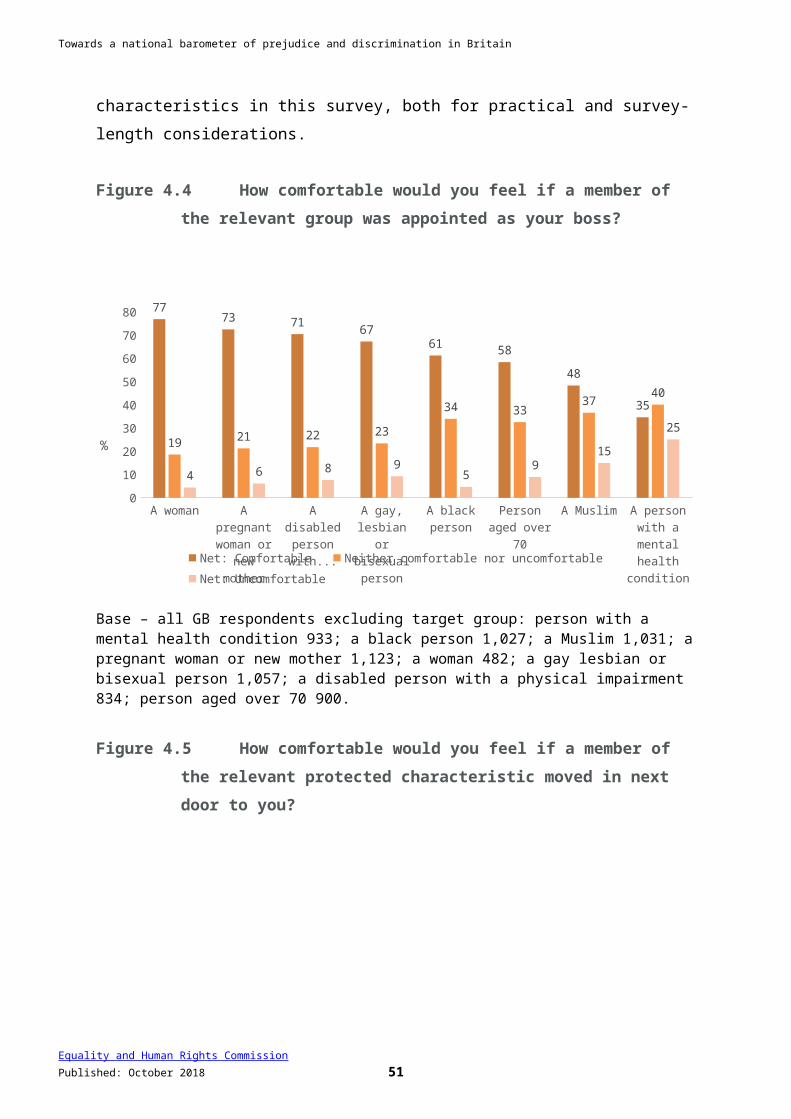
Towards a national barometer of prejudice and discrimination in Britain
may need to be directed at particular situations, localities, or particular sets of perpetrators (see Abrams et al., 2016; British Academy 2017).
In some cases the first priority may be to challenge hostile stereotypes (that the group is incompetent, immoral or directly competing), and to deal with directly hostile discrimination (such as hate crime). In other cases the priority may be to challenge paternalising stereotypes (those that assume a group is helpless or incompetent), and to deal with more subtle forms of discrimination such as being overlooked, disrespected or excluded.
The role of a national barometer of prejudice and discrimination
The survey provides a meaningful benchmark for assessing the prevalence of prejudice in Britain. It has been designed to be easy to use and to adapt for different groups or protected characteristics. Most importantly, the present evidence provides a clear benchmark and reference point against which future evidence can be compared.
Looking backward, briefly, it is reassuring that the subset of these items that were also fielded in 2005 (see Abrams and Houston, 2006) show patterns of responses to different protected characteristics that are fairly stable over time. There have also been interesting changes in average responses to various measures; these changes should be explored through future analysis.
The survey shows some commonalities across protected characteristics, and shows that people generally are sympathetic to the idea of reinforcing equality and reducing discrimination. Nonetheless, people with different protected characteristics are likely to experience prejudice in different forms and in different types of context. These differences are also reflected in the different forms of prejudiced attitudes towards these groups.
We can identify five important ways that a national barometer of prejudice and discrimination based on the survey presented here can be used:
1. to provide a benchmark for comparison over time, enabling monitoring of changes in experience and attitudes (for example, through repeat surveys at regular intervals, such as three years and through longitudinal studies)
2. to provide a more nuanced picture of the situation of members of a particular protected characteristic (for example, by characterising the multidimensional nature of the way that prejudice affects a protected characteristic)
Equality and Human Rights Commission Published: October 2018 51
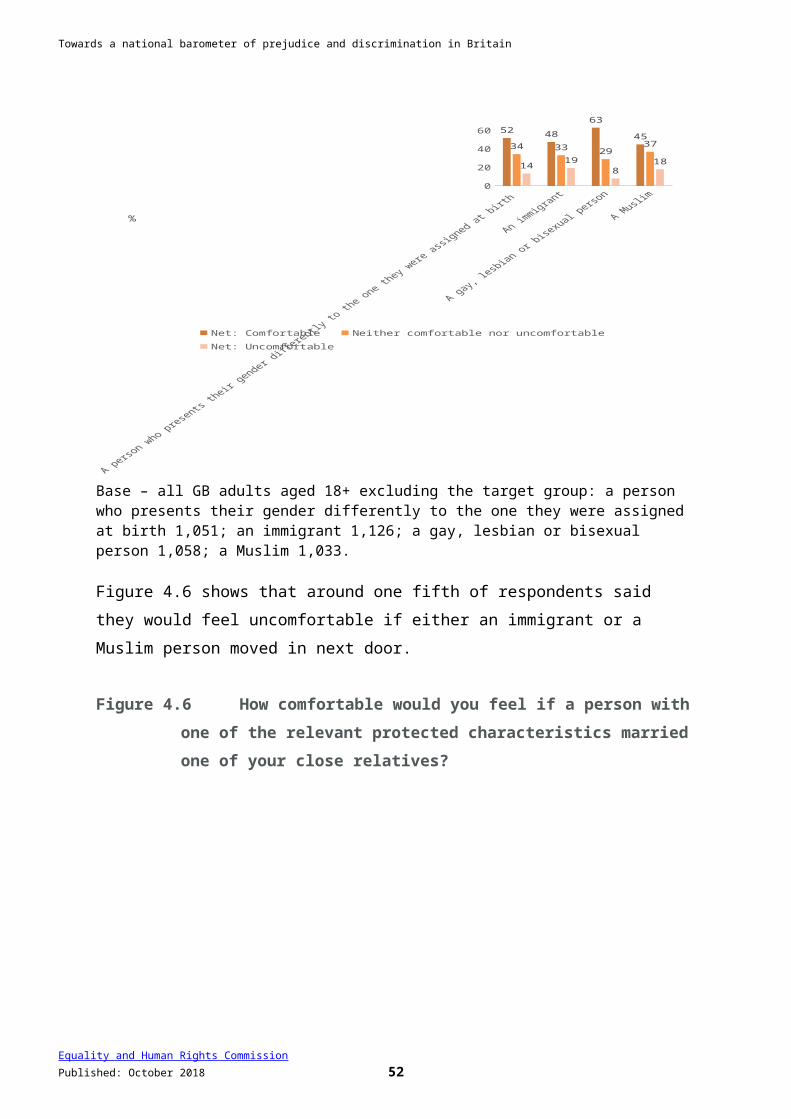
Towards a national barometer of prejudice and discrimination in Britain
3. to enable comparisons between different protected characteristics that can highlight where particularly distinctive risk factors may be occurring (for example, through comparative case studies)
4. to identify areas in which general interventions (and change) may be desirable to affect all protected characteristics (for example, awareness campaigns to influence interactions and promote anti-prejudice norms operating in social domains), and
5. to identify areas where more targeted or specific interventions would be more appropriate to address particular features of prejudice or discrimination or issues that are unique to particular protected characteristics (for example, experimental tests of interventions for specific attitudes or domains).
Equality and Human Rights Commission Published: October 2018 52

Towards a national barometer of prejudice and discrimination in Britain
References
Abrams, D. (2010). Processes of prejudice: Theory, evidence and intervention. Equalities and Human Rights Commission. Research Report 56. London: Equality and Human Rights Commission [accessed 24 August 2018].
Abrams, D., Eilola, T., & Swift, H. (2009). Attitudes to age in Britain 2004-08. Department for Work and Pensions [accessed 24 August 2018].
Abrams, D., & Houston, D.M. (2006). A Profile of Prejudice in Britain: Report of the National Survey. The Equalities Review. Cabinet Office [accessed 24 August 2018].
Abrams, D., Houston, D. M., Van de Vyver, J., & Vasiljevic, M. (2015). Equality hypocrisy, inconsistency, and prejudice: The unequal application of the universal human right to equality. Peace and Conflict: Journal of Peace Psychology, 21, 28–46. doi:10.1037/pac0000084
Abrams, D., Russell, P. S., Vauclair, M., & Swift, H. J. (2011). Ageism in Europe: Findings from the European Social Survey. London: Age UK.
Abrams, D., Swift, H.J. & Mahmood, L. (2016). Prejudice and unlawful behaviour: Exploring levers for change, Research report 101, London: Equality and Human Rights Commission. Available at: [accessed 24 August 2018].
Berinsky, A.J. (2004). Silent voices: Public opinion and political participation in America. Princeton: Princeton University Press.
Bratt, C., Abrams, D., Swift, H., Vauclair, C.-M., & Marques, S. (2017). Perceived age discrimination across age in Europe: From an ageing society to a society for all ages. Developmental Psychology, 54, 167–180. doi:10.1037/dev000039
British Academy (2017). If you could do one thing…: Local actions to improve social integration [accessed 24 August 2018].
Cowan, K. (2007). Living together. British attitudes to lesbian and gay people. Stonewall.
Equality and Human Rights Commission Published: October 2018 53
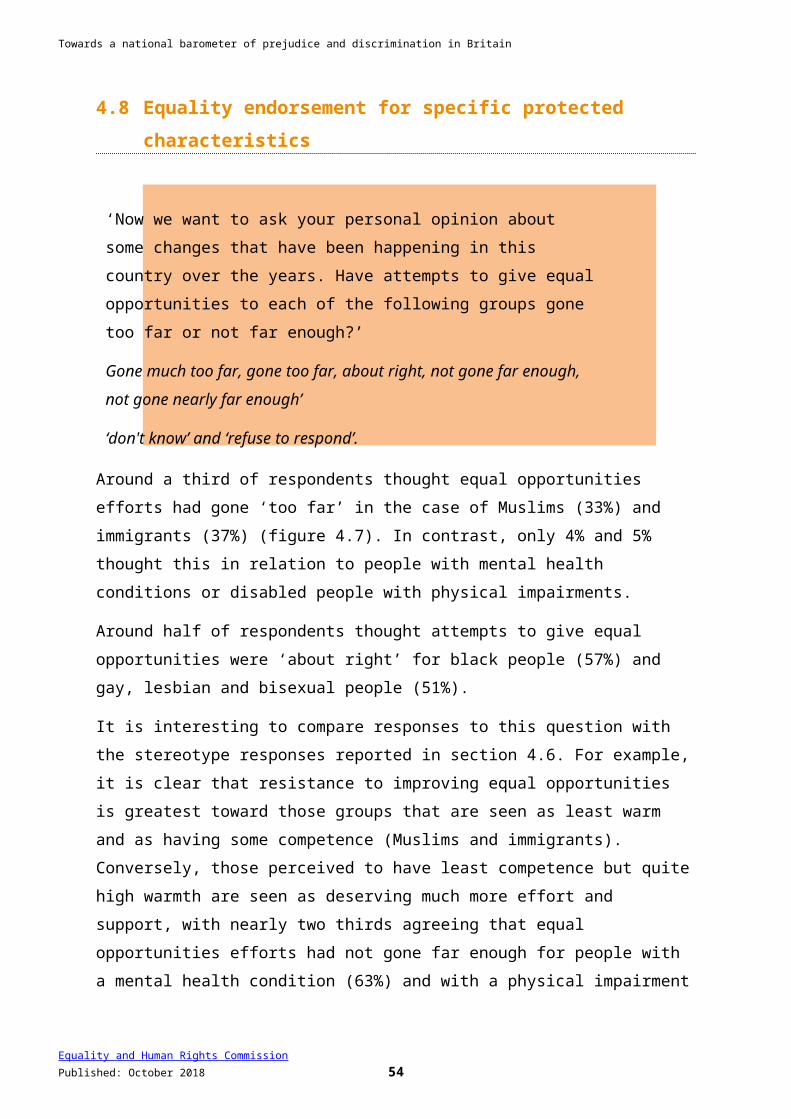
Towards a national barometer of prejudice and discrimination in Britain
Cuddy, A.J., Fiske, S.T., Kwan, V.S.Y., Glick, P., Demoulin, S., Leyens, J.P., Bond, M.H., Croizet, J-C., Ellemers, N., Sleebos, E., Htun, T.T., Kim, H-J., Maio, G., Perry, J., Petkpva, K., Todorov, V., Rodriguez-Bailon, R., Morales, E., Moya, M., Palacios, M., Smith, V., Perez., R., Vala, J., & Ziegler, R. (2009). Stereotype content model across cultures: Towards universal similarities and some differences, British Journal of Social Psychology, 48, 1–33. doi: 10.1348/014466608X314935
Cuddy, A. J. C., Fiske, S. T., & Glick, P. (2007). The BIAS map: Behaviors from intergroup affect and stereotypes. Journal of Personality and Social Psychology, 92, 631-648. doi: 10.1037/0022-3514.92.4.631
Equality and Human Rights Commission (2017). Measurement framework for equality and human rights, London: Equality and Human Rights Commission [accessed 24 August 2018].
Equality and Human Rights Commission (2016). England’s most disadvantaged groups. Is England fairer? The state of equality and human rights 2016 (pp. 103–24) [accessed 24 August 2018].
Fiske, S.T, Cuddy, J.C., Glick, P. and Xu, J. (2002). A model of (often mixed) stereotype content: Competence and warmth respectively follow from perceived status and competition. Journal of Personality and Social Psychology, 82, 878–902.
Monteith, M.J., Sherman, J.W. and Devine, P. (1998). Suppression as a stereotype control strategy. Personality and Social Psychology Review, 2, 63–82.
NatCen (undated). Our research [accessed 24 August 2018].
Nelson, T. D., (2009). Handbook of Prejudice, Stereotyping and Discrimination. Psychology Press
Pettigrew, T.F., Meertens, R.W. (1995). Subtle and blatant prejudice in Western Europe. European Journal of Social Psychology, 25, 57–75
Pettigrew, T.F. (1998). Intergroup Contact Theory, Annual Review of Psychology, 49, 65–85.
Pettigrew, T. F., & Tropp, L. R. (2006). A meta-analytic test of intergroup contact theory. Journal of Personality and Social Psychology, 90, 751–783. doi:10.1037/0022-3514.90.5.751
Plant, E.A. and Devine, P.G. (1998). Internal and external motivation to respond without prejudice. Journal of Personality and Social Psychology, 75: 811–832.
Equality and Human Rights Commission Published: October 2018 54
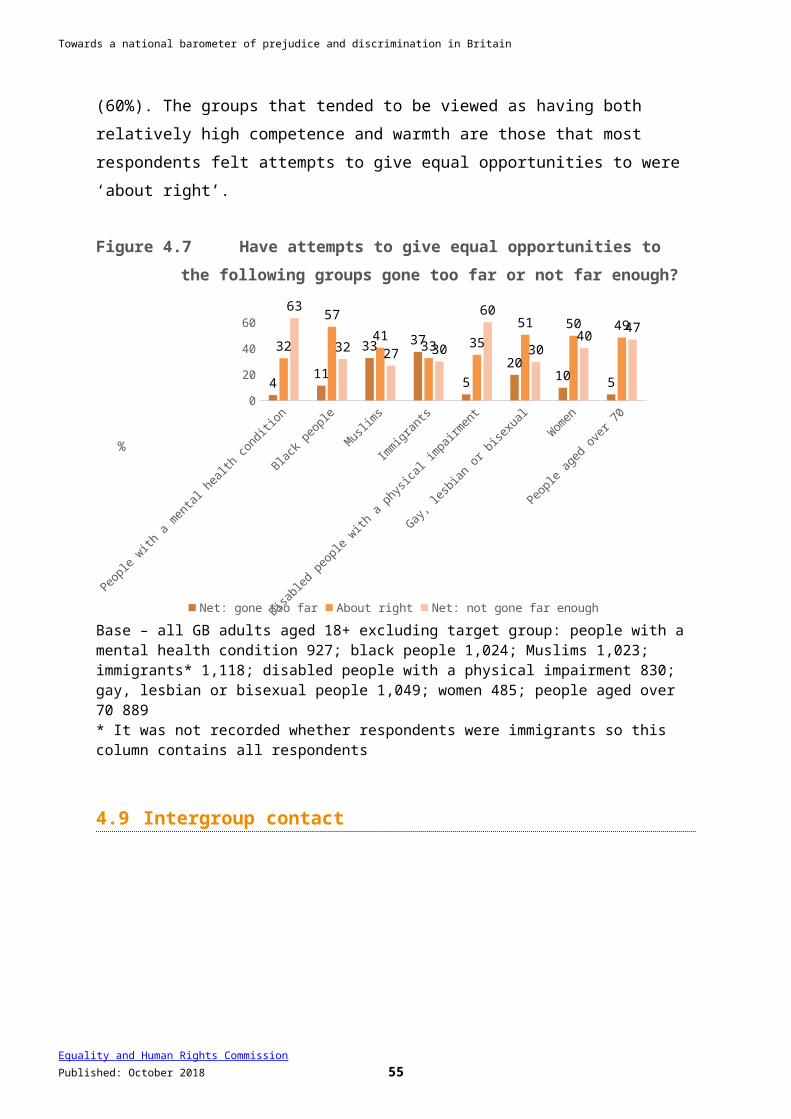
Towards a national barometer of prejudice and discrimination in Britain
Ray, S., Sharp, E., & Abrams, D. (2006). Ageism – A benchmark of public attitudes in Britain. Age Concern.
Robbins, J. M., and Krueger, J. I, (2005). Social projection to ingroups and outgroups: A review and meta-analysis, Personality and Social Psychology Review, 9, 32–47. Available at: doi:10.1207/s15327957pspr0901_3
Stonewall. (2012). Living together: British attitudes to lesbian gay and bisexual people in 2012. Stonewall.
Walters, M., Brown, R. and Wiedlitzka, S. (2017) Causes and motivations of hate crime. Equality and Human Rights Commission research report 102. [accessed 24 August 2018].
Equality and Human Rights Commission Published: October 2018 55
Towards a national barometer of prejudice and discrimination in Britain
Appendix A: Summary of measures
Table A.1 Overview of measures of prejudice
Experiences or expressions of prejudice
Measure Previous surveys
Inclusion / order in survey
Perceived prejudice and discrimination: Understanding personal experiences of prejudice and discrimination, and the perception of prejudice
General: Thinking about your personal experiences over the past year, how often has anyone shown prejudice against you or treated you unfairly for each of the following? [protected characteristic groups]
European Social Survey (ESS)
Q1
Domains: In which area of your life did the experience of prejudice occur in relation to your: 1. Employment / work – access to
or experience at work2. Health care – access to or
experience of health or social care
3. Justice and personal security – access to or experience of the police or Criminal Justice System
4. Living standards – access to housing or benefits
5. Participation – when using public transport
6. Other
New, areas of life based on EHRC domains.
Q1a
- And how often in the past year has someone treated you badly because of each of the following, for example by insulting you, abusing you or refusing you services?
Age UK, ESS
Q1b
- And how often in the past year Age UK, Q1c
Equality and Human Rights Commission Published: October 2018 56

Towards a national barometer of prejudice and discrimination in Britain
Experiences or expressions of prejudice
Measure Previous surveys
Inclusion / order in survey
have you felt that someone showed you a lack of respect for each of the following, for instance by ignoring or patronising you?
ESS
- Seriousness of discrimination: In this country nowadays, how serious is the issue of discrimination against people because of each of the following?[protected characteristic groups]
Age UK, Abrams & Houston, 2006, ESS
Q9
Equality values To what extent do you agree or disagree with the following statement: There should be equality for all groups in Britain.
Abrams & Houston, (2006)
Q16
Direct prejudice: Tapping the publicly ‘acceptable’ manifestations of prejudice in its blatant (hostile) forms
Feeling thermometer: In general, how negative or positive do you feel towards each of the following groups in Britain: [protected characteristic groups]
Abrams & Houston, 2006,
Q2
- Social distance [boss]: How comfortable or uncomfortable do you think you would feel if a suitably qualified person was appointed as your boss if they were…[protected characteristic]
Social distance [marry]: How comfortable or uncomfortable do you think you would feel if someone married one of your close relatives (such as a brother, sister, child or re-married parent if they were…[protected characteristic]
Social distance [neighbour]: How comfortable or uncomfortable do you think you would feel if someone moved in next door to you if they were…[protected characteristic]
- Q15–16
Stereotypes:Identifying the content of stereotypes and
To what extent are [protected characteristic group] viewed in the following ways?1.As capable
Stereotype content model
Q3–6
Equality and Human Rights Commission Published: October 2018 57
Towards a national barometer of prejudice and discrimination in Britain
Experiences or expressions of prejudice
Measure Previous surveys
Inclusion / order in survey
hostile and benevolent prejudice
2.As friendly3.As moral4.As receiving special treatment
which makes things more difficult for others in Britain
Emotions: likely manifestations of prejudice
To what extent are [protected characteristic group] viewed in the following ways?
1.With admiration2.With pity3.With anger or resentment4.With envy5.With fear6.With disgust
Stereotype content model / intergroup emotions
Q7–13
Application of equality
Now we want to ask your personal opinion about some changes that have been happening in this country over the years. Have attempts to give equal opportunities to each of the following groups gone too far or not far enough?
Abrams & Houston, (2006)
Q17
Internal and external motivation to control prejudice
I attempt to act in non-prejudiced ways toward other groups because it is personally important to me.
I try to appear non-prejudiced toward other groups in order to avoid disapproval from others.
- Q18–19
Direct contact: Evaluates the potential for prejudice reduction and identifies where cohesion / contact may be low between groups.
Of your friends or people you feel close to, how many are in any of the following groups? [protected characteristic groups]
- Q20
Equality and Human Rights Commission Published: October 2018 58

Towards a national barometer of prejudice and discrimination in Britain
Appendix B: Questionnaire
INTRO2 {ASK ALL}
In the next set of questions we would like to ask you about your experiences of living in Britain, and your attitudes to different groups of people living in Britain today.
{ASK ALL}
ExpDis
{RANDOMISE GRID ROWS, RANDOMLY FLIP RESPONSE SCALES 1..5}
Thinking about your personal experiences over the past year, how often has anyone shown prejudice against you or treated you unfairly because of each of the following?
{#G_Grid_II1}
GRID ROWS:
1. Your sex (male or female)
2. Your age
3. Your race or ethnicity
4. Any physical or mental health condition, impairment or illness you may have
5. Your sexual orientation
6. Your religion or religious beliefs
GRID COLUMNS:
1. Almost all of the time
2. A lot of the time
3. Sometimes
4. Rarely
5. Not in the last year
6. Does not apply
VARNAME1: ExpDisGen
VARNAME2: ExpDisAge
Equality and Human Rights Commission Published: October 2018 59

Towards a national barometer of prejudice and discrimination in Britain
VARNAME3: ExpDisEth
VARNAME4: ExpDisDis
VARNAME5: ExpDisSexO
VARNAME6: ExpDisRel
{IF ExpDisGen = 1..4}
DomainGen
{RANDOMISE ORDER EXCEPT ‘OTHER’}
And, in which area of your life did the experience of prejudice occur in relation to your <B>sex (male or female)</B>?
{#G_Multi_II1}
MULTICODE
1. Access to, or experience of education or training
2. Access to employment or experience at work
3. Access to, or experience of health or social care
4. Access to, or experience of the police or Criminal Justice System
5. Access to housing or benefits
6. Access to or experience using public transport
7. As a consumer (using shops and services)
8. Experience of a social situation, or with close peers or friends
9. Another area [WRITE IN]
{DomainAge to DomainRel to have same principle in routing and in same format as DomainGen, substituting ‘sex (male or female)’ with corresponding category from ExpDis}
{IF ExpDisAge = 1..4}
DomainAge
{IF ExpDisEth = 1..4}
DomainEth
{IF ExpDisDis = 1..4}
DomainDis
Equality and Human Rights Commission Published: October 2018 60

Towards a national barometer of prejudice and discrimination in Britain
{IF ExpDisSexO = 1..4}
DomainSexO
{IF ExpDisRel = 1..4}
DomainRel
{IF ANY ExpDis = 1..4}
ExpBad
{EACH GRID ROW PRESENTED IF CORRESPONDING ITEM AT ExpDis=1..4}
{RANDOMISE GRID ROWS, RANDOMLY FLIP RESPONSE SCALES 1..5}
And how often in the past year has someone <B>treated you badly</B> because of each of the following, for example by insulting you, abusing you or refusing you services?
{#G_Grid_II1}
GRID ROWS:
1. Your sex (male or female)
2. Your age
3. Your race or ethnicity
4. Any physical or mental health condition, impairment or illness you may have
5. Your sexual orientation
6. Your religion or religious beliefs
GRID COLS:
1. Almost all of the time
2. A lot of the time
3. Sometimes
4. Rarely
5. Not in the last year
6. Does not apply
VARNAME1: ExpBadGen
VARNAME2: ExpBadAge
VARNAME3: ExpBadEth
VARNAME4: ExpBadDis
Equality and Human Rights Commission Published: October 2018 61
Towards a national barometer of prejudice and discrimination in Britain
VARNAME5: ExpBadSexO
VARNAME6: ExpBadRel
{IF ANY ExpDis = 1..4}
ExpResp
{EACH GRID ROW PRESENTED IF CORRESPONDING ITEM AT ExpDis=1..4}
{RANDOMISE GRID ROWS, RANDOMLY FLIP RESPONSE SCALES 1..5}
And how often in the past year have you felt that someone <B>showed you a lack of respect</B> because of each of the following, for instance by ignoring or patronising you?
{#G_Grid_II1}
GRID ROWS:
1. Your sex (male or female)
2. Your age
3. Your race or ethnicity
4. Any physical or mental health condition or illness you may have which has a substantial and long-term adverse effect on your ability to carry out normal day-to-day activities
5. Your sexual orientation
6. Your religion or religious beliefs
GRID COLS:
1. Almost all of the time
2. A lot of the time
3. Sometimes
4. Rarely
5. Not in the last year
6. Does not apply
VARNAME1: ExpRespGen
VARNAME2: ExpRespAge
VARNAME3: ExpRespEth
VARNAME4: ExpRespDis
VARNAME5: ExpRespSexO
Equality and Human Rights Commission Published: October 2018 62
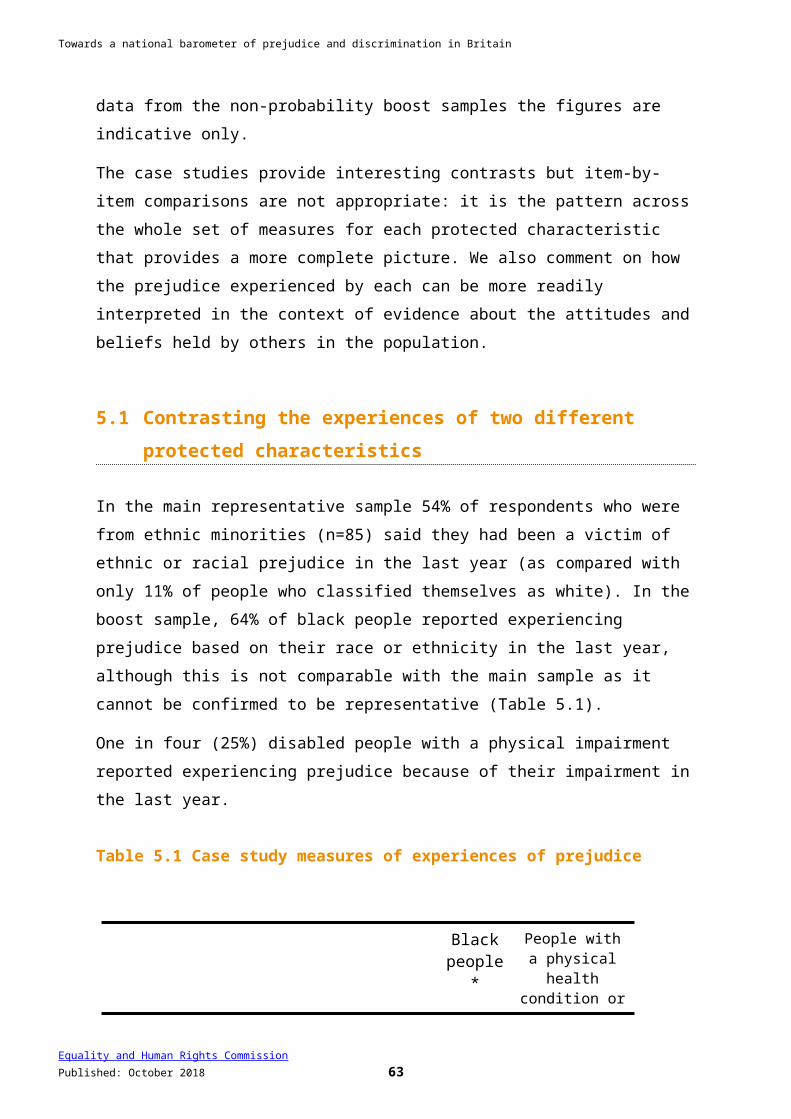
Towards a national barometer of prejudice and discrimination in Britain
VARNAME6: ExpRespRel
{ASK ALL}
Feeling
{RANDOMISE GRID ROWS, RANDOMLY FLIP RESPONSE SCALES}
{MAX OF 5 ROWS PER GRID – SPLIT INTO EVEN NUMBER OF ITEMS PER PAGE}
In general, how negative or positive do you feel towards each of the following groups in <B>Britain<\B>?
{#G_Grid_II1}
GRID ROWS:
1. Men
2. People aged over 70
3. Women
4. Black people
5. People who present their gender differently to the one they were assigned at birth (including transgender, non-binary and intersex people)
6. Muslims
7. People with a mental health condition
8. Gay, lesbian or bisexual people
9. Immigrants
10. Disabled people with a physical impairment
11. Gypsy, Roma and Travellers
12. People aged under 30
GRID COLUMNS:
1. Very negative
2. Somewhat negative
3. Neither negative nor positive
4. Somewhat positive
5. Very positive
VARNAME1: FeelingMen
VARNAME2: Feeling70
VARNAME3: FeelingWomen
Equality and Human Rights Commission Published: October 2018 63
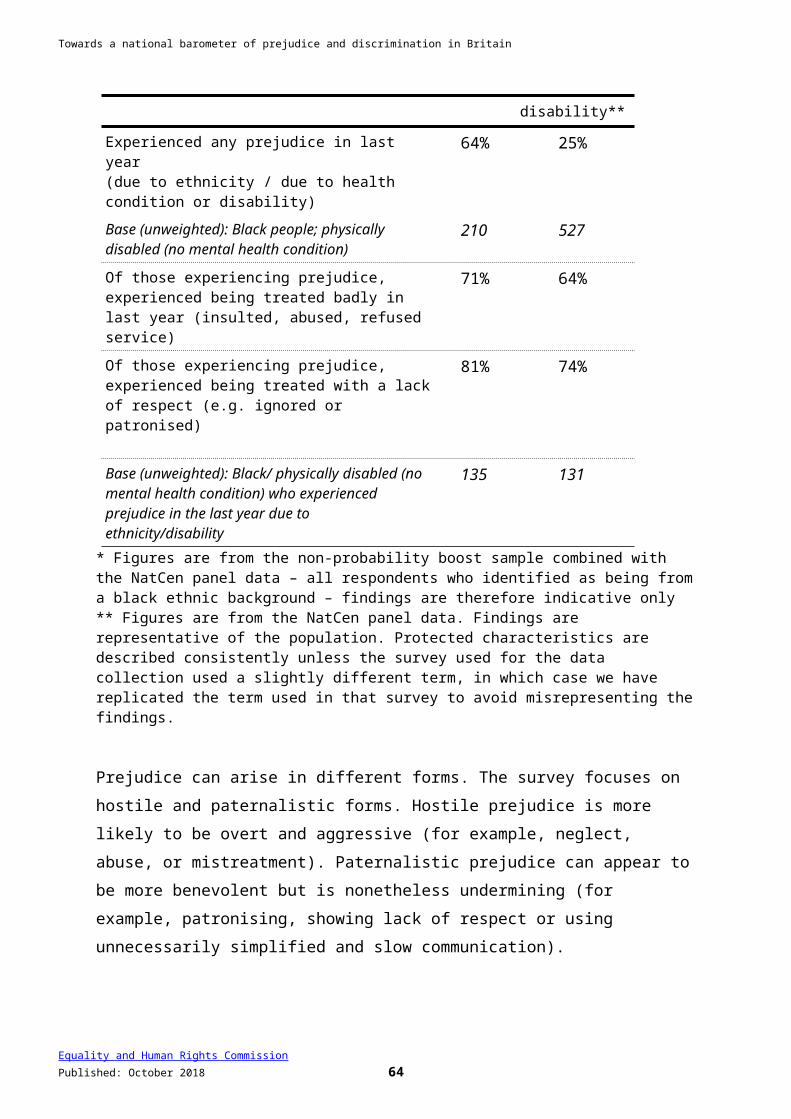
Towards a national barometer of prejudice and discrimination in Britain
VARNAME4: FeelingBlack
VARNAME5: FeelingTrans
VARNAME6: FeelingMuslim
VARNAME7: FeelingMent
VARNAME8: FeelingLes
VARNAME9: FeelingMigrant
VARNAME10: FeelingDis
VARNAME11: FeelingTrav
VARNAME12: Feeling30
{ASK ALL}
Some questions in this section are asked of two random halves of the sample (versions) and will cover different PC Groups (PCGroup):
IF Nov17SampSplit = 1
PCGroups =
1. people aged over 70
2. people with a mental health condition
3. Black people
4. Muslims
IF Nov17SampSplit = 2
PCGroup =
1. immigrants
2. disabled people with a physical impairment
3. gay, lesbian or bisexual people
4. women
Stereo
{Loop of grids in line with PCGroup – each PCGroup to be asked about within Version}
{RANDOMISE GRID ROWS, RANDOMLY FLIP RESPONSE SCALES}
Equality and Human Rights Commission Published: October 2018 64

Towards a national barometer of prejudice and discrimination in Britain
There are many different groups in this country and we would like to know how you think some of these groups are viewed by people in general. To what extent are <B>{Loop of PCGroup}<\B> viewed in the following ways?
{#G_Grid_II1}
GRID ROWS:
1. As capable
2. As friendly
3. As moral
4. As receiving special treatment which makes things more difficult for others in Britain
GRID COLUMNS:
1. Never viewed that way
2. Rarely
3. Sometimes
4. Usually
5. Always viewed that way
VARNAME1: Stereo_70_Cap
VARNAME2: Stereo_70_Frnd
VARNAME3: Stereo_70_Moral
VARNAME4: Stereo_70_Spec
VARNAME5: Stereo_Ment_Cap
VARNAME6: Stereo_Ment_Frnd
VARNAME7: Etc. to VARNAME32
{ASK ALL}
StereoEmot
{Loop of grids in line with PCGroup – each PCGroup to be asked about within Version}
{RANDOMISE GRID ROWS, RANDOMLY FLIP RESPONSE SCALES}
To what extent are <B>{Loop of PCGroup}<\B> viewed in the following ways?
{#G_Grid_II1}
Equality and Human Rights Commission Published: October 2018 65
Towards a national barometer of prejudice and discrimination in Britain
GRID ROWS:
1. With admiration
2. With pity
3. With anger or resentment
4. With envy
5. With fear
6. With disgust
GRID COLUMNS:
1. Never viewed that way
2. Rarely
3. Sometimes
4. Usually
5. Always viewed that way
VARNAME1: Emot_70_Adm
VARNAME2: Emot _70_Pit
VARNAME3: Emot _70_Ang
VARNAME4: Emot _70_Env
VARNAME5: Emot _70_ Fear
VARNAME6: Emot _70_Disg
VARNAME7: Emot_Ment_Adm
VARNAME8: Emot _Ment_Pit
VARNAME9: Etc. to VARNAME 48
{ASK ALL}
DistBoss
{RANDOMISE GRID ROWS, RANDOMLY FLIP RESPONSE SCALES}
How comfortable or uncomfortable do you think you would feel if a suitably qualified person was appointed <B>as your boss<\B> if they were…
{GRID ROWS DIFFERENT FOR EACH VERSION }
GRID ROWS:
Equality and Human Rights Commission Published: October 2018 66
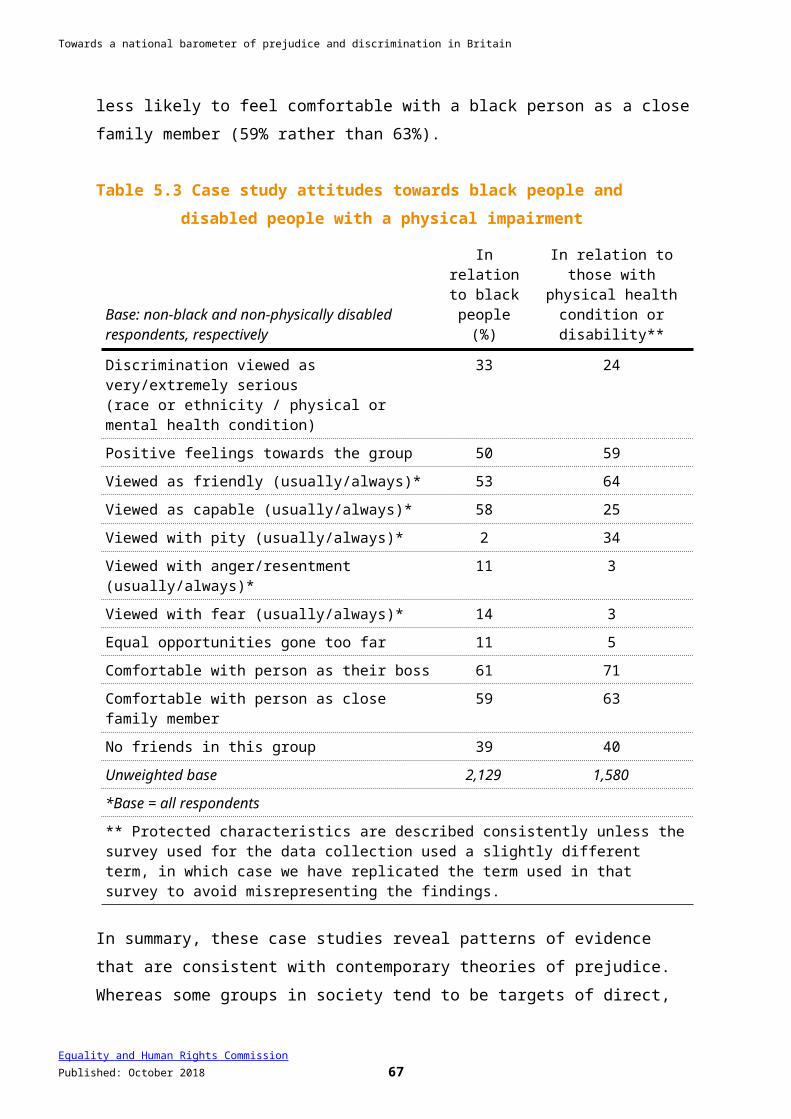
Towards a national barometer of prejudice and discrimination in Britain
{#G_Grid_II1}
{IF Nov17SampSplit = 1}
1. A person aged over 70
2. A person with a mental health condition
3. A Black person
4. Muslim
{IF Nov17SampSplit = 2}
1. A pregnant woman or new mother
2. A woman
3. A gay, lesbian or bisexual person
4. A disabled person with a physical impairment
GRID COLUMNS:
1. Very comfortable
2. Comfortable
3. Neither comfortable nor uncomfortable
4. Uncomfortable
5. Very uncomfortable
VARNAME1: DistBoss_70
VARNAME2: DistBoss_Woman
VARNAME3: DistBoss_Black
VARNAME4: DistBoss_Preg
VARNAME5: DistBoss_Muslim
VARNAME6: DistBoss_MentalHlth
VARNAME7: DistBoss_Gay
VARNAME8: DistBoss_Disabled
{ASK ALL}
DistRel
{RANDOMISE GRID ROWS, RANDOMLY FLIP RESPONSE SCALES}
Equality and Human Rights Commission Published: October 2018 67
Towards a national barometer of prejudice and discrimination in Britain
How comfortable or uncomfortable do you think you would feel if someone <B>married one of your close relatives<\B> (such as a brother, sister, child or re-married parent) if they were…
{#G_Grid_II1}
{GRID ROWS DIFFERENT FOR EACH VERSION}
GRID ROWS:
{IF Nov17SampSplit = 1}1. A Black person
2. A person with a mental health condition
{IF Nov17SampSplit = 2}
1. An immigrant
2. A disabled person with a physical impairment
GRID COLUMNS:
1. Very comfortable
2. Comfortable
3. Neither comfortable nor uncomfortable
4. Uncomfortable
5. Very uncomfortable
VARNAME1: DistRel _Black
VARNAME2: DistRel _MentalHlth
VARNAME3: DistRel _Migrant
VARNAME4: DistRel _Dis
{ASK ALL}
DistNext
{RANDOMISE GRID ROWS, RANDOMLY FLIP RESPONSE SCALES}
How comfortable or uncomfortable do you think you would feel if someone <B>moved in next door to you<\B> if they were…
{#G_Grid_II1}
{GRID ROWS DIFFERENT FOR EACH VERSION}
GRID ROWS:
Equality and Human Rights Commission Published: October 2018 68
Towards a national barometer of prejudice and discrimination in Britain
{IF Nov17SampSplit = 1}1. A Muslim
2. A person who presents their gender differently to the one they were assigned at birth (including transgender, non-binary and intersex people)
{IF Nov17SampSplit = 2}1. An Immigrant
2. A gay, lesbian or bisexual person
GRID COLUMNS:
1. Very comfortable
2. Comfortable
3. Neither comfortable nor uncomfortable
4. Uncomfortable
5. Very uncomfortable
VARNAME1: DistNext _Muslim
VARNAME2: DistNext _Trans
VARNAME3: DistNext_Migrant
VARNAME4: DistNext_Gay
{ASK ALL}
EqualAll
{RANDOMLY FLIP SCALE}
To what extent do you agree or disagree with the following statement:
There should be equality for all groups in Britain.
{G_ReadOut_II1}
1. Strongly disagree
2. Disagree
3. Neither agree nor disagree
4. Agree
5. Strongly agree
{ASK ALL}
EqualEmp
Equality and Human Rights Commission Published: October 2018 69

Towards a national barometer of prejudice and discrimination in Britain
{RANDOMISE GRID ROWS, RANDOMLY FLIP RESPONSE SCALES}
Now we want to ask your personal opinion about some changes that have been happening in this country over the years. Have attempts to give equal opportunities to each of the following groups gone too far or not far enough?
{#G_Grid_II1}
GRID ROWS:
IF Nov17SampSplit = 1
PCGroups = 1. People aged over 70
2. People with a mental health condition
3. Black people
4. Muslims
IF Nov17SampSplit = 2
PCGroup =1. Immigrants
2. Disabled people with a physical impairment
3. Gay, lesbian or bisexual people
4. Women
GRID COLUMNS:
1. Gone much too far
2. Gone too far
3. About right
4. Not gone far enough
5. Not gone nearly far enough
VARNAME1: EqualEmp_70
VARNAME2: EqualEmp _Woman
VARNAME3: EqualEmp _Black
VARNAME4: EqualEmp _Trans
VARNAME5: EqualEmp _Muslim
VARNAME6: EqualEmp _MentalHlth
Equality and Human Rights Commission Published: October 2018 70
Towards a national barometer of prejudice and discrimination in Britain
VARNAME7: EqualEmp _Gay
VARNAME8: EqualEmp _Migrants
{ASK ALL}
Serious
{RANDOMISE GRID ROWS, RANDOMLY FLIP RESPONSE SCALES}
In this country nowadays, how serious is the issue of discrimination against people because of each of the following?
{#G_Grid_II1}
GRID ROWS:
1. Age
2. Gender
3. Race or ethnic background
4. Religion or religious beliefs
5. Physical or mental health condition, impairment or illness
6. Sexual orientation
GRID COLS:
1. Not at all serious
2. Slightly serious
3. Somewhat serious
4. Very serious
5. Extremely serious
VARNAME1: Serious_Age
VARNAME2: Serious _Gender
VARNAME3: Serious _Race
VARNAME4: Serious _Religion
VARNAME5: Serious _Disability
VARNAME6: Serious _SexO
{ASK ALL}
MotivImp
{RANDOMLY FLIP RESPONSE SCALES}
Equality and Human Rights Commission Published: October 2018 71

Towards a national barometer of prejudice and discrimination in Britain
To what extent do you agree or disagree with the following statement:
‘I attempt to act in non-prejudiced ways toward other groups because it is personally important to me.’
{G_ReadOut_II1}
1. Strongly disagree
2. Disagree
3. Neither agree nor disagree
4. Agree
5. Strongly agree
{ASK ALL}
MotivAppr
{RANDOMLY FLIP RESPONSE SCALES}
To what extent do you agree or disagree with the following statement:
I try to appear non-prejudiced toward other groups in order to avoid disapproval from others.
{G_ReadOut_II1}
1. Strongly disagree
2. Disagree
3. Neither agree nor disagree
4. Agree
5. Strongly agree
{ASK ALL}
Contact
{RANDOMISE GRID ROWS, RANDOMLY FLIP RESPONSE SCALES}
Of your friends or people you feel close to, how many are in any of the following groups?
GRID ROWS
IF Nov17SampSplit = 1
PCGroups =
1. People aged over 70
Equality and Human Rights Commission Published: October 2018 72
Towards a national barometer of prejudice and discrimination in Britain
2. People with a mental health condition
3. Black people
4. Muslims
IF Nov17SampSplit = 2
PCGroup =
1. Immigrants
2. Disabled people with a physical impairment
3. Gay, lesbian or bisexual people
4. Women
GRID COLS:
1. None
2. 1
3. 2-5
4. 6-9
5. 10 or more
VARNAME1: Contact_70
VARNAME2: Contact_MentalHlth
VARNAME3: Contact_Black
VARNAME4: Contact_Muslims
VARNAME5: Contact_Migrant
VARNAME6: Contact_Dis
VARNAME7: Contact_Gay
VARNAME8: Contact_Women
Equality and Human Rights Commission Published: October 2018 73
Towards a national barometer of prejudice and discrimination in Britain
Appendix C: Data collection approach
C.1 Overview of the approach
The Commission required a cost-effective means of providing high quality data from the population in Britain aged 18 and over within a relatively limited timeframe. It also wished to provide insight into the experiences of some relatively low-incidence protected characteristic population subgroups and to be able to provide findings separately for England, Scotland and Wales.
To achieve these aims, the study collected data using the random probability NatCen and ScotCen panels (which use a sequential online and CATI data collection approach) in combination with the non-probability PopulusLive panel (which uses online data collection).
The NatCen panel provides the core of the study’s findings. As a random probability sample approach, the benefit is that the population of interest has a known and non-zero chance of selection and considerable effort is made to maximise response from the selected sample, thereby avoiding the bias that might occur from reliance on a ‘volunteer’ sample. Statistical theory can be applied to provide an assessment of the level of reliability of the results.
However, non-probability panels provide an effective means of accessing small incidence populations that would be very costly to achieve via probability approaches. This approach was used to provide samples of some specific protected characteristic groups and to boost the size of the sample available in Wales. Probability and non-probability data have been brought together in this study to provide some indicative findings for these small incidence groups. In addition, the probability ScotCen panel was used to provide a sample of sufficient size for robust analysis in Scotland.
Equality and Human Rights Commission Published: October 2018 74
Towards a national barometer of prejudice and discrimination in Britain
C.2 NatCen panel and ScotCen panel
The NatCen and ScotCen panels were developed via a ‘piggy-back’ approach to two high quality random probability face-to-face surveys: the British Social Attitudes survey (BSA) and the Scottish Social Attitudes (SSA) survey. Panellists for this research were recruited at the end of the interviews in BSA in 2016 and 2017 and from the SSA in 2015 and 2016. These surveys provide representative samples of adults aged 18 and over in Britain.
Both panels employ a ‘sequential mixed-mode’ fieldwork design, which for this research ran from 4 December 2017 to 7 January 2018. At the start of fieldwork, all active panel members were sent a letter and/or email with a link to the web survey and a unique log-in code to access the questionnaire and invited to take part in the research online (no quotas are used given the probability design). A £5 incentive was also offered as a ‘thank you’ to those who participated. During the first two weeks of fieldwork, active panel members who had not yet completed the survey were sent reminders via multiple modes (letters, emails and texts) to maximise response.
After two weeks of fieldwork, all active panel members who had not yet taken part in the survey online, and for whom we had a phone number, were issued to the NatCen telephone unit to follow-up by phone and either support them to take part online or complete an interview over the phone (there was some variation in this timing resulting from a ‘targeted’ fieldwork design which prioritised effort with specific categories of under-represented subgroups to efficiently improve quality). The telephone fieldwork aims to boost response rates, but also allow those without internet access to take part. Considerable effort is put into contacting eligible panel members and all are called a minimum of six times, at a variety of times of the day and days of the week, before being coded as a ‘non-contact’.
The multimode approach using online and CATI approaches meant that questions used in previous studies required some adaptation and optimisation for the mode in which they were to be asked. Questions were then included in an online pilot to provide some reassurance that they would work as anticipated. However, care should be taken when comparing estimates from surveys that used a face-to-face approach: given the subject matter, it is plausible that there could be measurement differences between interviewer-administered and self-completion approaches for some estimates (80% of NatCen panel interviews were achieved online).
Equality and Human Rights Commission Published: October 2018 75
Towards a national barometer of prejudice and discrimination in Britain
C.3 Survey response to the NatCen and ScotCen panels
The probability design of the NatCen and ScotCen panels allows us to apply statistical theory to the study, including tests of statistical significance or the ‘margin of error’. Response rates are a simple indicator of quality for surveys of this sort and are provided in table C.1. The main NatCen panel survey achieved a 60% response rate among those panellists invited to participate. When taking account of non-response at the BSA interview and then also at the point of recruitment to the panel, our overall response rate was 14%. Whilst the ScotCen panel had a lower survey response rate at 36%, the rate of recruitment to that panel was higher (a different recruitment approach was taken in that survey). The overall response rate, including non-response to the original survey, was similar to that of the NatCen panel at 13%.
Whilst these overall response rates appear relatively low for a probability sample, the rich information about sample members collected in the initial BSA/SSA interviews enables a sophisticated weighting approach that accounts effectively for subsequent non-response bias (see section C.5).
Tables C.2, C.3 and C.4 provide profile information on the survey respondents.
Table C.1Survey responseNatCen panel ScotCen panel
Response to the survey
Issued 3,729 1,894
Deadwood 3 8
Achieved 2,180 673
Survey response rate (%) 60 36
Overall response
BSA/SSA issued 16,718 5,910
BSA/SSA deadwood 1,529 633
BSA/SSA productive 6,930 2,525
Recruited to panel 4,003 2,087
BSA/SSA response rate (%) 46 48
Panel recruitment rate (%) 58 83
Panel deadwood 3 0
Overall survey response rate (%) 14 13
Equality and Human Rights Commission Published: October 2018 76

Towards a national barometer of prejudice and discrimination in Britain
Table C.2Sample profile of the NatCen panelBSA
population estimate
(weighted, %)*
Panel survey
estimate (weighted,
%)
Panel survey sample
(unweighted, %)
SexMale 49 49 43Female 51 51 57Age18–24 11 11 425–34 17 18 1435–44 16 17 1845–54 18 18 1955–64 15 15 1965+ 23 21 26RegionNorth East 4 4 4North West 11 11 12Yorkshire and The Humber 9 9 11East Midlands 7 8 8West Midlands 9 9 8East of England 10 10 12London 13 13 9South East 14 14 14South West 9 9 10Wales 5 5 5Scotland 9 9 8
Social gradeManagerial and professional occupations 38 40 50Intermediate occupations 12 13 14Small employers and own account workers 9 8 8Lower supervisory and technical occupations 8 8 7Semi-routine and routine occupations 27 28 20Highest level of educationDegree 26 27 35Higher education below degree 11 10 13A level or equivalent 19 19 18O level/CSE or equivalent 26 26 24Foreign or other 2 2 1
Equality and Human Rights Commission Published: October 2018 77

Towards a national barometer of prejudice and discrimination in Britain
No qualifications 17 15 9Household typeSingle person household 17 17 27Lone parent 4 4 62 adults (no children) 36 38 382 adults (with children) 21 20 193+ adults (no children) 15 14 73+ adults (with children) 7 6 3Economic activityFull time education 5 5 2Paid work 56 58 55Unemployed 5 6 4Retired 24 23 30Other 11 9 10TenureOwned/being bought 64 63 71Rented (LA) 10 9 7Rented (HA/Trust/New Town) 8 8 7Rented (Other) 18 19 15Other 1 1 1
Unweighted base 7270 2180 2180* Estimates are based on combined BSA 2016 and 2017 datasets, each weighted to reflect the population at the time.
Table C.3Sample profile of the ScotCen panelSSA population estimate (weighted, %)*
Panel survey estimate (weighted, %)
Panel survey sample (unweighted, %)
SexMale 48 46 48Female 52 54 52Age18–24 11 13 425–34 16 17 935–44 15 15 1445–54 18 18 2455–64 15 16 2365+ 22 21 26
Social gradeManagerial and professional occupations 34 33 48
Equality and Human Rights Commission Published: October 2018 78
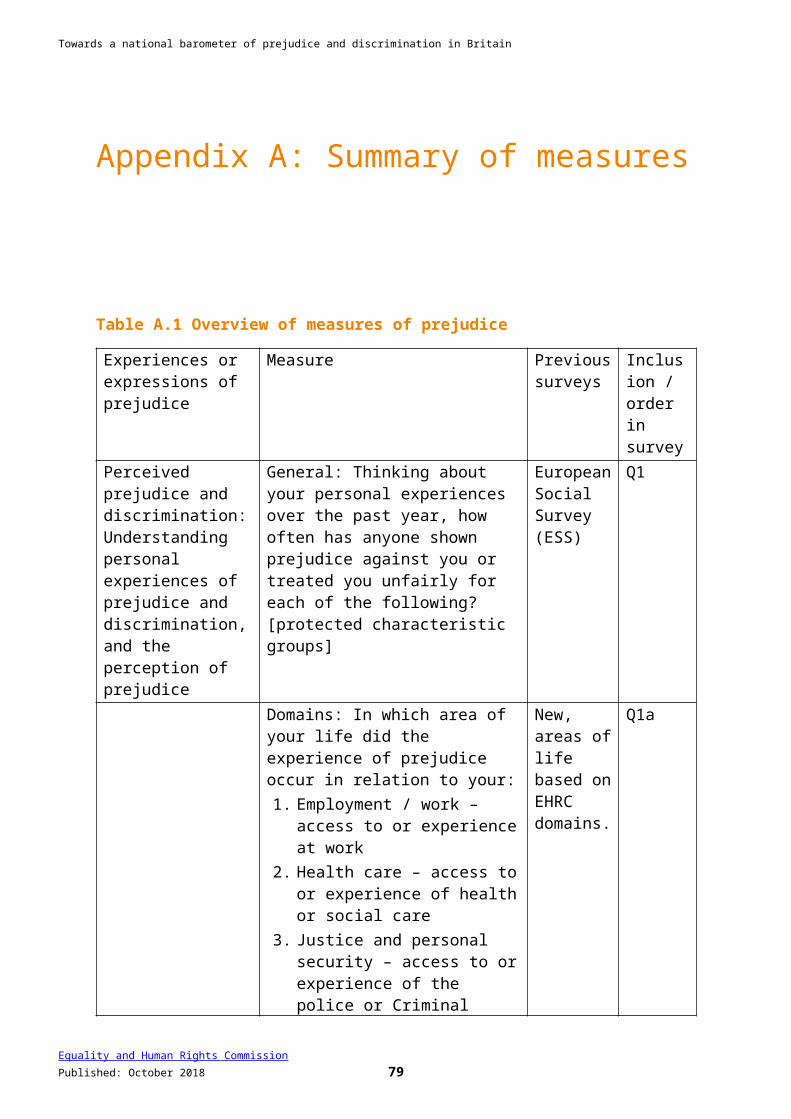
Towards a national barometer of prejudice and discrimination in Britain
Intermediate occupations 10 10 10Small employers and own account workers 7 7 9Lower supervisory and technical occupations 11 13 9Semi-routine and routine occupations 27 27 19Highest level of educationDegree 22 23 37Higher education below degree 15 15 14A level or equivalent 21 23 17O level/CSE or equivalent 21 22 18Foreign or other 2 0 1No qualifications 18 16 12Household typeSingle person household 20 21 32Lone parent 3 4 42 adults (no children) 35 36 372 adults (with children) 20 20 163+ adults (no children) 15 13 73+ adults (with children) 7 6 3Economic activityFull time education 6 6 3Paid work 55 58 53Unemployed 6 5 4Retired 23 22 31Other 10 9 10TenureOwned/being bought 62 64 73Rented (LA) 15 14 11Rented (HA/Trust/New Town) 9 9 7Rented (Other) 13 14 9Other 1 0 0
Unweighted base 2525 673 673* Estimates are based on combined BSA 2016 and 2017 datasets, each weighted to reflect the population at the time
Table C.4Profile of protected characteristics within survey respondents
Protected characteristic Survey estimate (weighted, %)
Survey estimate (unweighted, %)
SexMale 49 43Female 51 57Age
Equality and Human Rights Commission Published: October 2018 79

Towards a national barometer of prejudice and discrimination in Britain
Protected characteristic Survey estimate (weighted, %)
Survey estimate (unweighted, %)
18–24 10 425–34 17 1335–44 17 1845–54 18 1955–64 16 1965+ 22 28EthnicityBLACK: of African origin 2 1BLACK: of Caribbean origin 1 1BLACK: of other origin <1 <1ASIAN: of Indian origin 3 2ASIAN: of Pakistani origin 2 1ASIAN: of Bangladeshi origin 1 <1ASIAN: of Chinese origin <1 <1ASIAN: of other origin 1 1WHITE: of any origin 88 93MIXED ORIGIN 2 1OTHER 1 1ReligionNo religion 39 37Christian 52 56Other religion 8 6DisabilityYes – physical health condition or disability only*
22 24
Yes – mental health condition or disability only
7 7
Yes – Both physical and mental health condition or disability
3 3
No, neither 68 65Sexual orientationHeterosexual or straight 93 94Gay or lesbian 2 2Bisexual 3 4Other sexual orientation not listed 0 0I prefer not to say 2 2Transgender Respondents identifying with gender different to that assigned at birth, or currently identify their gender as ‘something else’
<1 <1
Base: 2,180 respondents, NatCen panel sample* Protected characteristics are described consistently unless the survey used for the data collection used a slightly different term, in which case we have replicated the term used in that survey to avoid misrepresenting the findings.
Equality and Human Rights Commission Published: October 2018 80
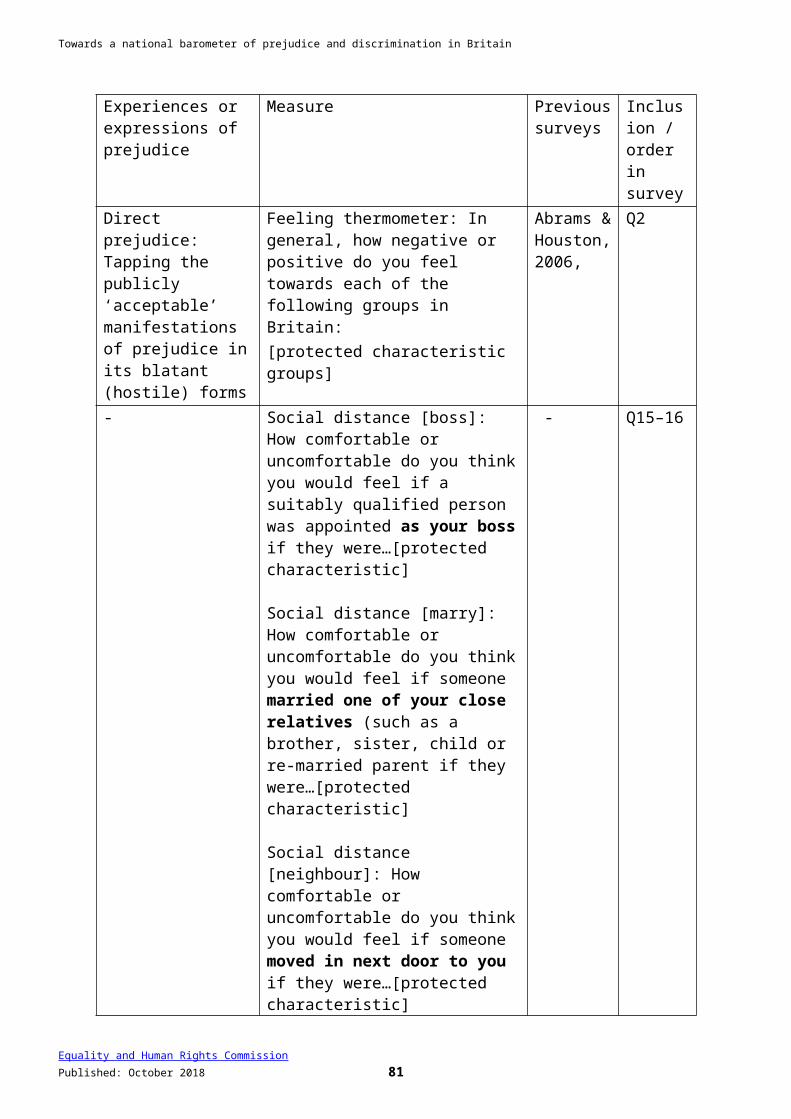
Towards a national barometer of prejudice and discrimination in Britain
Protected characteristic Survey estimate (weighted, %)
Survey estimate (unweighted, %)
SexMale 46 48Female 54 52Age18–24 11 325–34 16 935–44 15 1245–54 18 2355–64 16 2365+ 23 31EthnicityBLACK: of African origin 1 <1BLACK: of Caribbean origin 0 0BLACK: of other origin 0 0ASIAN: of Indian origin <1 <1ASIAN: of Pakistani origin 1 <1ASIAN: of Bangladeshi origin 0 0ASIAN: of Chinese origin 1 <1ASIAN: of other origin 1 <1WHITE: of any origin 96 98MIXED ORIGIN 1 <1OTHER 0 0ReligionNo religion 43 40Christian 52 56Other religion 3 3DisabilityYes – physical health condition or disability only*
21 25
Yes – mental health condition or disability only
10 7
Yes – Both physical and mental health condition or disability
3 3
No, neither 66 64Sexual orientationHeterosexual or Straight 89 93Gay or Lesbian 3 2Bisexual 4 2Other sexual orientation not listed 0 0I prefer not to say 5 2TransgenderRespondents with gender different to that assigned at birth, or currently identify their gender as ‘something else’
<1 <1
Base: 673 respondents, ScotCen panel sample* Protected characteristics are described consistently unless the survey used for the data collection used a slightly different term, in which case we have replicated the term used in that survey to avoid misrepresenting the findings.
Equality and Human Rights Commission Published: October 2018 81

Towards a national barometer of prejudice and discrimination in Britain
C.4 PopulusLive panel
The PopulusLive panel is a web panel with approximately 130,000 active members. The panel is recruited via a number of approaches including standard web advertising, working with selected database partners, and word of mouth to provide a cross section the population.
There were separate approaches for the boosted protected characteristic groups and the boost for Wales. For the latter, sample members for this survey were selected using a quota approach: quotas were set by sex, age, region and highest level of education to achieve a representative sample on those characteristics of those aged 18 and over living in Britain (whilst the sample used for the study was limited to Wales, interviews were carried out with panel members across Britain to enable a matching approach to the weighting – see below). Fieldwork lasted for four weeks in December 2017, with panel members offered an incentive to take part. Invitations were staggered to enable those who were slower to respond or harder to reach the opportunity to participate. Quota sample approaches do not look at response maximisation as an indicator of quality and are not presented here, but the efforts to ensure a longer than usual fieldwork period which encourages participation will go some way to improving the profile of the resulting sample.
Separately, boost samples for Black, Muslim, Gay/Lesbian/Bisexual and those with a mental health condition were achieved with emailed invitations to the full panel over the four-week period.
C.5 Weighting and analysis
Analysis of the British population uses the NatCen panel and that of Scotland on its own uses the ScotCen panel. A similar approach is taken to the weighting for both panels (though separately computed). A weight is applied that takes account of three stages of the panels’ design:
The BSA and SSA survey weights. Panel members were recruited from the BSA 2016 and BSA 2017 and from SSA 2015 and SSA 2016. Firstly, for both surveys, the weights account for unequal chances of selection in their sampling (for instance SSA over-samples rural areas and in both surveys individuals in larger households have a lower selection probability). Secondly, a non-response model is used to produce a non-response weight. This weight adjusts for non-response at the survey. Finally, the weights make the samples
Equality and Human Rights Commission Published: October 2018 82

Towards a national barometer of prejudice and discrimination in Britain
representative of the general British population (for BSA) or Scotland (for SSA) in terms of gender, age and Government Office Region (GOR).
Panel weight. This weight accounts for non-response at the panel recruitment stage where some people interviewed as part of the BSA/SSA survey chose not to join the panel. A logistic regression model was used to derive the probability of response of each panel member; the panel weight is computed as the inverse of the probabilities of response. This weight adjusts the panel for non-response (for the NatCen panel the survey variables used were: age and sex groups, GOR, survey year, household type, household income, education level, internet access, ethnicity, tenure, social class group, economic activity, political party identification, and interest in politics). The resulting panel weight was multiplied by the BSA/SSA weights, so the panel is representative of the population.
Survey weight. This weight is to adjust the bias caused by non-response to this particular panel survey. A logistic regression model was used to compute the probabilities of response of each participant. The panel survey weight is equal to the inverse of the probabilities of response. The initial set of predictors used to build the model was the same as for the panel weight; and at this wave the final set of variables used was also the same. The final survey weight is the result of multiplying the survey weight by the compounded panel weight.
Country analysis (England, Scotland and Wales) is made possible by the ScotCen panel and by the non-probability Welsh boost. To be more confident about the Welsh sample, a propensity matching approach was taken to match the PopulusLive GB sample to the NatCen panel sample on key variables,5 with the sample calibrated by age-sex within country. Data for Wales is therefore a mix of NatCen panel and PopulusLive data, weighted to be representative of the Welsh population.
Results for the boosted protected characteristic groups in the ‘experiences’ section should be regarded as indicative – we cannot know how representative the sample that we achieved is of these subgroups in the wider population. Unlike the Welsh boost, quotas were not set (due to the relatively small numbers available on the Populus panel) and all available cases were invited to be interviewed. Given the small numbers of these subgroups in the NatCen panel a matching approach similar
5 These variables were as follows: age, sex, region, relationship status, tenure, religion, highest educational qualification, disability, whether any children in household, economic activity and ethnicity. Note that the questions asked on the Populus omnibus were slightly different from those asked for the NatCen panel for disability, education and economic activity.
Equality and Human Rights Commission Published: October 2018 83

Towards a national barometer of prejudice and discrimination in Britain
to that for the Welsh sample was not undertaken for these boosts and data are left unweighted for analysis.
C.6 Coding of domains
The questions about the context in which experiences of prejudice took place included the collection of verbatim responses where the experience was not in one of the listed codes. These verbatim responses were coded in the office by specialist NatCen coders and either placed into new codes (where there was a number of similar responses), back-coded into the existing codes, or kept in an ‘other’ category.
Equality and Human Rights Commission Published: October 2018 84

Towards a national barometer of prejudice and discrimination in Britain
Appendix D: Recommendations on usage of the survey
D.1 Reliability and validity
The items in the survey are underpinned with social psychological theories of prejudice, and have been widely used in social psychological research (for example, in experimental studies) and in national and international surveys (Abrams and Houston, 2006; ESS, 2008 etc.) to capture experiences of prejudice and attitudes towards groups with protected characteristics. The items were based on established social psychological research (see reviews in Abrams, 2010; Abrams, Swift and Mahmood, 2016) to capture the multi-faceted nature of prejudice in as economical a form as possible.
The items are considered to have good content and face validity. Face validity is when the items appear valid and meaningful to respondents, those administering the items and non-experts. Our pilot work established that respondents understood the items and experienced no ambiguity over their meaning or how to use the response formats. For instance, participants understood the concepts such as ‘prejudice’ and what it meant to be ‘treated unfairly’ which formed the general item measuring experiences of prejudice.
Content validity refers to the adequacy of the items to capture knowledge about domains for which it was intended. The case studies illustrate content validity (and how the set of items as a whole can be interpreted together) in showing how prejudice can manifest differently for different protected characteristics.
Because of resource constraints (something many social researchers are likely to face), as well as limits of how many questions it is reasonable to ask of respondents in a single session, the survey was limited to 30 items. There are other aspects of prejudice (such as threat) that we could have assessed, and we would not argue that the survey is exhaustive (see Abrams, 2010 for a fuller set). However, the items that were selected do, in our view, cover many of the core elements of prejudice that are amenable to assessment through surveys and questionnaires. Future work, whether
Equality and Human Rights Commission Published: October 2018 85
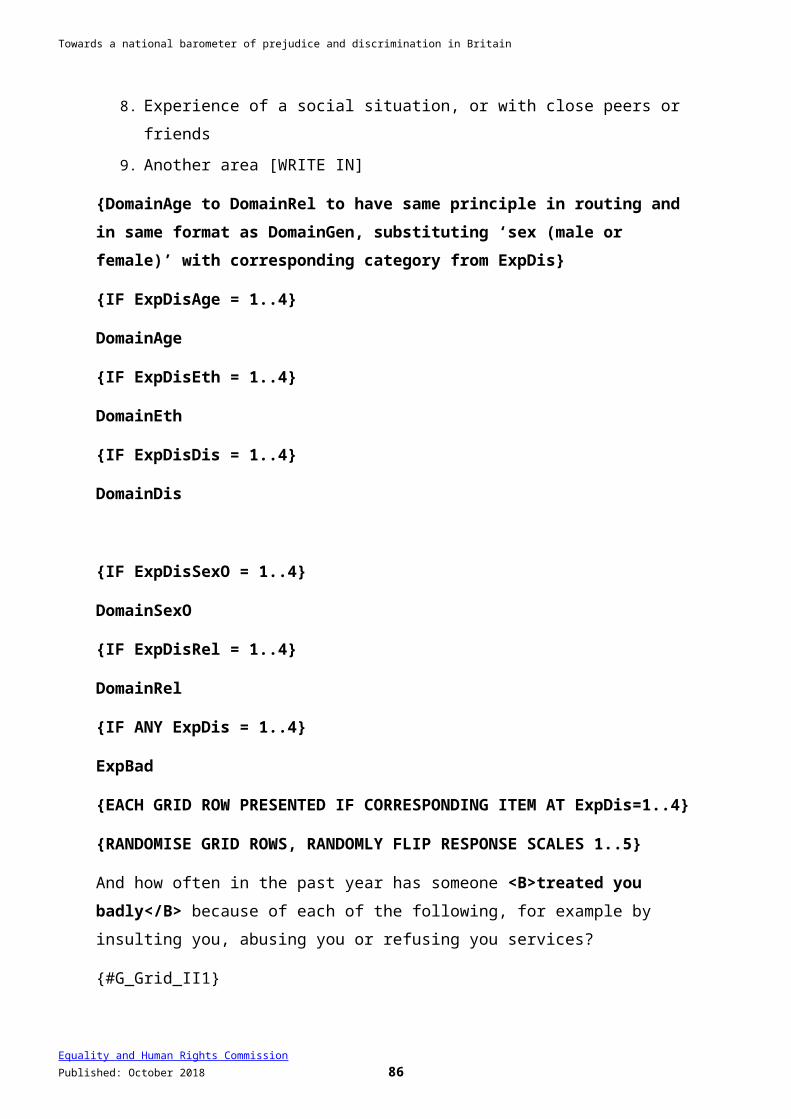
Towards a national barometer of prejudice and discrimination in Britain
an expanded version of the survey, or research to explore the situation of one protected characteristic in greater detail, could usefully include additional questions to explore the context, and other forms of experiences and expressions of prejudice.
Evaluating the full potential of the survey, and a ‘barometer’ that uses it, is a longer-term task that needs to be supported and should be conducted through further academic research.6 For example, previous research shows that the three items we have used to measure experiences of prejudice, when applied to prejudice based on age, do have the same meaning for younger and older respondents (Bratt et al., 2017). Therefore, we are confident that the items work well across other protected characteristics, but this will need to be evaluated by further statistical work.7
The test of the survey did not cover the whole range of protected characteristics. Some further work will be needed to examine experiences associated with marriage and civil partnership, pregnancy and maternity, and gender reassignment. In addition, we included some additional groups as part of this research because of particular risks they face even though they may not necessarily be afforded specific legal protections (Gypsy, Roma and Traveller, and immigrants). Further work is also needed to ensure that emerging categories and groups that may require protection are assessed in future. The survey can readily be adapted for these groups, and we hope that benchmark measures will be established as soon as is feasible across the whole set in order to ensure that new data can be compared meaningfully with existing evidence. It is also important to continue to look beyond protected characteristics to other vulnerable or at-risk groups, as noted in the Equality and Human Rights Commission Is England Fairer? report (2016; chapter 9).
6 The construct validity of the items (that is, how well the items capture a non-observable construct such as prejudice) need to be tested. This can be explored in two ways. One way is by analysing the relationships between the items capturing attitudes towards one protected characteristic (e.g. testing how all the constructs that capture attitudes towards, for example, black people, relate to one another). Another is by exploring how one item captures an attitude towards multiple protected characteristics (e.g. how well the feeling thermometer captures feelings towards multiple groups). Further analyses should also test for convergent validity, the extent to which the attitude items converge with other items measuring the same construct. This can be tested by analysing the correlations between the items measuring prejudice attitudes towards protected characteristic groups with items assessing equality values and motivation to control prejudice. We would expect that people who value equality and have higher motivation to control prejudice express less prejudice.7 This will be tested by exploring the measurement invariance of the items, where good items will be invariant across protected characteristic groups. Conducting these analyses will ensure that the items have the same meaning for each protected characteristic.
Equality and Human Rights Commission Published: October 2018 86
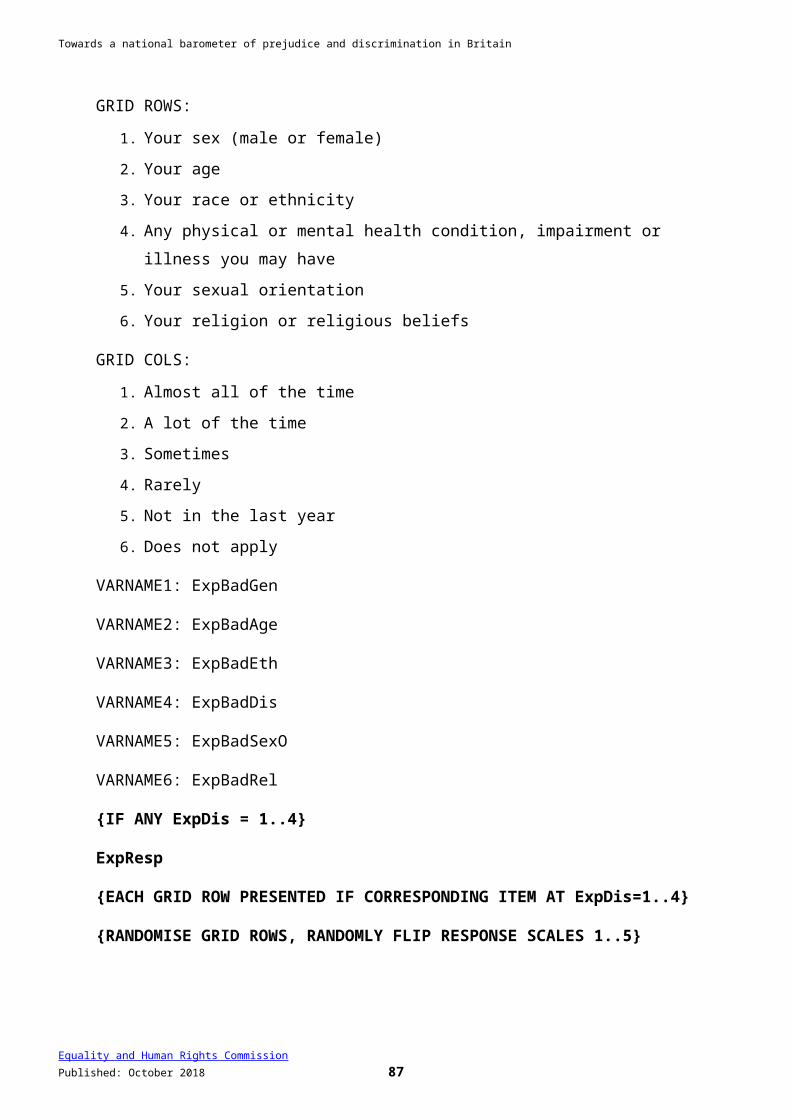
Towards a national barometer of prejudice and discrimination in Britain
D.2 Survey approach
A new element of the approach in this research was the use of an online/CATI probability panel, supplemented by a non-probability panel. The piloting and the initial findings described in this report support the view that the measures worked as anticipated in a (largely) self-completion setting. The probability sampling approach used for most of the analysis, coupled with sophisticated weighting, provides reassurance that adjustments can be made to correct non-response bias, and assess the level of error in our estimates. Efforts to adjust the non-probability sample in Wales did not entirely account for the variation observed between the probability and non-probability samples in that country on key measures, meaning that direct comparisons should not be made between Wales and England or Scotland, where all cases were from the probability panel. Future research could usefully focus on identifying variables that could better account for differences between these types of sample as they relate to the key measures of prejudicial attitudes and experience. There is also some uncertainty about the extent to which the boosted low-incidence protected characteristic group samples were representative of their counterparts in the wider population. More reliable estimates would be possible from larger probability samples and we hope that the survey measures will be taken up in further studies to achieve this.
Every three years, the Commission evaluates whether Britain is becoming fairer or not. We strongly recommend that new research is conducted to evaluate how prejudice and discrimination have changed by repeating the benchmark survey and its set of measures to coincide with these intervals. In addition, it would be highly desirable to conduct longitudinal panel studies to examine whose attitudes are changing and what other factors may be influencing these changes in relation to other indicators of inequality.
Equality and Human Rights Commission Published: October 2018 87
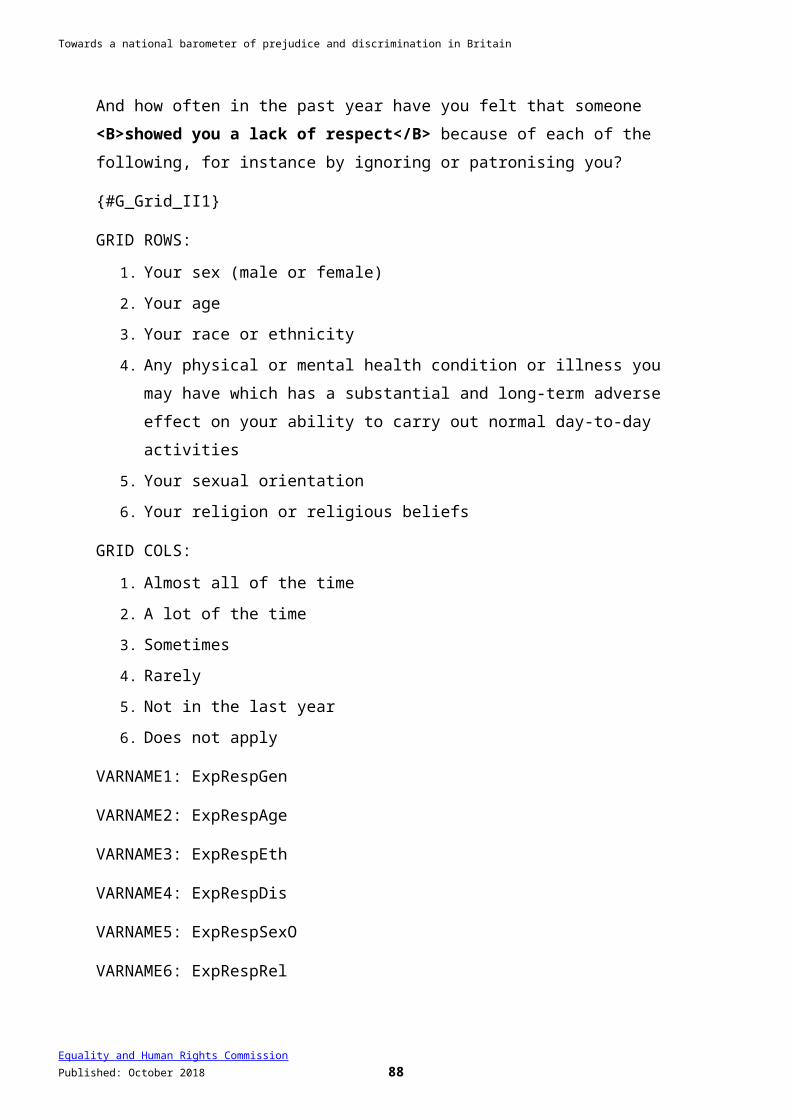
Towards a national barometer of prejudice and discrimination in Britain
Contacts
This publication and related equality and human rights resources are available from our website.
Questions and comments regarding this publication may be addressed to: [email protected]. We welcome your feedback.
For information on accessing one of our publications in an alternative format, please contact: [email protected] .
Keep up to date with our latest news, events and publications by signing up to our e- newsletter .
EASS
For advice, information or guidance on equality, discrimination or human rights issues, please contact the Equality Advisory and Support Service, a free and independent service.
Telephone 0808 800 0082
Textphone 0808 800 0084
Hours 09:00 to 19:00 (Monday to Friday)10:00 to 14:00 (Saturday)
Post FREEPOST EASS HELPLINE FPN6521
© 2018 Equality and Human Rights Commission
Published October 2018
ISBN 978-1-84206-763-5
Equality and Human Rights Commission Published: October 2018 88
Related Documents