Proceedings of the International Conference on Industrial Engineering and Operations Management Pilsen, Czech Republic, July 23-26, 2019 © IEOM Society International Developing a Discrete Event Simulation Methodology to support a Six Sigma Approach for Manufacturing Organization – Case study Anees Hussain, Jose Eduardo Munive-Hernandez, Felician Campean Faculty of Engineering & Informatics University of Bradford Bradford, BD7 1DP, UK [email protected], [email protected], [email protected] Abstract Competition in the manufacturing industry is growing at an accelerated rate due to globalization trend. This global competition urges manufacturing organizations to review and improve their processes in order to enhance and maintain their competitive advantage. One of those initiatives is the implementation of the Six Sigma methodology to analyze and reduce variation hence improving the processes of manufacturing organizations. This paper presents a Discrete Event Simulation methodology to support a Six Sigma approach for manufacturing organizations. Several approaches to implement Six Sigma focus on improving time management and reducing cycle time. However, these efforts may fail in their effective and practical implementation to achieve the desired results. Following the proposed methodology, a Discrete Event Simulation model was built to assist decision makers in understanding the behavior of the current manufacturing process. This approach helps to systematically define, measure and analyze the current state process to test different scenarios to improve performance. The paper proposes a systematic process improvement approach which allows for constant refinement of a process until a state of perfection is achieved. It applies an action research strategy to develop and validate the proposed modelling methodology in a British manufacturing organization competing in global markets. Keywords Six Sigma, Discrete Event Simulation, Process Improvement, Action Research and Modelling 1 Introduction According to The Engineer (2018), global manufacturing contributes to £6.7 trillion to the global economy. The UK automotive manufacturing industry turns over £80 billion year on year showing the growing competition for manufactures to implement process improvement techniques in order to stay competitive in local and global markets (SMMT, 2018). Initially developed as a methodology to measure defects and improve overall quality in manufacturing, Six Sigma in manufacturing seeks to reduce waste, improve quality of the product and in turn achieve more efficient operations. Six Sigma originated at Motorola, where the process was focused on reducing variability in product and process in order to prevent defects (Sanders & Hild, 2007). The concepts underlying brought to you by CORE View metadata, citation and similar papers at core.ac.uk provided by Bradford Scholars

Welcome message from author
This document is posted to help you gain knowledge. Please leave a comment to let me know what you think about it! Share it to your friends and learn new things together.
Transcript

Proceedings of the International Conference on Industrial Engineering and Operations Management
Pilsen, Czech Republic, July 23-26, 2019
© IEOM Society International
Developing a Discrete Event Simulation Methodology to
support a Six Sigma Approach for Manufacturing
Organization – Case study
Anees Hussain, Jose Eduardo Munive-Hernandez, Felician Campean
Faculty of Engineering & Informatics
University of Bradford
Bradford, BD7 1DP, UK
[email protected], [email protected], [email protected]
Abstract
Competition in the manufacturing industry is growing at an accelerated rate due to globalization
trend. This global competition urges manufacturing organizations to review and improve their
processes in order to enhance and maintain their competitive advantage. One of those initiatives is
the implementation of the Six Sigma methodology to analyze and reduce variation hence
improving the processes of manufacturing organizations. This paper presents a Discrete Event
Simulation methodology to support a Six Sigma approach for manufacturing organizations.
Several approaches to implement Six Sigma focus on improving time management and reducing
cycle time. However, these efforts may fail in their effective and practical implementation to
achieve the desired results. Following the proposed methodology, a Discrete Event Simulation
model was built to assist decision makers in understanding the behavior of the current
manufacturing process. This approach helps to systematically define, measure and analyze the
current state process to test different scenarios to improve performance. The paper proposes a
systematic process improvement approach which allows for constant refinement of a process until
a state of perfection is achieved. It applies an action research strategy to develop and validate the
proposed modelling methodology in a British manufacturing organization competing in global
markets.
Keywords Six Sigma, Discrete Event Simulation, Process Improvement, Action Research and Modelling
1 Introduction
According to The Engineer (2018), global manufacturing contributes to £6.7 trillion to the global
economy. The UK automotive manufacturing industry turns over £80 billion year on year showing
the growing competition for manufactures to implement process improvement techniques in order
to stay competitive in local and global markets (SMMT, 2018). Initially developed as a
methodology to measure defects and improve overall quality in manufacturing, Six Sigma in
manufacturing seeks to reduce waste, improve quality of the product and in turn achieve more
efficient operations.
Six Sigma originated at Motorola, where the process was focused on reducing variability in
product and process in order to prevent defects (Sanders & Hild, 2007). The concepts underlying
brought to you by COREView metadata, citation and similar papers at core.ac.uk
provided by Bradford Scholars

Proceedings of the International Conference on Industrial Engineering and Operations Management
Pilsen, Czech Republic, July 23-26, 2019
© IEOM Society International
Six Sigma deal with strong factors affecting manufacturing lead times, product and process costs,
process yield, product quality and ultimately, customer satisfaction (Sanders & Hild, 2000). Six
Sigma is made up of two methodologies, which are the Define, Measure, Analyze, Improve and
Control (DMAIC) improvement cycle and Define, Measure, Analyze, Design and Verify
(DMADV) method for improving new and existing products and processes.
This paper aims to develop a Discrete Event Simulation methodology to support a Six Sigma
approach for manufacturing organizations. This methodology integrates the DMAIC improvement
cycle, the Six Sigma technique to analyze and reduce variation, and the application of a Discrete
Event Simulation approach to understand the behavior of processes and support improvement
decisions. The proposed methodology is validated in the context of the manufacturing sector,
specifically automotive. In this way, a model of a manufacturing process under study is constructed
using a systematic approach for Discrete Event Simulation alongside the Define, Measure,
Analyze, and Improve (DMAIC) improvement cycle. This approach will allow to understand the
behavior of the current state process prior to simulate different scenarios to test the proposed
solutions and implement changes for improvements. In this way, managers can be assisted in
decision making to develop more effective improvement solutions aligned with strategic plans and
goals.
The paper reviews relevant literature related to Six Sigma, Lean Thinking and the Discrete Event
Simulation modelling technique. The paper continues with the development and implementation
of Discrete Event Simulation methodology, including the application of process improvement
techniques relevant to the DMAIC improvement cycle, the development of a cause and effect
diagram, producing process decomposition maps and constructing the Discrete Event model.
Finally, the paper presents the analysis of process variability and simulation of the model, outlining
an action plan for future implementation. The model is simulated based on data collected from a
manufacturing company in the UK. Applying simulation to action research have proven useful to
companies to gradually implement changes to their processes. An action research strategy was
established to support the development and implementation of the Discrete Event Simulation
methodology in a British manufacturing organization competing in global markets.
2 Research Context
This research is conducted in a global manufacturing company with facilities worldwide. The
organization is a leading supplier for combustion, hybrid and electric vehicles. The market is very
demanding in terms of quality, responsiveness to orders and delivery times. With increasing
change within the automotive industry, the organization aims to become more responsive and
flexible by improving the performance of its manufacturing processes. The research was carried
out in the UK facility of the global manufacturing organization. The manufacturing processes
considered for this research included low volume/high variety products, with majority of the
process heavily relying on skilled manual labor.
3 Research Methodology
Action research is an empirical research method concerned with the management of a change,
solving real-world problems whilst simultaneously studying the experience of solving the problem
(O'Brien, 1998) (Barber, et al., 2006). This research strategy involves close collaboration between

Proceedings of the International Conference on Industrial Engineering and Operations Management
Pilsen, Czech Republic, July 23-26, 2019
© IEOM Society International
practitioners and researchers, allowing the direct participation of problem owners. It is one of the
ways of conducting research within an organization that can solve an immediate problem or a
reflective process of a progressive problem. The action research strategy starts within a specific
context of the problem to study and with a clear purpose. The action research strategy typically
involves the following five stages in an iterative spiral (Rowley, 2003): (1) Diagnosis or fact
finding and analysis, (2) Action Planning, (3) Decision about actions to be taken, (4) Evaluation
of taken actions, and (5) Learning Specification (Susman & Evered, 1978). Action research
involves actively participating in a change situation, often in a large organization, with the aim of
improving strategies, practices and knowledge of the environment (Adelman, 1993). Once the
initial research structure was outlined, an action research strategy was established to help defining
the research objectives and to develop the Discrete Event Simulation methodology aligned with a
Six Sigma approach. The research project involved working closely with managers and employees
of the organization, which provided a greater understanding of the current state of the
manufacturing process under study.
Following the first stage of the action research strategy to develop the modelling methodology, the
diagnosis of the manufacturing process was carried out. This stage involved data analysis,
conversations with managers and operators, Gemba walk and observations of the manufacturing
process, including identification of the process flow. Several tools were used to support this
analysis, such as cause and effect diagram and process flow. The conducted analysis lead to the
identification of problems and selection and evaluation of key performance indicators (KPIs), such
as work-in-progress (WIP), takt time, cycle time, setup time, productivity and skills of operators.
In the action planning stage of the action research strategy, meetings with production supervisors
led to collaborate in producing ideas from different departments to consider potential courses of
action. From this stage, a course of action is selected prior to collecting data. This included the
selection of method to collect the data and to analyze this. This data will be used to populate the
Discrete Event model and to simulate different scenarios to validate the proposed modelling
methodology.
The evaluation stage and learning specification of the action research strategy was carried out
systematically after each period of collection and analysis of data for different family of parts being
produced in the manufacturing process under study. The action research strategy has been applied
in a systematic and iterative manner during the development of the Discrete Event Simulation
methodology.
4 Literature review
4.1 Six Sigma
In the early and mid-1980s, Motorola decided that traditional quality levels, didn’t provide an
adequate solution. Instead they wanted to measure the defects per million opportunities. Motorola
developed this new standard and created the new methodology associated with it (Hahn &
Doganaksov, 2000). By 1988, they received the Malcom Baldrige National Quality Award, which
lead to the use of Six Sigma in almost every industry.
Proceedings of the International Conference on Industrial Engineering and Operations Management
Pilsen, Czech Republic, July 23-26, 2019
© IEOM Society International
Six Sigma is defined as a business process that follows companies to drastically improve their
bottom line by designing and monitoring everyday business activities in ways that minimize waste
and resources while increasing customer satisfaction by some of its proponents (Andersson, et al.,
2006).
It is an highly disciplined approach that typically involves the five stages Define, Measure,
Analyze, Improve and Control which is also known as DMAIC. These steps, in brief are (Kakkad
& Makwana, 2017):
Define (D) – Define the problem statement, goals and identify factors that are critical to
quality.
Measure (M) – Collect data for all the processes involved in achieving the goal. This data
will be used to carry out comparative tests.
Analyze (A) – Understand the root causes of why the defects occur; identify key process
variables that cause defects.
Improve (I) – Implement potential corrective and preventive measures, thereby reducing
defect levels.
Control (C) – Ensure the modified process now keeps the key improved variables within
the acceptable limits, in order to maintain long term improvement.
While there are many definitions of the six concept, it is understood to represent a systematic
approach to identifying and eliminating elements which do not add value to the product. The
methodology describes 8 types of waste (Ghobadian, et al., 2018):
Defects – Products that are out of specification
Over Production – Producing too much of the product
Waiting – For parts, information, instruction, equipment from previous workstation
Skills – Underutilizing capabilities
Transportation – Transporting items or information that is not required to perform the
process from one location to another
Inventory – Holding material or information ahead of requirements
Motion – Moving people, products, and information more than required
Over Processing – Performing any activity that is not necessary to produce a function
product
4.2 Discrete Event Modelling and Simulation
The development of production systems is a complex task therefore strategies such as the use of
Discrete Event Simulation (DES) makes it easier to find problems prior to making changes. Some
authors applied animation resources integrated with DES models to make it easier to validate the
process of the model under study to accomplish its credibility (Woo, et al., 2014), (Laurindo, et
al., 2019).
Discrete Event Simulation (DES) is the process of defining the behavior of a complex system as
an ordered sequence of defined events. Within this context, an event involves changing the
system’s state at a specific point of time such as resources fail, operators take breaks, shifts change
etc. (Rose, 2019). DES can statistically provide valid estimates of performance measures
associated with these systems, such as the number of parts waiting in a particular queue or the
Proceedings of the International Conference on Industrial Engineering and Operations Management
Pilsen, Czech Republic, July 23-26, 2019
© IEOM Society International
longest waiting time a particular customer might experience (Sweetser, 1999). Therefore, DES
methodology is disciplined in terms of capturing the structure of an existing or proposed system.
The simulation will validate improving the process prior to implementation as this is often costly
without the actual benefits difficult to justify prior to implementation (Heshmat, et al., 2013).
A major part of DES models are often build from process maps, or flow charts. These maps can
also assist in clarifying important relationships and processes. Although there are exceptions, DES
consists of a great deal of effort in capturing and analyzing process maps, variances and
distributions, but once entered into the model these parameters remain fixed. The accuracy of
historical data or estimates of future performance are required to populate the model and produce
statistically valid results.
5 Building a Discrete Event Model for manufacturing process
The proposed methodology reflects on the following phases to develop the DES methodology to
support a Six Sigma approach: (1) Define the purpose of improvement; (2) Fishbone diagram to
understand the root cause; (3) Map the current state of the process; (4) Carry out a stopwatch
analysis; (5) Construct the Discrete Event model; (6) Populate the model with accurate timings;
(7) Analyze and simulate of the current state model; (8) Simulate different scenarios to test
potential solution for improvement; (9) Produce an action plan to implement the proposed solution,
and (10) Establish a continuous improvement approach. This systematical methodology is aligned
with the DMAIC, Six Sigma approach. Section 5.1 of this paper explains the development of
phases 1 and 2. Section 5.2 elaborate de development of phase 3, mapping the current state of the
process. Section 5.3 includes the stopwatch analysis. Section 5.4 explains the construction of the
Discreet Event model. The analysis and simulation of the current state of the manufacturing
process are included in section 5.5. Phases 8 to 10 are beyond the scope of this paper and these
will be addressed in a future paper.
5.1 Define the Purpose of Improvement and Understand Root Causes.
This phase of the DES methodology is aligned with the Define stage of the DMAIC improvement
cycle. At this stage, it is important that the objective statement of the research defines, in
measurable and time-bound terms, the target of performance to achieve in terms of improvement.
In this case, the objective statement defines the purpose of the initiative to be the improvement of
productivity by 5% of the specified manufacturing process. This statement can be adjusted once
the root causes are determined during the analysis phase.
The Discrete Event Simulation methodology was started by using the DMAIC process. The Define
stage of the Six Sigma approach is completed by using a fishbone diagram. This method is used
to represent the different parameters that can be analyzed to improve the process. The cause and
effect diagram will be validated by holding meetings with managers to measure a singular
parameter. This tool provides a systematic way of identifying possible causes that create or
contribute to the detected affect (Ilie & Ciocoiu, 2010). Thus, the fishbone is also beneficial to
identify areas (root cause of a problem) to collect relevant data (Basic tools for process
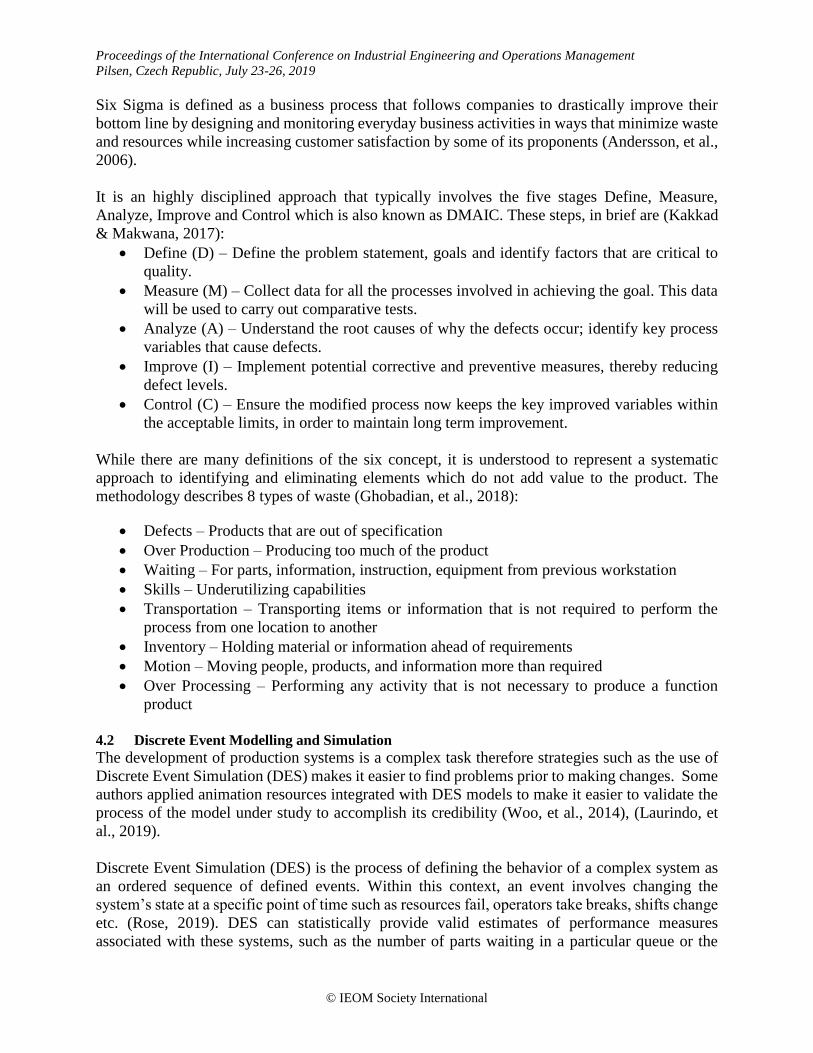
improvement, 1995). Figure 1 shows a fishbone diagram elaborated to identify the possible causes
affecting the required level of productivity in the manufacturing process under study.
Proceedings of the International Conference on Industrial Engineering and Operations Management
Pilsen, Czech Republic, July 23-26, 2019
© IEOM Society International
Productivity
Information
Material
People
Equipment
Procedures
Maintenance
Planning / Scheduling
Software
Inventory
TrainingManpower resource
Personal breaks
Under performance
New operators
Skills available / flexible
Setup
Changeover
Processes
No. of parts
Quality
Insufficient parts
Handling
Planned maintenance
Availability
Quality
Performance
No. of tools
Tool changes
Unplanned maintenance
Preventive maintenance
Defects
Figure 1. Cause and effect diagram
5.2 Mapping the Current State of the Manufacturing Process
From the cause and effect diagram, it was agreed upon to inspect the current state of the
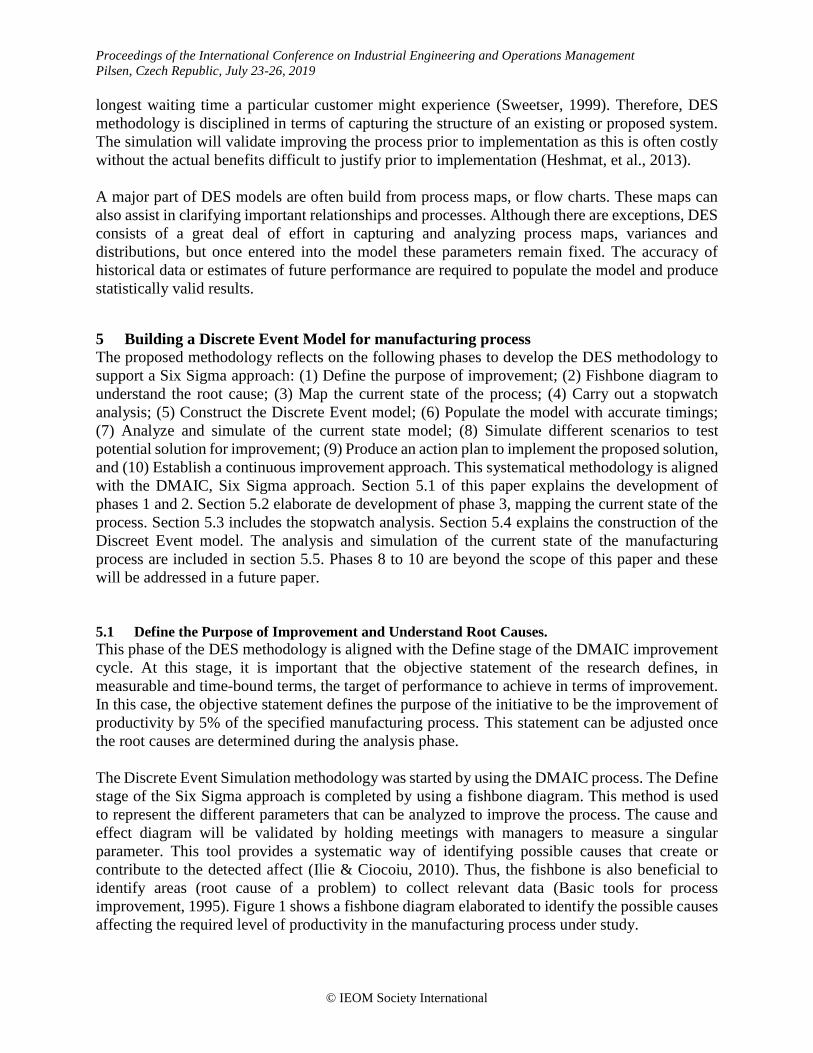
manufacturing process and observe any variations in its performance. Figure 2, shows a process
map of the assembly line that is being analyzed. The process map, consists of 3 main process with
queues in between them. It should be duly noted the maximum queue size in between each process
is 3 and all the process have a singular operator. Figure 3, shows process 1 broken down into two
separate workstations noted as WS1 and WS2. At each of the workstations there is 1 operator
manually making changes to the product. At Process 2, there is 1 operator using a machine to add
value to the product and Process 3 shows 1 operator manually adding value. This process flow
diagram is used to analyze the system as it shows a simple diagram of the current process. This
will be used to complete the next stage as the time measurements will be taken based upon deeper
analysis of these processes.
Figure 2. Graphical view of the manufacturing assembly line
Figure 3. Process flow diagram
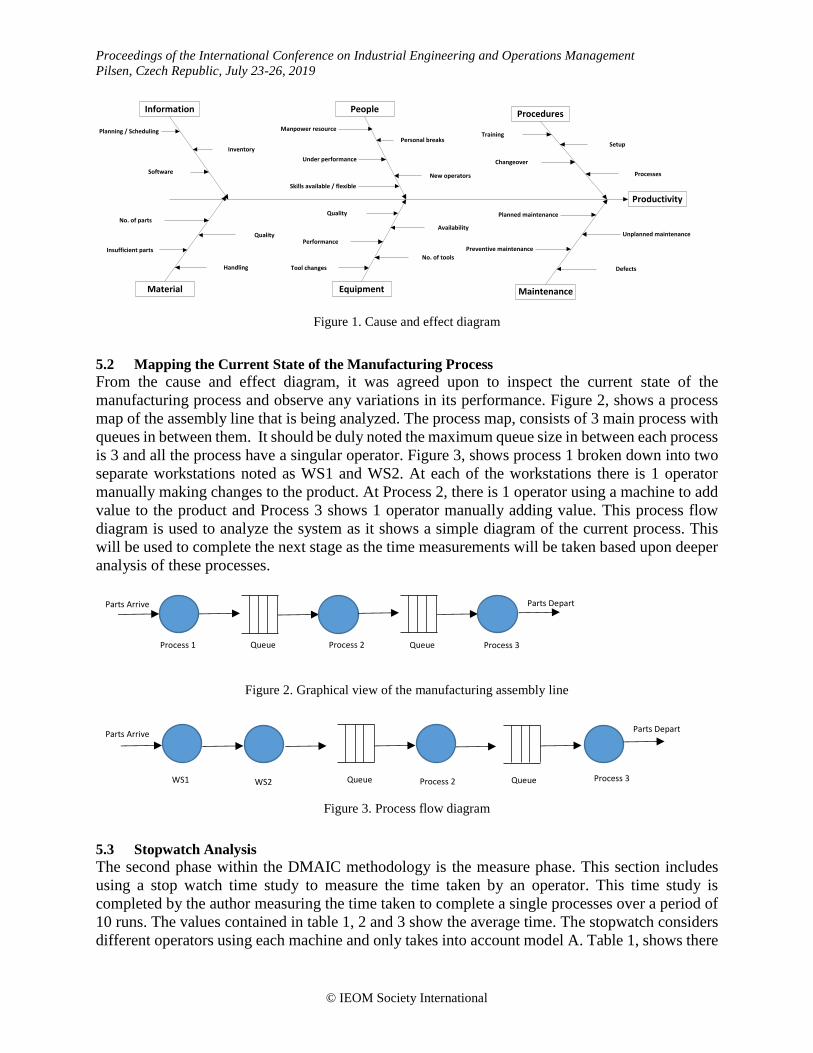
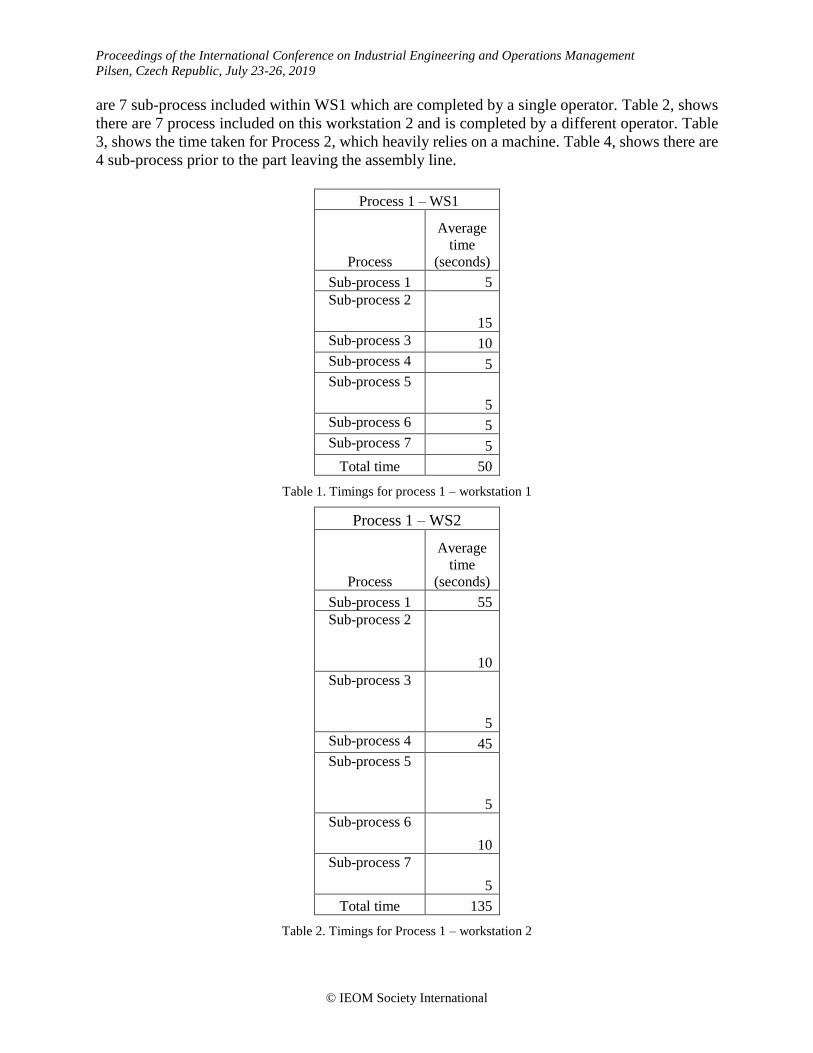
5.3 Stopwatch Analysis
The second phase within the DMAIC methodology is the measure phase. This section includes
using a stop watch time study to measure the time taken by an operator. This time study is
completed by the author measuring the time taken to complete a single processes over a period of
10 runs. The values contained in table 1, 2 and 3 show the average time. The stopwatch considers
different operators using each machine and only takes into account model A. Table 1, shows there
Parts Arrive
Queue Queue Process 1 Process 2 Process 3
Parts Depart
Parts Arrive
WS1 WS2 Process 2 Process 3 Queue
Parts Depart
Queue
Proceedings of the International Conference on Industrial Engineering and Operations Management
Pilsen, Czech Republic, July 23-26, 2019
© IEOM Society International
are 7 sub-process included within WS1 which are completed by a single operator. Table 2, shows
there are 7 process included on this workstation 2 and is completed by a different operator. Table
3, shows the time taken for Process 2, which heavily relies on a machine. Table 4, shows there are
4 sub-process prior to the part leaving the assembly line.
Process 1 – WS1
Process
Average
time
(seconds)
Sub-process 1 5
Sub-process 2
15
Sub-process 3 10
Sub-process 4 5
Sub-process 5
5
Sub-process 6 5
Sub-process 7 5
Total time 50
Table 1. Timings for process 1 – workstation 1
Process 1 – WS2
Process
Average
time
(seconds)
Sub-process 1 55
Sub-process 2
10
Sub-process 3
5
Sub-process 4 45
Sub-process 5
5
Sub-process 6
10
Sub-process 7
5
Total time 135
Table 2. Timings for Process 1 – workstation 2

Proceedings of the International Conference on Industrial Engineering and Operations Management
Pilsen, Czech Republic, July 23-26, 2019
© IEOM Society International
Process 2
Process
Average
time
(seconds)
Sub-process 1 10
Sub-process 2
20
Sub-process 3 35
Sub-process 4 10
Sub-process 5 35
Total time 110
Table 3. Timing for process 2
Process 3
Process
Average
time
(seconds)
Sub-process 1 5
Sub-process 2
35
Sub-process 3 15
Sub-process 4 10
Total time 65
Table 4. Timings for process 3
5.4 Construct and Populate the Discrete Event Model
This stage of the process allows to create a simple model based upon the current process map and
stopwatch analysis. Within this stage, the model is created using Discrete Event Simulation to
show how accurate the values are in comparison to reality. This is shown in Figure 4. The initial
values of the model consisted of the parts arriving to the line:
Random (exponential) value = 20.
Maximum Arrivals = 20
Figure 4. DSE simulation
5.5 Analyze and Simulate of the Current State Model
This section includes the Analyze phase of DMAIC. Within this phase, the simulation results are
discussed and various conclusions are made. Within this phase key outputs are:
Parts arrive to line WS1 process WS2 Process Dispose 1Process 3Process 2
0 0 0
0 0 0

Proceedings of the International Conference on Industrial Engineering and Operations Management
Pilsen, Czech Republic, July 23-26, 2019
© IEOM Society International
Identification of key reasons for problems
Identification of the difference between current and target performance
Estimation of resources required to achieve target
Identification of possible obstacles
The results from the Discrete Event Simulation model are shown in Table 5. To validate the model,
the entire process was compared to that found on the assembly line. The analysis showed the
current state of process including the total time to create 25 parts.
Using this data it is visible to show there is a large amount of wait time within the process. The
process shows there is a high number of parts waiting in WS2. Figure 5, shows the utilization of
resources within this process. This shows the part is spending a vast amount of time at workstation
2. Therefore, for the initial analysis it could be said the operator at Process 2 and Process 3 are idle
and are not being used in the correct manner.
Type Average time (Minutes)
Number In 25.00
Number Out 25.00
Total Time 28.01
Value-Added time 5.50
Wait Time 22.53
WIP 11.67
WS1 Queue 5.65
WS2 Queue 16.87
Process 2 Queue 0.00
Process 3 Queue 0.00
Number Waiting WS1 2.36
Number Waiting WS2 7.03
Number Waiting Process 2 0.00
Number Waiting Process 3 0.00
Table 5. Results from DSE
Figure 5. Utilization of resources

Proceedings of the International Conference on Industrial Engineering and Operations Management
Pilsen, Czech Republic, July 23-26, 2019
© IEOM Society International
6 Conclusion and Future work
This paper presents a Discrete Event Simulation methodology to support a Six Sigma approach for
manufacturing organizations.
The methodology includes the analysis and construction of a Discrete Event Simulation model to
support decision makers, planners and managers in understanding the behavior of the current state
of the manufacturing process under study. This will help them to be better informed to support
their decisions in improving the manufacturing process. The DES model is constructed integrating
the DMAIC improvement cycle, the Six Sigma technique to analyze and reduce variation, and the
application of a Discreet Event Simulation approach.
The paper proposes a systematic process improvement approach which allows for constant
refinement of a process until a state of perfection is achieved. The paper applies action research to
validate the proposed methodology in a British manufacturing organization competing in global
markets. Thus, the analysis, development and validation of a Discrete Event model of an assembly
line of a British manufacturing organization in the automotive sector is described in the paper. The
constructed model of the assembly line highlighted the need to improve the current state process
due to high waiting time and queue time within the existing process.
This proposed systematic methodology could be implemented in manufacturing organizations to
support the analysis and improvement of process performance and the successful implementation
of their Six Sigma initiatives. The methodology can be improved further in the near future by
addressing the following issues:
Further action research is needed to analyze and implement the methodology in other
assembly lines and collecting data considering a longer period of time.
Combine the DES methodology with other modelling techniques (e.g. System Dynamics)
to analyze the effect of strategic factors (internal and external) on manufacturing processes.
Validate the DES methodology with data collected from other assembly lines.
Create a detailed action plan for the implementation of improvements.

Proceedings of the International Conference on Industrial Engineering and Operations Management
Pilsen, Czech Republic, July 23-26, 2019
© IEOM Society International
References
Adelman, C., 1993. Kurt Lewin and the origins of the action research. Educational action research, 1(1).
Andersson, R., Eriksson, H. & Torstensson, H., 2006. Similarities and differences between TQM, six sigma and lean.
The TQM Magazine, 18(3), pp. 282-296.
Barber, K. D., Munive-Hernandez, E. J. & Keane, J. P., 2006. Process-based knowledge management system for
continious improvement. International journal of quality & reliability, 23(8), pp. 1002-1018.
Basic tools for process improvement, 1995. Cause and effect diagram. [Online] Available at:
https://www.balancedscorecard.org/Portals/0/PDF/c-ediag.pdf [Accessed 30 October 2018].
Corbett, S., 2007. Beyond manufacturing: The evolution of lean production, Dubai: Mckinsey's & company.
Garza-Reyes, J., Tangkeow, S., Kumar, V. & Nadeem, S., 2018. Lean manufacturing adoption in the transport and
logistics sector of thailand - an exploratory study. Bandung, Indonesia, Proceedings of the Internation conference
on industrial engineering and operations management, pp. 6-8.
Ghobadian, A. et al., 2018. Examining legitimisation of additive manufacturing in the inerplay between innovation,
lean manufacturing and sustainability. Internation Journal of Production Economics, pp. 1-12.
Hahn, G. J. & Doganaksov, N., 2000. The Evolution of Six Sigma. Quality Engineering, 12(3), pp. 317-326.
Heshmat, M., El-Sharief, M. A. & El-Sabaie, M. G., 2013. Simulation modelling of production lines: A case study of
cement production line, Assiut: Assiut University.
Ilie, G. & Ciocoiu, C. N., 2010. Application of fishbone diagram to determine the risk of an event with multiple causes.
Management research and practice, 2(1), pp. 1-20.
Kakkad, G. P. & Makwana, H. H., 2017. Quality improvement in forging industry by using DMAIC process.
International Journal of Emerging Technologies and Innovative Research, 4(6), pp. 54-58.
Laurindo, C. M. G., Túlio, P. A. & Rangel, J. J. d. A., 2019. Communication mechanism of the discrete event
simulation and themechanical project softwares for manufacturing systems. Journal of Computational Design
and Engineering, Volume 6, pp. 70-80.
O'Brien, R., 1998. An overview of the methodological approach of action research. [Online]
Available at: www.web.ca/~robrien/papers/xx%20ar%20final.htm [Accessed 26 January 2019].
Rose, M., 2019. Discrete event simulation (DES). [Online] Available at:
https://whatis.techtarget.com/definition/discrete-event-simulation-DES [Accessed 29 Jan 2019].
Rowley, J., 2003. Action research: an approach to student work based learning. Education & Training, 45(3), pp. 131-
138.
Sanders, D. & Hild, C., 2000. A discussion of strategies for six sigma implementation. Quality Engineering, 12(3),
pp. 303-309.
Sanders, D. & Hild, C., 2007. A discussion of strategies for six sigma implementation. Quality Engineering, 12(3),
pp. 303-309.
Sarkar, D., 2009. 8 Wastes of Lean Manufacturing in a Services Context. [Online] Available at:
https://www.processexcellencenetwork.com/lean-six-sigma-business-performance/columns/8-wastes-of-lean-
manufacturing-in-a-services-conte [Accessed 02 July 2018].
SMMT, 2018. SMMT Motor Industry Facts 2018, London, United Kingdon: The society of motor manufactures and
traders limited.
Susman, G. I. & Evered, R. D., 1978. An Assessment of the Scientific Merits of Action Research. Administrative
Science Quarterly, 23(4), pp. 582-603.
Sweetser, A., 1999. A comparison of system dynamics (SD) and Discrete event simulation (DES). International
conference of system dynamics society.
The Engineer, 2018. UK Manufacturing Statistics. [Online] Available at: https://www.themanufacturer.com/uk-
manufacturing-statistics/ [Accessed 16 December 2018].
Woo, J. H., Nam, J. H. & Ko, H. K., 2014. Development of a simulation method for the subsea production system.
Journal of Computational Design and Engineering, 1(3), pp. 173-186.

Proceedings of the International Conference on Industrial Engineering and Operations Management
Pilsen, Czech Republic, July 23-26, 2019
© IEOM Society International
Biographies Anees Hussain is currently a postgraduate research student within faculty of Engineering and informatics at the
University of Bradford. Having completed his BENG in 2017, He is also completing an MSc in Mechanical
Engineering whilst working as a process engineer for an automotive company. His research interests include the
analysis, implementation of lean and six sigma methodologies within manufacturing, supply chain management and
big data systems.
Dr J. Eduardo Munive-Hernandez is a Lecturer in Advanced Manufacturing Engineering at the Faculty of
Engineering and Informatics, University of Bradford. He received his PhD in Total Technology from the University
of Manchester Institute of Science and Technology in 2003. He has industrial experience in the manufacturing sector
and in the automotive industry. His research interests include application of modelling techniques, such as System
Dynamics and Discreet Event Simulation, to support analysis and performance measurement, process improvement
and lean initiatives for sustainable operations and supply chain management. He is also interested in the analysis,
development and implementation of strategic knowledge management systems to support those improvement
initiatives.
Felician Campean is a Professor in Automotive Reliability Engineering and Director of the Automotive Research
Centre at the University of Bradford. He holds a PhD in Reliability from Brunel University (1998) and a Mechanical
/ Manufacturing Engineering Degree from Transylvania University (1990). Worked in the bearings industry before
joining Academia as a lecturer in manufacturing automation. Has joined University of Bradford in 1998 as a Research
Fellow, and progressed to Senior Research Fellow (2000), Senior Lecturer in Competitive Design (2005), and
Professor in 2011. Current research interests revolve around modelling complex systems, including model based
methods for systems engineering, reliability, robustness and resilience analysis for multi-disciplinary complex
systems, big data analytics methods for systems design and lifecycle management, multi-disciplinary design
optimization applied to complex systems, modelling complex manufacturing and product development processes.
Related Documents