Developed by: E. Ruzycki and R. Axler Updated: Sept. 2003 U3-m8a- s1 Lake Bathymetry Aquatic Ecology

Developed by: E. Ruzycki and R. Axler Updated: Sept. 2003 U3-m8a-s1 Lake Bathymetry Aquatic Ecology.
Dec 18, 2015
Welcome message from author
This document is posted to help you gain knowledge. Please leave a comment to let me know what you think about it! Share it to your friends and learn new things together.
Transcript
Developed by: E. Ruzycki and R. Axler Updated: Sept. 2003 U3-m8a-s1
Lake Bathymetry
Aquatic Ecology
Developed by: E. Ruzycki and R. Axler Updated: Sept. 2003 U3-m8a-s2
Objectives
Students will be able to: determine common morphometric characteristics of
lakes identify characteristics of a bathymetric map. describe methods used to create bathymetric maps. use bathymetric maps to determine areal
characteristics for lakes. determine the importance of lake volume and mean
depth in lakes. calculate lake volume and mean depth. interpret hypsographic and volumetric curves of lakes. explain the hydraulic residence time of a lake. calculate the hydraulic residence time of a lake.
Developed by: E. Ruzycki and R. Axler Updated: Sept. 2003 U3-m8a-s3
Definitions
Bathymetry: the measurement of water depth (bathus, Greek, depth and –metry, to measure). Multiple measurements of depth can used to visualize the topography of the sea floor.
Sounding: an early method used to measure water depth by dropping a weighted line into the water. As the line was pulled aboard, the sailor would measure the length of the line in fathoms, the distance between his out stretched hands. The pseudonym “Mark Twain” was derived from the words shouted to “mark” the water depth. A sailor would call to the captain, "by the mark, twain" (meaning, mark two fathoms).
Fathom: 6 feet. Contours, isobaths (iso – same, bath – depth): lines of equal
depth. Cross section: a two dimensional side view of bottom
topography.
Developed by: E. Ruzycki and R. Axler Updated: Sept. 2003 U3-m8a-s4
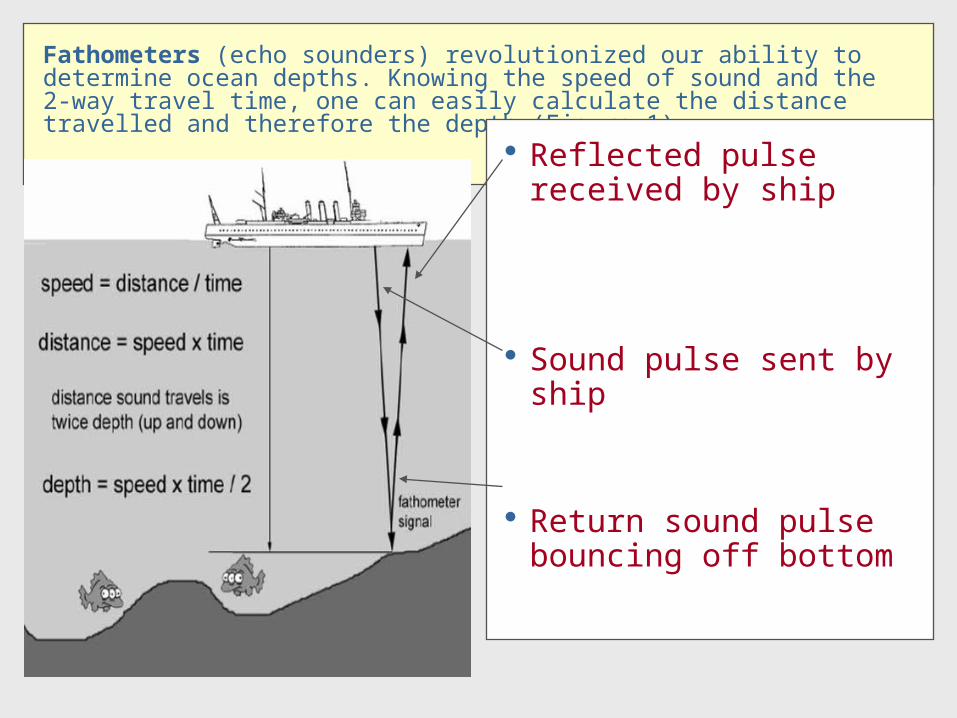
Fathometers (echo sounders) revolutionized our ability to determine ocean depths. Knowing the speed of sound and the 2-way travel time, one can easily calculate the distance travelled and therefore the depth (Figure 1).
Reflected pulse received by ship
Sound pulse sent by ship
Return sound pulse bouncing off bottom
Developed by: E. Ruzycki and R. Axler Updated: Sept. 2003 U3-m8a-s5
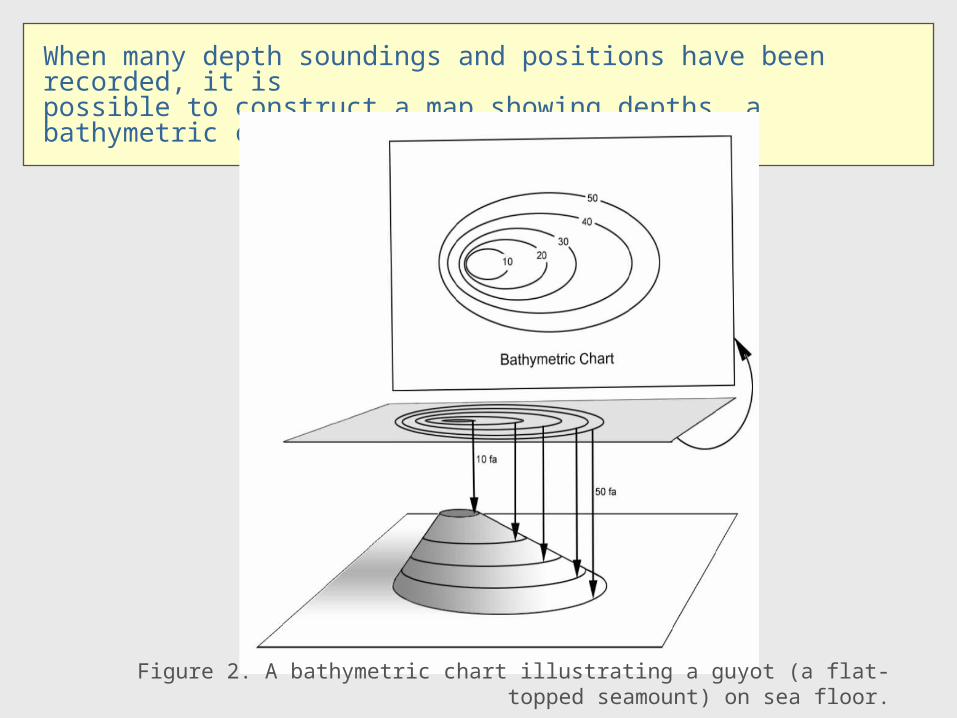
When many depth soundings and positions have been recorded, it ispossible to construct a map showing depths, a bathymetric chart (Figure 2).
•Figure 2. A bathymetric chart illustrating a guyot (a flat-topped seamount) on sea floor.
Developed by: E. Ruzycki and R. Axler Updated: Sept. 2003 U3-m8a-s6
Isobaths
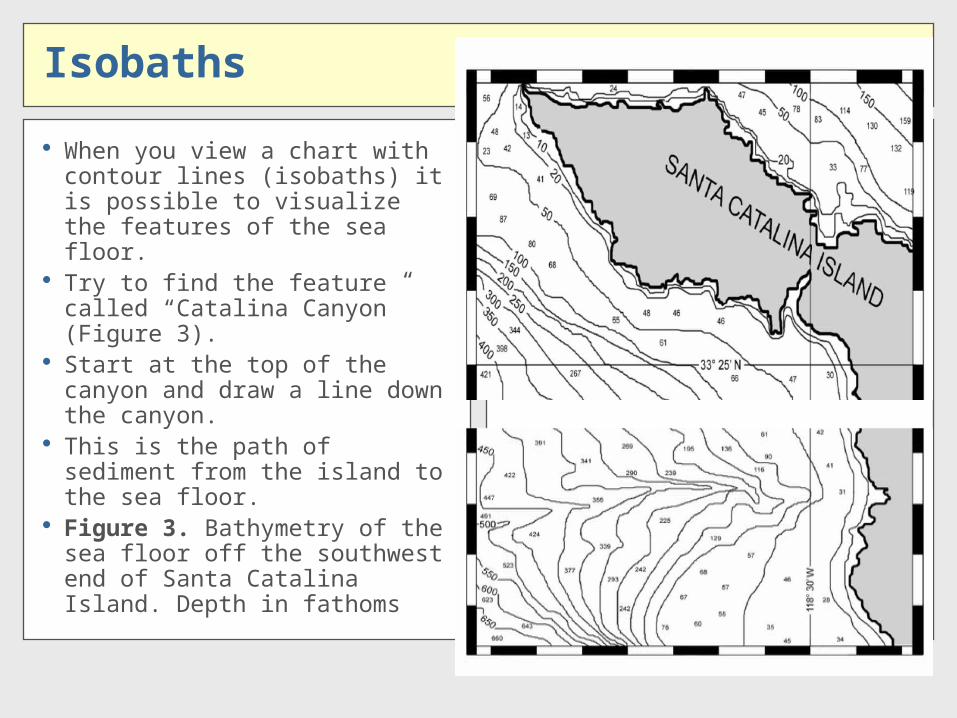
When you view a chart with contour lines (isobaths) it is possible to visualize the features of the sea floor.
Try to find the feature called “Catalina Canyon” (Figure 3).
Start at the top of the canyon and draw a line down the canyon.
This is the path of sediment from the island to the sea floor.
Figure 3. Bathymetry of the sea floor off the southwest end of Santa Catalina Island. Depth in fathoms
Developed by: E. Ruzycki and R. Axler Updated: Sept. 2003 U3-m8a-s7
Contour Line Rules
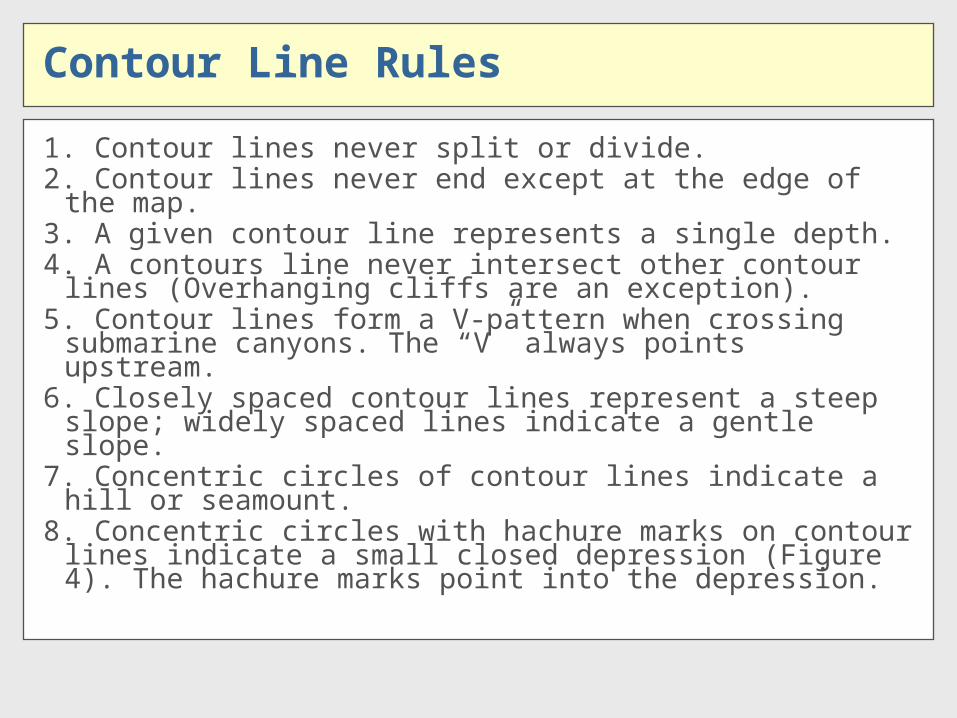
1. Contour lines never split or divide.2. Contour lines never end except at the edge of the map.3. A given contour line represents a single depth.4. A contours line never intersect other contour lines
(Overhanging cliffs are an exception).5. Contour lines form a V-pattern when crossing submarine
canyons. The “V” always points upstream.6. Closely spaced contour lines represent a steep slope;
widely spaced lines indicate a gentle slope.7. Concentric circles of contour lines indicate a hill or
seamount.8. Concentric circles with hachure marks on contour lines
indicate a small closed depression (Figure 4). The hachure marks point into the depression.
Developed by: E. Ruzycki and R. Axler Updated: Sept. 2003 U3-m8a-s8
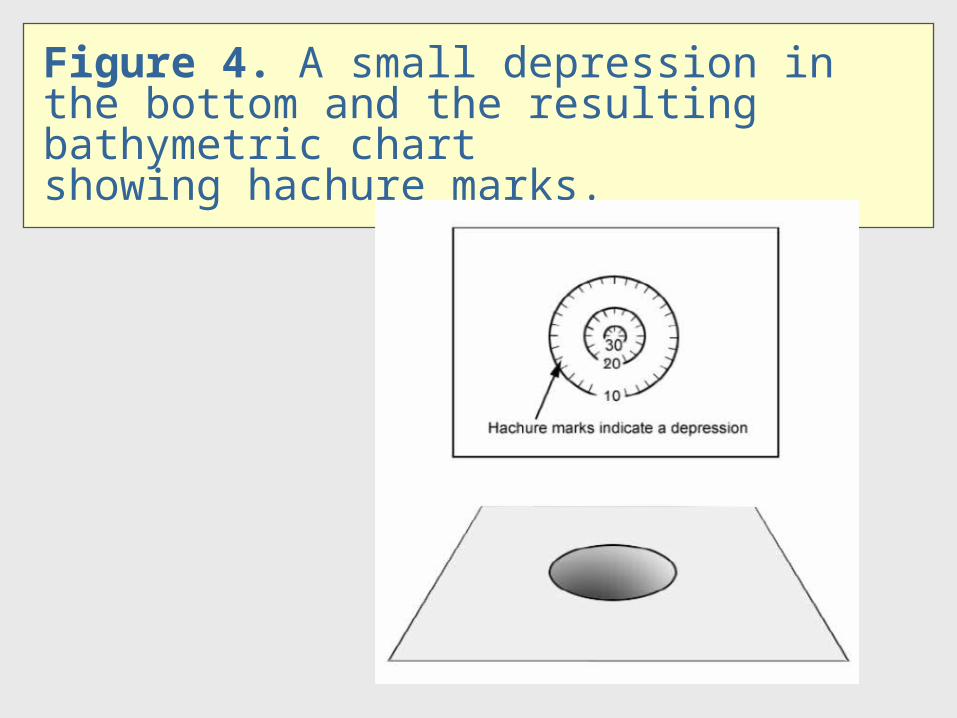
Figure 4. A small depression in the bottom and the resulting bathymetric chartshowing hachure marks.
Developed by: E. Ruzycki and R. Axler Updated: Sept. 2003 U3-m8a-s9
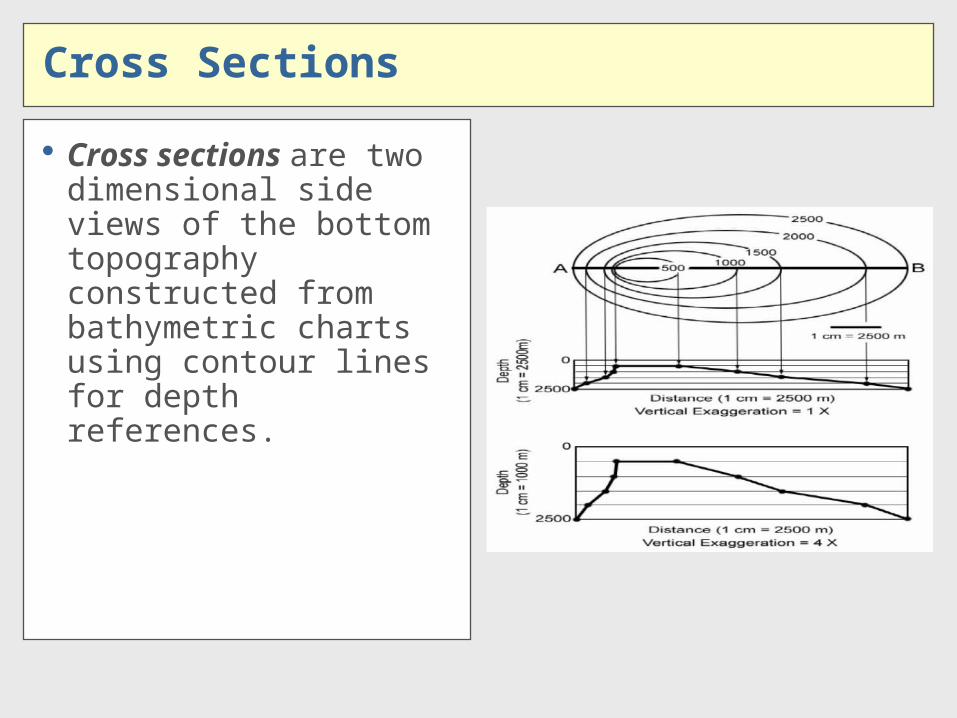
Cross Sections
Cross sections are two dimensional side views of the bottom topography constructed from bathymetric charts using contour lines for depth references.

Developed by: E. Ruzycki and R. Axler Updated: Sept. 2003 U3-m8a-s10
Cross Sections and VerticalExaggeration
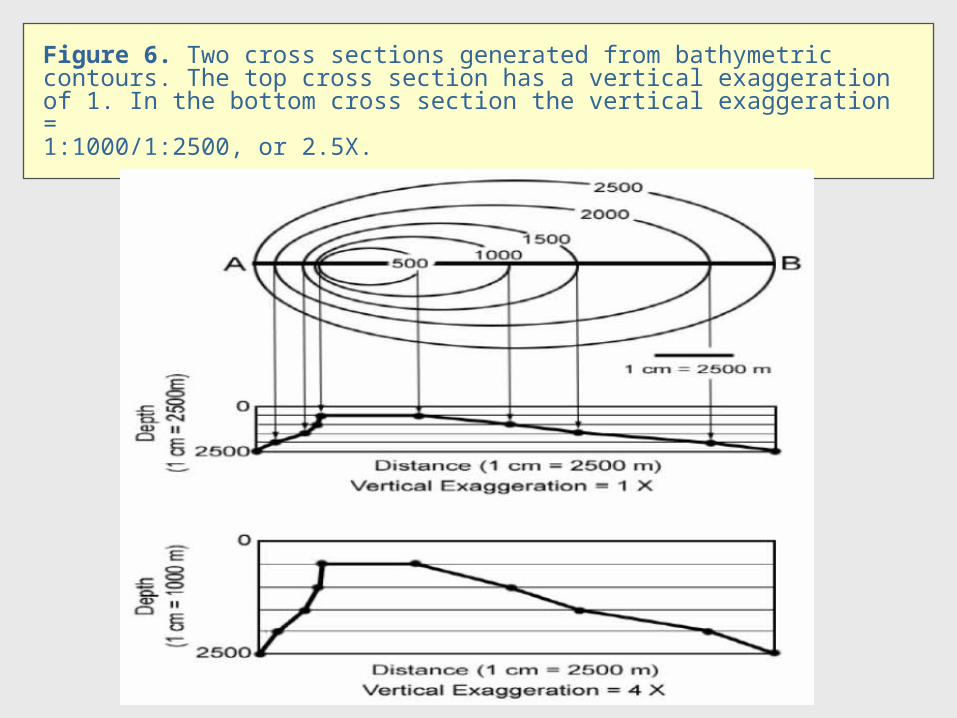
To make a cross section, we draw a line of section (A—B in this case) on the bathymetric chart.
Where the contour lines intersect the line A—B, points are plotted at the corresponding depth on a vertical scale.
In this example, the horizontal scale for both sections is the same; 1 cm (on the cross section) represents 2500 m (in real life).
In the top section, the vertical scale = the horizontal scale. In the bottom section, the vertical scale is exaggerated, or
expanded. 1 cm on this cross section represents only 1000 m (in real life).
Developed by: E. Ruzycki and R. Axler Updated: Sept. 2003 U3-m8a-s11
Figure 6. Two cross sections generated from bathymetriccontours. The top cross section has a vertical exaggerationof 1. In the bottom cross section the vertical exaggeration =1:1000/1:2500, or 2.5X.

Developed by: E. Ruzycki and R. Axler Updated: Sept. 2003 U3-m8a-s12
Cross Sections and Vertical Exaggeration
To calculate vertical exaggeration, divide the vertical scale by the horizontal scale.
In this example, 1:1000 divided by 1:2500. 1/1000 * 2500/1 = 2.5
Cross sections are exaggerated to show vertical features in more detail.
For instance, we can better appreciate the cliff on the left side of the guyot in the lower cross section of Figure 6.
Developed by: E. Ruzycki and R. Axler Updated: Sept. 2003 U3-m8a-s13
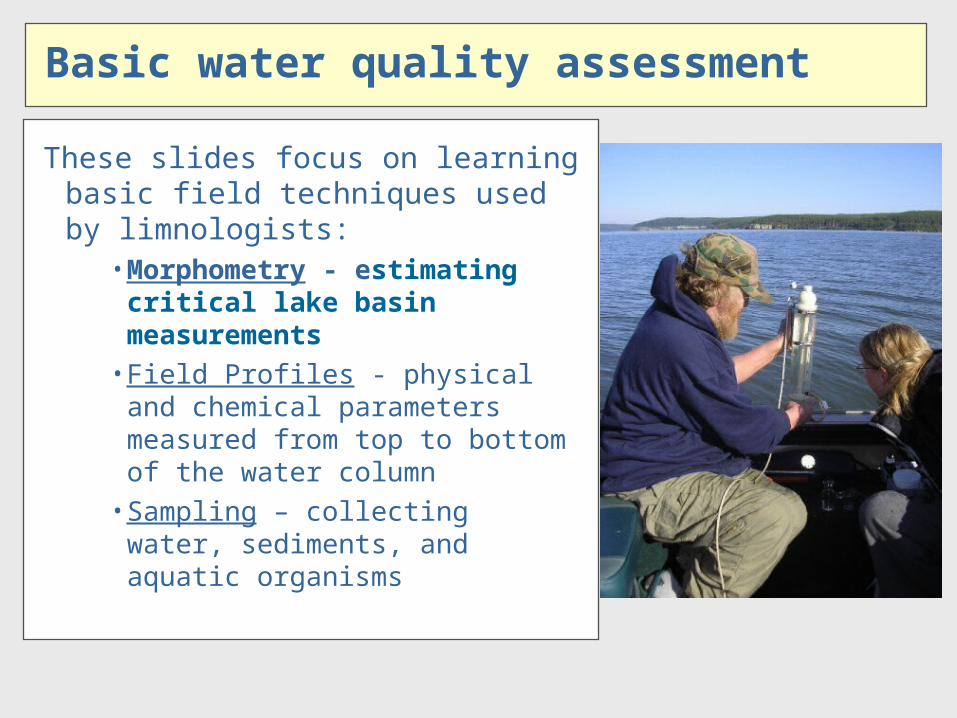
Basic water quality assessment
These slides focus on learning basic field techniques used by limnologists:
• Morphometry - estimating critical lake basin measurements
• Field Profiles - physical and chemical parameters measured from top to bottom of the water column
• Sampling – collecting water, sediments, and aquatic organisms
Developed by: E. Ruzycki and R. Axler Updated: Sept. 2003 U3-m8a-s14
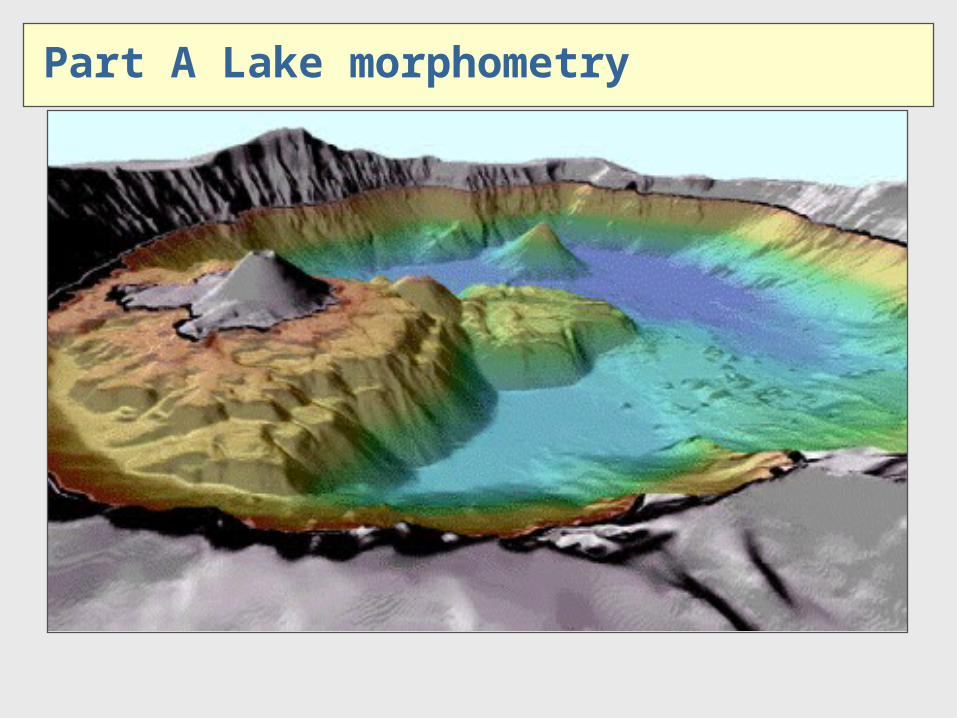
Part A Lake morphometry
Developed by: E. Ruzycki and R. Axler Updated: Sept. 2003 U3-m8a-s15
Part A Lake morphometry
Goal
This module will help you:– Learn how to determine common morphometric
characteristics of lakes
Developed by: E. Ruzycki and R. Axler Updated: Sept. 2003 U3-m8a-s16
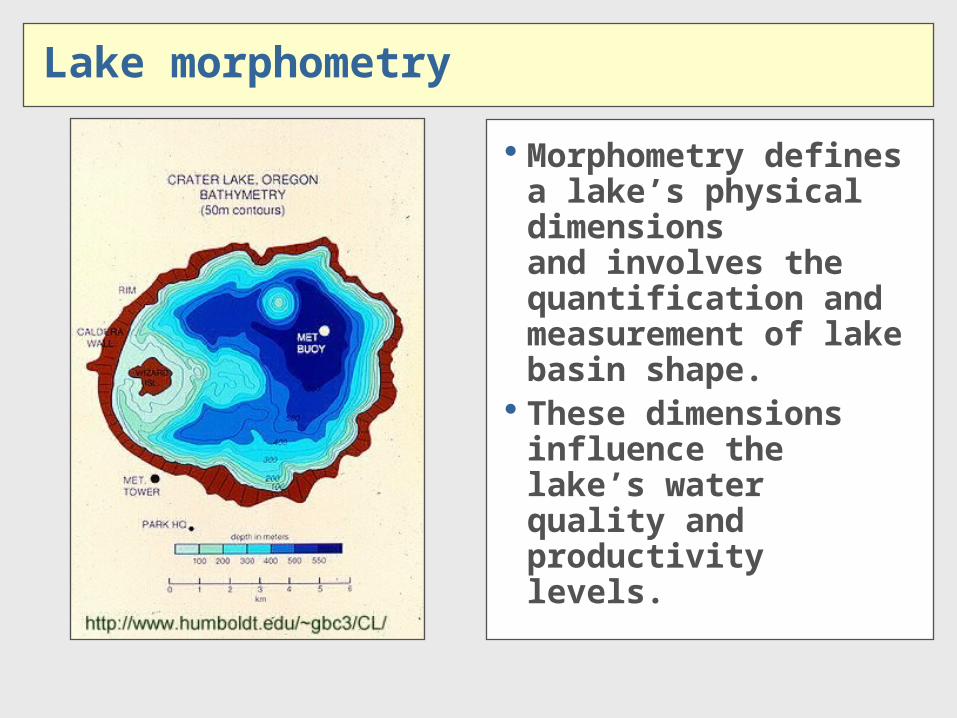
Lake morphometry
Morphometry defines a lake’s physical dimensionsand involves the quantification and measurement of lake basin shape.
These dimensions influence the lake’s water quality and productivity levels.

Developed by: E. Ruzycki and R. Axler Updated: Sept. 2003 U3-m8a-s17
Determining lake morphometry
• First Step is to obtain or develop a bathymetric map-a bathymetric map is essentially a topographic map of the lake bottom that shows depth contours within the lake basin
-used to estimate morphometric and many hydrological parameters
-the reliability of your morphometric data will depend on the accuracy of the bathymetric map
Developed by: E. Ruzycki and R. Axler Updated: Sept. 2003 U3-m8a-s18
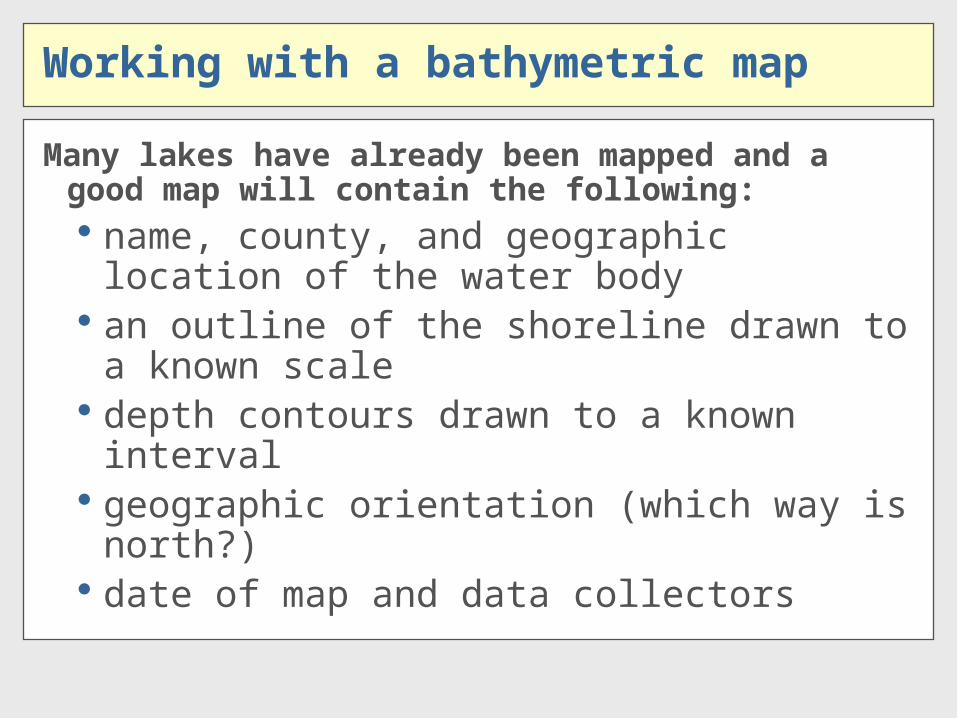
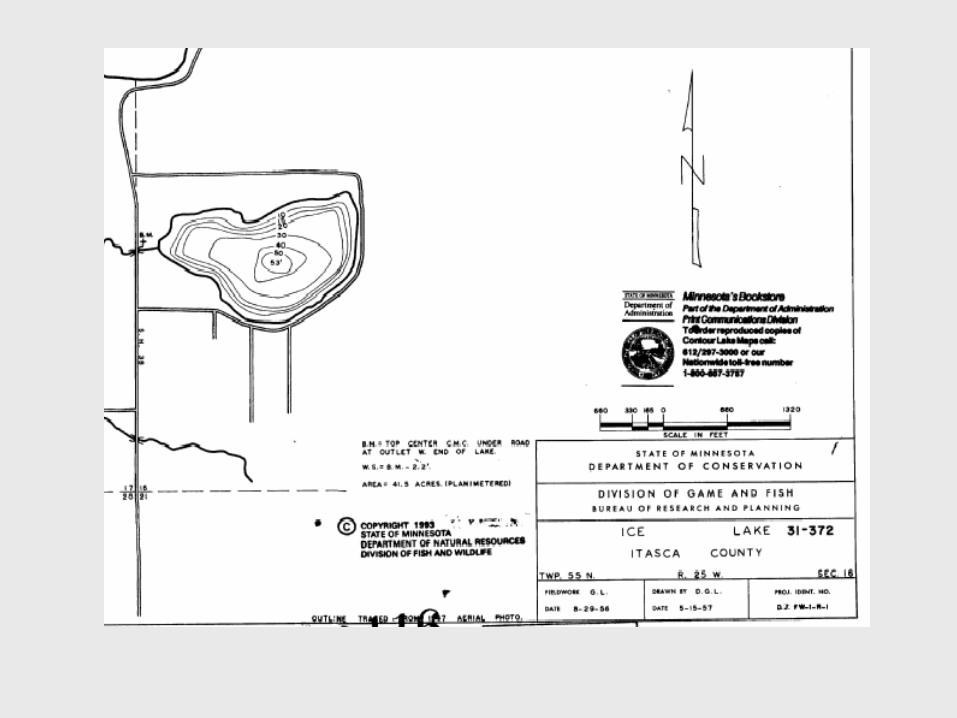
Working with a bathymetric map
Many lakes have already been mapped and a good map will contain the following: name, county, and geographic location of the
water body an outline of the shoreline drawn to a known
scale depth contours drawn to a known interval geographic orientation (which way is north?) date of map and data collectors
Developed by: E. Ruzycki and R. Axler Updated: Sept. 2003 U3-m8a-s19
Developed by: E. Ruzycki and R. Axler Updated: Sept. 2003 U3-m8a-s20
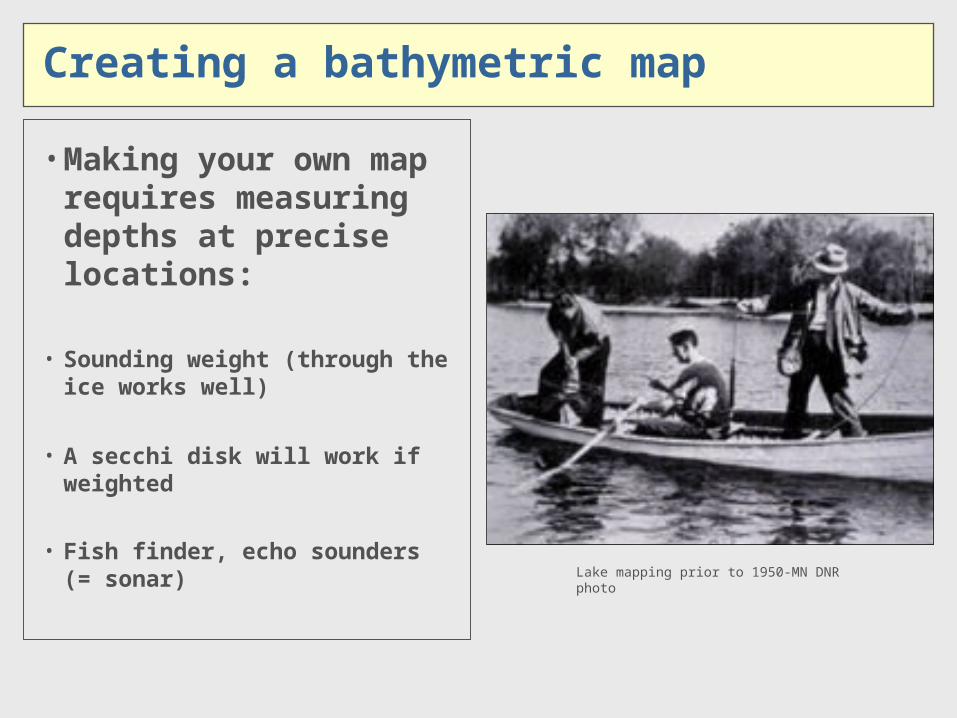
Creating a bathymetric map
Lake mapping prior to 1950-MN DNR photo
• Making your own map requires measuring depths at precise locations:
• Sounding weight (through the ice works well)
• A secchi disk will work if weighted
• Fish finder, echo sounders (= sonar)

Developed by: E. Ruzycki and R. Axler Updated: Sept. 2003 U3-m8a-s21
Creating a bathymetric map
Bathymetric maps can be made by:
-Drawing a general outline of the lake or finding an aerial photo or map
-Measuring and recording water depths at a number of locations
-Then connecting the depth “dots” to develop simple contour lines

Developed by: E. Ruzycki and R. Axler Updated: Sept. 2003 U3-m8a-s22
Creating a bathymetric map
The most commonly used method today involves using precise echo sounders, on board computers and GPS systems.
There are several components to lake bathymetric mapping;
-the GPS equipment which will work in tandem with -the depth sounding equipment, and -the data collection process
Developed by: E. Ruzycki and R. Axler Updated: Sept. 2003 U3-m8a-s23
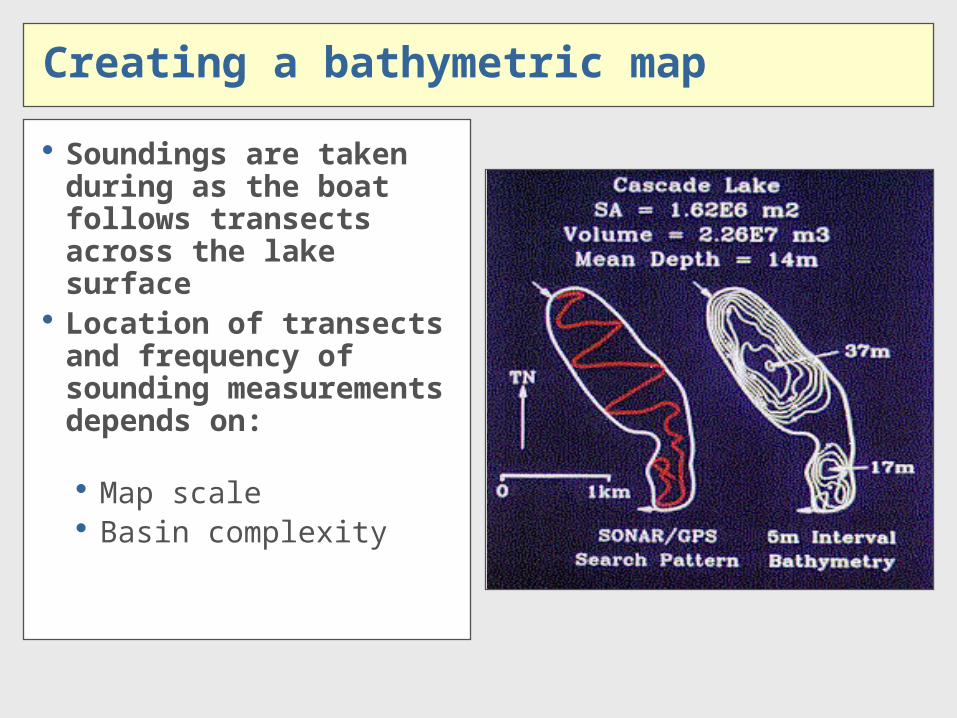
Creating a bathymetric map
Soundings are taken during as the boat follows transects across the lake surface
Location of transects and frequency of sounding measurements depends on: Map scale Basin complexity
Developed by: E. Ruzycki and R. Axler Updated: Sept. 2003 U3-m8a-s24
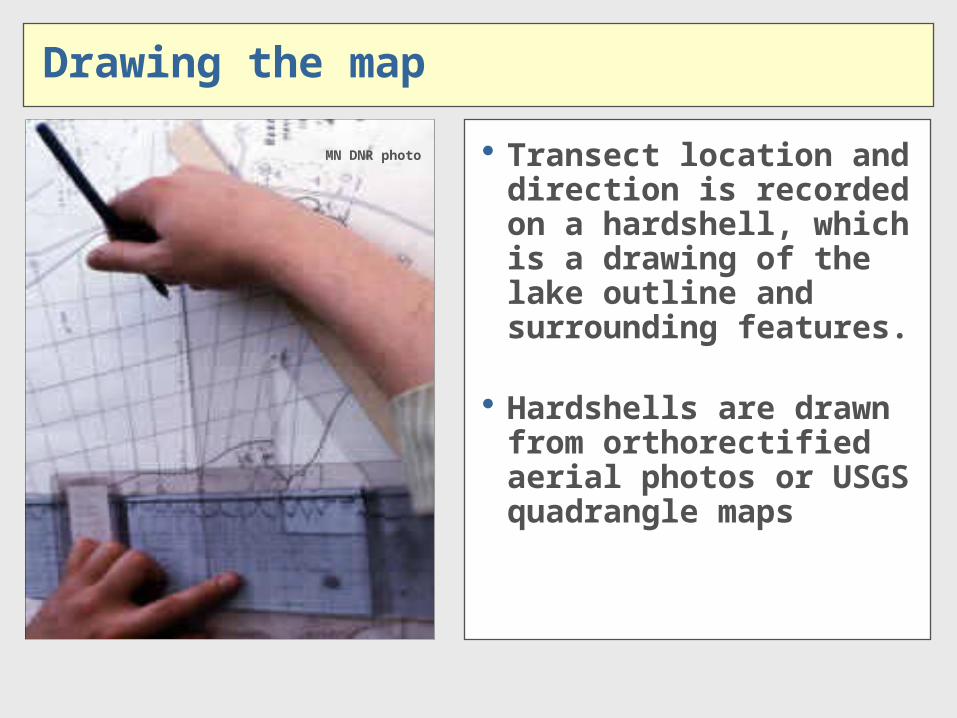
Drawing the map
Transect location and direction is recorded on a hardshell, which is a drawing of the lake outline and surrounding features.
Hardshells are drawn from orthorectified aerial photos or USGS quadrangle maps
MN DNR photo
Developed by: E. Ruzycki and R. Axler Updated: Sept. 2003 U3-m8a-s25
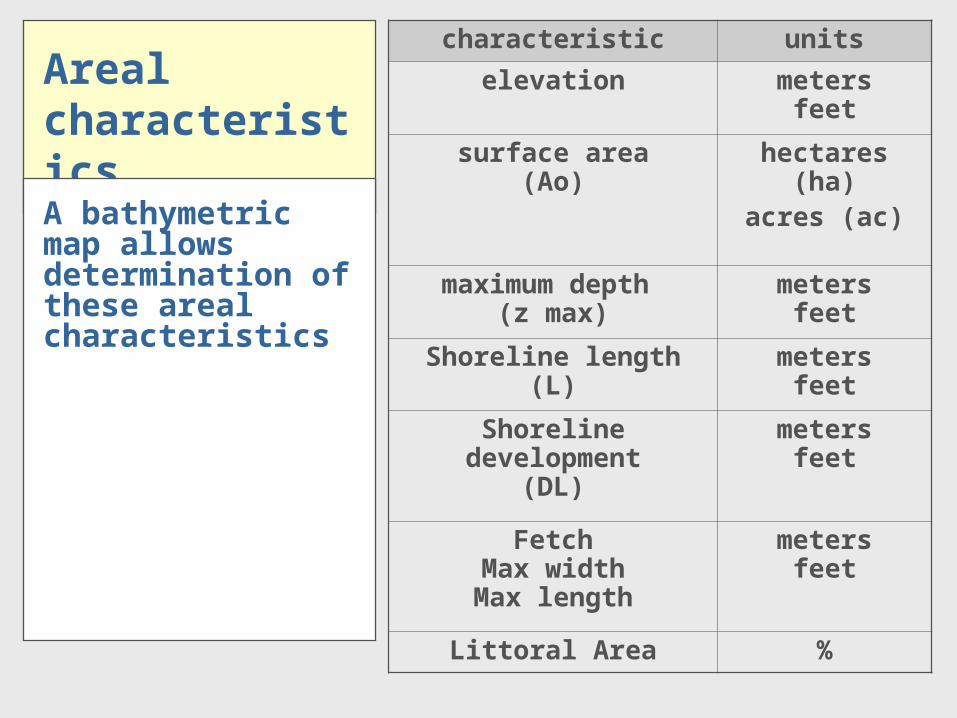
Areal characteristics
characteristic units
elevation metersfeet
surface area(Ao)
hectares (ha)acres (ac)
maximum depth (z max)
metersfeet
Shoreline length(L)
metersfeet
Shoreline development(DL)
metersfeet
FetchMax widthMax length
metersfeet
Littoral Area %
A bathymetric map allows determination of these areal characteristics

Developed by: E. Ruzycki and R. Axler Updated: Sept. 2003 U3-m8a-s26
Areal characteristics
Example:Morphometric (and watershed) characteristics for Ice Lake

Developed by: E. Ruzycki and R. Axler Updated: Sept. 2003 U3-m8a-s27
Areal characteristics
Maximum length (fetch)
Maximum width
Z max
•Several areal characteristics and measurements can be taken directly off the
bathymetric map
Developed by: E. Ruzycki and R. Axler Updated: Sept. 2003 U3-m8a-s28
Areal characteristics: surface area
• Other measurements, such as lake surface area, require more work
• There are several methods for determining lake surface area:
• Cut and weigh method
• Planimetry
• Grid method
• Digitized map
Developed by: E. Ruzycki and R. Axler Updated: Sept. 2003 U3-m8a-s29
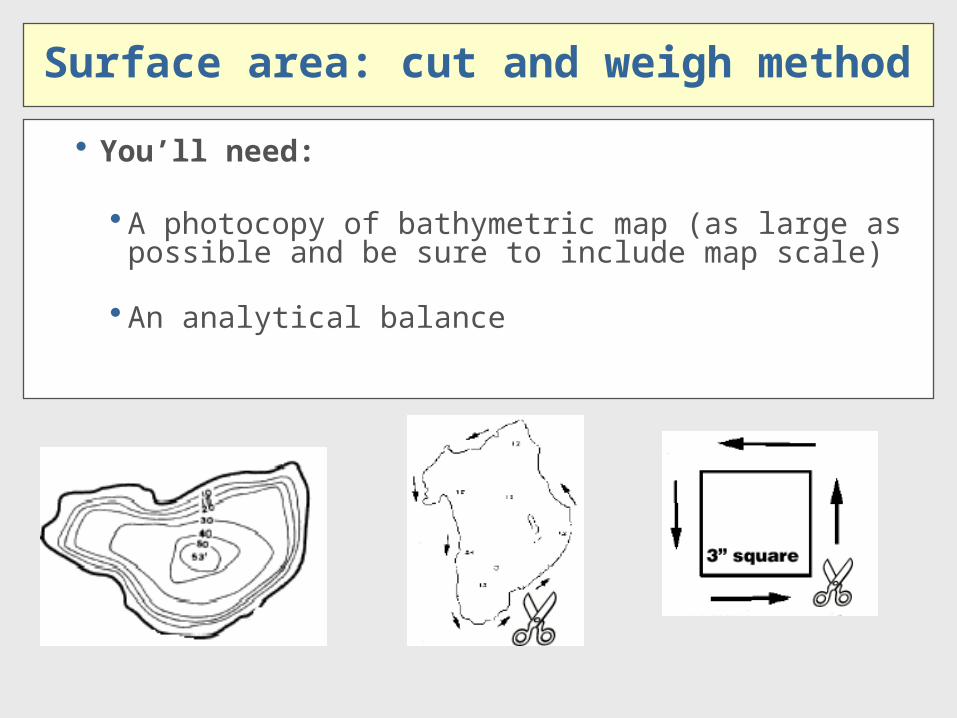
Surface area: cut and weigh method
You’ll need:
A photocopy of bathymetric map (as large as possible and be sure to include map scale)
An analytical balance
Developed by: E. Ruzycki and R. Axler Updated: Sept. 2003 U3-m8a-s30
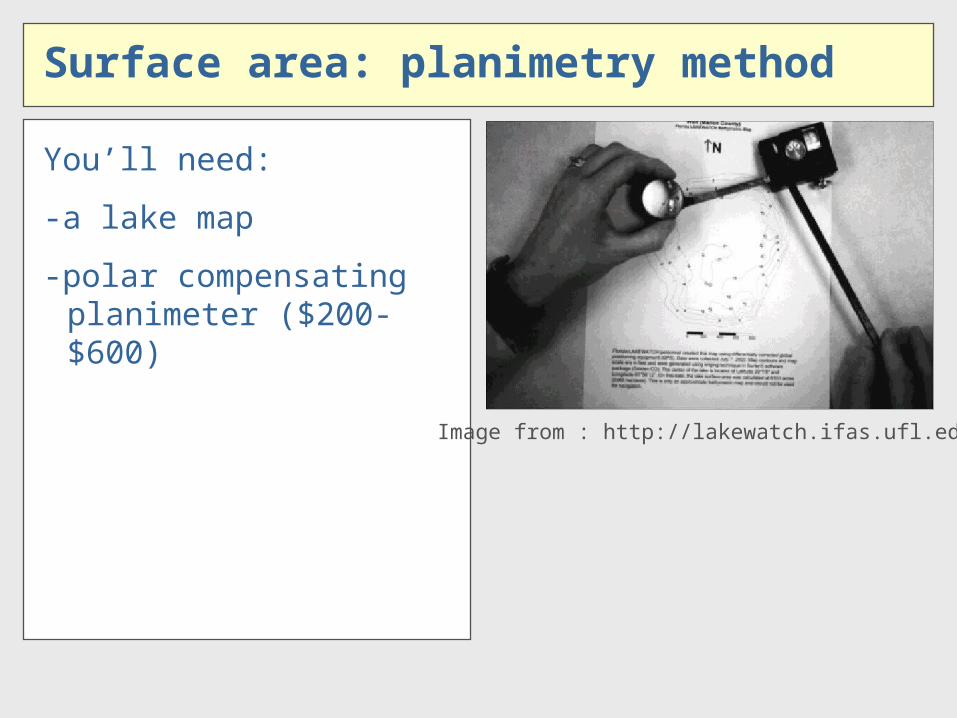
Surface area: planimetry method
You’ll need:
-a lake map
-polar compensating planimeter ($200-$600)
Image from : http://lakewatch.ifas.ufl.edu
Developed by: E. Ruzycki and R. Axler Updated: Sept. 2003 U3-m8a-s31
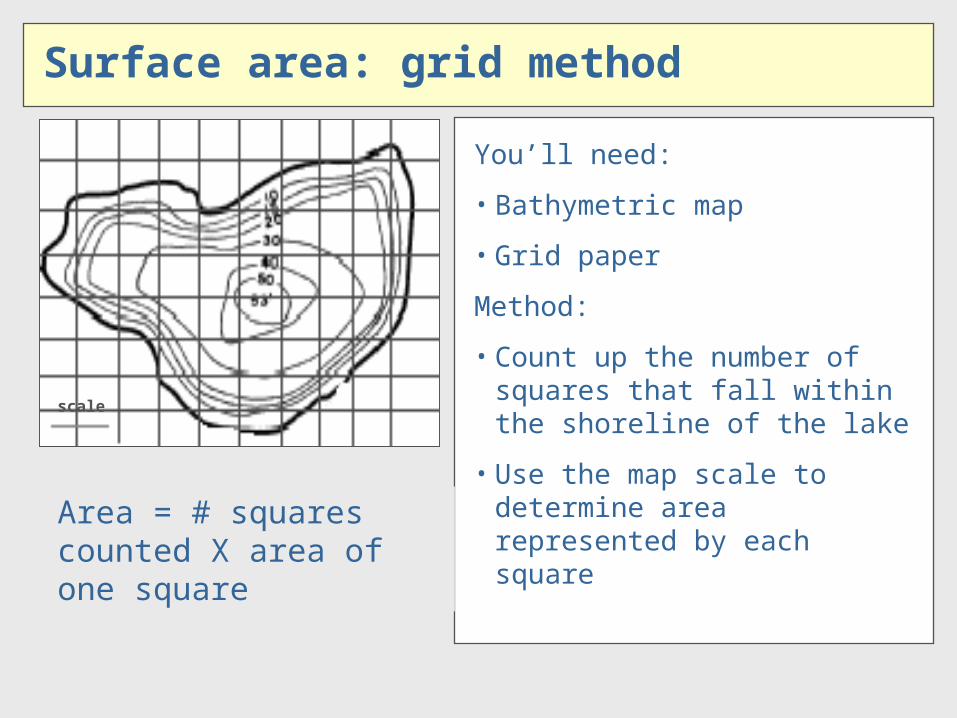
Surface area: grid method
You’ll need:
• Bathymetric map
• Grid paper
Method:
• Count up the number of squares that fall within the shoreline of the lake
• Use the map scale to determine area represented by each square
scale
Area = # squares counted X area of one square
Developed by: E. Ruzycki and R. Axler Updated: Sept. 2003 U3-m8a-s32
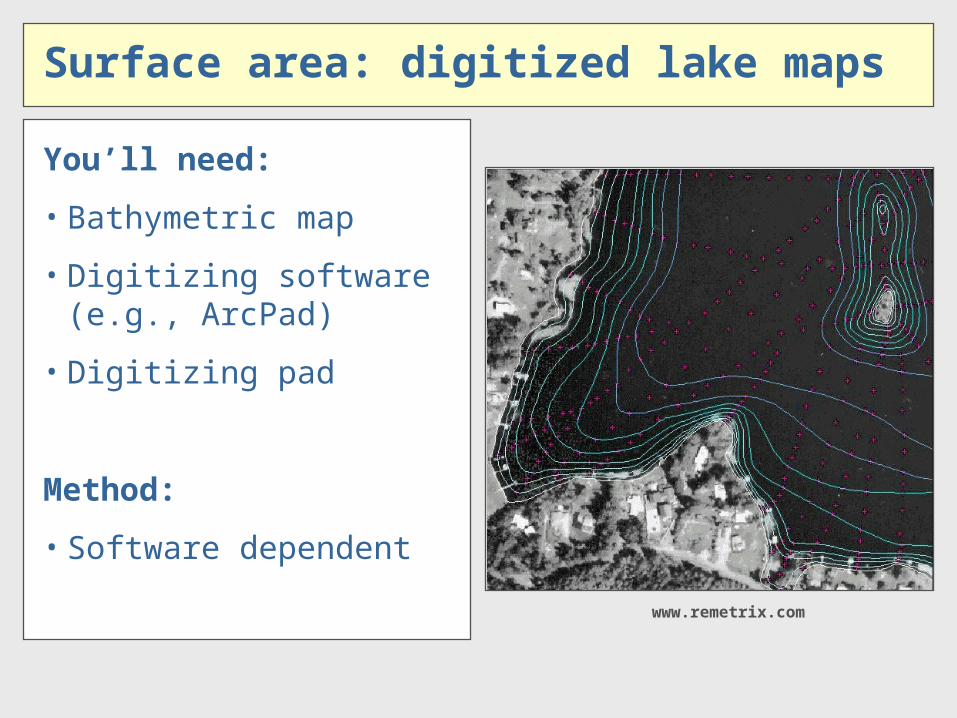
Surface area: digitized lake maps
You’ll need:
• Bathymetric map
• Digitizing software (e.g., ArcPad)
• Digitizing pad
Method:
• Software dependent
www.remetrix.com
Developed by: E. Ruzycki and R. Axler Updated: Sept. 2003 U3-m8a-s33
Areal characteristics: shoreline length
Shoreline length (L) = circumference or perimeter of lake
• The linear measurement of the lake’s entire perimeter at a given water level
• Provides a measurement of the amount of interface between the lake and surrounding land
Developed by: E. Ruzycki and R. Axler Updated: Sept. 2003 U3-m8a-s34
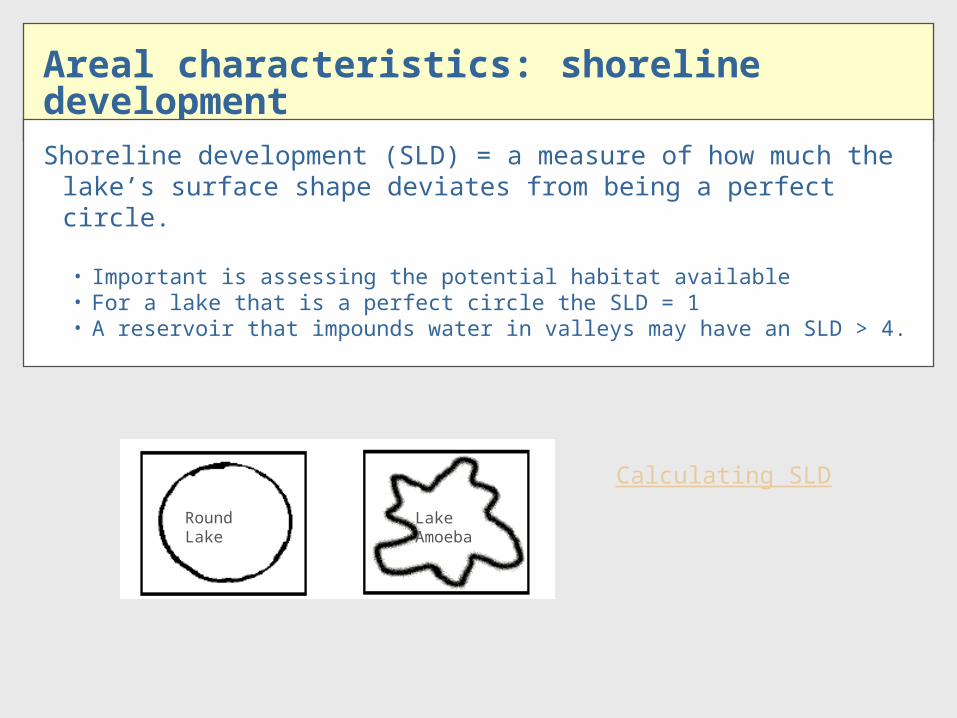
Areal characteristics: shoreline development
Shoreline development (SLD) = a measure of how much the lake’s surface shape deviates from being a perfect circle.
• Important is assessing the potential habitat available• For a lake that is a perfect circle the SLD = 1• A reservoir that impounds water in valleys may have an SLD > 4.
Round Lake LakeAmoeba
Calculating SLD
Developed by: E. Ruzycki and R. Axler Updated: Sept. 2003 U3-m8a-s35
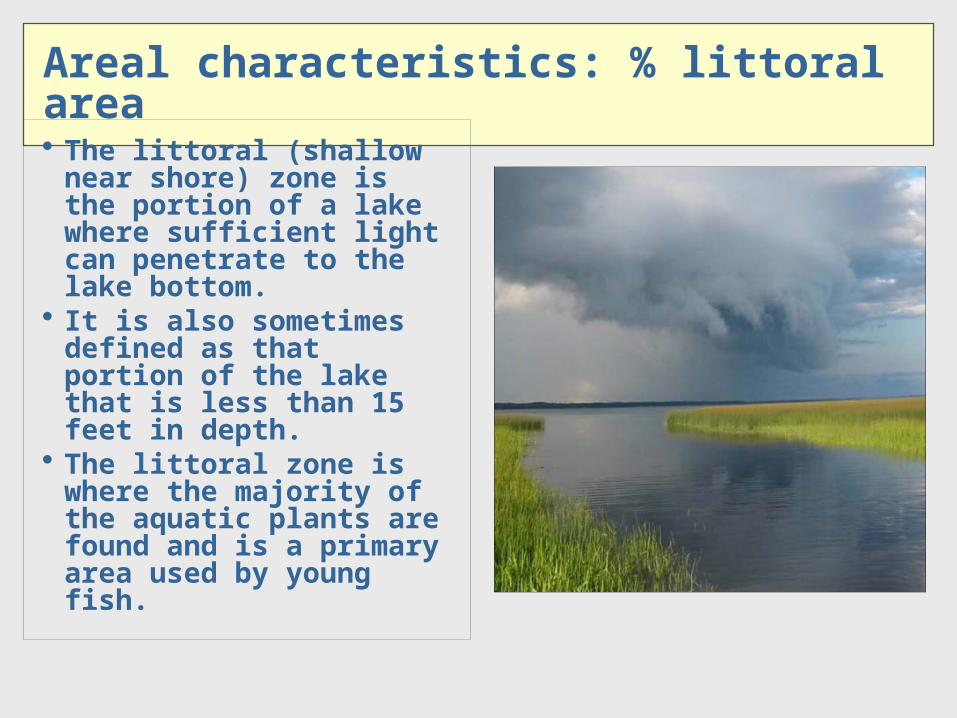
Areal characteristics: % littoral area
The littoral (shallow near shore) zone is the portion of a lake where sufficient light can penetrate to the lake bottom.
It is also sometimes defined as that portion of the lake that is less than 15 feet in depth.
The littoral zone is where the majority of the aquatic plants are found and is a primary area used by young fish.
Developed by: E. Ruzycki and R. Axler Updated: Sept. 2003 U3-m8a-s36
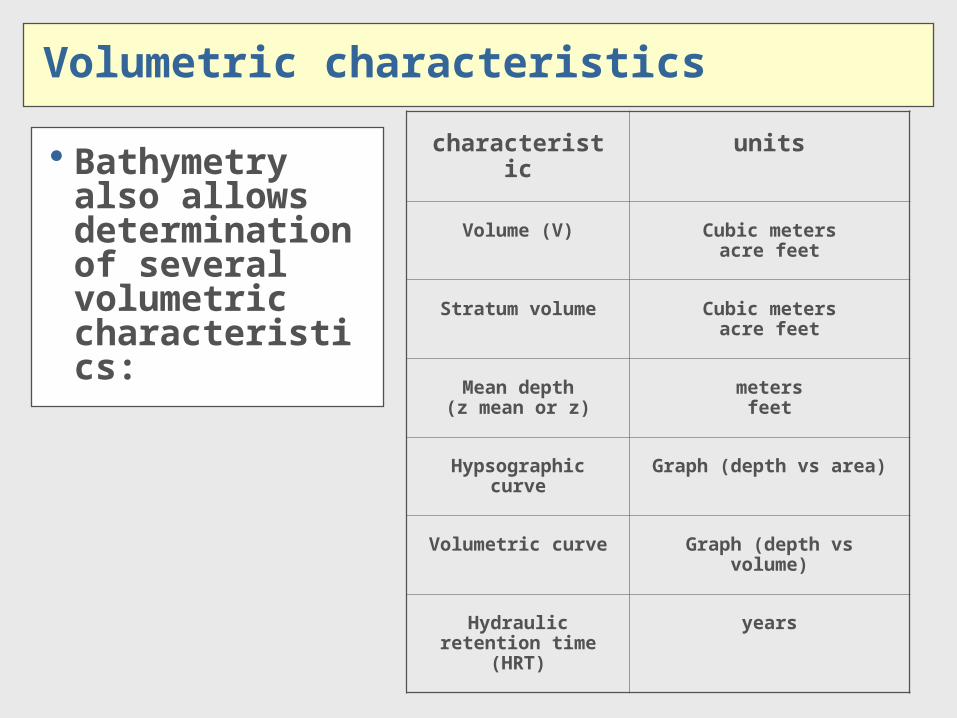
Volumetric characteristics
Bathymetry also allows determination of several volumetric characteristics:
characteristic units
Volume (V) Cubic metersacre feet
Stratum volume Cubic metersacre feet
Mean depth(z mean or z)
metersfeet
Hypsographic curve Graph (depth vs area)
Volumetric curve Graph (depth vs volume)
Hydraulic retention time (HRT)
years

Developed by: E. Ruzycki and R. Axler Updated: Sept. 2003 U3-m8a-s37
Volumetric characteristics: volume
Importance
1) Total lake volume can influence a lake’s dilution capacity.
2) Allows the determination of mixed layer (epilimnion) volume.
3) Or hypolimnion; e.g. determining available trout habitat with temperatures from 4 to 25 oC and DO > 5 mg/L.
Developed by: E. Ruzycki and R. Axler Updated: Sept. 2003 U3-m8a-s38
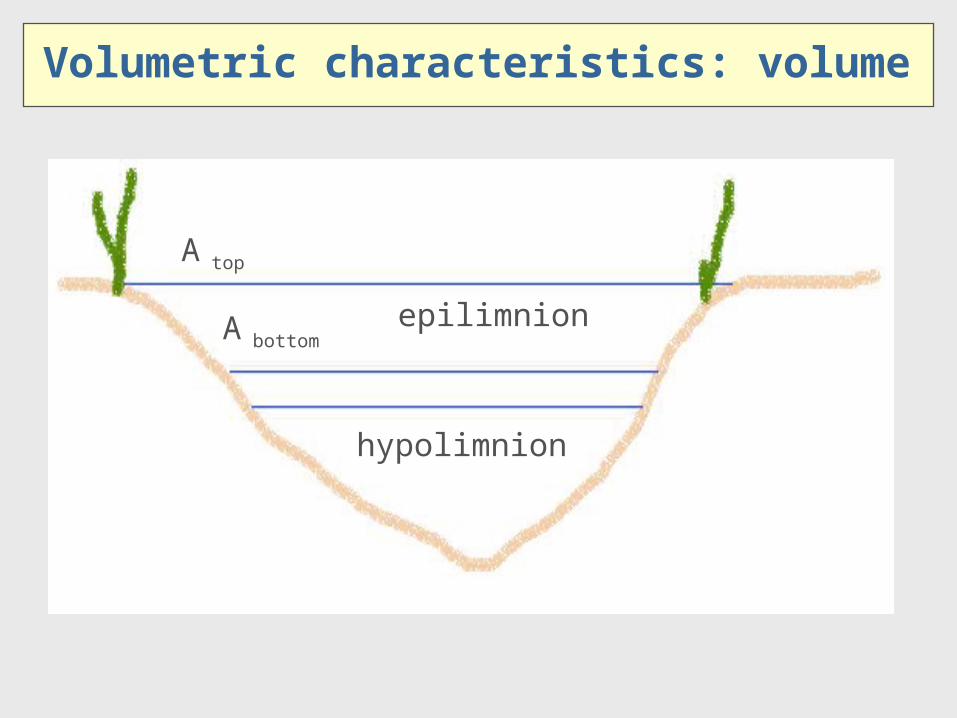
Volumetric characteristics: volume
A top
A bottomepilimnion
hypolimnion
Developed by: E. Ruzycki and R. Axler Updated: Sept. 2003 U3-m8a-s39
A top
A bottomz
zz
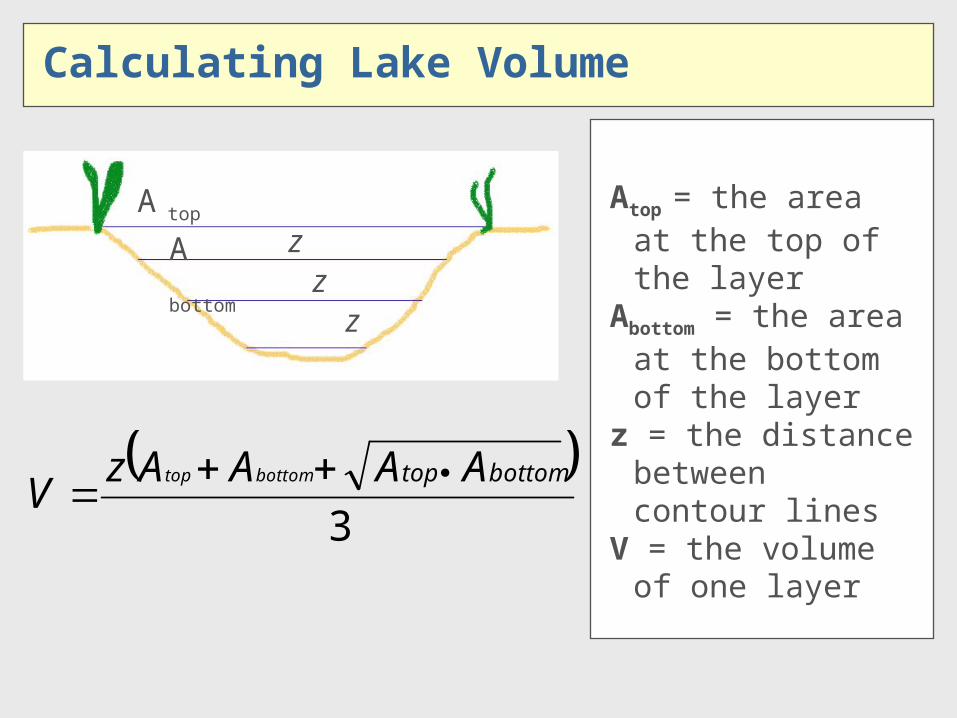
Calculating Lake Volume
Atop = the area at the top of the layer
Abottom = the area at the bottom of the layer
z = the distance between contour lines
V = the volume of one layer
3
bottomtop AAAAzV
bottomtop
Developed by: E. Ruzycki and R. Axler Updated: Sept. 2003 U3-m8a-s40
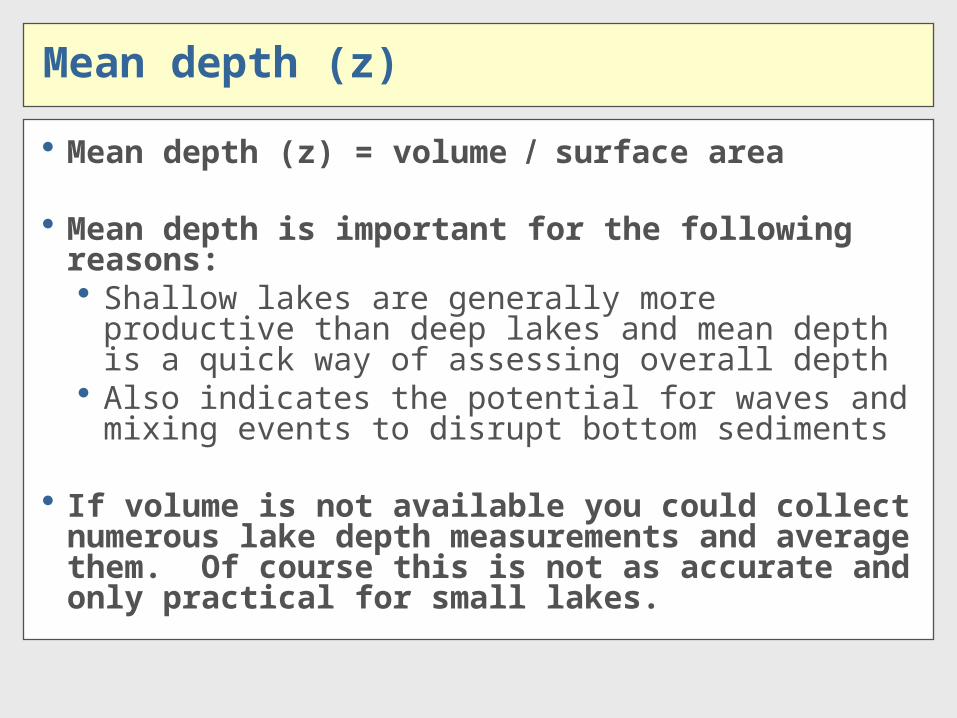
Mean depth (z)
Mean depth (z) = volume surface area
Mean depth is important for the following reasons: Shallow lakes are generally more productive than deep
lakes and mean depth is a quick way of assessing overall depth
Also indicates the potential for waves and mixing events to disrupt bottom sediments
If volume is not available you could collect numerous lake depth measurements and average them. Of course this is not as accurate and only practical for small lakes.
Developed by: E. Ruzycki and R. Axler Updated: Sept. 2003 U3-m8a-s41
Hypsographic curves
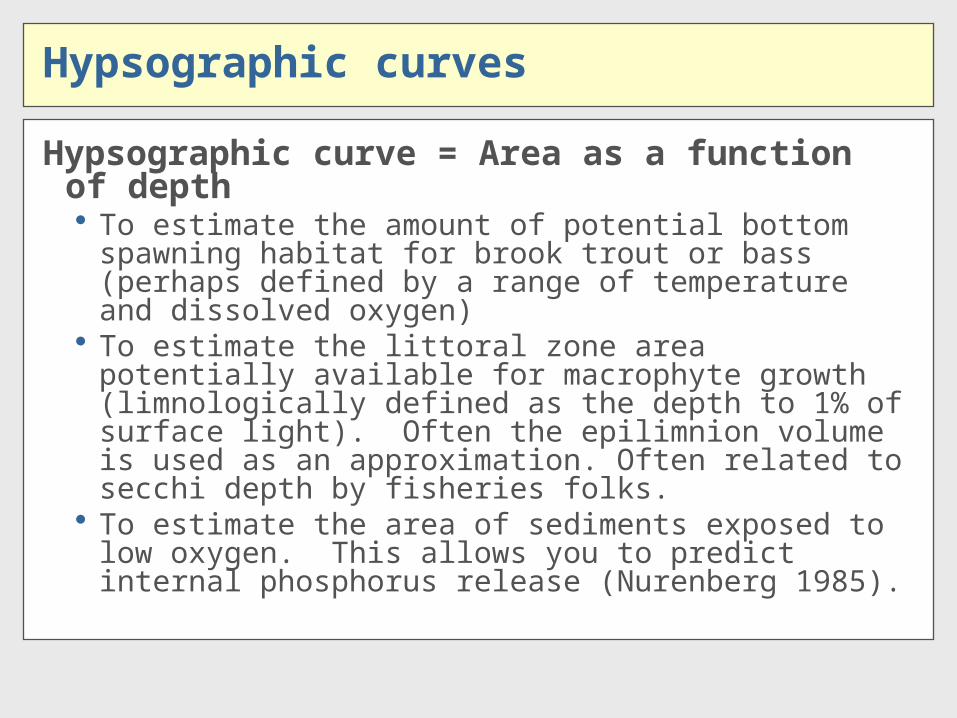
Hypsographic curve = Area as a function of depth To estimate the amount of potential bottom spawning
habitat for brook trout or bass (perhaps defined by a range of temperature and dissolved oxygen)
To estimate the littoral zone area potentially available for macrophyte growth (limnologically defined as the depth to 1% of surface light). Often the epilimnion volume is used as an approximation. Often related to secchi depth by fisheries folks.
To estimate the area of sediments exposed to low oxygen. This allows you to predict internal phosphorus release (Nurenberg 1985).
Developed by: E. Ruzycki and R. Axler Updated: Sept. 2003 U3-m8a-s42
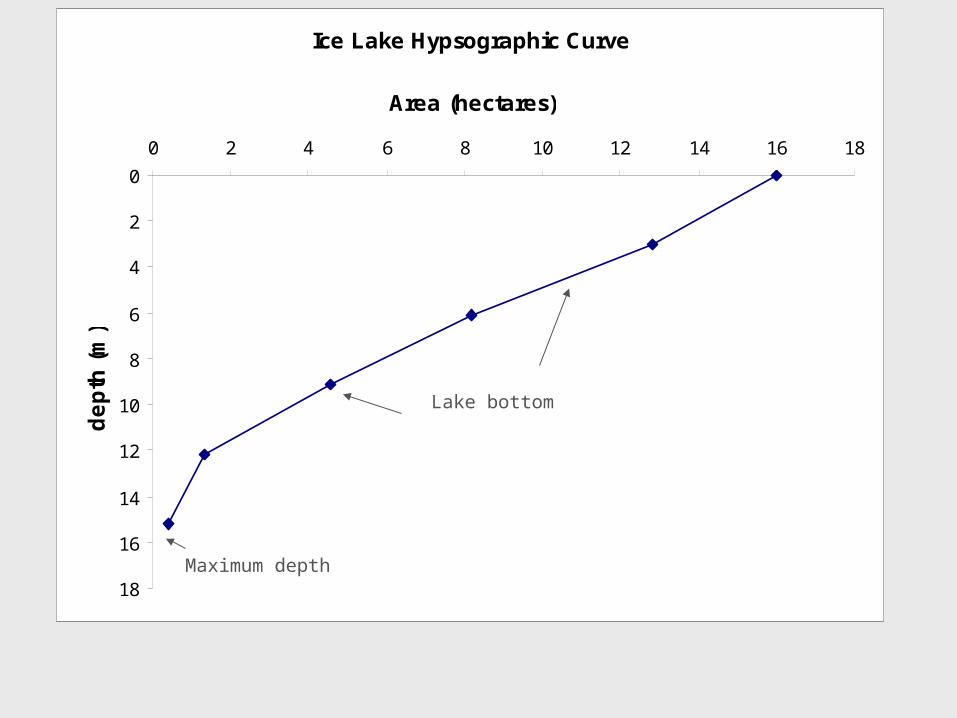
Ice Lake Hypsographic Curve
0
2
4
6
8
10
12
14
16
18
0 2 4 6 8 10 12 14 16 18
Area (hectares)d
ep
th (
m)
Maximum depth
Lake bottom
Developed by: E. Ruzycki and R. Axler Updated: Sept. 2003 U3-m8a-s43
Sounding the Depths of the Ocean Floor
We will supply you a topographic model box and a sounding rod.
Do not open the box. Inside the box is a model sea floor. You will
determine the topography of this model by “sounding”. When you have finished the lab, you may

Developed by: E. Ruzycki and R. Axler Updated: Sept. 2003 U3-m8a-s44
To practice making depth soundings:
1. Place the box on the table with the grid side up (Figure 6).
2. Gently push the sounding rod into one of the holes in the top of the box. Keep the rod vertical!
3. When you reach the bottom, use your fingers to mark the depth of the rod in the box.
4. Withdraw the rod and measure the depth to the nearest 0.1 cm.
Developed by: E. Ruzycki and R. Axler Updated: Sept. 2003 U3-m8a-s45
Practice making depth soundings
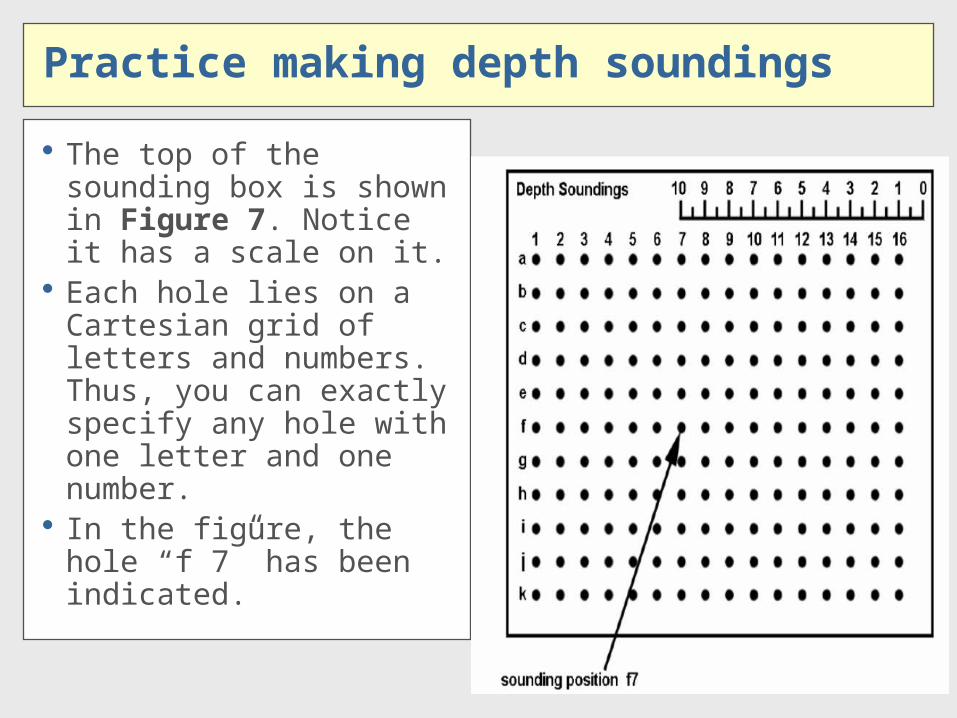
The top of the sounding box is shown in Figure 7. Notice it has a scale on it.
Each hole lies on a Cartesian grid of letters and numbers. Thus, you can exactly specify any hole with one letter and one number.
In the figure, the hole “f 7” has been indicated.

Related Documents