DEVELOP DRAFT CHIP SEAL COVER AGGREGATE SPECIFICATION BASED ON AGGREGATE IMAGING SYSTEM (AIMS) ANGULARITY, SHAPE, AND TEXTURE TEST RESULTS FINAL REPORT ~ FHWA-OK-14-01 ODOT SP&R ITEM NUMBER 2239 Submitted to: John R. Bowman, P.E. Director, Capital Programs Oklahoma Department of Transportation Submitted by: Musharraf Zaman, Ph.D., P.E. Dominique Pittenger, Ph.D. Douglas Gransberg, Ph.D., P.E. Rifat Bulut, Ph.D. Sesh Commuri, Ph.D. College of Engineering The University of Oklahoma January 2014

Welcome message from author
This document is posted to help you gain knowledge. Please leave a comment to let me know what you think about it! Share it to your friends and learn new things together.
Transcript

DEVELOP DRAFT CHIP SEAL COVER AGGREGATE SPECIFICATION BASED ON AGGREGATE IMAGING
SYSTEM (AIMS) ANGULARITY, SHAPE, AND TEXTURE TEST RESULTS
FINAL REPORT ~ FHWA-OK-14-01 ODOT SP&R ITEM NUMBER 2239
Submitted to:
John R. Bowman, P.E. Director, Capital Programs
Oklahoma Department of Transportation
Submitted by: Musharraf Zaman, Ph.D., P.E.
Dominique Pittenger, Ph.D. Douglas Gransberg, Ph.D., P.E.
Rifat Bulut, Ph.D. Sesh Commuri, Ph.D. College of Engineering
The University of Oklahoma
January 2014

ii
TECHNICAL REPORT DOCUMENTATION PAGE
1. REPORT NO. 2. GOVERNMENT ACCESSION NO. 3. RECIPIENT’S CATALOG NO.
FHWA-OK- 14 - 01
4. TITLE AND SUBTITLE 5. REPORT DATE
Develop Draft Chip Seal Cover Aggregate Specification Based On Aggregate Imaging System (AIMS) Angularity, Shape, And Texture Test Results
Jan 2014
6. PERFORMING ORGANIZATION CODE
7. AUTHOR(S)
8. PERFORMING ORGANIZATION REPORT
Musharraf Zaman, Dominique Pittenger, Douglas Gransberg, Rifat Bulut and Sesh Commuri
Click here to enter text.
9. PERFORMING ORGANIZATION NAME AND ADDRESS
10. WORK UNIT NO.
The University of Oklahoma, Office of Research Services Three Partners Place, Suite 150, 201 David L. Boren Blvd Norman, Oklahoma 73019
11. CONTRACT OR GRANT NO.
ODOT SP&R Item Number 2239 12. SPONSORING AGENCY NAME AND ADDRESS
13. TYPE OF REPORT AND PERIOD COVERED
Oklahoma Department of Transportation Planning and Research Division 200 N.E. 21st Street, Room 3A7 Oklahoma City, OK 73105
Final Report
Oct 2011 - Dec 2013 14. SPONSORING AGENCY CODE
15. SUPPLEMENTARY NOTES
Click here to enter text. 16. ABSTRACT
The objective of the study is to improve Oklahoma Department of Transportation (ODOT) chip seal design and performance through introducing new criteria for the selection of cover aggregate and binder. The study evaluates the shape and texture-related index properties, as well as durability, of commonly used cover aggregates in chip seal programs in Oklahoma. Additionally, it provides a methodology for inclusion of these characteristics as a metric in future chip seal specifications. The study includes both laboratory testing and construction and performance evaluation of chip seal test sections. The study quantifies how well the newly developed performance-based uniformity coefficient (PUC) correlates with chip seal performance in Oklahoma, and if it should be incorporated into state chip seal specifications. It has generated aggregate-binder compatibility data, based on the surface free energy (compatibility ratio) approach, for commonly used aggregates and asphalt emulsion binders in Oklahoma. Moreover, the chip seal construction practice followed by different ODOT Maintenance Divisions was documented and the best practice identified. This repository of information will be a useful resource for ODOT maintenance divisions. 17. KEY WORDS 18. DISTRIBUTION STATEMENT
Chip seal, pavement management, skid
resistance, aggregate-binder
compatibility, maintenance, pavement
preservation
No restrictions. This publication is available from the Planning & Research Div., Oklahoma DOT.
19. SECURITY CLASSIF. (OF THIS REPORT) 20. SECURITY CLASSIF. (OF THIS PAGE) 21. NO. OF PAGES 22. PRICE
Unclassified Unclassified 121 N/A

iii
DISCLAIMER The contents of this report reflect the views of the author(s) who is responsible for the facts and the accuracy of the data presented herein. The contents do not necessarily reflect the views of the Oklahoma Department of Transportation or the Federal Highway Administration. This report does not constitute a standard, specification, or regulation. While trade names may be used in this report, it is not intended as an endorsement of any machine, contractor, process, or product.

iv
SI* (MODERN METRIC) CONVERSION FACTORS
APPROXIMATE CONVERSIONS TO SI UNITS
SYMBOL WHEN YOU KNOW MULTIPLY BY TO FIND SYMBOL
LENGTH
in inches 25.4 millimeters mm
ft feet 0.305 meters m
yd yards 0.914 meters m
mi miles 1.61 kilometers km
AREA
in2 square inches 645.2 square millimeters mm
2
ft2 square feet 0.093 square meters m
2
yd2 square yard 0.836 square meters m
2
ac acres 0.405 hectares ha
mi2 square miles 2.59 square kilometers km
2
VOLUME
fl oz fluid ounces 29.57 milliliters mL
gal gallons 3.785 liters L
ft3 cubic feet 0.028 cubic meters m
3
yd3 cubic yards 0.765 cubic meters m
3
NOTE: volumes greater than 1000 L shall be shown in m3
MASS
oz ounces 28.35 grams g
lb pounds 0.454 kilograms kg
T short tons (2000 lb) 0.907 megagrams (or "metric ton")
Mg (or "t")
TEMPERATURE (exact degrees) oF Fahrenheit 5 (F-32)/9
or (F-32)/1.8 Celsius
oC
ILLUMINATION
fc foot-candles 10.76 lux lx
fl foot-Lamberts 3.426 candela/m2 cd/m
2
FORCE and PRESSURE or STRESS
lbf poundforce 4.45 newtons N
lbf/in2 poundforce per square
inch 6.89 kilopascals kPa

v
APPROXIMATE CONVERSIONS FROM SI UNITS
SYMBOL WHEN YOU KNOW MULTIPLY BY TO FIND SYMBOL
LENGTH
mm millimeters 0.039 inches in
m meters 3.28 feet ft
m meters 1.09 yards yd
km kilometers 0.621 miles mi
AREA
mm2 square millimeters 0.0016 square inches in
2
m2 square meters 10.764 square feet ft
2
m2 square meters 1.195 square yards yd
2
ha hectares 2.47 acres ac
km2 square kilometers 0.386 square miles mi
2
VOLUME
mL milliliters 0.034 fluid ounces fl oz
L liters 0.264 gallons gal
m3 cubic meters 35.314 cubic feet ft
3
m3 cubic meters 1.307 cubic yards yd
3
MASS
g grams 0.035 ounces oz
kg kilograms 2.202 pounds lb
Mg (or "t") megagrams (or "metric ton")
1.103 short tons (2000 lb) T
TEMPERATURE (exact degrees) oC Celsius 1.8C+32 Fahrenheit
oF
ILLUMINATION
lx lux 0.0929 foot-candles fc
cd/m2 candela/m
2 0.2919 foot-Lamberts fl
FORCE and PRESSURE or STRESS
N newtons 0.225 poundforce lbf
kPa kilopascals 0.145 poundforce per square inch
lbf/in2
*SI is the symbol for the International System of Units. Appropriate rounding should be made to comply with Section 4 of ASTM E380.

vi
TABLE OF CONTENTS TABLE OF CONTENTS ..................................................................................................vi
LIST OF FIGURES ......................................................................................................... vii
LIST OF TABLES .......................................................................................................... viii
EXECUTIVE SUMMARY .................................................................................................ix
1.0 INTRODUCTION ................................................................................................... 1
2.0 CHIP SEAL DESIGN ............................................................................................. 6
3.0 CHIP SEAL PERFORMANCE ............................................................................. 18
4.0 RESEARCH METHODOLOGY AND PROTOCOLS ........................................... 32
5.0 LABORATORY TEST RESULTS AND ANALYSIS ............................................. 57
6.0 FIELD TEST RESULTS AND ANALYSIS ............................................................ 77
7.0 CONCLUSIONS .................................................................................................. 92
8.0 REFERENCES .................................................................................................... 94
APPENDIX A - Outline Specification for Single Size Chip Seal ...................................A-1
APPENDIX B - Sessile Drop Results ...........................................................................B-1
APPENDIX C – AIMS1 Results ................................................................................... C-1

vii
LIST OF FIGURES Figure 1.1 Chip Seal Schematic [3] ........................................................................................... 1
Figure 2.1 Chip Seal Installation ................................................................................................ 7
Figure 2.2 Kearby Nomograph [1] ............................................................................................. 9
Figure 2.3 Schematic of McLeod’s Failure Criteria [2] ......................................................... 16 Figure 2.4 Gradation Range to Maximize Performance (after [10]) ................................... 17 Figure 3.1 Aggregate Imaging System in OU Lab ................................................................ 21
Figure 3.2 Sessile Drop Device ............................................................................................... 26 Figure 3.3 Pavement Surface Microtexture and Macrotexture [42] ................................... 28
Figure 3.4 Pavement Friction Model [43] ............................................................................... 29 Figure 3.5 ODOT Skid Truck .................................................................................................... 31
Figure 4.1 Study Aggregate Sources – (1) Dolese-Cooperton, (2) Hanson-Davis, (3) Martin Marietta-Mill Creek, (4) Dolese-Hartshorne and (5) Kemp Stone-Pryor ............... 33
Figure 4.2 Validation of AIMS1 Gradient Angularity: Dolese (top) Hanson (bottom) ...... 35 Figure 4.3 Validation of AIMS1 2D Form: Dolese (top), Hanson (bottom) ........................ 36
Figure 4.4 Validation of AIMS1 Texture: Dolese (top), Hanson (bottom).......................... 38 Figure 4.5 Prepared sample from Dolese Cooperton (limestone) ...................................... 40
Figure 4.6 Bleeding and Aggregate Loss Values for Three ½” Gradations ...................... 45 Figure 4.7 Chip Seal Test Section Layout .............................................................................. 47
Figure 4.8 Geosynthetic (Paving) Fabric Being Installed in Test Sections ....................... 48
Figure 4.9 Dipstick Device (Rutting) Output .......................................................................... 50 Figure 4.10 Dipstick Device Output Histogram ..................................................................... 50
Figure 4.11 FWD Results, Pre- and Post-Construction (Chip Seal) .................................. 51 Figure 4.12 Fog Seal Application to Chip Seal Test Sections ............................................ 55
Figure 5.1 AIMS1 Output for Gradient Angularity (3/8” Aggregate, Sample 1) ................ 60 Figure 5.2 AIMS1 Output for Sphericity I (3/8” Aggregate, Sample 1) .............................. 62
Figure 5.3 AIMS1 Output for Texture (3/8” Aggregate, Sample 1) .................................... 64 Figure 5.4 AIMS 1 Output: Gradient Angularity for Test Section Aggregate .................... 66 Figure 5.5 AIMS 1 Output: Texture for Test Section Aggregate ......................................... 67
Figure 5.6 AIMS 1 Output: Sphericity for Test Section Aggregate ..................................... 67
Figure 5.7 Sessile Drop Results Graph for Dolese Cooperton ........................................... 69
Figure 5.8 Typical DCA Specimens Prepared from Asphalt Binder .................................. 72
Figure 5.9 Emulsion Coated Glass Cover Specimens: (Left) 70⁰C; (Middle) 80⁰C; (Right) 90⁰C ................................................................................................................................ 73
Figure 5.10 The Cahn Dynamic Contact Angle (DCA) Analyzer ........................................ 73 Figure 5.11 Total SFE (ergs/cm2) of Tested Emulsion ........................................................ 74
Figure 6.1 Microtexture Values for 3/8" Test Sections ......................................................... 79 Figure 6.2 Microtexture Values for 1/2" Test Sections ......................................................... 80 Figure 6.3 Macrotexture Values for 3/8" Test Sections ....................................................... 81
Figure 6.4 Macrotexture Values for 1/2" Test Sections ....................................................... 82
Figure 6.5 Macrotexture Values for Test Sections with and without Fabric ...................... 83
Figure 6.7 Chip Seal Construction: Distributor, Chip Spreader and Dump Truck ........... 86 Figure 6.8 Chip Seal Rolling Operation .................................................................................. 89
Figure 6.9 Dump Trucks in Staggered Pattern ...................................................................... 90 Figure 6.10 Traffic Control Signage and Pilot Car for Test Section Installation ............... 91

viii
LIST OF TABLES
Table 2.1 Effect of Aggregate Gradation/Aggregate Treatment on Retention [18] ......... 12
Table 2.2 Asphalt Application Rate Correction Factor for Traffic [15] ............................... 15
Table 2.3 Asphalt Application Rate Existing Surface Correction Factors [15] ................. 15
Table 4.1 Surface energy components of liquid probes [54] ............................................... 42
Table 4.2 PUC Values for ½” Gradations ............................................................................... 46
Table 4.3 Test Section Gradations .......................................................................................... 46
Table 4.4 Chip Seal Test Section Shot Rates ....................................................................... 48
Table 5.1 LA Abrasion and Micro-Deval Results .................................................................. 57
Table 5.3 AIMS1 Gradient Angularity: Descriptive Statistics for 6 Quarries ..................... 59
Table 5.4 AIMS1 Gradient Angularity Classification for 6 Quarries (Sample 1) .............. 60
Table 5.5 AIMS1 Sphericity I: Descriptive Statistics for 6 Quarries ................................... 62
Table 5.6 AIMS1 Sphericity I Classification for 6 Quarries (Sample 1) ............................. 63
Table 5.7 AIMS1 Texture: Descriptive Statistics for 6 Quarries ......................................... 64
Table 5.6 Sessile Drop Results for Dolese Cooperton ........................................................ 69
Table 5.7 SFE Components of Study Aggregates and Emulsion ...................................... 70
Table 5.8 Free Energy of Adhesion Values for Aggregate and Emulsion Sources ......... 71
Table 5.9 Compatibility Ratios for Aggregate-Binder Compatibility ................................... 75
Table 5.10 SFE Components of Typical PG 64-22 Asphalt Binder ................................... 75
Table 5.11 Compatibility Values for Aggregates with PG 64-22 Asphalt Binder ............. 76
Table 6.1 Microtexture (Skid Number) Values at Month 1 and Month 7 (Final) ............... 78
Table 6.2 Macrotexture Values at Month 1 (Initial) and Month 12 (Final) ......................... 80
Table 6.3 TNZ P/17 Performance Specification Comparison ............................................. 84
Table 6.4 Chip Seal Best Practices: Equipment (After [3]) .................................................. 86
Table 6.5 Chip Seal Best Practices: Construction (After [3]) .............................................. 87

ix
EXECUTIVE SUMMARY
The study seeks to improve Oklahoma Department of Transportation (ODOT) chip seal
design and performance through introducing new criteria for the selection of cover
aggregate and binder. These criteria will be based upon the recent technological
advances in the characterization of aggregate shape and texture as well as aggregate-
binder compatibility. Specifically, the study includes evaluation of aggregate index
properties obtained from the Aggregate Imaging System (AIMS) and performance-
based uniformity coefficients (PUC) in tweaking ODOT chip seal cover aggregate
specifications. It also uses the surface free energy (compatibility ratio) approach in
evaluation of the aggregate-binder compatibility. Moreover, the chip seal construction
practices followed by ODOT Maintenance Divisions has been documented and effective
practices have been identified. The study includes both laboratory testing and
construction and performance evaluation of chip seal test sections. Division THREE
(Ada) has been actively involved in the construction of the chip seal test sections as well
as performance monitoring.
This study has three objectives. The first objective is to evaluate the shape and texture-
related index properties, as well as durability, of commonly used cover aggregates in
chip seal programs in Oklahoma, and provide a methodology for inclusion of these
characteristics as a metric in future chip seal specifications. The second objective is to
quantify how well the newly developed performance-based uniformity coefficient (PUC)
correlates with chip seal performance in Oklahoma, and if it should be incorporated into
state chip seal specifications. The last objective is to generate aggregate-binder
compatibility data, based on the surface free energy (compatibility ratio) approach, for
commonly used aggregates and asphalt emulsion binders in Oklahoma, which will be a
useful resource for ODOT maintenance divisions.

x
The major benefits of the research are: (i) a more precise specification of the required
characteristics of chip seal cover aggregate; (ii) the identification of combinations of chip
seal binder and aggregate that are incompatible in each ODOT division; (iii) influence of
fog seal on chip seal performance; (iv) documentation of construction practices in each
maintenance division and identification of effective construction practice. This can
eliminate or reduce premature failures due to incompatible binder-aggregate
combinations. It can also accrue benefits by increasing chip seal average service life by
quantifying the aggregate characteristics that promote proper adhesion as determined
by field performance evaluation and laboratory aggregate analysis. Achieving these
benefits will provide a further benefit of releasing scarce maintenance funds to be used
as programmed by reducing the amount of unplanned reactive maintenance that occurs
on a state-wide basis. This comes from increasing the probability of chip seal success
by eliminating those factors that can be controlled in the design process.
The research team has implemented a program of real-time feedback to ODOT
divisions as developments have been made. This was done through presentations and
workshops for rapid implementation. Dr. Kim, who introduced the PUC-based gradation
concept in North Carolina, conducted a workshop at ODOT in May 2013 and delivered a
presentation at the University of Oklahoma as a technology transfer event for this
project. The major products of this project include recommendations for revising ODOT
chip seal cover aggregate specifications and fine-tuning division-specific chip seal
design procedures. Once the research findings are reviewed and approved by ODOT, a
seminar can be organized for the purpose of Oklahoma implementation of the revised
specification and its ramification on current division maintenance practices. The target
audience is ODOT maintenance engineers; however, it will be made available to all
interested ODOT employees. The seminar could also be used as an outreach
opportunity by inviting pavement managers from cities and counties as well. Thus, the
results of the research can be made immediately available in a form that permits rapid
implementation.

1
1.0 INTRODUCTION Chip seals are widely used for preventive maintenance of pavements. While there has
been extensive research on the various parts of the surface treatment, there is little
research on how to combine the various materials and methods. Hence, chip sealing
continues to be considered an art rather than a rationally engineered composite system.
While some systematic methodology exists for design and installation of chip seals, the
methods are quite dated [1,2]. In most cases, the Oklahoma Department of
Transportation (ODOT) maintenance engineers use empirical design based on trial and
error. However, additional technical information is needed that defines aggregate
gradation and selection based on performance characteristics and binder compatibility.
This could permit ODOT engineers to specify appropriate chip seal gradations and
enhance chip seal specifications and design methods.
1.1 BACKGROUND Chip seals are one of the major pavement preservation tools used to extend the service
lives of asphalt pavements across the nation [3]. Based on the relatively low costs of
chip seals, they are used regularly by most ODOT maintenance divisions as a
pavement preservation technique. A traditional chip seal consists of a single layer of
asphalt emulsion binder (henceforth called “binder”) covered with a single layer of
aggregate, as illustrated in Figure 1.1. As a result of its simplicity, the quality of its two
components (cover aggregate and binder) becomes critical.
Figure 1.1 Chip Seal Schematic [3]

2
The primary purpose of a chip seal is to seal a pavement against water intrusion.
Additionally, chip sealing plays an important safety role by providing enhanced
macrotexture, which increases drainage, and enhanced microtexture, which provides
surface friction [3,4].
A recent Oklahoma Transportation Center (OkTC) study by the research team
(OTCREOS7.1-16, “Quantifying the Costs and Benefits of Pavement Retexturing as a
Pavement Preservation Tool,” [4]) demonstrated that chips seals will fail in two
unrelated timeframes. The first is a short-term failure caused by the loss of cover
aggregate within the first year of service. This type of failure is normally related to
incompatibility of the aggregate and the binder, excessive fines in the aggregate, or
some weather event or deficiency in the construction process such as inadequate rolling
or placing the chip seal late in the season where ambient air temperatures are below
specified minimums [3,4,5]. The second type of failure is a long-term failure, which
occurs after the first year of service but before the end of the expected service life [4].
The OkTC study demonstrated that this type of failure, which manifests as aggregate
loss or bleeding, will be either due to a loss of surface macrotexture or a loss of skid
resistance. In both failure modes, the quality of the cover aggregate is an important
issue.
In a recent ODOT SPR project (FHWA-OK-10-PS01), the research team identified that
the test method using the aggregate imaging system (AIMS) holds potential to measure
cover aggregate angularity, which is a predictor of adhesion between the binder and the
aggregate [6]. The project also discovered a potential correlation between the gradient
angularity measured by AIMS [7-9] and the skid number as measured with the locked
wheel skid test. Moreover, the project found promising relationships between the
performance-based uniformity coefficient (PUC), a North Carolina DOT chip seal metric
[10] and the sphericity index measured by AIMS. Thus, these issues will be
investigated for ODOT to determine the potential for early chip seal failure which result
in costly corrective maintenance.

3
Compatibility between aggregates and binders is important to ensure that adequate
adhesion is achieved [3]. Most of the research in this field has focused on material
science aspects of either the asphalt binders or the aggregates, but little has been
written about combinations of binder and aggregate. A Texas DOT (TxDOT) study
found that electrostatic incompatibility of aggregates and binders (i.e. using an anionic
binder with an aggregate that is also anionic) was a major cause of early failure in
emulsion chip seals [11]. Additionally, the study found that lack of adequate angularity
and hardness caused Texas chip seals to fail to achieve their design lives. The results
were used to revise TxDOT chip seal specifications [11] and develop a manual for
statewide implementation [12].
Successful chip seal application is also extremely dependent on the methods employed
in the field during construction. Much of the previous materials research relies on
assumption that the material will be properly installed in the field [13]. Additionally, the
research that has looked at actual project performance is focused on the forensic
evaluation of failures. Thus, ODOT and its paving contractors have a body of reference
knowledge that details what should not be done when installing chip seals with very little
guidance on the subject of what should be done to successfully apply an emulsion chip
seal. This fact was confirmed at the national level in an NCHRP study of chip seal best
practices [3]. This project seeks to extend the previous research and add to the body-of-
knowledge in this area specifically for Oklahoma climate, traffic conditions, and locally
available materials. Thus, the focus will be on how to replicate success with Oklahoma
materials, means, and methods rather than how to avoid failure.
1.2 OBJECTIVES
This study has three objectives:
1. The study evaluates the shape and texture-related index properties, as well as
durability, of commonly used cover aggregates in chip seal programs in Oklahoma,
and provides a methodology for inclusion as a metric in future chip seal
specifications.
4
2. It quantifies how well the newly developed performance-based uniformity coefficient
(PUC) correlates with chip seal performance in Oklahoma, and if it should be
incorporated into state chip seal specifications.
3. It generates aggregate-binder compatibility data, based on the surface free energy
(compatibility ratio) approach, for commonly used aggregates and asphalt emulsion
binders in Oklahoma, which will be a useful resource for ODOT maintenance
divisions.
The major benefits of the research include: (i) a more precise specification of the
required characteristics of chip seal cover aggregate; (ii) the identification of
combinations of chip seal binder and aggregate that are compatible in each ODOT
division; (iii) the influence of fog seal on chip seal performance; and (iv) documentation
of construction practices in each maintenance division and identification of effective
construction practice. This should eliminate or reduce premature failures due to
incompatible binder/aggregate combinations. It should also accrue benefits by
increasing chip seal average service life by quantifying the aggregate characteristics
that promote proper adhesion as determined by field performance evaluation and
laboratory aggregate analysis. Achieving these benefits will provide a further benefit of
releasing scarce maintenance funds to be used as programmed by reducing the amount
of unplanned reactive maintenance that occurs on a state-wide basis. This comes from
increasing the probability of chip seal success by eliminating those factors that can be
controlled in the design process.
1.3 SCOPE
The following tasks constitute the scope of this study:
1. Literature Review
2. Selection of Cover Aggregate and Binder Sources and Collection of Samples
3. Laboratory Testing of Aggregates
4. Laboratory Evaluation of Aggregate-Binder Compatibility
5. Evaluation of Performance-Based Uniformity Coefficient (PUC)
6. Field Testing for Performance Evaluation of Chip Seals
7. Construction of New Chip Seal Test Sections

5
8. Constructability Review of ODOT Division Chip Seal Practices
9. Draft Cover Aggregate Specifications
1.4 TECHNOLOGY TRANSFER
The research team has implemented a program of real-time feedback to ODOT
divisions as developments have been made. This was done through presentations and
workshops for rapid implementation. Dr. Kim [10] who introduced the PUC-based
gradation concept in North Carolina conducted a workshop at ODOT in May 2013 and
delivered a presentation at the University of Oklahoma as a tech transfer for this project.
The major products of this project include recommendations for revising ODOT chip
seal cover aggregate specifications and fine-tuning division-specific chip seal design
procedures. Once the research findings are reviewed and approved by ODOT, a
seminar will be organized on Oklahoma implementing the revised specification and its
ramification on current division maintenance practices. The target audience is ODOT
maintenance engineers; however, it will be made available to all interested ODOT
employees. The seminar could also be used as an outreach opportunity by inviting
pavement managers from cities and counties as well. Thus, the results of the research
will be made immediately available in a form that permits rapid implementation.
1.5 REPORT ORGANIZATION
The body of the report is organized in three major sections, following the three primary
areas in which the project is organized. Those sections are as follows:
The history and science of chip seal design and performance: covers the
information necessary to understand the laboratory and field test results.
Laboratory and field test methodology and protocols: describes the procedures
used in the research.
Laboratory and field test results: provides results and analysis of the laboratory
research.

6
2.0 CHIP SEAL DESIGN Chip seals are applied to existing asphalt pavements to seal surface cracks against air
and water intrusion. They furnish other benefits such as enhancing skid values
(microtexture) to reduce wet weather crashes, providing a uniform looking surface and
improving the visibility of traffic lane striping. Chip seals contribute no structural capacity
to the pavement since they are effectively one rock thick. However, chip seals do
enhance pavement performance through the extension of pavement service life,
qualifying them as a pavement preservation or preventive maintenance application [16].
Chip seal applications are appropriate for low- to mid- volume roads to mitigate
weathering and raveling for pavements with no significant structural distress, only minor
surface distresses. Chip seals cannot be used to improve the pavement ride quality [3].
They should not be applied to correct badly cracked or weathered pavement surfaces
where a rehabilitation or overlay activity is needed. In some cases, chip seals may be
used on such poor surfaces as a stopgap measure until the corrective action can be
taken. Flushed or bleeding surfaces should be considered carefully before chip sealing
because flushing is generally reflected through the new seal if the aggregate and binder
rates are not designed accordingly [3]. One of the major difficulties in chip seal design is
the non-uniformity of the pavement [3]. Most chip seal candidate sections will have
preexisting patching, flushing and raveling observed at different locations of the
pavement. All of these conditions require binder application rate to be varied as the
surface conditions change. This is typically performed by an experienced field crew
changing the rates as needed in the field [3].
Aggregates used in chip seal are expected to transfer the load to the underlying surface
as well as protect the new seal from traffic abrasion [3]. Selection of chip seal cover
aggregates is directly related to the local availability of aggregates. Whatever the
selected aggregate is, caution should be exercised with the aggregate size distribution.
Gradation of the aggregate is should be as uniform as possible [3]. The rule of thumb
for a single-size chip seal cover aggregate gradation correlates roughly to 85% by
weight passing the desired sieve size. Single size cover stone is thought to furnish a

7
better interlocking of particles and better aggregate retention on the surface. Chip seal
application is illustrated in Figure 2.1.
Figure 2.1 Chip Seal Installation
Also, the embedment depth will be more uniform across the road’s surface. The shape
of cover aggregate is also crucial to obtain a good interlocking pattern of aggregates.
Angular aggregate shapes such as cubical or pyramidal surfaces have demonstrated
satisfactory service [3]. Rounded, elongated and flat gravels should be avoided.
Flakiness index defined as the ratio of smallest size of aggregate to the average
aggregate size can indicate the suitability of the aggregate. In practice such undesired
particle shapes are avoided by specifying a maximum percentage of aggregates having
a 0.6 flakiness index [15].
2.1 HISTORY OF CHIP SEAL DESIGN
The early practitioners of surface treatments like chip seals appear to have used a
purely empirical approach to their design. Sealing a pavement was considered then, as
it is now in many circles, an art. Chip seal design involves the calculation of correct

8
amounts of a bituminous binder and a cover aggregate to be applied over a unit area of
the pavement. The two major components of the chip seal design process are the types
and amounts of binder and aggregate.
2.1.1 Hanson Method (New Zealand)
The first recorded effort for developing a chip seal design procedure appears to be
made by Hanson [17]. His design method was developed primarily for liquid asphalt,
specifically cutback asphalt, and was based on the average least dimension (ALD) of
the cover aggregate. Hanson calculated ALD by manually calipering a representative
aggregate sample to obtain the smallest value for ALD that represents the rolled cover
aggregate layer. He observed that when cover aggregate is dropped from a chip
spreader on to a bituminous binder, the voids between aggregate particles is
approximately 50 percent. He theorized that when it is rolled, this value is reduced to 30
percent and it further reduces to 20 percent when the cover aggregate is compacted by
traffic. Hanson’s design method involved the calculation of bituminous binder and
aggregate spread rates to be applied to fill a certain percentage of the voids between
aggregate particles. Hanson specified the percentage of the void space to be filled by
residual binder to be between 60 and 75 percent depending on the type of aggregate
and traffic level.
2.1.2 Kearby Method (Texas)
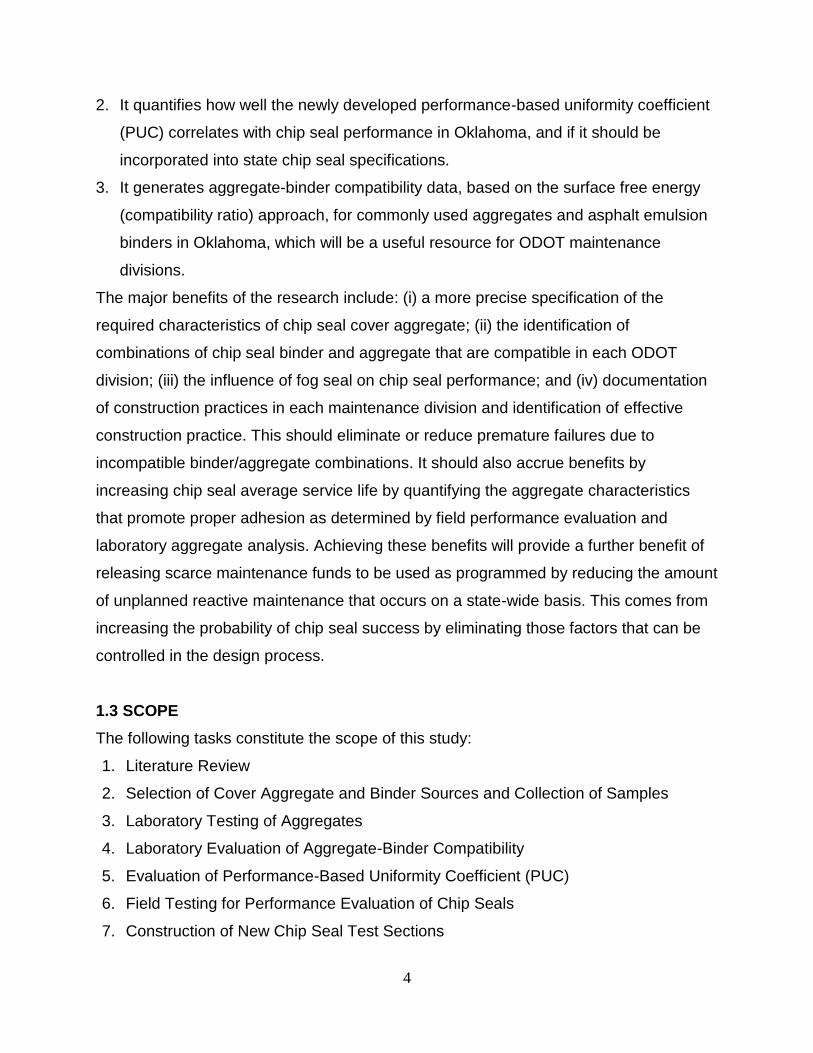
One of the first efforts to design chip seal material application rates in the United States
was made by Jerome P. Kearby, then Senior Resident Engineer at the Texas Highway
Department [1]. He developed a method to determine the amounts and types of asphalt
and aggregate rates for one-course surface treatments and chip seals. He developed
the nomograph, which provided an asphalt cement application rate in gallons per
square yard for the input data of average mat thickness, percent aggregate embedded
and percent voids in aggregate. The percent voids in aggregate correspond to the
percent voids in a bulk loose volume of aggregate and not to the aggregate spread on a
pavement. If liquid asphalt were to be used, he recommended that the rate of
bituminous material application should be increased such that the residual asphalt
9
content is equal to the asphalt content given by the design nomograph. In order to
determine the aggregate spread rate for aggregates containing flat and elongated
particles, Kearby recommended the laboratory board test. In this test, the aggregate is
manually spread over a one square-yard area and then weighed to determine the
weight per unit area design spread rate. The nomograph is shown in Figure 2.2.
Figure 2.2 Kearby Nomograph [1]
In addition to the nomograph, Kearby recommended the use of a uniformly graded
aggregate by outlining eight grades of aggregate based on gradation and associated
average spread ratios. Each gradation was based on three sieve sizes. He also
recommended that combined flat and elongated particle content should not exceed ten
percent of any aggregate gradation requirement. Flat particles were defined as those
with a thickness less than half the average width of particle, and elongated particles
were defined as those with length greater than twice the other minimum dimension.
10
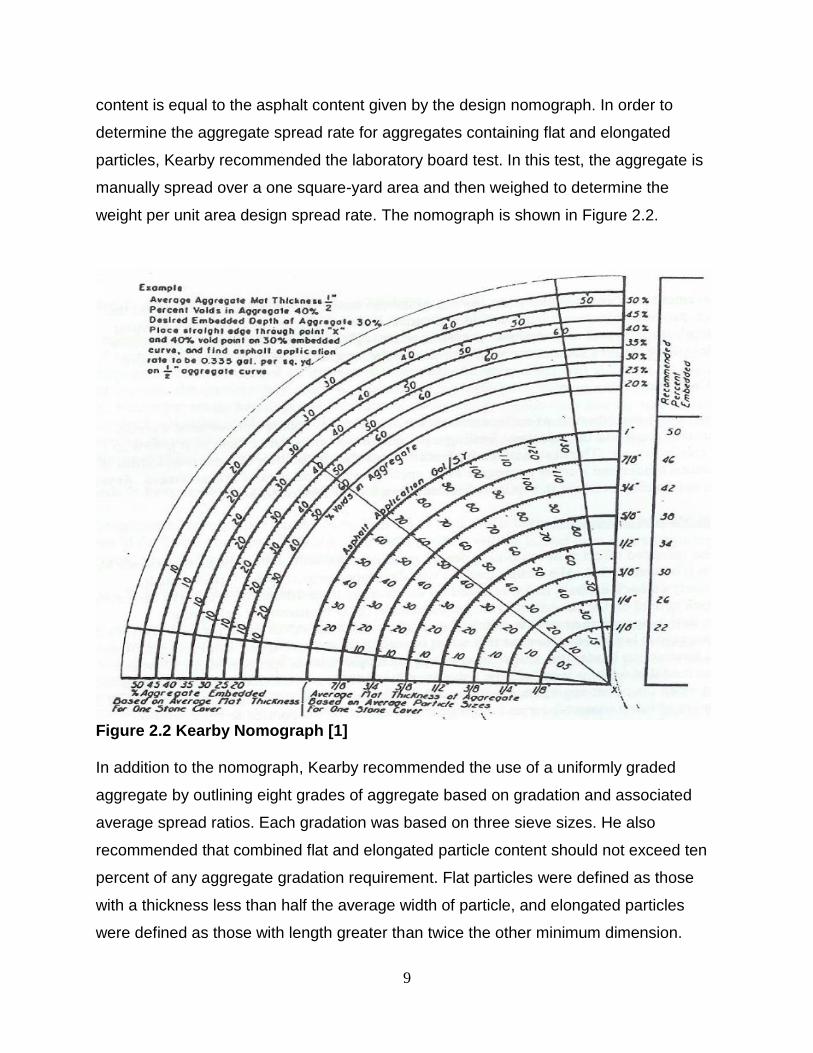
Kearby stated that “computations alone cannot produce satisfactory results and that
certain existing field conditions require visual inspection and the use of judgment in the
choice of quantities of asphalt and aggregate.” He suggested that when surface
treatments are applied over existing hard-paved surfaces or tightly bonded hard base
courses, the percentage of embedment should be increased for hard aggregates and
reduced for soft aggregates. He also mentioned that some allowance should be made
for traffic. It was suggested that for highways with high counts of heavy traffic, the
percent embedment should be reduced along with using larger-sized aggregates. For
those with low traffic volumes, the embedment should be increased with the use of
medium-sized aggregates. However, Kearby did not recommend any specific numerical
corrections.
Kearby also elaborated on the following construction aspects of surface treatments and
chip seals based on his experience at the Texas Highway Department [1]:
Chip seals had been used satisfactorily on both heavy-traffic primary highways
and low-traffic farm roads, with the degree of success largely depending on the
structural strength of the pavement rather than the surface treatment itself.
Thickness of the surface treatment range from ¼ in. to 1 in. with the higher
thickness being preferred. However, lighter treatments have, in general, proven
satisfactory when the pavement has adequate structural capacity and drainage.
In general, most specification requirements for aggregate gradation are very
broad, resulting in considerable variations in particle shape and size as well as
percent voids taken together.
It is better to err on the side of a slight deficiency of asphalt to avoid a fat, slick
surface.
Considerable excess of aggregate is often more detrimental than a slight
shortage.
Aggregate particles passing the #10 sieve acts as filler, thereby raising the level
of asphalt appreciably and cannot be counted on as cover material for the riding
surface.

11
Suitable conditions for applying surface treatments are controlled by factors such
as ambient, aggregate, and surface temperatures as well as general weather and
surface conditions.
Rolling with both flat wheel and pneumatic rollers is virtually essential.
During the same period, two researchers from the Texas Highway Department [18]
published a paper on their aggregate retention studies on chip seals. They conducted
tests to determine the aggregate retention under a variety of conditions including source
of asphalt cement, penetration grade of asphalt, number of roller passes, binder type
(AC vs. cutback), aggregate gradation and binder application temperature. All their tests
were conducted under the same conditions with only the test parameter being variable.
The authors concluded that aggregate retention was not significantly different in asphalt
cements picked from five different sources commonly used by the Texas Highway
Department at the time. A commentary made in the early 1950’s by the authors on the
subject of asphalt quality strikes a familiar theme commonly used by practitioners even
today.
“There has long been a perhaps natural but unjustified tendency to attribute a large
variety of job failures to the quality or source of the asphalt without adequate
investigation of the other factors involved. Ironically, this was as true back in the days of
almost universal use of Trinidad natural asphalt ... now often referred to as standards of
quality in demonstrating the inferiority of some modern product, as it is today” [18].
This study also highlighted the interrelationship between the binder type, binder grade
and the temperature of the pavement during the asphalt shot and during rolling. In one
set of laboratory experiments, the aggregate loss from an OA-230 penetration grade
asphalt cement (close to an AC-2.5) reduced from 44 percent to 11 percent when the
number of roller passes increased from one to three. In the same study, the effect of
aggregate gradation on the performance of chip seals was investigated. An OA-135
asphalt cement (close to an AC-5) applied at a rate of 0.32 gallons per square yard was
used under different aggregate treatments and the corresponding aggregate loss values
are reproduced in Table 2.1. These results highlight the authors’ contention that

12
increased #10-sized aggregate content pose aggregate retention problems in chip
seals. In addition, these researchers showed that a smaller portion of aggregate smaller
than ¼ in. size will result in better performance of the chip seal.
Table 2.1 Effect of Aggregate Gradation/Aggregate Treatment on Retention [18]
Test Condition for Aggregate
Aggregate Loss as a
% of Original
12.6% passing #10 sieve 72.0
6.7% passing #10 sieve 57.4
0% passing #10 sieve 30.5
12.6% passing #10 sieve & rock pre-heated to 250⁰F 17.7
12.6% passing #10 sieve & rock precoated with MC-1 33.6
In 1953, more research findings on aggregate retention were published by Benson and
Galloway of Texas Engineering Experiment Station [18]. The intent of this research was
to study the effects of field factors that usually affect the surface treatments as an
extension of the Kearby design method. A comprehensive laboratory test program was
conducted to study a number of factors including the material application rates,
aggregate gradation, moisture and dust in the aggregate as well as the elapsed time
between the application of binder and aggregate for different binder types. Some of the
notable conclusions made by Benson and Galloway are listed below [18].
A ten percent upward correction to aggregate quantity is needed, calculated from
the Board Test recommended by Kearby, to account for spreading inaccuracy.
For average mat thickness less than 0.5 in., a higher percentage embedment is
needed to hold the smaller aggregate particles together. As a result, the authors
proposed an alteration to the curve proposed by Kearby.
When asphalt cement is used as the binder, aggregate should be spread as soon
as possible after the asphalt is sprayed.
Harder asphalt cements hold cover stone more tightly, but initial retention is more
difficult to obtain
Cover stone with a limited variation in grading will give the highest retention.
Wet aggregates give poor retention with asphalt cement.

13
Dust in aggregate results in poor retention. However, wetting the dry aggregate
before application and by allowing it to dry before rolling reduced the negative
effect from dust.
Aggregate retention increased with increased quantity of asphalt.
When a 24-hour curing period was allowed, the retention of wet stone by RS-2
emulsion was slightly greater than that for dry stone.
The retention of wet dusty stone was slightly less than for dry stone.
During the 1940’s and 1950’s, research work indicated that sufficient curing time is
needed for chip seals constructed using liquid asphalt. The recommendation from
researchers was that at least 24 hours of curing is required before opening the road for
traffic. J. R. Harris [19] of the Texas Highway Department proposed, based on his
experience, that precoated aggregate should be used to increase the performance of
the chip seal as well as to expedite the construction process. Harris’ contention was that
precoated aggregates considerably shorten the required curing time by eliminating the
problems associated with aggregate dust and moisture, and that traffic can be allowed
to use the roadway within one hour after a chip seal is placed with precoated aggregate.
Also, the report said that this would allow using chip seals on high traffic roadways
where shorter lane closure times due to the use of precoated aggregates would make
the traffic control problem a lot more manageable.
2.1.3 Modified Kearby Method (Texas)
In 1974, Epps et al. proposed a further change to the design curve developed by
Kearby for use in chip seals using synthetic aggregates [20]. Due to high porosity in
synthetic aggregates, a curve showing approximately 30 percent more embedment than
the Benson-Galloway curve was proposed. The rationale for this increase was that high
friction lightweight aggregate may overturn and subsequently ravel under the action of
traffic.
In a separate research effort, Epps et al. [20] continued the work done in Texas by
Kearby [1] and Galloway and Harper [21] by undertaking a research program to conduct

14
a field validation of Kearby’s design method. Actual pre-construction and post-
construction data of 80 different projects were gathered and analyzed for this purpose. It
was observed that Kearby design method predicted smaller asphalt rates than what was
actually used in Texas practice and the study proposed two changes to the design
procedures. The first one was a correction to the asphalt application rates based on
level of traffic and existing pavement condition. The second change was the justification
of the shift of the original design curve proposed by the Kearby and Benson-Galloway
methods, as appropriate for lightweight aggregates.
Equation 1 was used to calculate the asphalt application rate (in gallons per square
yard), which included two correction factors determined for traffic level and existing
surface condition [20].
Equation 1
Where W and G are the dry unit-weight and dry bulk specific gravity of the aggregate,
respectively, and d is the mat thickness that can be measured in the laboratory. Also, E
is the depth of embedment and T and V are traffic correction factor and surface
correction factor, respectively, for the asphalt application rate (A).
The proposed correction factors were projected from the actual mat thickness-
embedment combinations that were proven to work well in the field. Epps et al. [15]
also suggested that the asphalt rate should be varied both longitudinally and
transversely as reflected by the pavement surface condition. Since then, practitioners
and researchers have labeled this design approach the “Modified Kearby Method.”

15
Table 2.2 and Table 2.3 show the asphalt application rate correction factors
corresponding to traffic level and existing surface condition, respectively.
Table 2.2 Asphalt Application Rate Correction Factor for Traffic [15]
Traffic Level – Vehicles Per Day Per Lane
Over 1000 500 to 1000 250 to 500 100 to 250 Under 100
Traffic Factor (T) 1.00 1.05 1.10 1.15 1.20
Table 2.3 Asphalt Application Rate Existing Surface Correction Factors [15]
Description of Existing Surface
Asphalt Application Rate Correction (Gallons per Square Yard)
Flushed asphalt surface - 0.06
Smooth, nonporous surface - 0.03
Slightly porous, slightly oxidized surface 0.00
Slightly pocked, porous, oxidized surface + 0.03
Badly pocked, porous, oxidized surface + 0.06
2.2 CURRENT DEVELOPMENTS IN CHIP SEAL DESIGN
A significant US development in chip seal research was proposed by Lee and Kim [10]
resulting from a project funded by the North Carolina DOT. Essentially, the research
extended the study conducted in 1962 by Norman McLeod that developed failure
criteria for chip seals based upon bleeding/flushing and aggregate loss distresses [2].
Lee and Kim showed that improved chip seal performance can be achieved using the
performance-based uniformity coefficient (PUC) concept to select cover aggregate
gradation. In this ODOT study, the researchers have altered the commonly used chip
seal aggregate gradations consistent with the PUC methodology to determine if any
correlation exists between PUC-gradations and field performance of chip seal projects
in Oklahoma.
Aggregate gradation is one of the major factors affecting chip seal performance [2,10].
McLeod postulated that “the largest size for a chip seal aggregate should be no more
than twice the smallest size” [2]. Thus, the ideal chip seal aggregate gradation would
contain only particles of a single size. According to McLeod, the correct binder
16
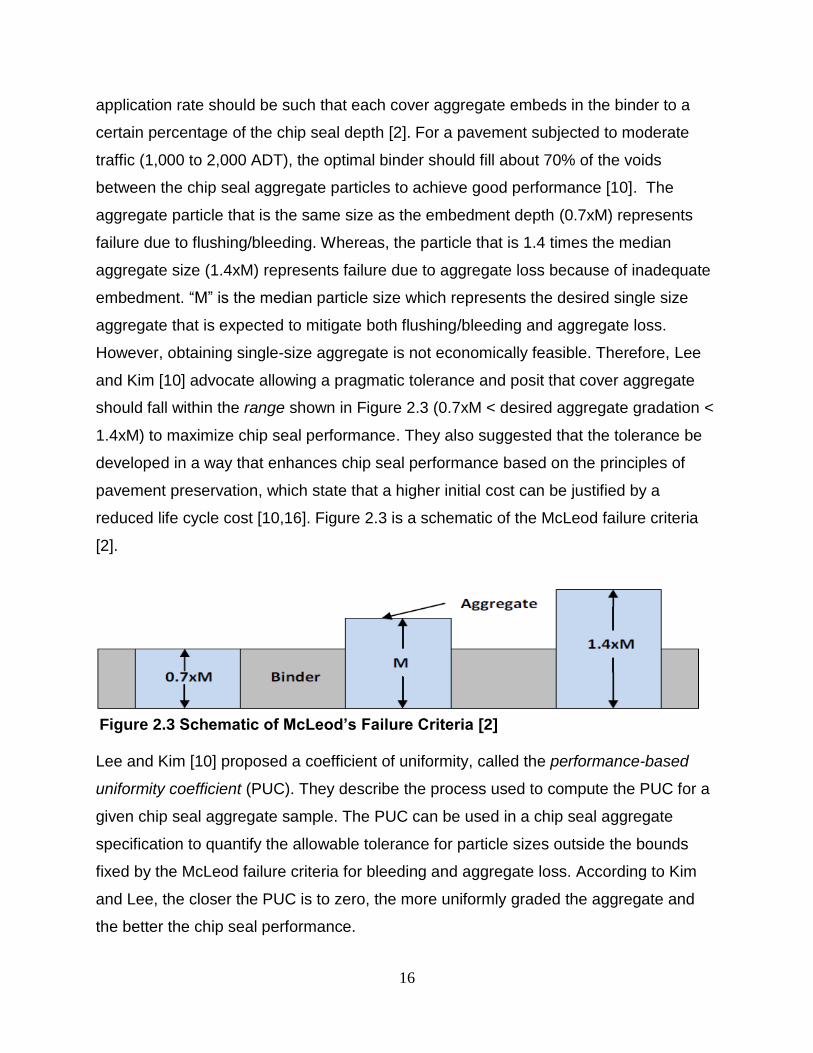
application rate should be such that each cover aggregate embeds in the binder to a
certain percentage of the chip seal depth [2]. For a pavement subjected to moderate
traffic (1,000 to 2,000 ADT), the optimal binder should fill about 70% of the voids
between the chip seal aggregate particles to achieve good performance [10]. The
aggregate particle that is the same size as the embedment depth (0.7xM) represents
failure due to flushing/bleeding. Whereas, the particle that is 1.4 times the median
aggregate size (1.4xM) represents failure due to aggregate loss because of inadequate
embedment. “M” is the median particle size which represents the desired single size
aggregate that is expected to mitigate both flushing/bleeding and aggregate loss.
However, obtaining single-size aggregate is not economically feasible. Therefore, Lee
and Kim [10] advocate allowing a pragmatic tolerance and posit that cover aggregate
should fall within the range shown in Figure 2.3 (0.7xM < desired aggregate gradation <
1.4xM) to maximize chip seal performance. They also suggested that the tolerance be
developed in a way that enhances chip seal performance based on the principles of
pavement preservation, which state that a higher initial cost can be justified by a
reduced life cycle cost [10,16]. Figure 2.3 is a schematic of the McLeod failure criteria
[2].
Figure 2.3 Schematic of McLeod’s Failure Criteria [2]
Lee and Kim [10] proposed a coefficient of uniformity, called the performance-based
uniformity coefficient (PUC). They describe the process used to compute the PUC for a
given chip seal aggregate sample. The PUC can be used in a chip seal aggregate
specification to quantify the allowable tolerance for particle sizes outside the bounds
fixed by the McLeod failure criteria for bleeding and aggregate loss. According to Kim
and Lee, the closer the PUC is to zero, the more uniformly graded the aggregate and
the better the chip seal performance.
17
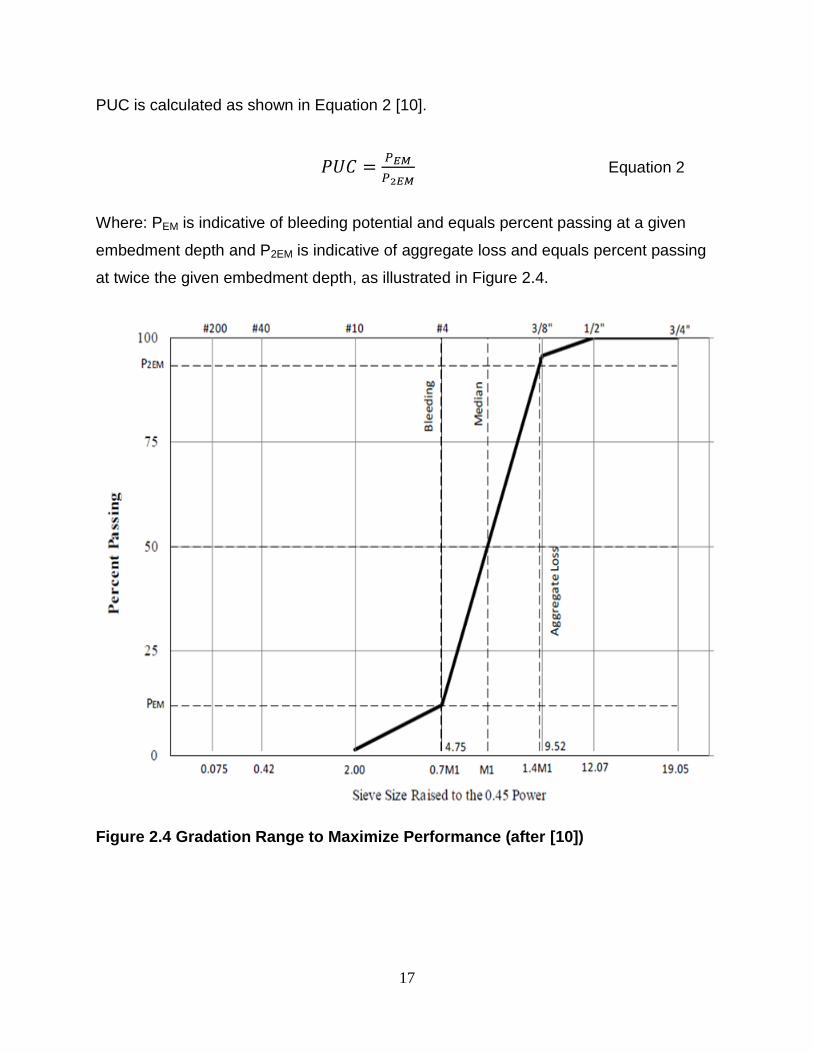
PUC is calculated as shown in Equation 2 [10].
Equation 2
Where: PEM is indicative of bleeding potential and equals percent passing at a given
embedment depth and P2EM is indicative of aggregate loss and equals percent passing
at twice the given embedment depth, as illustrated in Figure 2.4.
Figure 2.4 Gradation Range to Maximize Performance (after [10])

18
3.0 CHIP SEAL PERFORMANCE Aggregate characteristics, such as durability, shape, texture and binder compatibility,
will affect chip seal performance [2,10]. Therefore, various laboratory and field tests are
conducted to ensure proper chip seal design. Typical laboratory testing includes
aggregate durability and abrasion resistance tests. Recently, the aggregate imaging
system (AIMS) has been used to determine aggregate shape and texture properties.
Additionally, aggregate-binder compatibility tests are conducted. Aggregate is
responsible for surface friction in the field. Therefore, field testing includes
measurement of microtexture and macrotexture. Thus, these test methodologies will be
implemented in this ODOT study to characterize cover aggregates and chip seals used
in Oklahoma.
3.1 LABORATORY TESTS FOR COVER AGGREGATE
Laboratory tests are used to characterize cover aggregate for the purposing of
enhancing chip seal performance. Los Angeles Abrasion and Micro-Deval tests assess
aggregate durability and resistance to abrasion. AIMS determines aggregate shape and
texture. Sessile Drop and Universal Sorption Device evaluate aggregate-binder
compatibility. Analyzing the data from the laboratory tests can provide insight about the
potential for early chip seal failures.
3.1.1 Los Angeles Abrasion & Micro-Deval Tests
NCHRP Synthesis 342 found that one of the major causes of chip seal failure related to
aggregate was excessive fines [3]. The fine content in chip seal aggregate is typically
measured at the aggregate quarry. Each time the aggregate is moved, the gradation
changes and the fines content increases. Therefore, the gradation may change
significantly between the quarry and the aggregates’ final destination on the road. The
amount of degradation is a function of the aggregate’s abrasion and impact resistance.
The Los Angeles (LA) Abrasion test and the Micro-Deval test provide information about
aggregate abrasion and impact resistance. It is worth noting that ODOT only specifies
the LA Abrasion, not Micro-Deval, for cover aggregates.
19
The LA Abrasion and Impact Test (AASHTO T 96) is the most widely used method for
measuring aggregate resistance for abrasion and aggregate toughness [22]. It
simulates degradation during transport, mixing, and compaction and measures
aggregate resistance to the degradation. The methodology involves obtaining 5000 ± 5
g of an aggregate blend, which is placed into a steel cylinder drum with six to twelve
46.8 mm steel spheres, depending on the gradation used for the blend. The aggregates
and steel spheres are then rotated in the drum at 30 to 33 rpm until the total rotations
reach 500. The weight loss is measured as material passing the #12 sieve, and the
percent weight loss is calculated using Equation 3.
Equation 3
The Micro-Deval test was developed in the 1870s in France to evaluate road aggregate,
and it was initially adopted by ASTM in 1908 [23]. The Micro-Deval test is standardized
in AASHTO T 327 “Standard Test Method for Resistance of Coarse Aggregate to
Degradation by Abrasion in the Micro-Deval Apparatus”. The Micro-Deval test simulates
aggregate resistance to abrasion and weathering. Unlike the dry conditions used in LA
Abrasion method, an aggregate blend sample weighing 1500 ± 5 g is soaked in 2000 ±
50 mL of water for a minimum of one hour. The sample is then placed in a steel cylinder
with 5000 ± 5 g of steel ball bearings, much smaller in size than the spheres used in the
LA Abrasion test. This mixture of water, aggregate, and ball bearings are rotated for 105
minutes at 100 ± 5 rpm. After the abrasion process, the aggregates are washed, and
the weight loss is measured as material passing the #16 sieve. It can also be calculated
using Equation 3 to determine the percent weight loss.
Research has shown that there is no correlation between Micro-Deval and the LA
abrasion test. According to AASHTO T 96, the LA Abrasion test is a measure of
aggregate degradation due to abrasion, impact, and grinding. However, other studies
indicate that LA Abrasion primarily measures an aggregate’s resistance to mechanical
breakdown rather than abrasion due to wear [24,25]. The wet conditions in the Micro-
Deval test are thought to better simulate the field condition of aggregates and resistance

20
to abrasion than the dry state of the LA Abrasion test [24]. Two National Center for
Asphalt Technology (NCAT) studies reported that Micro-Deval did not correlate with
other abrasion tests, including the LA abrasion test [22,26].
3.1.2 Aggregate Imaging System (AIMS)
The importance of cover aggregate shape and texture has been recognized even by the
early pioneers of chip seal designs [2,15,20]. Technological advances in imaging tools
now make it possible to accurately quantify aggregate shape and texture. One of the
most appropriate technologies in this regard is the Aggregate Imaging System (AIMS),
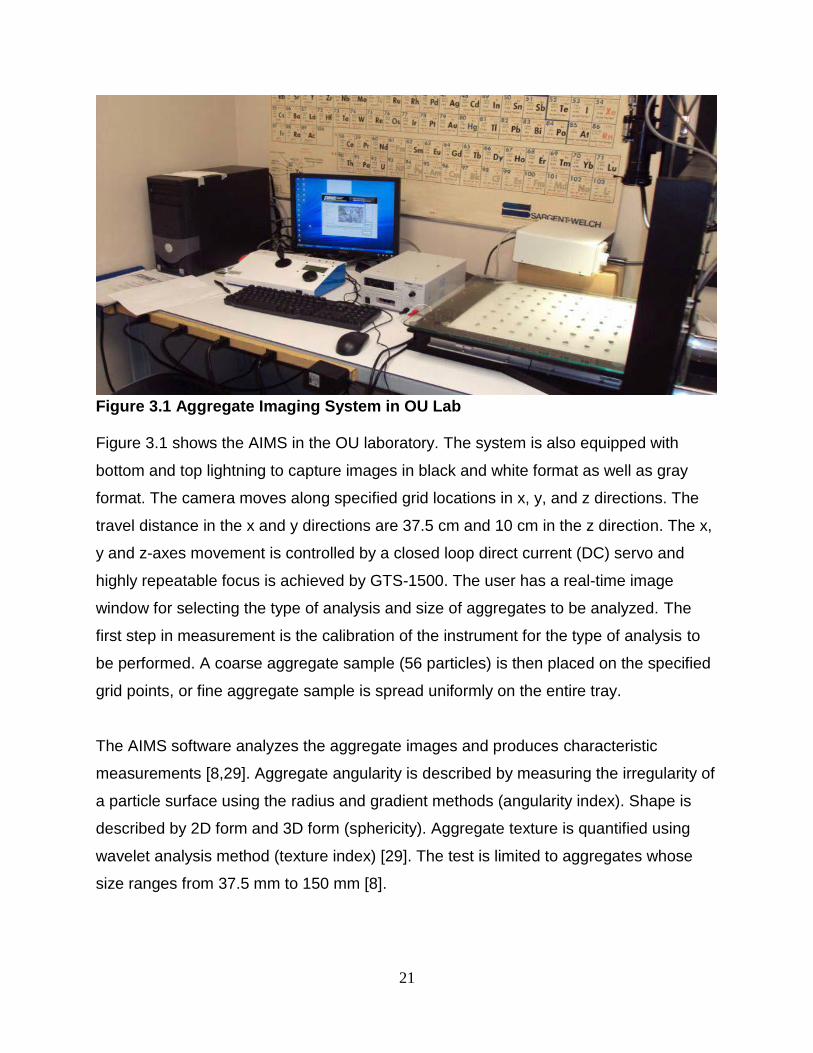
available at the OU Binders Laboratory, shown in Figure 3.1. The Aggregate Imaging
System (AIMS) captures aggregate characteristics in terms of shape, angularity, and
surface texture through image processing and analysis techniques. Currently, there are
no approved AASHTO test methods for conducting AIMS testing; only provisional
standards [27].
The shape and texture of the chip seal aggregate furnishes two important physical
characteristics related to chip seal performance. First, the angularity and sphericity of
each particle impact the quality of the bond formed between the aggregate and the
binder. A very angular stone has more surface area over which to develop the bond
than a smooth stone. The sphericity relates to the ease with which the stone can be
seated during construction. During rolling, the individual particles are reoriented to their
least dimension and embedded in the binder [18]. If proper embedment is achieved, the
probability of premature loss of aggregate is minimized. In addition to orientation of the
embedded chip being important, cubical aggregate shapes are preferred because traffic
does not have a significant effect on the final orientation of aggregate [28]. Cubical
materials tend to lock together and provide better long-term retention and stability.
AIMS equipment consists of a computer automated unit which includes an aggregate
measurement tray with marked grid points at specified distances along x and y axes.
The system contains a camera unit, which has an optem zoom 160 video microscope.
21
Figure 3.1 Aggregate Imaging System in OU Lab
Figure 3.1 shows the AIMS in the OU laboratory. The system is also equipped with
bottom and top lightning to capture images in black and white format as well as gray
format. The camera moves along specified grid locations in x, y, and z directions. The
travel distance in the x and y directions are 37.5 cm and 10 cm in the z direction. The x,
y and z-axes movement is controlled by a closed loop direct current (DC) servo and
highly repeatable focus is achieved by GTS-1500. The user has a real-time image
window for selecting the type of analysis and size of aggregates to be analyzed. The
first step in measurement is the calibration of the instrument for the type of analysis to
be performed. A coarse aggregate sample (56 particles) is then placed on the specified
grid points, or fine aggregate sample is spread uniformly on the entire tray.
The AIMS software analyzes the aggregate images and produces characteristic
measurements [8,29]. Aggregate angularity is described by measuring the irregularity of
a particle surface using the radius and gradient methods (angularity index). Shape is
described by 2D form and 3D form (sphericity). Aggregate texture is quantified using
wavelet analysis method (texture index) [29]. The test is limited to aggregates whose
size ranges from 37.5 mm to 150 mm [8].

22
3.1.2.1 Radius Method (Angularity)
The analysis of angularity by the radius method was developed by Masad et al. [9]
using black and white images. In the radius method, the angularity index is measured
as the difference between the particle radii in a given direction to that of an equivalent
ellipse, as shown in Equation 4.
Equation 4
Where Rϴ is the radius of the particle at an angle of ϴ; and REEϴ is the radius of the
equivalent ellipse at an angle of ϴ [9].
3.1.2.2 Gradient Method (Angularity)
The gradient method is based on the principle that at sharp corners of the image the
direction of the gradient vector changes rapidly, whereas it changes slowly along the
outline of rounded particles. The angularity is calculated based on the values of angle of
orientation of the edge points (ϴ) and the magnitude of difference of these values (Δϴ).
The sum of angularity values for all the boundary points are accumulated around the
edge to get the angularity index. The angularity is mathematically represented in
Equation 5.
Equation 5
Where n is the total number of points on the edge of the particle with the subscript i
denoting the ith point on the edge of the particle [7].
3.1.2.3 Sphericity
Sphericity quantifies the aggregate’s form using the three dimensions of the particle,
which are the longest dimension (dL), the intermediate dimension (dI), and the shortest
dimension (ds) and are used in Equations 6 and 7 for sphericity and shape factor. A

23
sphericity index of 1.0 denotes that a particle is a perfect sphere or cube while sphericity
decreases as a particle becomes more flat and/or elongated.
Equation 6
Equation 7
3.1.2.4 Form
Form analysis using the form index was proposed by Masad et al. [9], and is used to
quantify the form in two dimensions. The form index uses incremental change in the
particle radius and is expressed by Equation 8:
Equation 8
Where Rϴ is the radius of the particle at an angle of ϴ; and Δϴ is the incremental
difference in the angle.
3.1.2.5 Texture Analysis
The AIMS also has the capability to analyze the surface texture of aggregate, which is
initiated by taking a grayscale image of the surface of the aggregate particle. The
Wavelet method, described in detail in NCHRP Report 4-30, is the used to determine
surface texture [7]. The wavelet analysis uses short, high-frequency basis functions and
long, low-frequency basis functions to isolate fine and coarse variations in texture. The
texture contents in all directions are given equal weight and the texture index is
computed as the simple sum of squares of the detail coefficients at that particular
resolution.

24
The texture index is given by Equation 9.
Equation 9
Where N is the total number of coefficients in a detailed image of texture, i takes values
1, 2, or 3 for the three detailed images of texture, j is the wavelet coefficient index and
(x, y) is the location of the coefficients in the transformed domain [7].
3.1.3 Sessile Drop and Universal Sorption Device
Compatibility between aggregates and binders is critical to ensure that adequate
adhesion is achieved [30,31]. A TxDOT study found that electrostatic incompatibility of
aggregates and binders (i.e. using an anionic binder with an aggregate that is also
anionic) was a major cause of early failure in emulsion chip seals [11]. Emulsions
routinely come in either anionic or cationic forms. For a compatible aggregate-binder
system, the binder and aggregate must have opposite charges. Otherwise, the residual
binder will not form a strong bond with the aggregate. Senadheera et al. [30] developed
a performance-based test method for aggregate-binder compatibility. This method
essentially requires the preparation of a chip seal specimen on hot aluminum plate and
subjecting the specimen to debonding failure using a Modified Proctor Hammer [30].
The “Coating Ability and Water Resistance” method, specified in ASTM D244 22-29,
provides a framework for evaluation of aggregate-binder compatibility. However, none
of these methods are based on mechanistic performance.
The theory of surface energy can be used to characterize aggregate-binder
compatibility [32]. Specifically, the strength of the interface bonding can be quantified
fundamentally by comparing the wet adhesive bond strength with the dry adhesive bond
strength between the binder and aggregate. Three components comprise a material’s
total surface free energy: the Lifshitz-van der Waals (LW) component, the Lewis acid
component and the Lewis base component [32]. The total work of adhesion (WAS) can

25
be determined by incorporating these values, which can be determined indirectly using
contact angles (e.g., Sessile Drop), vapor adsorption isotherm (e.g., Universal Sorption
Device), or heat of immersion measurements [32,33,34,35], into Equation 10.
Equation 10
Where γ represents total SFE of each material, γLW is the LW component,
γ+ is the Lewis acid component, and γ- is the Lewis base component, and A and S
denote binder and aggregate, respectively.
Equation 11 is used to calculate total work of adhesion in wet condition.
Equation 11
Where the subscripts AW, SW, and AS refer to the interfacial energy between asphalt
binder and water, aggregate and water, and asphalt binder and aggregate, respectively
[32].
The Sessile Drop (SD) device measures the contact angles of both aggregate and
binder directly. The contact angles are measured with liquids of known surface free
energy (SFE), which in turn can be used determine the SFE components. The SFE
components of a binder and aggregate system can then be used to estimate
compatibility ratio (CR) [36,37]. The CR of a binder-aggregate system is the ratio of the
free energy of adhesion under dry conditions (WAS, dry) to the free energy of adhesion in
the presence of moisture (WAS, wet). Higher CR values (greater than 0.8) denote better
bonding [32]. A CR value less than 0.5 indicates poor compatibility.
26
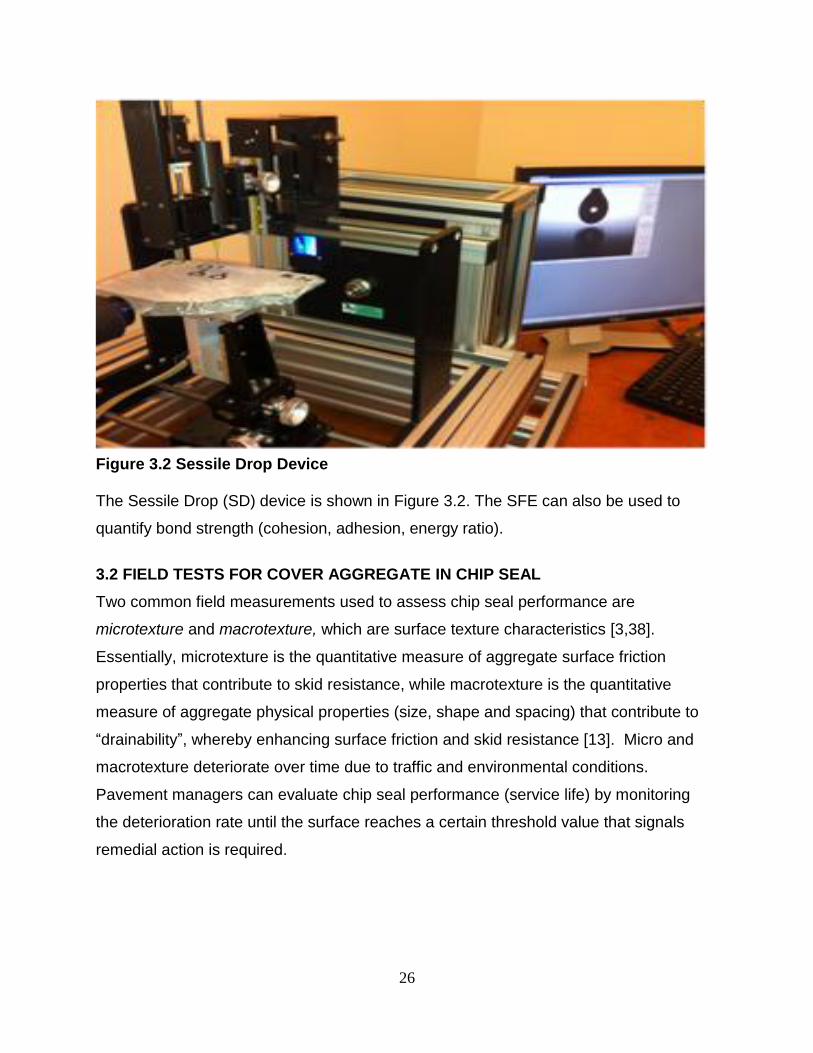
Figure 3.2 Sessile Drop Device
The Sessile Drop (SD) device is shown in Figure 3.2. The SFE can also be used to
quantify bond strength (cohesion, adhesion, energy ratio).
3.2 FIELD TESTS FOR COVER AGGREGATE IN CHIP SEAL
Two common field measurements used to assess chip seal performance are
microtexture and macrotexture, which are surface texture characteristics [3,38].
Essentially, microtexture is the quantitative measure of aggregate surface friction
properties that contribute to skid resistance, while macrotexture is the quantitative
measure of aggregate physical properties (size, shape and spacing) that contribute to
“drainability”, whereby enhancing surface friction and skid resistance [13]. Micro and
macrotexture deteriorate over time due to traffic and environmental conditions.
Pavement managers can evaluate chip seal performance (service life) by monitoring
the deterioration rate until the surface reaches a certain threshold value that signals
remedial action is required.

27
3.2.1 Managing Pavement Surface Texture
Roadway crashes are complex events that are the result of one or more contributing
factors relating to three main categories: driver-related causes, vehicle-related causes,
and highway condition-related causes [39]. Pavement engineers must manage
pavement surface texture (microtexture and macrotexture) to reduce the highway
condition-related causes throughout the pavement life cycle. During design and
construction phases, the engineer has control over the geometry of the road, both in
horizontal and vertical alignments, the speed of travel, the signage of the roadway
system and the material properties of the surface course. The maintenance engineer is
responsible for managing the characteristics of the pavement surface as it deteriorates
over time. Pavement preservation and maintenance treatments, such as chip seal, are
installed to preserve the road’s structural capacity and to ensure that the surface
frictional characteristics are sufficient.
Deterioration of surface texture is the result of mechanical wear and polishing action
rolling or braking and/or accumulation of contaminants [40]. In Australia and New
Zealand, extensive work has been done to manage deterioration through remediation of
mean texture depth (MTD), or macrotexture, to control crash rates. In North America
extensive work has been done to manage skid number, or microtexture, to control crash
rates. Generally, US agencies believe that if an engineer could control wet weather
related crashes then all crashes would be reduced. Therefore, most studies regarding
crash rates and surface characteristics, whether macrotexture or microtexture, primarily
focus on the reduction of wet weather crashes [41].
28
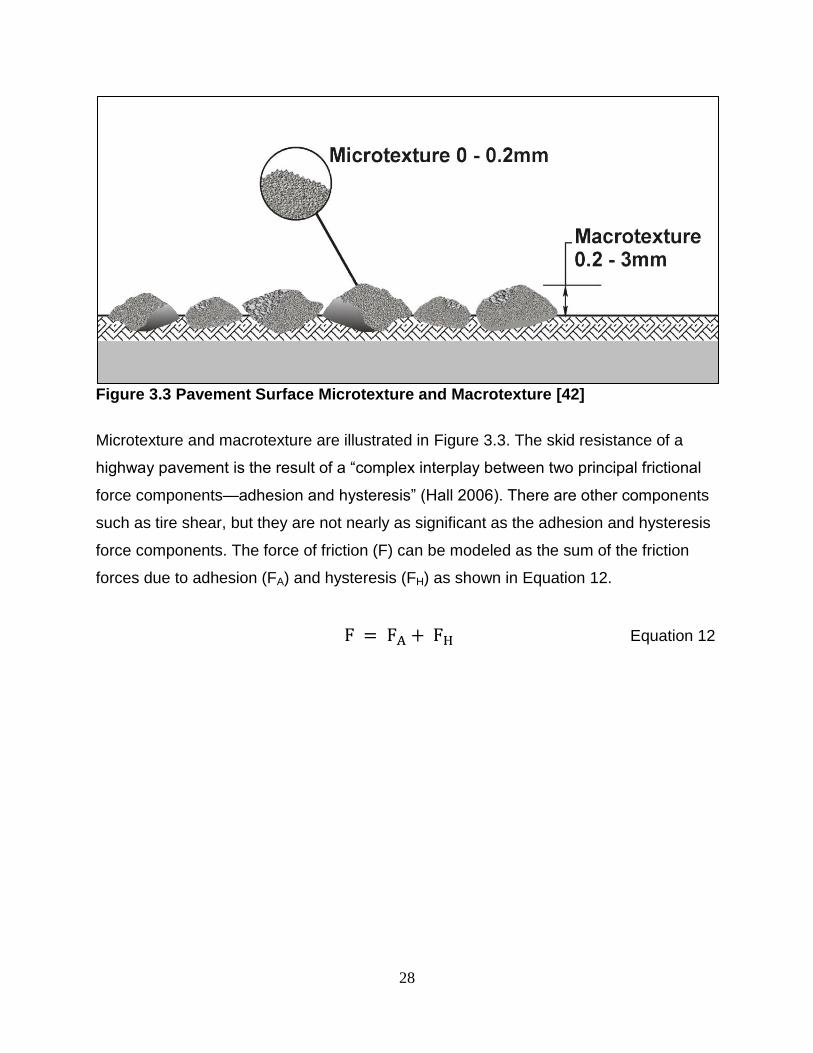
Figure 3.3 Pavement Surface Microtexture and Macrotexture [42]
Microtexture and macrotexture are illustrated in Figure 3.3. The skid resistance of a
highway pavement is the result of a “complex interplay between two principal frictional
force components—adhesion and hysteresis” (Hall 2006). There are other components
such as tire shear, but they are not nearly as significant as the adhesion and hysteresis
force components. The force of friction (F) can be modeled as the sum of the friction
forces due to adhesion (FA) and hysteresis (FH) as shown in Equation 12.
Equation 12

29
Figure 3.4 Pavement Friction Model [43]
Figure 3.4 shows these forces. Relating Figure 3.3 to Figure 3.4, the frictional force of
adhesion is “proportional to the real area of adhesion between the tire and surface
asperities” [43], which makes it a function of pavement microtexture. The hysteresis
force is “generated within the deflecting and visco-elastic tire tread material, and is a
function of speed” making it mainly related to pavement macrotexture [43]. Thus, if an
engineer wants to improve skid resistance through increasing the inherent friction of the
physical properties of the pavement, then the engineer should seek to improve both
surface microtexture and macrotexture.
3.2.2 Measuring Surface Texture
Macrotexture and microtexture are primary performance indicators for chip seal [3,38].
The deterioration of these surface texture characteristics can be measured and
analyzed to determine remaining service life [4].
3.2.2.1 Macrotexture Measurement
Macrotexture is an indicator of aggregate loss in chip seals. The New Zealand
Transport Agency (NZTA) uses chip seal extensively throughout its network to ensure
adequate macrotexture for surface drainage. NZTA considers macrotexture

30
measurement to be one of the key performance indicators (KPI) of surface treatments
[44]. If the average macrotexture of a road surface drops below 0.9mm (0.04 in) on
roads with posted speed limits greater than 70 km/hr (43.5 mph), then the NZTA
requires remedial action to restore surface texture. Based on this failure criterion, NZTA
maintenance engineers have developed trigger points based on local conditions that
allow the programming of pavement preservation treatments, like chip seal, before the
macrotexture loss becomes critical [42]. Macrotexture can be assessed by measuring
mean texture depth (MTD) with the New Zealand Sand Circle testing procedure (TNZ
T/3), which provides information about surface “drainability”.
Error! Reference source not found. shows the TNZ T/3 test being conducted in the
ield. The TNZ T/3 testing procedure feeds the TNZ P/17 performance specification
which can then be used as a metric to judge the success or failure of the surface
treatments in their first 12 months based on a field-proven standard [45]. A recently
completed pavement surface texture research project in Texas proved the validity of
both the test procedure and the performance specification for use in the US [46].
The sand circle test is a volumetric test, performed by placing a known volume of sand,
in this case 45 mL, which is then spread by revolving a straight edge in a circle until the
sand is level with the tops of the surface aggregate and can no longer be moved around
[45]. Once the known volume has been spread in a circle on the surface of the roadway
and can no longer be moved, two measurements are taken to determine the average
diameter of the circle. These values are then averaged and inserted into Equation 13.
Equation 13
The surface texture is inversely proportional to the diameter of the circle produced on
the surface. This testing protocol is relatively simple but has limitations: it is susceptible
to operator inconsistency, environmental issues with rain and wind, and roadway
imperfections, such as abnormal aggregate heights on the surface of the road. A wind
shield is used to shelter the circle from winds and prevent loss of test sand during the
31
test. However, The TNZ T/3 sand circle test provides better reliability than the ASTM
sand patch test, as demonstrated in previous studies [46,47]. Additionally, studies have
shown no statistically significant difference exists between the results of the TNZ T/3
sand circle test and other tests, like circular track meter and RoboTex, which measure
macrotexture [4].
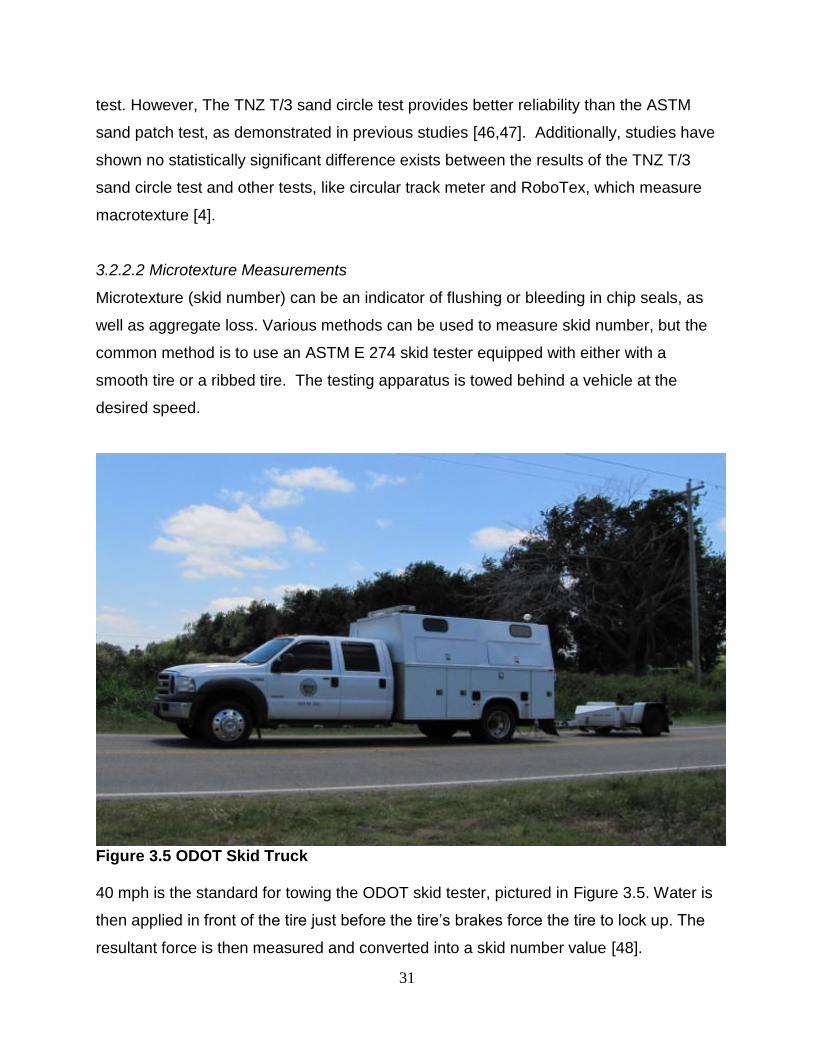
3.2.2.2 Microtexture Measurements
Microtexture (skid number) can be an indicator of flushing or bleeding in chip seals, as
well as aggregate loss. Various methods can be used to measure skid number, but the
common method is to use an ASTM E 274 skid tester equipped with either with a
smooth tire or a ribbed tire. The testing apparatus is towed behind a vehicle at the
desired speed.
Figure 3.5 ODOT Skid Truck
40 mph is the standard for towing the ODOT skid tester, pictured in Figure 3.5. Water is
then applied in front of the tire just before the tire’s brakes force the tire to lock up. The
resultant force is then measured and converted into a skid number value [48].

32
4.0 RESEARCH METHODOLOGY AND PROTOCOLS The research methodology and protocols were established for the purpose of achieving
the study objectives. The objectives include characterizing commonly used chip seal
aggregate, determining aggregate-binder compatibility and evaluating the performance-
based uniformity coefficient (PUC) and any correlation it may have with chip seal
performance in Oklahoma. The results provide the basis for determining if a more
precise ODOT specification of the required characteristics of chip seal cover aggregate
is warranted. Results will also identify combinations of chip seal binder and aggregate
that are compatible in each ODOT division. Additionally, the research provides
documentation of construction practices in each maintenance division and identification
of effective construction practices. Lastly, the influence of fog seal and geosynthetic
fabric on chip seal performance is investigated.
4.1 CHARACTERIZING OKLAHOMA CHIP SEAL AGGREGATE
A Project Panel was formed that consisted of members from the chip seal community,
including members of ODOT, aggregate and binder suppliers to assist the research
team in the selection of commonly used cover aggregates and binders to be
characterized. Among other factors, type, demographic distribution and suppliers were
considered in the materials selection, and the actual number of sources was guided by
the input of the Project Panel. Bulk aggregate and binder samples were collected in
cooperation with the Project Panel members and the suppliers. The aggregate samples
were obtained from the following quarries (locations illustrated in Figure 4.1):
1. Dolese Cooperton (limestone),
2. Hanson Davis (rhyolite),
3. Martin Marietta Mill Creek (granite),
4. Dolese Hartshorne (limestone) and
5. Kemp Stone Pryor (limestone).

33
Figure 4.1 Study Aggregate Sources – (1) Dolese-Cooperton, (2) Hanson-Davis, (3) Martin Marietta-Mill Creek, (4) Dolese-Hartshorne and (5) Kemp Stone-Pryor Additionally, aggregate was obtained from Dolese Davis in Year 2 of the research when
it was identified as being the aggregate source for the test sections based upon cost
and gradation availability.
Emulsion (CRS-2S) samples were gathered from ERGON Lawton and Coastal
Missouri. CRS-2 is the most common chip seal binder used in the US, including
Oklahoma [3], and was identified by the Project Panel for inclusion in this study. “CRS”
designates the material as being a cationic rapid set emulsified asphalt; the “2” in “2S”
refers to a specified viscosity and the “S” denotes the source as being a soft base
asphalt. CRS-2S is non-polymer modified, so it is best used on roads with low traffic
volumes.
Aggregate characterization tests were conducted at the Broce Laboratory and Binders
Laboratory located at The University of Oklahoma. The aggregate samples were first
characterized using sieve analysis. The durability of selected cover aggregates was
evaluated using Los Angeles Abrasion (AASHTO T 96) and Micro-Deval (AASHTO T
327) tests. Shape and texture-related index properties were assessed using AIMS
(AASHTO TP81-10).
3
34
Recently, some issues have been raised concerning the influence of ambient light on
the texture index [49]. Reference aggregates selected from a national level round robin
study available at the Texas Transportation Institute (TTI), were used to ensure
consistency of AIMS results. TTI owns a new generation AIMS (hereafter referred to as
AIMS2). The research team compared results for selected aggregates obtained from
the OU AIMS (hereafter referred to as AIMS1) with those from the AIMS2. Dr. Dallas
Little with TTI conducted the AIMS2 testing. Results were comparable when comparing
natural aggregate.
The research team also sent aggregate samples identified for this study to TTI for
comparison. A selective size (passing ½ in (12.5mm) and retained on 3/8 inch (9.5
mm)) of aggregate from two sources, Dolese Cooperton and Hanson Davis, were
tested. The surface properties (angularity, 2D form, and texture) were compared with
those obtained from the AIMS2. Furthermore, the same samples were tested by two
independent operators at OU (OU-OP1-JA and OU-OP1-ZH) by using the AIMS1
device to ensure repeatability. The AIMS1 results were validated by the AIMS 2 and
multiple operators for angularity and form, as evidenced by the comparability illustrated
in Figure 4.2.
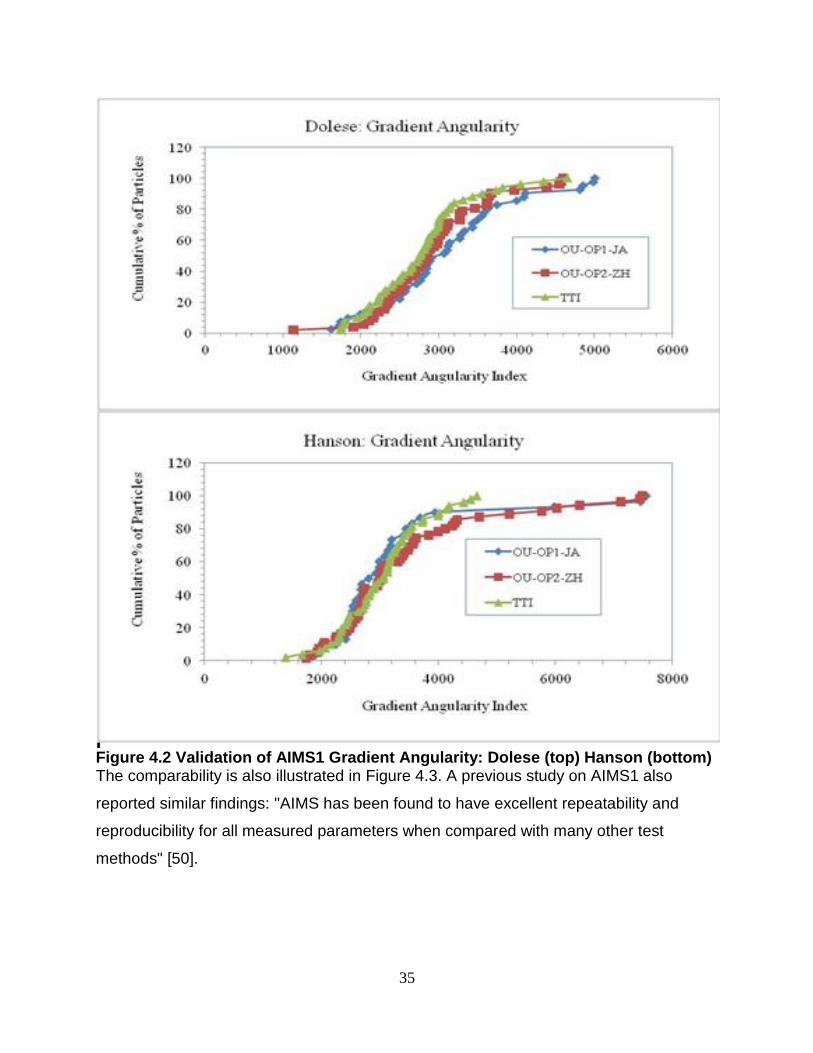
35
Figure 4.2 Validation of AIMS1 Gradient Angularity: Dolese (top) Hanson (bottom) The comparability is also illustrated in Figure 4.3. A previous study on AIMS1 also
reported similar findings: "AIMS has been found to have excellent repeatability and
reproducibility for all measured parameters when compared with many other test
methods" [50].

36
Figure 4.3 Validation of AIMS1 2D Form: Dolese (top), Hanson (bottom) However, a statistically significant difference in the measured texture indices was
observed between AIMS1 and AIMS2. A recent study by Texas Transportation Institute
researchers [51] reported similar findings, “AIMS1 to AIMS2 2D-Form, Angularity, and
Dimensional ratios required no adjustments. The AIMS2 texture value required
adjustment to match the AIMS1 texture.” This is partly due to the fact that the texture
measurement process is highly dependent on ambient light intensity. The backlight of

37
the tray must be kept in OFF mode and the rim (top) light should be kept in the ON
mode while capturing images for texture analysis to reduce variability. However, it
should be noted that AIMS1 and AIMS2 texture index values may differ. The trend
noted in this study is that the texture index obtained from AIMS2 is higher than that
obtained from AIMS1.
Light intensity may be an issue with AIMS results, especially with synthetic aggregates
or light-colored natural aggregates. It can be noted that Pine Instrument Company, the
AIMS manufacturer, recommends the light intensity range of images be from 165 to 175
cd. While capturing images for texture analysis for this study, light intensity will be
maintained at the recommended level for all 56 particles and any images outside of the
recommended range will be discarded.
Texture indices vary between two operators using the same AIMS1 device. This is
partly due to the fact that the layouts (orientations) of specimens on the testing tray
were random and the texture index of one face of a particle can be different from that of
the opposite or another face. Therefore, for this study, the same set of aggregates with
random payout will be tested at least three times and the average of the measured
indices will be reported.

38
Figure 4.4 Validation of AIMS1 Texture: Dolese (top), Hanson (bottom) Figure 4.4 illustrates the variance in texture indices. 4.2 DETERMINING OKLAHOMA AGGREGATE-BINDER COMPATIBILITY
Currently, there is no standard sample preparation or testing procedures for measuring
contact angles of aggregates/aggregates coated with binders with Sessile Drop for the
39
purpose of determining aggregate-binder compatibility. However, under an OkTC
project (OTCREOS10.1-06), the research team has successfully developed guidelines
that provide meaningful and reproducible results that are consistent with the results
from other devices (e.g., Wilhelmy Plate (WP), Universal Sorption Device (USD)).
Details of the test procedures are given by Bulut et al. [33].
The Sessile Drop (SD) device available at Oklahoma State University was used to
characterize the aggregate-binder compatibility of materials identified by the Project
Panel. Three samples of each of the five aggregate sources were obtained from the
quarries. Although aggregate samples came from the same source, differences in
texture and color were noted in some of the samples. The exception was Dolese
material from the Hartshorne Quarry, which visually appeared similar. Therefore, the
number of samples tested for each source was based upon exhibited differences and is
listed in parentheses as follows:
Dolese – Cooperton (3),
Hanson – Davis (2),
Martin Marietta - Mill Creek (3),
Dolese – Hartshorne (1), and
Kemp Stone – (2).
The samples which were cut with thicknesses varying from 1 cm to 2 cm using a Hill
Quist mechanical hacksaw. Then the samples were polished consecutively using 220
(66-µm), 320 (34.3-µm) and 400 (22.1-µm) silicon carbide grits on a polishing device
which rotates mechanically for approximately 15 min each. Then the samples were
polished using 600 (14.5-µm) and 1000 (9.2-µm) silicon carbide grits followed with 5
micron alumina oxide powder on a glass plate for about 20 min each. After samples
were polished, they were cleaned with hexane or octane, then with a mixture of soap
and warm water, and finally rinsed with water. Octane is used on Sample 1 and Sample
2 of Miller-Creek Granite, Sample 2 of Pryor Stone Limestone and Sample 2 of Hanson
Davis Rhyolite because hexane was not available when taking measurements on those
samples. Octane and hexane are two chemicals with same characteristics and can be
used for cleaning process on aggregates without any adverse effects to their chemical

40
structure, as suggested by Dr. Wilber Gregory of Environmental Engineering in
Oklahoma State University. The samples were kept in an oven at a temperature of
110oC for 12 hours for drying. Then, samples were kept in a desiccator for 12 hours for
cooling to the testing temperature. The numbers of sets of measurements as given in
the tables in the Results section were taken in consecutive days maintaining the 12
hours of oven and 12 hours of cooling process. One of the prepared samples is shown
in Figure 4.5.
Figure 4.5 Prepared sample from Dolese Cooperton (limestone)
Both WP and USD are available at OU and were used selectively for Sessile Drop
results validation purposes. Universal Sorption Device (USD) is a gravimetric sorption
device designed for water and organic vapor sorption studies of materials. This
technique works based on the development of a vapor sorption isotherm, i.e. the
amount of vapor adsorbed, or desorbed, on the solid surface at a fixed temperature and
partial pressure. The range of relative pressure (RP) can be designed from 0.02 to 0.98
and temperatures from 5 to 60°C. At each relative humidity (RH) or pressure step, the
system controls the RH or RP and monitors sample weight until it reaches equilibrium
41
conditions. Sample weight, temperature, and RH or RP are recorded in a data file at
user defined intervals. Identical conditions of temperature and humidity for a sample
and a reference are achieved by using a symmetrical two-chamber aluminum block. To
achieve research quality data, the critical components of the system, microbalance,
aluminum block, and humidifier sections are thermostatically separate. Sample weight
changes are recorded using a microbalance. The SFE components of selected
aggregate(s) in this study were determined using a USD and applying the methodology
discussed by Bhasin and Little [32]. The probe vapors of known SFE components,
namely water, n-hexane, and methyl propyl ketone (MPK) were used to determine
adsorption isotherms. Thereafter, based on the adsorption isotherms, SFE components
of each tested aggregate were determined. To prepare aggregate samples for testing,
aggregates were crushed from rock samples. The portion passing No.4 and retained on
No. 8 sieves was selected and washed several times with distilled water to obtain a
dust-free and clean aggregate surface. Then the aggregate was oven dried at 120°C for
12 hours and allowed to cool to room temperature in a desiccator sealed with silica gel.
About 20 grams of aggregate was used to conduct one USD test. The test was
repeated three times using each probe vapor to ensure consistency of the results.
Although asphalt cement SFE determination is found in literature, no specific testing
protocol exists for determining the surface free energy values of emulsion. Therefore,
the research team developed these methodologies for determining emulsion SFE so
that compatibility ratios could be calculated and aggregate-binder compatibility could be
determined. Specifically, the Good-van Oss-Chaudhury (GVOC) approach was followed
by using liquid probes, shown in Table 4.1, to facilitate determination of the surface free
energy (SFE) components of the CRS-2S asphalt emulsion. The GVOC approach or
acid-base theory has been widely used in various disciplines for the calculation of SFE
components of polymers, colloids, asphalt binders, and aggregates [32,34,35,52-55].

42
Table 4.1 Surface energy components of liquid probes [54]
Liquid Probe
Total
LW
AB
-
+
(ergs/cm2 or mJ/m
2)
Water 72.80 21.80 51.00 25.50 25.50
Di-iodomethane 50.80 50.80 0.00 0.00 0.00
Ethylene Glycol 48.00 29.00 19.00 1.92 47.00
Glycerol 64.00 34.00 30.00 57.40 3.92
Formamide 56.00 39.00 19.00 39.60 2.28
The methodology for testing asphalt binder specimens has been modified for testing the
CRS-2S asphalt emulsion for contact angle measurements using the SD method. The
following testing protocol was followed:
In order to obtain a homogeneous mixture of the emulsion sample, the asphalt
emulsion container was shaken vigorously.
The asphalt emulsion sample was then poured into a small canister.
A plain microscopic glass slide with 76 mm x 25 mm x 1 mm dimensions was
dipped into the asphalt emulsion for a few seconds and then held out of the
canister for another few seconds to allow excessive liquid to drop off the glass.
This process was repeated two times, when necessary, to obtain a flat and
smooth surface area of the asphalt emulsion on the glass surface. This resulted
in a glass slide with a film thickness about 1 mm of asphalt emulsion with a
smooth surface being obtained.
Since the viscosity of the CRS-2S asphalt emulsion is not high enough for the
probe liquid drops to form finite contact angles, the asphalt emulsion covered
glass slides were kept either in a desiccator or exposed to open-air at the room
temperature for varying hours (2, 4, 6, 8, and 24 hours) for sample conditioning,
curing and drying before performing the direct contact angle measurements.

43
For this study, 42 asphalt emulsion glass slide specimens were prepared. Half of
the specimens were kept in a desiccator and the other half were kept in the open
air until they gained enough viscosity for contact angle measurements.
The contact angle measurements were also performed on asphalt emulsion specimens
with different film thicknesses of about 2 mm (double layered) and 3 mm (triple layered)
glass slide specimens. These specimens were prepared following the same protocol for
single layered (about 1 mm film thickness) asphalt emulsion samples described in the
preceding section.
Once the single layered specimen is obtained, it is kept at the room temperature
for 30 minutes in order to gain some viscosity from drying.
The sample is then dipped into the canister filled with asphalt emulsion one more
time.
Hence another layer of asphalt emulsion is added on the surface of the glass
slide.
After waiting 30 more minutes, the above process was repeated if the triple
layered asphalt emulsion specimen was needed.
The testing protocol for contact angle measurements using the SD device on asphalt
emulsion samples is identical to the testing protocol for asphalt binders and it is given
below. The contact angle measurements were conducted on single layered (about 1
mm film thickness) asphalt emulsion specimens after 2, 4, 6, 8, and 24 hours of setting,
curing, and drying. After taking six consecutive contact angle readings on each slide
with one probe liquid, the slide was disposed. For each time interval, three specimens
were tested with three different probe liquids namely; water, di-iodomethane (methylene
iodide), and ethylene glycol. The measurements on the double and triple layered
specimens were obtained after a 2-hour waiting period. A brief explanation of the testing
protocol is given below:
The SD device is calibrated before each testing set according to standard
protocol.

44
The syringe that contains the probe liquid was refilled before the test. When a
different probe liquid was used, the syringe was either replaced or cleaned
thoroughly.
Once the device was calibrated and the samples were at the testing temperature
(at room temperature), the specimen was placed under the needle attached to
the syringe in the automated pump system of the SD device.
About 5 μL of probe liquid was dispensed on the specimen from the needle using
the FTA software in the SD device system.
While the liquid was still in the form of a pendant drop, the platform that holds the
specimen was elevated slowly until the specimen touches the drop.
The drop detaches from the needle and forms the sessile drop on the flat surface
of the specimen.
The high resolution camera constantly captures the images of the liquid-solid
interface and sends it to the software for processing. The number of the images
per second and test duration, if needed, can be adjusted from the software. In
this study, three images per second were used. The time period for a single test
was about 15 seconds.
Finally, the software processes each image and determines the average contact angles.
The testing protocols for contact angle measurements on the single, double, and triple
layered asphalt emulsion specimens are identical.
4.3 EVALUATING PUC APPLICABILITY
Performance-based uniformity coefficient (PUC) was used to determine gradations for
single size (SS) chip seal test section design. Chip seal test sections were constructed
for the purpose of evaluating the PUC concept using surface texture performance
indicators.
4.3.1 PUC-Based Gradation and Test Section Development
Several (at least three) gradations were selected within the gradation range of the
specification (e.g., CA #3) with the same median “M” value for each gradation. Each

45
“PEM” and “P2EM” of the selected gradations was obtained from the respective percent
passing that correspond to 0.7M (bleeding line) and 1.4M (aggregate loss line). Figure
4.6 shows a graph of ½” gradation possibilities generated for this study based upon the
PUC concept. The figure indicates that the G2 gradation is expected to minimize both
bleeding and aggregate loss. A similar plot for the aggregates selected for this study
and the gradations in current ODOT specifications will show where changes in the
current specifications are needed most. Also, these results will be helpful to ODOT
maintenance engineers in tweaking cover aggregate gradations for future chip seal
projects to enhance chip seal performance.
Figure 4.6 Bleeding and Aggregate Loss Values for Three ½” Gradations
0
5
10
15
20
25
30
35
40
8.00 8.50 9.00 9.50 10.00 10.50 11.00 11.50
Ble
edin
g o
r A
ggre
gat
e L
oss
(%
)
Median Size (mm)
1/2"-G1 1/2"-G3 1/2"-G2

46
Table 4.2 shows the PUC values based upon the bleeding and aggregate loss values
for gradations in Figure 4.6. The lowest PUC is desirable. Therefore, Gradation 2 (G2:
PUC=0.11) is the gradation that is expected to make the greatest contribution to chip
seal performance and is the gradation for Test Section 5.
Table 4.2 PUC Values for ½” Gradations
Aggregate Type
Median Size (mm)
Bleeding (%)
Aggregate Loss (%)
PUC
1/2"-G1 9.07 18.5 0 0.185
1/2"-G2 10.63 11.32 0 0.11
1/2"-G3 11.30 13.31 1.54 0.14
The same process was conducted for the 3/8” gradation as well. Unfortunately, the
aggregate supplier that supplied the PUC-based gradations did not produce the PUC-
based 5/8” gradation. The test sections with PUC-based gradations are shown in
columns 4 and 5 in Table 4.3.
Table 4.3 Test Section Gradations
Common ODOT Gradations Single Size Gradations
TS 1 & 1s
#2 (3/8”)
TS 2 & 2s
(1/2”)
TS 3 & 3s
3C (5/8”)
TS 4 & 4s
#2-G2 (3/8”SS)
TS 5 & 5s
½”- G2 (SS)
Sieve # LL UL LL UL LL LL UL UL LL UL
1 in
7/8 in
3/4 in
5/8 in 100 100 100
1/2 in 100 95 100 70 100 100 95 100
3/8 in 90 100 60 80 20 55 95 100 15 40
1 /4 in 15 35
No. 4 0 25 0 5 0 15 0 5 0 5
No. 8 0 5 0 2 0 5 0 2 0 2
No.
200
0 2 0 2
4.3.2 Test Section Construction
In cooperation with ODOT Division 3, fourteen new chip seal test sections were
constructed on a 7-mile segment of Highway 39 (2300 ADT) west of Purcell, Oklahoma,

47
that was scheduled to receive a maintenance chip seal. Test section performance
comparison requires uniform test sections. Therefore, the project eliminated as many
ancillary factors as possible. The sections were placed in the eastbound lane of travel
with care to avoid major turning motions at intersections and driveways. To ensure
uniformity, the sections were also designed as full lane-width sections to not
inadvertently create an uneven driving surface.
Figure 4.7 shows the layout of the field test sections. Each test section (gradation
section) is 1 mile in length, of which ½ mile includes fog seal (SS-1). The exceptions are
found in the fabric sections, which contain two different gradations in ½ mile sections
and of each, ¼ mile sections were to receive fog seal, but CRS-2S was mistakenly
applied to the surface of the chip seal. The test section numbers correlate with the
gradation numbers found in Table 4.3. Specifically, the fabric sections contain
gradations 1 and 3 (ODOT 3/8-inch and 5/8-inch NMAS, respectively).
Test section designations denote inclusion or exclusion of fog seal and fabric. For
example, “TS 1” designates a 3/8” NMAS Chip Seal (gradation 1). “TS 1s” designates
the same chip seal, but with fog seal (“s”). “TS 1f” designates the same chip seal
without fog seal, but with geosynthetic fabric (“f”). Finally, “TS 1sf” would designate a
gradation 1 chip seal with both fog seal and fabric. Permanent markers were installed to
demarcate test sections with these designations.
Figure 4.7 Chip Seal Test Section Layout

48
The aggregate source for the test sections was Dolese Davis. Researchers verified by
sieve analysis that the proposed single size gradations based upon PUC evaluation
corresponded to actual test section gradations. The researchers also verified that the
initial evaluation of PUC was still applicable. The emulsion (CRS-2S) source was
ERGON-Lawton. Shot rates were consistent with supplier recommendations and are
noted in Table 4.4.Two of the test sections constructed included TenCate paving fabric
(MPV-500) installation over PG 64-22 OK (Source: Vance Bros. in Oklahoma City).
ODOT Division 3 installed the chip seal in September 2012. Fog seal was applied two
weeks after construction as weather permitted.
Table 4.4 Chip Seal Test Section Shot Rates
Test Section Aggregate Shot Rate
(lb/SY) Emulsion Shot Rate
(gal/SY)
1 & 1s (Gradation 1) 22.5 0.275
2 & 2s (Gradation 2) 26.5 0.319
3 & 3s (Gradation 3) 28 0.420
4 & 4s (Gradation 4) 26 0.329
5 & 5s (Gradation 5) 28 0.429
Vance Bros. contributed binder and paving fabric installation, as shown in Figure 4.8.
TenCate contributed paving fabric and had two representatives on site.
Figure 4.8 Geosynthetic (Paving) Fabric Being Installed in Test Sections

49
Prior to construction, baseline pavement measurements were obtained for the purpose
of characterizing the existing substrate. Measurements included microtexture (skid),
macrotexture (sand circles), falling weight deflectometer (FWD) and rutting
measurements (Dipstick Device). A road that exhibits structural distress will eventually
result in cracks being reflected through the new chip seal, therefore FWD testing was
conducted to determine the structural condition of the pavement. Additionally, rutting
causes the emulsion to flood the wheel paths and creates an uneven distribution of
binder across the lane. The extra binder left in the wheel paths will contribute to early
flushing and be measurable by a loss of skid numbers. This is a lesson learned from the
OkTC project. The literature shows that international chip seal design procedures use
average rut depth as an input variable in selecting the gradation and top size of the
cover aggregate. The general rule is that the deeper the rut, the larger the average least
dimension of the cover aggregate. OTCREOS7.1-16 did not make these measurements
and one of the chip seal test sections failed prematurely [4]. Since it was the test section
that had the smallest top size aggregate, the failure may have been due to the ruts
being deeper than the dimension of the stone. Adding this to the field test protocol
permitted the research team to make an informed recommendation as to whether or not
ODOT should include average rut depth in its chip seal design procedure.
Consistent with pavement preservation requirements, the condition of the existing
Highway 39 pavement section make it an ideal candidate for pavement preservation
treatment application, like chip seal. Baseline measurements using all four tests were
taken at the same locations (as close as possible) so that future performance
measurements (via sand circles) could be compared with baseline condition. The
testing revealed that the substrate is structurally sound, with only surface issues, like
cracking and some isolated, but minimal, rutting.
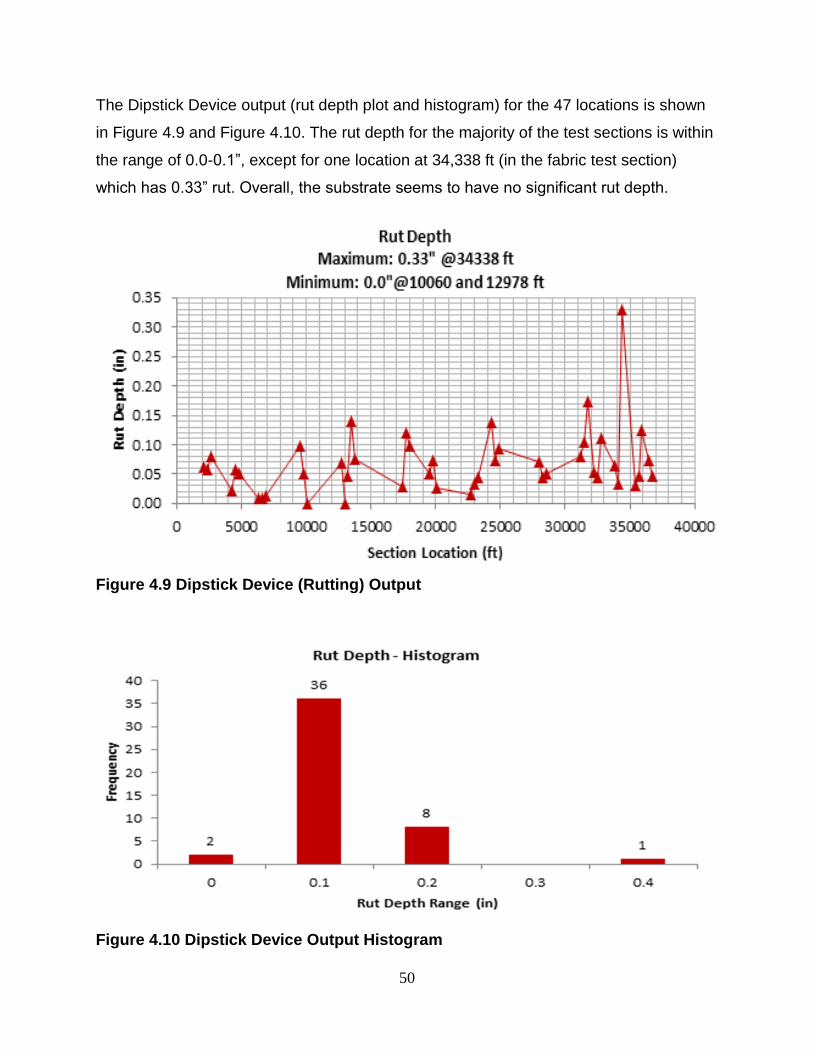
50
The Dipstick Device output (rut depth plot and histogram) for the 47 locations is shown
in Figure 4.9 and Figure 4.10. The rut depth for the majority of the test sections is within
the range of 0.0-0.1”, except for one location at 34,338 ft (in the fabric test section)
which has 0.33” rut. Overall, the substrate seems to have no significant rut depth.
Figure 4.9 Dipstick Device (Rutting) Output
Figure 4.10 Dipstick Device Output Histogram

51
The baseline Falling Weight Deflectometer (FWD) measurements were taken
approximately every 250 feet throughout the test section locations. Post-construction
FWD measurements were obtained and show that the chip seal made no considerable
contribution to the structural capacity of the pavement, as expected and further
supporting its classification as a pavement preservation treatment. Figure 4.11 shows
the similar pre- and post-construction results.
Figure 4.11 FWD Results, Pre- and Post-Construction (Chip Seal)
4.3.3 Surface Texture Measurement
An attempt has been made to obtain microtexture and macrotexture measurements on
a monthly basis during the testing period of October 2012 – September 2013. The chip
seal test sections all have the same level of traffic, same environmental conditions, and
were installed by the same construction crew with the same equipment. This furnishes a
direct comparison that involves only the variables of interest in this project.

52
The two tests being performed on each test section monthly to facilitate performance
evaluation:
1. Microtexture (ASTM E274)
2. Macrotexture (TNZ3 Sand Circle).
To reduce variability in monthly measurements, the research team identified the
locations of the baseline measurements and marked them with PK nails and landmarks
so that sand circle testing occurs as close to the same locations as possible. Photos
were also taken for future locating reference.
The purpose of obtaining surface texture measurements on this project was to facilitate
the creation of deterioration models to compare the performance of PUC-based and
non-PUC-based chip seal test sections. However, linear regression could not be
appropriately applied to the field trial microtexture and macrotexture data due to
insufficient data. Therefore, the researchers are unable to approximate the
deterioration rate and extrapolate the remaining service life of each treatment, which
has been found to yield high R2 values when applied to chip seal [56].
Insufficiency in microtexture (skid number) data points was due to the lack of availability
of the ODOT Skid Tester. The tester was in the shop for maintenance for two of the
twelve testing period months. The tester was later rear-ended (non-project related) and
was unavailable for an additional five months. Because of this, only 5 data points were
obtained for each of the test sections, which is not enough to adequately support neither
statistical significance nor deterioration models. Therefore, limited analysis could be
completed. The failure point considered for microtexture was a skid number less than
25.
A logarithmic equation has been shown to model chip seal deterioration, on the basis of
macrotexture, over the service life well [56]. The deterioration at this point in the service
life of the study test sections is not well modeled by the logarithmic equation since the
data has not started to “level off”, due to variables such traffic levels and weathering,
etc. Applying the logarithmic equation on the current data results in a premature

53
“leveling off” of the deterioration rate and subsequently yields unreasonably long service
life estimates (i.e. 20+ years).
Therefore, New Zealand’s P/17, Notes for the Specification of Bituminous Reseals [45],
which is a performance specification, was used to evaluate test section performance on
the basis of macrotexture. The philosophy behind the P/17 specification is that the
texture depth after twelve months of service is the most accurate indication of the
performance of the chip seal for its remaining life. The New Zealand specification also
contends, “the design life of a chip seal is reached when the texture depth drops below
0.9 mm (0.035 inches) on road surface areas supporting speeds greater than70 km/h
(43 mph)” [45]. The deterioration models developed in New Zealand have directed the
P/17 Specification to require a minimum texture depth one year after the chip seal is
completed, as calculated by using Equation 14.
Equation 14
Where: Td1 = texture depth in one year (mm)
Yd = design life in years
ALD = average least dimension of the aggregate (mm)
Chip seal macrotexture performance will be assessed using Equation 14 and design life
values of 4, 5 and 6 years, consistent with ODOT survey and literature [4].
The newly constructed chip seal sections on Highway 39 were first tested in October
2012 after one month of service. For macrotexture measurement, three sand circles
were taken on the outside wheel path and averaged together to eliminate any
irregularities caused due to slight variations in the test location. Macrotexture on all
sections increased from the baseline measurements, as expected because chip seal
increases macrotexture. The baseline measurement was conducted on asphalt
pavement, which only exhibits microtexture.

54
Seventy existing-substrate microtexture measurements were taken with: a ribbed tire
(mean skid number = 45.8, sd = 3.15) and a smooth tire (mean skid number = 39.1, sd
= 4.68), showing that the existing asphalt pavement exhibited adequate skid resistance.
Post-construction measurements were taken to obtain a ribbed tire measurement (mean
skid number = 41.5, sd = 4.95) and a smooth tire measurement (mean skid number =
41.8, sd = 5.16) showing that the chip seal did not significantly alter skid resistance.
Microtexture was measured on the outside wheel path by the ODOT skid truck. Five
ribbed tire measurements and five smooth tire measurements have been obtained for
every test section each month when possible. The five skid numbers resulting from the
respective tests were averaged to eliminate any irregularities due to slight variations in
the test location and provide data for a given test section.
As part of OTCREOS7.1-16, four chip seal test sections were constructed on Highway
77 in Norman [4]. The performance of these chip seals was being monitored using field
observations and testing as part of Phase II of OTCREOS9.1-21, which has completed
[56]. With ODOT assistance, field testing and performance monitoring of these test
sections was to continue on a quarterly basis for two years so that the results could be
correlated with chip seal performance. However, test results have not been provided by
ODOT so no analysis can be completed.
4.4 DOCUMENTING OKLAHOMA CHIP SEAL CONSTRUCTION PRACTICES
ODOT Division 3 indicated that a careful documentation of the chip seal construction
procedures would add value to this research. Therefore, a constructability review of the
chip seal test section construction practices was conducted. Additionally, other ODOT
Divisions participated by sharing common chip seal construction practices used in their
regions. NCHRP Synthesis 342: Chip Seal Best Practices was reviewed [3] and a
checklist was created, augmented with the 2009 ODOT specifications, to assist
researchers in conducting the constructability review.
The review has identified those construction factors that impact chip seal performance
but cannot be specified by other means. Information was collected regarding the chip

55
sealing equipment to determine its state of maintenance, equipment-related factors
such as roller tire pressures before, during and after construction, and the number of
times the aggregate is handled between the pit and the road. The exact steps taken by
the chip seal crews to prepare the substrate, install the chip seal, roll the section,
broom, and timing of various events in the construction process was noted. Moreover,
the review evaluated the traffic control methods used and the age of the seal when
traffic control is removed. The purpose of this type of analysis was to find those
construction factors that support good chip seal performance and identify the means
and methods that allow ODOT to replicate success.
4.5 INVESTIGATING FOG SEAL AND GEOSYNTHETIC FABRIC CONTRIBUTION
Fog seal (slow setting emulsion: SS-1) was obtained from Vance Bros. in Oklahoma
City and applied to half of each chip seal test section two weeks after construction, as
shown in Figure 4.12. Fog seal is a pavement preservation treatment option [57,58] that
is essentially “a light spray application of dilute asphalt emulsion” [59].
Figure 4.12 Fog Seal Application to Chip Seal Test Sections
56
Aggregate loss is a failure criterion associated with chip seal [2] that may be mitigated
by applying fog seal to the chip seal surface, whereby maintaining macrotexture [38].
Although performance information is limited, fog seals have been found to enhance
short-term pavement performance [58], but have not been shown to enhance skid
resistance or slow surface deterioration over the long term and more research is
needed [58,60,61,62]. Therefore, this research conducted surface texture testing to
determine the efficacy of fog seal on the chip seal test sections.
The fabric section mistakenly received CRS-2S emulsion instead of fog seal. Some
agencies use CRS instead of SS-1 on the surface of chip seal to retain aggregate.
However, this adds another variable in the test sections that will have to be considered
when comparing fabric sections to non-fabric sections.
On the day of test section construction, geotextile fabric was installed in two of the test
sections. MPV-500 paving fabric was installed over PG 64-22 OK on the existing
pavement, then rolled with a pneumatic-tire roller before the chip seal was installed.
Paving fabric under chip seal can mitigate reflective cracking and water penetration to
protect the underlying pavement and extend its service life, yielding a lower life cycle
cost than a traditional chip seal [63]. The use of paving fabric in chip seal systems is a
common and effective practice in New Zealand and Australia; however there are mixed
results reported in US applications [3].

57
5.0 LABORATORY TEST RESULTS AND ANALYSIS This section reports current results and provides analysis for laboratory testing,
including chip seal aggregate characterization and aggregate-binder compatibility.
5.1 AGGREGATE CHARACTERIZATION RESULTS AND ANALYSIS
The aggregate samples collected from the various quarries identified in Phase I of the
research were characterized using sieve analysis, the Los Angeles abrasion test, the
Micro-Deval abrasion test and AIMS1. Additionally, the test section aggregate obtained
from Dolese Davis in Phase II of the research was characterized using sieve analysis
and AIMS1. This section provides the results and analysis regarding aggregate
characterization. These results allow comparison between aggregate sources.
Additionally, they provide insight into chip seal test section performance.
5.1.1 LA Abrasion and Micro Deval Results
LA Abrasion and Micro-Deval tests were conducted on the five aggregate sources
identified in Phase 1 of the research. These tests provide insight into the impact
resistance and abrasion resistance of aggregate. Ideally, chip seal aggregate that is
more resistant to abrasion is less likely to be adversely impacted by handling between
the quarry and the road project. Aggregates results are shown in Table 5.1.
Table 5.1 LA Abrasion and Micro-Deval Results
Quarry Aggregate Type LA Abrasion Micro-Deval
Hanson-Davis rhyolite 11% 7.6%
Dolese-Cooperton limestone 18% 10.1%
Dolese-Hartshorne limestone 13% 10.7%
Martin Marietta-Mill Creek granite 19% 0.3%
Kemp Stone-Pryor limestone 21% 22.8%
ODOT specifies a percent loss of less than or equal to 40% on LA Abrasion. Therefore,
the values are within specification. While ODOT does not specify Micro Deval for chip
seal cover aggregate, it does use a standard of less than or equal to 25% allowable
percentage loss for other applications (such as Superpave). The corresponding LA
58
abrasion test specification in these applications is either less than or equal to 30% or
40% depending on the aggregate’s use.
It should be noted that previous studies have shown that no correlation exists between
LA Abrasion and Micro-Deval test results, which is also supported by this study. The
rhyolite from Hanson and the granite from Martin Marietta were expected to be more
resistant to impact and abrasion than the limestone from the other three sources. While
this stands true for Micro Deval, the LA Abrasion returned a different result. The Micro
Deval results show that the Dolese limestone was similarly resistant to abrasion as the
rhyolite. The relative ranking between the sources reveals that the Hanson Davis
aggregate was the most impact resistant sample and the Kemp Stone aggregate
sample was the least. It also shows that the Martin Marietta sample was the most
resistant to abrasion while the Kemp Stone sample was the least.
5.1.2 AIMS Results
Research by McLeod [2] showed that aggregate shape was a key factor in chip seal
performance. Since the technology to efficiently measure and characterize particle
shape did not exist, McLeod developed failure criteria based on the ratio of aggregate
retained weights to the median particle size (the 50% passing sieve size). Lee and Kim
[10] built on McLeod’s concepts and proposed a metric called the Performance-Based
Uniformity Coefficient (PUC). Their work was based on the premise that the “perfect”
particle shape was a cube. As the stone shape becomes more elongated, the chance
that it will not be properly embedded (defined as less than 50% by Lee and Kim)
increases. Additionally, if the percent of particles less than the median particle size is
greater than those that are greater than the median particle size, the potential for
flushing or bleeding increases [10]. The AIMS technology now provides the ability to
quantify particle shape that McLeod did not have in 1962 and hence, this research
builds on the work done by Lee and Kim by adding the AIMS output to the suite of chip
seal performance indicators.

59
5.1.2.1 AIMS1 Results - Quarries
The AIMS properties for the 3/8” aggregate from each of the six quarries are compared
in this section to determine (1) relative differences between sources and (2) if any
correlations exist between laboratory tests. See Appendix C for all analyses.
High angularity in aggregate can enhance chip seal performance. It increases surface
area, which promotes adhesion between the binder and the aggregate. Additionally, the
previous OkTC study [6] found that skid number is related to aggregate gradient
angularity. In AIMS analysis, it was found that increasing aggregate gradient angularity
tracked with increasing skid number [6]. Table 5.2 shows the descriptive statistics for
the AIMS1 gradient angularity output for the aggregate sources.
Table 5.2 AIMS1 Gradient Angularity: Descriptive Statistics for 6 Quarries
AIMS1 Output: Gradient Angularity, 3/8” Aggregate
Quarry
Sample
Size
(N) Mean
Standard
Deviation
(Pooled: 1374)
Min.
Value
Max.
Value
Hanson - Davis 56 3370 1492 364 8472
Dolese - Cooperton 52 2992 900 1133 6545
Dolese - Hartshorne 85 3623 1613 1851 9400
Martin Marietta – Mill Creek 99 3571 1588 795 9926
Kemp Stone - Pryor 111 3040 1019 1458 7750
Dolese – Davis 51 3332 1434 838 7930
60
The gradient angularity data obtained from Sample 1 testing (N = 56, approx.) is
graphically depicted in Figure 5.1 and numerically expressed in Table 5.3. Most of the
indices for the tested particles from the aggregated results fall within the range of 1800
to 5000, with the bulk of the particles considered to be sub-rounded as classified by
AIMS.
Figure 5.1 AIMS1 Output for Gradient Angularity (3/8” Aggregate, Sample 1) The analysis of variance showed that there was a statistically significant difference (p =
0.011) between the Kemp Stone (more rounded) and Dolese Hartshorne (more angular)
material based upon a 95% confidence interval (Tukey’s Method). Table 5.3 shows that
25% of the Dolese Hartshorne material was considered sub-angular and angular,
versus 5% for Kemp Stone.
Table 5.3 AIMS1 Gradient Angularity Classification for 6 Quarries (Sample 1)
Quarry
Rounded
(< 2100) Sub-Rounded
(2100-4000) Sub-Angular
(4000-5400) Angular
(> 5400)
% in Range
Hanson - Davis 12 66 11 11
Dolese - Cooperton 11 81 6 2
Dolese - Hartshorne 5 70 21 4
61
Quarry
Rounded
(< 2100) Sub-Rounded
(2100-4000) Sub-Angular
(4000-5400) Angular
(> 5400)
Martin Marietta – Mill Creek 10 74 6 10
Kemp Stone - Pryor 11 84 3 2
Dolese – Davis 14 70 6 10
Based upon these results, Dolese Hartshorne material may provide better adhesion with
the binder and better skid resistance than the Kemp Stone aggregate.
Micro Deval results have been shown to correlate with AIMS results. In this case, the
Dolese Hartshorne material has the greater resistance to impact and abrasion and also
has the highest percentage of sub-angular/angular particles. Therefore, the material
from this source may experience less degradation between the pit and the road than the
Kemp Stone material.
Sphericity is a relative measure of aggregate shape with the greatest value denoting a
cubical particle, the desired cover aggregate shape. Since the purpose of the cover
aggregate is to protect the bituminous seal from traffic wear, a high sphericity index is
desirable. This is based on the need for a consistent size particle to ensure that the
majority of the cover aggregate particles have a least dimension greater than the
embedment depth. During rolling, the individual particles are reoriented to their least
dimension and embedded in the binder [18]. If proper embedment is achieved, the
probability of premature loss of aggregate is minimized. It is also fundamental to the
PUC concept because it reduces bleeding and flushing. In addition to orientation of the
embedded chip being important, cubical aggregate shapes are preferred because traffic
does not have a significant effect on the final orientation of aggregate [28]. Cubical
materials tend to lock together and provide better long-term retention and stability.
Table 5.4 provides the descriptive statistics for sphericity data resulting from AIMS
testing of the samples from the various aggregate sources.

62
Table 5.4 AIMS1 Sphericity I: Descriptive Statistics for 6 Quarries
AIMS1 Output: Sphericity I, 3/8” Aggregate
Quarry
Sample
Size Mean
Standard
Deviation
(Pooled: 0.1011)
Min.
Value
Max.
Value
Hanson - Davis 49 0.5398 0.0838 0.3720 0.7580
Dolese - Cooperton 52 0.6383 0.0968 0.3390 0.8680
Dolese - Hartshorne 94 0.6875 0.1128 0.2890 0.8850
Martin Marietta – Mill Creek 105 0.7228 0.1046 0.3030 0.9680
Kemp Stone - Pryor 105 0.6688 0.0974 0.3960 0.8860
Dolese – Davis 50 0.6484 0.0979 0.4090 0.8330
The sphericity data obtained from Sample 1 testing (N = 56, approx.) is graphically
depicted in Figure 5.2 and numerically expressed in the table that follows. A higher
value is desirable, as particles tend to be more cubicle (the ideal cover aggregate
shape) as the value approaches 1. The indices range from 0.30 to 0.89.
Figure 5.2 AIMS1 Output for Sphericity I (3/8” Aggregate, Sample 1)
The analysis of variance showed that there was a statistically significant difference (p =
0.000) between the Hanson Davis material (less cubicle) and the other five quarries
based upon a 95% confidence interval (Tukey’s Method). Table 5.5 shows that 78% of

63
the Hanson material was considered to be flat/elongated, versus one-third or less of
material for all of the other quarries.
Table 5.5 AIMS1 Sphericity I Classification for 6 Quarries (Sample 1)
Quarry
Flat/
Elongated
(< 0.6)
Low
Sphericity
(0.6 - 0.7)
Moderate
Sphericity
(0.7 – 0.8)
High
Sphericity
(> 0.8)
% in Range
Hanson - Davis 78 21 1 0
Dolese - Cooperton 34 40 23 3
Dolese - Hartshorne 15 33 46 6
Martin Marietta – Mill Creek 11 34 42 13
Kemp Stone - Pryor 23 43 29 5
Dolese – Davis 27 41 28 4
These results indicate that the limestone material exhibits a lower flat-elongated ratio (is
more cubicle in shape) than the Hanson rhyolite material, which may enhance
embedment. It also contributes to its impact resistance. Although the Hanson material
has a lower Micro Deval value, the shape of the limestone particles may contribute for
its lower impact resistance and be less prone to breakage under traffic. This finding may
support chip seal design practices, as most divisions prefer to use limestone cover
aggregate in chip seals because it is thought to mitigate windshield damage from
dislodged aggregate.
There is also a statistically significant difference between the Martin Marietta Mill Creek
material (more cubical) and the rest of the quarries, with the exception of Dolese
Hartshorne. This is also consistent with the Micro Deval results that show Martin
Marietta material has the greatest resistance to abrasion.
Research continues as to the validity of AIMS1 and AIMS2 output and correlation.
AIMS1 texture indices were shown to be lower (polish values higher) than AIMS2
texture indices based upon preliminary results of this study, as explained in Section 4.1.
Aggregates that have higher polished face values are not as desirable for use in chip
seal; therefore, the AIMS1 results will not appear as favorable as AIMS2 with regard to

64
texture. Care should be exercised when interpreting the AIMS1 data in this section. The
researchers are considering only relative differences in texture for the purpose of
comparing given aggregates, which suits the purpose of this research. The descriptive
statistics are provided in Table 5.6.
Table 5.6 AIMS1 Texture: Descriptive Statistics for 6 Quarries
AIMS1 Output: Texture, 3/8” Aggregate
Quarry
Sample
Size Mean
Standard
Deviation
(Pooled: 75.8)
Min.
Value
Max.
Value
Hanson - Davis 51 176.8 54.8 81 323
Dolese - Cooperton 56 260.0 78.9 51 428
Dolese - Hartshorne 105 237.4 71.8 87 414
Martin Marietta – Mill Creek 108 233.5 99.3 90 557
Kemp Stone - Pryor 101 126.9 54.3 45 289
Dolese – Davis 52 165.9 77.3 42 367
The texture data obtained from Sample 1 testing (N = 56, approx.) is graphically
depicted in Figure 5.3. The AIMS classifies texture in a range that has a low end of
“polished faces” (index < 165) and a high end of “high roughness” (index > 460).
Therefore, a higher value is desirable. The indices of the tested material range from 42
to 557.
Figure 5.3 AIMS1 Output for Texture (3/8” Aggregate, Sample 1)

65
The analysis of variance showed that there was a statistically significant difference (p =
0.000) between material sources with regard to texture. Based on these results, the
Martin Marietta and Dolese (Cooperton and Hartshorne) materials exhibited greater
roughness (texture) than the Hanson, Dolese Davis and Kemp Stone materials based
upon a 95% confidence interval (Tukey’s Method). This indicates that the Martin
Marietta and Dolese materials may offer increased surface friction and adhesion.
5.1.2.2 AIMS1 Results – Test Section Source (Dolese Davis)
This section presents AIMS results for the test section aggregate from Dolese Davis
obtained from the chip spreader during construction of each test section. Comparisons
of the various size fractions (1/2”, 3/8”, 1/4” and No. 4) were made to determine any
trends that exist between AIMS properties and field performance. See Appendix C for
all analyses.
In a previous OkTC study [6], a potential correlation was found between the gradient
angularity measured by AIMS1 and the skid number as measured with the locked wheel
skid test. Additionally, there was a promising relationship between the Performance-
based Uniformity Coefficient (PUC) and the sphericity index measured by AIMS1. This
section presents results that support these findings.
The analysis in this section focuses on the comparison of the aggregate size fractions
found in the ½” test sections (TS 2 and TS 5) to determine if there were correlations
between the AIMS1 results and the field test results. The gradations used in this study
show that four size fractions characterize most of the aggregate in the gradations: 1/2”,
3/8”, 1/4” and No. 4. The table also shows that the 1/2” SS gradation can contain up to
85% material that is retained on the 3/8” sieve, versus 40% in the traditional gradation.
The sieve analysis showed that the actual TS 5 gradation (1/2” SS) contained
approximately 70% of 3/8” and larger material, versus half that value (39%) in TS 2. The
remainder of the traditional gradation is made up mostly of 1/4” and No. 4 material.
Results were analyzed and then evaluated in the context of test section performance
results (Section 6 of this report).
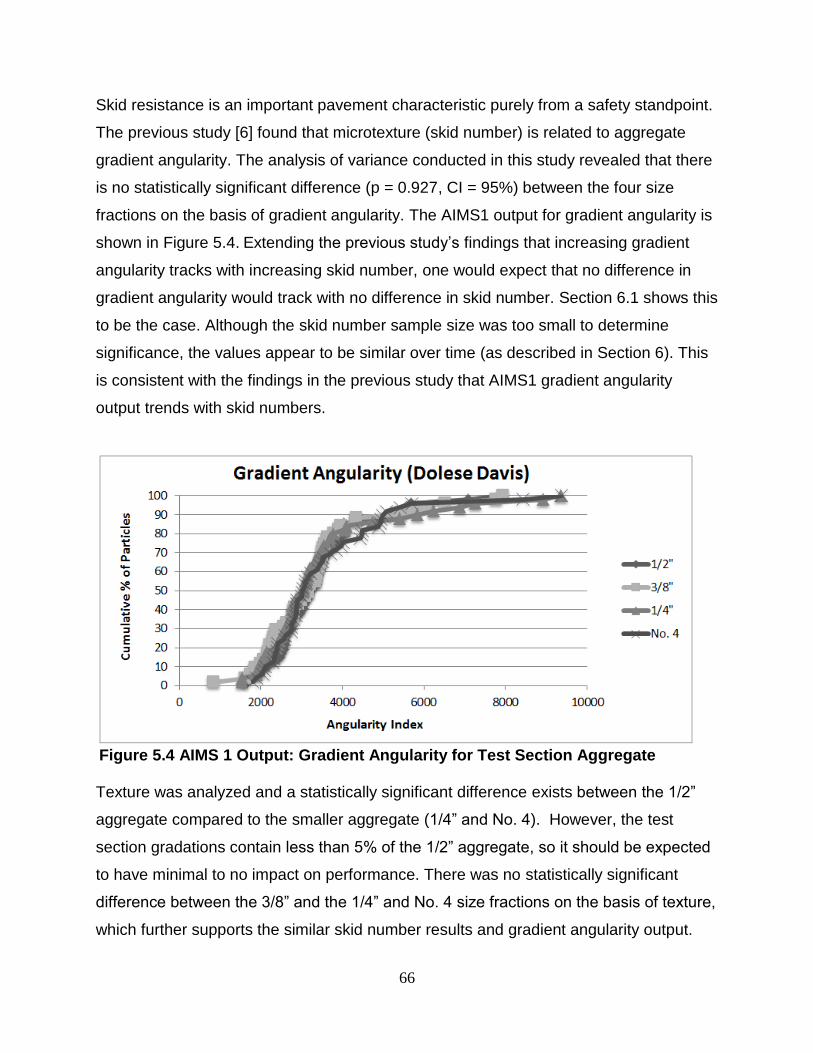
66
Skid resistance is an important pavement characteristic purely from a safety standpoint.
The previous study [6] found that microtexture (skid number) is related to aggregate
gradient angularity. The analysis of variance conducted in this study revealed that there
is no statistically significant difference (p = 0.927, CI = 95%) between the four size
fractions on the basis of gradient angularity. The AIMS1 output for gradient angularity is
shown in Figure 5.4. Extending the previous study’s findings that increasing gradient
angularity tracks with increasing skid number, one would expect that no difference in
gradient angularity would track with no difference in skid number. Section 6.1 shows this
to be the case. Although the skid number sample size was too small to determine
significance, the values appear to be similar over time (as described in Section 6). This
is consistent with the findings in the previous study that AIMS1 gradient angularity
output trends with skid numbers.
Figure 5.4 AIMS 1 Output: Gradient Angularity for Test Section Aggregate Texture was analyzed and a statistically significant difference exists between the 1/2”
aggregate compared to the smaller aggregate (1/4” and No. 4). However, the test
section gradations contain less than 5% of the 1/2” aggregate, so it should be expected
to have minimal to no impact on performance. There was no statistically significant
difference between the 3/8” and the 1/4” and No. 4 size fractions on the basis of texture,
which further supports the similar skid number results and gradient angularity output.

67
Figure 5.5 shows the texture output for the various size fractions.
Figure 5.5 AIMS 1 Output: Texture for Test Section Aggregate The PUC is a promising metric for measuring chip seal susceptibility to failure due to
flushing/bleeding. The previous study [6] found trends between the PUC and the
AIMS1 sphericity index results. Figure 5.6 shows the AIMS1 output for sphericity
obtained in this study.
Figure 5.6 AIMS 1 Output: Sphericity for Test Section Aggregate

68
The analysis of variance for this study showed that there was a statistically significant
difference between sphericity characteristics of size fractions (p = 0.00, CI = 95%). The
Tukey’s Test revealed that the 1/2” and 3/8” aggregate were statistically the same, but
that there was a statistically significant difference between them and the 1/4” and No.4
aggregate. Essentially, the 1/2” and 3/8” aggregate samples provide greater sphericity
values (more cubical shape) than the other two size fractions.
In terms of chip seal performance, the higher sphericity values should translate to
greater embedment potential and greater aggregate retention, reducing the potential for
failure based upon flushing/bleeding. Ultimately, the chip seal containing the larger
aggregate at greater quantities that exhibits higher sphericity indices would theoretically
allow better protection of the bituminous seal from traffic wear. This study’s findings
were consistent with the previous study’s conclusions based upon the relationship
between PUC and sphericity [6]. As described in Section 6.1, the single size (SS) test
sections based upon PUC generally outperformed the traditional gradation sections
over the 1 year period on the basis of macrotexture (“drainability”, aggregate retention).
This could be because the SS test sections contain nearly twice as much 1/2” and 3/8”
aggregate as the test sections built with traditional gradations.
5.2 AGGREGATE-BINDER COMPATIBILITY
Testing for aggregate-binder compatibility has been completed. Contact angles of
aggregates were evaluated using the aggregates collected for the research. Contact
angle measurements with liquids of known surface energy (water, ethylene glycol and
di-iodomethane (DIM)) were used to quantify the SFE components of the aggregate.
Complete Sessile Drop results for the five aggregates are listed in Appendix B.

69
Sessile Drop results for Dolese-Cooperton (probe liquid: water) are shown for illustrative purposes in graphical and numerical form in Figure 5.7 and Table 5.7, respectively.
Figure 5.7 Sessile Drop Results Graph for Dolese Cooperton Table 5.7 Sessile Drop Results for Dolese Cooperton
Test No. set – 1 (Day-1)
set – 2 (Day-2)
set – 3 (Day-3)
(In Degrees)
1 58.5 53.0 58.8
2 58.2 57.9 52.3
3 58.9 57.3 51.8
4 58.7 55.8 55.6
5 55.6 51.2 54.7
6 56.5 51.1 53.4
7 55.0 54.9 49.5
8 54.7 55.4 52.6
9 55.7 57.5 49.7
10 58.1 55.1 49.6
Average 57.0 54.9 52.8
Std. deviation 1.7 2.5 3.0
Overall average 54.9
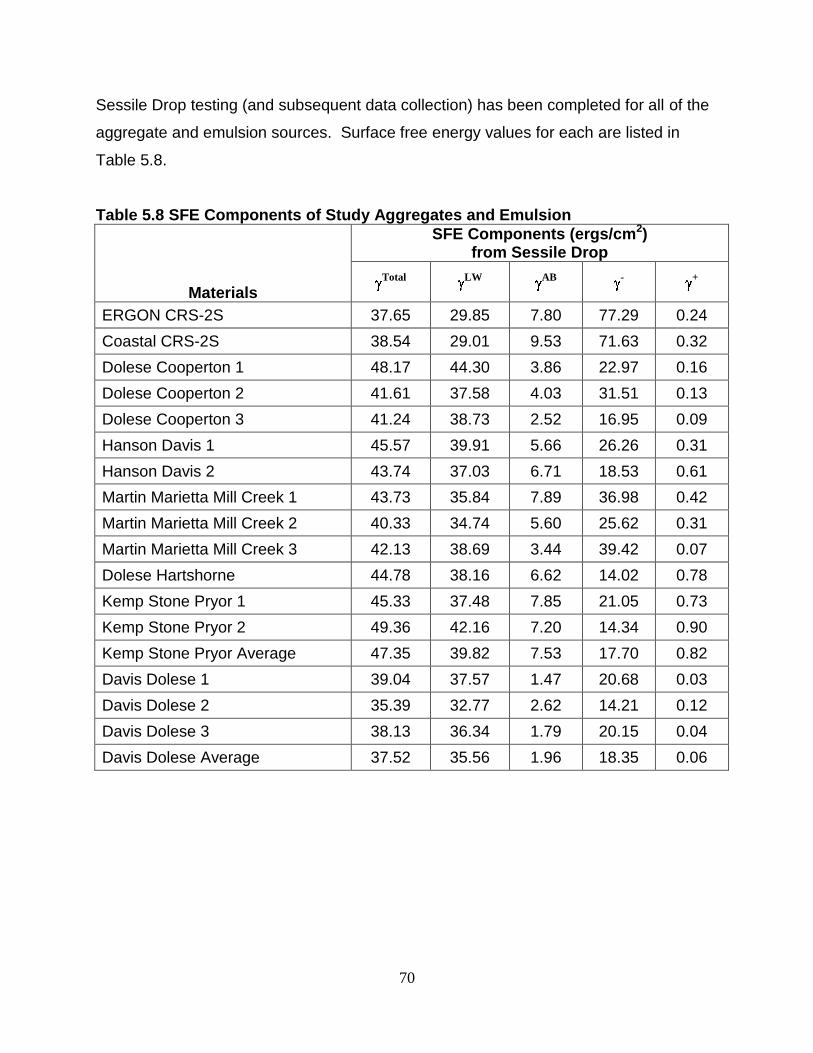
70
Sessile Drop testing (and subsequent data collection) has been completed for all of the
aggregate and emulsion sources. Surface free energy values for each are listed in
Table 5.8.
Table 5.8 SFE Components of Study Aggregates and Emulsion
Materials
SFE Components (ergs/cm2) from Sessile Drop
Total LW AB - +
ERGON CRS-2S 37.65 29.85 7.80 77.29 0.24
Coastal CRS-2S 38.54 29.01 9.53 71.63 0.32
Dolese Cooperton 1 48.17 44.30 3.86 22.97 0.16
Dolese Cooperton 2 41.61 37.58 4.03 31.51 0.13
Dolese Cooperton 3 41.24 38.73 2.52 16.95 0.09
Hanson Davis 1 45.57 39.91 5.66 26.26 0.31
Hanson Davis 2 43.74 37.03 6.71 18.53 0.61
Martin Marietta Mill Creek 1 43.73 35.84 7.89 36.98 0.42
Martin Marietta Mill Creek 2 40.33 34.74 5.60 25.62 0.31
Martin Marietta Mill Creek 3 42.13 38.69 3.44 39.42 0.07
Dolese Hartshorne 44.78 38.16 6.62 14.02 0.78
Kemp Stone Pryor 1 45.33 37.48 7.85 21.05 0.73
Kemp Stone Pryor 2 49.36 42.16 7.20 14.34 0.90
Kemp Stone Pryor Average 47.35 39.82 7.53 17.70 0.82
Davis Dolese 1 39.04 37.57 1.47 20.68 0.03
Davis Dolese 2 35.39 32.77 2.62 14.21 0.12
Davis Dolese 3 38.13 36.34 1.79 20.15 0.04
Davis Dolese Average 37.52 35.56 1.96 18.35 0.06

71
Subsequently, the free energy of adhesion was calculated and the results are listed in
Table 5.9.
Table 5.9 Free Energy of Adhesion Values for Aggregate and Emulsion Sources
Materials
Free Energy of Adhesion
ERGON CRS-2S Coastal CRS-2S
Wet Case Dry Case Wet Case Dry Case
Dolese Cooperton 1 29.30 84.48 26.59 83.89
Dolese Cooperton 2 37.91 78.85 34.97 78.49
Dolese Cooperton 3 24.57 77.33 21.83 76.77
Hanson Davis 1 31.69 83.86 28.98 83.27
Hanson Davis 2 22.90 84.46 20.43 83.64
Martin Marietta Mill Creek 1 40.25 82.79 37.41 82.34
Martin Marietta Mill Creek 2 31.79 79.17 29.02 78.64
Martin Marietta Mill Creek 3 44.55 78.79 41.47 78.59
Dolese Hartshorne 16.88 86.71 14.58 85.73
Pryor Stone Pryor 1 24.88 86.43 22.42 85.60
Pryor Stone Pryor 2 16.28 91.36 14.06 90.29
Davis Dolese 1 29.60 74.50 26.70 74.10
Davis Dolese 2 21.85 72.35 19.12 71.79
Davis Dolese 3 29.02 73.80 26.13 73.40
Additional testing was completed in an effort to determine the SFE of emulsion, since no
protocol currently exists in literature. The initial objective of the supplemental SFE
analysis was to estimate SFE through dynamic contact angle (DCA) measurements,
which requires thin and smooth glass plates (Fisher Scientific) specimens (50 mm X 24
X No. 1.5) coated with emulsion. In the specimen preparation process, asphalt binder is
heated at 150oC for about two hours and then hot glass plates are dipped into the liquid
asphalt to prepare smooth specimens. These specimens are tested by measuring SFE
components of asphalt binder samples by using three probe liquids (water, ethylene
glycol and formamide) as recommend by Texas Transportation Institute researchers.
The measured SFE components are then used to estimate the total SFE of the asphalt
binder systems.
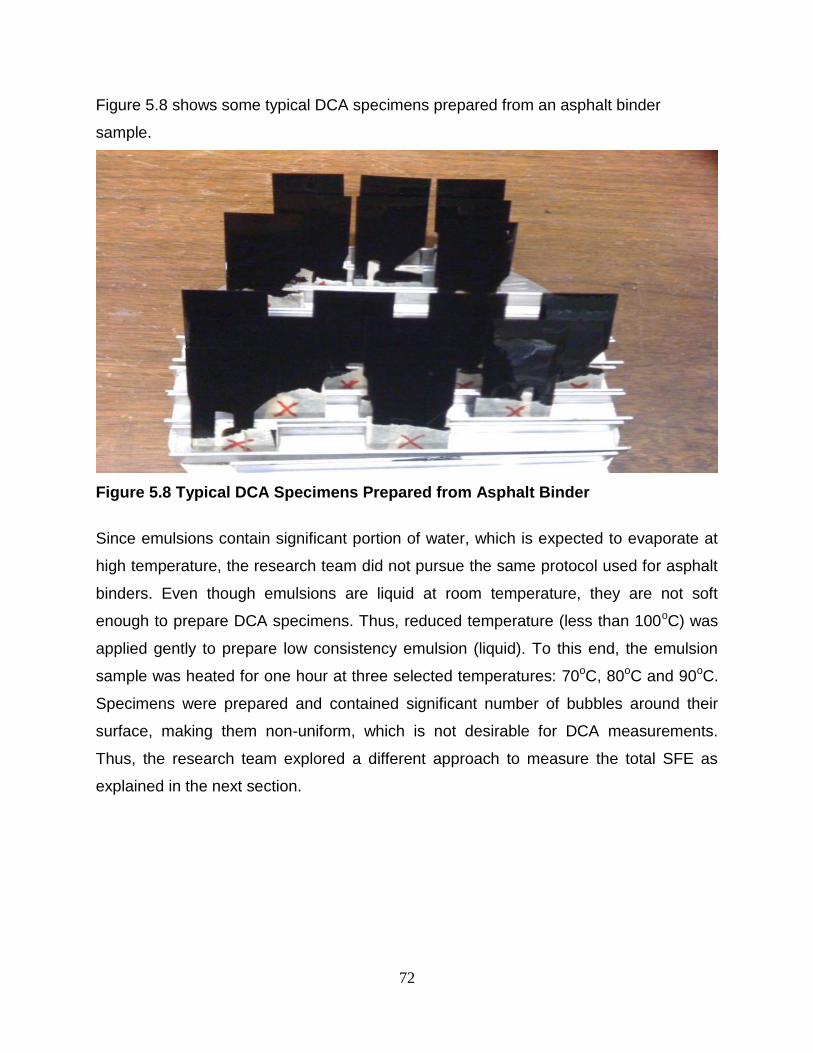
72
Figure 5.8 shows some typical DCA specimens prepared from an asphalt binder
sample.
Figure 5.8 Typical DCA Specimens Prepared from Asphalt Binder
Since emulsions contain significant portion of water, which is expected to evaporate at
high temperature, the research team did not pursue the same protocol used for asphalt
binders. Even though emulsions are liquid at room temperature, they are not soft
enough to prepare DCA specimens. Thus, reduced temperature (less than 100oC) was
applied gently to prepare low consistency emulsion (liquid). To this end, the emulsion
sample was heated for one hour at three selected temperatures: 70oC, 80oC and 90oC.
Specimens were prepared and contained significant number of bubbles around their
surface, making them non-uniform, which is not desirable for DCA measurements.
Thus, the research team explored a different approach to measure the total SFE as
explained in the next section.
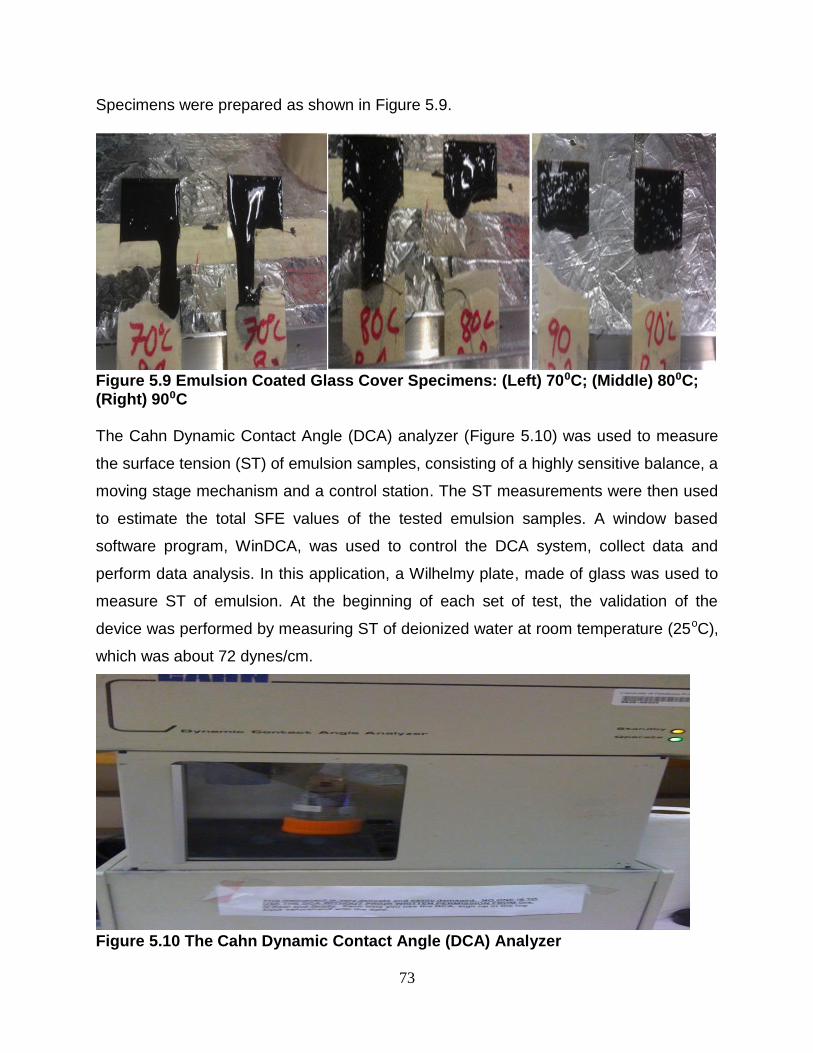
73
Specimens were prepared as shown in Figure 5.9.
Figure 5.9 Emulsion Coated Glass Cover Specimens: (Left) 70⁰C; (Middle) 80⁰C; (Right) 90⁰C
The Cahn Dynamic Contact Angle (DCA) analyzer (Figure 5.10) was used to measure
the surface tension (ST) of emulsion samples, consisting of a highly sensitive balance, a
moving stage mechanism and a control station. The ST measurements were then used
to estimate the total SFE values of the tested emulsion samples. A window based
software program, WinDCA, was used to control the DCA system, collect data and
perform data analysis. In this application, a Wilhelmy plate, made of glass was used to
measure ST of emulsion. At the beginning of each set of test, the validation of the
device was performed by measuring ST of deionized water at room temperature (25oC),
which was about 72 dynes/cm.
Figure 5.10 The Cahn Dynamic Contact Angle (DCA) Analyzer

74
The tested emulsion was a cationic emulsion produced by Ergon at Lawton, OK
((Product: CRS-25; Tank No. 20; Date Sampled: 5/18/12; Batch Run: LA051112004;
Person Sampled: SR). The emulsion was sampled at two conditions: (1) sample
obtained directly from the refinery, or plant (Set I), and (2) sample collected from
construction test site (Set II). Emulsion samples were collected at the construction site
at the beginning and middle point of the day of construction. Total SFE values of the
tested emulsion are shown in Figure 5.11, in which the vertical bar represents one
standard deviation (error bar) for the given set of specimens.
Figure 5.11 Total SFE (ergs/cm2) of Tested Emulsion
Four replicate specimens were tested for each emulsion sample to ensure repeatability.
Thus, a total of eight specimens were tested and good repeatability was observed.
Figure 5.11 shows that the SFE values of Set I and Set II samples were found to be
31.2 ergs/cm2 and 31.8 ergs/cm2, respectively. This indicates that the SFE values of the
emulsion sample collected from the construction site and the emulsion sample shipped
to the testing lab are almost identical. Therefore, no changes in SFE values occurred
between emulsion source and project destination.
Using the SFE components of tested emulsions and aggregates obtained from the
Sessile Drop method as presented previously, the CR values were calculated. The CR
of different aggregate emulsion systems are listed in Table 5.10. All ratios are greater
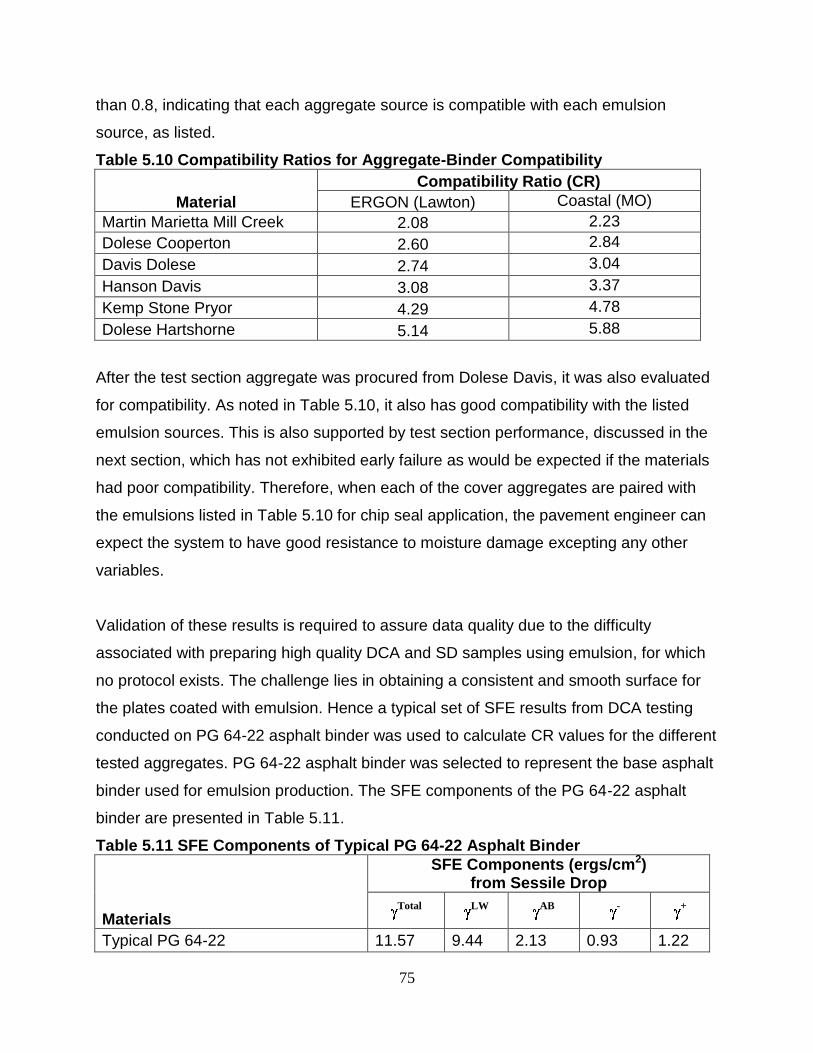
75
than 0.8, indicating that each aggregate source is compatible with each emulsion
source, as listed.
Table 5.10 Compatibility Ratios for Aggregate-Binder Compatibility
Material
Compatibility Ratio (CR)
ERGON (Lawton) Coastal (MO)
Martin Marietta Mill Creek 2.08 2.23
Dolese Cooperton 2.60 2.84
Davis Dolese 2.74 3.04
Hanson Davis 3.08 3.37
Kemp Stone Pryor 4.29 4.78
Dolese Hartshorne 5.14 5.88
After the test section aggregate was procured from Dolese Davis, it was also evaluated
for compatibility. As noted in Table 5.10, it also has good compatibility with the listed
emulsion sources. This is also supported by test section performance, discussed in the
next section, which has not exhibited early failure as would be expected if the materials
had poor compatibility. Therefore, when each of the cover aggregates are paired with
the emulsions listed in Table 5.10 for chip seal application, the pavement engineer can
expect the system to have good resistance to moisture damage excepting any other
variables.
Validation of these results is required to assure data quality due to the difficulty
associated with preparing high quality DCA and SD samples using emulsion, for which
no protocol exists. The challenge lies in obtaining a consistent and smooth surface for
the plates coated with emulsion. Hence a typical set of SFE results from DCA testing
conducted on PG 64-22 asphalt binder was used to calculate CR values for the different
tested aggregates. PG 64-22 asphalt binder was selected to represent the base asphalt
binder used for emulsion production. The SFE components of the PG 64-22 asphalt
binder are presented in Table 5.11.
Table 5.11 SFE Components of Typical PG 64-22 Asphalt Binder
Materials
SFE Components (ergs/cm2) from Sessile Drop
Total LW AB - +
Typical PG 64-22 11.57 9.44 2.13 0.93 1.22

76
Table 5.12 presents the free energies of adhesion in dry and wet conditions and CR
values calculated for each aggregate with the Typical PG 64-22 asphalt binder.
Table 5.12 Compatibility Values for Aggregates with PG 64-22 Asphalt Binder
Materials
SFE Components (ergs/cm2) from Sessile Drop
Free Energy of Adhesion (ergs/cm2)
CR value
Total LW AB - + Wet Case
Dry Case
Dolese Cooperton 1 48.17 44.30 3.86 22.97 0.16 33.68 52.24 1.55
Dolese Cooperton 2 41.61 37.58 4.03 31.51 0.13 29.18 50.74 1.74
Dolese Cooperton 3 41.24 38.73 2.52 16.95 0.09 41.19 47.90 1.16
Hanson Davis 1 45.57 39.91 5.66 26.26 0.31 30.85 51.19 1.66
Hanson Davis 2 43.74 37.03 6.71 18.53 0.61 36.22 48.39 1.34
MM Mill Creek 1 43.73 35.84 7.89 36.98 0.42 23.59 51.45 2.18
MM Mill Creek 2 40.33 34.74 5.60 25.62 0.31 32.68 48.45 1.48
MM Mill Creek 3 42.13 38.69 3.44 39.42 0.07 24.43 52.58 2.15
Dolese Hartshorne 44.78 38.16 6.62 14.02 0.78 39.52 47.92 1.21
Kemp Stone Pryor 1 45.33 37.48 7.85 21.05 0.73 33.27 53.14 1.60
Kemp Stone Pryor 2 49.36 42.16 7.20 14.34 0.90 37.65 53.35 1.42
Davis Dolese 1 39.04 37.57 1.47 20.68 0.03 39.13 48.76 1.25
Davis Dolese 2 35.39 32.77 2.62 14.21 0.12 45.13 45.54 1.01
Davis Dolese 3 38.13 36.34 1.79 20.15 0.04 39.69 48.23 1.22
It is evident that the CR values for all of the aggregate-binder combinations listed in
Table 5.12 are greater than 0.8. This may be interpreted as a possible indication of
acceptable performance against debonding from the binder as a result of moisture
induced damage. The same trend is also observed in the aggregate and emulsion SFE
data that were used for CR calculation. Therefore, the aggregate-emulsion compatibility
results are validated.

77
6.0 FIELD TEST RESULTS AND ANALYSIS The ultimate goal of the project field testing was to determine relative differences in
performance between the chip seal test sections. Specifically, the objective was to
evaluate test sections that have PUC gradations and compare them to test sections that
were built with traditional gradations. Additionally, sections with and without fog seals
and geosynthetic fabric were monitored for performance. Macro- and microtexture
values obtained at one year of service have been deemed appropriate to evaluate chip
seal performance [45,64]. Macrotexture measurements were obtained from the chip
seal test sections in month 12. However, the ODOT skid tester was involved in a rear-
end collision and was unavailable to provide more than 5 months of microtexture data.
All of the chip seal test sections were performing satisfactorily on the basis of macro
and microtexture at the time of their respective final measurements. Chip seal
construction practices were observed and compared with effective practices. The chip
seal test sections have not exhibited short term failure, which is an indication of proper
construction practices and aggregate-binder compatibility, among other factors.
6.1 MICROTEXTURE AND MACROTEXTURE RESULTS AND ANALYSIS
Post-construction microtexture measurements were taken in Month 1 (November 2012)
that show all of the sections that received fog seal (or emulsion, mistakenly) exhibited a
lower skid number compared to respective sections with no fog seal, as expected. For
example, Table 6.1 shows that Test Section 1 has a higher skid value (47.1) than Test
Section 1s (37.5), which is the fog sealed section. This is due to the initial “slickness”
that the fog seal/emulsion causes. It is common for skid numbers to increase as the fog
seal is worn off the aggregate by traffic. This is may be the case for Test Section 4s,
with its 1% increase in skid value over the 7 month period in which the 5 data points
were obtained (Table 6.1). Microtexture should be expected to, at some point, begin to
decrease with deterioration soon after the fog seal has been worn off by traffic. This
deterioration is demonstrated in the microtexture values obtained in May 2013 (Table
6.1). Emulsion (CRS-2S) was placed on the fabric sections (1/2 mile) instead of SS-1,
mistakenly (Vance Bros. loaded the ODOT distributor with the wrong material). There
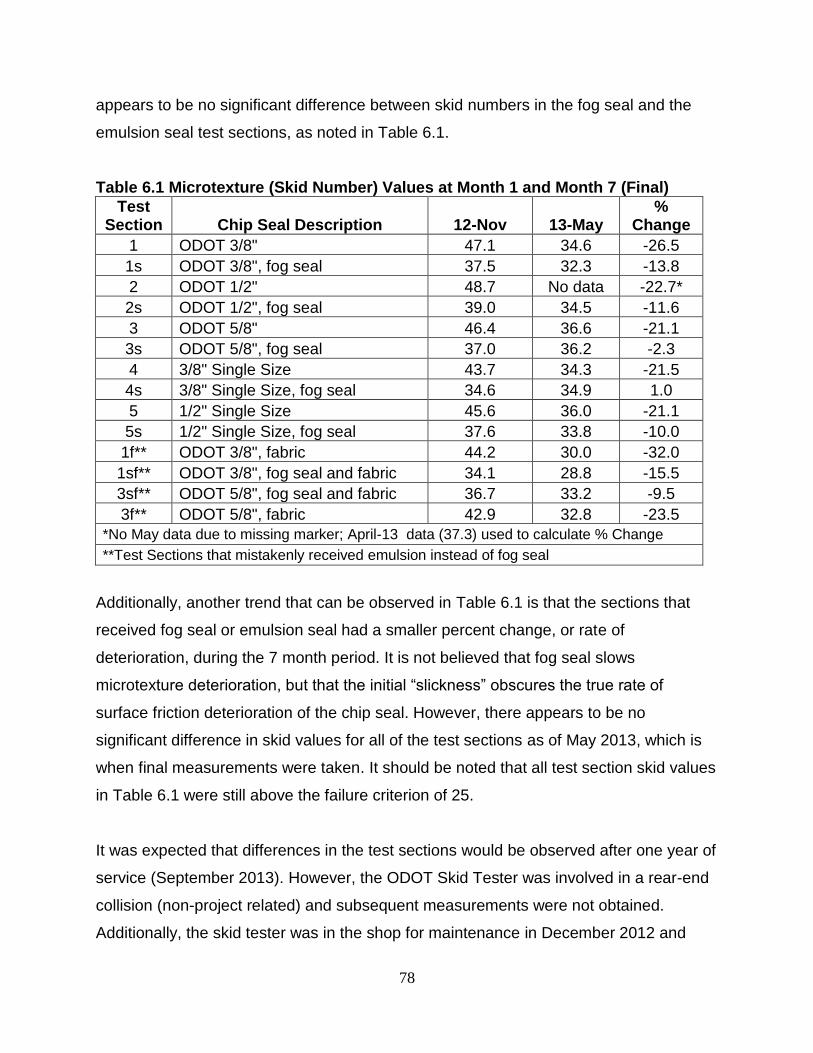
78
appears to be no significant difference between skid numbers in the fog seal and the
emulsion seal test sections, as noted in Table 6.1.
Table 6.1 Microtexture (Skid Number) Values at Month 1 and Month 7 (Final)
Test Section Chip Seal Description 12-Nov 13-May
% Change
1 ODOT 3/8" 47.1 34.6 -26.5
1s ODOT 3/8", fog seal 37.5 32.3 -13.8
2 ODOT 1/2" 48.7 No data -22.7*
2s ODOT 1/2", fog seal 39.0 34.5 -11.6
3 ODOT 5/8" 46.4 36.6 -21.1
3s ODOT 5/8", fog seal 37.0 36.2 -2.3
4 3/8" Single Size 43.7 34.3 -21.5
4s 3/8" Single Size, fog seal 34.6 34.9 1.0
5 1/2" Single Size 45.6 36.0 -21.1
5s 1/2" Single Size, fog seal 37.6 33.8 -10.0
1f** ODOT 3/8", fabric 44.2 30.0 -32.0
1sf** ODOT 3/8", fog seal and fabric 34.1 28.8 -15.5
3sf** ODOT 5/8", fog seal and fabric 36.7 33.2 -9.5
3f** ODOT 5/8", fabric 42.9 32.8 -23.5
*No May data due to missing marker; April-13 data (37.3) used to calculate % Change
**Test Sections that mistakenly received emulsion instead of fog seal
Additionally, another trend that can be observed in Table 6.1 is that the sections that
received fog seal or emulsion seal had a smaller percent change, or rate of
deterioration, during the 7 month period. It is not believed that fog seal slows
microtexture deterioration, but that the initial “slickness” obscures the true rate of
surface friction deterioration of the chip seal. However, there appears to be no
significant difference in skid values for all of the test sections as of May 2013, which is
when final measurements were taken. It should be noted that all test section skid values
in Table 6.1 were still above the failure criterion of 25.
It was expected that differences in the test sections would be observed after one year of
service (September 2013). However, the ODOT Skid Tester was involved in a rear-end
collision (non-project related) and subsequent measurements were not obtained.
Additionally, the skid tester was in the shop for maintenance in December 2012 and

79
January 2013, so measurements were not obtained in those months. Therefore,
deterioration models could not be created nor significance determined for differences
due to insufficient data.
Figure 6.1 shows the measurements that were obtained (smooth tire) in remaining
months. The value at time zero is the baseline measurement obtained before chip seal
application.
Figure 6.1 Microtexture Values for 3/8" Test Sections There appears to be no difference in skid performance of the 3/8” chip seal test
sections, regardless of gradation or fog seal. This also appears to be the case for the
1/2” chip seal sections (next figure).
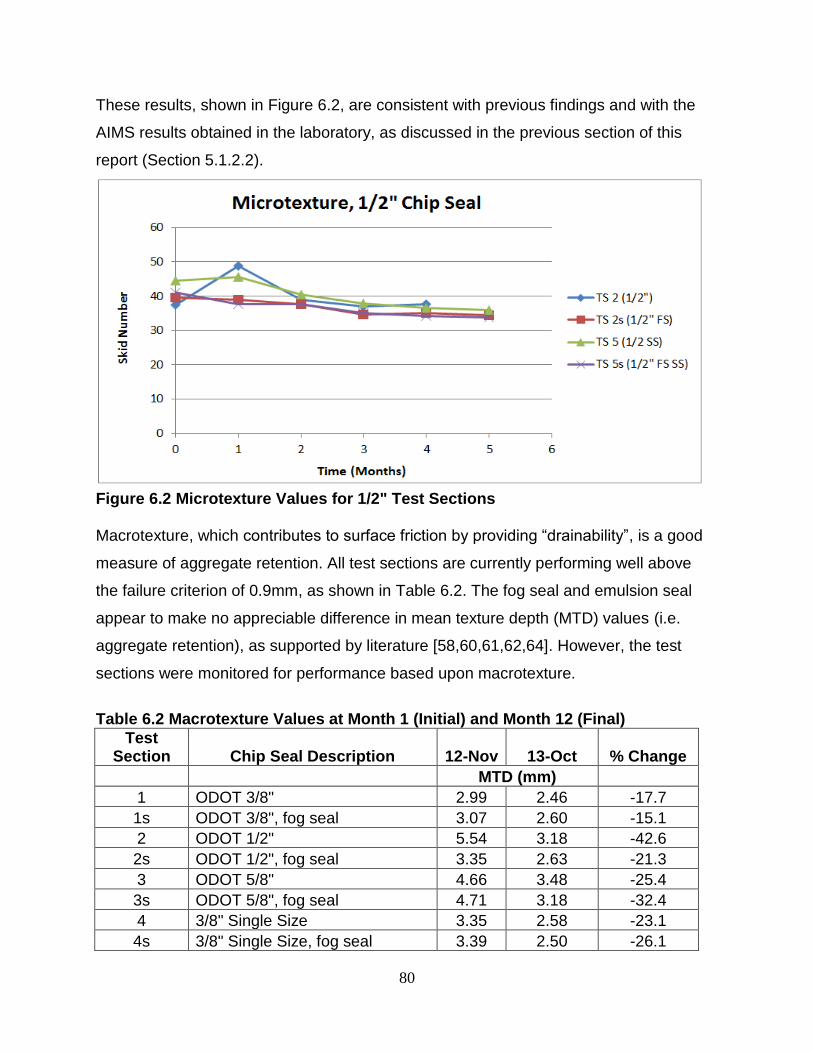
80
These results, shown in Figure 6.2, are consistent with previous findings and with the
AIMS results obtained in the laboratory, as discussed in the previous section of this
report (Section 5.1.2.2).
Figure 6.2 Microtexture Values for 1/2" Test Sections
Macrotexture, which contributes to surface friction by providing “drainability”, is a good
measure of aggregate retention. All test sections are currently performing well above
the failure criterion of 0.9mm, as shown in Table 6.2. The fog seal and emulsion seal
appear to make no appreciable difference in mean texture depth (MTD) values (i.e.
aggregate retention), as supported by literature [58,60,61,62,64]. However, the test
sections were monitored for performance based upon macrotexture.
Table 6.2 Macrotexture Values at Month 1 (Initial) and Month 12 (Final)
Test Section Chip Seal Description 12-Nov 13-Oct % Change
MTD (mm)
1 ODOT 3/8" 2.99 2.46 -17.7
1s ODOT 3/8", fog seal 3.07 2.60 -15.1
2 ODOT 1/2" 5.54 3.18 -42.6
2s ODOT 1/2", fog seal 3.35 2.63 -21.3
3 ODOT 5/8" 4.66 3.48 -25.4
3s ODOT 5/8", fog seal 4.71 3.18 -32.4
4 3/8" Single Size 3.35 2.58 -23.1
4s 3/8" Single Size, fog seal 3.39 2.50 -26.1

81
Test Section Chip Seal Description 12-Nov 13-Oct % Change
5 1/2" Single Size 4.21 2.98 -29.3
5s 1/2" Single Size, fog seal 4.53 3.39 -25.1
1f ODOT 3/8", fabric 3.03 2.44 -19.6
1sf ODOT 3/8", fog seal and fabric 2.60 2.08 -20.0
3sf ODOT 5/8", fog seal and fabric 3.87 2.86 -26.2
3f ODOT 5/8", fabric 3.92 3.09 -21.3
Figure 6.3 shows all of the 3/8” chip seal sections macrotexture data points obtained in
the field. The first data point represents baseline (pre-construction) measurement.
At this point in the service life, there is no statistical significant difference (p>0.05)
between the performance of the 3/8” test sections with traditional ODOT gradation and
PUC-based gradations (denoted “SS” for single size in the graph). However, the single
size section (TS 4) has yielded higher macrotexture values over the testing period than
the other test sections. Regardless of fog seal or single-size gradation, all are
performing well above the 0.9mm failure criterion.
Figure 6.3 Macrotexture Values for 3/8" Test Sections

82
The macrotexture values for the 1/2” Chip Seal Test Sections show that the PUC-based
sections have outperformed (albeit slightly) the non-PUC-based sections, as depicted in
Figure 6.4. All sections are still performing well above the 0.9mm failure criterion.
However, at this point in the service life, a statistically significant difference exists
between the PUC-graded test section with fog seal versus the traditional gradation
section with fog seal (p<0.05). These results are consistent with previous findings and
with the AIMS results obtained in the laboratory, as discussed in the previous section of
this report (Section 5.1.2.2).
Figure 6.4 Macrotexture Values for 1/2" Test Sections Unfortunately, Dolese did not supply the PUC-based 5/8” gradation. The macrotexture
values show that the PUC-based gradations for 1/2” chip seal have been generally
greater than the ODOT gradations on the basis of macrotexture. Also, the 1/2” chip seal
sections have performed better than the 3/8” sections at this point in the service life. If
the trend that the SS sections with larger aggregate are outperforming their
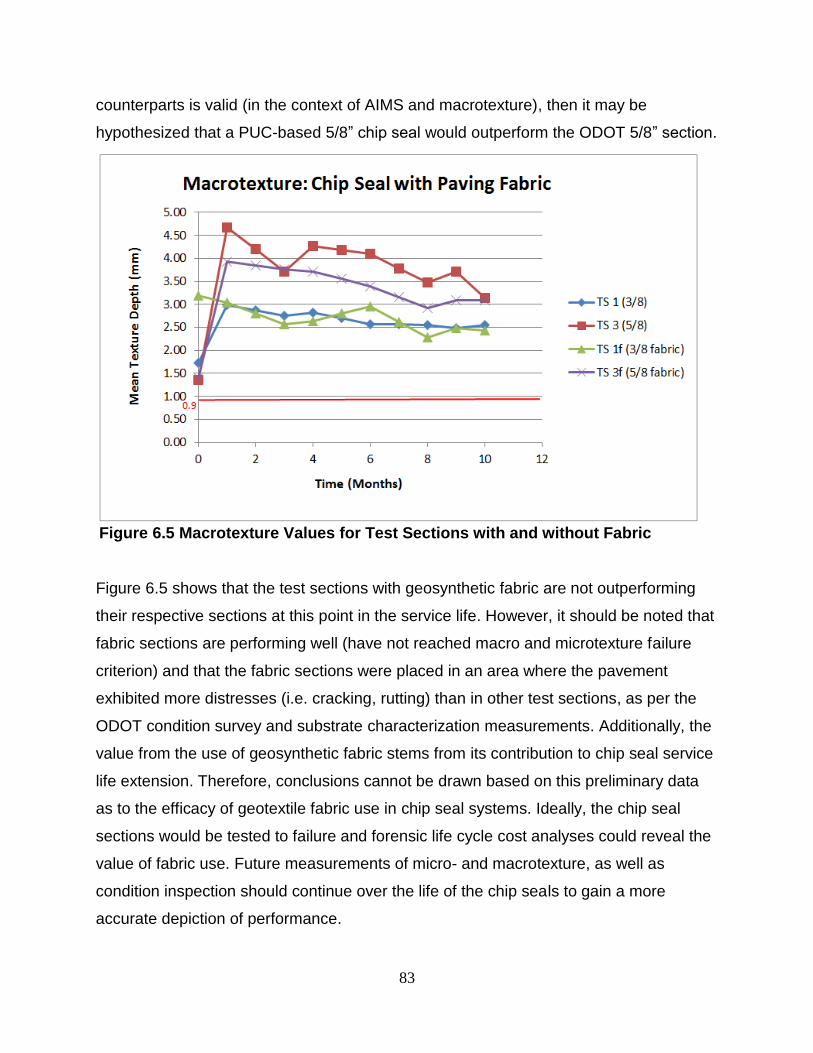
83
counterparts is valid (in the context of AIMS and macrotexture), then it may be
hypothesized that a PUC-based 5/8” chip seal would outperform the ODOT 5/8” section.
Figure 6.5 Macrotexture Values for Test Sections with and without Fabric Figure 6.5 shows that the test sections with geosynthetic fabric are not outperforming
their respective sections at this point in the service life. However, it should be noted that
fabric sections are performing well (have not reached macro and microtexture failure
criterion) and that the fabric sections were placed in an area where the pavement
exhibited more distresses (i.e. cracking, rutting) than in other test sections, as per the
ODOT condition survey and substrate characterization measurements. Additionally, the
value from the use of geosynthetic fabric stems from its contribution to chip seal service
life extension. Therefore, conclusions cannot be drawn based on this preliminary data
as to the efficacy of geotextile fabric use in chip seal systems. Ideally, the chip seal
sections would be tested to failure and forensic life cycle cost analyses could reveal the
value of fabric use. Future measurements of micro- and macrotexture, as well as
condition inspection should continue over the life of the chip seals to gain a more
accurate depiction of performance.

84
In general, chip seal deterioration occurs more rapidly at the beginning of the service
life, then “levels off” in following years [56]. Therefore, a logarithmic equation has been
shown to model chip seal deterioration over the service life well [56]. However, the
deterioration at this point in the service life of the study test sections is not well modeled
by the logarithmic equation since the data has not started to “level off”, due to variables
such traffic levels and weathering, etc. Applying the logarithmic equation on the current
data results in a premature “leveling off” of the deterioration rate and subsequently
yields unreasonably long service life estimates (i.e. 20+ years). Therefore, development
of deterioration models based upon linear regression is not appropriate at this point in
the test section service life.
However, the use of the TNZ performance specification can provide some insight into
expected performance of the chip seal test sections on the basis of macrotexture [45].
The TNZ T/3 sand circle test was chosen for this particular study (Table 6.2) because it
can be directly compared with the Australian and New Zealand research upon which the
project builds. Table 6.3 shows the minimum macrotexture values required for the test
sections as observed at 12 months of service. The TNZ failure criterion is 0.9mm.
Referencing Table 6.2, all test sections are yielding values above the failure criterion of
0.9mm, as well as the P/17 12- month criterion at all possible design lives, as noted in
Table 6.3. Therefore, according to the performance specification, all of the test sections
should be expected to reach a service life of greater than 6 years on the basis of
macrotexture.
Table 6.3 TNZ P/17 Performance Specification Comparison
Treatment
P/17 12-month Minimum Macrotexture at Given Design Life
4-year 5-year 6-year
3/8" Chip Seal 1.17 1.29 1.37
1/2" Chip Seal 1.32 1.52 1.60
5/8" Chip Seal 1.43 1.68 1.85

85
6.2 CONSTRUCTION PRACTICES REVIEW Short-term failure in chip seal is defined as failure within the first year of service, mainly
caused by the loss of cover aggregate. This type of failure is normally related to
incompatibility of the aggregate and the binder, excessive fines in the aggregate, or
some weather event or deficiency in the construction process such as inadequate rolling
or placing the chip seal late in the season where ambient air temperatures are below
specified minimums [3,4,5]. In fact, construction quality can have the greatest impact on
chip seal success [3]. Therefore, ODOT chip seal construction practices were reviewed.
Additionally, the other five ODOT divisions that use chip seal in their maintenance
programs provided information about their construction practices. The practices were
then compared to the best construction practices listed in NCHRP Synthesis 342: Chip
Seal Best Practices, listed in this section’s tables.
Common chip seal equipment includes an emulsion distributor, aggregate spreader,
rollers, dump trucks and sweeping equipment. Figure 6.6 shows part of the chip seal
crew that installed the test sections. It shows the distributor installing the CRS-2S
emulsion in front of the chip spreader, which is spreading the cover aggregate, called
“chips” on the emulsion. Also partially pictured is one of the dump trucks responsible for
keeping the chip spreader continuously supplied with cover aggregate. In general, the
practices observed in the field were consistent with chip seal best practices [3].
Additionally, all of the ODOT Divisions indicated similar practices with regard to
equipment and methods for chip seal construction in their regions.

86
Common chip seal equipment includes an emulsion distributor, aggregate spreader,
rollers, dump trucks and sweeping equipment. Figure 6.6 shows part of the chip seal
crew that installed the test sections.
Figure 6.6 Chip Seal Construction: Distributor, Chip Spreader and Dump Truck It shows the distributor installing the CRS-2S emulsion in front of the chip spreader,
which is spreading the cover aggregate, called “chips” on the emulsion. Also partially
pictured is one of the dump trucks responsible for keeping the chip spreader
continuously supplied with cover aggregate. In general, the practices observed in the
field were consistent with chip seal best practices [3] as noted in Table 6.4. Additionally,
all of the ODOT Divisions indicated similar practices with regard to equipment and
methods for chip seal construction in their regions.
Table 6.4 Chip Seal Best Practices: Equipment (After [3])
Best Practice Purpose Observed
Computerized Distributor with Variable Nozzles
To ensure consistent and accurate emulsion application
Synchronized Equipment Production Rates
To allow adequate time for rolling operation before emulsion cures
Properly Calibrated Equipment To ensure accurate distribution of material
Verification of Application Rates (Aggregate and Binder)
To ensure application rates are appropriate for field conditions

87
Best Practice Purpose Observed
Self-Propelled, Computerized Chip Spreader with Adjustable Discharge Gate/Roller
To ensure uniform spread of cover aggregate
Sufficient # of Dump Trucks To ensure sufficient supply to spreader for continuous operation
Sufficient #, Speed, Pattern of Rollers
To ensure proper embedment and orientation of aggregate into binder
Proper Roller Weight, # and size of tires, inflation pressure
To ensure proper weight and pressure to embed and orient aggregate into binder
Properly sized static steel-wheeled roller, if used
To ensure cover aggregate is not crushed N/A
Use of Sweeping Equipment
To remove debris from pavement surface immediately prior to chip seal installation and to remove loose aggregate after chip seal installation
Chip seal best practices for construction involve proper conditions, materials, means
and methods, as listed in Table 6.5. All of the Divisions reported similar weather
condition requirements and construction practices. There was one main exception.
Timing for opening the newly chip-sealed surface back over to traffic did vary between
the Divisions. During test section construction, a 30-minute average was observed
between the time that the roller was finished and the time that the road was open to
traffic. The responses from the Divisions ranged from “immediately” to four hours after
rolling operations cease. Division 1 (Muskogee) requires a four-hour period stated the
reason was to allow adequate emulsion cure time, a practice that is consistent with best
practices [3]. It is recommended that all Divisions ensure that the emulsion has
adequately cured before turning the section over to traffic. Although this may cause
temporary inconvenience to the traveling public, the benefits can be realized in
enhanced aggregate retention and extended chip seal service life.
Table 6.5 Chip Seal Best Practices: Construction (After [3])
Best Practice Purpose Observed
Apply chip seal in warmest, driest weather
To reduce chance of short-term chip seal failure

88
Best Practice Purpose Observed
Apply chip seal when: ambient air temp between
50⁰F - 100⁰F
surface temp between 70⁰F -
140⁰F
To ensure proper aggregate-binder adhesion and chip seal-pavement surface adhesion
Ambient air temp
range was 72⁰F at
start, 86⁰F at finish;
surface temp was
82⁰F, then 112⁰F
Prepare existing substrate months in advance (patching – 6 months, crack seal – 3 months)
To ensure adequate time for repairs to cure before placing chip seal
Sweep existing substrate prior to chip seal construction
To ensure proper bond between chip seal and pavement
Hand-rake in aggregate in deficient areas behind spreader
To ensure proper aggregate coverage
Apply aggregate immediately after emulsion
To ensure proper time for rolling operations
Have experienced personnel adjust application rates as warranted by field conditions
To ensure proper application rates
Apply a small amount of excess aggregate in areas with high turning and stopping activity
To protect binder from traffic damage
Not Observed
Proper roller operations (3,000 – 5,000 SY per hour of coverage before emulsion break)
To ensure proper roller coverage for aggregate embedment
Approx 3,500 SY/hour until one of the rollers stopped
working
Sweep only after emulsion breaks
To ensure aggregate retention
Open to traffic only after emulsion breaks
To ensure aggregate retention Average 30 minutes behind roller
Have experienced personnel ensure QC/QA in field
To ensure proper materials, means and methods
Evaluate aggregate-binder compatibility
To ensure proper adhesion for aggregate retention
Based upon experience;
validated by this research
Test binder at the distributor and aggregate at stockpiles
To ensure material quality has not degraded during handling
Completed for this research project
Recommendations from previous studies include using precoated aggregates to shorten
cure time, allowing at least 24 hours of cure time and/or ensuring at least 85% moisture
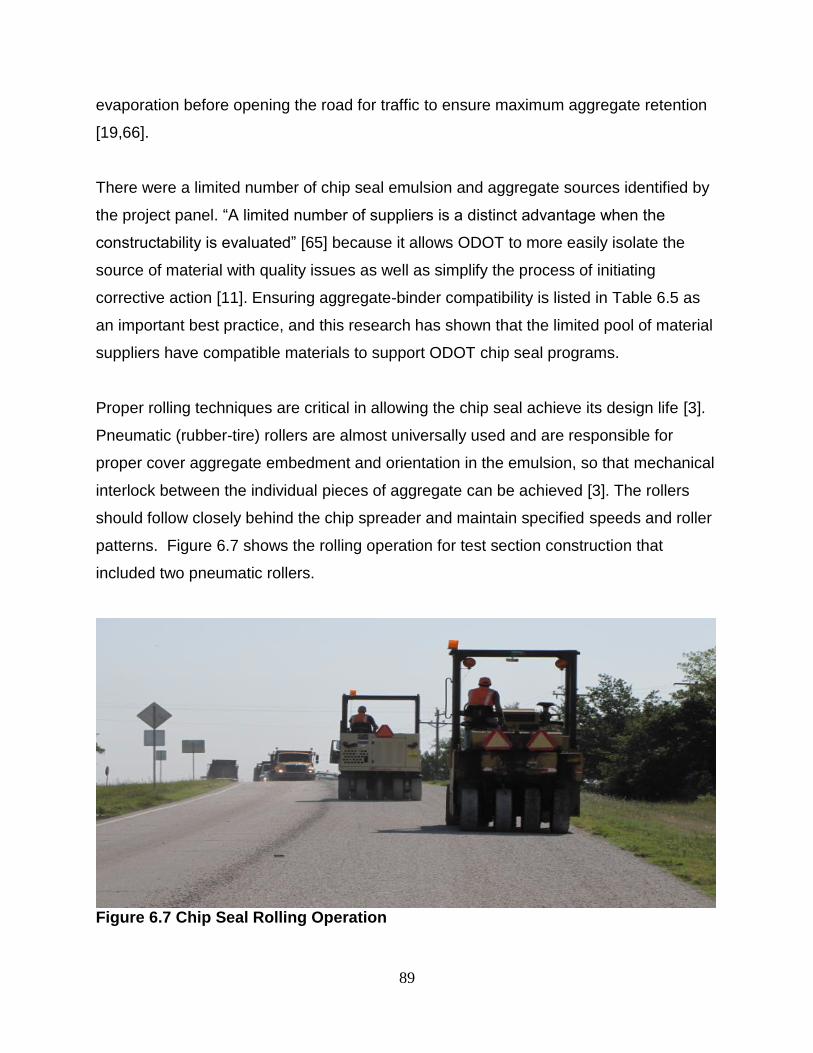
89
evaporation before opening the road for traffic to ensure maximum aggregate retention
[19,66].
There were a limited number of chip seal emulsion and aggregate sources identified by
the project panel. “A limited number of suppliers is a distinct advantage when the
constructability is evaluated” [65] because it allows ODOT to more easily isolate the
source of material with quality issues as well as simplify the process of initiating
corrective action [11]. Ensuring aggregate-binder compatibility is listed in Table 6.5 as
an important best practice, and this research has shown that the limited pool of material
suppliers have compatible materials to support ODOT chip seal programs.
Proper rolling techniques are critical in allowing the chip seal achieve its design life [3].
Pneumatic (rubber-tire) rollers are almost universally used and are responsible for
proper cover aggregate embedment and orientation in the emulsion, so that mechanical
interlock between the individual pieces of aggregate can be achieved [3]. The rollers
should follow closely behind the chip spreader and maintain specified speeds and roller
patterns. Figure 6.7 shows the rolling operation for test section construction that
included two pneumatic rollers.
Figure 6.7 Chip Seal Rolling Operation

90
All of the ODOT Divisions indicated that they enlist the dump trucks to aid in the
embedment process by staggering their positions relative to each other, as shown in
Figure 6.8, as deliver their loads of aggregate to the spreader.
Figure 6.8 Dump Trucks in Staggered Pattern
One of the rollers blew a hydraulic hose after rolling test sections 1, 1s, 2 and 2s.
Therefore, the rest of the test sections only had one roller, which is not considered best
practice due to the fact that the rolling process is the slowest part of the chip seal
installation and may not keep pace with the operation before the emulsion cures.
However, from the performance results (Table 6.1 and Table 6.2), it appears that any
detrimental effect of having only one roller on the test sections was compensated by the
dump truck rolling contribution.
Proper traffic control methods are also important for ensuring adequate emulsion cure
time. The ODOT Divisions use pilot cars and flaggers, as well as warning signs such as
“Loose Gravel”, as illustrated in Figure 6.9, to keep traffic off of the newly chip sealed
surface, as well as to protect and warn the traveling public.
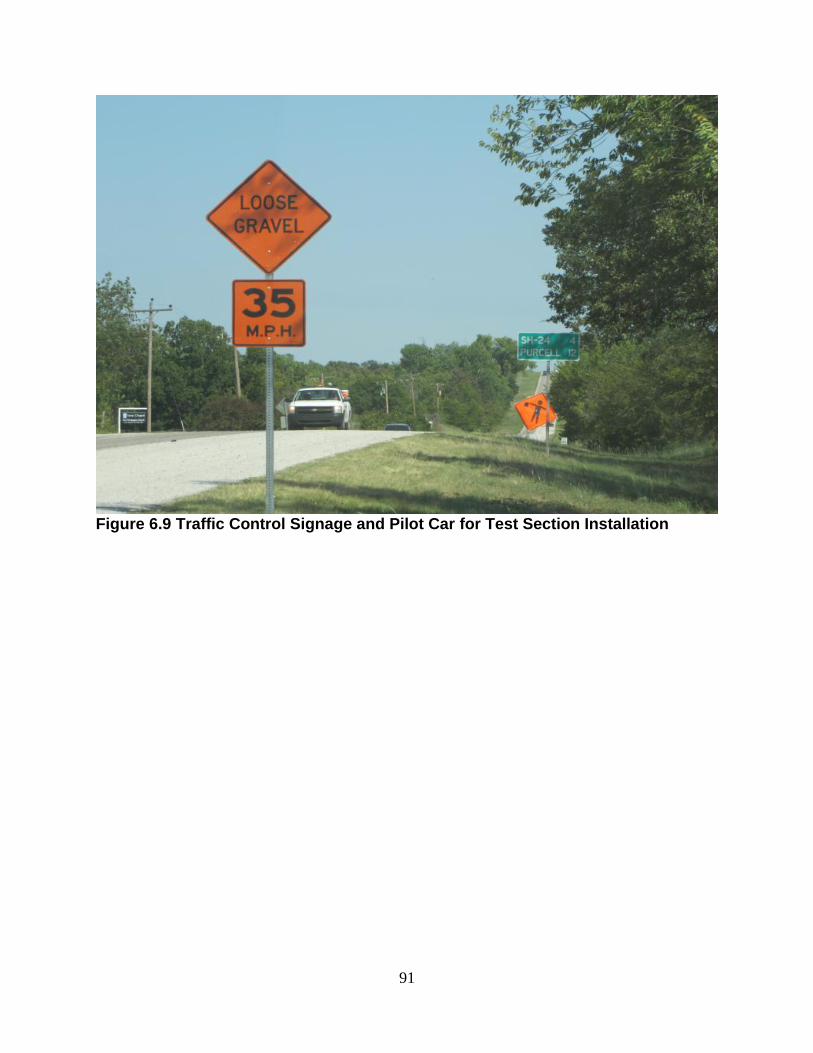
91
Figure 6.9 Traffic Control Signage and Pilot Car for Test Section Installation
92
7.0 CONCLUSIONS The following conclusions can be drawn from the preceding analyses:
1. Protocol for determining SFE of emulsion using contact angles has been developed.
2. The compatibility ratios indicate that the aggregate and emulsion materials from the
listed sources are compatible and will not be the cause of short term failure in
Oklahoma chip seals.
3. The newly developed performance-based uniformity coefficient (PUC) resulting in
single size gradations appears to enhance chip seal performance in Oklahoma.
However, authoritative conclusions cannot be drawn based upon the limited data
obtained within the research time frame. Specifically, the research was limited by the
rate of deterioration exhibited in the first year of the chip seal service lives. However,
the results indicate that the ½” single size (PUC) gradation is outperforming the
traditional ODOT ½” gradation.
4. All of the chip seal test sections are performing satisfactorily on the basis of
microtexture (skid resistance) after seven months of service and on the basis of
macrotexture (aggregate retention) after twelve months of service.
5. Based upon the Transit New Zealand Performance Specification (P/17), all test
sections should exceed 6 years of service life on the basis of macrotexture
(“drainability” and aggregate retention).
6. AIMS1 testing results are consistent with previous findings that show a correlation
exists between AIMS properties (sphericity) and Micro Deval results: aggregate that
exhibits greater sphericity (cubical shape) may exhibit greater resistance to
degredation due to impact and abrasion.
7. AIMS testing has shown that there are statistically significant differences between
aggregate sources in Oklahoma that may impact chip seal performance.
8. AIMS1 and AIMS2 (new generation AIMS) provide comparable shape results;
however, a statistically significant difference exists between texture results.
9. Testing has provided further support for potential links between AIMS results and
field performance.
93
10. There was no difference in AIMS1 gradient angularity and texture output for the
aggregate obtained during construction of the various test sections. This is
consistent with the similar skid numbers exhibited by all test sections.
11. There was a difference in AIMS sphericity output for the aggregate obtained during
construction of the various test sections. The larger size fractions provided higher
sphericity indices. This is consistent with the greater macrotexture performance of
the single size chip seals, which contain approximately twice as much of the larger
aggregate than the traditional chip seals.
12. Fog seal and geosynthetic fabric has not improved chip seal performance in the
short term.
13. ODOT chip seal construction practices are consistent with best practices as noted in
NCHRP 342: Synthesis Chip Seal Best Practices. However, time between rolling
operation and opening to traffic was an hour or less for all but one ODOT Division.
Actual emulsion cure times was not measured as part of this research effort, but
literature supports keeping the chip seal section closed until the emulsion has cured
to ensure adequate aggregate retention.

94
8.0 REFERENCES 1. Kearby, J.P. Tests and Theories on Penetration Surfaces, Proceedings, Highway Research Board, 1953,Volume 32. 2. McLeod, N. W. “A General Method of Design for Seal Coats and Surface Treatments,” Proceedings Association of Asphalt Paving Technologists, 1962,
Vol. 38, pp. 537–630. 3. Gransberg, D.D., and James, D.B. “NCHRP Synthesis of Highway Practice 342:
Chip Seal Best Practices,” Transportation Research Board, Washington, D.C., 2005; http://tris.trb.org/view.aspx?type=MO&id=755197 (accessed on April 27, 2011).
4. Gransberg, D.D., Zaman, M., Reimer, C. and Pittenger, D. “Quantifying the Costs and Benefits of Pavement Retexturing as a Pavement Preservation Tool,” Final report (OTCREOS7.1-16) submitted to Oklahoma Transportation Center, December, 2010a, 110p.
5. Lawson, W.D., and Senadheera, S. “Chip Seal Maintenance Solutions for Bleeding and Flushed Pavement Surfaces,” Journal of Transportation Research Record 2108, Transportation Research Board of the National Academies, Washington, D.C., 2009, pp. 61-68.
6. Gransberg, D.D., Zaman, M., and Aktas, B. “Performance Analysis of Aggregate/Binder Combinations Used for the ODOT Chip Seal Program,” Final Report (FHWA-OK-10-PS01; Item 2221) submitted to Oklahoma Department of Transportation, 2010b.
7. Masad, E., “Aggregate Imaging System (AIMS): Basics and Applications,” Report 5-1707-01-1, Texas Transportation Institute, TX, November, 2005.
8. Masad, E. “Aggregate Imaging System (AIMS) basics and applications” Report no. FHWA/TX-05/5-1707-01-1, Texas Department of Transportation and Federal Highway Administration, Washington, D.C., 2004.
9. Masad, E., Olcott, D., White, T., and Tashman, L. “Correlation of Fine Aggregate Imaging Shape Indices with Asphalt Mixture Performance,” Transportation Research Record, Journal of the Transportation Research Board 1757, 2001, pp. 148–156.
10. Lee, J.S. and Kim, Y.R. “Performance-Based Uniformity Coefficient of Chip Seal Aggregate,” Journal of the Transportation Research Board, No. 2108, Transportation Research Board of the National Academies, Washington, D.C., 2009, pp. 53–60.
11. Gransberg, D.D., S. Senadheera, and I. Karaca. Analysis of Statewide Chip seal Constructability Review, Texas Department of Transportation Research Report TX- 98/0-1787-1R, 1999, Texas Tech University, Lubbock, Texas.
12. Senadheera, S.P. and J.R. Khan, “Standardized Seal Coat Terminology Pamphlet,” TxDOT Research Implementation Study Number 5-1787, Center For Multidisciplinary Research in Transportation, Texas Tech University, Lubbock, 2001.
13. Abdul-Malak, M.-A.U., D.W. Fowler, and A.H. Meyer. “Major Factors Explaining Performance Variability of Seal Coat Pavement Rehabilitation Overlays,” Transportation Research Record 1338, Transportation Research Board, National Research Council, Washington, D.C., pp. 140–149, 1993.
95
14. Eltahan, A.A., J.F. Daleiden, and A.L. Simpson, “Effectiveness of Maintenance Treatments of Flexible Pavements,” Transportation Research Record 1680, Transportation Research Board, National Research Council, Washington, D.C., 1999, pp. 18–25.
15. Epps, J.A., Chaffin, C.W., and Hill, A.J. “Field Evaluation of a Chip seal Design Method,” Research Report 214-23, Texas Transportation Institute, Texas A&M University System, College Station, 1980.
16. Galehouse, L., J.S. Moulthrop, and R.G. Hicks, “Principles for Pavement Preservation: Definitions, Benefits, Issues and Barriers,” TR News, September/October 2003, pp.4-9.
17. Hanson, F.M. “Bituminous Surface Treatments of Rural Highways,” Proceedings, New Zealand Society of Civil Engineers, Volume 21, 1934.
18. Benson, F.J. and B.M. Gallaway, “Retention of Cover Stone by Asphalt Surface Treatments,” Bulletin 133, Texas Engineering Experiment Station, Texas A&M University System, College Station, 1953, 58 pp.
19. Harris, J.R. Surface Treatments of Existing Bituminous Surfaces, Proceedings of the Symposium on Chip seals and Surface Treatments for Existing Bituminous Surfaces, Technical Sessions of the Associations of Asphalt Paving Technologists held at New Orleans, Louisiana, 1955, Volume 24.
20. Epps, J.A., Galloway, B.M, and Brown, M.R. “Synthetic Aggregate Chip Seal,” Research Report83-2F, Texas Transportation Institute, Texas A&M University System, College Station, 1974.
21. Gallaway, B.M. and W.J. Harper, “Laboratory and Field Evaluation of Lightweight Aggregates as Coverstone for Seal Coats and Surface Treatments,” Highway Research Record 50, Transportation Research Board, National Research Council, Washington, D.C., 1966b, pp. 25–81.
22. Kandhal, P., and F. Parker, Jr. “Aggregate Tests Related to Asphalt Concrete Performance in Pavements.” National Cooperative Highway Research Program Report 405, Transportation Research Board, National Research Council, 1998, Washington, D.C.
23. Amirkhanian, S., D. Kaczmarek, and J. Burati, "Effects of Los Angeles Abrasion Test Values on the Strengths of Laboratory-Prepared Marshall Specimens," Transportation Research Record, No. 1301, 1991, pp. 77-86.
24. Rogers, C. “Canadian Experience with the Micro-Deval Test for Aggregates.” Advances in Aggregates and Armourstone Evaluation 13, 1998, 139-147.
25. Lane, B., C. Rogers, and S. Senior. “The Micro-Deval Test for Aggregates in Asphalt Pavement.” Presented at the 8th Annual Symposium of International Center for Aggregate Research, 2000, Denver, Colorado.
26. Cooley, L. Jr., and R. James. “Micro-Deval Testing of Aggregates in the Southeast.” Transportation Research Record 1837, Transportation Research Board, Washington, D.C., 2003, 73-79.
27. AASHTO TP81-10 “Determining Aggregate Shape Properties by Means of Digital Image Analysis,” 2010.
28. Janisch, D., and Gaillard, F.“Minnesota Seal Coat Handbook,” MN/RC-1999-07, Minnesota Department of Transportation, Maplewood, 112, 1998.

96
29. Al-Rousan, T.M. “Characterization of Aggregate Shape Properties Using a Computer Automated System.” PhD Dissertation, Texas A&M University, College Station, 2004, Texas.
30. Senadheera, S., R. W. Tock, M. S. Hossain, B. Yazgan, and S. Das. (2006). “A Testing and Evaluation Protocol to Assess Seal Coat Binder-Aggregate Compatibility,” Report- FHWA/TX-06/0-4362-1, Texas Tech University, Lubbock, TX.
31. Shuler, S., Lord, A., Epps-Martin, A., and Hoyt, D. “Manual for Emulsion-Based Chip Seals for Pavement Preservation,” NCHRP Report No. 680, Washington, D.C. 2011.
32. Bhasin, Amit and Little, Dallas N., “Characterization of Aggregate Surface Energy Using the Universal Sorption Device,” Journal of Materials in Civil Engineering, American Society of Civil Engineers, Volume 19, Number 8, pp. 634 – 641, 2007.
33. Bulut, R., Zaman, M. and Cross, S. “WMA Pavements in Oklahoma: Moisture Damage and Performance Issues,” Quarterly progress report on project OTCREOS10.1-06 submitted to Oklahoma Transportation Center, December, 2010.
34. Cheng, D. X., Little, D. N., Lytton, R. L., and Holste, J. C., “Surface Free Energy Measurements of Asphalt and Its Application to Predicting Fatigue and Healing in Asphalt Mixtures,” Journal of the Transportation Research Record, No. 1810, Transportation Research Board of the National Academies, Washington, D.C., 2002b, pp. 44-53.
35. Cheng, D. X., Little, D. N., Lytton, R. L., and Holste, J. C., “Use of Surface Free Energy Properties of the Asphalt-Aggregate System to Predict Damage Potential,” Journal of the Association of Asphalt Paving Technologists, Vol. 71, 2002a, pp. 59-88.
36. Howson, J., Masad, E. A., Bhasin, A., Branco, V. C., Arambula, E., Lytton, R., and Little, D. “System For The Evaluation Of Moisture Damage Using Fundamental Material Properties,” Report No. FHWA/TX-07/0-4524-1, Texas Department of Transportation, March, 2007 http://www.fhwa.dot.gov/pavement/preservation/091205.cfm (Last accessed: April 12, 2010).
37. Bhasin, A., Masad, E., Little, D. N., Lytton, R., “Limits on Adhesion Bond Energy for Improved Resistance of Hot Mix Asphalt to Moisture Damage.” Transportation Research Record: Journal of Transportation Research Board, Vol. 1970, pp. 3-13, 2006.
38. Roque, R., D. Anderson, and M. Thompson (1991). “Effect of Material, Design, and Construction Variables on Seal-Coat Performance,” Transportation Research Record 1300, Transportation Research Board, National Research Council, Washington, D.C., pp. 108–115.
39. Noyce, D.A., H.U. Bahia, J.M. Yambo, and G. Kim, “Incorporating Road Safety into Pavement Management: Maximizing Asphalt surface Friction for Road Safety Improvements,” Midwest Regional University Transportation Center, Madison, Wisconsin, 2005.

97
40. Neubert, T.W., “Runway Friction Measurement and Reporting Procedures,” Presentation to 2006 Airfield Operations Area Expo and Conference, Milwaukee, Wisconsin, p.3, 2006.
41. National Cooperative Highway Research Program, Evolution and Benefits of Preventative Maintenance Strategies, Synthesis of Highway Practice No. 153, National Cooperative Highway Research Program, Transportation Research Board, Washington, D.C., 1989.
42. Pidwerbesky, B.D., D.D. Gransberg, R. Stemprok, and J. Waters, Road Surface Texture Measurement Using Digital Image Processing and Information Theory, Land Transport New Zealand Research Report 290, 42pp, 2006.
43. Hall, J.W. “Guide for Pavement Friction,” American Association of State Highway and Transportation Officials, 2006, http://www.transportation.org/sites/design/docs/Friction%20Guide%20with%20AASHTO%20changes%20-%208-14-2007%20line%20nos.pdf, September 22, 2007.
44. Manion, M. and S.L. Tighe, “Performance-Specified Maintenance Contracts: Adding Value Through Improved Safety Performance,” Transportation Research Record: Journal of the Transportation Research Board 1990, Transportation Research Board of the National Academies, Washington, D.C., pp. 72-79, 2007.
45. Transit New Zealand (TNZ), Notes for the Specification for Bituminous Reseals, TNZ P17, Wellington, New Zealand, 2002.
46. Gransberg, D.D., “Using a New Zealand Performance Specification to Evaluate US Chip Seal Performance,” Journal of Transportation Engineering, ASCE, Vol. 133 (12), pp 688-695, 2007.
47. Doty, R.N., “A Study of the Sand Patch and Outflow Meter Methods of Pavement Surface Texture Measurement,” Proceedings, ASTM 1974 Annual Meeting, Washington, D.C., 35pp, June 27, 1974.
48. (ASTM E274) American Society for Testing and Materials, International, Standard Test Method for Skid Resistance of Paved Surfaces Using a Full-Scale Tire, ASTM International, West Conshohocken, PA, 2009, http://www.astm.org, July 16, 2010.
49. Seiter, S. Verbal Communication, Assistant Division Engineer, Materials Division, Oklahoma Department of Transportation, 2011.
50. Bathina, M. “Quality Analysis of the Aggregate Imaging System (AIMS) Measurements,” MS Thesis, Civil Engineering, Texas A&M University, 2005.
51. Federal Highway Administration, Aggregate Image Measurement System 2 (AIMS2): Final Report, Addendum 1, Highways for Life Final Report, Grant Number DTFH61-08-G-00003, Online, http://www.fhwa.dot.gov/hfl/partnerships/aims2/aims2_11.cfm, Last accessed, December, 2012.
52. van Oss, C.J., et al. (1988). “Interfacial Liftshitz-van der Waals and Polar Interactions in Macroscopic Systems.” Chemical Reviews, Vol. 88, pp. 927-941.
53. van Oss, C.J. (1994). “Interfacial Forces in Aqueous Media.” Marcel Dekker, Inc., New York.
54. van Oss, C.J. (2002). “Use of the Combined Lifshitz-van der Waals and Lewis Acid-base Approaches in Determining the Apolar Contributions to Surface and

98
Interfacial Tensions and Free Energies.” Journal of Adhesion Science and Technology, Vol. 16, 669-677.
55. Yildirim, I. (2001). “Surface Free Energy Characterization of Powders.” Ph.D. Dissertation, Virginia Polytechnic Institute and State University, Blacksburg, Virginia.
56. Zaman, M., D.D. Gransberg, C. Riemer, D.M. Pittenger and B. Aktas, 2011. “Quantifying the Costs and Benefits of Pavement Retexturing as a Pavement Preservation Tool,” Final Report, Oklahoma Transportation Center.
57. (FHWA) U.S. Department of Transportation Federal Highway Administration, 2011. FHWA'S List of Preservation Methods for Asphalt Pavements. Retrieved on December 31, 2011 from http://www.fhwa.dot.gov/pavement/preservation/ppc0612.cfm.
58. Outcalt, W. (2001). SHRP Chip Seal. Report No. CDOT-DTD-R-2001-20, Colorado Department of Transportation Research Branch.
59. (AEMA) Asphalt Emulsion Manufacturers Association (2011). “Fog Seal”. Retrieved on January 12, 2012 from www.aema.org/index.
60. Prapaitrakul N., Freeman, T. and C. J. Glover (2005). “Analyze Existing Fog Seal Asphalts and Additives: Literature Review,” Texas Transportation Institute, Technical Report FHWA/TX-06/0-5091-1, College Station, Texas.
61. Lu, Q. and B. Steven (2006). Technical Memorandum UCPRC-TM-2006-10: Friction Testing of Pavement Preservation Treatments: Literature Review. California Department of Transportation (Caltrans) Division of Research and Innovation and Division of Maintenance. University of California Pavement Research Center, UC Davis and Berkeley.
62. Estakhri, C. K., and H. Agarwal (1991). Effectiveness of Fog Seals and Rejuvenators for Bituminous Pavement Surfaces. Research Report 1156-1F, Project No. 1156, Texas Transportation Institute, College Station.
63. Davis, L. and J. Miner, 2010. “Chip Sealing Over Paving Fabric in Various Climatic Conditions,” Paper 21, First International Conference on Pavement Preservation, Newport Beach, CA.
64. Li, S., T. Shield, S. Noureldin and Y. Jiang, 2012. “A Field Evaluation of Surface Friction Performance of Chip Seals in Indiana,” National Academy of Sciences, Transportation Research Board Annual Meeting, Washington DC
65. Anderson, S.D., and D.J. Fisher, Constructability Review Process of Transportation Facilities, National Cooperative Highway Research Program Report 390, , Transportation Research Board, National Research Council, Washington, D. C., 1997.
66. Shuler, S. and A. Lord, 2010. “Determining Time to Uncontrolled Trafficking After Chip Seal Construction,” Paper 5, First International Conference on Pavement Preservation, Newport Beach, CA.
.

1
APPENDIX A - Outline Specification for Single Size Chip Seal The following outline specification is a product of this research. It should be noted that
performance data resulting from this study, upon which the specification
recommendations are based, was limited to the first year of the service life of the chip
seal test sections. The specification may enhance Oklahoma Department of
Transportation (ODOT) chip seal design and performance through introducing new
criteria for the selection of cover aggregate and binder. These criteria are based upon
the recent technological advances in the characterization of aggregate shape and
texture as well as aggregate-binder compatibility. Specifically, the specification includes
metrics for aggregate index properties obtained from the Aggregate Imaging System
(AIMS) and performance-based uniformity coefficients (PUC). It also uses the surface
free energy (compatibility ratio) approach in evaluation of the aggregate-binder
compatibility. Lastly, effective chip seal construction practices are incorporated.
SINGLE SIZE CHIP SEAL
1. DESCRIPTION
This work consists of constructing a single surface, single size treatment of aggregates
and bituminous materials.
2. MATERIALS
Provide materials in accordance with the following sections:
Cover Aggregates (Materials Section): C. Gradation Provide cover aggregates with gradations in accordance with the following:

2
Gradation to have a performance uniformity coefficient (PUC) less than 0.2.
Gradation to meet the following limits for aggregate imaging on the basis of sphericity:
Flat/Elongated
(< 0.6)
Low Sphericity
(0.6 - 0.7) Moderate Sphericity
(0.7 – 0.8) High Sphericity
(> 0.8)
% in Range
27 41 28 4
Bituminous Binder (See Materials Section):
The bituminous binder and aggregate should yield a minimum compatibility ratio
(based on surface free energy (SFE)) of 0.8 to 1.0 for compatibility.
3. EQUIPMENT
4. CONSTRUCTION METHODS
Rolling
Roll the entire surface at a rate of 3500 SY/hour as a standard benchmark.
X. PERFORMANCE*
Use a performance specification* to evaluate chip seal performance on the basis of
macrotexture. The design life of a chip seal is reached when the texture depth drops
below 0.9 mm (0.035 inches) on road surface areas supporting speeds greater than70
km/h (43 mph)” [45]. After twelve months of service, obtain the in-field texture depth
and compare it to the minimum texture depth at 1 year, as calculated by using Equation
14.
Equation 14
Where: Td1 = texture depth in one year (mm)
Yd = design life in years
ALD = average least dimension of the aggregate (mm)
*Based on New Zealand’s P/17, Notes for the Specification of Bituminous Reseals [45]

1
APPENDIX B - Sessile Drop Results
Contact Angles (Probe Liquid: Water)
Aggregate 1st 2nd 3rd Average Std. Dev.
Dolese Cooperton 1 57 54.9 52.8 54.90 2.10
Dolese Cooperton 2 51.1 52 52.9 52.00 0.90
Dolese Cooperton 3 67.1 63.5 66.4 65.67 1.91
Hanson Davis 1 51.7 53.5 54.5 53.23 1.42
Hanson Davis 2 61.7 61.5 59.5 60.90 1.22
Martin Marietta Mill Creek 1 47.98 46.15 41.95 45.36 3.09
Martin Marietta Mill Creek 2 55.57 59.19 58.08 57.61 1.85
Martin Marietta Mill Creek 3 45.3 45 44.5 44.93 0.40
Dolese Hartshorne 62 65.1 65.6 64.23 1.95
Kemp Stone Pryor 1 58.2 55.26 58.25 57.24 1.71
Kemp Stone Pryor 2 61.3 60.04 60.56 60.63 0.63
Contact Angles (Probe Liquid: DIM)
Aggregate 1st 2nd 3rd Ave Std. Dev.
Dolese Cooperton 1 29.2 29.7 30.3 29.80 0.55
Dolese Cooperton 2 43.5 44 44.3 43.93 0.40
Dolese Cooperton 3 40.8 41.7 42.7 41.73 0.95
Hanson Davis 1 38.9 37.4 39.5 39.40 1.08
Hanson Davis 2 45.9 44.4 44.6 44.97 0.81
Martin Marietta Mill Creek 1 45.7 47.4 48.42 47.17 1.37
Martin Marietta Mill Creek 2 48.08 49.72 49.69 49.16 0.94
Martin Marietta Mill Creek 3 42 42.6 40.8 41.80 0.92
Dolese Hartshorne 40.2 43.9 44.4 42.83 2.29
Kemp Stone Pryor 1 43.15 43.58 45.6 44.11 1.31
Kemp Stone Pryor 2 31.92 35.27 36.95 34.71 2.56

2
Contact Angles (Probe Liquid: Ethylene Glycol)
Aggregate 1st 2nd 3rd Ave Std. Dev.
Dolese Cooperton 1 28.4 28.2 26.65 27.70 0.96
Dolese Cooperton 2 34.9 37.9 37.2 36.67 1.57
Dolese Cooperton 3 41.3 46.4 43.8 43.83 2.55
Hanson Davis 1 30.4 30.5 27.9 29.40 1.47
Hanson Davis 2 32.3 34.3 33.1 33.23 1.01
Martin Marietta Mill Creek 1 30.34 28.32 26.53 28.40 1.91
Martin Marietta Mill Creek 2 39.17 40.55 38.51 39.41 1.04
Martin Marietta Mill Creek 3 32.3 34.3 33.1 33.23 1.01
Dolese Hartshorne 35.3 29.3 29.2 31.27 3.49
Kemp Stone Pryor 1 28.88 27.78 27.31 27.99 0.81
Kemp Stone Pryor 2 18.2 17.58 20.36 18.71 1.46
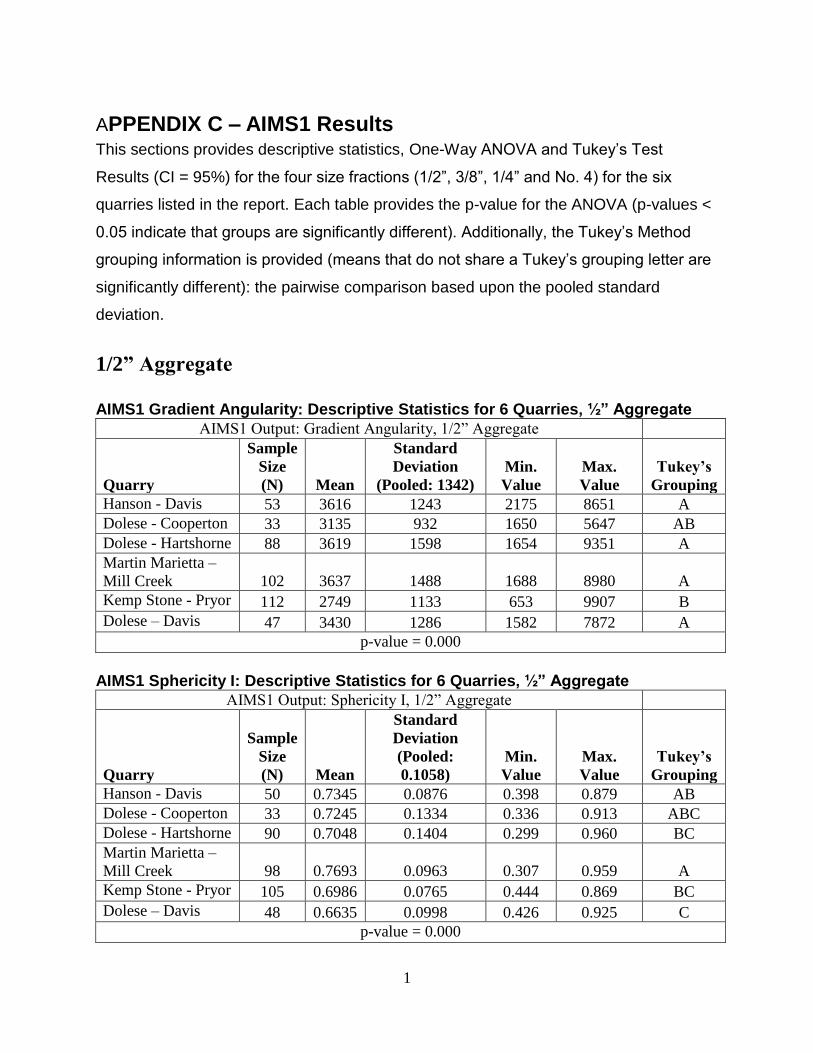
1
APPENDIX C – AIMS1 Results This sections provides descriptive statistics, One-Way ANOVA and Tukey’s Test
Results (CI = 95%) for the four size fractions (1/2”, 3/8”, 1/4” and No. 4) for the six
quarries listed in the report. Each table provides the p-value for the ANOVA (p-values <
0.05 indicate that groups are significantly different). Additionally, the Tukey’s Method
grouping information is provided (means that do not share a Tukey’s grouping letter are
significantly different): the pairwise comparison based upon the pooled standard
deviation.
1/2” Aggregate
AIMS1 Gradient Angularity: Descriptive Statistics for 6 Quarries, ½” Aggregate
AIMS1 Output: Gradient Angularity, 1/2” Aggregate
Quarry
Sample
Size
(N) Mean
Standard
Deviation
(Pooled: 1342)
Min.
Value
Max.
Value
Tukey’s
Grouping
Hanson - Davis 53 3616 1243 2175 8651 A
Dolese - Cooperton 33 3135 932 1650 5647 AB
Dolese - Hartshorne 88 3619 1598 1654 9351 A
Martin Marietta –
Mill Creek 102 3637 1488 1688 8980 A
Kemp Stone - Pryor 112 2749 1133 653 9907 B
Dolese – Davis 47 3430 1286 1582 7872 A
p-value = 0.000
AIMS1 Sphericity I: Descriptive Statistics for 6 Quarries, ½” Aggregate
AIMS1 Output: Sphericity I, 1/2” Aggregate
Quarry
Sample
Size
(N) Mean
Standard
Deviation
(Pooled:
0.1058)
Min.
Value
Max.
Value
Tukey’s
Grouping
Hanson - Davis 50 0.7345 0.0876 0.398 0.879 AB
Dolese - Cooperton 33 0.7245 0.1334 0.336 0.913 ABC
Dolese - Hartshorne 90 0.7048 0.1404 0.299 0.960 BC
Martin Marietta –
Mill Creek 98 0.7693 0.0963 0.307 0.959 A
Kemp Stone - Pryor 105 0.6986 0.0765 0.444 0.869 BC
Dolese – Davis 48 0.6635 0.0998 0.426 0.925 C
p-value = 0.000

2
AIMS1 Sphericity II: Descriptive Statistics for 6 Quarries, ½” Aggregate
AIMS1 Output: Sphericity II, 1/2” Aggregate
Quarry
Sample
Size
(N) Mean
Standard
Deviation
(Pooled:
0.1306)
Min.
Value
Max.
Value
Tukey’s
Grouping
Hanson - Davis 53 0.7567 0.1269 0.3842 0.9938 AB
Dolese - Cooperton 34 0.7138 0.1612 0.3053 0.9525 B
Dolese - Hartshorne 97 0.7450 0.1382 0.3694 1.0000 AB
Martin Marietta –
Mill Creek 106 0.7911 0.1055 0.4472 0.9808 A
Kemp Stone - Pryor 111 0.7557 0.1013 0.5515 0.9963 AB
Dolese – Davis 52 0.5914 0.1878 0.1306 0.9764 C
p-value = 0.000
AIMS1 2D Form: Descriptive Statistics for 6 Quarries, ½” Aggregate
AIMS1 Output: 2D Form, 1/2” Aggregate
Quarry
Sample
Size
(N) Mean
Standard
Deviation
(Pooled: 2.567)
Min.
Value
Max.
Value
Tukey’s
Grouping
Hanson - Davis 55 7.726 2.206 4.57 17.47 A
Dolese - Cooperton 32 7.660 3.129 1.00 18.33 AB
Dolese - Hartshorne 91 8.336 3.376 4.22 19.98 A
Martin Marietta –
Mill Creek 97 7.616 2.073 4.59 14.36 A
Kemp Stone - Pryor 103 6.441 1.351 3.74 9.66 B
Dolese – Davis 53 8.794 3.421 4.41 19.26 A
p-value = 0.000
AIMS1 Texture: Descriptive Statistics for 6 Quarries, ½” Aggregate
AIMS1 Output: Texture, 1/2” Aggregate
Quarry
Sample
Size
(N) Mean
Standard
Deviation
(Pooled: 81.3)
Min.
Value
Max.
Value
Tukey’s
Grouping
Hanson - Davis 56 193.7 69.4 48.0 364.0 C
Dolese - Cooperton 49 293.2 99.3 52.0 501.5 A
Dolese - Hartshorne 53 230.4 77.8 76.5 433.5 BC
Martin Marietta –
Mill Creek 53 244.1 104.7 50.0 518.0 B
Kemp Stone - Pryor 51 138.2 52.3 69.0 289.0 D
Dolese – Davis 53 188.5 74.0 42.0 343.5 C
p-value = 0.000

3
3/8” Aggregate
AIMS1 Gradient Angularity: Descriptive Statistics for 6 Quarries - 3/8” Aggregate
AIMS1 Output: Gradient Angularity, 3/8” Aggregate
Quarry
Sample
Size
(N) Mean
Standard
Deviation
(Pooled:
1374)
Min.
Value
Max.
Value
Tukey’s
Grouping
Hanson - Davis 56 3370 1492 364 8472 AB
Dolese - Cooperton 52 2992 900 1133 6545 AB
Dolese - Hartshorne 85 3623 1613 1851 9400 A
Martin Marietta –
Mill Creek 99 3571 1588 795 9926 AB
Kemp Stone - Pryor 111 3040 1019 1458 7750 B
Dolese – Davis 51 3332 1434 838 7930 AB
p = 0.011
AIMS1 Sphericity I: Descriptive Statistics for 6 Quarries – 3/8” Aggregate
AIMS1 Output: Sphericity I, 3/8” Aggregate
Quarry
Sample
Size Mean
Standard
Deviation
(Pooled:
0.1011)
Min.
Value
Max.
Value
Tukey’s
Grouping
Hanson - Davis 49 0.5398 0.0838 0.3720 0.7580 C
Dolese - Cooperton 52 0.6383 0.0968 0.3390 0.8680 B
Dolese - Hartshorne 94 0.6875 0.1128 0.2890 0.8850 AB
Martin Marietta –
Mill Creek 105 0.7228 0.1046 0.3030 0.9680 A
Kemp Stone - Pryor 105 0.6688 0.0974 0.3960 0.8860 B
Dolese – Davis 50 0.6484 0.0979 0.4090 0.8330 B
p = 0.000
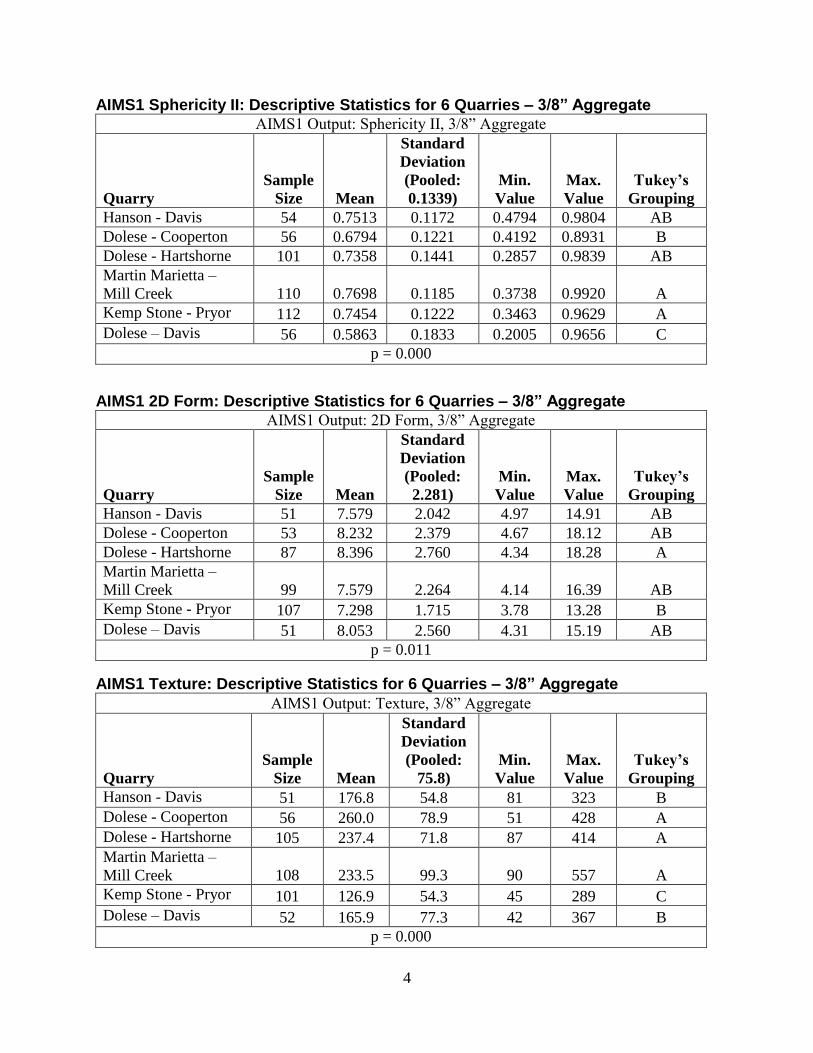
4
AIMS1 Sphericity II: Descriptive Statistics for 6 Quarries – 3/8” Aggregate
AIMS1 Output: Sphericity II, 3/8” Aggregate
Quarry
Sample
Size Mean
Standard
Deviation
(Pooled:
0.1339)
Min.
Value
Max.
Value
Tukey’s
Grouping
Hanson - Davis 54 0.7513 0.1172 0.4794 0.9804 AB
Dolese - Cooperton 56 0.6794 0.1221 0.4192 0.8931 B
Dolese - Hartshorne 101 0.7358 0.1441 0.2857 0.9839 AB
Martin Marietta –
Mill Creek 110 0.7698 0.1185 0.3738 0.9920 A
Kemp Stone - Pryor 112 0.7454 0.1222 0.3463 0.9629 A
Dolese – Davis 56 0.5863 0.1833 0.2005 0.9656 C
p = 0.000
AIMS1 2D Form: Descriptive Statistics for 6 Quarries – 3/8” Aggregate
AIMS1 Output: 2D Form, 3/8” Aggregate
Quarry
Sample
Size Mean
Standard
Deviation
(Pooled:
2.281)
Min.
Value
Max.
Value
Tukey’s
Grouping
Hanson - Davis 51 7.579 2.042 4.97 14.91 AB
Dolese - Cooperton 53 8.232 2.379 4.67 18.12 AB
Dolese - Hartshorne 87 8.396 2.760 4.34 18.28 A
Martin Marietta –
Mill Creek 99 7.579 2.264 4.14 16.39 AB
Kemp Stone - Pryor 107 7.298 1.715 3.78 13.28 B
Dolese – Davis 51 8.053 2.560 4.31 15.19 AB
p = 0.011
AIMS1 Texture: Descriptive Statistics for 6 Quarries – 3/8” Aggregate
AIMS1 Output: Texture, 3/8” Aggregate
Quarry
Sample
Size Mean
Standard
Deviation
(Pooled:
75.8)
Min.
Value
Max.
Value
Tukey’s
Grouping
Hanson - Davis 51 176.8 54.8 81 323 B
Dolese - Cooperton 56 260.0 78.9 51 428 A
Dolese - Hartshorne 105 237.4 71.8 87 414 A
Martin Marietta –
Mill Creek 108 233.5 99.3 90 557 A
Kemp Stone - Pryor 101 126.9 54.3 45 289 C
Dolese – Davis 52 165.9 77.3 42 367 B
p = 0.000

5
1/4” Aggregate AIMS1 Gradient Angularity: Descriptive Statistics for 6 Quarries - 1/4” Aggregate
AIMS1 Output: Gradient Angularity, 1/4” Aggregate
Quarry
Sample
Size
(N) Mean
Standard
Deviation
(Pooled:
1456)
Min.
Value
Max.
Value
Tukey’s
Grouping
Hanson - Davis 83 3847 1728 1320 9820 A
Dolese - Cooperton 76 3537 1512 1373 9156 AB
Dolese - Hartshorne 103 3398 1246 1925 9665 AB
Martin Marietta –
Mill Creek 93 3611 1635 1590 9907 A
Kemp Stone - Pryor 110 2922 1027 1126 9331 B
Dolese – Davis 50 3471 1708 1532 9353 AB
p = 0.001
AIMS1 Sphericity I: Descriptive Statistics for 6 Quarries – 1/4” Aggregate
AIMS1 Output: Sphericity I, 1/4” Aggregate
Quarry
Sample
Size Mean
Standard
Deviation
(Pooled:
0.1047)
Min.
Value
Max.
Value
Tukey’s
Grouping
Hanson - Davis 85 0.6587 0.1171 0.346 0.865 A
Dolese - Cooperton 92 0.5666 0.1044 0.335 0.926 C
Dolese - Hartshorne 105 0.6199 0.1066 0.338 0.922 AB
Martin Marietta –
Mill Creek 97 0.6569 0.0966 0.375 0.955 A
Kemp Stone - Pryor 103 0.6127 0.0967 0.404 0.823 B
Dolese – Davis 47 0.5823 0.1106 0.395 0.841 BC
p = 0.000

6
AIMS1 Sphericity II: Descriptive Statistics for 6 Quarries – 1/4” Aggregate
AIMS1 Output: Sphericity II, 1/4” Aggregate
Quarry
Sample
Size Mean
Standard
Deviation
(Pooled:
0.1374)
Min.
Value
Max.
Value
Tukey’s
Grouping
Hanson - Davis 93 0.7208 0.1384 0.3411 0.9945 A
Dolese - Cooperton 95 0.6309 0.1554 0.2442 0.9502 B
Dolese - Hartshorne 109 0.6929 0.1448 0.3467 0.9789 A
Martin Marietta –
Mill Creek 102 0.6764 0.1139 0.4260 0.9373 AB
Kemp Stone - Pryor 111 0.7137 0.1104 0.4854 0.9630 A
Dolese – Davis 53 0.4746 0.1734 0.1081 0.8612 C
p = 0.000
AIMS1 2D Form: Descriptive Statistics for 6 Quarries – 1/4” Aggregate
AIMS1 Output: 2D Form, 1/4” Aggregate
Quarry
Sample
Size Mean
Standard
Deviation
(Pooled:
2.655)
Min.
Value
Max.
Value
Tukey’s
Grouping
Hanson - Davis 87 8.768 2.692 5.27 19.54 A
Dolese - Cooperton 85 9.464 2.794 1.00 18.53 A
Dolese - Hartshorne 104 8.702 2.773 5.02 17.65 A
Martin Marietta –
Mill Creek 95 8.871 2.942 5.17 18.98 A
Kemp Stone - Pryor 109 7.609 1.956 3.89 15.63 B
Dolese – Davis 52 8.591 2.840 4.79 15.93 AB
p = 0.000
AIMS1 Texture: Descriptive Statistics for 6 Quarries – 1/4” Aggregate
AIMS1 Output: Texture, 1/4” Aggregate
Quarry
Sample
Size Mean
Standard
Deviation
(Pooled:
67.59)
Min.
Value
Max.
Value
Tukey’s
Grouping
Hanson - Davis 107 162.85 50.58 37.0 280.5 BC
Dolese - Cooperton 101 249.06 84.45 55.0 586.5 A
Dolese - Hartshorne 110 182.89 65.22 50.5 329.0 B
Martin Marietta –
Mill Creek 106 178.01 77.37 51.0 364.0 B
Kemp Stone - Pryor 100 125.16 51.37 56.0 270.0 D
Dolese – Davis 53 141.08 72.11 24.0 345.0 CD
p = 0.000
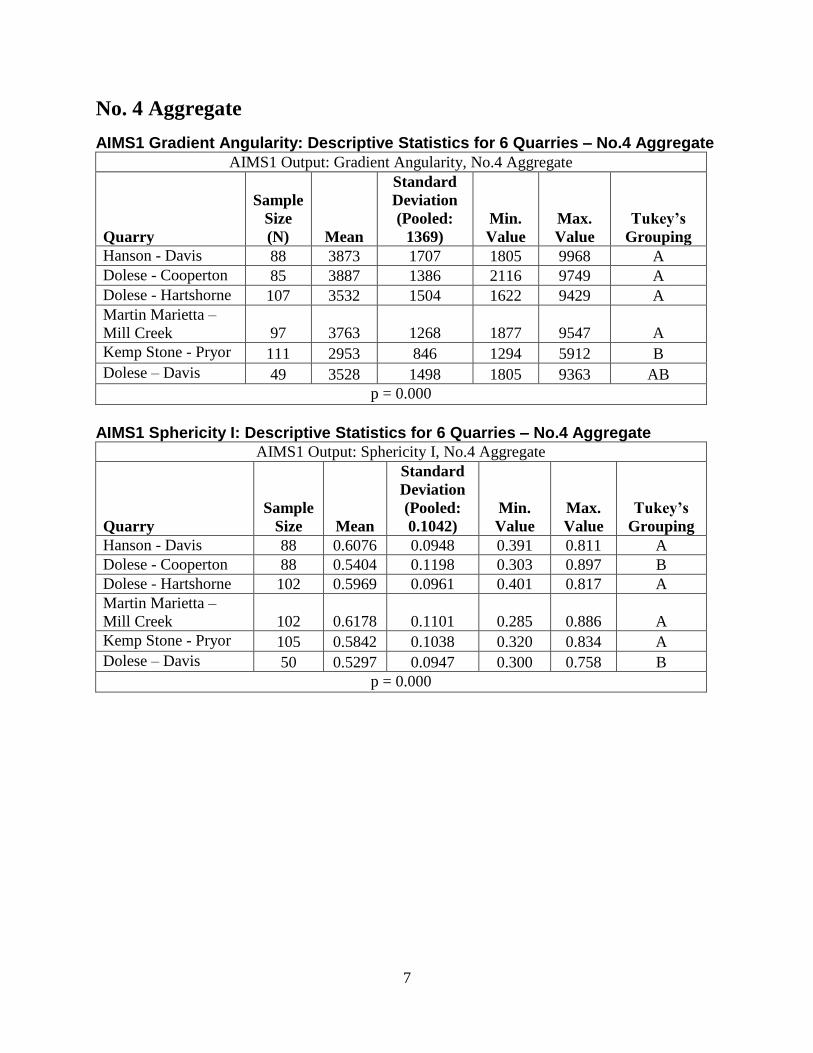
7
No. 4 Aggregate
AIMS1 Gradient Angularity: Descriptive Statistics for 6 Quarries – No.4 Aggregate
AIMS1 Output: Gradient Angularity, No.4 Aggregate
Quarry
Sample
Size
(N) Mean
Standard
Deviation
(Pooled:
1369)
Min.
Value
Max.
Value
Tukey’s
Grouping
Hanson - Davis 88 3873 1707 1805 9968 A
Dolese - Cooperton 85 3887 1386 2116 9749 A
Dolese - Hartshorne 107 3532 1504 1622 9429 A
Martin Marietta –
Mill Creek 97 3763 1268 1877 9547 A
Kemp Stone - Pryor 111 2953 846 1294 5912 B
Dolese – Davis 49 3528 1498 1805 9363 AB
p = 0.000
AIMS1 Sphericity I: Descriptive Statistics for 6 Quarries – No.4 Aggregate
AIMS1 Output: Sphericity I, No.4 Aggregate
Quarry
Sample
Size Mean
Standard
Deviation
(Pooled:
0.1042)
Min.
Value
Max.
Value
Tukey’s
Grouping
Hanson - Davis 88 0.6076 0.0948 0.391 0.811 A
Dolese - Cooperton 88 0.5404 0.1198 0.303 0.897 B
Dolese - Hartshorne 102 0.5969 0.0961 0.401 0.817 A
Martin Marietta –
Mill Creek 102 0.6178 0.1101 0.285 0.886 A
Kemp Stone - Pryor 105 0.5842 0.1038 0.320 0.834 A
Dolese – Davis 50 0.5297 0.0947 0.300 0.758 B
p = 0.000

8
AIMS1 Sphericity II: Descriptive Statistics for 6 Quarries – No.4 Aggregate
AIMS1 Output: Sphericity II, No.4 Aggregate
Quarry
Sample
Size Mean
Standard
Deviation
(Pooled:
0.1491)
Min.
Value
Max.
Value
Tukey’s
Grouping
Hanson - Davis 94 0.6837 0.1248 0.4289 0.9645 A
Dolese - Cooperton 92 0.6045 0.1809 0.1932 0.9840 C
Dolese - Hartshorne 110 0.6898 0.1294 0.3384 0.9887 A
Martin Marietta –
Mill Creek 104 0.6130 0.1416 0.2717 0.9519 BC
Kemp Stone - Pryor 109 0.6699 0.1436 0.3287 0.9945 AB
Dolese – Davis 53 0.4105 0.1870 0.2677 0.8489 D
p = 0.000
AIMS1 2D Form: Descriptive Statistics for 6 Quarries – No.4 Aggregate
AIMS1 Output: 2D Form, No.4 Aggregate
Quarry
Sample
Size Mean
Standard
Deviation
(Pooled:
2.503)
Min.
Value
Max.
Value
Tukey’s
Grouping
Hanson - Davis 90 9.414 2.658 5.90 18.41 AB
Dolese - Cooperton 86 10.082 2.761 5.39 18.63 A
Dolese - Hartshorne 106 8.456 2.187 4.94 17.59 BC
Martin Marietta –
Mill Creek 99 9.329 2.777 5.19 18.62 AB
Kemp Stone - Pryor 109 8.085 1.845 5.28 17.63 C
Dolese – Davis 48 9.773 3.027 5.65 18.63 A
p = 0.000
AIMS1 Texture: Descriptive Statistics for 6 Quarries – No.4 Aggregate
AIMS1 Output: Texture, No.4 Aggregate
Quarry
Sample
Size Mean
Standard
Deviation
(Pooled:
63.78)
Min.
Value
Max.
Value
Tukey’s
Grouping
Hanson - Davis 103 159.04 50.73 41.5 333.5 B
Dolese - Cooperton 101 212.78 79.33 49.5 448.5 A
Dolese - Hartshorne 105 155.73 47.19 45.0 252.0 B
Martin Marietta –
Mill Creek 107 155.99 79.07 33.0 427.5 B
Kemp Stone - Pryor 103 118.63 49.14 33.0 272.0 C
Dolese – Davis 53 141.08 72.11 24.0 345.0 BC
p = 0.000

9
Dolese Davis Aggregate
AIMS1 Gradient Angularity: Descriptive Statistics for Dolese Davis
AIMS1 Output: Gradient Angularity, 4 Size Fractions
Quarry
Sample
Size
(N) Mean
Standard
Deviation
(Pooled:
1492)
Min.
Value
Max.
Value
Tukey’s
Grouping
1/2” Aggregate 47 3430 1286 1582 7872 A
3/8” Aggregate 51 3332 1434 838 7930 A
1/4” Aggregate 50 3471 1708 1532 9353 A
No. 4 Aggregate 49 3528 1498 1805 9363 A
p = 0.927
AIMS1 Radius Angularity: Descriptive Statistics for Dolese Davis
AIMS1 Output: Radius Angularity, 4 Size Fractions
Quarry
Sample
Size
(N) Mean
Standard
Deviation
(Pooled:
3.785)
Min.
Value
Max.
Value
Tukey’s
Grouping
1/2” Aggregate 56 11.311 3.720 5.024 19.768 AB
3/8” Aggregate 52 10.305 3.652 4.182 17.931 B
1/4” Aggregate 50 11.733 4.402 4.675 19.643 AB
No. 4 Aggregate 51 12.442 3.306 6.646 19.378 A
p = 0.037
AIMS1 Sphericity I: Descriptive Statistics for Dolese Davis
AIMS1 Output: Sphericity I, 4 Size Fractions
Quarry
Sample
Size
(N) Mean
Standard
Deviation
(Pooled:
0.1008)
Min.
Value
Max.
Value
Tukey’s
Grouping
1/2” Aggregate 48 0.6635 0.0998 0.426 0.925 A
3/8” Aggregate 50 0.6484 0.0979 0.409 0.833 A
1/4” Aggregate 47 0.5823 0.1106 0.935 0.841 B
No. 4 Aggregate 50 0.5297 0.0947 0.300 0.758 B
p = 0.000
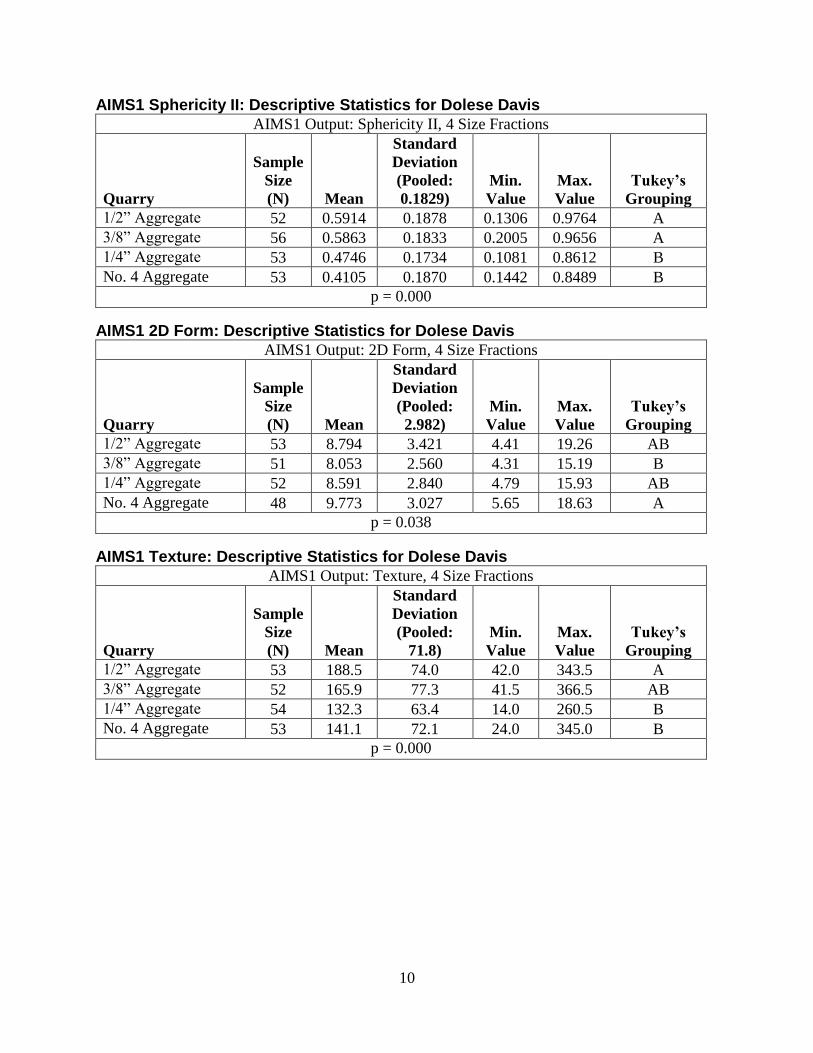
10
AIMS1 Sphericity II: Descriptive Statistics for Dolese Davis
AIMS1 Output: Sphericity II, 4 Size Fractions
Quarry
Sample
Size
(N) Mean
Standard
Deviation
(Pooled:
0.1829)
Min.
Value
Max.
Value
Tukey’s
Grouping
1/2” Aggregate 52 0.5914 0.1878 0.1306 0.9764 A
3/8” Aggregate 56 0.5863 0.1833 0.2005 0.9656 A
1/4” Aggregate 53 0.4746 0.1734 0.1081 0.8612 B
No. 4 Aggregate 53 0.4105 0.1870 0.1442 0.8489 B
p = 0.000
AIMS1 2D Form: Descriptive Statistics for Dolese Davis
AIMS1 Output: 2D Form, 4 Size Fractions
Quarry
Sample
Size
(N) Mean
Standard
Deviation
(Pooled:
2.982)
Min.
Value
Max.
Value
Tukey’s
Grouping
1/2” Aggregate 53 8.794 3.421 4.41 19.26 AB
3/8” Aggregate 51 8.053 2.560 4.31 15.19 B
1/4” Aggregate 52 8.591 2.840 4.79 15.93 AB
No. 4 Aggregate 48 9.773 3.027 5.65 18.63 A
p = 0.038
AIMS1 Texture: Descriptive Statistics for Dolese Davis
AIMS1 Output: Texture, 4 Size Fractions
Quarry
Sample
Size
(N) Mean
Standard
Deviation
(Pooled:
71.8)
Min.
Value
Max.
Value
Tukey’s
Grouping
1/2” Aggregate 53 188.5 74.0 42.0 343.5 A
3/8” Aggregate 52 165.9 77.3 41.5 366.5 AB
1/4” Aggregate 54 132.3 63.4 14.0 260.5 B
No. 4 Aggregate 53 141.1 72.1 24.0 345.0 B
p = 0.000
Related Documents