Devastating Decline of Forest Elephants in Central Africa Fiona Maisels 1,2. *, Samantha Strindberg 1. , Stephen Blake 1¤a , George Wittemyer 3,4 , John Hart 1¤b , Elizabeth A. Williamson 2 , Rostand Aba’a 1¤c , Gaspard Abitsi 1 , Ruffin D. Ambahe 1 , Fide ` l Amsini 1¤d , Parfait C. Bakabana 1¤e , Thurston Cleveland Hicks 6¤f , Rosine E. Bayogo 7 , Martha Bechem 1¤g , Rene L. Beyers 8 , Anicet N. Bezangoye 9 , Patrick Boundja 1 , Nicolas Bout 1¤h , Marc Ella Akou 9¤i , Lambert Bene Bene 10{ , Bernard Fosso 1 , Elizabeth Greengrass 1¤j , Falk Grossmann 1 , Clement Ikamba-Nkulu 1 , Omari Ilambu 1¤i , Bila-Isia Inogwabini 1¤k , Fortune Iyenguet 1 , Franck Kiminou 1 , Max Kokangoye 1,9{ , Deo Kujirakwinja 1 , Stephanie Latour 1,11¤l , Innocent Liengola 1 , Quevain Mackaya 1 , Jacob Madidi 1¤m , Bola Madzoke 1 , Calixte Makoumbou 1¤n , Guy-Aime ´ Malanda 1¤o , Richard Malonga 1 , Olivier Mbani 1¤p , Valentin A. Mbendzo 1,10¤q , Edgar Ambassa 1¤r , Albert Ekinde 1 , Yves Mihindou 1 , Bethan J. Morgan 2,12 , Prosper Motsaba 1 , Gabin Moukala 1¤p , Anselme Mounguengui 10 , Brice S. Mowawa 1¤s , Christian Ndzai 1 , Stuart Nixon 13¤t , Pele Nkumu 1 , Fabian Nzolani 1 , Lilian Pintea 11 , Andrew Plumptre 1 , Hugo Rainey 1¤u , Bruno Bokoto de Semboli 7 , Adeline Serckx 14 , Emma Stokes 1 , Andrea Turkalo 1 , Hilde Vanleeuwe 1 , Ashley Vosper 5,15¤v , Ymke Warren 1{ 1 Global Conservation Program, Wildlife Conservation Society, Bronx, New York, United States of America, 2 School of Natural Sciences, University of Stirling, Stirling, Scotland, United Kingdom, 3 Department of Fish, Wildlife, and Conservation Biology, Colorado State University, Fort Collins, United States of America, 4 Save The Elephants, Karen, Nairobi, Kenya, 5 Lukuru Wildlife Research Foundation, Gombe, Kinshasa, Democratic Republic of Congo, 6 The Institute of Biodiversity and Ecosystem Dynamics, University of Amsterdam, Amsterdam, The Netherlands, 7 Ministe `re des Eaux, Fore ˆts, Chasse et Pe ˆche, Bangui, Central African Republic, 8 Beatty Biodiversity Centre, University of British Columbia, Vancouver, British Columbia, Canada, 9 Direction de la Gestion de la Faune et de la Chasse, Ministe `re des Eaux et Fore ˆ ts, Libreville, Gabon, 10 Central Africa Regional Programme Office, World Wildlife Fund, Yaounde ´, Cameroon, 11 The Jane Goodall Institute, Arlington, Virginia, United States of America, 12 Central Africa Program, Zoological Society of San Diego, Yaounde ´, Cameroon, 13 Zoological Society of London, Regents Park, London, United Kingdom, 14 Behavioral Biology Unit, University of Liege, Liege, Belgium, 15 African Wildlife Foundation, Gombe, Kinshasa, Democratic Republic of Congo Abstract African forest elephants– taxonomically and functionally unique–are being poached at accelerating rates, but we lack range- wide information on the repercussions. Analysis of the largest survey dataset ever assembled for forest elephants (80 foot- surveys; covering 13,000 km; 91,600 person-days of fieldwork) revealed that population size declined by ca. 62% between 2002–2011, and the taxon lost 30% of its geographical range. The population is now less than 10% of its potential size, occupying less than 25% of its potential range. High human population density, hunting intensity, absence of law enforcement, poor governance, and proximity to expanding infrastructure are the strongest predictors of decline. To save the remaining African forest elephants, illegal poaching for ivory and encroachment into core elephant habitat must be stopped. In addition, the international demand for ivory, which fuels illegal trade, must be dramatically reduced. Citation: Maisels F, Strindberg S, Blake S, Wittemyer G, Hart J, et al. (2013) Devastating Decline of Forest Elephants in Central Africa. PLoS ONE 8(3): e59469. doi:10.1371/journal.pone.0059469 Editor: Sergios-Orestis Kolokotronis, Fordham University, United States of America Received May 28, 2012; Accepted February 18, 2013; Published March 4, 2013 Copyright: ß 2013 Maisels et al. This is an open-access article distributed under the terms of the Creative Commons Attribution License, which permits unrestricted use, distribution, and reproduction in any medium, provided the original author and source are credited. Funding: For funding of the survey work the authors thank (in alphabetical order) Nancy Abraham, the African Wildlife Foundation, Beneficia Foundation, Busch Gardens, Columbus Zoo, Conservation International, Daniel K. Thorne Foundation, Diane Fossey Gorilla Foundation International, Espe `ces Phares (European Union), Ecosyste ` mes Forestiers d’Afrique Centrale (ECOFAC), Fauna and Flora International, Frankfurt Zoological Society, IUCN Netherlands, John D. and Catherine T. MacArthur Foundation, KFW, LifeWeb (Spain), National Fund for Scientific Research (FNRS, Belgium), Offield Family Foundation, Operation Loango, Prince Bernhard Wildlife Fund, RAPAC, The Arcus Foundation, The Aspinall Foundation, The Born Free Foundation, The Institute for Biodiversity and Ecosystem Dynamics at The University of Amsterdam, The Jane Goodall Institute, The Liz Claiborne and Art Ortenberg Foundation, The Lucie Burgers Foundation, The Wasmoeth Wildlife Foundation and Karl Ammann, Total Gabon, United States Agency for International Development (USAID CARPE), USFWS Great Ape Conservation Fund, USFWS African Elephant Conservation Fund, Wildlife Conservation Society, World Wildlife Fund and the Zoological Society of London. The funders had no role in study design, data collection and analysis, decision to publish, or preparation of the manuscript. Competing Interests: The authors have the following interest: This study was in part supported by the following: Busch Gardens and TOTAL Gabon. CIB (Congolaise Industrielle du Bois) provided some logistical help for the 2006 and 2010–11 surveys in the following northern Congo sites (Pokola, Kabo, Loundougou. This does not alter the authors’ adherence to all the PLOS ONE policies on sharing data and materials, as detailed online in the guide for authors. * E-mail: [email protected] . These authors contributed equally to this work. PLOS ONE | www.plosone.org 1 March 2013 | Volume 8 | Issue 3 | e59469

Welcome message from author
This document is posted to help you gain knowledge. Please leave a comment to let me know what you think about it! Share it to your friends and learn new things together.
Transcript
Devastating Decline of Forest Elephants in Central AfricaFiona Maisels1,2.*, Samantha Strindberg1., Stephen Blake1¤a, George Wittemyer3,4, John Hart1¤b,
Elizabeth A. Williamson2, Rostand Aba’a1¤c, Gaspard Abitsi1, Ruffin D. Ambahe1, Fidel Amsini1¤d,
Parfait C. Bakabana1¤e, Thurston Cleveland Hicks6¤f, Rosine E. Bayogo7, Martha Bechem1¤g,
Rene L. Beyers8, Anicet N. Bezangoye9, Patrick Boundja1, Nicolas Bout1¤h, Marc Ella Akou9¤i, Lambert
Bene Bene10{, Bernard Fosso1, Elizabeth Greengrass1¤j, Falk Grossmann1, Clement Ikamba-Nkulu1,
Omari Ilambu1¤i, Bila-Isia Inogwabini1¤k, Fortune Iyenguet1, Franck Kiminou1, Max Kokangoye1,9{,
Deo Kujirakwinja1, Stephanie Latour1,11¤l, Innocent Liengola1, Quevain Mackaya1, Jacob Madidi1¤m,
Bola Madzoke1, Calixte Makoumbou1¤n, Guy-Aime Malanda1¤o, Richard Malonga1, Olivier Mbani1¤p,
Valentin A. Mbendzo1,10¤q, Edgar Ambassa1¤r, Albert Ekinde1, Yves Mihindou1, Bethan J. Morgan2,12,
Prosper Motsaba1, Gabin Moukala1¤p, Anselme Mounguengui10, Brice S. Mowawa1¤s, Christian Ndzai1,
Stuart Nixon13¤t, Pele Nkumu1, Fabian Nzolani1, Lilian Pintea11, Andrew Plumptre1, Hugo Rainey1¤u,
Bruno Bokoto de Semboli7, Adeline Serckx14, Emma Stokes1, Andrea Turkalo1, Hilde Vanleeuwe1,
Ashley Vosper5,15¤v, Ymke Warren1{
1 Global Conservation Program, Wildlife Conservation Society, Bronx, New York, United States of America, 2 School of Natural Sciences, University of Stirling, Stirling,
Scotland, United Kingdom, 3 Department of Fish, Wildlife, and Conservation Biology, Colorado State University, Fort Collins, United States of America, 4 Save The
Elephants, Karen, Nairobi, Kenya, 5 Lukuru Wildlife Research Foundation, Gombe, Kinshasa, Democratic Republic of Congo, 6 The Institute of Biodiversity and Ecosystem
Dynamics, University of Amsterdam, Amsterdam, The Netherlands, 7 Ministere des Eaux, Forets, Chasse et Peche, Bangui, Central African Republic, 8 Beatty Biodiversity
Centre, University of British Columbia, Vancouver, British Columbia, Canada, 9 Direction de la Gestion de la Faune et de la Chasse, Ministere des Eaux et Forets, Libreville,
Gabon, 10 Central Africa Regional Programme Office, World Wildlife Fund, Yaounde, Cameroon, 11 The Jane Goodall Institute, Arlington, Virginia, United States of
America, 12 Central Africa Program, Zoological Society of San Diego, Yaounde, Cameroon, 13 Zoological Society of London, Regents Park, London, United Kingdom,
14 Behavioral Biology Unit, University of Liege, Liege, Belgium, 15 African Wildlife Foundation, Gombe, Kinshasa, Democratic Republic of Congo
Abstract
African forest elephants– taxonomically and functionally unique–are being poached at accelerating rates, but we lack range-wide information on the repercussions. Analysis of the largest survey dataset ever assembled for forest elephants (80 foot-surveys; covering 13,000 km; 91,600 person-days of fieldwork) revealed that population size declined by ca. 62% between2002–2011, and the taxon lost 30% of its geographical range. The population is now less than 10% of its potential size,occupying less than 25% of its potential range. High human population density, hunting intensity, absence of lawenforcement, poor governance, and proximity to expanding infrastructure are the strongest predictors of decline. To savethe remaining African forest elephants, illegal poaching for ivory and encroachment into core elephant habitat must bestopped. In addition, the international demand for ivory, which fuels illegal trade, must be dramatically reduced.
Citation: Maisels F, Strindberg S, Blake S, Wittemyer G, Hart J, et al. (2013) Devastating Decline of Forest Elephants in Central Africa. PLoS ONE 8(3): e59469.doi:10.1371/journal.pone.0059469
Editor: Sergios-Orestis Kolokotronis, Fordham University, United States of America
Received May 28, 2012; Accepted February 18, 2013; Published March 4, 2013
Copyright: � 2013 Maisels et al. This is an open-access article distributed under the terms of the Creative Commons Attribution License, which permitsunrestricted use, distribution, and reproduction in any medium, provided the original author and source are credited.
Funding: For funding of the survey work the authors thank (in alphabetical order) Nancy Abraham, the African Wildlife Foundation, Beneficia Foundation, BuschGardens, Columbus Zoo, Conservation International, Daniel K. Thorne Foundation, Diane Fossey Gorilla Foundation International, Especes Phares (EuropeanUnion), Ecosystemes Forestiers d’Afrique Centrale (ECOFAC), Fauna and Flora International, Frankfurt Zoological Society, IUCN Netherlands, John D. and CatherineT. MacArthur Foundation, KFW, LifeWeb (Spain), National Fund for Scientific Research (FNRS, Belgium), Offield Family Foundation, Operation Loango, PrinceBernhard Wildlife Fund, RAPAC, The Arcus Foundation, The Aspinall Foundation, The Born Free Foundation, The Institute for Biodiversity and Ecosystem Dynamicsat The University of Amsterdam, The Jane Goodall Institute, The Liz Claiborne and Art Ortenberg Foundation, The Lucie Burgers Foundation, The WasmoethWildlife Foundation and Karl Ammann, Total Gabon, United States Agency for International Development (USAID CARPE), USFWS Great Ape Conservation Fund,USFWS African Elephant Conservation Fund, Wildlife Conservation Society, World Wildlife Fund and the Zoological Society of London. The funders had no role instudy design, data collection and analysis, decision to publish, or preparation of the manuscript.
Competing Interests: The authors have the following interest: This study was in part supported by the following: Busch Gardens and TOTAL Gabon. CIB(Congolaise Industrielle du Bois) provided some logistical help for the 2006 and 2010–11 surveys in the following northern Congo sites (Pokola, Kabo,Loundougou. This does not alter the authors’ adherence to all the PLOS ONE policies on sharing data and materials, as detailed online in the guide for authors.
* E-mail: [email protected]
. These authors contributed equally to this work.
PLOS ONE | www.plosone.org 1 March 2013 | Volume 8 | Issue 3 | e59469
¤a Current address: Max Planck Institute for Ornithology, Vogelwarte Radolfzell, Radolfzell, Germany¤b Current address: Lukuru Wildlife Research Foundation, Gombe, Kinshasa, Democratic Republic of Congo¤c Current address: Agence Nationale des parcs Nationaux, Libreville, Gabon¤d Current address: Frankfurt Zoological Society, Frankfurt, Germany¤e Current address: International Union for Conservation of Nature, Kabo, Republic of Congo¤f Current address: Max Planck Institute for Evolutionary Anthropology, Leipzig, Germany¤g Current address: MIKE Subregional Office, Yaounde, Cameroon¤h Current address: The Aspinall Foundation, Franceville, Gabon¤i Current address: Central Africa Regional Programme Office, World Wildlife Fund, Yaounde, Cameroon¤j Current address: Bradford on Avon, Wiltshire, United Kingdom¤k Current address: Department of Aquatic Sciences and Assessment, Swedish University of Agricultural Sciences, Uppsala, Sweden¤l Current address: Vaucresson, France¤m Current address: Societe Generale de Surveillance, Bunia, Oriental Province, Democratic Republic of Congo¤n Current address: Mokabi Societe anonyme (Rougier Group), Brazzaville, Republic of Congo¤o Current address: Odzala-Kokoua National Park, African Parks, Brazzaville, Republic of Congo¤p Current address: Environment Department, Association Sylvatrop, Conakry, Guinea¤q Current address: Programme d’Appui a la Conservation des Ecosystemes du Bassin du Congo, Yaounde, Cameroon¤r Current address: Ministry of Forestry and Wildlife, Yaounde, Cameroon¤s Current address: Ministere de l’Economie Forestiere, Brazzaville, Republic of Congo¤t Current address: Fauna & Flora International, Cambridge, United Kingdom¤u Current address: The Biodiversity Consultancy Ltd, Cambridge, United Kingdom¤v Current address: Global Conservation Program, Wildlife Conservation Society, Bronx, New York, United States of America
{ Deceased.
Introduction
The basic information required for effective conservation
management of a species includes population status and distribu-
tion, identification and prioritization of threats, and trends in all of
the above [1]. These metrics are the basis by which the IUCN Red
List assesses the conservation status of species [2], and conserva-
tion policymakers and managers in the field decide on the
management strategies which best serve the taxon in question.
However, these requirements are notoriously difficult to ascertain
and, therefore, lacking for numerous species including one of the
world’s largest terrestrial mammals, the African forest elephant.
There are two distinct types of African elephants, often
considered to be two species: savannah elephants Loxodonta africana
(Blumenbach, 1797) and forest elephants L. cyclotis (Matschie,
1900). In 2003, the IUCN African Elephant Specialist Group
(AfESG) listed them as subspecies (L. a. cyclotis and L. a. africana,
respectively), due to perceived data gaps [3]. However, in 2008
they suggested that further research may reveal more than one
African elephant species [4]. It was proposed that they should be
considered two species on morphological grounds [5] and are
considered as such by the Convention on Migratory Species [6].
Genetic evidence also supports this view [7–15]. The AfESG do,
however, stress that it is important to recognize the different
challenges to the conservation of forest and savannah elephants
[3,16].
African forest elephants have deep ecological differences from
savannah elephants. They are highly frugivorous [17–20] and thus
play an important role in one of Earth’s primary carbon-
sequestering forests [17,21,22]. They can move great quantities
of large seeds many kilometres from the parent tree [17] and are
thus integral for maintaining forest structure and diversity. They
also maintain [23], and possibly create, forest clearings in mineral-
rich soil, on which a wide variety of African forest fauna are
dependent [24,25].
The history of African elephant abundance and distribution is
strongly linked to the commerce in ivory, and their decline since
the 1800s has been documented across the continent [26–28].
Even in the forests of Central Africa, a century ago, there were
very few elephants remaining anywhere along the Gabonese coast,
or around Brazzaville, in what is now the Republic of Congo [29].
It was thought that there was a slow decline in elephant
populations during the 19th century, flattening off in the first half
of the 20th century, and then a steep drop between 1950 and 1989
[28]. Modern African elephant density, based on data up to 2007,
has recently been shown to be correlated with human factors
rather than ecological factors [30].
The elephant subpopulation of Central Africa (which included
some savannah populations in Chad and northern Cameroon) was
recognized in 2008 as Endangered by the IUCN [4]. In 2010, the
African Elephant Action Plan [31] drawn up by all of the African
elephant range states, ranked poaching and illegal trade in
elephant products as the top threat to elephants across the
continent. In the last few years there have been very large and
frequent ivory seizures in Africa and Asia, and the combination of
seizure data analysed by the Elephant Trade Information System
(ETIS) and of elephant carcass data documented and analysed by
the Monitoring the Illegal Killing of Elephants (MIKE) pro-
gramme demonstrate that the illegal trade is escalating [16,32–36].
This increasing trade has been linked to increasing demand and
value of ivory in China [37,38]. The proportion of elephant
carcasses found that had been killed illegally in 2010 was the
highest on record [39] only to be exceeded by 2011 levels [16,35].
Elephant meat is an important by-product, but ivory is the
primary reason for elephant poaching [40]. It is now clear that
elephants in general, and especially the elephants of Central
Africa, are under serious threat [33] and that the poaching since
2011, may be at the level at which all elephant populations are in
net decline [16,31].
The scale of historical forest elephant decline, although
substantial [28,41], has been difficult to quantify due to a lack of
comprehensive, range-wide information on distribution and
density. Previous analyses, collected over a relatively short period
and limited in geographic extent relative to their range, suggested
a growing crisis for elephants in the Central African forests [42]. It
is critical that a broader assessment is provided to understand
range and demographic trends [16]. The Central African forest
block covers about 95% of the current ‘‘known’’ and ‘‘possible’’
range of forest elephants [43]; the remaining 5% are in the forests
of West Africa, to the west of the Cameroon-Nigeria border. We
present the analysis of eighty surveys carried out over the nine-year
period between 2002–2011 across the Central African forest block.
The area stretches from the western Cameroon across to the
eastern border of the Democratic Republic of Congo (DRC). The
analysis responds to recent demands for a rigorous, range-wide
assessment of forest elephant conservation status [16,31]. Trends
Devastating Decline of Forest Elephants, C. Africa
PLOS ONE | www.plosone.org 2 March 2013 | Volume 8 | Issue 3 | e59469
inferred from dung surveys are presented. In addition, landscape
covariates correlated with dung density (a proxy for elephant
density) were analyzed and results discussed with the aim of
providing information to enhance effective conservation policy
and management.
Results
Our results demonstrate a widespread and catastrophic decline
in numbers of forest elephants, in the order of 62%, and a
corresponding range contraction of approximately 30%, during
the nine-year period 2002–2011 represented by this study (Figs. 1
and 2; Tables S2 and S3). Forest elephants now have likely
declined to extremely low density over 75% of their potential
range (Tables S3, S6), and probably have been extirpated from
large sections of this range. Considering 2002–2011 range
contraction relative to elephant habitat per country, ca. 95% of
DRC’s forests are likely to be almost empty of elephants, a country
historically thought to have held the highest numbers (Table S3).
About half of the surviving elephants are in Gabon, and under a
fifth in DRC, despite these countries covering 13% and 62% of the
total forest area, respectively (Table S6). In 2011, less than 2% of
the Central African forest contained elephants at high density
(Table S3). Even for Gabon, in 2011 high density populations
were found in only 14% of the forest (a decline of over 18%
between 2002 and 2011). No high density areas remained in DRC
even in 2002.
Correlates of Decline in Multi-variable ModelsThe overall top-ranked multi-variable model of elephant dung
pile density by increasing Un-Biased Risk Estimator (UBRE) score
included the explanatory variables: hunter-sign frequency, survey
year, proximity to roads, human population density, corruption,
and presence or absence of wildlife guards (Table S5, and Fig. 3).
Site-specific dung-encounter rates and hunter-sign frequency were
significantly negatively correlated–elephants occur where people
do not–and both were strongly influenced by guard presence/
absence (Figs. 4, 5, and 6). Survey year and corruption were
included in almost all of the top-ranking models that included
hunter sign. Models that included hunter-sign frequency were
always better when considering UBRE score than otherwise
identical models that excluded this variable and able to explain on
average 50% of the variability in the data with satisfactory model
fit diagnostics (Table S5, and Fig. 3). The top-ranking models
without the hunter sign covariate were similar to each other in
terms of UBRE score and were able to explain on average 45% of
the variability in the data with satisfactory model fit diagnostics
with models including the HII (Human Influence Index: [44]), in
place of road proximity and human population density, generally a
few percentage points lower; (Table S2, and Fig. S1). Again,
survey year and corruption were included in almost all of these
models. While hunter sign was clearly an important variable, it
was one of the few for which data were collected directly during
the surveys at each site (rather than extracting the information
from GIS data layers, for example). Because it was site collected
and not part of a global dataset such as the HII, it was not
available at all locations across the Central African forests.
Therefore, models containing hunter sign could not be used to
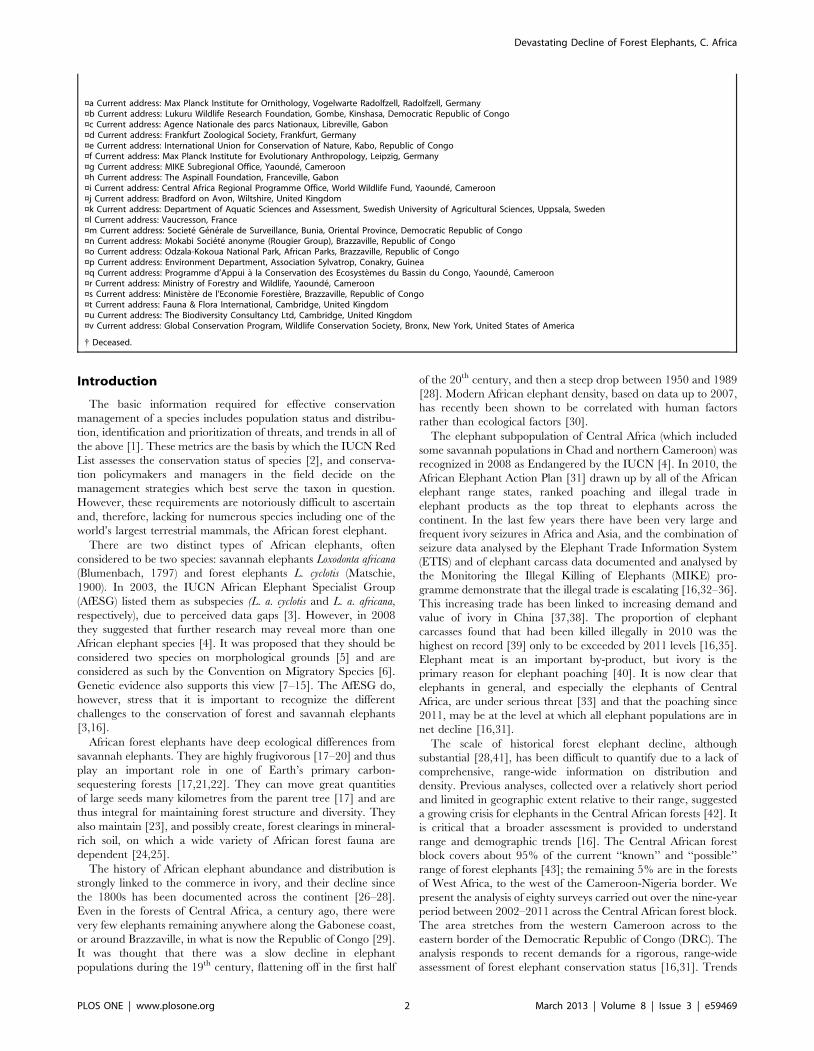
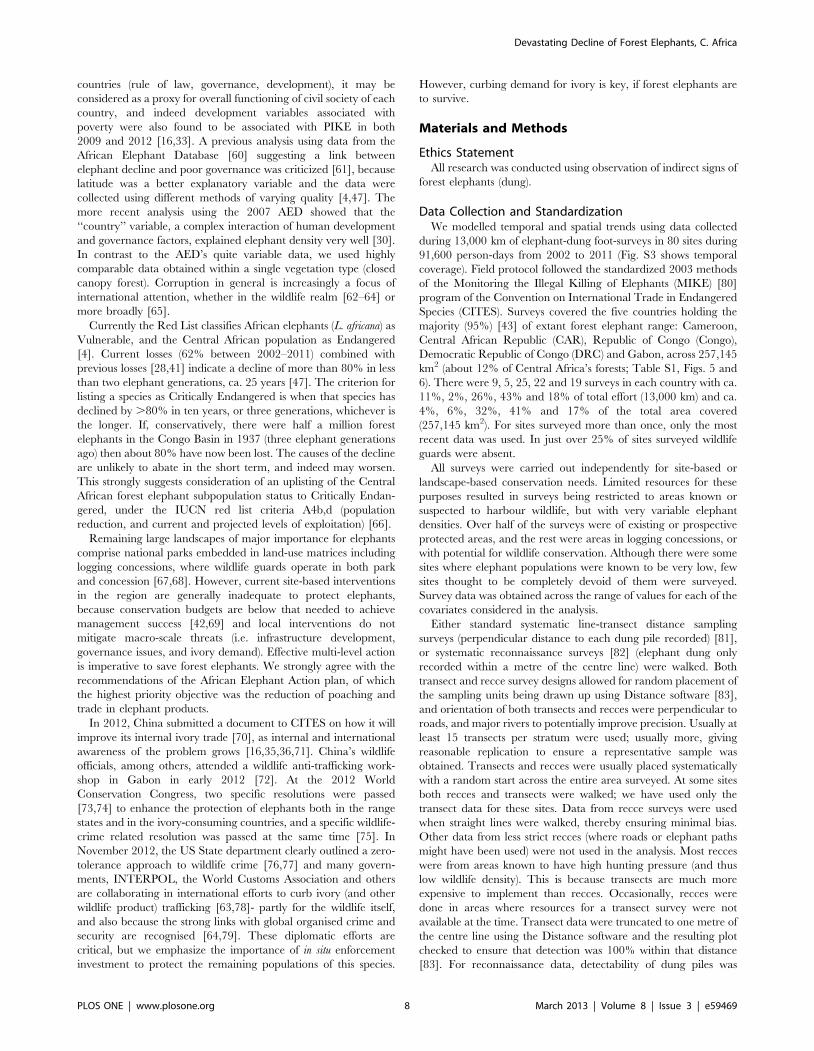
Figure 1. Elephant dung density and range reduction across the Central African forests. Predictions are shown for (A) 2002 and (B) 2011for the model with variables: survey year‘, Human Influence Index***, corruption*** and the presence/absence of guards***, and (C) 2002 and (D)2011 for the model with variables: survey year‘, proximity to road‘, human population density***, corruption*** and the presence/absence ofguards*** (P-values are: ‘***’ ,0.001 and ‘‘’ ,0.1). Increasingly darker shades of green correspond to higher densities, grey represents extremely lowelephant density range (the first interval: 0–100 elephant dung piles/km2) and white is non-habitat (80 survey sites outlined in red). Cutpoints are: 0;100; 250; 500; 1,000; 1,500; 3,000; 5,000; and 7,500 dung piles/km2. Countries 1–5 are: Cameroon; Central African Republic; Republic of Congo; DRC;Gabon.doi:10.1371/journal.pone.0059469.g001
Devastating Decline of Forest Elephants, C. Africa
PLOS ONE | www.plosone.org 3 March 2013 | Volume 8 | Issue 3 | e59469
produce predicted dung density surfaces and to estimate elephant
range and abundance across the entire area of interest.
For the set of top-ranked models that used the variables across
Central Africa, dung density was significantly higher at sites with
wildlife guards and with a designated official protection status
(Fig. 4). Dung density was inversely correlated with corruption as
measured by Transparency International’s Corruption Perception
Index (CPI) [45]; with more widespread distributions and higher
densities in less corrupt countries: Gabon was significantly higher
and DRC significantly lower than the roughly similar Cameroon,
Central African Republic (CAR) and Republic of Congo (Congo)
(Table S3). The regional proxy variables latitude and longitude
appeared frequently among the top-ranking models and also
captured significant variation. Longitude was the better covariate.
In most of the models including either of these variables, these
proxies indicated higher dung densities closer to the equator and
significant decreases further east, which potentially represents site
differences not accounted for by other variables, such as political
instability in the Southeast (Eastern DRC) of the study area [46].
The inclusion of variables such as human population density,
HII, and the presence/absence of wildlife guards always improved
the UBRE score and were always statistically significant. Inclusion
of variables such as proximity to roads, survey year and corruption
in the models also improved the UBRE score, but these variables
were occasionally non-significant. Either the HII or the combina-
tion of proximity to roads and human population density was used
(with only human population density in some models), as the
composite variable HII was highly correlated with the other two
variables that comprise two of several variables used to generate
the HII [44]. When considering the relative performance of the
significantly correlated variables official protection and the
presence/absence of guards (where official protection was low,
there were no guards), the latter was much better in terms of
improvements to the UBRE score and its effect on deviance
explained, and was thus the preferred variable in top-ranking
models. Corruption, as measured by the CPI was very highly
correlated and almost identical to the country factor in terms of
improvements to the UBRE score and its effect on deviance
explained; with the added benefit of providing insights on how
corruption, conceptually associated with poaching, may be
influencing elephant distribution and density by country.
Correlates of Decline in Single-variable ModelsThe single variable modelling results were similar to the multi-
variable models, where all variables considered were significantly
related to elephant dung density (Fig. S2 and Table S4).
Univariate models with the variables longitude, country, corrup-
tion, and survey year were highly ranked, whereas the model with
official protection received the lowest ranking (the UBRE scores
for the remaining variables are also shown in Table S4).
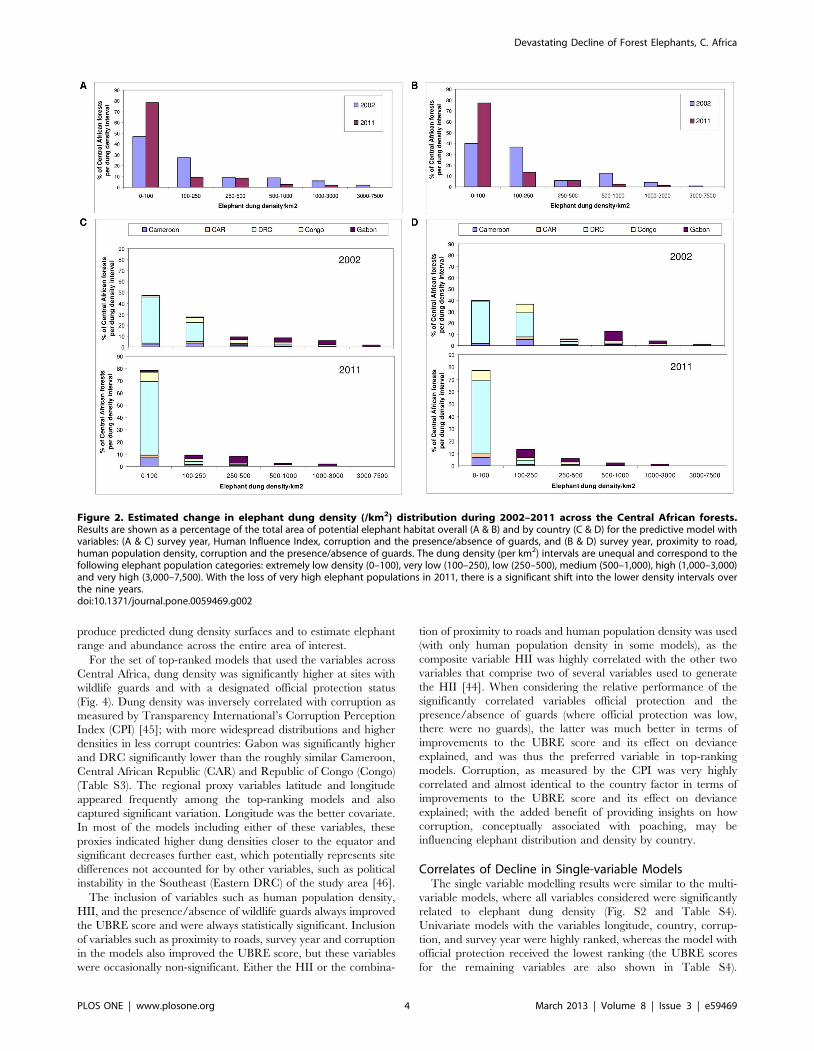
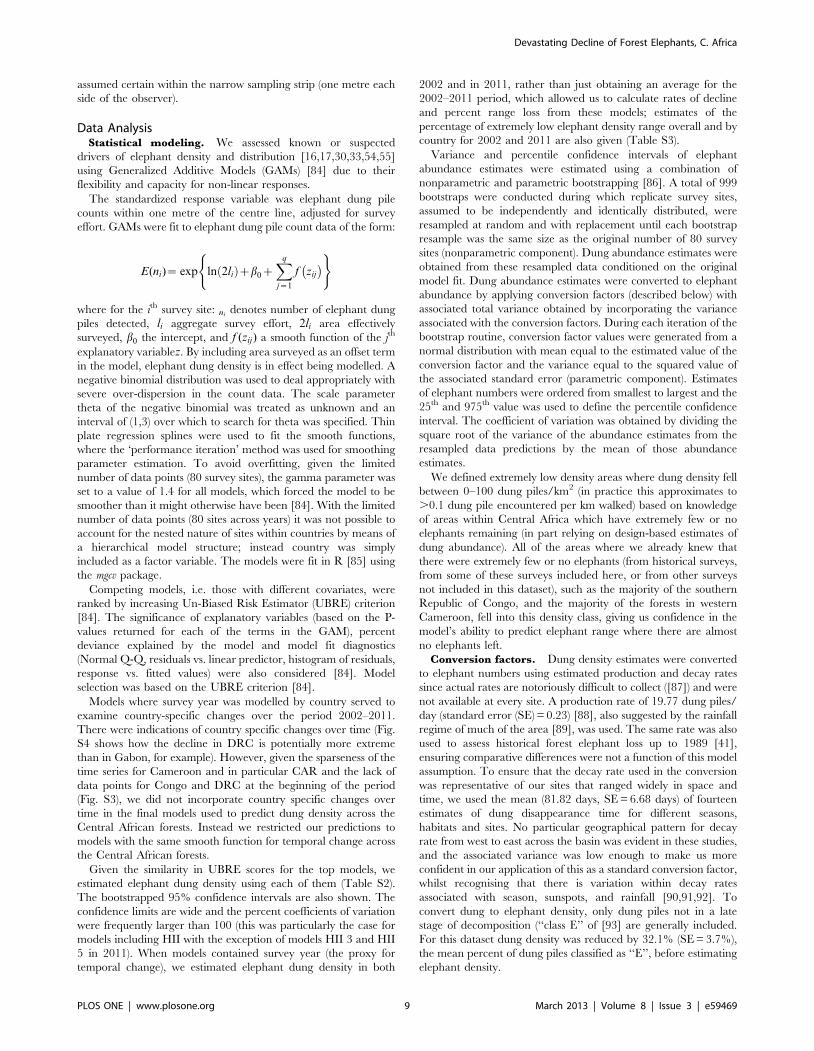
Figure 2. Estimated change in elephant dung density (/km2) distribution during 2002–2011 across the Central African forests.Results are shown as a percentage of the total area of potential elephant habitat overall (A & B) and by country (C & D) for the predictive model withvariables: (A & C) survey year, Human Influence Index, corruption and the presence/absence of guards, and (B & D) survey year, proximity to road,human population density, corruption and the presence/absence of guards. The dung density (per km2) intervals are unequal and correspond to thefollowing elephant population categories: extremely low density (0–100), very low (100–250), low (250–500), medium (500–1,000), high (1,000–3,000)and very high (3,000–7,500). With the loss of very high elephant populations in 2011, there is a significant shift into the lower density intervals overthe nine years.doi:10.1371/journal.pone.0059469.g002
Devastating Decline of Forest Elephants, C. Africa
PLOS ONE | www.plosone.org 4 March 2013 | Volume 8 | Issue 3 | e59469
Univariate models predicted that dung density decreased by (i)
89% as hunter-sign frequency increased from zero to four per km,
(ii) 85% when guards were absent, (iii) 30% or 76% as proximity to
road decreased from 50 to 25 or zero km, (iv) 48%, 75% or 92% as
human density increased from one to five, 10 or 20 people/km2,
and (v) 17% for each unit increase in the HII. Among the survey
site specific variables, human population density had the highest
value for deviance explained, followed by the hunter-sign
frequency, the presence/absence of guards, and the HII. For the
remaining site specific variables (official protection status, prox-
imity to roads, and survey year) the values were considerably
smaller. The highest deviance explained corresponded to country-
level variables, such as country itself and corruption. The proxy
variable longitude also had one of the largest values for deviance
explained, whereas latitude did not (Table S4).
Predictive Modelling of DeclineWe used the top-ranking multi-variable models with available
regional data to predict forest elephant dung density across
Central Africa (Fig. 1 and Table S2). We chose to highlight two
models including predictor variables that elephants might be
responding to directly, rather than latitude and longitude, so as to
avoid using spatial location as a proxy for other processes. These
models also include survey year as a covariate, which allows for
predictions by year and comparisons over time. Results were
consistent across models, and predicted dung density across
Central Africa reflected the map of actual dung encounter rate
(Fig. 5) and also most of the ‘‘Known’’ range described by the
African Elephant Database (AED) [47]. Broadly speaking, whether
using the HII or a combination of road proximity and human
population density, the forested regions of Gabon, northern
Congo, southwestern CAR and southeastern Cameroon contained
the region’s highest elephant densities and almost all the nationally
important elephant populations, while most of DRC, eastern
Congo and southern CAR had very low densities (Fig. 1). The
most country-specific important sites for elephants are as follows:
in Gabon, most of the National Parks and their surroundings
(often Forest Stewardship Council (FSC)-certified logging conces-
sions), especially all of those in the centre and northeast of the
country, plus a long section along the coast. In Congo, about half
of the north of the country can be classed as an important elephant
site, including not only the National Parks of Odzala and
Nouabale-Ndoki (and the soon-to-be declared Ntokou-Pikounda
National Park) but several huge areas of FSC certified timber
concessions that connect and surround these Parks. In the Central
African Republic, the Dzanga-Sangha National Park, and in
Cameroon the whole of the southeast corner of the country, which
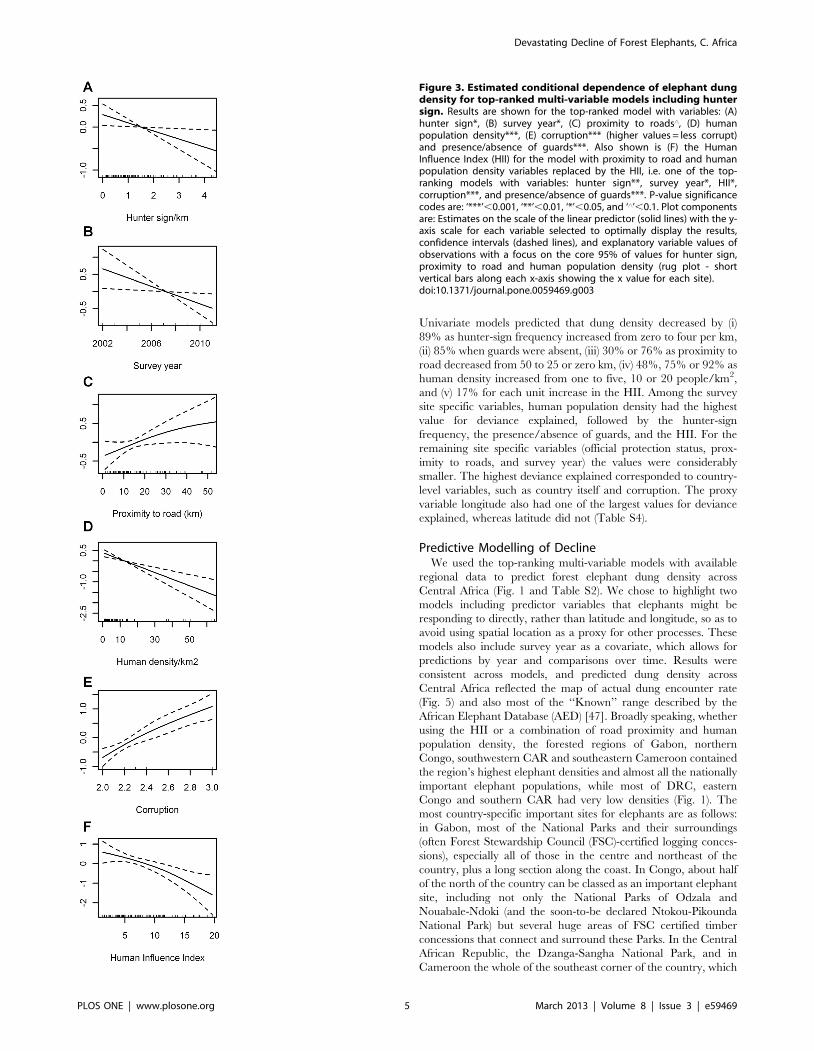
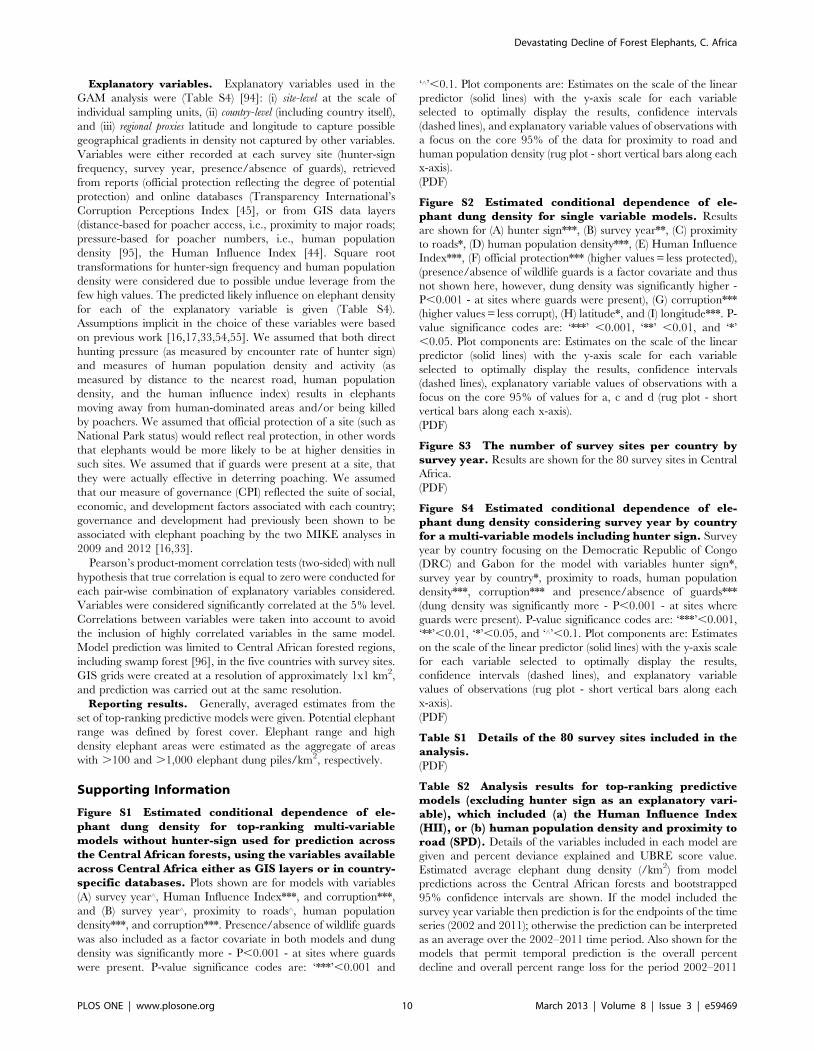
Figure 3. Estimated conditional dependence of elephant dungdensity for top-ranked multi-variable models including huntersign. Results are shown for the top-ranked model with variables: (A)hunter sign*, (B) survey year*, (C) proximity to roads‘, (D) humanpopulation density***, (E) corruption*** (higher values = less corrupt)and presence/absence of guards***. Also shown is (F) the HumanInfluence Index (HII) for the model with proximity to road and humanpopulation density variables replaced by the HII, i.e. one of the top-ranking models with variables: hunter sign**, survey year*, HII*,corruption***, and presence/absence of guards***. P-value significancecodes are: ‘***’,0.001, ‘**’,0.01, ‘*’,0.05, and ‘‘’,0.1. Plot componentsare: Estimates on the scale of the linear predictor (solid lines) with the y-axis scale for each variable selected to optimally display the results,confidence intervals (dashed lines), and explanatory variable values ofobservations with a focus on the core 95% of values for hunter sign,proximity to road and human population density (rug plot - shortvertical bars along each x-axis showing the x value for each site).doi:10.1371/journal.pone.0059469.g003
Devastating Decline of Forest Elephants, C. Africa
PLOS ONE | www.plosone.org 5 March 2013 | Volume 8 | Issue 3 | e59469
includes three National Parks and large areas of FSC-certified
logging concessions. Finally, the two significant sites in DRC are
the Okapi Faunal Reserve and the Salonga National Park, with
smaller but still significant numbers in some of the other forest
areas (including one which may soon be gazetted as a protected
area, known as the Tshuapa-Lomami area).
In areas where there is little or no poaching, elephant density is
usually 0.5–1.0/km2 (data included in this study). Using a
conservative density of 0.5 elephants/km2, historically the 2.2
million km2 Central African forest could have harboured over a
million individuals [28,41] (Fig. 7). Even in 1993, it was estimated
that roughly half of this projected original population remained
[41] (based on their model predictions). Our analysis suggests that
in 2011 just 10% (ca. 100,000 individuals) still survive (99,869 with
95% bootstrapped confidence interval (49,867–187,340) for the
predictive model shown in Fig. 1B). Gabon maintains 30–50% of
its probable historical numbers; DRC only 1% - it was thought
that DRC originally contained almost 60% of all forest elephants,
and had 40% in 1989 [41].
Discussion
Elephants have been recently extirpated from extensive areas of
Africa [30,34,46,47,48] and even sites thought to be well-protected
are no longer safe from ivory poaching [32]. Bouche et al.’s (2011)
study examined the West and Central African savannahs, and
showed that the once large savannah elephant populations had
been reduced to several small pockets of a few hundred animals in
many cases, with only about 7,000 individuals remaining in total.
Shortly after that publication, in early 2012, several hundred
elephants were killed in a matter of a few months, in the Park
holding most of Cameroon’s savannah elephants [49,50]; the
poachers were well-armed and on horseback. In mid-November
2012, the same poachers were heading back to the same Park –
but the Cameroon army were alerted before they arrived [51]. In
February 2013, the Gabonese Government announced the loss of
at least half of the elephants in Minkebe National Park; as many as
11,000 individuals may have been killed between 2004 and 2012
[52]. The rapid increases in demand for, and price of, ivory in
China, and the ease of sale of ivory in China [37,38], the persistent
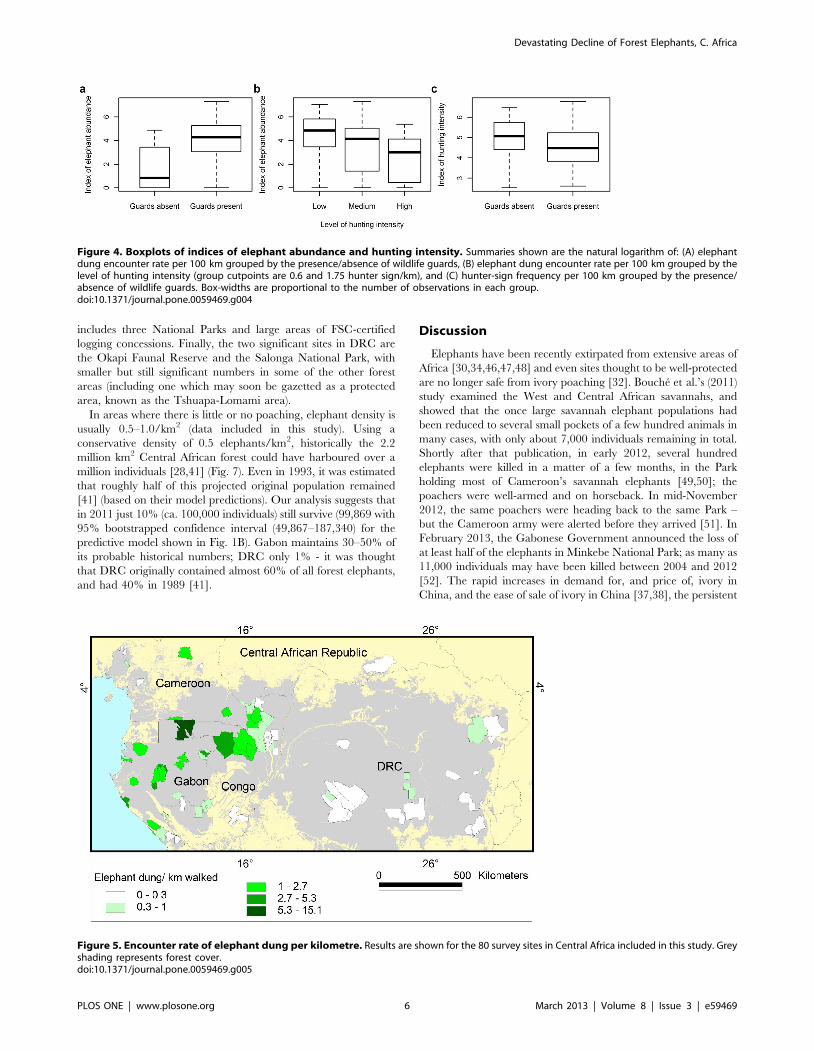
Figure 4. Boxplots of indices of elephant abundance and hunting intensity. Summaries shown are the natural logarithm of: (A) elephantdung encounter rate per 100 km grouped by the presence/absence of wildlife guards, (B) elephant dung encounter rate per 100 km grouped by thelevel of hunting intensity (group cutpoints are 0.6 and 1.75 hunter sign/km), and (C) hunter-sign frequency per 100 km grouped by the presence/absence of wildlife guards. Box-widths are proportional to the number of observations in each group.doi:10.1371/journal.pone.0059469.g004
Figure 5. Encounter rate of elephant dung per kilometre. Results are shown for the 80 survey sites in Central Africa included in this study. Greyshading represents forest cover.doi:10.1371/journal.pone.0059469.g005
Devastating Decline of Forest Elephants, C. Africa
PLOS ONE | www.plosone.org 6 March 2013 | Volume 8 | Issue 3 | e59469
lack of effective governance in Central Africa [53] and a
proliferation of unprotected roads that provide access to hunters
[54,55] combine to facilitate illegal ivory poaching, transport and
trade. Forest elephant population and range will continue to
decline unless conditions change dramatically.
Other threats and management issues also affect forest
elephants. Unlike other tropical forests, deforestation is very low
in Central Africa, although increasing [56,57]. Nevertheless, land
use pressure, habitat loss, and human-elephant conflict also
threaten this species [16] and will likely increase as industrial
agriculture, such as oil palm for biofuel production, develops in the
near future in Africa in general and Central Africa in particular
[58,59]. While these management issues will likely increase with
accelerating land use changes, the immediate, and very serious
threat to the persistence of this species remains ivory poaching.
Our analysis identified several factors likely to contribute to
decline and demonstrated the importance of law enforcement for
persistence of elephants. Similar factors were also found to be
important in recent analyses of a very different dataset- carcass
data from the MIKE sites [16,33] – where higher levels of
elephant poaching, as expressed by the proportion of illegally
killed elephants (PIKE) were associated with sites where law
enforcement capacity was lower, and in countries with poor
governance. Governance in our study was represented by the CPI
[45], whereas the MIKE analysis up to 2009 [33] incorporated
both CPI and several government effectiveness indicators used by
the World Bank (which can be found in their website http://info.
worldbank.org/governance/wgi/). However, in 2012, the MIKE
analysis used only the CPI as the proxy for governance [16].
Because the CPI is strongly associated with other factors within
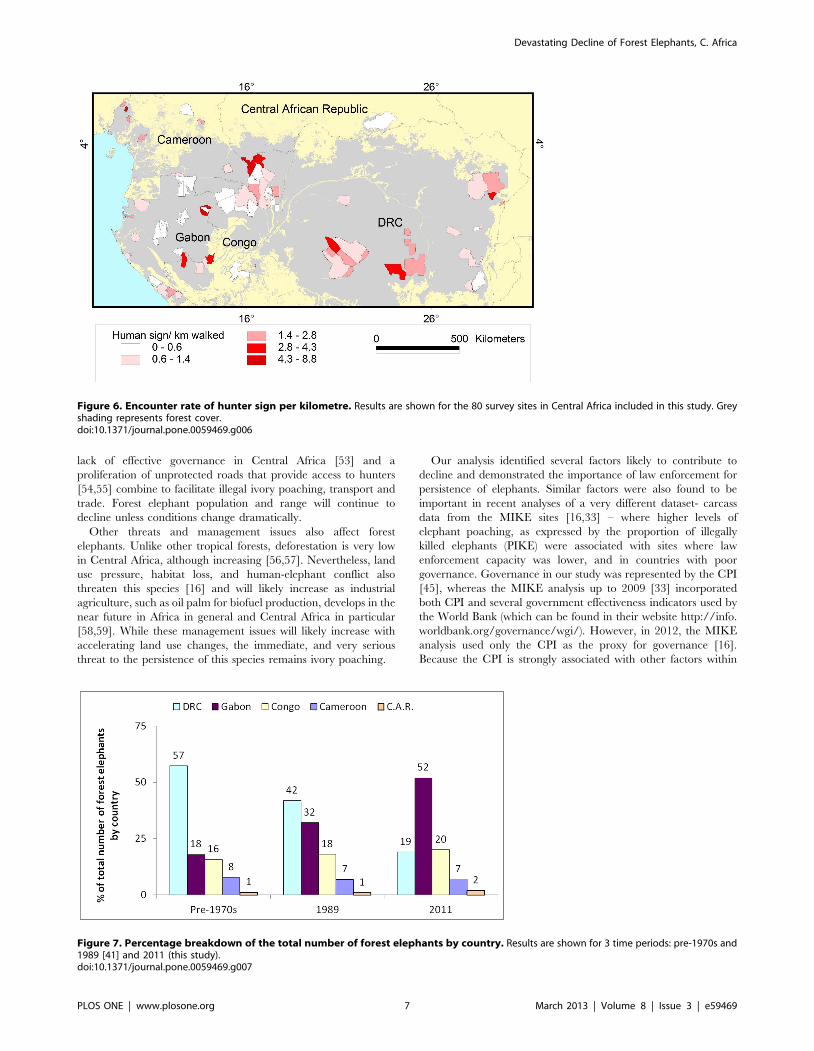
Figure 6. Encounter rate of hunter sign per kilometre. Results are shown for the 80 survey sites in Central Africa included in this study. Greyshading represents forest cover.doi:10.1371/journal.pone.0059469.g006
Figure 7. Percentage breakdown of the total number of forest elephants by country. Results are shown for 3 time periods: pre-1970s and1989 [41] and 2011 (this study).doi:10.1371/journal.pone.0059469.g007
Devastating Decline of Forest Elephants, C. Africa
PLOS ONE | www.plosone.org 7 March 2013 | Volume 8 | Issue 3 | e59469
countries (rule of law, governance, development), it may be
considered as a proxy for overall functioning of civil society of each
country, and indeed development variables associated with
poverty were also found to be associated with PIKE in both
2009 and 2012 [16,33]. A previous analysis using data from the
African Elephant Database [60] suggesting a link between
elephant decline and poor governance was criticized [61], because
latitude was a better explanatory variable and the data were
collected using different methods of varying quality [4,47]. The
more recent analysis using the 2007 AED showed that the
‘‘country’’ variable, a complex interaction of human development
and governance factors, explained elephant density very well [30].
In contrast to the AED’s quite variable data, we used highly
comparable data obtained within a single vegetation type (closed
canopy forest). Corruption in general is increasingly a focus of
international attention, whether in the wildlife realm [62–64] or
more broadly [65].
Currently the Red List classifies African elephants (L. africana) as
Vulnerable, and the Central African population as Endangered
[4]. Current losses (62% between 2002–2011) combined with
previous losses [28,41] indicate a decline of more than 80% in less
than two elephant generations, ca. 25 years [47]. The criterion for
listing a species as Critically Endangered is when that species has
declined by .80% in ten years, or three generations, whichever is
the longer. If, conservatively, there were half a million forest
elephants in the Congo Basin in 1937 (three elephant generations
ago) then about 80% have now been lost. The causes of the decline
are unlikely to abate in the short term, and indeed may worsen.
This strongly suggests consideration of an uplisting of the Central
African forest elephant subpopulation status to Critically Endan-
gered, under the IUCN red list criteria A4b,d (population
reduction, and current and projected levels of exploitation) [66].
Remaining large landscapes of major importance for elephants
comprise national parks embedded in land-use matrices including
logging concessions, where wildlife guards operate in both park
and concession [67,68]. However, current site-based interventions
in the region are generally inadequate to protect elephants,
because conservation budgets are below that needed to achieve
management success [42,69] and local interventions do not
mitigate macro-scale threats (i.e. infrastructure development,
governance issues, and ivory demand). Effective multi-level action
is imperative to save forest elephants. We strongly agree with the
recommendations of the African Elephant Action plan, of which
the highest priority objective was the reduction of poaching and
trade in elephant products.
In 2012, China submitted a document to CITES on how it will
improve its internal ivory trade [70], as internal and international
awareness of the problem grows [16,35,36,71]. China’s wildlife
officials, among others, attended a wildlife anti-trafficking work-
shop in Gabon in early 2012 [72]. At the 2012 World
Conservation Congress, two specific resolutions were passed
[73,74] to enhance the protection of elephants both in the range
states and in the ivory-consuming countries, and a specific wildlife-
crime related resolution was passed at the same time [75]. In
November 2012, the US State department clearly outlined a zero-
tolerance approach to wildlife crime [76,77] and many govern-
ments, INTERPOL, the World Customs Association and others
are collaborating in international efforts to curb ivory (and other
wildlife product) trafficking [63,78]- partly for the wildlife itself,
and also because the strong links with global organised crime and
security are recognised [64,79]. These diplomatic efforts are
critical, but we emphasize the importance of in situ enforcement
investment to protect the remaining populations of this species.
However, curbing demand for ivory is key, if forest elephants are
to survive.
Materials and Methods
Ethics StatementAll research was conducted using observation of indirect signs of
forest elephants (dung).
Data Collection and StandardizationWe modelled temporal and spatial trends using data collected
during 13,000 km of elephant-dung foot-surveys in 80 sites during
91,600 person-days from 2002 to 2011 (Fig. S3 shows temporal
coverage). Field protocol followed the standardized 2003 methods
of the Monitoring the Illegal Killing of Elephants (MIKE) [80]
program of the Convention on International Trade in Endangered
Species (CITES). Surveys covered the five countries holding the
majority (95%) [43] of extant forest elephant range: Cameroon,
Central African Republic (CAR), Republic of Congo (Congo),
Democratic Republic of Congo (DRC) and Gabon, across 257,145
km2 (about 12% of Central Africa’s forests; Table S1, Figs. 5 and
6). There were 9, 5, 25, 22 and 19 surveys in each country with ca.
11%, 2%, 26%, 43% and 18% of total effort (13,000 km) and ca.
4%, 6%, 32%, 41% and 17% of the total area covered
(257,145 km2). For sites surveyed more than once, only the most
recent data was used. In just over 25% of sites surveyed wildlife
guards were absent.
All surveys were carried out independently for site-based or
landscape-based conservation needs. Limited resources for these
purposes resulted in surveys being restricted to areas known or
suspected to harbour wildlife, but with very variable elephant
densities. Over half of the surveys were of existing or prospective
protected areas, and the rest were areas in logging concessions, or
with potential for wildlife conservation. Although there were some
sites where elephant populations were known to be very low, few
sites thought to be completely devoid of them were surveyed.
Survey data was obtained across the range of values for each of the
covariates considered in the analysis.
Either standard systematic line-transect distance sampling
surveys (perpendicular distance to each dung pile recorded) [81],
or systematic reconnaissance surveys [82] (elephant dung only
recorded within a metre of the centre line) were walked. Both
transect and recce survey designs allowed for random placement of
the sampling units being drawn up using Distance software [83],
and orientation of both transects and recces were perpendicular to
roads, and major rivers to potentially improve precision. Usually at
least 15 transects per stratum were used; usually more, giving
reasonable replication to ensure a representative sample was
obtained. Transects and recces were usually placed systematically
with a random start across the entire area surveyed. At some sites
both recces and transects were walked; we have used only the
transect data for these sites. Data from recce surveys were used
when straight lines were walked, thereby ensuring minimal bias.
Other data from less strict recces (where roads or elephant paths
might have been used) were not used in the analysis. Most recces
were from areas known to have high hunting pressure (and thus
low wildlife density). This is because transects are much more
expensive to implement than recces. Occasionally, recces were
done in areas where resources for a transect survey were not
available at the time. Transect data were truncated to one metre of
the centre line using the Distance software and the resulting plot
checked to ensure that detection was 100% within that distance
[83]. For reconnaissance data, detectability of dung piles was
Devastating Decline of Forest Elephants, C. Africa
PLOS ONE | www.plosone.org 8 March 2013 | Volume 8 | Issue 3 | e59469
assumed certain within the narrow sampling strip (one metre each
side of the observer).
Data AnalysisStatistical modeling. We assessed known or suspected
drivers of elephant density and distribution [16,17,30,33,54,55]
using Generalized Additive Models (GAMs) [84] due to their
flexibility and capacity for non-linear responses.
The standardized response variable was elephant dung pile
counts within one metre of the centre line, adjusted for survey
effort. GAMs were fit to elephant dung pile count data of the form:
E(ni)~ exp ln 2lið Þzb0zXq
j~1
f zij
� �( )
where for the ith survey site: nidenotes number of elephant dung
piles detected, li aggregate survey effort, 2li area effectively
surveyed, b0 the intercept, and f (zij) a smooth function of the jth
explanatory variablez. By including area surveyed as an offset term
in the model, elephant dung density is in effect being modelled. A
negative binomial distribution was used to deal appropriately with
severe over-dispersion in the count data. The scale parameter
theta of the negative binomial was treated as unknown and an
interval of (1,3) over which to search for theta was specified. Thin
plate regression splines were used to fit the smooth functions,
where the ‘performance iteration’ method was used for smoothing
parameter estimation. To avoid overfitting, given the limited
number of data points (80 survey sites), the gamma parameter was
set to a value of 1.4 for all models, which forced the model to be
smoother than it might otherwise have been [84]. With the limited
number of data points (80 sites across years) it was not possible to
account for the nested nature of sites within countries by means of
a hierarchical model structure; instead country was simply
included as a factor variable. The models were fit in R [85] using
the mgcv package.
Competing models, i.e. those with different covariates, were
ranked by increasing Un-Biased Risk Estimator (UBRE) criterion
[84]. The significance of explanatory variables (based on the P-
values returned for each of the terms in the GAM), percent
deviance explained by the model and model fit diagnostics
(Normal Q-Q, residuals vs. linear predictor, histogram of residuals,
response vs. fitted values) were also considered [84]. Model
selection was based on the UBRE criterion [84].
Models where survey year was modelled by country served to
examine country-specific changes over the period 2002–2011.
There were indications of country specific changes over time (Fig.
S4 shows how the decline in DRC is potentially more extreme
than in Gabon, for example). However, given the sparseness of the
time series for Cameroon and in particular CAR and the lack of
data points for Congo and DRC at the beginning of the period
(Fig. S3), we did not incorporate country specific changes over
time in the final models used to predict dung density across the
Central African forests. Instead we restricted our predictions to
models with the same smooth function for temporal change across
the Central African forests.
Given the similarity in UBRE scores for the top models, we
estimated elephant dung density using each of them (Table S2).
The bootstrapped 95% confidence intervals are also shown. The
confidence limits are wide and the percent coefficients of variation
were frequently larger than 100 (this was particularly the case for
models including HII with the exception of models HII 3 and HII
5 in 2011). When models contained survey year (the proxy for
temporal change), we estimated elephant dung density in both
2002 and in 2011, rather than just obtaining an average for the
2002–2011 period, which allowed us to calculate rates of decline
and percent range loss from these models; estimates of the
percentage of extremely low elephant density range overall and by
country for 2002 and 2011 are also given (Table S3).
Variance and percentile confidence intervals of elephant
abundance estimates were estimated using a combination of
nonparametric and parametric bootstrapping [86]. A total of 999
bootstraps were conducted during which replicate survey sites,
assumed to be independently and identically distributed, were
resampled at random and with replacement until each bootstrap
resample was the same size as the original number of 80 survey
sites (nonparametric component). Dung abundance estimates were
obtained from these resampled data conditioned on the original
model fit. Dung abundance estimates were converted to elephant
abundance by applying conversion factors (described below) with
associated total variance obtained by incorporating the variance
associated with the conversion factors. During each iteration of the
bootstrap routine, conversion factor values were generated from a
normal distribution with mean equal to the estimated value of the
conversion factor and the variance equal to the squared value of
the associated standard error (parametric component). Estimates
of elephant numbers were ordered from smallest to largest and the
25th and 975th value was used to define the percentile confidence
interval. The coefficient of variation was obtained by dividing the
square root of the variance of the abundance estimates from the
resampled data predictions by the mean of those abundance
estimates.
We defined extremely low density areas where dung density fell
between 0–100 dung piles/km2 (in practice this approximates to
.0.1 dung pile encountered per km walked) based on knowledge
of areas within Central Africa which have extremely few or no
elephants remaining (in part relying on design-based estimates of
dung abundance). All of the areas where we already knew that
there were extremely few or no elephants (from historical surveys,
from some of these surveys included here, or from other surveys
not included in this dataset), such as the majority of the southern
Republic of Congo, and the majority of the forests in western
Cameroon, fell into this density class, giving us confidence in the
model’s ability to predict elephant range where there are almost
no elephants left.
Conversion factors. Dung density estimates were converted
to elephant numbers using estimated production and decay rates
since actual rates are notoriously difficult to collect ([87]) and were
not available at every site. A production rate of 19.77 dung piles/
day (standard error (SE) = 0.23) [88], also suggested by the rainfall
regime of much of the area [89], was used. The same rate was also
used to assess historical forest elephant loss up to 1989 [41],
ensuring comparative differences were not a function of this model
assumption. To ensure that the decay rate used in the conversion
was representative of our sites that ranged widely in space and
time, we used the mean (81.82 days, SE = 6.68 days) of fourteen
estimates of dung disappearance time for different seasons,
habitats and sites. No particular geographical pattern for decay
rate from west to east across the basin was evident in these studies,
and the associated variance was low enough to make us more
confident in our application of this as a standard conversion factor,
whilst recognising that there is variation within decay rates
associated with season, sunspots, and rainfall [90,91,92]. To
convert dung to elephant density, only dung piles not in a late
stage of decomposition (‘‘class E’’ of [93] are generally included.
For this dataset dung density was reduced by 32.1% (SE = 3.7%),
the mean percent of dung piles classified as ‘‘E’’, before estimating
elephant density.
Devastating Decline of Forest Elephants, C. Africa
PLOS ONE | www.plosone.org 9 March 2013 | Volume 8 | Issue 3 | e59469
Explanatory variables. Explanatory variables used in the
GAM analysis were (Table S4) [94]: (i) site-level at the scale of
individual sampling units, (ii) country-level (including country itself),
and (iii) regional proxies latitude and longitude to capture possible
geographical gradients in density not captured by other variables.
Variables were either recorded at each survey site (hunter-sign
frequency, survey year, presence/absence of guards), retrieved
from reports (official protection reflecting the degree of potential
protection) and online databases (Transparency International’s
Corruption Perceptions Index [45], or from GIS data layers
(distance-based for poacher access, i.e., proximity to major roads;
pressure-based for poacher numbers, i.e., human population
density [95], the Human Influence Index [44]. Square root
transformations for hunter-sign frequency and human population
density were considered due to possible undue leverage from the
few high values. The predicted likely influence on elephant density
for each of the explanatory variable is given (Table S4).
Assumptions implicit in the choice of these variables were based
on previous work [16,17,33,54,55]. We assumed that both direct
hunting pressure (as measured by encounter rate of hunter sign)
and measures of human population density and activity (as
measured by distance to the nearest road, human population
density, and the human influence index) results in elephants
moving away from human-dominated areas and/or being killed
by poachers. We assumed that official protection of a site (such as
National Park status) would reflect real protection, in other words
that elephants would be more likely to be at higher densities in
such sites. We assumed that if guards were present at a site, that
they were actually effective in deterring poaching. We assumed
that our measure of governance (CPI) reflected the suite of social,
economic, and development factors associated with each country;
governance and development had previously been shown to be
associated with elephant poaching by the two MIKE analyses in
2009 and 2012 [16,33].
Pearson’s product-moment correlation tests (two-sided) with null
hypothesis that true correlation is equal to zero were conducted for
each pair-wise combination of explanatory variables considered.
Variables were considered significantly correlated at the 5% level.
Correlations between variables were taken into account to avoid
the inclusion of highly correlated variables in the same model.
Model prediction was limited to Central African forested regions,
including swamp forest [96], in the five countries with survey sites.
GIS grids were created at a resolution of approximately 1x1 km2,
and prediction was carried out at the same resolution.
Reporting results. Generally, averaged estimates from the
set of top-ranking predictive models were given. Potential elephant
range was defined by forest cover. Elephant range and high
density elephant areas were estimated as the aggregate of areas
with .100 and .1,000 elephant dung piles/km2, respectively.
Supporting Information
Figure S1 Estimated conditional dependence of ele-phant dung density for top-ranking multi-variablemodels without hunter-sign used for prediction acrossthe Central African forests, using the variables availableacross Central Africa either as GIS layers or in country-specific databases. Plots shown are for models with variables
(A) survey year‘, Human Influence Index***, and corruption***,
and (B) survey year‘, proximity to roads‘, human population
density***, and corruption***. Presence/absence of wildlife guards
was also included as a factor covariate in both models and dung
density was significantly more - P,0.001 - at sites where guards
were present. P-value significance codes are: ‘***’,0.001 and
‘‘’,0.1. Plot components are: Estimates on the scale of the linear
predictor (solid lines) with the y-axis scale for each variable
selected to optimally display the results, confidence intervals
(dashed lines), and explanatory variable values of observations with
a focus on the core 95% of the data for proximity to road and
human population density (rug plot - short vertical bars along each
x-axis).
(PDF)
Figure S2 Estimated conditional dependence of ele-phant dung density for single variable models. Results
are shown for (A) hunter sign***, (B) survey year**, (C) proximity
to roads*, (D) human population density***, (E) Human Influence
Index***, (F) official protection*** (higher values = less protected),
(presence/absence of wildlife guards is a factor covariate and thus
not shown here, however, dung density was significantly higher -
P,0.001 - at sites where guards were present), (G) corruption***
(higher values = less corrupt), (H) latitude*, and (I) longitude***. P-
value significance codes are: ‘***’ ,0.001, ‘**’ ,0.01, and ‘*’
,0.05. Plot components are: Estimates on the scale of the linear
predictor (solid lines) with the y-axis scale for each variable
selected to optimally display the results, confidence intervals
(dashed lines), explanatory variable values of observations with a
focus on the core 95% of values for a, c and d (rug plot - short
vertical bars along each x-axis).
(PDF)
Figure S3 The number of survey sites per country bysurvey year. Results are shown for the 80 survey sites in Central
Africa.
(PDF)
Figure S4 Estimated conditional dependence of ele-phant dung density considering survey year by countryfor a multi-variable models including hunter sign. Survey
year by country focusing on the Democratic Republic of Congo
(DRC) and Gabon for the model with variables hunter sign*,
survey year by country*, proximity to roads, human population
density***, corruption*** and presence/absence of guards***
(dung density was significantly more - P,0.001 - at sites where
guards were present). P-value significance codes are: ‘***’,0.001,
‘**’,0.01, ‘*’,0.05, and ‘‘’,0.1. Plot components are: Estimates
on the scale of the linear predictor (solid lines) with the y-axis scale
for each variable selected to optimally display the results,
confidence intervals (dashed lines), and explanatory variable
values of observations (rug plot - short vertical bars along each
x-axis).
(PDF)
Table S1 Details of the 80 survey sites included in theanalysis.(PDF)
Table S2 Analysis results for top-ranking predictivemodels (excluding hunter sign as an explanatory vari-able), which included (a) the Human Influence Index(HII), or (b) human population density and proximity toroad (SPD). Details of the variables included in each model are
given and percent deviance explained and UBRE score value.
Estimated average elephant dung density (/km2) from model
predictions across the Central African forests and bootstrapped
95% confidence intervals are shown. If the model included the
survey year variable then prediction is for the endpoints of the time
series (2002 and 2011); otherwise the prediction can be interpreted
as an average over the 2002–2011 time period. Also shown for the
models that permit temporal prediction is the overall percent
decline and overall percent range loss for the period 2002–2011
Devastating Decline of Forest Elephants, C. Africa
PLOS ONE | www.plosone.org 10 March 2013 | Volume 8 | Issue 3 | e59469
(elephants are assumed to be absent when dung density falls below
100 elephant dung piles/km2; see Table S3 and Figure 2 for
details, including a breakdown by country).
(PDF)
Table S3 Estimates of percentage extremely low densityelephant range across the Central African forests and bycountry (relative to each country’s forested area) for2002 and 2011 for the top-ranking predictive models,which included the survey year variable. Elephants are
assumed to be almost absent when dung density falls below a
threshold value of 100 elephant dung piles/km2. Also shown are
estimates of the percentage of potential habitat at high elephant
density (defined as .1,000 elephant dung piles/km2). The average
across all models for 2002 and for 2011 is shown, as well as the
range Table S6 for a breakdown of forest cover by country.
(PDF)
Table S4 Description of spatial variables, data source,method of calculation, likely influence on elephantdensity, UBRE score and deviance explained for thesingle variable models.(PDF)
Table S5 Analysis results for top-ranking models whichincluded the hunter sign variable. Hunter sign was not
included in the predictive model across the Central African forests,
as it was unavailable at that scale.
(PDF)
Table S6 Estimated forest cover by country as definedby Iremonger et al. (1997) [96].(PDF)
Acknowledgments
The research authorities and wildlife departments from the Republic of
Congo, Republic of Cameroon, Gabon, the Democratic Republic of
Congo, and the Central African Republic are thanked for permissions and
collaboration. The Central Africa roads dataset came from Global Forest
Watch supplemented with local knowledge for some recently built road
segments. For support of the survey work we thank (in alphabetical order)
Nancy Abraham, the African Wildlife Foundation, Beneficia Foundation,
Busch Gardens, CITES-MIKE, Columbus Zoo, Conservation Interna-
tional, Daniel K. Thorne Foundation, Diane Fossey Gorilla Foundation
International, Especes Phares (European Union), Ecosystemes Forestiers
d’Afrique Centrale (ECOFAC), Fauna and Flora International, Frankfurt
Zoological Society, IUCN Netherlands, John D. and Catherine T.
MacArthur Foundation, KFW, LifeWeb (Spain), National Fund for
Scientific Research (FNRS, Belgium), Offield Family Foundation,
Operation Loango, Prince Bernhard Wildlife Fund, RAPAC, The Arcus
Foundation, The Aspinall Foundation, The Born Free Foundation, The
Institute for Biodiversity and Ecosystem Dynamics at The University of
Amsterdam, The Jane Goodall Institute, The Liz Claiborne and Art
Ortenberg Foundation, The Lucie Burgers Foundation, The Wasmoeth
Wildlife Foundation and Karl Ammann, Total Gabon, United States
Agency for International Development (USAID CARPE), USFWS Great
Ape Conservation Fund, USFWS African Elephant Conservation Fund,
Wildlife Conservation Society, World Wildlife Fund and the Zoological
Society of London. We thank the following who made extremely useful
suggestions for improvements to the MS: David Wilkie, Josh Ginsberg,
James Deutsch and Anthony Rylands, and three anonymous referees.
This paper is dedicated to the wildlife guards who have lost their lives
across the African continent whilst defending the elephants and other
wildlife in their countries, to our co-authors Lambert Bene Bene, Ymke
Warren and Max Kokangoye, whose contributions to wildlife conservation
live on after them, and to those brave individuals who continue to protect
elephants.
Author Contributions
Commented on the MS and organised fieldwork: AB AE AP AS AT AV
BBds BF B-II BJM BM BSM TCH CI-N CM CN DK EA EAW EG ES
FA FG FI FK FM FN GA G-AM GM GW HR HV IL JH JM LP MA MB
MK NB OI OM PB PCB PM PN QM RA RLB REB RDA RM SB SL
SN SS VAM YM. Conceived and designed the experiments: AP AS AV
BJM TCH DK ES FA FG FI FM G-AM HR HV JH RA SB SL SN SS
YW. Performed the experiments: AB AE AM AP AS AV BBds B-II BJM
BM BSM TCH CI-N CM CN DK EA EAW EG FA FG FI FK FM FN
GA G-AM GM HV JH JM LB MA MB MK NB OI OM PB PCB PM PN
QM RA REB RDA SB SL SN VAM YM YW. Analyzed the data: SS FM
GW. Wrote the paper: AP AT AV B-II BJM TCH EAW EG ES FI FM
GW HR HV JH NB PB RLB RM SB SL SN SS.
References
1. IUCN/SSC (2008) Strategic planning for species conservation- a handbook.
The species conservation planning task force. Species Survival Commission,
IUCN. Gland, Switzerland: IUCN Species Survival Commission. 104.
Available: http://data.iucn.org/dbtw-wpd/edocs/2008-047.pdf. Accessed
2013 Feb 20.
2. IUCN (2012) IUCN Red List of threatened species. Version 2012.2. Cambridge,
UK: IUCN. Available: http://www.iucnredlist.org/. Accessed 2013 Feb 20.
3. AfESG (2003) Statement on the taxonomy of extant Loxodonta, December 2003.
IUCN. 2. Available: www.iucnredlist.org/documents/AfESGGeneticStatement.
pdf. Accessed 2013 Feb 20.
4. Blanc J (2008) Loxodonta africana. IUCN Available: http://www.iucnredlist.org/
documents/attach/12392.pdf. Accessed 2013 Feb 20.
5. Grubb P, Groves CP, Dudley JP, Shoshani J (2000) Living African elephants
belong to two species: Loxodonta africana (Blumenbach, 1797) and Loxodonta cyclotis
(Matschie, 1900). Elephant 2: 1–4.
6. CMS (2012) Appendices I and II of the Convention on the conservation of
Appendix I migratory species of wild animals. Available: http://www.cms.int/
documents/appendix/appendices_e.pdf. Accessed 2013 Feb 20.
7. Ishida Y, Georgiadis N, Hondo T, Roca A (2012) Triangulating the provenance
of African elephants using mitochondrial DNA. Evolutionary Applications 6:
253–265.
8. Ishida Y, Demeke Y, de Groot PJvC, Georgiadis NJ, Leggett KEA, et al. (2011)
Distinguishing forest and savanna African elephants using short nuclear DNA
sequences. Journal of Heredity 102: 610–616.
9. Roca AL, Georgiadis N, O’Brien SJ (2007) Cyto-nuclear genomic dissociation
and the African elephant species question. Quaternary International 169: 4–16.
10. Rohland N, Reich D, Mallick S, Meyer M, Green RE, et al. (2010) Genomic
DNA sequences from mastodon and woolly mammoth reveal deep speciation of
forest and savanna elephants. PLoS Biology 8: e1000564.
11. Ishida Y, Oleksyk TK, Georgiadis NJ, David VA, Zhao K, et al. (2011)
Reconciling apparent conflicts between mitochondrial and nuclear phylogenies
in African elephants. PLoS One 6: e20642.
12. Brandt AL, Ishida Y, Georgiadis NJ, Roca AL (2012) Forest elephant
mitochondrial genomes reveal that elephantid diversification in Africa tracked
climate transitions. Molecular Ecology 21: 1175–1189.
13. Roca AL, Georgiadis N, Pecon-Slattery J, O’Brien SJ (2001) Genetic evidence
for two species of elephant in Africa. Science 293: 1473–1477.
14. Roca AL, O’Brien SJ (2005) Genomic inferences from Afrotheria and the
evolution of elephants. Current Opinion in Genetics & Development 15: 652–
659.
15. Roca AL, Georgiadis N, O’Brien SJ (2005) Cytonuclear genomic dissociation in
African elephant species. Nature Genetics 37: 96–100.
16. CITES (2012) Convention on international trade in endangered species of wild
fauna and flora- Elephant conservation, illegal killing and ivory trade in ivory.
SC62 Doc 46.1 (Rev 1). 29. Available: http://www.cites.org/eng/com/sc/62/
E62-46-01.pdf. Accessed 2013 Feb 20.
17. Blake S, Deem SL, Mossimbo E, Maisels F, Walsh P (2009) Forest elephants:
tree planters of the Congo. Biotropica 41: 459–468.
18. Blake S (2002) The ecology of forest elephant distribution and its implications for
conservation [PhD]. Edinburgh: University of Edinburgh. 319 Available: http:
//www.savetheelephants.org/files/pdf/publications/2002%20Blake%20The%
20Ecology%20of%20Forest%20Elephant%20Distribution%20and%20its%20
Implications%20for%20Conservation.pdf. Accessed 2013 Feb 20.
19. White LJT, Tutin CEG, Fernandez M (1993) Group composition and diet of
forest elephants, Loxodonta africana cyclotis Matschie 1900, in the Lope Reserve,
Gabon African Journal of Ecology 31: 181–199.
20. Short J (1981) Diet and feeding behaviour of the forest elephant. Mammalia 45:
177–185.
Devastating Decline of Forest Elephants, C. Africa
PLOS ONE | www.plosone.org 11 March 2013 | Volume 8 | Issue 3 | e59469
21. Lewis SL, Lopez-Gonzalez G, Sonke B, Affum-Baffoe K, Baker TR, et al. (2009)
Increasing carbon storage in intact African tropical forests. Nature 457: 1003–1006.
22. Campos-Arceiz A, Blake S (2011) Megagardeners of the forest - the role of
elephants in seed dispersal. Acta Oecologica 37: 542–553.
23. Turkalo A, Fay JM (1995) Studying elephants by direct observations:
preliminary results from the Dzanga clearing, Central African Republic.Pachyderm 20: 45–54.
24. Klaus G, Klaus-Hugi C, Schmid B (1998) Geophagy by large mammals at
natural licks in the rain forest of the Dzanga National Park, Central African
Republic. Journal of Tropical Ecology 14: 829–839.
25. Turkalo A, Fay JM (2001) Forest elephant behaviour and ecology: observationsfrom the Dzanga saline. In: Weber W, White L, Vedder A, Naughton L, editors.
Conservation and ecology of the African rain forest. Ithaca: Yale University
Press. 207–213.
26. Douglas-Hamilton I (1979) African elephant ivory trade study final report FinalReport to US Fish and Wildlife Service. 138. Available: http://www.
savetheelephants.org/files/pdf/publications/1979%20Douglas-Hamilton%20African%20Elephant%20Ivory%20Trade%20Study.pdf. Accessed 2013 Feb
20.
27. Douglas-Hamilton I (1987) African elephants: population trends and their
causes. Oryx 21: 11–24.
28. Milner-Gulland EJ, Beddington JR (1993) The exploitation of elephants for the
ivory trade-an historical perspective. Proceedings of the Royal Society of London- Series B: Biological Sciences 252: 29–37.
29. Cuvillier-Fleury H (1904) La mise en valeur du Congo francais. These de Doctorat
[Doctorat.]. Paris Universite de Paris. 290 Available: http://ia600301.us.archive.org/6/items/lamiseenvaleurdu00cuviuoft/lamiseenvaleurdu00cuviuoft.pdf. Ac-
cessed 2013 Feb 20.
30. de Boer WF, van Langevelde F, Prins HHT, de Ruiter PC, Blanc J, et al. (2013)
Understanding spatial differences in African elephant densities and occurrence, acontinent-wide analysis. Biological Conservation 159: 468–476.
31. CITES (2010) African elephant action plan: document CoP15 Inf. 68. 24.Available: http://www.cites.org/common/cop/15/inf/E15i-68.pdf. Accessed
2013 Feb 20.
32. Wittemyer G, Daballen D, Douglas-Hamilton I (2011) Rising ivory pricesthreaten elephants. Nature 476: 282–283.
33. Burn RW, Underwood FM, Blanc J (2011) Global trends and factors associatedwith the illegal killing of elephants: A hierarchical Bayesian analysis of carcass
encounter data. PLoS One 6: e24165.
34. Bouche P, Douglas-Hamilton I, Wittemyer G, Nianogo AJ, Doucet JL, et al.
(2011) Will elephants soon disappear from west African savannahs? PLoS One 6:e20619.
35. Milliken T, Burn RW, Underwood FM, Sangalakula L (2012) The Elephant
Trade Information System (ETIS) and the Illicit Trade in Ivory: A report to the16th meeting of the Conference of the Parties to CITES (Cop 16) cites.org/eng/
cop/16/doc/E-CoP16-53-02-02.pdf. TRAFFIC. 30.
36. CITES (2012) Interpretation and implementation of the Convention- Species
trade and conservation: Elephants. Monitoring of illegal trade in ivory and otherelephant specimens : report of the secretariat. CoP16 Doc. 53.2.1. 10. Available:
http://www.cites.org/eng/cop/16/doc/E-CoP16-53-02-01.pdf. Accessed 2013
Feb 20.
37. Vigne L, Martin E (2011) Consumption of elephant and mammoth ivoryincreases in southern China. Pachyderm 49: 79–89.
38. Martin EB, Vigne L (2011) The ivory dynasty: A report on the soaring demand
for elephant and mammoth ivory in southern China. Elephant Family, The
Aspinall Foundation and Columbus Zoo and Aquarium Available: http://www.elephantfamily.org/uploads/copy/EF_Ivory_Report_2011_web.pdf. Accessed
2013 Feb 20.
39. CITES (2011) Convention on international trade in endangered species of wild
fauna and flora- Status of elephant populations, levels of illegal killing and thetrade in ivory: a report to the standing committee of CITES. SC61 Doc. 44.2
(Rev. 1) Annex 1. Available: http://www.cites.org/eng/com/sc/61/E61-44-02-A1.pdf. Accessed 2013 Feb 20.
40. Stiles D (2011) Elephant Meat Trade in Central Africa. Gland, Switzerland:
IUCN. 104 Available: http://cmsdata.iucn.org/downloads/ssc_op_045.pdf.
Accessed 2013 Feb 20.
41. Michelmore F, Beardsley K, Barnes R, Douglas-Hamilton I (1994) A modelillustrating the changes in forest elephant numbers caused by poaching. African
Journal of Ecology 32: 89–99.
42. Blake S, Strindberg S, Boudjan P, Makombo C, Bila-Isia I, et al. (2007) Forest
elephant crisis in the Congo Basin. PLoS Biology 5: 945–953.
43. IUCN/SSC (2008) African Elephant Loxodonta africana: Further Details on Data
Used for the Global Assessment. African Elephant Specialist Group. Available:http://www.iucnredlist.org/documents/attach/12392.pdf. Accessed 2013 Feb
20.
44. WCS/CIESIN (2005) Last of the wild data version 2: Global Human InfluenceIndex (HII). Wildlife Conservation Society (WCS) and Center for International
Earth Science Information Network (CIESIN). Available: http://sedac.ciesin.
columbia.edu/data/set/wildareas-v2-human-influence-index-geographic. Ac-cessed 2013 Feb 20.
45. Corruption_Perceptions_Index (2011) Corruption Perceptions Index 2011.
Transparency International. Available: http://files.transparency.org/content/
download/313/1264/file/CPI2011_DataPackage.zip. Accessed 2013 Feb 20.
46. Beyers R, Sinclair T, Hart J, Grossman F, Dino S, et al. (2011) Resource wars
and conflict ivory. The impact of civil conflict on elephants in the Okapi Faunal
Reserve: 1995–2006. PLoS One 6: e27129.
47. Blanc J, Barnes RFW, Craig GC, Dublin HT, Thouless CR, et al. (2007) African
elephant status report 2007: an update from the African elephant database.
Gland, Switzerland: IUCN/SSC African Elephant Specialist Group. pp vi +276
Available: http://www.african-elephant.org/aed/pdfs/aesr2007.pdf. Accessed
2013 Feb 20.
48. Bouche P, Mange RNM, Tankalet F, Zowoya F, Lejeune P, et al. (2012) Game
over! Wildlife collapse in northern Central African Republic. Environmental
Monitoring and Assessment 184: 7001–7011.
49. Omondi P, Bitok EK, Tchamba M, Mayienda R, Lambert BB (2008) The total
aerial count of elephants and other wildlife species in Faro, Benoue and Bouba
Ndjidda National Parks and adjacent hunting blocks in northern Cameroon
National Parks and adjacent hunting blocks in northern Cameroon. Yaounde,
Cameroon: WWF and Cameroon Ministry of Forestry and Wildlife. 75.
Available: http://www.mintour.gov.cm/index.php/content/download/1858/
19444/version/1/file/Rapport+de+Denombrement+des+Aires+Proteges.pdf.
Accessed 2013 Feb 20.
50. Platt J (2012) Cameroon elephant massacre shows poaching, ivory trade require
an international response. Available: http://blogs.scientificamerican.com/
extinction-countdown/2012/03/20/cameroon-elephant-massacre-poaching-
ivory-trade/. Accessed 2013 Feb 20.
51. WWF (2012) Cameroon sends army to defend borders from Sudanese poachers
Available: http://wwf.panda.org/wwf_news/?206742/Cameroon-sends-army-
to-defend-borders-from-Sudanese-poachers.Accessed 2013 Feb 20.
52. ANPN (2013) Wildlife and poaching assessment in northeast Gabon-
preliminary results. ANPN, WCS, WWF. 23. Available: http://awsassets.
panda.org/downloads/preliminary_results_of_minkebe_pilot_study.pdf. Ac-
cessed 2013 Feb 20.
53. Lemieux AM, Clarke RV (2009) The international ban on ivory sales and its
effects on elephant poaching in Africa. British Journal of Criminology 49: 451–
471.
54. Blake S, Deem SL, Strindberg S, Maisels F, Momont L, et al. (2008) Roadless
wilderness area determines forest elephant movements in the Congo Basin. PLoS
One 3: e3546.
55. Yackulic CB, Strindberg S, Maisels F, Blake S (2011) The spatial structure of
hunter access determines the local abundance of forest elephants (Loxodonta
africana cyclotis). Ecological Applications 21: 1296–1307.
56. Potapov PV, Turubanova SA, Hansen MC, Adusei B, Broich M, et al. (2012)
Quantifying forest cover loss in Democratic Republic of the Congo, 2000–2010,
with Landsat ETM+data. Remote Sensing of Environment 122: 106–116.
57. Hansen MC, Stehman SV, Potapov P (2011) Quantification of global gross
forest cover loss. Proceedings of the National Academy of Sciences of the United
States of America 107: 8650–8655.
58. Fitzherbert EB, Struebig MJ, Morel A, Danielsen F, Bruhl CA, et al. (2008) How
will oil palm expansion affect biodiversity? Trends in Ecology & Evolution 23:
538–545.
59. Senelwa K, Etiegni L, Osano O, Balozi K, Imo M (2012) Environmental
Impacts of biofuel production in Africa. In: Janssen R, Rutz D, editors.
Bioenergy for Sustainable Development in Africa: Springer Netherlands. 237–
245.
60. Smith RJ, Muir RDJ, Walpole MJ, Balmford A, Leader-Williams N (2003)
Governance and loss of biodiversity. Nature 426: 67–70.
61. Barrett CB, Gibson CC, Hoffman B, McCubbins MD (2006) The complex links
between governance and biodiversity. Conservation Biology 20: 1358–1366.
62. UNODC (2012) Corruption, environment and the United Nations Convention
against corruption. United Nations Office on Drugs and Crime. 94. Available:
http://www.unodc.org/documents/eastasiaandpacific/indonesia/publication/
Corruption_Environment_and_the_UNCAC.pdf. Accessed 2013 Feb 20.
63. INTERPOL (2012) Environmental crime Interpol. Available: http://www.
interpol.int/Crime-areas/Environmental-crime/Environmental-crime. Ac-
cessed 2013 Feb 20.
64. United States Senate Committee on Foreign Relations (2012) Ivory and
insecurity: the global implications of poaching in Africa. U.S. Senate Committee
on foreign relations hearing, May 24, 2012. Washington DC, USA: U.S. Senate
Committee on Foreign Relations. Available: http://www.foreign.senate.gov/
hearings/ivory-and-insecurity_the-global-implications-of-poaching-in-africa.
Accessed 2013 Feb 20.
65. INTERPOL (2012) INTERPOL group of experts on corruption. Interpol.
Available: http://www.interpol.int/Crime-areas/Corruption/INTERPOL-
Group-of-Experts-on-Corruption. Accessed 2013 Feb 20.
66. IUCN (2011) Guidelines for using the IUCN Red List categories and criteria -
verson 9.0. Cambridge, U. K: Prepared by the Standards and Petitions
Subcommittee in September 2011. Available: http://intranet.iucn.org/webfiles/
doc/SSC/RedList/RedListGuidelines.pdf. Accessed 2013 Feb 20.
67. Stokes EJ, Strindberg S, Bakabana PC, Elkan PW, Iyenguet FC, et al. (2010)
Monitoring great ape and elephant abundance at large spatial scales: measuring
effectiveness of a conservation landscape. PLoS One 5: e10294.
68. Clark CJ, Poulsen JR, Malonga R, Elkan PW (2009) Logging concessions can
extend the conservation estate for central African tropical forests. Conservation
Biology 23: 1281–1293.
Devastating Decline of Forest Elephants, C. Africa
PLOS ONE | www.plosone.org 12 March 2013 | Volume 8 | Issue 3 | e59469
69. Blom A (2004) An estimate of the costs of an effective system of protected areas
in the Niger Delta - Congo Basin forest region. Biodiversity and Conservation13: 2661–2678.
70. CITES-China (2012) Convention on international trade in endangered species
of wild fauna and flora- Control of trade in ivory in China. SC62 Inf. 8. 3.Available: http://www.cites.org/eng/com/sc/62/inf/E62i-08.pdf. Accessed
2013 Feb 20.71. Xinhua (2012) Police uncover 700 illegal wildlife trade cases Available: http://
www.chinadaily.com.cn/china/2012-04/28/content_15172209.htm.Accessed
2013 Feb 20.72. U.S.Embassy (2012) Regional wildlife workshop Chair summary April 2012:
Central African sub-regional workshop on wildlife trafficking and dismantlingtransnational illicit networks. Libreville, Gabon. Available: http://libreville.
usembassy.gov/latest_embassy_news3/wildlife-workshop-chair-summary-april-2012.html. Accessed 2013 Feb 20.
73. IUCN (2012) WCC-2012-RES-025-EN; Conservation of African elephants. 2.
Available: http://portals.iucn.org/docs/iucnpolicy/2012-resolutions%5Cen/WCC-2012-Res-025-EN%20Conservation%20of%20African%20elephants.pdf.
Accessed 2013 Feb 20.74. IUCN (2012) WCC-2012-Res-024-EN: Enhancing anti-poaching and wildlife
resource protection efforts, using rhino and elephant as indicators. 2. Available:
http://portals.iucn.org/docs/iucnpolicy/2012-resolutions%5Cen/WCC-2012-Res-024-EN%20Enhancing%20anti-poaching%20and%20wildlife%20resource
%20protection%20efforts,%20using%20rhino%20and%20elephant%20as%20indicators.pdf. Accessed 2013 Feb 20.
75. IUCN (2012) WCC-2012-Res-133-EN: Improving capacity for enforcement oflegislation relating to wildlife crime. 2. Available: http://portals.iucn.org/docs/
iucnpolicy/2012-resolutions%5Cen/WCC-2012-Res-133-EN%20Improving%
20capacity%20for%20enforcement%20of%20legislation%20relating%20to%20wildlife%20crime.pdf. Accessed 2013 Feb 20.
76. Department US (2012) Clinton at partnership meeting on combating wildlifetrafficking. Available: http://iipdigital.usembassy.gov/st/english/texttrans/
2012/11/20121108138454.html#ixzz2CJcgMSv5. Accessed 2013 Feb 20.
77. Department US (2012) U.S. efforts to combat wildlife trafficking and promoteconservation. Available: http://www.state.gov/r/pa/prs/ps/2012/11/200354.
htm. Accessed 2013 Feb 20.78. Government U (2012) Wildlife crime - environmental audit committee: 2
International wildlife crime London: UK Government. Available: http://www.publications.parliament.uk/pa/cm201213/cmselect/cmenvaud/140/14005.
htm#a5. Accessed 2013 Feb 20.
79. House of Commons Environmental Audit Committee (2012) Wildlife crime:third report of session 2012–13. Volume II. Additional written evidence London:
UK Government. 94. Available: http://www.publications.parliament.uk/pa/cm201213/cmselect/cmenvaud/140/140vw.pdf. Accessed 2013 Feb 20.
80. MIKE (2005) Monitoring the illegal killing of elephants- Central African forests:
Final report on population surveys (2003–2004). Washington DC, USA: MIKE-CITES- WCS. 122. Available: http://www.cites.org/common/prog/mike/
survey/central_africa_survey03-04.pdf. Accessed 2013 Feb 20.
81. Buckland ST, Anderson DR, Burnham KP, Laake JL, Borchers D, et al. (2001)
Distance sampling: estimating abundance of biological populations. Oxford:
Oxford University Press. 432 p.
82. Hall JS, White LJT, Inogwabini B-I, Omari I, Simons Morland H, et al. (1998)
Survey of Grauer’s gorillas (Gorilla gorilla graueri) and Eastern chimpanzees (Pan
troglodytes schweinfurthi) in the Kahuzi-Biega National Park lowland sector and the
adjacent forest in eastern Democratic Republic of Congo. International Journal
of Primatology 19: 207–235.
83. Thomas L, Buckland ST, Rexstad EA, Laake JL, Strindberg S, et al. (2010)
Distance software: design and analysis of distance sampling surveys for
estimating population size. Journal of Applied Ecology 47: 5–14.
84. Wood SN (2006) Generalized additive models: an introduction with R. Boca
Raton, USA: Chapman & Hall/CRC Press. 391 p.
85. R Development Core Team (2011) R: A language and environment for
statistical computing. 2.13.1 Vienna, Austria: R Foundation for Statistical
Computing.
86. Buckland ST (1984) Monte-Carlo confidence intervals. Biometrics 40: 811–817.
87. Laing SE, Buckland ST, Burn RW, Lambie D, Amphlett A (2003) Dung and
nest surveys: estimating decay rates. Journal of Applied Ecology 40: 1102–1111.
88. Tchamba M (1992) Defaecation by the African forest elephant Loxodonta africana
cyclotis in the Santchou Reserve, Cameroon. Mammalia 56: 155–158.
89. Theuerkauf J, Gula R (2010) Towards standardisation of population estimates:
defecation rates of elephants should be assessed using a rainfall model. Annales
Zoologici Fennici 47: 398–402.
90. Breuer T, Hockemba MN (2007) Forest elephant dung decay in Ndoki Forest,
northern Congo. Pachyderm 43: 43–51.
91. Barnes RFW, Asamoah-Boateng A, Naada Majam J, Agyei- Ohemeng J (1997)
Rainfall and the population dynamics of elephant dung-piles in the forests of
southern Ghana. African Journal of Ecology 35: 39–52.
92. Barnes RFW, Dunn A (2002) Estimating forest elephant density in Sapo
National Park (Liberia) with a rainfall model. African Journal of Ecology 40:
159–163.
93. Barnes R, Jensen K (1987) How to count elephants in forests. Technical Bulletin
of African Elephant and Rhino Specialist Group 1: 1–6.
94. Burnham KP, Anderson DR (2002) Model selection and inference: a practical
information-theoretic approach. New York: Springer. 353 p.
95. CIESIN/CIAT (2005) Gridded population of the world, version 3 (GPWv3).
Center for International Earth Science Information Network (CIESIN),
Columbia University; and Centro Internacional de Agricultura Tropical (CIAT).
Palisades, NY: Socioeconomic Data and Applications Center (SEDAC),
Columbia University. Available: http://sedac.ciesin.columbia.edu/gpw. Ac-
cessed 2013 Feb 20.
96. Iremonger S, Ravilious C, Quinton T (1997) A statistical analysis of global forest
conservation. Including: GIS files of forests and protected areas, version 2. CD-
ROM In: Iremonger S, Ravilious C, Quinton T, editors. A global overview of
forest conservation. 2 ed. Cambridge, U.K: CIFOR and WCMC.
Devastating Decline of Forest Elephants, C. Africa
PLOS ONE | www.plosone.org 13 March 2013 | Volume 8 | Issue 3 | e59469
Related Documents


![Devastating Decline of Forest Elephants in Central Africa · 2017-10-19 · challenges to the conservation of forest and savannah elephants [3,16]. African forest elephants have deep](https://static.cupdf.com/doc/110x72/5ec78f1e16bba61ea92315f8/devastating-decline-of-forest-elephants-in-central-africa-2017-10-19-challenges.jpg)