11.2017 COMPANY PRESENTATION

Welcome message from author
This document is posted to help you gain knowledge. Please leave a comment to let me know what you think about it! Share it to your friends and learn new things together.
Transcript

11.2017
COMPANY PRESENTATION

EQUITY STORY COMPANY
Company Presentation 2 November 2017
Deutsche EuroShop is Germany´s only public company that invests solely in shopping centers
Shopping centers are attractive investments because of
Continuously positive development of rents
Stable long term growth
Prime locations
High quality standards
Deutsche EuroShop does not seek short-term success, but rather long-term growth and the re-sulting stable increase in the value of the portfolio

AT A GLANCE
1 100%-view
Lettable space1 Approx. 1,087,000 sqm
Retail shops1 Approx. 2,700
Market value1 approx. €5.1 billion (DES-share €4.1 bn.)
Rents per year1 €297 million (DES-share €237 mn.)
Occupancy rate1 99%
Avg. GLA per DES-center: inner city 40,400 sqm est. locations 99,900 sqm
COMPANY
November 2017 Company Presentation 3
21 shopping centers on high street and in established locations – 17 in Germany and one each in Austria, Czech Republic, Hungary and Poland
2016 portfolio valuation: approx. 4.94% net initial yield (before transaction costs)
Professional center management by ECE, the European market leader in this industry

KEY FIGURES
1 2013 – 2016, Compound Annual Growth Rate (CAGR) 2 paid on 3 July 2017
COMPANY
REVENUE EBIT FFO
€m €m €m
NUMBER OF SHARES DIVIDEND PER SHARE NAV PER SHARE (EPRA)
mn € €
188.0
200.8 202.9
205.1
2013 2014 2015 2016
165.8 177.5 176.3 178.6
2013 2014 2015 2016
112.0 120.5 123.4 129.9
2013 2014 2015 2016
+5.1%1
53.95 53.95 53.95 53.95
2013 2014 2015 2016
1.25 1.30
1.35
2013 2014 2015 2016
30.59 33.17 39.58
43.24
2013 2014 2015 2016
1.402
+0%1 +3.8%1 +12.2%1
November 2017 Company Presentation 4
+2.5%1 +2.9%1

-1%
0%
1%
2%
3%
2006 2007 2008 2009 2010 2011 2012 2013 2014 2015 2016 2017(9M)
German inflation avg. 1.3% DES´ like-for-like revenue avg. 1.5%
LEASE SYSTEM
1 Status: 31 Dec. 2016 2 excl. VAT 3 Source: GfK Geomarketing
10 years lease
No break-up option
Turnover-linked rents
Minimum rents are CPI-linked
Avg. retail space rent per sqm and year: €270
Avg. turnover per sqm and year (productivity) in DES’ German shopping centers: €3,9061,2 (avg. German retail: €3,456, avg. German shopping centers: €3,912)1,2,3
Rent-to-sales-ratio: 7.5 – 11.5%
Weighted maturity of rental contracts: 5.7 years1
LIKE-FOR-LIKE REVENUE
COMPANY
November 2017 Company Presentation 5

TARGETS
November 2017 Company Presentation 6
COMPANY
Long term net asset value enhancement
Main focus on NAV and dividend
“Buy & hold”-strategy, Continuous growth
Stable and attractive dividends
Dividend yield: currently 4.7%
Investment-focus: At least 75% Germany and up to 25% Europe
Portfolio extension By acquisition of new shopping
centers By increasing existing amounts
of holdings By expansion of portfolio centers

MAP OF THE PORTFOLIO SHOPPING CENTERS
Germany 17 centers
Austria 1 center
Poland 1 center
Hungary 1 center
November 2017 Company Presentation 7
Czech Republic 1 center

-1
0
1
2
3
4
5
6
7
2005
Q4
2006
Q2
2006
Q4
2007
Q2
2007
Q4
2008
Q2
2008
Q4
2009
Q2
2009
Q4
2010
Q2
2010
Q4
2011
Q2
2011
Q4
2012
Q2
2012
Q4
2013
Q2
2013
Q4
2014
Q2
2014
Q4
2015
Q2
2015
Q4
2016
Q2
2016
Q4
2018
Q4
2020
Q4
Norderstedt 6.1%
Passau 5.5%
A10 6.5%
Billstedt 6.0%
Magdeburg 5.9%
Dresden 5.4%
Source: JLL
GERMAN PRIME SHOPPING CENTER YIELDS 2005-2020E
SHOPPING CENTERS
November 2017 Company Presentation 8
German shopping center prime yields
Euro Swap Rate
Forecast
Compression Decompression Polarisation Compression
%
Neunkirchen 5.0%

ACQUISITION OF OLYMPIA BRNO
November 2017 Company Presentation 9
Deutsche EuroShop acquired 100% of the shares in Olympia SPV from Rockspring and ECE European Prime Shopping Centre Fund I (50% each)
Closing: 31 March 2017
Total investment: approx. €382 million, net purchase price excl. debt of SPV and excl. acquisition costs: approx. €207 million
financing by long term debt (approx. €217 million, 57%) and proceeds of capital increase (approx. €165 million, 43%)
Expected annualised rents 2017: €20.1 million
Expected NOI yield: 5.1%, expected net initial yield: 5.0%
The SPV is fully consolidated as of 31 March 2017
SHOPPING CENTERS

SUCCESS FACTORS OF A MODERN SHOPPING CENTER
10 16 November 2017 Conference Call – Quarterly Statement 9M 2017
SHOPPING CENTERS
Food Courts and popular tenants
Location
Convenience
Ambience
Digitalization Logistics
Tenant Mix
Asset Management
More than 170 million customers per year
Click & Collect, Digital Mall Center Apps, Future Lab
ECE, a leading center manager in Europe
At Your Service program started
Mall Beautification program started

Design studies
INVESTMENTS: MALL BEAUTIFICATION & CONVENIENCE
11 16 November 2017 Conference Call – Quarterly Statement 9M 2017
SHOPPING CENTERS

0.00
0.20
0.40
0.60
0.80
1.00
1.20
1.40
1.60
1.80
2.00
2.20
2.40
2.60
40%
50%
60%
70%
80%
90%
100%
2014 2015 2016 2017* 2018*
Remainder
Capex
Principal payments
Dividend
Payout ratio
INVESTMENTS: CAPEX COVERED BY FFO
* Forecast Dividend per share: proposal ** expected: €27.5 million per year on avg.
12 16 November 2017 Conference Call – Quarterly Statement 9M 2017
2.23
Payout ratio in %
FFO per share in €
2.29
2.41
2.42- 2.46 2.35-
2.39
**
€25-30 million per year on avg.
€23-25 million per year on avg.
Expected for 2018-2022:
FINANCIALS
€0.05 increase per year (guidance until 2018)

Main-Taunus-Zentrum
A10 Center
Altmarkt- Galerie
Rhein-Neckar-Zentrum
Location Sulzbach/Frankfurt Wildau/Berlin Dresden Viernheim/Mannheim
Investment 52.0% 100% 100% 100%
Lettable space sqm
124,000 121,000 77,000 69,500
Parking 4,500 4,000 500 3,800
Number of shops Approx. 170 Approx. 200 Approx. 200 Approx. 110
Occupancy rate 100% 100% 100% 100%
Catchment area
Approx. 3.1 m. inhabitants
Approx. 1.1 m. inhabitants
Approx. 2.1 m. inhabitants
Approx. 1.5 m. inhabitants
Visitors 2016 8.10 m. 6.90 m. 14.40 m. 7.80 m.
Opening/ refurbishment
1964/2004/2011 1996/2011 2002/2011 1972/2002
GERMANY SHOPPING CENTERS
November 2017 Company Presentation 13

Herold- Center
Rathaus- Center
Allee- Center
Phoenix- Center
Location Norderstedt Dessau Magdeburg Hamburg
Investment 100% 100% 50.0% 50.0%
Lettable space sqm
54,300 52,500 51,300 43,400
Parking 850 850 1,300 1,400
Number of shops Approx. 140 Approx. 90 Approx. 150 Approx. 130
Occupancy rate 96% 100% 98% 97%
Catchment area
Approx. 0.5 m. inhabitants
Approx. 0.5 m. inhabitants
Approx. 0.8 m. inhabitants
Approx. 0.6 m. inhabitants
Visitors 2016 11.50 m. 5.60 m. 9.50 m. 9.20 m.
Opening/ refurbishment
1971/1995/2003 1995 1998/2006 2004/2016
GERMANY SHOPPING CENTERS
November 2017 Company Presentation 14

Billstedt- Center
Saarpark- Center Forum
Allee- Center
Location Hamburg Neunkirchen Wetzlar Hamm
Investment 100% 50.0% 65.0% 100%
Lettable space sqm
42,500 35,600 34,500 34,000
Parking 1,500 1,600 1,700 1,300
Number of shops Approx. 110 Approx. 130 Approx. 110 Approx. 90
Occupancy rate 95% 96% 98% 99%
Catchment area
Approx. 1.0 m. inhabitants
Approx. 0.6 m. inhabitants
Approx. 0.5 m. inhabitants
Approx. 0.7 m. inhabitants
Visitors 2016 10.10 m. 6.90 m. 7.60 m. 6.50 m.
Opening/ refurbishment
1969/1977/1996 1989/1999/2009 2005 1992/2003/2009
GERMANY SHOPPING CENTERS
November 2017 Company Presentation 15

City- Galerie
City- Arkaden
City- Point
Stadt- Galerie
Location Wolfsburg Wuppertal Kassel Passau
Investment 100% 100% 100% 75.0%
Lettable space sqm
30,800 28,700 27,800 27,700
Parking 800 650 220 500
Number of shops Approx. 100 Approx. 80 Approx. 60 Approx. 90
Occupancy rate 98% 99% 100% 100%
Catchment area
Approx. 0.5 m. inhabitants
Approx. 0.8 m. inhabitants
Approx. 0.8 m. inhabitants
Approx. 1.2 m. inhabitants
Visitors 2016 7.50 m. 8.40 m. 8.60 m. 8.00 m.
Opening/ refurbishment
2001/2006 2001/2004 2002/2009/2015 2008
GERMANY SHOPPING CENTERS
November 2017 Company Presentation 16

Stadt- Galerie
Location Hameln
Investment 100%
Lettable space sqm
26,000
Parking 500
Number of shops Approx. 100
Occupancy rate 97%
Catchment area
Approx. 0.4 m. inhabitants
Visitors 2016 5.80 m.
Opening/ refurbishment
2008
GERMANY SHOPPING CENTERS
November 2017 Company Presentation 17

Olympia Galeria
Bałtycka City
Arkaden Árkád
Location
Brno, Czech Republic
Gdansk, Poland
Klagenfurt, Austria
Pécs, Hungary
Investment 100% 74.0% 50.0% 50.0%
Lettable space sqm
85,000 48,700 36,900 35,400
Parking 4,000 1,050 880 850
Number of shops Approx. 200 Approx. 195 Approx. 120 Approx. 130
Occupancy rate 99% 100% 98% 99%
Catchment area
Approx. 1.2 m. inhabitants
Approx. 1.1 m. inhabitants
Approx. 0.4 m. inhabitants
Approx. 1.0 m. inhabitants
Visitors 2016 8.4 m. 9.80 m. 5.80 m. 12.50 m.
Opening/ refurbishment
1999/2014-16 2007 2006 2004
EUROPE SHOPPING CENTERS
November 2017 Company Presentation 18
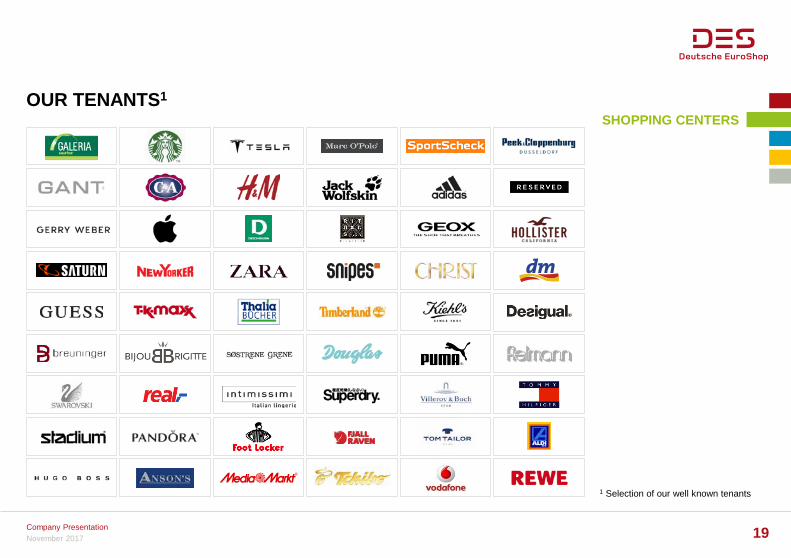
OUR TENANTS1
1 Selection of our well known tenants
SHOPPING CENTERS
November 2017 Company Presentation 19

TENANTS STRUCTURE TOP 10 TENANTS1
1 in % of total rents as at 31 Dec. 2016 2 excluding Kaufhof 3 perfumeries only
SHOPPING CENTERS
2016 2015
Metro Group2 4.7% 4.5%
H&M 3.6% 3.4%
New Yorker 2.4% 2.3%
Peek & Cloppenburg
2.2% 2.1%
Deichmann 2.0% 1.8%
Douglas3 2.0% 2.1%
C&A 1.9% 1.5%
REWE 1.7% 1.6%
dm-drogerie markt 1.4% 1.2%
Thalia 1.3% 1.0%
Total 23.2% 21.5%
77%
23%
Other tenants
Company Presentation 20
Low level of dependence on the top 10 tenants
November 2017

MATURITY DISTRIBUTION OF RENTAL CONTRACTS1
1 as % of rental income as at 31 Dec. 2016
SHOPPING CENTERS
2022 et sqq:
72%
2021: 18%
2020: 4%
2019: 3%
2018: 2%
2017: 1%
Company Presentation 21
Long-term contracts base rental income
Weighted maturity 5.7 years
November 2017

SECTOR MIX1
1 as % of rental space as at 31 Dec. 2016
Balanced sector diversification
Fashion 51.8%
Non-food/ electronics
18.8%
Department stores 10.5%
Food 6.8%
Health & beauty 6.1%
Catering 4.4%
Services 1.6%
SHOPPING CENTERS
November 2017 Company Presentation 22

KEY FIGURES 9M 2017
FINANCIALS € million 01.01. – 30.09.2017 01.01. – 30.09.2016 Change
Revenue 161.0 152.3 6%
Net operating income 144.4 136.0 6%
EBIT 140.2 131.5 7%
Net finance costs -30.1 -36.6 18%
Measurement gains/losses -3.6 -4.8 25%
EBT 106.6 90.1 12%
Consolidated profit 85.2 72.2 18%
FFO per share (€) 1.88 1.74 8%
EPRA Earnings per share (€, undiluted) 1.79 1.66 8%
€ million 30.09.2017 31.12.2016 Change
Total equity1 2,422.1 2,240.7 8%
Net Financial liabilities 2,141.4 1,873.8 14%
Total assets 4,563.5 4,114.5 11%
Equity ratio1 53.1% 54.5%
Loan to value ratio 35.5% 34.2%
Cash and cash equivalents 81.2 64.0 27%
November 2017 Company Presentation 23
1 Including the share attributable to equity-accounted joint ventures and associates

5.40 5.64
5.80 5.89 5.92 5.98 5.97 5.87
5.46 5.24
5.14 5.37
5.52 5.61 5.64 5.70 5.69 5.53
5.13 4.94
2007 2008 2009 2010 2011 2012 2013 2014 2015 2016
Net operating yield in % Net initial yield in %
VALUATION1 – INVESTMENT PROPERTIES 2016
1 External appraisers: since 2015: JLL
SENSITIVITY ANALYSIS
in € thousand Basis change of -25bps change of +25bps
Rent increase rates 1.39% -101,100 +148,000
Discount rate 5.97% +69,000 -69,200
Capitalization rate 5.21% +114,200 -106,600
Cost ratio 10.17% +10,400 -9,000
FINANCIALS
Company Presentation 24 November 2017

LOAN STRUCTURE INCL. CONVERTIBLE BONDS1,2
1 as of 30 September 2017 2 excl. non-consolidated loans
FINANCIALS Interest lockin Duration
Principle amounts (€ million)
Share of total loan
avg. interest rate
Up to 1 year 96.1 5.9% 1.87%
1 to 5 years 3.3 513.9 31.4% 4.26%
5 to 10 years 6.7 706.5 43.1% 2.75%
Over 10 years 10.3 322.1 19.6% 2.45%
Total1 5.3 1,638.6 100% 2.90%
3.88 3.76 3.69 3.67
2.90
012345678
2.50
3.00
3.50
4.00
2013 2014 2015 2016 2017
avg. interest rates weighted maturities
yrs %
21 German and 4 foreign bank partners
Weighted maturity of fixed interest periods 5.3 years1
Company Presentation 25 November 2017
1

in € million end of fixed interest periods respectively expiring loans
avg. interest rate
regular redemption
payments total
maturities
2017 91.2 1.75% 4.9 96.1
2018 148.3 2.49% 22.3 170.6
2019 123.1 4.73% 19.9 143.0
2020 134.1 4.52% 19.5 153.6
2021 198.3 4.48% 16.0 214.3
2022 217.8 3.26% 16.5 234.3
912.8
Convertible Bond3
in € million
End of fixed interest periods respectively
expiring loans Avg. interest
rate DES‘
share
2017-2019 0
2020 35.0 4.00% 50%
2021 48.6 4.65% 50%
2022 12.1 4.90% 50%
MATURITIES UNTIL 20221,2
1 as of 30 September 2017 2 excl. non-consolidated loans 3 99.5% conversion as of 6 November 2017
FINANCIALS
Conference Call – Quarterly Statement 9M 2017 26 16 November 2017
Non-consolidated loans1
Phoenix-Center Hamburg
Saarpark-Center Neunkirchen
Saarpark-Center Neunkirchen
Already fixed:
Allee-Center Hamm: €4.9m, 1.68%, 6y
Altmarkt-Galerie Dresden: €71.6m, 1.63%, 10y City-Arkaden Wuppertal €12.2m, 1.91%, 7.3y
Galeria Baltycka Gdansk: €81.0m, 2.03%, 10y

GERMAN CONSUMER PRICE INDEX
Source: Destatis
November 2017 27
FINANCIALS
Company Presentation
99
101
103
105
107
109
111
Apr
-10
Jul-1
0
Oct
-10
Jan-
11
Apr
-11
Jul-1
1
Oct
-11
Jan-
12
Apr
-12
Jul-1
2
Oct
-12
Jan-
13
Apr
-13
Jul-1
3
Oct
-13
Jan-
14
Apr
-14
Jul-1
4
Oct
-14
Jan-
15
Apr
-15
Jul-1
5
Oct
-15
Jan-
16
Apr
-16
Jul-1
6
Oct
-16
Jan-
17
Apr
-17
Jul-1
7
Oct
-17
106
107
108
109
110
last 2 years
+2.6% since Oct. 15
+9.6% since Apr. 10

FORECAST
FINANCIALS
November 2017 28
1 Compound Annual Growth Rate (CAGR) 2014 - 2018 2 weighted, taking into account the fact that the convertible bond was nearly fully converted at the end of its term in November 2017
Company Presentation
FFO
€m
120.5 123.4 129.9
140-143
145-148
2014 2015 2016 2017 2018
+5.0%1
NUMBER OF SHARES2
mn
53.95 53.95 53.95
58.25
61.78
2014 2015 2016 2017 2018
+3.4%1
FFO PER SHARE
€
2.23 2.29
2.41
2.42-2.46 2.35-
2.39
2014 2015 2016 2017 2018
+1.5%1
EBT EXCL. VALUATION
€m
125.0 127.0 134.5
145-148
154-157
2014 2015 2016 2017 2018
+5.6%1
REVENUE
€m
200.8 202.9 205.1
216-220
220-224
2014 2015 2016 2017 2018
+6% +2%
+2.5%1
EBIT
€m
177.5 176.3 178.6
187-191
193-197
2014 2015 2016 2017 2018
+2.4%1
+6% +3% +7% +7%
+9% +6% +9% +4%
+1% -3%

1.05 1.05 1.05 1.05 1.10 1.10
1.20 1.25
1.30 1.35
1.407 1.458
1.508
23.50 24.30 23.67 28.98
24.80
31.64 31.83
36.20 40.46
38.67
32.67
10.00
15.00
20.00
25.00
30.00
35.00
40.00
45.00
0.90
1.00
1.10
1.20
1.30
1.40
1.50
1.60
2007 2008 2009 2010 2011 2012 2013 2014 2015 2016 2017 2018 2019
DIVIDEND & PERFORMANCE
1 respectively paid for the previous FY 2 2017: as of 16 Nov. 2017 3 as of 31 Dec. 2016 4 EPRA/NAREIT Europe 5 German government bonds index 6 Open ended real estate funds 7 paid on 3 July 2017 8 planned proposal
TREND OF SHARE
Dividend1 Share price2
PERFORMANCE3
DES DAX EPRA4 REX5 OEF6
1 year (2016) -1.2% +6.9% -5.0% +2.3% +2.8%
3 years +34.1% = +10.3% p.a. +6.3% p.a. +13.0% p.a. +3.3% p.a. +2.9% p.a.
5 years +86.0% = +13.2% p.a. +14.2% p.a. +15.3% p.a. +2.8% p.a. +2.3% p.a.
Since IPO (2001) +280.9%= +8.7% p.a. +3.7% p.a. +7.9% p.a. +4.6% p.a. +3.3% p.a.
SHARE
November 2017 Company Presentation 29

SHAREHOLDER STRUCTURE1
1 Status: 17 Nov. 2017
Institutional Investors
51.6%
Private Investors
19.3%
Alexander Otto 16.7% BlackRock 5.9% US 9%
Germany 68%
NL 3%
UK 9%
FR 3%
Other 3% CH 3% NO 2%
17,800 shareholders Free float 83.3% SHARE
November 2017 Company Presentation 30
Johannes Schorr 3.5%
State Street 3.0%

ANALYSTS‘ CONSENSUS1
1 Aggregated by DES, status: 8 Nov. 2017, 21 analysts
avg./in € 2017 2018
EBIT (€ million) 192.0 197.4
FFO per share 2.46 2.45
NAV per share 43.02 44.86
Dividend 1.45 1.50
Price target 39.96
SELL UNDERPERFORM NEUTRAL OUTPERFORM BUY
BA Merrill Lynch Commerzbank Deutsche Bank Equinet Green Street GSC Research HSBC J.P. Morgan
Cazenove Kempen Natixis Oddo BHF
Kepler Cheuvreux Metzler M.M. Warburg NORD/LB Societe Generale
0%
50%
100%
Q204
Q404
Q205
Q405
Q206
Q406
Q207
Q407
Q208
Q408
Q209
Q409
Q210
Q410
Q211
Q411
Q212
Q412
Q213
Q413
Q214
Q414
Q215
Q415
Q216
Q416
Q217
Q417
negative neutral positive
SHARE
November 2017 Company Presentation 31
Baader Bank Bankhaus Lampe Berenberg Bank DZ Bank Independent
Research

10 REASONS TO INVEST
SHARE
The only public company in Germany to invest solely in shopping centers
Prime locations
Proven, conservative strategy
Shareholder-friendly dividend policy
Stable cash flow with long term visibility
01 02 03 04 05
Experienced management team
Excellent track record
Centers almost 100% let
Solidity combined with growth potential
Inflation-protected rental agreements
06 07 08 09 10
November 2017 Company Presentation 32

KEY DATA OF THE SHARE
APPENDIX
Listed since 02.01.2001
Nominal capital €61,783,594.00
Outstanding shares 61,783,594
Class of shares Registered shares
Dividend 2016 (paid on 3 July 2017) €1.40
52W High €39.47
52W Low €30.29
Share price (14 Nov. 2017) €31.22
Market capitalisation €1.93 billion
Avg. turnover per day last 12 months (XETRA) 197,300 shares
Indices MDAX, EPRA, GPR, MSCI Small Cap,
EURO STOXX, STOXX Europe 600
Official market Prime Standard
Frankfurt and XETRA
OTC market Berlin-Bremen, Dusseldorf, Hamburg,
Hanover, Munich and Stuttgart
ISIN DE 000 748 020 4
Ticker DEQ, Reuters: DEQGn.DE
Market maker Oddo Seydler
November 2017 Company Presentation 33

APPENDIX
34
RETAIL TURNOVER 9M 20171
1 German centers on a like-for-like basis (turnover: €2.2 billion) 2 The sum may not equal the totals due to rounding
Retail sector % change
to 2016 rent-to-sales
ratio in % % of
sales % of
space
Department stores -0.5 6.2 7.4 13.1
Food -0.4 7.6 8.7 6.2
Fashion textiles +0.7 11.9 29.8 39.6
Shoes & leather goods +0.9 14.4 5.4 6.5
Sports -2.3 9.6 3.9 5.0
Health & beauty -1.0 7.2 11.8 6.0
General retail -1.6 10.6 8.2 8.9
Electronics +6.3 3.8 15.2 8.5
Services +4.0 4.9 4.9 1.8
Food catering +2.6 12.5 4.8 4.3
Total +1.0 8.9 1002 1002
Retail turnover development on a like-for-like basis: Germany +1.0% , abroad +5.4% DES-Portfolio overall: +1.8%
Absolute turnover development: Germany +1.5%, abroad +5.8% DES-Portfolio overall: +2.3%
November 2017 Company Presentation

ONLINE VS. STATIONARY RETAIL?
Source: GfK
TURNOVER DISTRIBUTION OF A FASHION RETAILER
Pure online purchases
Order in shop, dispatch by post
Order online, pickup in shop (click & collect)
Online search, purchase in shop
Pure shop purchases
Stationary retail transforms from “Point of Purchase” to “Touch Point” (product experience)
New store concepts (flagship store, show room, multi-channel store, pick-up store), click & collect, augmented reality, online goes offline, mobile services
“Location, location, location” newly interpreted: “Convenience, attractivity & likeability“
November 2017 Company Presentation 35
APPENDIX

THE CUSTOMER JOURNEY IN OUR SHOPPING CENTERS
Source: ECE
November 2017 Company Presentation 36
APPENDIX
„Love2shop“ app center website social media
„Easy to Park“ card QR code car finder
3D wayfinding systems indoor navigation InfoGate
gift-wrapping and packaging services personal shopper guest card
cell phone charging stations quiet zones/lounge areas Selfie photo boxes free Wi-Fi
same day delivery service prepaid parking cards

ECOMMERCE: GROWTH WITHOUT END?
Source: GfK
PROGRESSION OF ONLINE RETAIL TO MARKET MATURITY
November 2017 Company Presentation 37
APPENDIX

OUR PARTNER:
APPENDIX
ECE develops, plans, builds, leases and manages large commercial real estate in the sectors shopping, office, industries since 1965
originally ECE was an abbreviation for the German word Einkaufscenterentwicklung (Shopping center development)
100% privately owned by the Otto family
Active in 14 European countries
European market leader in the shopping center business
Assets under management:
− approx. 200 shopping centers
− 7.3 million sqm overall sales area
− approx. 21,000 retail businesses
− 4.6 million daily visitors
− €31 billion assets under management
Many investors rely on ECE:
November 2017 Company Presentation 38
Austria Bulgaria Czech Republic Denmark Germany Hungary Italy
Lithuania Poland Qatar Russia Slovakia Spain Turkey

ENVIRONMENT
Climate protection is one of the most important issues for Deutsche EuroShop. We believe that sustainability and profitability, the shopping experience and environmental awareness are not opposing forces. Long-term thinking is part of our strategy. This includes playing our part in environmental protection
In 2016, all our German shopping centers had contracts with suppliers that use renewable energy sources, such as hydroelectric power, for their electricity needs. The “EnergieVision” organisation certified the green electricity for our centers in Germany with the renowned “ok-power” accreditation in 2016. We also plan to switch our centers in other countries over to green electricity wherever possible within the next few years
The German centers used a total of around 62.5 million kWh of green electricity in 2016. This represented 100% of the electricity requirements in these shopping centers. Based on conservative calculations, this meant a reduction of around 22,445 tonnes in carbon dioxide emissions, which equates to the annual CO2 emissions of more than 1,000 two-person households. The use of heat exchangers and energy-saving light bulbs allows us to further reduce energy consumption in our shopping centers
Deutsche EuroShop, through its shopping centers, also supports a range of activities at local and regional level in the areas of ecology, society and economy
APPENDIX
November 2017 Company Presentation 39

FINANCIAL CALENDAR
APPENDIX
2017
Company Presentation 40 November 2017
15.11. Quarterly Statement 9M 2017
16.11. Natixis European Mid Caps Conferece, Paris
17.11. Roadshow Brussels, Kempen & Co
21.11. DZ Bank Equity Conf.erence, Frankfurt
05.12. Berenberg European Conference, Pennyhill
11.-12.12. HSBC Global RE Conference, Cape Town
18.12.-19.12. Roadshow Abu Dhabi & Dubai, Berenberg
11.-12.01. Oddo MidCap Forum, Lyon
16.01. Kepler Cheuvreux GCC, Frankfurt
20.03. Preliminary Results 2017
27.04. Publication of the Annual Report 2017
15.05. Quarterly Statement 3M 2018
28.06. Annual General Meeting, Hamburg
14.08. Half-year Financial Report 2018
14.11. Quarterly Statement 9M 2018
2018

CONTACT
Important Notice: Forward-Looking Statements
Statements in this presentation relating to future status or circumstances, including state-ments regarding management’s plans and ob-jectives for future operations, sales and earn-ings figures, are forward-looking statements of goals and expectations based on estimates, as-sumptions and the anticipated effects of future events on current and developing circumstan-ces and do not necessarily predict future re-sults.
Many factors could cause the actual results to be materially different from those that may be expressed or implied by such statements. Deutsche EuroShop does not intend to update these forward-looking statements and does not assume any obligation to do so.
APPENDIX
41 November 2017
Deutsche EuroShop AG Investor & Public Relations Heegbarg 36 22391 Hamburg
Tel. +49 (40) 41 35 79 – 20/ – 22 Fax +49 (40) 41 35 79 – 29 E-Mail: [email protected] Web: www.deutsche-euroshop.com
Company Presentation
ir-mall.com
facebook.com/euroshop
flickr.com/desag
slideshare.net/desag
twitter.com/des_ag
youtube.com/DeutscheEuroShop
PATRICK KISS
Head of IR
NICOLAS LISSNER
IRO
WILHELM WELLNER
CEO
OLAF BORKERS
CFO
Related Documents