Deutsche Bank Deutsche Bank: Winning in a changed environment Jürgen Fitschen and Anshu Jain, Co-Chairmen of the Management Board and the Group Executive Committee Investor Day, Frankfurt, 11 September 2012 financial transparency. Jürgen Fitschen, Anshu Jain Investor Day, Frankfurt, 11 September 2012 Deutsche Bank Investor Relations

Welcome message from author
This document is posted to help you gain knowledge. Please leave a comment to let me know what you think about it! Share it to your friends and learn new things together.
Transcript
Deutsche Bank
Deutsche Bank:Winning in a changed environment Jürgen Fitschen and Anshu Jain,Co-Chairmen of the Management Board and the Group Executive Committee
Investor Day, Frankfurt, 11 September 2012
financial transparency. Jürgen Fitschen, Anshu Jain Investor Day, Frankfurt, 11 September 2012
Deutsche BankInvestor Relations
y, , p

Agenda
1 Operating environment
Vision
p g
2
Capital and operational excellence4
Strategy 2015+: Recalibrating the Bank3
Cultural change5
Summary6 Summary6
financial transparency. Jürgen Fitschen, Anshu Jain Investor Day, Frankfurt, 11 September 2012
Deutsche BankInvestor Relations
1

We face a challenging medium-term environment
Low growth; further potential for shocks
Continued dependence on policy stimulus
Significant, prolonged deleveraging ahead
Macroeconomic challenges
Changing global demographics
Urbanization and financial deepening in emerging marketsMegatrends drive
significant
Fractured relationship with society
Technological advancementsopportunities
Fractured relationship with society
Restrictive regulatory landscape
Transformation of competitive landscape
Unprecedented pressure on banks
financial transparency. Jürgen Fitschen, Anshu Jain Investor Day, Frankfurt, 11 September 2012
Deutsche BankInvestor Relations
Transformation of competitive landscape
2

Near-term challenges, longer-term opportunities
Macro-economic challenges: Examples Longer-term mega trends: Examples
5 6Ø 2004-11 7.0GDP growth, in % Retired workforce (aged >60), in %
4732
31
Lower global growth
1.4 1.2 1.51.1 0.52.6
5.6
EM
Ø 2012-15eAging
population
Emerging Markets
Developed countries
20502011
32
20502011
16
Unprece-dented
li
Central bank assets, normalized to 100, June 2007
250350450
Fed
BoE
Urbaniza-ti
Marketscountries
% of population in urban centers205020101990
50
100
policy stimulus
50150250
2007 2008 2009 2010 2011 2012
ECBFed
Domestic debt outstanding, % of GDP
tion
0
50
US Europe Asia Africa
FX daily electronic trading l i USD t
Cost of storagei b t i USD
Need for delever-
aging500400300
600Europe
US
UK
2000 2004 2008 2012Germany
Impact of technology
volumes, in USD tn
0.52.0
10yrs ago Now
per gigabyte, in USD
0.1
30yrs ago Now
100,000
financial transparency. Jürgen Fitschen, Anshu Jain Investor Day, Frankfurt, 11 September 2012
Deutsche BankInvestor Relations
3
2000 2004 2008 2012
Source: GDP growth: IMF World Economic Outlook (2004-2011), DB Research (2012-2015), Haver Analytics, DB Research, Bloomberg, United Nations Statistics, BIS

Reputational and regulatory challenges
Lack of trust in the banking sector Further restrictive regulatory changes
B l 3Percentage of survey respondents who place trust in
Basel 3Capital, leverage and
funding
Restrictions on
— Compressed profitability: Reduced margins and
given industry, 2012(1)
626466
79
Restrictions on business activities
Volcker, ICB, compensation
increased fixed costs
— Changes to fundamental
47515356
62
Additional taxesBank levies,
transaction taxes
fundamental structures and business models
Consumer protection Disclosures, distribution
— Changes to compensation levelsFoodAutoTech Tele-
comPhar-ma
BanksMediaEner-gy
financial transparency. Jürgen Fitschen, Anshu Jain Investor Day, Frankfurt, 11 September 2012
Deutsche BankInvestor Relations
4
(1) Participants assessed trust of every industry on a 9-point scale from “trust them a great deal” to “don’t trust them at all”Source: Edelman trustbarometer
gy

In this environment, the banking industry shrinks …
Has shrunk in previous crises …Share of total assets Number of commercial Number of banks by geography
… and is shrinking now
held by second tier banks in Japan(1)
banks in the USy g g y
EU 15
~ 20,000
~(50)%~(20)ppt
60%
40%
(33)%
8,680
10,924(34)%
10,043
~ 10,0007,358
6,6787,345
(45)%
2 0503,420
1990s 20111929 1933 201120061997
1,8982,050
201120061997 201120061997
financial transparency. Jürgen Fitschen, Anshu Jain Investor Day, Frankfurt, 11 September 2012
Deutsche BankInvestor Relations
1990s 20111929 1933(1) Denotes banks outside of the top 5Source: Japanese Bankers Association, FDIC, ECB, DB Research
5
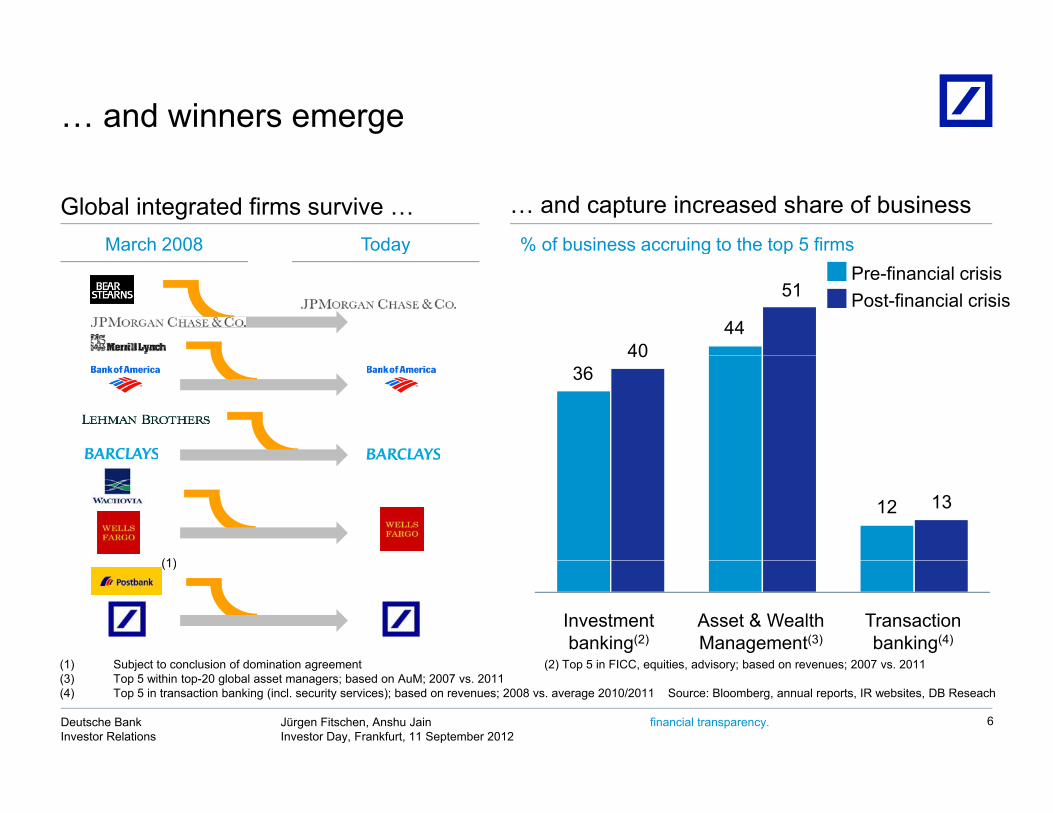
… and winners emerge
% of business accruing to the top 5 firms
Global integrated firms survive … … and capture increased share of businessMarch 2008 Today g p
Pre-financial crisisPost-financial crisis
4440
y
51
3640
12 13
(1)
Investment banking(2)
Asset & Wealth Management(3)
Transaction banking(4)
(1) Subject to conclusion of domination agreement (2) Top 5 in FICC equities advisory; based on revenues; 2007 vs 2011
(1)
financial transparency. Jürgen Fitschen, Anshu Jain Investor Day, Frankfurt, 11 September 2012
Deutsche BankInvestor Relations
6
(1) Subject to conclusion of domination agreement (2) Top 5 in FICC, equities, advisory; based on revenues; 2007 vs. 2011(3) Top 5 within top-20 global asset managers; based on AuM; 2007 vs. 2011 (4) Top 5 in transaction banking (incl. security services); based on revenues; 2008 vs. average 2010/2011 Source: Bloomberg, annual reports, IR websites, DB Reseach

Clients will define future winners
Increasingly complex client needs … … define attributes of future winners
World-class financial strengthPrudent risk management
Sustainable fundingAsset gathering capability
24/7 access to liquidity globally
Access to worldwide markets
Payments / flow of funds
Risk solutions
Superior client solutionsDiversified solutions providerRisk solutions
Trade facilitation
Ability to deliver around the worldFlexible resource allocation
Wealth preservation and growth
Trusted advice Culture of responsibility and excellenceResponsible product innovation
New balance of risk/rewardOperational excellence
financial transparency. Jürgen Fitschen, Anshu Jain Investor Day, Frankfurt, 11 September 2012
Deutsche BankInvestor Relations
7

Agenda
1 Operating environment
Vision
p g
2
Capital and operational excellence4
Strategy 2015+: Recalibrating the Bank3
Cultural change5
Summary6 Summary6
financial transparency. Jürgen Fitschen, Anshu Jain Investor Day, Frankfurt, 11 September 2012
Deutsche BankInvestor Relations
8
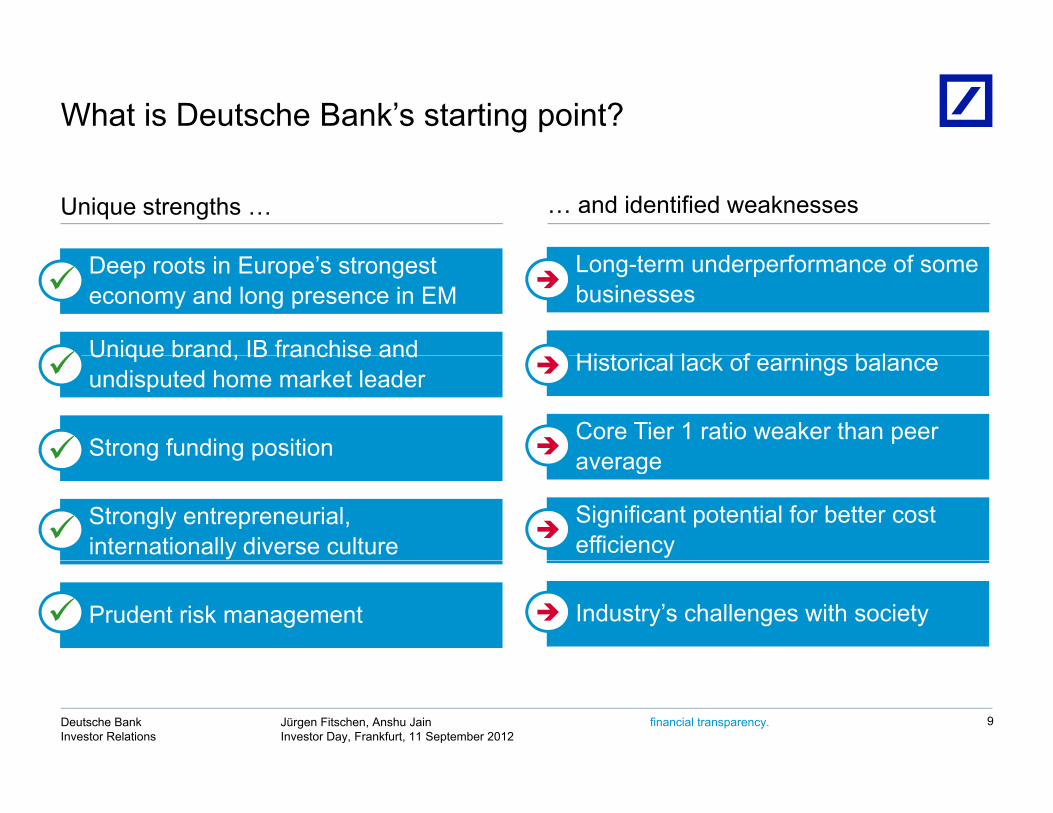
What is Deutsche Bank’s starting point?
Unique strengths … … and identified weaknesses
Long-term underperformance of some businesses
Hi t i l l k f i b l
Deep roots in Europe’s strongest economy and long presence in EM
Unique brand, IB franchise and
Core Tier 1 ratio weaker than peer average
Historical lack of earnings balance
Strong funding position
Unique brand, IB franchise and undisputed home market leader
average
Significant potential for better cost efficiency
g g p
Strongly entrepreneurial, internationally diverse culture
Industry’s challenges with societyPrudent risk management
financial transparency. Jürgen Fitschen, Anshu Jain Investor Day, Frankfurt, 11 September 2012
Deutsche BankInvestor Relations
9

Our vision
We aspire to be the leading client-centric global universal bank
We commit to a culture that aligns risks and rewards; attracts and
We serve shareholders best by putting our clients first and by We value our German develops talented
individuals; fosters teamwork and t hi d i
clients first and by building a global
network of balanced businesses
We value our German roots and remain
dedicated to our global presence partnership; and is
sensitive to the society in which we operate
businesses underpinned by strong
capital and liquidity
presence
financial transparency. Jürgen Fitschen, Anshu Jain Investor Day, Frankfurt, 11 September 2012
Deutsche BankInvestor Relations
10
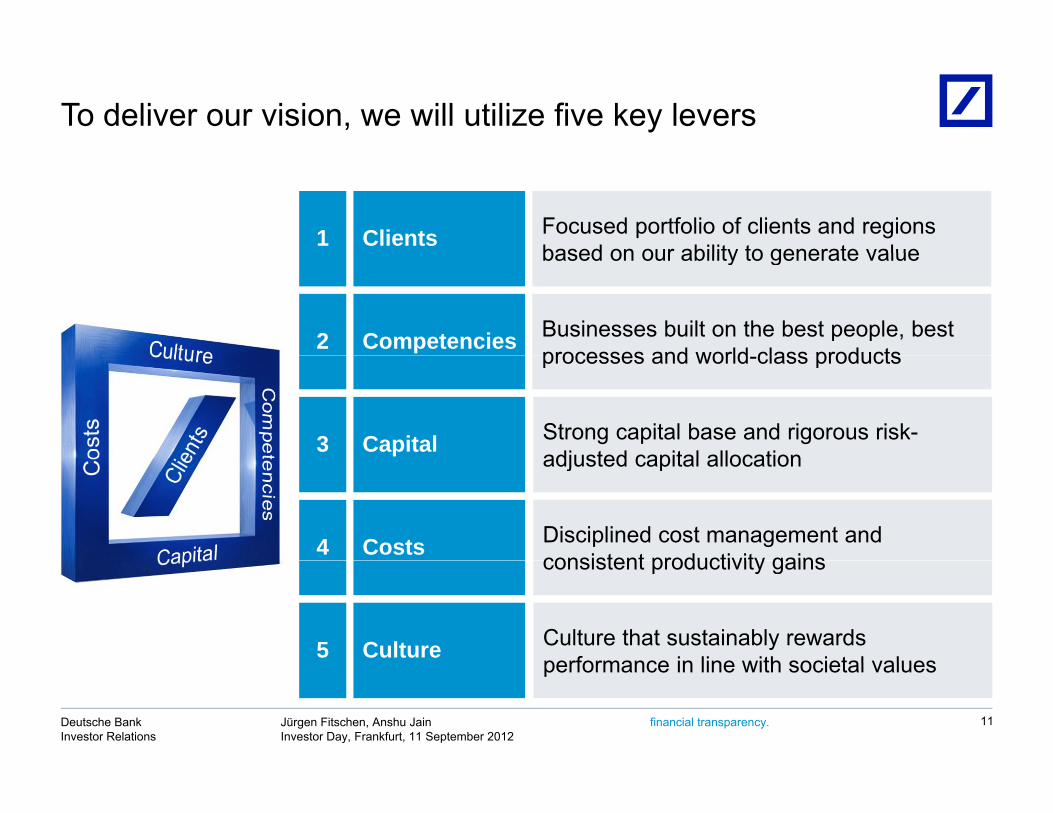
To deliver our vision, we will utilize five key levers
Focused portfolio of clients and regions based on our ability to generate value1 Clients
Businesses built on the best people, best processes and world class products
based on our ability to generate value
2 Competencies
Capital Strong capital base and rigorous risk-adjusted capital allocation
processes and world-class products
3 adjusted capital allocation
Disciplined cost management and consistent productivity gains4 Costs consistent productivity gains
Culture that sustainably rewards performance in line with societal values5 Culture
financial transparency. Jürgen Fitschen, Anshu Jain Investor Day, Frankfurt, 11 September 2012
Deutsche BankInvestor Relations
11
performance in line with societal values

Agenda
1 Operating environment
Vision
p g
2
Capital and operational excellence4
Strategy 2015+: Recalibrating the Bank3
Cultural change5
Summary6 Summary6
financial transparency. Jürgen Fitschen, Anshu Jain Investor Day, Frankfurt, 11 September 2012
Deutsche BankInvestor Relations
12

Of the many priorities, three are keyA i ti
Fully — Normalization/stabilization of
FY2011Aspiration
2015 Key assumptions
Fully loaded B3 Core Tier 1
ratio
>10%<6%(1)
— Normalization/stabilization of asset valuations
— Revenue growth in line with market
Cost Income <65%78%
— No major changes to current regulatory frameworks on capital or separation
Ratio — Global GDP growth 2-4% p.a. over the period
— Normalization of EUR/USD h t ( 1 30)
Post-tax RoE >12%(2)8%
exchange rate (~1.30)— Selective consolidation driven
market share gains
financial transparency. Jürgen Fitschen, Anshu Jain Investor Day, Frankfurt, 11 September 2012
Deutsche BankInvestor Relations
13
(1) Pro-forma (2) Based on corporate tax rate guidance of 30-35%, Basel 3 (fully loaded) and average active equity
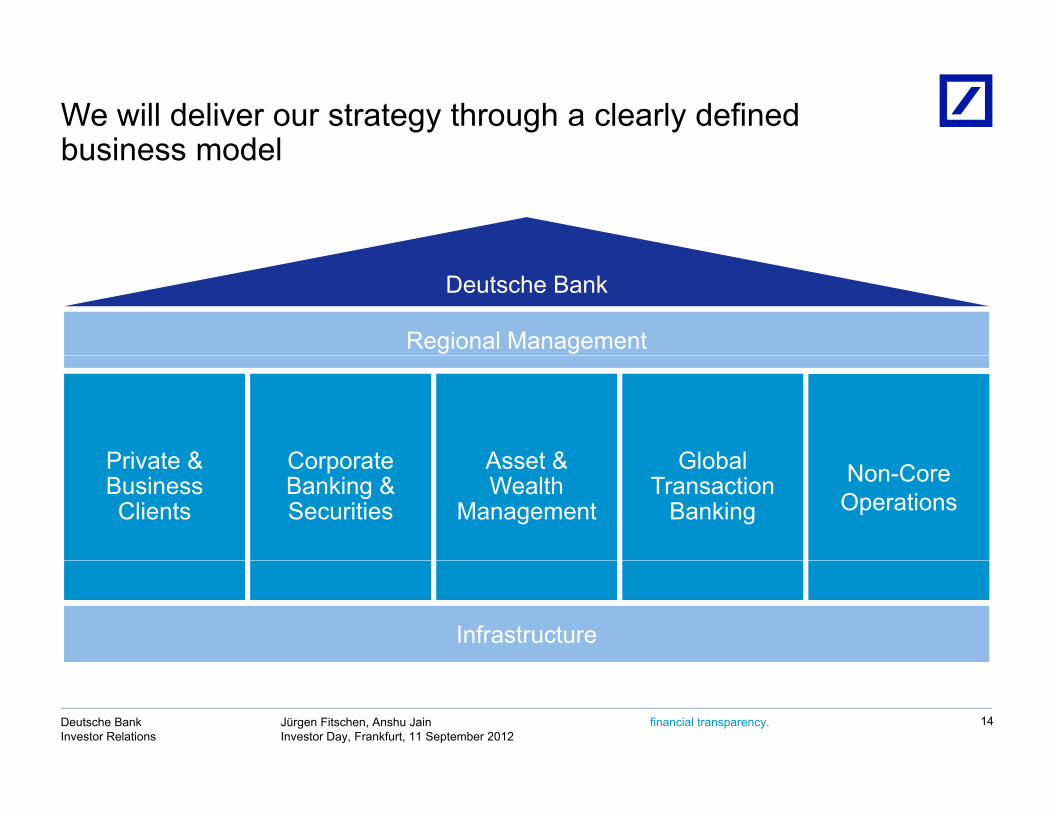
We will deliver our strategy through a clearly defined business modelbusiness model
Deutsche Bank
Regional Management
Private & Asset & GlobalCorporate Non-Core Operations
Private & Business Clients
Asset & Wealth
Management
Global Transaction
Banking
Corporate Banking & Securities
Infrastructure
financial transparency. Jürgen Fitschen, Anshu Jain Investor Day, Frankfurt, 11 September 2012
Deutsche BankInvestor Relations
14

We plan to grow our geographic footprint in Germany, the Americas and Asia Pacificthe Americas and Asia Pacific
— Build on existing strong platform as bank of choice
>20% 10-20% ≤0%
Indicative IBIT CAGR(1) aspiration 2011-2015
— Increase loan volume by at least EUR 10 bn by 2015
— Streamline resource consumption in line with
Germany
Streamline resource consumption in line with growth prospects
— Commit to the leading corporates and institutions
— Position franchise to benefit from pro-cyclical
EMEA ex Germany
Position franchise to benefit from pro cyclical recovery
— Capture market share, especially in Equities, Corporate Finance, core Latin America markets
Americas
— Investment in CB&S flow franchise, GTB local large cap clients and PWM in core markets
— Deepen focus on India, China, Korea and ASEANAsia Pacific
financial transparency. Jürgen Fitschen, Anshu Jain Investor Day, Frankfurt, 11 September 2012
Deutsche BankInvestor Relations
15
Note: Excluding Corporate Investments and Consolidation & Adjustments (C&A)(1) Compound annual growth rate

We will optimize delivery to clients
Our clients today How we will enhance delivery going forwardExamplesIndicative split of 2011 client revenues
Retail clients
100%
German Mid-Caps:Renewed approach to combine world-class
Wealthy individuals
SMEs
ppproducts with enhanced local coverage
UHNWI coverage:
Corporates
UHNWI coverage: New, streamlined UHNWI solutions platformand servicing teams
Institutions
Governments
Emerging markets corporates:New investment in trade finance and cash management solutions to support global client business
financial transparency. Jürgen Fitschen, Anshu Jain Investor Day, Frankfurt, 11 September 2012
Deutsche BankInvestor Relations
16
Governments business

We will allocate assets dynamically across our portfolio
— DB will emphasize and add value ...align well ...meet contribute ILLUSTRATIVE
Key principles Operating portfolio implications: Does the business ...
DB will emphasize and invest in businesses which— Are directly linked to the
needs of our clientsM t f Invest
...add value for clients?
gto trends/ outlook?
performance criteria?
...contribute to balance?
— Meet our performance criteria
— Are well-aligned to environmental outlook
Invest
Maintain/ re-tool
— Ensure a balanced and
stable portfolio over-the-cycle
— DB will be disciplined in
Turnaround DB will be disciplined in
exiting businesses which no longer meet these criteria Exit
financial transparency. Jürgen Fitschen, Anshu Jain Investor Day, Frankfurt, 11 September 2012
Deutsche BankInvestor Relations
17

Dynamic asset allocation at work – selected examples
CB&S
— FXEmerging markets
GTB
— Trade FinanceCMC/CMFI
AWM
— AM European retailPassive Alternatives
PBC
— Postbank customer bank
Invest— Emerging markets— Platforms
— Flow Rates/Credit Cli t Fi i
— CMC/CMFI— TSS— Asia
— Selected European locations
— Passive, Alternatives— UHNWI— Emerging Markets
— PWM GermanyPWM EMEA ex
bank— Advisory banking
Germany
— PBC Europe
Maintain/ re-tool
— Client Financing— NA Equities— Origination/Advisory— Commodities
— European equities
locations
— Mid-cap/SME
— PWM EMEA ex. Germany
— RREEF— PBC India
Turnaround
European equities— APAC equities— Rationalize corp.
and institutional coverage footprint
Mid cap/SME business in the Netherlands
RREEF— AM Insurance/
Institutional— AM US/Asian retail
PBC India
Exit
— Capital intensive “legacy” assets
— Consistently unprofitable clients
— PWM: Review client relationships with low investable assets outside of PBC countries
— Postbank non-customer bank
— Organic branches in China
financial transparency. Jürgen Fitschen, Anshu Jain Investor Day, Frankfurt, 11 September 2012
Deutsche BankInvestor Relations
18

Private & Business ClientsBuilding a powerhouse while improving efficiencyBuilding a powerhouse while improving efficiency
Where we are today Where we aspire to be in 2015
How we will get there:The journey
Focus on delivering PostbankPBC operating b siness(1)Challenging environment
(low interest rates, low client investment activity)
ocus o de e g ostba— Product standardization— Straight through processing— Front-end platform integration
PBC operating business(1)
2 0
~3.0
Undisputed leadership in German retail banking
IBIT(EUR bn) Increased efficiency in advisory
banking— Improve cost efficiency in
d ti b ki
2.0
20152011
Profitable and resilient international franchise despite crisis
domestic banking— Implement target operating
model in international banking
De-risk / enhance efficiency~60%
68%
20152011
Smooth execution of integration without impacting ongoing business
CIR — Continued disposal of Postbank non customer businesses
— Alignment of resources to operating businesses2011 2015
financial transparency. Jürgen Fitschen, Anshu Jain Investor Day, Frankfurt, 11 September 2012
Deutsche BankInvestor Relations
19
operating businesses
(1) All numbers exclude Non-Core Operations, 2011 numbers will therefore not reconcile to reported numbers

Corporate Banking & SecuritiesRetaining our leading position while recalibratingRetaining our leading position while recalibrating
— More top-3 positions than th IB(1)
Where we are today Where we aspire to be in 2015
How we will get there:The journey
FocusRe evaluate CB&S portfolio to
CB&S operating business(2)
Low revenue
any other IB(1)
— A truly global franchiseCost
income ratio
— Re-evaluate CB&S portfolio to identify strategic priorities
— Transfer of non-core assets— Align client profitability and B/S
deployment better2011 2015
71%<65%
growth
Competitive environment
RWA equi-
valent(3)
y
Scale— Leverage strong FICC platform— Industrialize processes— Redesign trading architecture
Pro-forma
244(4)
184(5)
<200(4)
Regulatory environment
valent(3)
(in EUR bn) Efficiency— Reduce capital consumption
across the business— Align coverage to market
t iti
2011Pro-forma
2015
~15%(8)16%(6)
Societal pressure
Post-tax RoE
opportunities
Cultural change— “Red flags” for behavior— Realigned compensation practices
(1) Top 3 rankings counted for each product and major region (Americas Europe Asia ex Japan Japan) Products include a wide range of fixed income equities and corporate finance products Rankings generally on the
11%(7)
2011Pro-forma
2015
financial transparency. Jürgen Fitschen, Anshu Jain Investor Day, Frankfurt, 11 September 2012
Deutsche BankInvestor Relations
20
(1) Top 3 rankings counted for each product and major region (Americas, Europe, Asia ex Japan, Japan). Products include a wide range of fixed income, equities and corporate finance products. Rankings generally on the basis of client market share, penetration or fees. Total of 77 markets analyzed (2) All numbers exclude Non-Core Operations and financial impact of passive asset management transferred to AWM, 2011 numbers will therefore not reconcile to reported numbers (3) RWAs including equivalent capital formation items (fully loaded) (4) Based on pro-forma Basel 3 (5) Based on Basel 2.5 (6) Based on Basel 2 and domestic statutory tax rate of 30.8% in 2011 (7) Assumes overall bank capitalization consistent with an 8% CET1 ratio under Basel 3 fully loaded and Basel 3 RWA impact commensurate with yearend 2012 targets. Based on 2011 domestic statutory tax rate of 30.8% (8) Based on corporate tax rate guidance of 30-35%
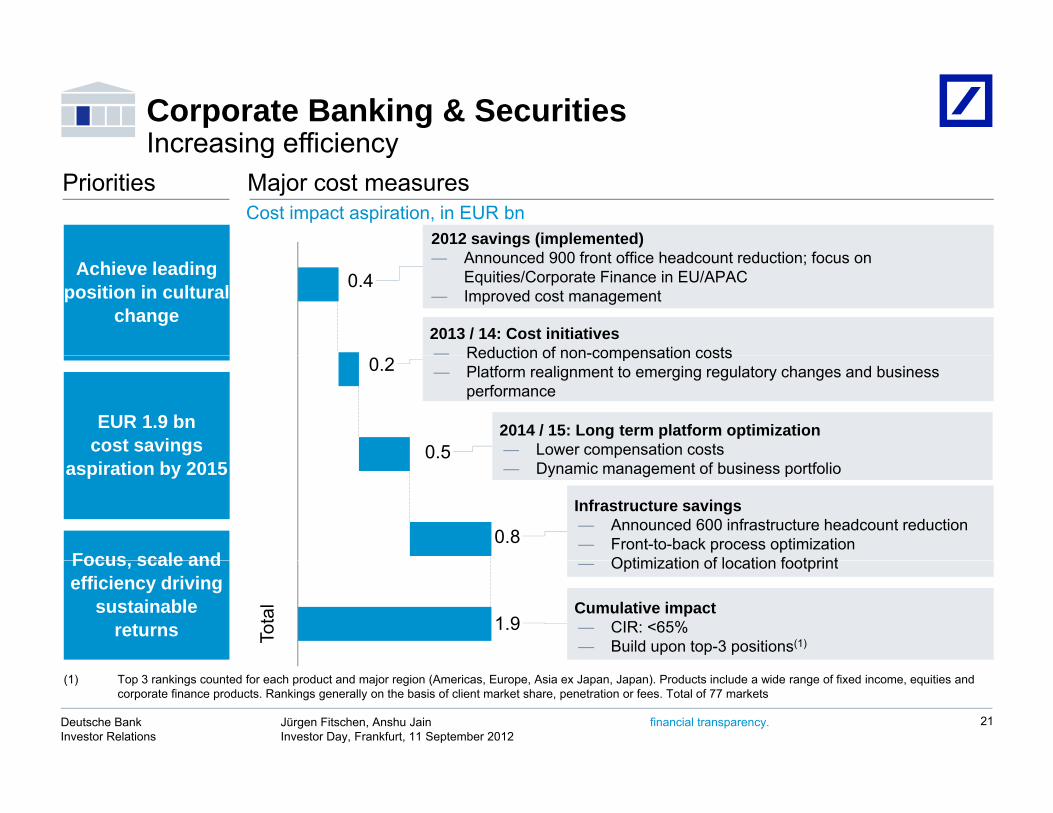
Corporate Banking & SecuritiesIncreasing efficiencyIncreasing efficiency
2012 savings (implemented)A d 900 f t ffi h d t d ti f
Priorities Major cost measuresCost impact aspiration, in EUR bn
0.4Achieve leading position in cultural
change
— Announced 900 front office headcount reduction; focus on Equities/Corporate Finance in EU/APAC
— Improved cost management
2013 / 14: Cost initiatives— Reduction of non-compensation costs
0.2
0.5EUR 1.9 bn
cost savings
Reduction of non compensation costs— Platform realignment to emerging regulatory changes and business
performance
2014 / 15: Long term platform optimization— Lower compensation costs
0.8
0.5
Focus scale and
aspiration by 2015 — Dynamic management of business portfolio
Infrastructure savings— Announced 600 infrastructure headcount reduction— Front-to-back process optimization
Optimization of location footprint
Tota
l
1.9
Focus, scale and efficiency driving
sustainable returns
— Optimization of location footprint
Cumulative impact— CIR: <65%— Build upon top-3 positions(1)
financial transparency. Jürgen Fitschen, Anshu Jain Investor Day, Frankfurt, 11 September 2012
Deutsche BankInvestor Relations
21
(1) Top 3 rankings counted for each product and major region (Americas, Europe, Asia ex Japan, Japan). Products include a wide range of fixed income, equities and corporate finance products. Rankings generally on the basis of client market share, penetration or fees. Total of 77 markets

Asset & Wealth ManagementWe aspire to double profitability through integration and efficiency
Where we are today
We aspire to double profitability through integration and efficiencyWhere we aspire
to be in 2015 How we will get there: The journey
Realize potential ofThree solid pillars
Private Wealth ManagementAWM operating
business(1)Realize potential of underperforming businesses
Drive efficiency gains from untapped synergies between AWM
— Private Wealth Management— Retail & institutional Asset Management— Passive/3rd party Alternatives transferred from
CB&S
2011
IBIT, in EUR bn
0.8 2012 cost base headwinds— Increase in cost base vs. 2011 primarily driven
business(1)
Unlock revenue synergies by closer
and passive businesses transferred from CB&S, e.g., consolidate
manufacturing centers by ~50%; reduce IT & Ops costs by 18%
Key revenue levers— Focus on growth in UHNWI and EM clients— Passive/alternative segments in focus— Leverage scale in active asset management~0 3
~(0.1)
Increase in cost base vs. 2011 primarily driven by one-offs and FX effects
Unlock revenue synergies by closer alignment to other DB businesses
e.g., access unique investment opportunities in beta products and
capital markets
g gKey cost levers— Eliminate duplication by integrating three
previously separate businesses— Reorganize products and services around
distribution channels~0.7
0.3
Exploit megatrends: Clear investments in key customer
segments, geographies and asset classes
Cumulative impact— ~EUR 1.0 trillion AuM/IA aspiration— Increase gross revenue margin by ~5%20
15
Aspiration to double IBIT to EUR ~1.7 bn by 2015
~1.7
financial transparency. Jürgen Fitschen, Anshu Jain Investor Day, Frankfurt, 11 September 2012
Deutsche BankInvestor Relations
22
(1) All numbers exclude Non-Core Operations and include financial impact of passive asset management business transferred from CB&S, 2011 numbers will therefore not reconcile to reported numbers
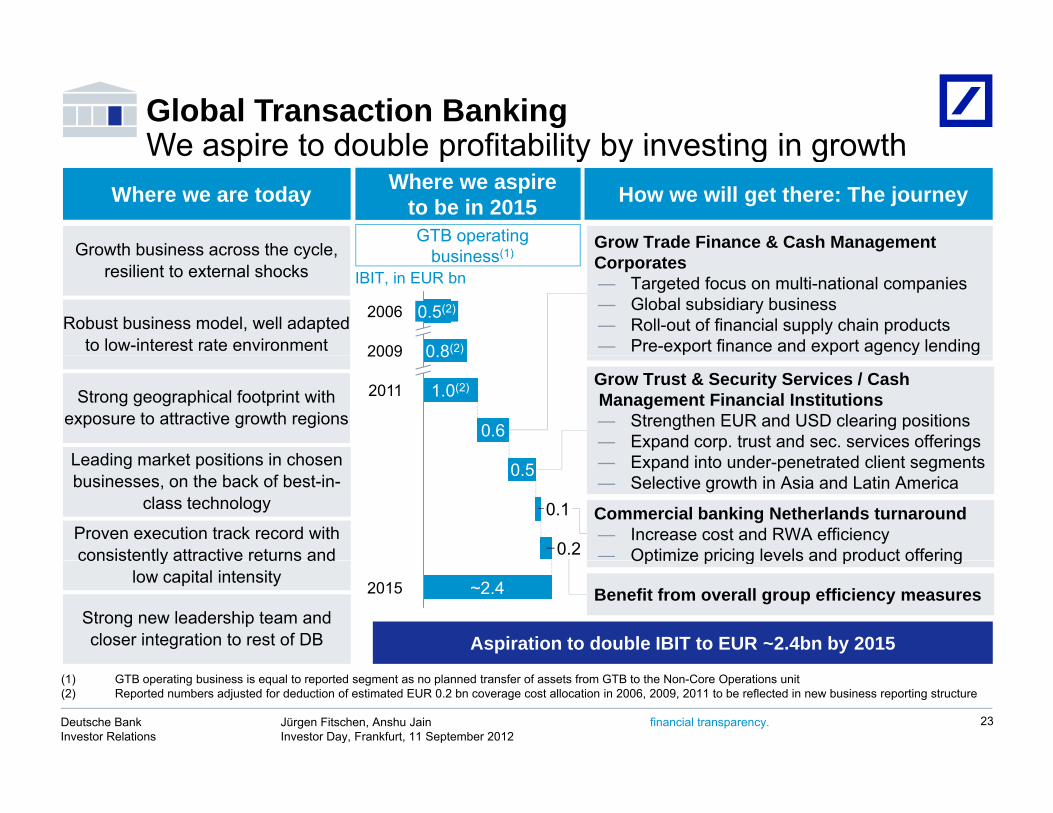
Global Transaction BankingWe aspire to double profitability by investing in growthWe aspire to double profitability by investing in growth
Growth business across the cycle Grow Trade Finance & Cash Management
Where we are today Where we aspire to be in 2015 How we will get there: The journey
GTB operating b siness(1)
2009 0.8(2)
2006 0.5(2)
Growth business across the cycle, resilient to external shocks
Robust business model, well adapted to low-interest rate environment
Corporates— Targeted focus on multi-national companies— Global subsidiary business— Roll-out of financial supply chain products— Pre-export finance and export agency lending
business(1)
IBIT, in EUR bn
0.6
1.0(2)
2009 0.8
2011Strong geographical footprint with exposure to attractive growth regions
Leading market positions in chosen
Grow Trust & Security Services / CashManagement Financial Institutions— Strengthen EUR and USD clearing positions — Expand corp. trust and sec. services offerings
E d i t d t t d li t t
0.2
0.1
0.5
Commercial banking Netherlands turnaround— Increase cost and RWA efficiency— Optimize pricing levels and product offering
Leading market positions in chosen businesses, on the back of best-in-
class technology
Proven execution track record with consistently attractive returns and
— Expand into under-penetrated client segments— Selective growth in Asia and Latin America
2015 ~2.4
Aspiration to double IBIT to EUR ~2.4bn by 2015
Optimize pricing levels and product offering
Strong new leadership team and closer integration to rest of DB
consistently attractive returns and low capital intensity
Benefit from overall group efficiency measures
financial transparency. Jürgen Fitschen, Anshu Jain Investor Day, Frankfurt, 11 September 2012
Deutsche BankInvestor Relations
23
(1) GTB operating business is equal to reported segment as no planned transfer of assets from GTB to the Non-Core Operations unit (2) Reported numbers adjusted for deduction of estimated EUR 0.2 bn coverage cost allocation in 2006, 2009, 2011 to be reflected in new business reporting structure
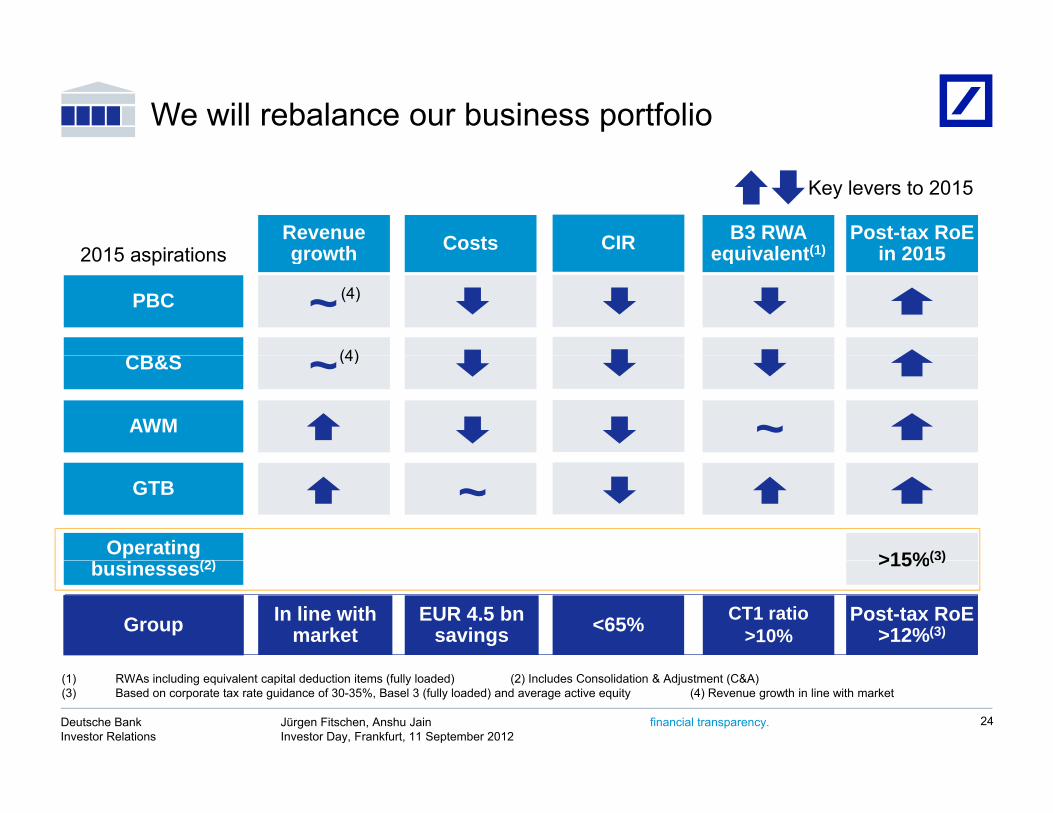
We will rebalance our business portfolio
Key levers to 2015
Post-tax RoE in 2015
Revenue growth Costs B3 RWA
equivalent(1)CIR2015 aspirations in 2015
CB&S
growth equivalent(1)
PBC ~2015 aspirations
(4)
(4)CB&S
AWM ~~(4)
>15%(3)
~GTB
Operating (2)
Group Post-tax RoE>12%(3)
>15%( )
In line with market
EUR 4.5 bnsavings <65%
businesses(2)
CT1 ratio >10%
financial transparency. Jürgen Fitschen, Anshu Jain Investor Day, Frankfurt, 11 September 2012
Deutsche BankInvestor Relations
24
(1) RWAs including equivalent capital deduction items (fully loaded) (2) Includes Consolidation & Adjustment (C&A) (3) Based on corporate tax rate guidance of 30-35%, Basel 3 (fully loaded) and average active equity (4) Revenue growth in line with market

While recalibrating, we still see significant areas of growth and will invest in themand will invest in them
TransactionTrade facilitation
How we are helping our clients and driving growthComplex client needs
Helping m lti national clients ith s pplTransaction banking in Asia
— Trade facilitation— Access to worldwide
markets
— Helping multi-national clients with supply chain and trade finance products in India, driving a >40% yoy revenue increase
H l i BMW h i GBP 3 b UKFinancial innovation in Europe
— Risk solutions— Trusted advice
— Helping BMW manage their GBP 3 bn UK pension scheme for 60,000 pensioners
— Strong pipeline of future demand, DB seen as a market leader
Retail banking in Germany
— Wealth preservation and growth
— Better products resulting in >100% increase in retail deposits since 2006
— Over 640,000 new mortgages since 2006
Corporate finance in the US
— Access to liquidity and worldwide
k t
g g
— Helping financial institutions access international equity markets e.g., capital raising for AIG, Fifth Third to replace
financial transparency. Jürgen Fitschen, Anshu Jain Investor Day, Frankfurt, 11 September 2012
Deutsche BankInvestor Relations
25
USmarkets raising for AIG, Fifth Third to replace government funding

Agenda
1 Operating environment
Vision
p g
2
Capital and operational excellence4
Strategy 2015+: Recalibrating the Bank3
Cultural change5
Summary6 Summary6
financial transparency. Jürgen Fitschen, Anshu Jain Investor Day, Frankfurt, 11 September 2012
Deutsche BankInvestor Relations
26

We will realize our capital goals organicallyB3 RWA equivalent(2)
June 2012
Reduction2Q 12 –1Q 13
Core Tier 1 goalsBasel 3 Core Tier 1 ratio, fully loaded
Capital tool boxB3 RWA equivalent( )
relief, in EUR bn
Non Core Operations ~45~135
Included in capital plan
>10%
≥8%
10.2%(1) Available capital
demandreduction
Non-Core Operations
Portfolio optimization
Roll out of advanced models ~45
~45~135
~31
~17
7.2% measures Improvement of operating model ~15
CT1 capital formation, in EUR bn
Identified potential capital build(not in capital plan)
Available capital supply
measures
Bonus reduction
Equity comp / deferrals(3)
DTA reduction
Up to 1.2(4)
31 Mar2015
31 Mar 2013
1 Jan 2013
June 2012
Further capital supply
measures
Dividend reduction
Authorized capital
financial transparency. Jürgen Fitschen, Anshu Jain Investor Day, Frankfurt, 11 September 2012
Deutsche BankInvestor Relations
27
2015201320132012(1) Based on Basel 2.5 (2) RWAs including equivalent capital deduction items (fully loaded)(3) Not yet including shares without pre-emptive rights which could be issued to further develop equity compensation programs (4) Executable by March 2013
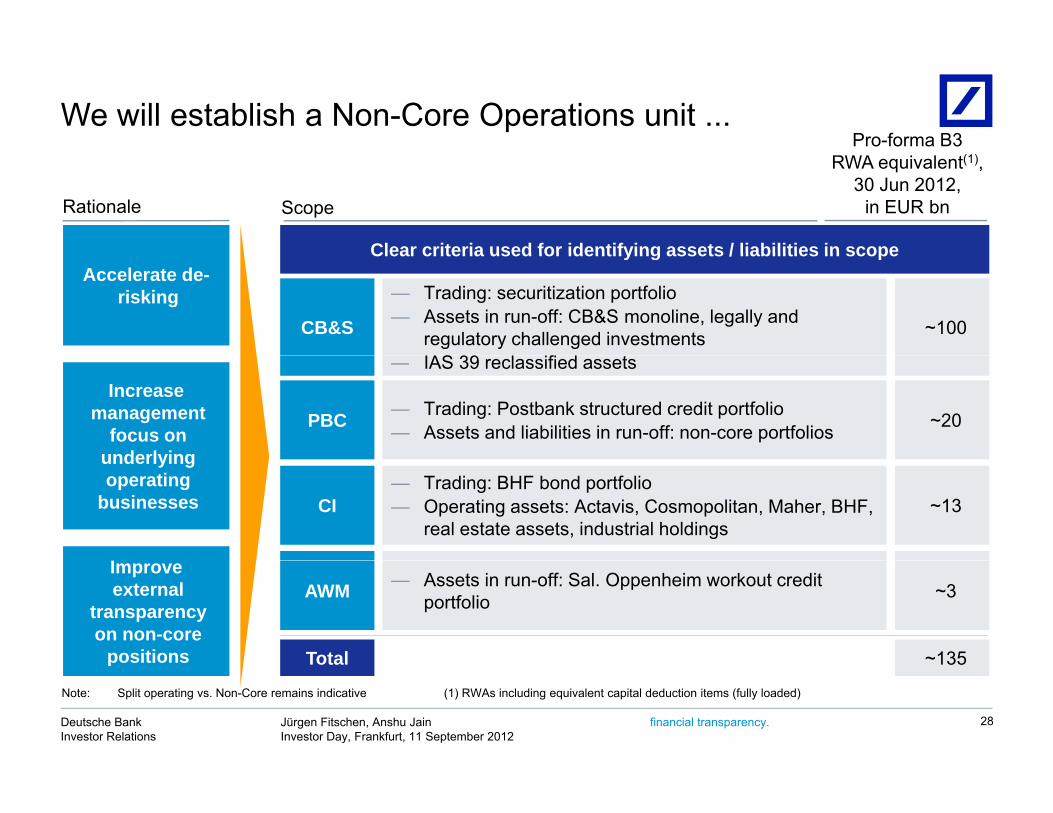
We will establish a Non-Core Operations unit ...Pro-forma B3
Rationale Scope
RWA equivalent(1), 30 Jun 2012,
in EUR bn
Clear criteria used for identifying assets / liabilities in scopeAccelerate de-
riskingCB&S
— Trading: securitization portfolio— Assets in run-off: CB&S monoline, legally and
regulatory challenged investmentsIAS 39 l ifi d
~100
Clear criteria used for identifying assets / liabilities in scope
Increase management
focus on underlying
— IAS 39 reclassified assets
PBC — Trading: Postbank structured credit portfolio— Assets and liabilities in run-off: non-core portfolios ~20
underlying operating
businesses
I
CI— Trading: BHF bond portfolio— Operating assets: Actavis, Cosmopolitan, Maher, BHF,
real estate assets, industrial holdings~13
Improve external
transparency on non-core
positions
AWM — Assets in run-off: Sal. Oppenheim workout credit portfolio ~3
Total ~135
financial transparency. Jürgen Fitschen, Anshu Jain Investor Day, Frankfurt, 11 September 2012
Deutsche BankInvestor Relations
28
p Total 135
Note: Split operating vs. Non-Core remains indicative (1) RWAs including equivalent capital deduction items (fully loaded)

... with dedicated governance
Governance model Non-Core Operations de-risking aspirationRWA equivalent(1), in EUR bn
— De-risking and capital formation interests aligned between operating and Non-Core businesses
RWA equivalent , in EUR bn
~135
~(45)
— Centralized coordination of Non-Core Operations with Management Board-level accountability
S t ti f O ti
110105
<80~90
— Separate reporting of Operating Businesses and Non-Core Operations from 4Q2012
Dedicated risk management across— Dedicated risk management across non-core portfolio
Basel 2.5 Basel 3
31 Dec2013
31 Mar 2013
31 Dec 2011
30 Jun 2012
30 Jun 2012
31 Dec2015
31 Dec2014
financial transparency. Jürgen Fitschen, Anshu Jain Investor Day, Frankfurt, 11 September 2012
Deutsche BankInvestor Relations
29
Basel 2.5 Basel 3
(1) RWAs including equivalent capital deduction items (fully loaded)

We will further strengthen our risk disciplineSt i k di i li th h t l til C it t t ti d i t t i
S l & T di P&L 3 th l tilit (lh )In EUR m In %— Clear expectations of staff and
managers
Strong risk discipline throughout volatile crisis periodP&L vs. market volatility
Commitment to continued investment in risk management
40
80
70
140 Sales & Trading P&L 3 mnth volatility (lhs) eStoxx 3M realised volatility (rhs)
In EUR m In % managers— Objective measurement and
monitoring of behavior— Strong deterrents
Risk cultureRisk reduction effect
0-2008 2009 2010 2011 2012
Risk principles /
process
— Continued investment in risk control, transparency and early warning systems
— Maintain proven underwriting VaR efficiency(1), multiple process standards and independence of DB Risk function
— Risk / reward balance embedded into decision
VaR efficiency , multiple
0 40.6 0.8 1.0 1.2
DB Peer average Peer best in class (2)
(1) Average daily Sales & Trading P&L divided by VaR All VaR converted to EUR 1 day 99% confidence interval
Risk / reward making at all levels
(0.2)0.0 0.2 0.4
2008 2009 2010 2011 2012
financial transparency. Jürgen Fitschen, Anshu Jain Investor Day, Frankfurt, 11 September 2012
Deutsche BankInvestor Relations
(1) Average daily Sales & Trading P&L divided by VaR. All VaR converted to EUR, 1 day, 99% confidence interval (2) Peer group includes: Barclays, Bank of America, Citigroup, Credit Suisse, Goldman Sachs, JPMorgan, Morgan Stanley, UBSSource: ederivatives, company data and analysis
30
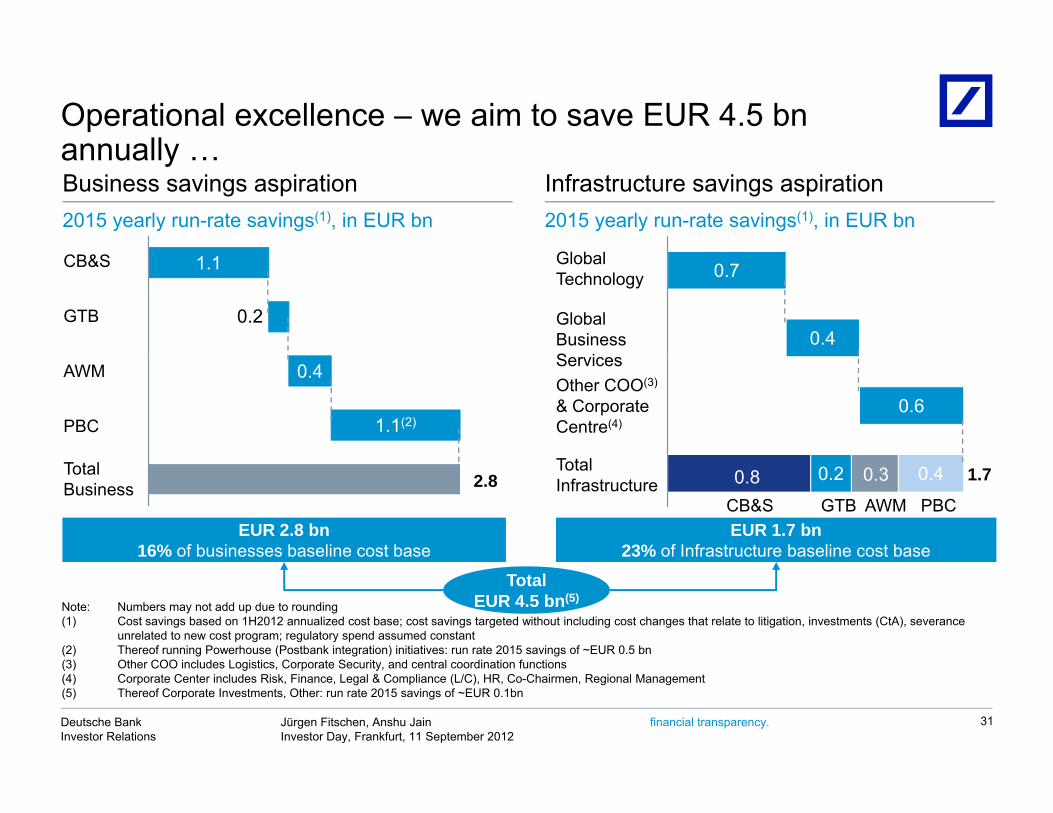
Operational excellence – we aim to save EUR 4.5 bnannuallyannually …
Gl b l
Business savings aspiration2015 yearly run-rate savings(1), in EUR bn
Infrastructure savings aspiration2015 yearly run-rate savings(1), in EUR bn
1.1
0.2
CB&S
GTB Global BusinessS i
Global Technology 0.7
0.4
0.4
1.1(2)
AWM
PBC
Other COO(3)
& Corporate Centre(4)
Services
0.6
EUR 2.8 bn16% of businesses baseline cost base
EUR 1.7 bn23% of Infrastructure baseline cost base
Total Business
Total Infrastructure 0.2 0.3 0.40.8
CB&S PBCGTB AWM
1.72.8
TotalEUR 4.5 bn(5)
Note: Numbers may not add up due to rounding (1) Cost savings based on 1H2012 annualized cost base; cost savings targeted without including cost changes that relate to litigation, investments (CtA), severance
unrelated to new cost program; regulatory spend assumed constant(2) Thereof running Powerhouse (Postbank integration) initiatives: run rate 2015 savings of ~EUR 0.5 bn(3) Other COO includes Logistics Corporate Security and central coordination functions
financial transparency. Jürgen Fitschen, Anshu Jain Investor Day, Frankfurt, 11 September 2012
Deutsche BankInvestor Relations
31
(3) Other COO includes Logistics, Corporate Security, and central coordination functions(4) Corporate Center includes Risk, Finance, Legal & Compliance (L/C), HR, Co-Chairmen, Regional Management(5) Thereof Corporate Investments, Other: run rate 2015 savings of ~EUR 0.1bn

… through a one-off investment of EUR ~4 bnOur aspiration 2015 Structural levers Examples
Postbank CtAalready announced
Our aspiration 2015In EUR bn
Structural leversSavings(3)
— Invest in world class technology platform
IT platform renewal 0.8
— Magellan platform— Golden source for data
reference
Examples
Infra-structure 1.7
4.5
~4.0
0.8
— More effective management in flatter organization
Organizational streamlining 1.9
— Reduce from 10 to 8 layers — Increase average span of
control from 1:5.5 to 1:8
reference
Frontffi 2.8
3.2
— Invest into single sourcing infrastructure
— Invest in process
Sourcing excellence 0.6
— Reduce vendor base by 25%— 80%+ of spend with 500
vendors
— Increase level of automation
Yearly Incr.
office 8 Invest in process simplification and automation
Front-to-back productivity 0.9
— Optimize location t t
Footprint rationalization 0.3
— 40 targeted sites for disposal— Max 40% share of infra staff
Increase level of automation to reduce cost per trade by ~20%
DB aspires to reduce its cost income ratio to <65% by 2015
run-ratesavings(1)
one-off investment
(CTA)(2) 4.5
strategyrationalization Max 40% share of infra staff in higher cost locations
financial transparency. Jürgen Fitschen, Anshu Jain Investor Day, Frankfurt, 11 September 2012
Deutsche BankInvestor Relations
32
(1) Thereof: Corporate Investments, Other: run rate 2015 savings of ~EUR 0.1bn; outstanding Powerhouse (Postbank integration) savings of ~EUR 0.5bn mainly in IT (2) Thereof running Powerhouse initiatives: investments (CtA) of ~EUR 0.8bn (3) Aspiration. Cost savings based on 1H2012 annualized cost base; cost savings targeted without including cost changes that relate to litigation, investments (CtA), severance unrelated to new cost program; regulatory spend assumed constant
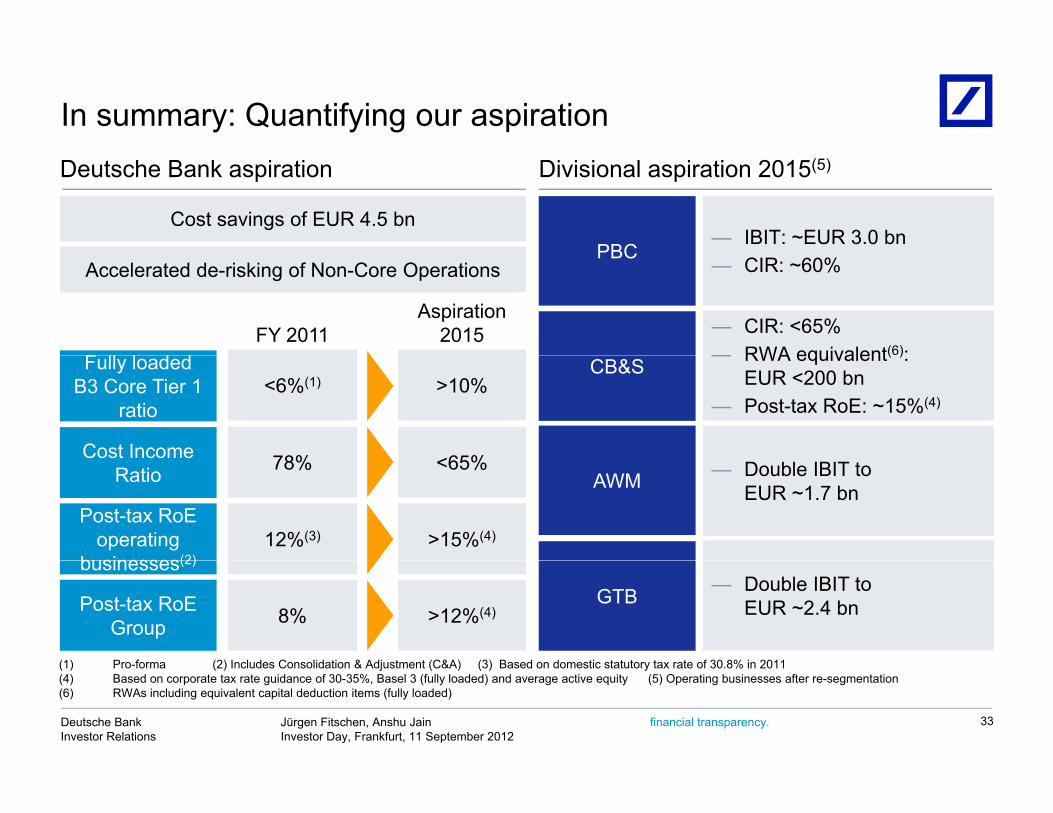
In summary: Quantifying our aspirationDeutsche Bank aspiration Divisional aspiration 2015(5)
Cost savings of EUR 4.5 bnPBC
— IBIT: ~EUR 3.0 bn
F ll l d d
Accelerated de-risking of Non-Core OperationsPBC
— CIR: ~60%
— CIR: <65%— RWA equivalent(6):
FY 2011Aspiration
2015
>10%Fully loaded
B3 Core Tier 1 ratio
<6%(1)
Cost Income <65%78%
CB&S — RWA equivalent( ): EUR <200 bn
— Post-tax RoE: ~15%(4)
Cost co eRatio <65%78%
Post-tax RoEoperating
businesses(2)>15%(4)12%(3)
AWM — Double IBIT toEUR ~1.7 bn
Post-tax RoE Group >12%(4)8%
businesses(2)
(1) Pro forma (2) Includes Consolidation & Adjustment (C&A) (3) Based on domestic statutory tax rate of 30 8% in 2011
GTB — Double IBIT to EUR ~2.4 bn
financial transparency. Jürgen Fitschen, Anshu Jain Investor Day, Frankfurt, 11 September 2012
Deutsche BankInvestor Relations
33
(1) Pro-forma (2) Includes Consolidation & Adjustment (C&A) (3) Based on domestic statutory tax rate of 30.8% in 2011(4) Based on corporate tax rate guidance of 30-35%, Basel 3 (fully loaded) and average active equity (5) Operating businesses after re-segmentation(6) RWAs including equivalent capital deduction items (fully loaded)

Positioned to capture longer-term opportunities
Now – 2015
2015+
Ready and able to capitalize on future optionality
Clear actions to position ourselves to win
y p p y
Long-term trends Future opportunity?
Changed — A leading Strengthen our unique global platform
and home market position
Further leverage integrated
1
2
Changed competitive landscape
gEuropean consolidator
performance of our universal banking model
Achieve operational excellence3
Demographic shifts
— A scaled global asset gatherer
Build capital strength organically
Place Deutsche Bank at the forefront f lt l h i b ki
4
5
Emerging market
dynamics
— A dominant local markets player in Emerging Markets
financial transparency. Jürgen Fitschen, Anshu Jain Investor Day, Frankfurt, 11 September 2012
Deutsche BankInvestor Relations
34
of cultural change in banking Markets

Agenda
1 Operating environment
Vision
p g
2
Capital and operational excellence4
Strategy 2015+: Recalibrating the Bank3
Cultural change5
Summary6 Summary6
financial transparency. Jürgen Fitschen, Anshu Jain Investor Day, Frankfurt, 11 September 2012
Deutsche BankInvestor Relations
35

We acknowledge the need for cultural change
Meritocracy
We are proud of the culture we have built Attributes we will emphasize
Performance culture Long-term orientation and sustainability
— Meritocracy— Execution and results
oriented— Crisis mobilization
Risk culture
Entre-
— Risk culture
— Speed and agility— Empowerment of business
l dpreneurialspirit
Client focusleaders— Innovation
Cultural diversity Teamwork and partnership
— Global culture— Strongly anchored in home
market— Respect for others
financial transparency. Jürgen Fitschen, Anshu Jain Investor Day, Frankfurt, 11 September 2012
Deutsche BankInvestor Relations
36
— Ability to adapt and change
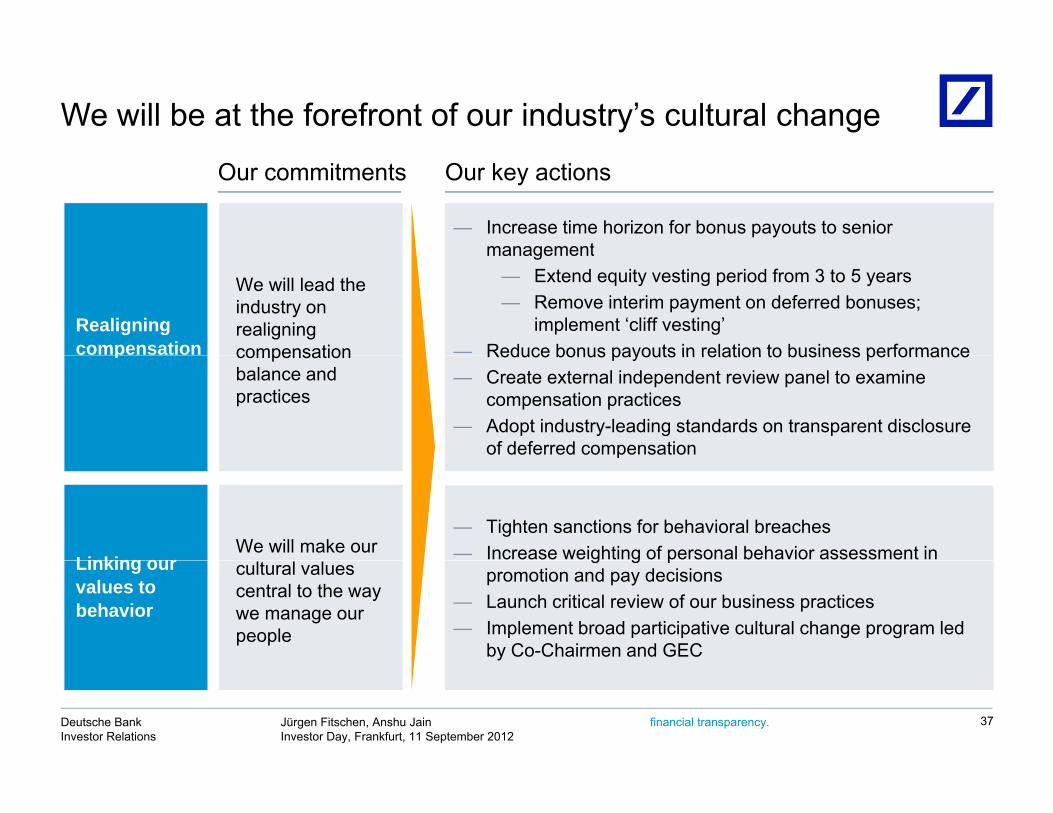
We will be at the forefront of our industry’s cultural change
— Increase time horizon for bonus payouts to senior management
Our key actionsOur commitments
Realigning compensation
We will lead the industry on realigning compensation
management— Extend equity vesting period from 3 to 5 years— Remove interim payment on deferred bonuses;
implement ‘cliff vesting’— Reduce bonus payouts in relation to business performancep compensation
balance and practices
Reduce bonus payouts in relation to business performance— Create external independent review panel to examine
compensation practices— Adopt industry-leading standards on transparent disclosure
of deferred compensation
Linking ourWe will make our
p
— Tighten sanctions for behavioral breaches— Increase weighting of personal behavior assessment in Linking our
values to behavior
cultural values central to the way we manage our people
g g ppromotion and pay decisions
— Launch critical review of our business practices— Implement broad participative cultural change program led
by Co-Chairmen and GEC
financial transparency. Jürgen Fitschen, Anshu Jain Investor Day, Frankfurt, 11 September 2012
Deutsche BankInvestor Relations
37

We have already addressed many compensation issues
Variable comp(1) as % of net revenues has declined Compensation practices have improved
22%
Early adoption of regulatory requirements
Stricter governance22%
20%19%
17%Early adoption of regulatory requirements
Better alignment to long-term performance
15%
11%
Strong behavioral focus
Increased transparency
201120102009200820072006
financial transparency. Jürgen Fitschen, Anshu Jain Investor Day, Frankfurt, 11 September 2012
Deutsche BankInvestor Relations
38
(1) Variable remuneration awarded including deferrals. No adjustments made for pay mix change in 2010 (EUR 742 m). Ratios excluding Postbank: 2010 14%, 2011 12%

Leading the industry – an independent panel on compensation governance
Panel composition and objectives
compensation governance
Panel composition … ... and objectives
— Benchmark our compensation systems against industry best practice and
— Independent external panel of senior and highly credible professionals from outside g y p
regulatory requirements and intent — Formulate core principles and minimum
standards for future compensation structures and practices
g y pthe financial services industry
— Industry leaders from Germany, UK, US and Asia PacificL di d i i th fi ld structures and practices
— Help define the appropriate level of transparency and disclosure
— Leading academic in the field— External compensation consultant
The panel's findings will influence 2012 year-end compensation
financial transparency. Jürgen Fitschen, Anshu Jain Investor Day, Frankfurt, 11 September 2012
Deutsche BankInvestor Relations
39

Agendag
1 Operating environment
Vision
p g
2
Capital and operational excellence4
Strategy 2015+: Recalibrating the Bank3
Cultural change5
Summary6 Summary6
financial transparency. Jürgen Fitschen, Anshu Jain Investor Day, Frankfurt, 11 September 2012
Deutsche BankInvestor Relations
40
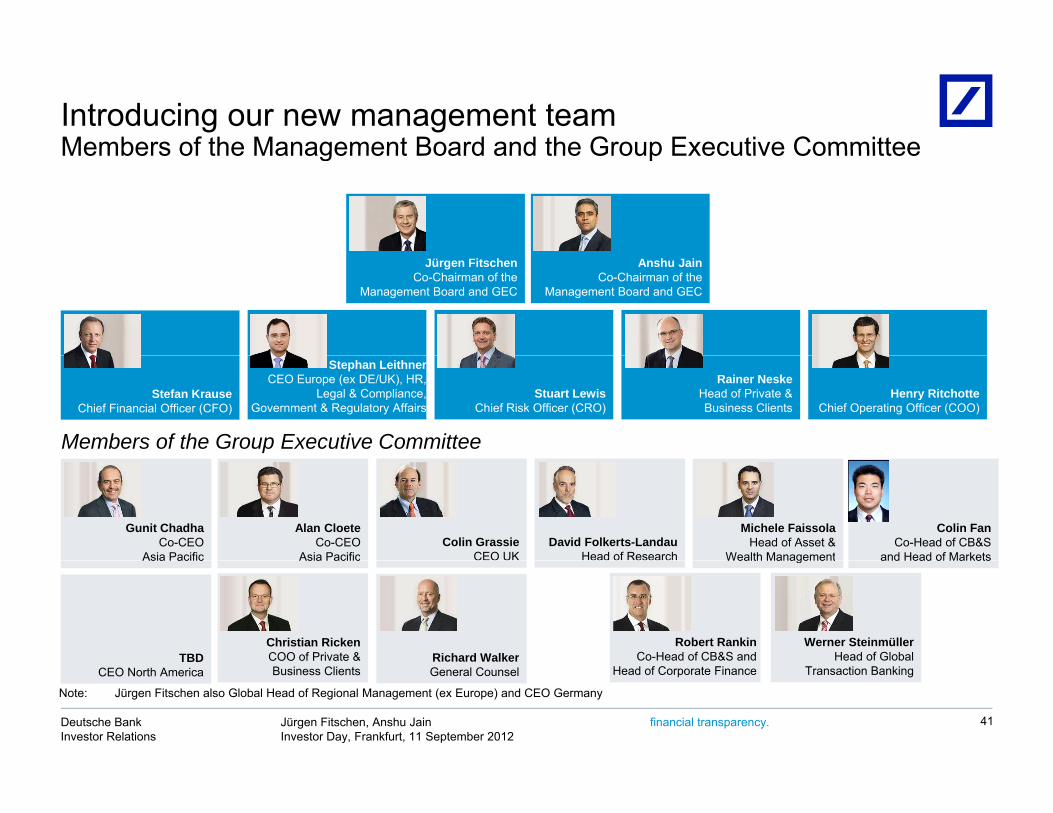
Introducing our new management teamMembers of the Management Board and the Group Executive CommitteeMembers of the Management Board and the Group Executive Committee
Jürgen FitschenCo-Chairman of the
Management Board and GEC
Anshu JainCo-Chairman of the
Management Board and GEC
Stefan KrauseChief Financial Officer (CFO)
Stephan LeithnerCEO Europe (ex DE/UK), HR,
Legal & Compliance, Government & Regulatory Affairs
Members of the Group Executive Committee
Stuart LewisChief Risk Officer (CRO)
Rainer NeskeHead of Private & Business Clients
Henry RitchotteChief Operating Officer (COO)
Colin FanCo-Head of CB&S
and Head of MarketsColin Grassie
CEO UK
Alan CloeteCo-CEO
Asia Pacific
Gunit ChadhaCo-CEO
Asia PacificDavid Folkerts-Landau
Head of Research
Michele FaissolaHead of Asset &
Wealth Management
Werner SteinmüllerHead of Global
and Head of Markets
TBDChristian RickenCOO of Private & Richard Walker
Asia PacificAsia Pacific Wealth Management
Robert RankinCo-Head of CB&S and
financial transparency. Jürgen Fitschen, Anshu Jain Investor Day, Frankfurt, 11 September 2012
Deutsche BankInvestor Relations
Transaction BankingCEO North America Business Clients General Counsel Head of Corporate Finance
41
Note: Jürgen Fitschen also Global Head of Regional Management (ex Europe) and CEO Germany

Presenters for Wednesday, 12 September Schedule Presenter
— Stefan Krause, CFO
— Stuart Lewis, CROMorning
— Henry Ritchotte, COO
— Stephan Leithner, CEO Europe (ex DE/UK), HR, Legal & Compliance, Gov. & Reg. Affairs
— Colin Fan / Robert Rankin, CB&S
Aft— Werner Steinmüller, GTB
— Michele Faissola, AWM
— Rainer Neske, PBC
Afternoon
financial transparency. Jürgen Fitschen, Anshu Jain Investor Day, Frankfurt, 11 September 2012
Deutsche BankInvestor Relations
42
,
Deutsche Bank
Appendixpp
financial transparency. Jürgen Fitschen, Anshu Jain Investor Day, Frankfurt, 11 September 2012
Deutsche BankInvestor Relations

Reconciliation of key financials shown in presentationsy p2011 SPLIT OPERATING vs. NON-CORE INDICATIVE
Re-segmentation
As reportedNon-Core
Operations Other(1) Operating
businesses
Cost/income ratio 78% (6)ppt (1)ppt 71%RWA (in EUR bn) 229 (52) (3) 173
Memo: RWA equivalent (in EUR bn)(2) 257 (70) (3) 184 Pre-tax RoE 13% +10ppt +1ppt 24%
Post-tax RoE(4) 9% +7ppt +1ppt 16%
GTB IBIT (in EUR bn) 1.1 - (0.2) 1.0
AWM
CB&S
AWM IBIT (in EUR bn) 0.8 (0.1) 0.2 0.8 IBIT (in EUR bn) 1.8 0.2 - 2.0 Cost/income ratio 69% (1)ppt - 68%Cost/income ratio 78% (6)ppt - 72%Pre-tax RoE 10% +8ppt - 18%
PBC
Group(3)
Note: Numbers may not add up due to rounding. All RoE numbers in the table are based on average active equity.(1) Reassignment of management responsibilities for asset-gathering business and changes to the allocation of coverage costs between CB&S and GTB (2) RWA plus equivalent of items currently deducted 50/50 from Tier 1/Tier 2 capital whereby the Tier 1 deduction amount is scaled at 10%(3) Operating business of Group also includes Consolidation & Adjustments(4) Based on domestic statutory tax rate of 30 8%
pp
Post-tax RoE(4) 7%(5) +6ppt - 13%Group
financial transparency. Jürgen Fitschen, Anshu Jain Investor Day, Frankfurt, 11 September 2012
Deutsche BankInvestor Relations
(4) Based on domestic statutory tax rate of 30.8%(5) The post-tax RoE of 7% is calculated as a memo item for the purposes of this slide using the domestic statutory tax rate. 2011 reported post-tax RoE is 8%, based on
average shareholders‘ equity
44
Cautionary statements
This presentation contains forward-looking statements. Forward-looking statements are statements that are not historicalfacts; they include statements about our beliefs and expectations and the assumptions underlying them. These; y p p y gstatements are based on plans, estimates and projections as they are currently available to the management of DeutscheBank. Forward-looking statements therefore speak only as of the date they are made, and we undertake no obligation toupdate publicly any of them in light of new information or future events.
By their very nature forward-looking statements involve risks and uncertainties A number of important factors couldBy their very nature, forward looking statements involve risks and uncertainties. A number of important factors couldtherefore cause actual results to differ materially from those contained in any forward-looking statement. Such factorsinclude the conditions in the financial markets in Germany, in Europe, in the United States and elsewhere from which wederive a substantial portion of our revenues and in which we hold a substantial portion of our assets, the development ofasset prices and market volatility, potential defaults of borrowers or trading counterparties, the implementation of ourstrategic initiatives, the reliability of our risk management policies, procedures and methods, and other risks referenced inour filings with the U.S. Securities and Exchange Commission. Such factors are described in detail in our SEC Form20-F of 20 March 2012 under the heading “Risk Factors.” Copies of this document are readily available upon request orcan be downloaded from www.db.com/ir.
This presentation also contains non-IFRS financial measures. For a reconciliation to directly comparable figures reportedunder IFRS, to the extent such reconciliation is not provided in this presentation, refer to the 2Q2012 Financial DataSupplement, which is accompanying this presentation and available at www.db.com/ir.
financial transparency. Jürgen Fitschen, Anshu Jain Investor Day, Frankfurt, 11 September 2012
Deutsche BankInvestor Relations
45
Related Documents