Deutsche Bank Global Auto Industry Conference Brad Hughes - CFO January 15, 2013

Welcome message from author
This document is posted to help you gain knowledge. Please leave a comment to let me know what you think about it! Share it to your friends and learn new things together.
Transcript
Deutsche BankGlobal Auto Industry Conference
Brad Hughes - CFO
January 15, 2013

2
Safe Harbor Statement
This presentation contains strategic goals and other forward-looking statements related to future financial results and business operations for Cooper Tire & Rubber Company. Actual results may differ materially from the goals and from current management forecasts and projections as a result of factors over which the Company may have limited or no control. Information on certain of these risk factors and additional information on forward-looking statements are included in the Company’s reports on file with the Securities and Exchange Commission and are set forth at the end of this presentation.
3
Available InformationOur internet address is http://www.coopertire.com. We webcast our earnings calls and certain events we participate in or host on the investor relations portion of our website, http://coopertire.com/investors.aspx. We also make available on our website free of charge a variety of information for investors. Our goal is to maintain the investor relations portion of the website as a portal through which investors can easily find or navigate to pertinent information about us, including:
• our annual report on Form 10-K, quarterly reports on Form 10-Q, current reports on Form 8-K, and any amendments to those reports, as soon as reasonably practicable after we electronically file that material with or furnish it to the Securities and Exchange Commission (“SEC”);• information on our business strategies, financial results and selected key performance indicators;• announcements of our participation at investor conferences and other events;• press releases on quarterly earnings, product and service announcements and legal developments;• corporate governance information; and• other news and announcements that we may post from time to time that investors might find useful or interesting.
The content of our website is not intended to be incorporated by reference into this presentation or in any report or document we file with or furnish to the SEC, and any references to our website are intended to be inactive textual references only.
4
AgendaRecent News421 Tariff ExpirationCompany BackgroundIndustry Raw MaterialsQ3 2012 Results & Other ItemsBalance Sheet and InvestmentsStrategic Plan ExecutionRisks

5
Recent HeadlinesAug 2012AR Securitization credit facility extended to June 2015
Sep 2012421 Tariff Expiration
Oct 2012Declared 163rd consecutive quarterly dividend
Nov 2012Cooper reports record third quarter net incomeTexarkana receives Superior Energy Performance certificate from US Department of Energy
Jan 2013Tupelo safety milestone of 2 million hours worked without a lost time injury
6
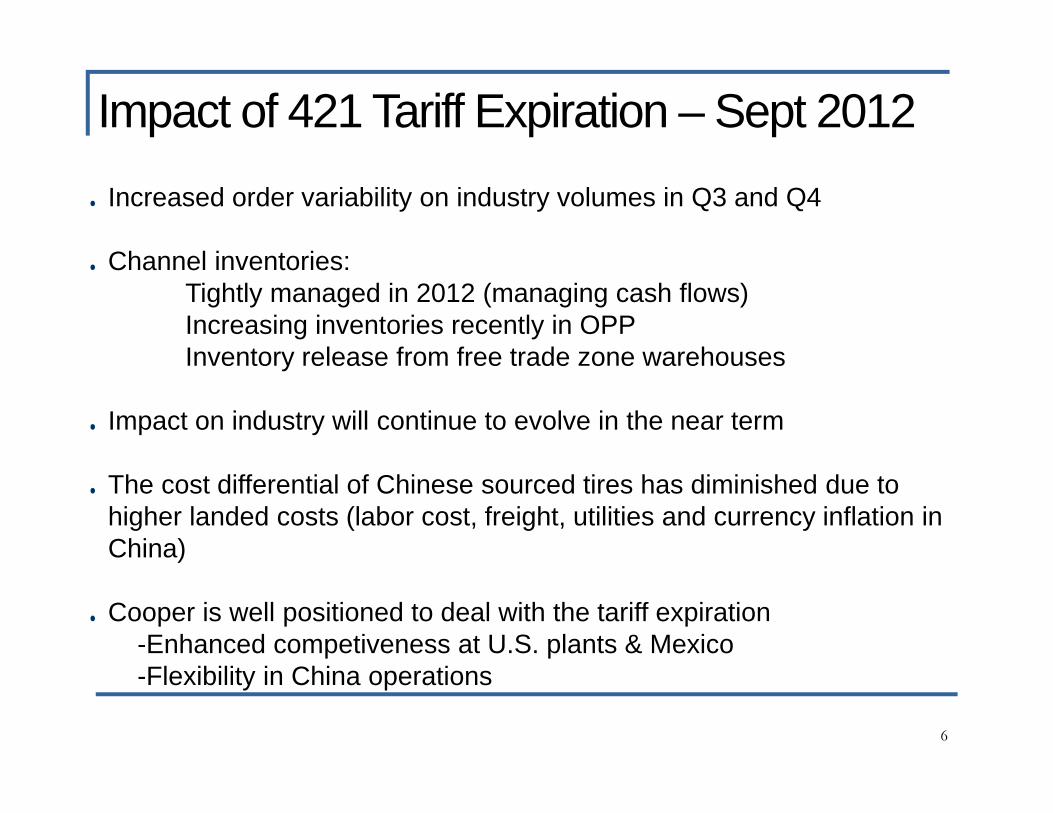
Increased order variability on industry volumes in Q3 and Q4
Channel inventories:Tightly managed in 2012 (managing cash flows)Increasing inventories recently in OPPInventory release from free trade zone warehouses
Impact on industry will continue to evolve in the near term
The cost differential of Chinese sourced tires has diminished due to higher landed costs (labor cost, freight, utilities and currency inflation in China)
Cooper is well positioned to deal with the tariff expiration-Enhanced competiveness at U.S. plants & Mexico-Flexibility in China operations
Impact of 421 Tariff Expiration – Sept 2012
7
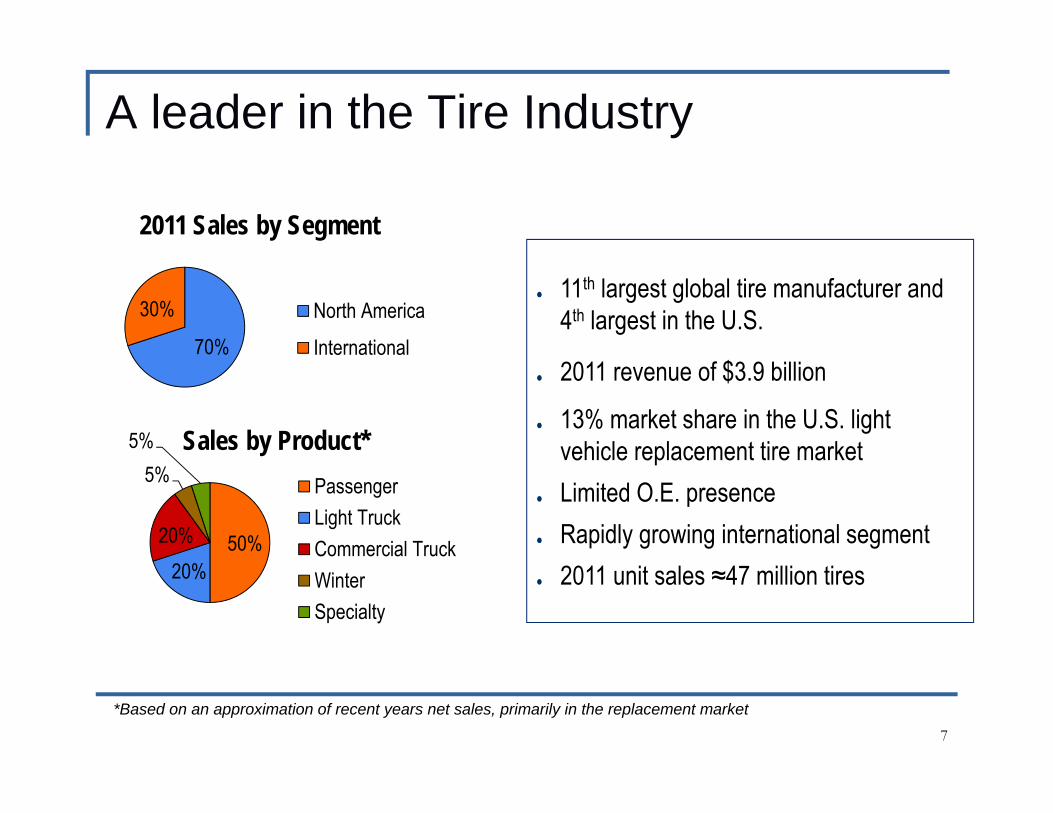
A leader in the Tire Industry
11th largest global tire manufacturer and 4th largest in the U.S.
2011 revenue of $3.9 billion
13% market share in the U.S. light vehicle replacement tire marketLimited O.E. presenceRapidly growing international segment2011 unit sales ≈47 million tires
70%
30%
2011 Sales by Segment
North AmericaInternational
50%20%
20%
5%5% Sales by Product*
PassengerLight TruckCommercial TruckWinterSpecialty
*Based on an approximation of recent years net sales, primarily in the replacement market

8
With a Global Network and Presence
Note: Operations in Rongcheng City, China, and Guadalajara, Mexico are not wholly owned.Assets from the operation in Kruševac, Serbia were acquired in early 2012.

9
Flexible and Cost Effective Manufacturing Network
Cooper's sourcing alternatives are used to maximizecost effectiveness using high quality, near source operations.
Findlay, OH (mfg, R&D, Corp HQ)Texarkana, AR (mfg)Tupelo, MS (mfg)Pearsall, TX (test track)Occidente, Guadalajara, Mexico (mfg)Stow, OH (Mickey Thomson HQ)Clarksdale, MS (rubber mixing)
Cooper Chengshan Tire (CCT), Rongcheng City, China (mfg)Cooper Kunshan Tire (CKT), Kunshan, China (mfg)Asia Technical Center (ATC) and HQ, Shanghai, China (R&D), Asia HQMelksham, England (mfg, R&D, European HQ)Cooper Tire Serbia (CTS)Kruševac, Serbia (mfg)
Note: Operations in Rongcheng City, China, and Guadalajara, Mexico are not wholly owned.
10
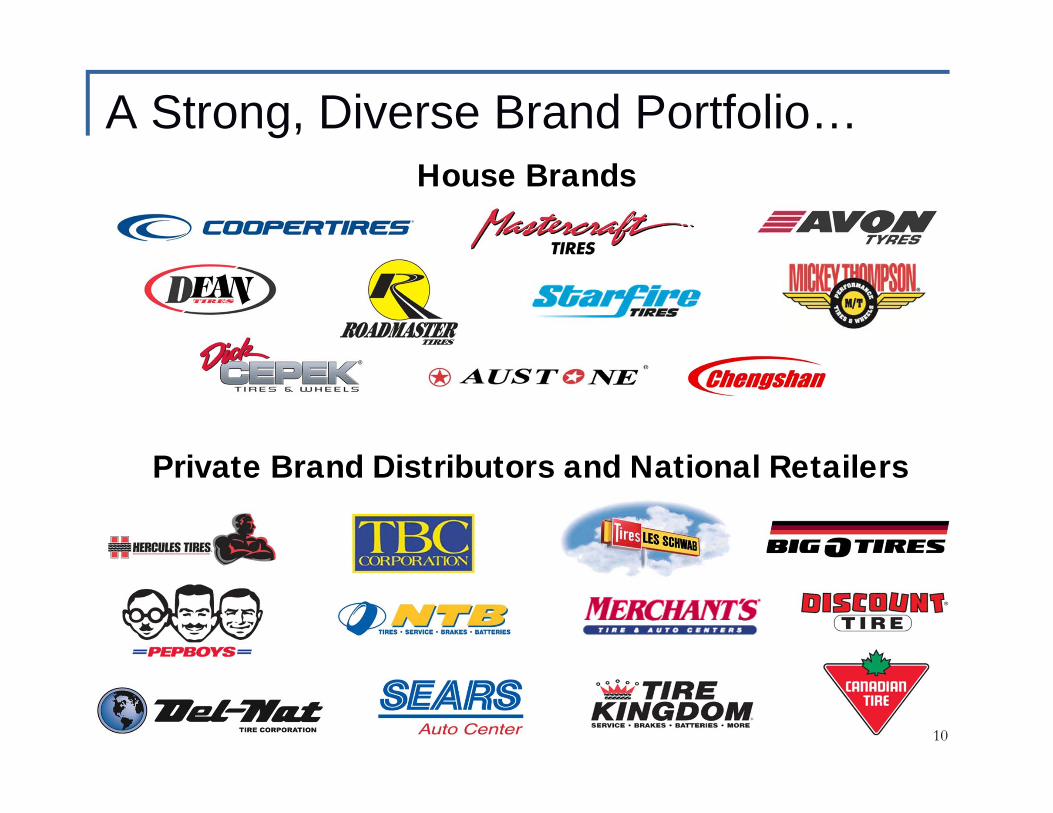
A Strong, Diverse Brand Portfolio…
Private Brand Distributors and National Retailers
House Brands
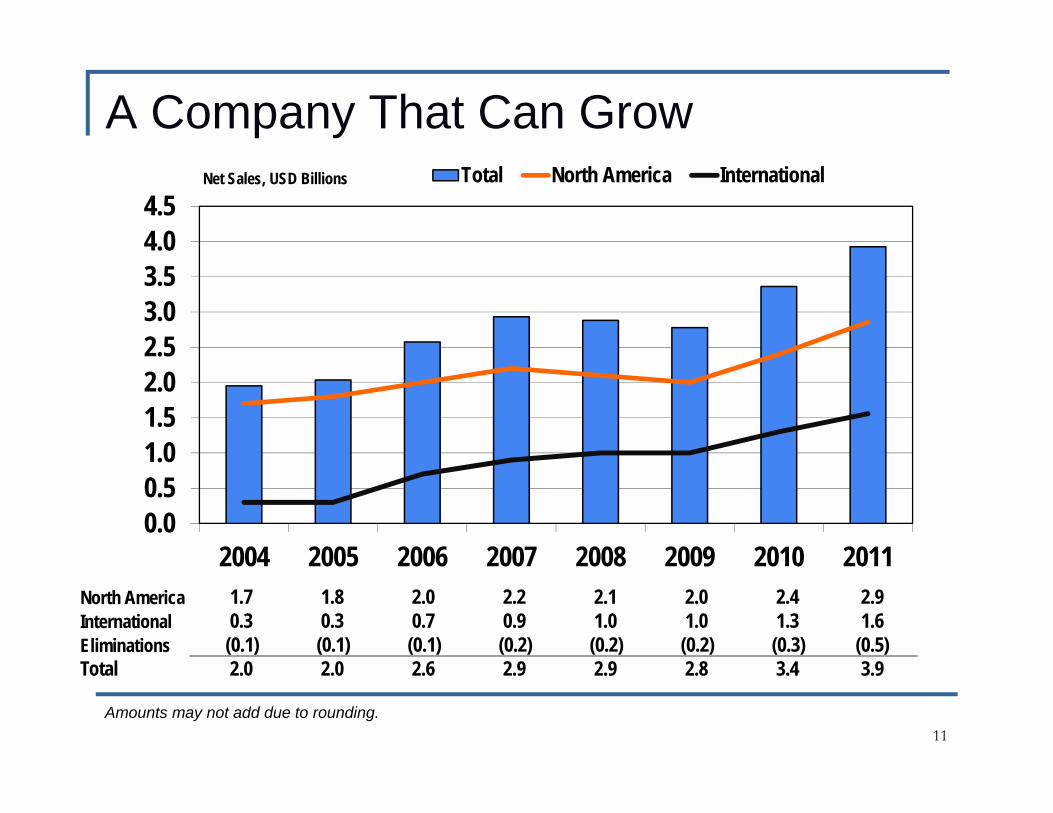
A Company That Can Grow
11
0.00.51.01.52.02.53.03.54.04.5
2004 2005 2006 2007 2008 2009 2010 2011
Total North America International
North America 1.7 1.8 2.0 2.2 2.1 2.0 2.4 2.9International 0.3 0.3 0.7 0.9 1.0 1.0 1.3 1.6Eliminations (0.1) (0.1) (0.1) (0.2) (0.2) (0.2) (0.3) (0.5)Total 2.0 2.0 2.6 2.9 2.9 2.8 3.4 3.9
Net Sales, USD Billions
Amounts may not add due to rounding.

Diversifying Profits
12
-150
-100
-50
0
50
100
150
200
2007 2008 2009 2010 2011
Total North America International
Operating Profit, USD millions

13
Media Recognition
Cooper Zeon RS3™ UHP tire and the Cooper Discoverer AT3 ™ recognized by a prominent
consumer testing organization as best available on the market.
Brand Embedment
Significant product launches including commercial tires are occurring around the globe.
Exciting Products
Successful new product launches support growth
14
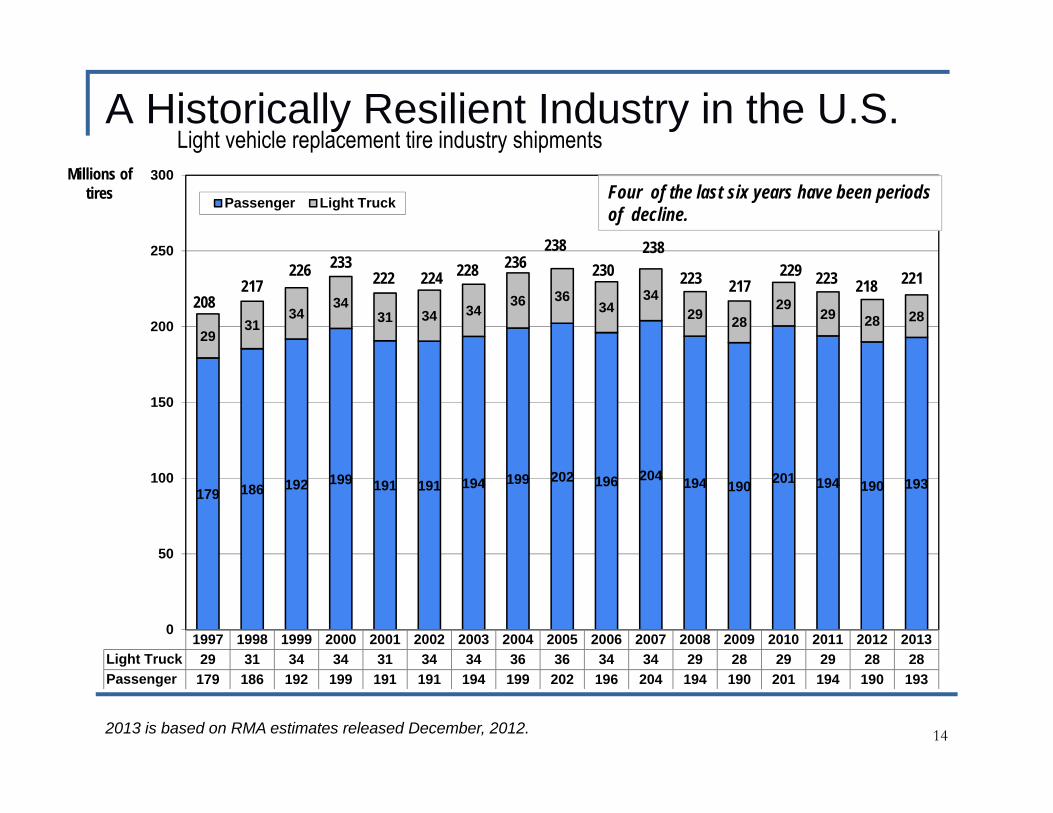
A Historically Resilient Industry in the U.S.
1997 1998 1999 2000 2001 2002 2003 2004 2005 2006 2007 2008 2009 2010 2011 2012 2013Light Truck 29 31 34 34 31 34 34 36 36 34 34 29 28 29 29 28 28Passenger 179 186 192 199 191 191 194 199 202 196 204 194 190 201 194 190 193
179 186 192 199 191 191 194 199 202 196 204 194 190 201 194 190 193
2931
3434
31 34 3436 36
3434
29 2829
29 28 28
0
50
100
150
200
250
300
Passenger Light Truck
208
226217 222
233 228224
238236
238230
217223 223229218 221
2013 is based on RMA estimates released December, 2012.
Millions of tires Four of the last six years have been periods
of decline.
Light vehicle replacement tire industry shipments
15
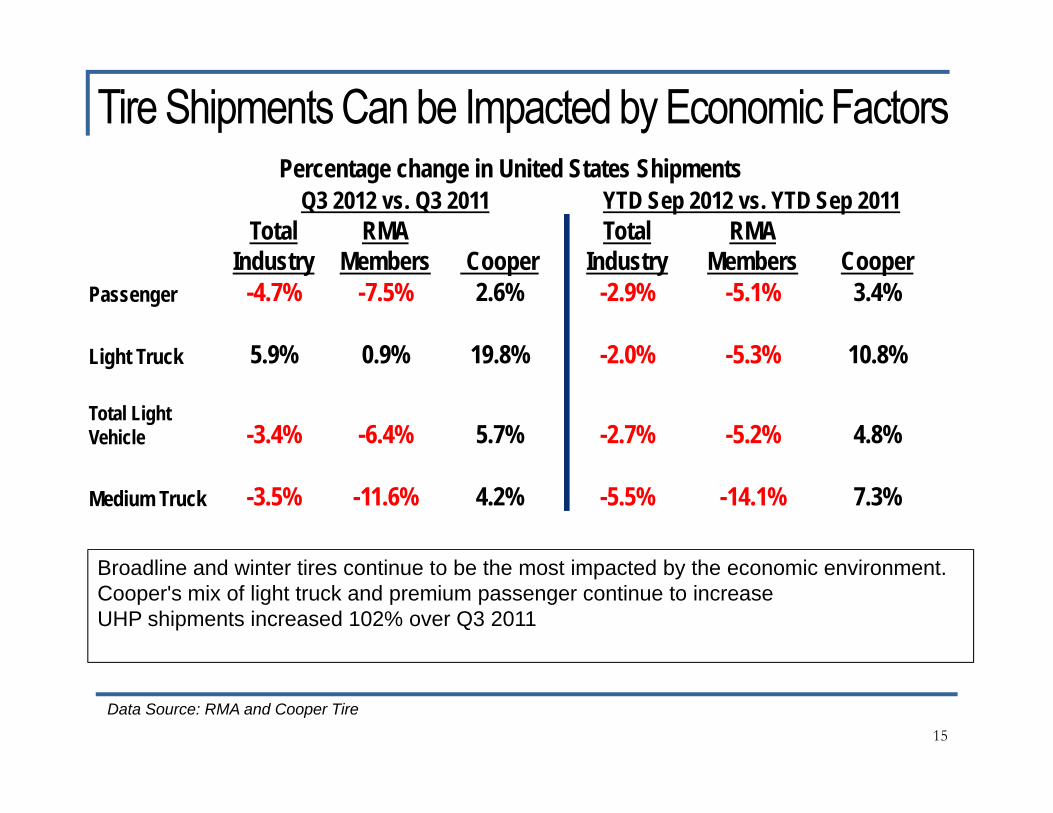
Tire Shipments Can be Impacted by Economic FactorsPercentage change in United States Shipments
Q3 2012 vs. Q3 2011 YTD Sep 2012 vs. YTD Sep 2011Total
IndustryRMA
Members CooperTotal
IndustryRMA
Members CooperPassenger -4.7% -7.5% 2.6% -2.9% -5.1% 3.4%
Light Truck 5.9% 0.9% 19.8% -2.0% -5.3% 10.8%
Total Light Vehicle -3.4% -6.4% 5.7% -2.7% -5.2% 4.8%
Medium Truck -3.5% -11.6% 4.2% -5.5% -14.1% 7.3%
Data Source: RMA and Cooper Tire
Broadline and winter tires continue to be the most impacted by the economic environment. Cooper's mix of light truck and premium passenger continue to increaseUHP shipments increased 102% over Q3 2011
16
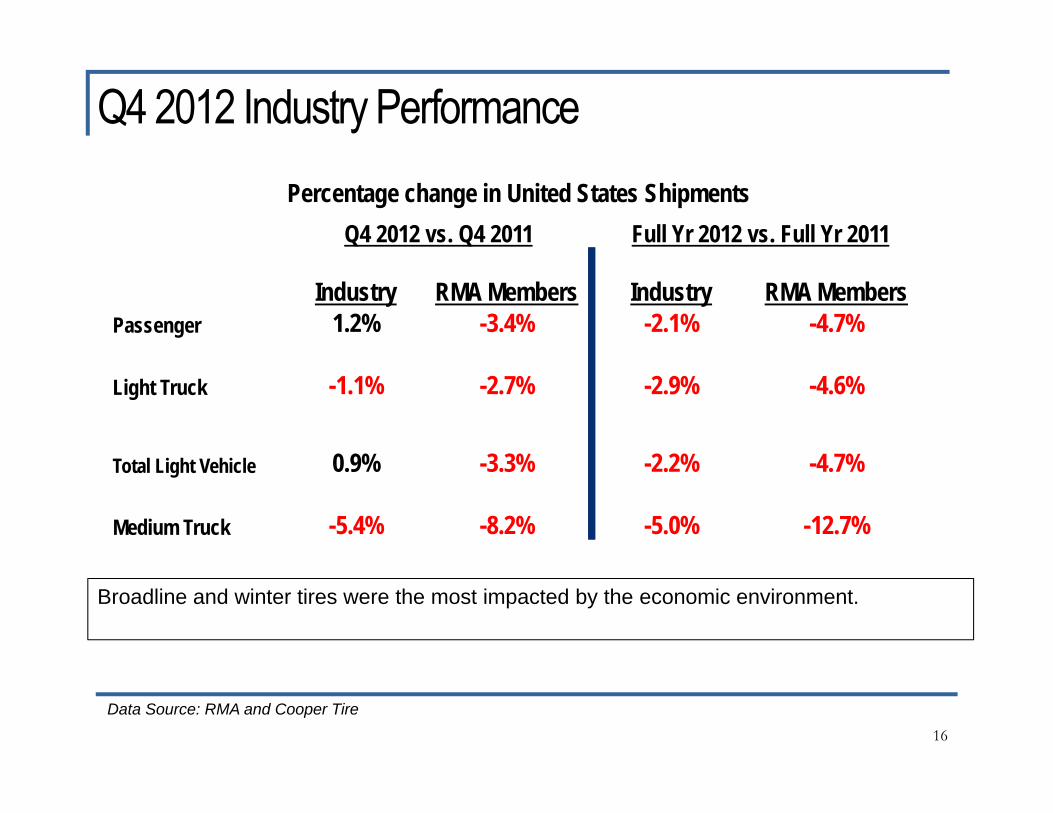
Q4 2012 Industry PerformancePercentage change in United States Shipments
Q4 2012 vs. Q4 2011 Full Yr 2012 vs. Full Yr 2011
Industry RMA Members Industry RMA MembersPassenger 1.2% -3.4% -2.1% -4.7%
Light Truck -1.1% -2.7% -2.9% -4.6%
Total Light Vehicle 0.9% -3.3% -2.2% -4.7%
Medium Truck -5.4% -8.2% -5.0% -12.7%
Data Source: RMA and Cooper Tire
Broadline and winter tires were the most impacted by the economic environment.
17
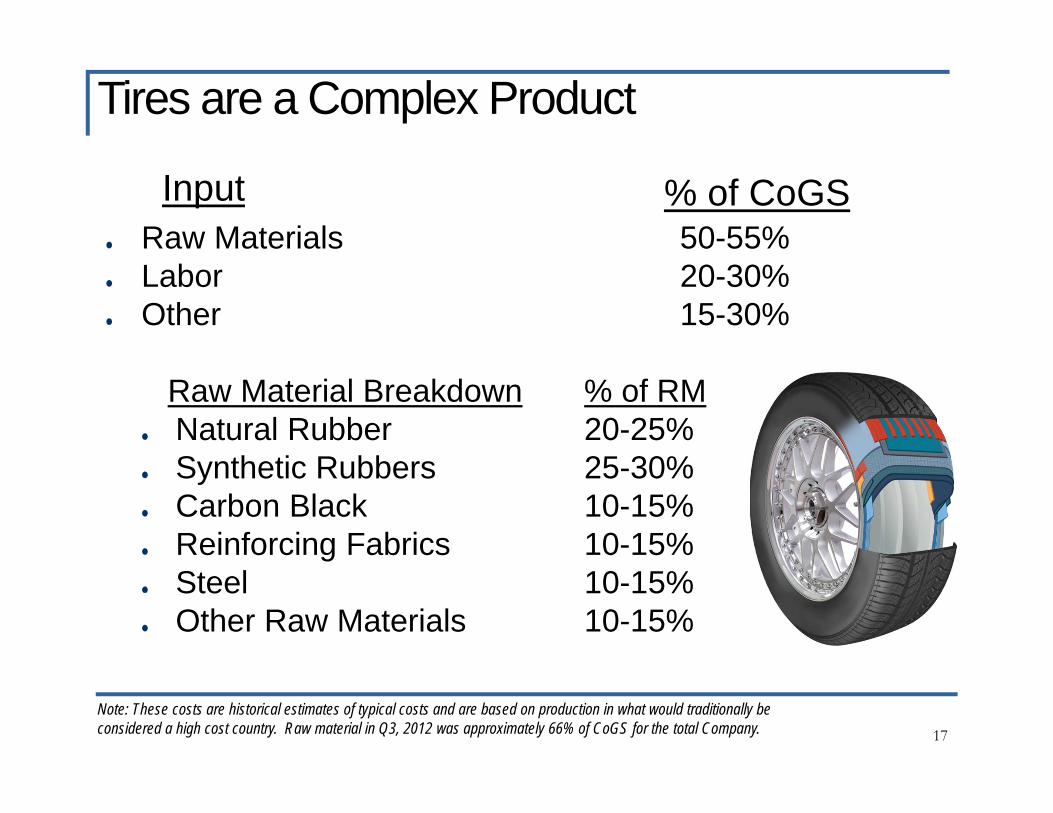
Raw Materials 50-55%Labor 20-30%Other 15-30%
Raw Material Breakdown % of RMNatural Rubber 20-25%Synthetic Rubbers 25-30%Carbon Black 10-15%Reinforcing Fabrics 10-15%Steel 10-15%Other Raw Materials 10-15%
Input % of CoGS
Note: These costs are historical estimates of typical costs and are based on production in what would traditionally be considered a high cost country. Raw material in Q3, 2012 was approximately 66% of CoGS for the total Company.
Tires are a Complex Product
18
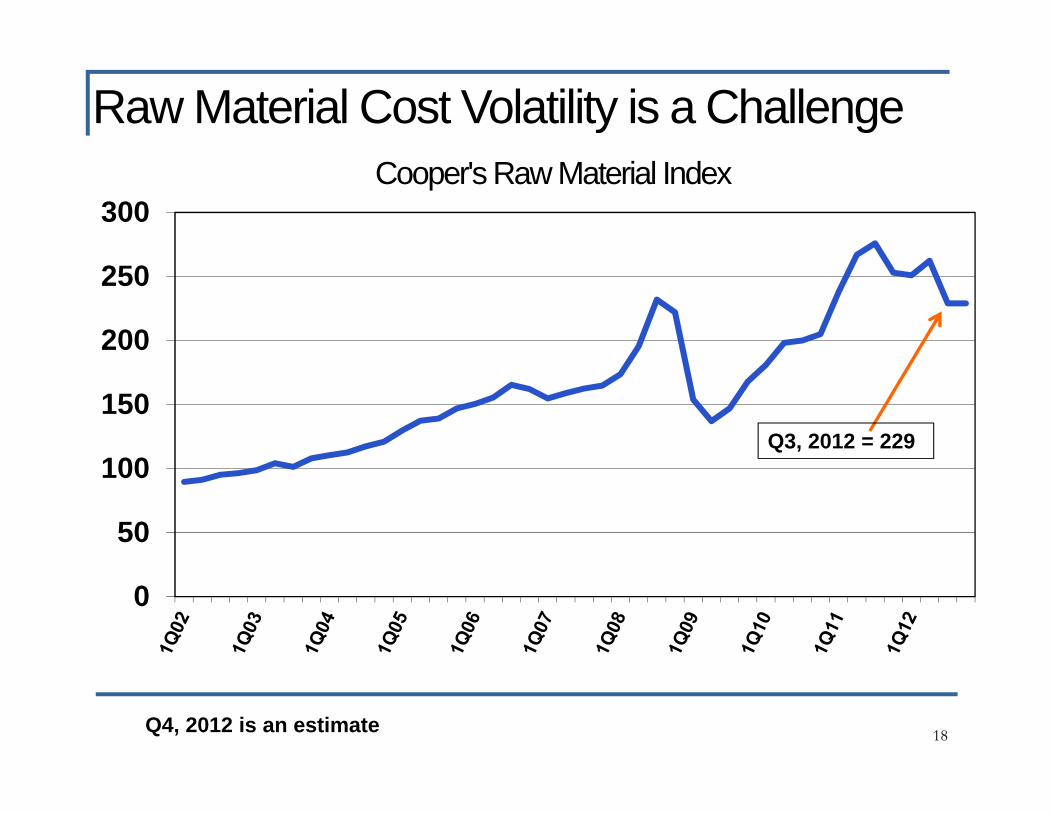
Raw Material Cost Volatility is a ChallengeCooper's Raw Material Index
0
50
100
150
200
250
300
Q3, 2012 = 229
Q4, 2012 is an estimate
19
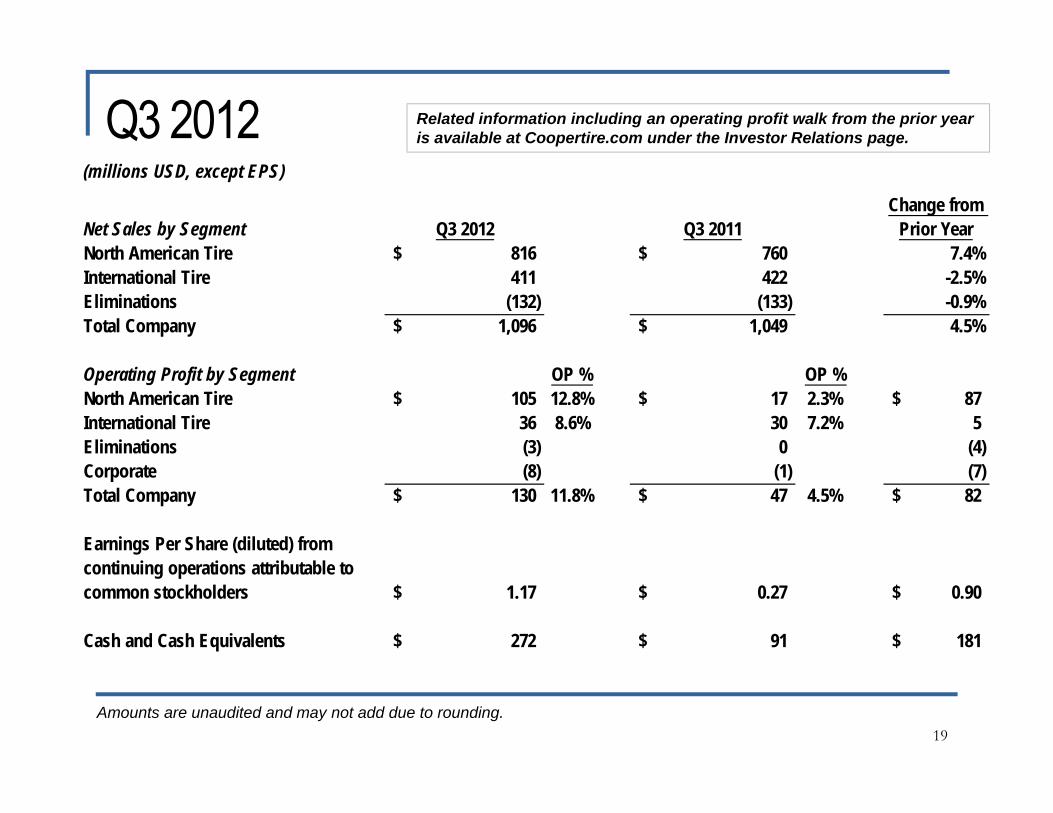
Related information including an operating profit walk from the prior year is available at Coopertire.com under the Investor Relations page.
Amounts are unaudited and may not add due to rounding.
Q3 2012(millions USD, except EPS)
Net Sales by Segment Q3 2012 Q3 2011Change from
Prior YearNorth American Tire 816$ 760$ 7.4%International Tire 411 422 -2.5%Eliminations (132) (133) -0.9%Total Company 1,096$ 1,049$ 4.5%
Operating Profit by Segment OP % OP %North American Tire 105$ 12.8% 17$ 2.3% 87$ International Tire 36 8.6% 30 7.2% 5 Eliminations (3) 0 (4) Corporate (8) (1) (7) Total Company 130$ 11.8% 47$ 4.5% 82$
Earnings Per Share (diluted) from continuing operations attributable to common stockholders 1.17$ 0.27$ 0.90$
Cash and Cash Equivalents 272$ 91$ 181$
20
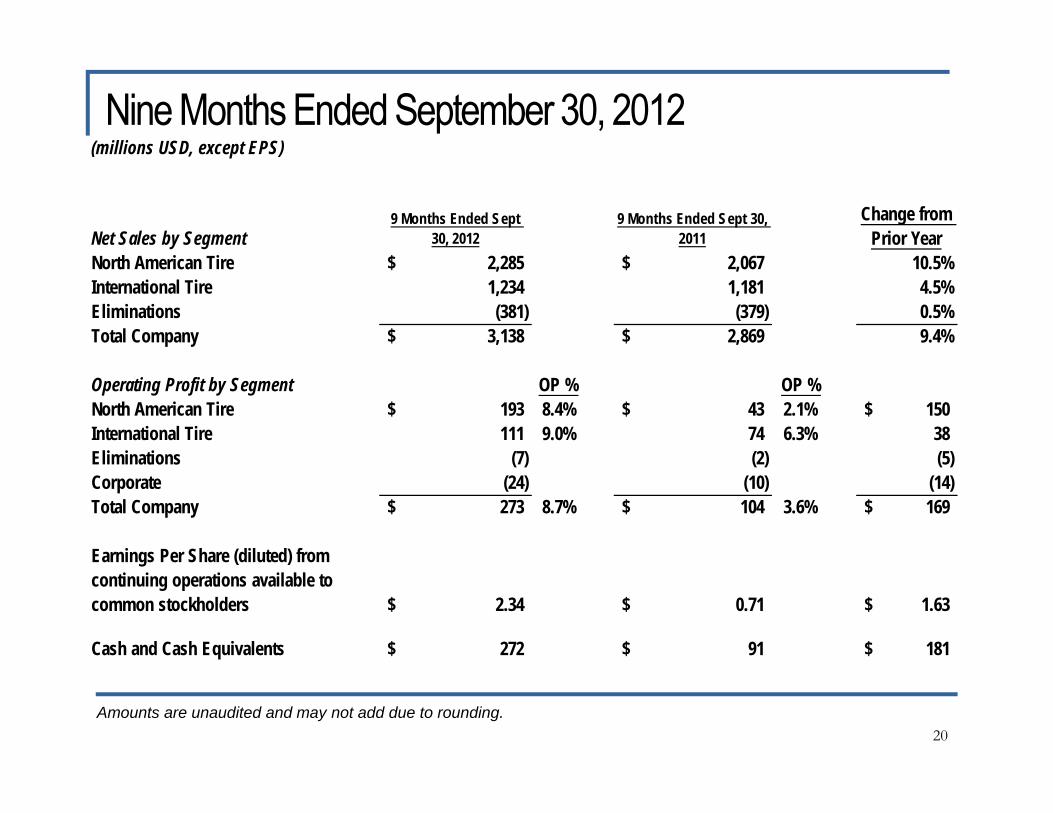
Nine Months Ended September 30, 2012(millions USD, except EPS)
Net Sales by Segment9 Months Ended Sept
30, 20129 Months Ended Sept 30,
2011Change from
Prior YearNorth American Tire 2,285$ 2,067$ 10.5%International Tire 1,234 1,181 4.5%Eliminations (381) (379) 0.5%Total Company 3,138$ 2,869$ 9.4%
Operating Profit by Segment OP % OP %North American Tire 193$ 8.4% 43$ 2.1% 150$ International Tire 111 9.0% 74 6.3% 38 Eliminations (7) (2) (5) Corporate (24) (10) (14) Total Company 273$ 8.7% 104$ 3.6% 169$
Earnings Per Share (diluted) from continuing operations available to common stockholders 2.34$ 0.71$ 1.63$
Cash and Cash Equivalents 272$ 91$ 181$
Amounts are unaudited and may not add due to rounding.
21
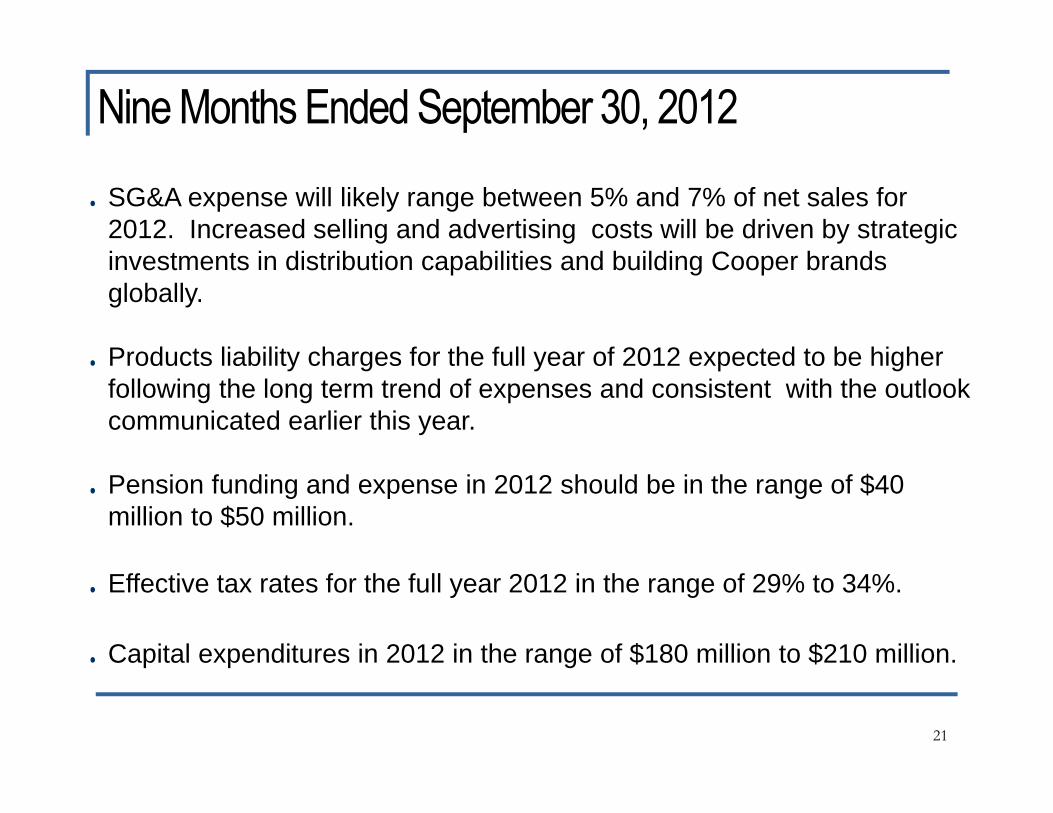
SG&A expense will likely range between 5% and 7% of net sales for 2012. Increased selling and advertising costs will be driven by strategic investments in distribution capabilities and building Cooper brands globally.
Products liability charges for the full year of 2012 expected to be higher following the long term trend of expenses and consistent with the outlook communicated earlier this year.
Pension funding and expense in 2012 should be in the range of $40 million to $50 million.
Effective tax rates for the full year 2012 in the range of 29% to 34%.
Capital expenditures in 2012 in the range of $180 million to $210 million.
Nine Months Ended September 30, 2012
22
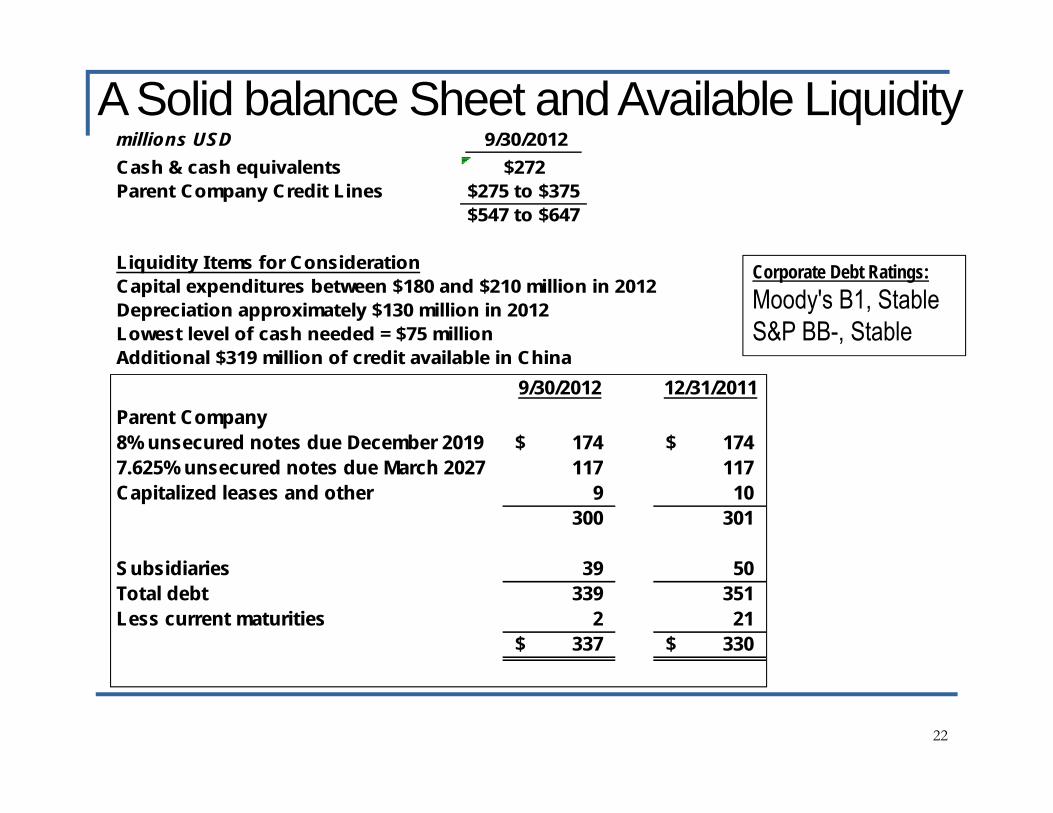
Corporate Debt Ratings:Moody's B1, StableS&P BB-, Stable
A Solid balance Sheet and Available Liquidity
9/30/2012 12/31/2011Parent Company8% unsecured notes due December 2019 174$ 174$ 7.625% unsecured notes due March 2027 117 117 Capitalized leases and other 9 10
300 301
Subsidiaries 39 50 Total debt 339 351 Less current maturities 2 21
337$ 330$
millions USD 9/30/2012 Cash & cash equivalents $272Parent Company Credit Lines $275 to $375
$547 to $647
Liquidity I tems for ConsiderationCapital expenditures between $180 and $210 million in 2012Depreciation approximately $130 million in 2012Lowest level of cash needed = $75 millionAdditional $319 million of credit available in China
23
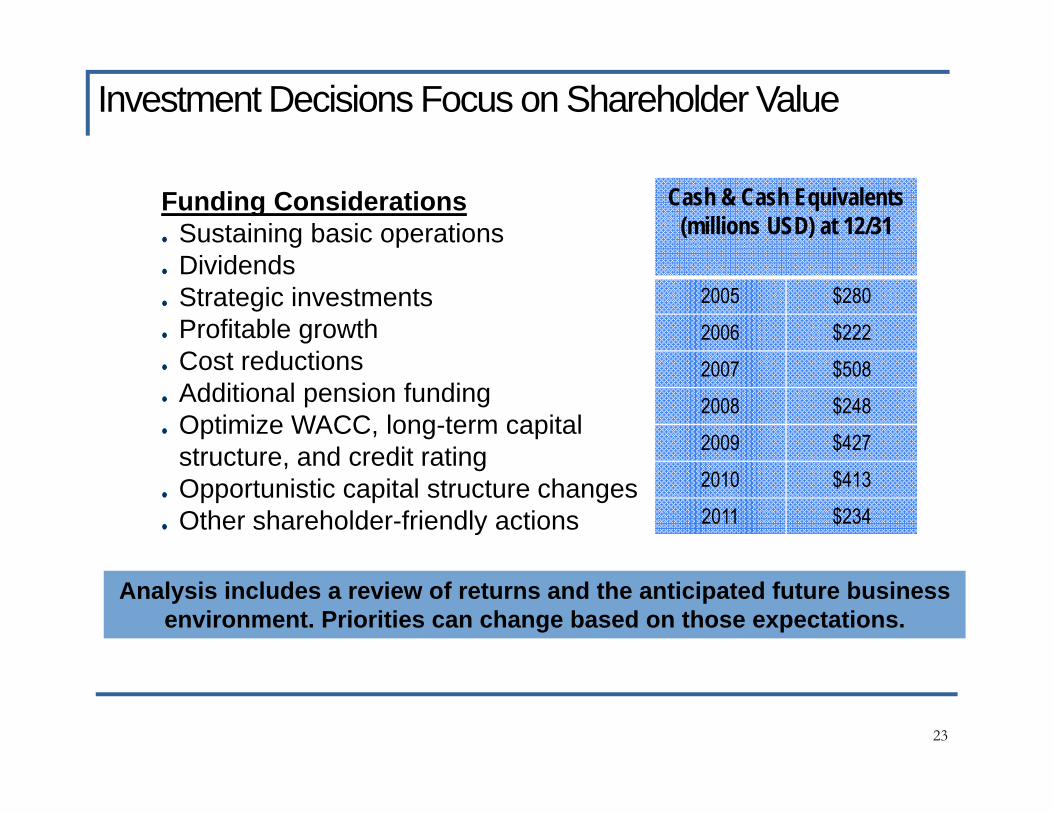
Funding ConsiderationsSustaining basic operationsDividendsStrategic investments Profitable growth Cost reductionsAdditional pension fundingOptimize WACC, long-term capital structure, and credit ratingOpportunistic capital structure changesOther shareholder-friendly actions
Analysis includes a review of returns and the anticipated future business environment. Priorities can change based on those expectations.
Cash & Cash Equivalents (millions USD) at 12/31
2005 $2802006 $2222007 $5082008 $2482009 $4272010 $4132011 $234
Investment Decisions Focus on Shareholder Value

24
More details on Cooper's Strategic Plan are available at Coopertire.com.
Delivered Our Long-Term Strategy
25
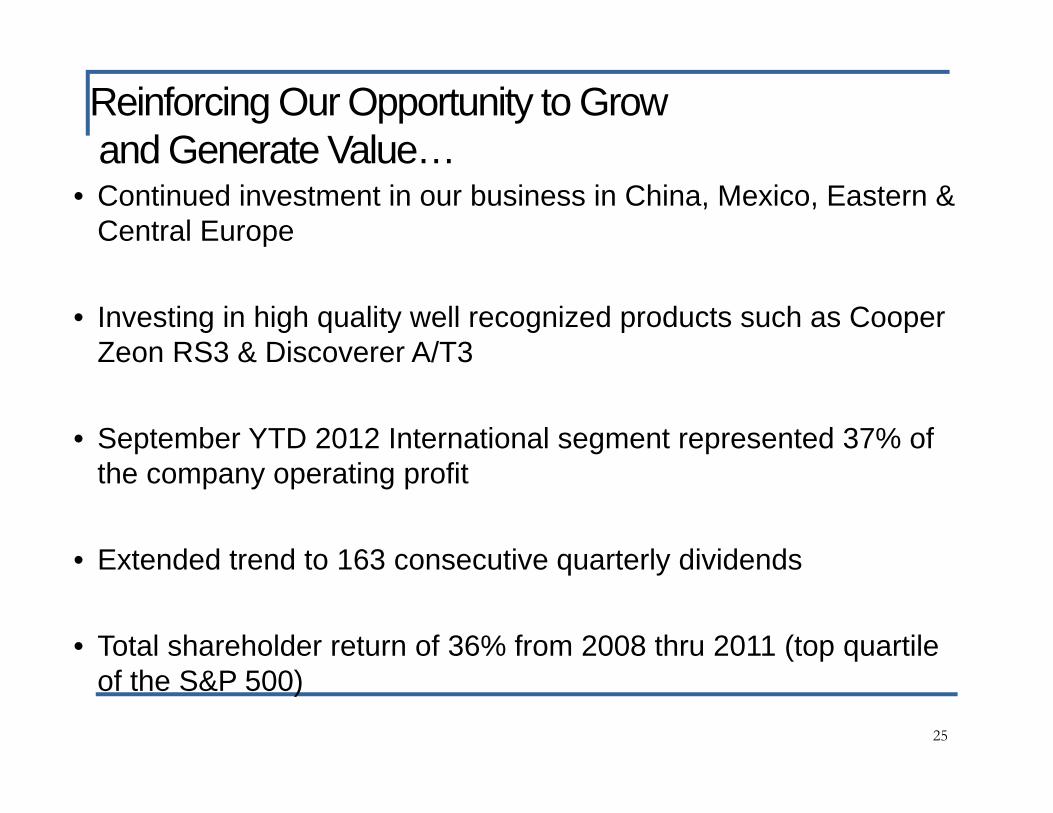
• Continued investment in our business in China, Mexico, Eastern & Central Europe
• Investing in high quality well recognized products such as Cooper Zeon RS3 & Discoverer A/T3
• September YTD 2012 International segment represented 37% of the company operating profit
• Extended trend to 163 consecutive quarterly dividends
• Total shareholder return of 36% from 2008 thru 2011 (top quartile of the S&P 500)
Reinforcing Our Opportunity to Growand Generate Value…

26
Questions?

27
RisksIt is possible that actual results may differ materially from those projections or expectations due to a variety of factors, including but not limited to: the failure to achieve expected sales levels; volatility in raw material and energy prices, including those of rubber, steel, petroleum based products and natural gas and the unavailability of such raw
materials or energy sources; the inability to obtain and maintain price increases to offset higher production or material costs; the failure of the Company’s suppliers to timely deliver products in accordance with contract specifications; changes in economic and business conditions in the world; changes in interest or foreign exchange rates; increased competitive activity including actions by larger competitors or lower-cost producers; consolidation among the Company's competitors or customers; changes in the Company’s customer relationships, including loss of particular business for competitive or other reasons; litigation brought against the Company, including products liability claims, which could result in material damages against the Company, as well as
potential increases in legal fees due to a more active trial docket; volatility in the capital and financial markets or changes to the credit markets and/or access to those markets; an adverse change in the Company’s credit ratings, which could increase its borrowing costs and/or hamper its access to the credit markets; failure to implement information technologies or related systems, including failure to successfully implement an ERP system; changes in pension expense and/or funding resulting from investment performance of the Company’s pension plan assets and changes in discount rate,
salary increase rate, and expected return on plan assets assumptions, or changes to related accounting regulations; the impact of labor problems, including labor disruptions at the Company or at one or more of its large customers or suppliers; changes to tariffs on certain tires imported into the United States from the People's Republic of China or the imposition of new tariffs or trade restrictions; government regulatory and legislative initiatives including environmental and healthcare matters; the failure to develop technologies, processes or products needed to support consumer demand; technology advancements; the risks associated with doing business outside of the United States; failure to attract or retain key personnel; inaccurate assumptions used in developing the Company’s strategic plan or operating plans or the inability or failure to successfully implement such
plans; failure to successfully integrate acquisitions into operations or their related financings may impact liquidity and capital resources; changes in the Company’s relationship with joint-venture partners; the inability to recover the costs to develop and test new products or processes; inability to adequately protect the Company’s intellectual property rights; and inability to use deferred tax assets.
Related Documents


