NREL is a national laboratory of the U.S. Department of Energy, Office of Energy Efficiency & Renewable Energy, operated by the Alliance for Sustainable Energy, LLC. Contract No. DE-AC36-08GO28308 Determining Wind Turbine Gearbox Model Complexity Using Measurement Validation and Cost Comparison Preprint William LaCava and Yi Guo National Renewable Energy Laboratory Yihan Xing and Torgeir Moan Norwegian University of Science and Technology To be presented at EWEA 2012 Copenhagen, Denmark April 16 – 19, 2012 Conference Paper NREL/CP-5000-54545 April 2012

Welcome message from author
This document is posted to help you gain knowledge. Please leave a comment to let me know what you think about it! Share it to your friends and learn new things together.
Transcript

NREL is a national laboratory of the U.S. Department of Energy, Office of Energy Efficiency & Renewable Energy, operated by the Alliance for Sustainable Energy, LLC.
Contract No. DE-AC36-08GO28308
Determining Wind Turbine Gearbox Model Complexity Using Measurement Validation and Cost Comparison Preprint
William LaCava and Yi Guo National Renewable Energy Laboratory
Yihan Xing and Torgeir Moan Norwegian University of Science and Technology
To be presented at EWEA 2012 Copenhagen, Denmark April 16 – 19, 2012
Conference Paper NREL/CP-5000-54545 April 2012

NOTICE
The submitted manuscript has been offered by an employee of the Alliance for Sustainable Energy, LLC (Alliance), a contractor of the US Government under Contract No. DE-AC36-08GO28308. Accordingly, the US Government and Alliance retain a nonexclusive royalty-free license to publish or reproduce the published form of this contribution, or allow others to do so, for US Government purposes.
This report was prepared as an account of work sponsored by an agency of the United States government. Neither the United States government nor any agency thereof, nor any of their employees, makes any warranty, express or implied, or assumes any legal liability or responsibility for the accuracy, completeness, or usefulness of any information, apparatus, product, or process disclosed, or represents that its use would not infringe privately owned rights. Reference herein to any specific commercial product, process, or service by trade name, trademark, manufacturer, or otherwise does not necessarily constitute or imply its endorsement, recommendation, or favoring by the United States government or any agency thereof. The views and opinions of authors expressed herein do not necessarily state or reflect those of the United States government or any agency thereof.
Available electronically at http://www.osti.gov/bridge
Available for a processing fee to U.S. Department of Energy and its contractors, in paper, from:
U.S. Department of Energy Office of Scientific and Technical Information P.O. Box 62 Oak Ridge, TN 37831-0062 phone: 865.576.8401 fax: 865.576.5728 email: mailto:[email protected]
Available for sale to the public, in paper, from:
U.S. Department of Commerce National Technical Information Service 5285 Port Royal Road Springfield, VA 22161 phone: 800.553.6847 fax: 703.605.6900 email: [email protected] online ordering: http://www.ntis.gov/help/ordermethods.aspx
Cover Photos: (left to right) PIX 16416, PIX 17423, PIX 16560, PIX 17613, PIX 17436, PIX 17721
Printed on paper containing at least 50% wastepaper, including 10% post consumer waste.
1
Determining Wind Turbine Gearbox Model Complexity Using Measurement Validation and Cost Comparison
William LaCava Yihan Xing Yi Guo Torgeir Moan
National Wind Technology Center, National
Renewable Energy Laboratory
Golden, Colorado
Centre for Ships and Ocean Structures,
Norwegian University of Science and Technology
Trondheim, Norway
National Wind Technology Center, National
Renewable Energy Laboratory
Golden, Colorado
Centre for Ships and Ocean Structures, Norwegian
University of Science and Technology
Trondheim, Norway
[email protected] [email protected] [email protected] [email protected]
Abstract The Gearbox Reliability Collaborative (GRC) has conducted extensive field and dynamometer test campaigns on two heavily instrumented wind turbine gearboxes. In this paper, data from the planetary stage is used to evaluate the accuracy and computation time of numerical models of the gearbox. First, planet-bearing load and motion data is analyzed to characterize planetary stage behavior in different environments and to derive requirements for gearbox models and life calculations. Second, a set of models are constructed that represent different levels of fidelity. Simulations of the test conditions are compared to the test data and the computational cost of the models are compared. The test data suggests that the planet-bearing life calculations should be made separately for each bearing on a row due to unequal load distribution. It also shows that tilting of the gear axes is related to planet load share. The modeling study concluded that fully flexible models were needed to predict planet-bearing loading in some cases, although less complex models were able to achieve good correlation in the field-loading case. Significant differences in planet load share were found in simulation and were dependent on the scope of the model and the bearing stiffness model used.
Keywords: wind turbine gearbox, drivetrain, planetary stage, multibody modeling, planet load share
1 Introduction The Gearbox Reliability Collaborative (GRC) is a
U.S. Department of Energy (DOE) project that was created to identify the gaps in the wind turbine gearbox design process that may be contributing to premature failure of these components—despite their 20-year design life [1, 2]. The core project activities include field and dynamometer testing of two heavily instrumented gearboxes and modeling and analysis collaboration with wind turbine and gearbox
designers, bearing manufacturers, and research institutions. Cooperative research between the National Renewable Energy Laboratory (NREL) and the Norwegian University of Science and Technology (NTNU) investigates modeling techniques for wind turbine drivetrains and evaluates gearbox response to offshore loading conditions using models validated with GRC data. By gaining a greater understanding of the internal loading conditions of offshore wind turbine gearboxes, researchers hope to improve gearbox reliability and significantly reduce the higher offshore maintenance costs.
This paper presents a combined approach of test data analysis and model correlation in order to provide a set of guidelines for the accurate and efficient modeling of the wind turbine gearbox. By using full finite element models, researchers can provide a complete description of local component structural deflections that influence drivetrain misalignments and response modes [3]. However, there is a huge time advantage to using rigid multibody gearbox models with discrete stiffness and reduced degrees of freedom (DOF) [4]. The in-depth GRC gearbox measurements can be used to validate gearbox modeling techniques and determine the right compromise between model complexity and accuracy. By identifying and taking into account only the structural flexibilities that are necessary, various model reduction methods can help reduce processing time and cost [5, 6].
The identification of the necessary component flexibilities is paramount to reducing the cost of system dynamics modeling, and establishing the correct model reduction procedure is critical for maintaining accuracy. For instance, including gearbox housing flexibility has generally been considered necessary due to its influence on shaft bore and ring gear misalignment [7]. Carrier flexibility is also considered necessary due to its effect on planet pin alignment [8]. However, a robust assessment of the accuracy of various modeling techniques versus cost has not been conducted for wind turbine drivetrains, nor has the

2
influence of flexibility of other subcomponents been analyzed with test data correlation. The GRC test campaigns provide a unique opportunity to validate internal response characteristics against over 1,000 hours of test data from field and dynamometer testing.
2 Drivetrain and Instrumentation Description
Two identical 750-kilowatt gearboxes, henceforth called GB1 and GB2, were removed from an operating population and redesigned to represent a common three-stage, multi-megawatt gearbox design as shown in Figure 1. A schematic representation of the planetary stage instrumentation is shown in Figure 2 and described in Table 1. This paper focuses on comparisons of planetary stage gear and bearing loading.
Figure 1: Exploded view of GRC gearbox components
Each planet-bearing inner race was machined with grooves and instrumented at six locations. Poisson gauges were placed along both 25% and 75% of the race width at various positions in the bearing load zone. Every planet bearing had two strain measurements in the tangential direction, or the direction of rotation of the carrier, calibrated to a range of applied radial loads [9]. An instrumentation schematic for bearing strain is shown in Figure 3.
In order to measure the planet motion, three proximity sensors were mounted to the carrier targeting the planet rim (as shown in Figure 4). From these sensors, tilt about Y and Z and axial motion are derived.
Figure 2: Schematic of planetary stage instrumentation
No. Measurement Quantity Derivation 1 Ring external
root strain 8 External measurement of
ring gear face width load distribution
2 Planet deflection
6 Three DOF motion of planet gears with respect to (w.r.t.) carrier
3 Planet-bearing strain
36 Pin load distribution, planet load share (Kγ) [10]
4 Sun motion 2 Two DOF sun gear orbit 5 Carrier rim
deflection 6 Five DOF carrier motion
w.r.t. housing, rim deformation w.r.t. housing
6 Ring gear root strain
24 Ring gear face width load distribution at 0°, 120°, and 240° azimuth, Khß [11], load centroid
Table 1: Instrumentation in planetary stage
Figure 3: Planet-bearing instrumentation
3
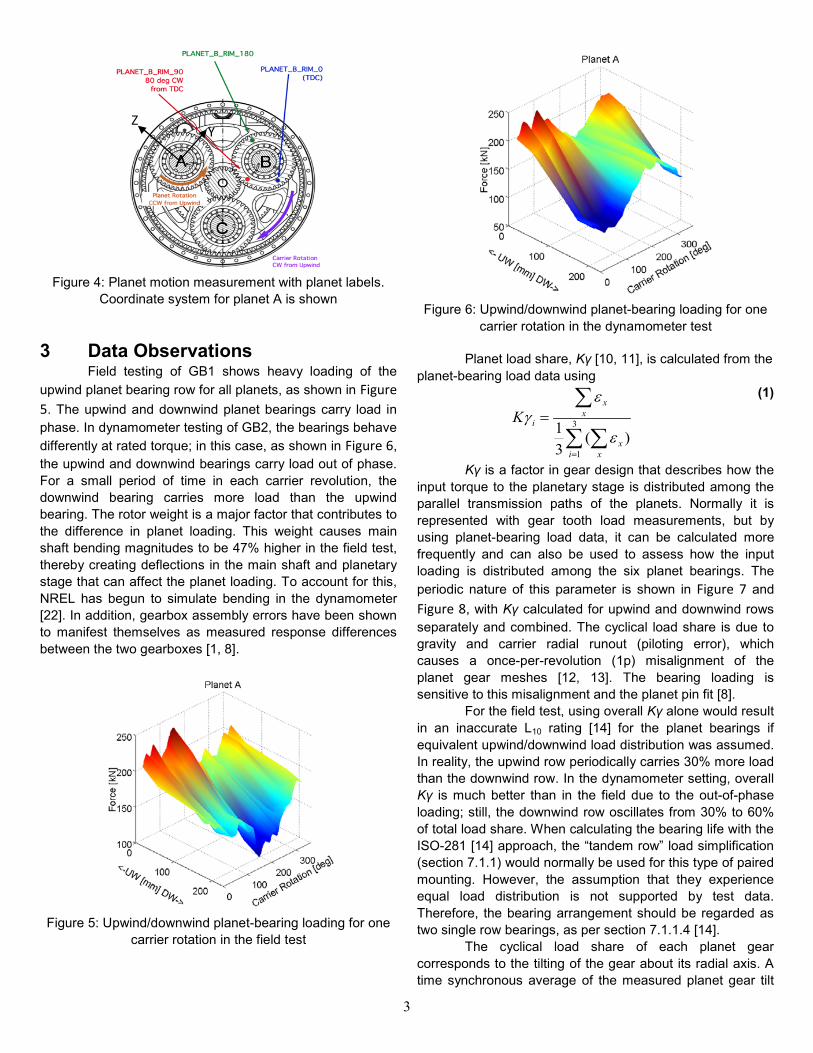
Figure 4: Planet motion measurement with planet labels.
Coordinate system for planet A is shown
3 Data Observations Field testing of GB1 shows heavy loading of the
upwind planet bearing row for all planets, as shown in Figure 5. The upwind and downwind planet bearings carry load in phase. In dynamometer testing of GB2, the bearings behave differently at rated torque; in this case, as shown in Figure 6, the upwind and downwind bearings carry load out of phase. For a small period of time in each carrier revolution, the downwind bearing carries more load than the upwind bearing. The rotor weight is a major factor that contributes to the difference in planet loading. This weight causes main shaft bending magnitudes to be 47% higher in the field test, thereby creating deflections in the main shaft and planetary stage that can affect the planet loading. To account for this, NREL has begun to simulate bending in the dynamometer [22]. In addition, gearbox assembly errors have been shown to manifest themselves as measured response differences between the two gearboxes [1, 8].
Figure 5: Upwind/downwind planet-bearing loading for one
carrier rotation in the field test
Figure 6: Upwind/downwind planet-bearing loading for one
carrier rotation in the dynamometer test
Planet load share, Kγ [10, 11], is calculated from the planet-bearing load data using
∑ ∑
∑
=
= 3
1)(
31
i xx
xx
iKε
εγ
(1)
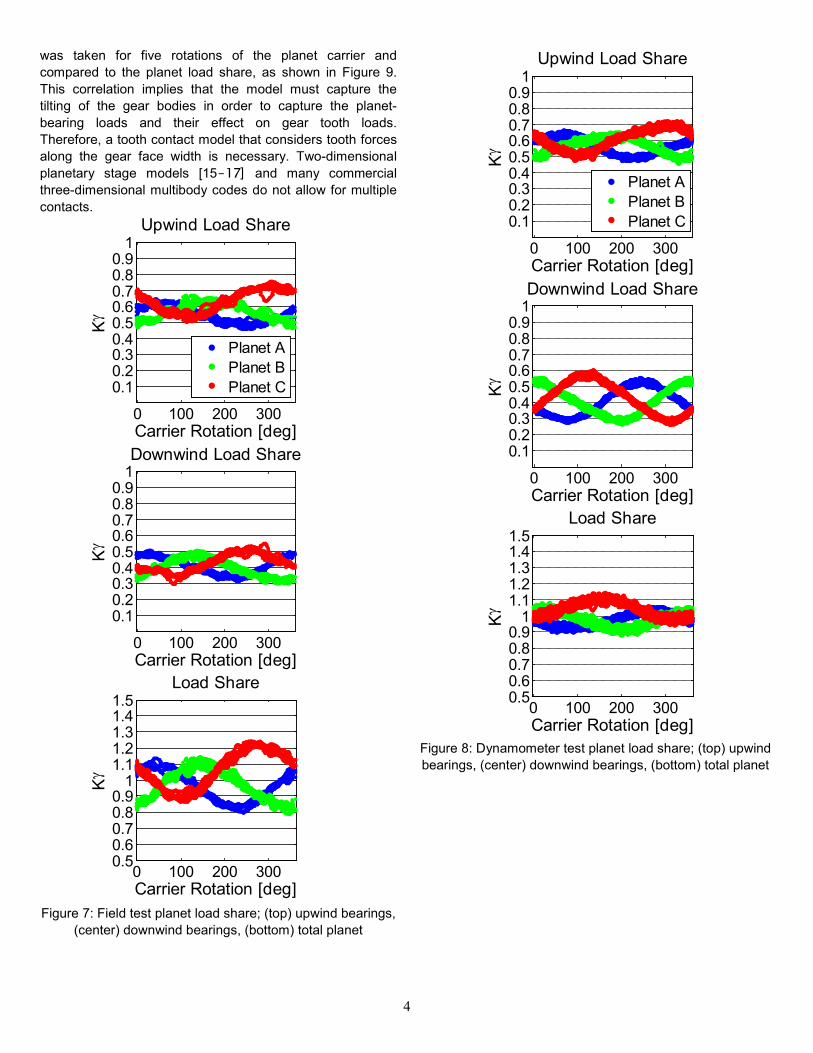
Kγ is a factor in gear design that describes how the input torque to the planetary stage is distributed among the parallel transmission paths of the planets. Normally it is represented with gear tooth load measurements, but by using planet-bearing load data, it can be calculated more frequently and can also be used to assess how the input loading is distributed among the six planet bearings. The periodic nature of this parameter is shown in Figure 7 and Figure 8, with Kγ calculated for upwind and downwind rows separately and combined. The cyclical load share is due to gravity and carrier radial runout (piloting error), which causes a once-per-revolution (1p) misalignment of the planet gear meshes [12, 13]. The bearing loading is sensitive to this misalignment and the planet pin fit [8].
For the field test, using overall Kγ alone would result in an inaccurate L10 rating [14] for the planet bearings if equivalent upwind/downwind load distribution was assumed. In reality, the upwind row periodically carries 30% more load than the downwind row. In the dynamometer setting, overall Kγ is much better than in the field due to the out-of-phase loading; still, the downwind row oscillates from 30% to 60% of total load share. When calculating the bearing life with the ISO-281 [14] approach, the “tandem row” load simplification (section 7.1.1) would normally be used for this type of paired mounting. However, the assumption that they experience equal load distribution is not supported by test data. Therefore, the bearing arrangement should be regarded as two single row bearings, as per section 7.1.1.4 [14].
The cyclical load share of each planet gear corresponds to the tilting of the gear about its radial axis. A time synchronous average of the measured planet gear tilt
Y
Z
4
was taken for five rotations of the planet carrier and compared to the planet load share, as shown in Figure 9. This correlation implies that the model must capture the tilting of the gear bodies in order to capture the planet-bearing loads and their effect on gear tooth loads. Therefore, a tooth contact model that considers tooth forces along the gear face width is necessary. Two-dimensional planetary stage models [15‒17] and many commercial three-dimensional multibody codes do not allow for multiple contacts.
Figure 7: Field test planet load share; (top) upwind bearings,
(center) downwind bearings, (bottom) total planet
Figure 8: Dynamometer test planet load share; (top) upwind bearings, (center) downwind bearings, (bottom) total planet
0 100 200 3000.50.60.70.80.9
11.11.21.31.41.5
Load Share
Kγ
Carrier Rotation [deg]
0 100 200 300
0.10.20.30.40.50.60.70.80.9
1
Carrier Rotation [deg]
Kγ
Upwind Load Share
Planet APlanet BPlanet C
0 100 200 300
0.10.20.30.40.50.60.70.80.9
1Downwind Load Share
Kγ
Carrier Rotation [deg]
0 100 200 3000.50.60.70.80.9
11.11.21.31.41.5
Load ShareKγ
Carrier Rotation [deg]
0 100 200 300
0.10.20.30.40.50.60.70.80.9
1
Carrier Rotation [deg]
Kγ
Upwind Load Share
Planet APlanet BPlanet C
0 100 200 300
0.10.20.30.40.50.60.70.80.9
1Downwind Load Share
Kγ
Carrier Rotation [deg]

5
Figure 9: Correlation of planet load share to planet tilt
4 Model Comparison Setup 4.1 Partner Models
As part of the GRC round-robin activities, GRC modeling partners submitted modeling results for dynamometer test cases from different gearbox modeling software. These results are included in the model comparisons and provide insight into the scope of the gearbox model that is required to capture specific properties of the bearing response.
The partner 1 model, henceforth P1, is a planetary stage multibody model. Only the planet carrier, planets, planet bearings, ring gear, and sun gear are included. The gear face width is divided into nine force elements. Bearing properties equivalent to bearing model B in Table 2 are implemented. The planet carrier and planet pins are modeled as flexible bodies.
The partner 2 model, henceforth P2, is a quasi-static model built in RomaxWIND. The NREL dynamometer setup is included in the model, including the weights and inertias of the jack shafts and testing equipment. The model is fully flexible, with Timoshenko [18] beams used for the shafts and flexible bodies that have been reduced using the Guyan, or static, reduction method [5]. Unlike the other models, bearing stiffness matrices are calculated at each time step and include analytical gear and roller contact.
4.2 NREL Models For this study, five different multibody models are
compared, as shown in Table 2. The naming convention for each model comes directly from this table. The models vary both in inclusions of flexible structures and in complexity of the bearing model used for the planetary stage. Figure 10 shows the three levels of flexibility implemented in SIMPACKTM. Each model is compared for accuracy against planet-bearing load data at rated power from field and dynamometer test cases. In a preliminary fidelity study, the
number of tooth slices on each gear mesh in the gearbox is varied for model 1A (rigid). The resultant planetary stage tooth loads are evaluated.
Drivetrain Flexibility
1. Rigid 6 DOF
2. Flexible Housing, Carrier
3. Fully Flexible
Bea
ring
Mod
el
A. 6x6 Diagonal Matrix M1A M2A
B. 6x6 Diagonal Matrix with Clearance
M1B M2B M3B
Table 2: Compared models
4.3 Body Models Finite Element (FE) meshes of the housing and
planet carrier were developed in Abaqus. For the purposes of multibody modeling, it is important to maintain accurate modal response for the flexible bodies, since the internal loads and deflections of the flexible body in a multibody setting are determined through the superposition of modal responses. The minimum mesh size needed for convergence on the free modal response of the individual components was determined first. Second, fixed-interface component mode synthesis, known as the Craig-Bampton Method [6], was performed on each part. Third, a modal analysis was performed on the reduced matrices. Finally, a selection of modes was kept and the condensed flexible bodies were imported into SIMPACK.
Each model is a 6-DOF multibody model of the gearbox with discrete stiffness. The main shaft, hub mass, and generator control are included. The two-speed induction generator used in this turbine is represented by a Thevenin equivalent model running at fixed speed with six poles. For more information on the turbine, refer to [19].
0 0.02 0.04 0.06 0.08 0.10.85
0.9
0.95
1
1.05
1.1
1.15
1.2
1.25
ΘZ [deg]
Kγ
Planet BR2 = .91Planet CR2 = .77
6
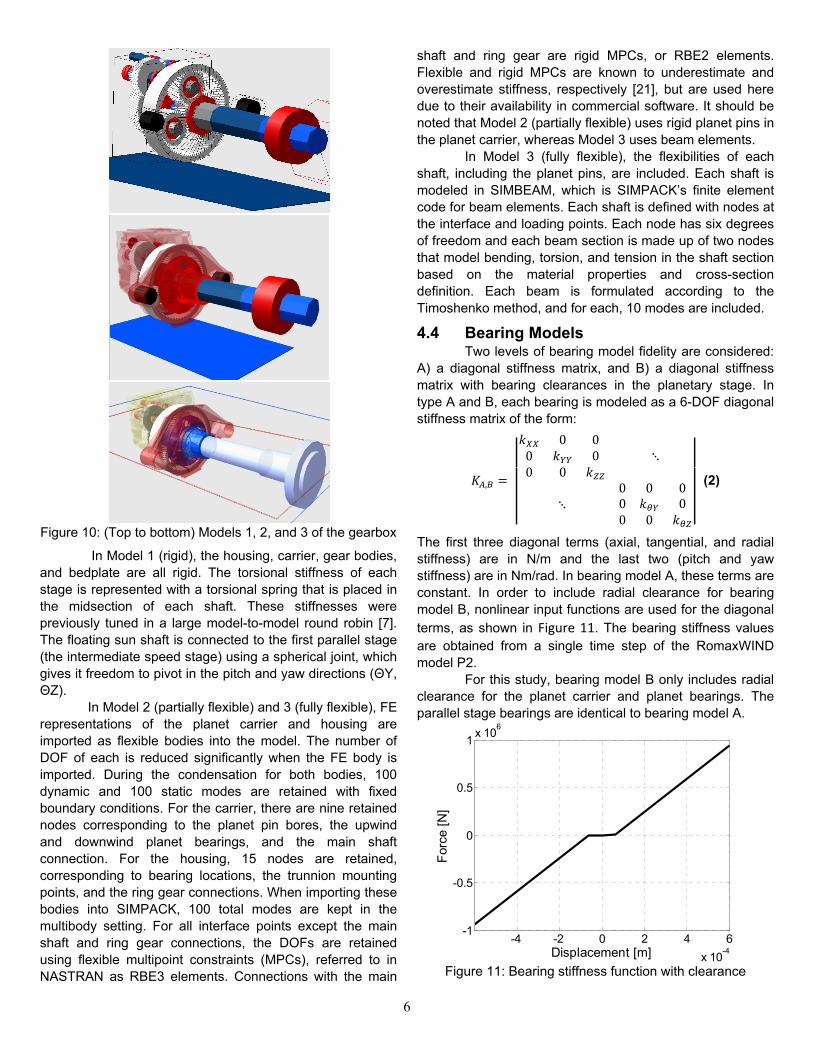
Figure 10: (Top to bottom) Models 1, 2, and 3 of the gearbox
In Model 1 (rigid), the housing, carrier, gear bodies, and bedplate are all rigid. The torsional stiffness of each stage is represented with a torsional spring that is placed in the midsection of each shaft. These stiffnesses were previously tuned in a large model-to-model round robin [7]. The floating sun shaft is connected to the first parallel stage (the intermediate speed stage) using a spherical joint, which gives it freedom to pivot in the pitch and yaw directions (ΘY, ΘZ).
In Model 2 (partially flexible) and 3 (fully flexible), FE representations of the planet carrier and housing are imported as flexible bodies into the model. The number of DOF of each is reduced significantly when the FE body is imported. During the condensation for both bodies, 100 dynamic and 100 static modes are retained with fixed boundary conditions. For the carrier, there are nine retained nodes corresponding to the planet pin bores, the upwind and downwind planet bearings, and the main shaft connection. For the housing, 15 nodes are retained, corresponding to bearing locations, the trunnion mounting points, and the ring gear connections. When importing these bodies into SIMPACK, 100 total modes are kept in the multibody setting. For all interface points except the main shaft and ring gear connections, the DOFs are retained using flexible multipoint constraints (MPCs), referred to in NASTRAN as RBE3 elements. Connections with the main
shaft and ring gear are rigid MPCs, or RBE2 elements. Flexible and rigid MPCs are known to underestimate and overestimate stiffness, respectively [21], but are used here due to their availability in commercial software. It should be noted that Model 2 (partially flexible) uses rigid planet pins in the planet carrier, whereas Model 3 uses beam elements.
In Model 3 (fully flexible), the flexibilities of each shaft, including the planet pins, are included. Each shaft is modeled in SIMBEAM, which is SIMPACK’s finite element code for beam elements. Each shaft is defined with nodes at the interface and loading points. Each node has six degrees of freedom and each beam section is made up of two nodes that model bending, torsion, and tension in the shaft section based on the material properties and cross-section definition. Each beam is formulated according to the Timoshenko method, and for each, 10 modes are included.
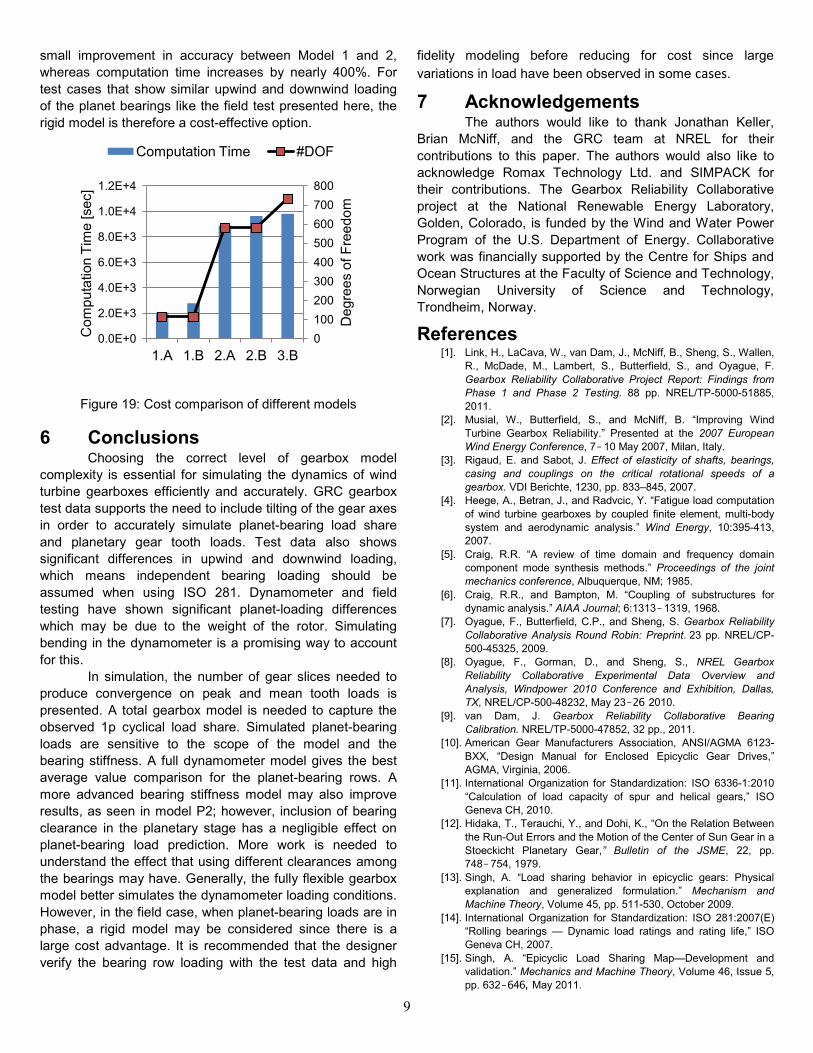
4.4 Bearing Models Two levels of bearing model fidelity are considered:
A) a diagonal stiffness matrix, and B) a diagonal stiffness matrix with bearing clearances in the planetary stage. In type A and B, each bearing is modeled as a 6-DOF diagonal stiffness matrix of the form:
, 0 00 00 0 0 0 00 00 0
(2)
The first three diagonal terms (axial, tangential, and radial stiffness) are in N/m and the last two (pitch and yaw stiffness) are in Nm/rad. In bearing model A, these terms are constant. In order to include radial clearance for bearing model B, nonlinear input functions are used for the diagonal terms, as shown in Figure 11. The bearing stiffness values are obtained from a single time step of the RomaxWIND model P2.
For this study, bearing model B only includes radial clearance for the planet carrier and planet bearings. The parallel stage bearings are identical to bearing model A.
Figure 11: Bearing stiffness function with clearance
-4 -2 0 2 4 6
x 10-4
-1
-0.5
0
0.5
1x 10
6
Displacement [m]
For
ce [
N]

7
4.5 Gear Tooth Model Including the influence of ring gear body flexibility is
a developing area of research [20]. The misalignment of the gear axes can be captured in tooth loading by slicing the gear face width into many spring-damper force elements. With helical gear sets, this capability is important due to the axial forces at the gear meshes and the resulting moment induced on the planet gears, as shown in the Data Observations section. For each model, the gear contacts are split into slices along the face width of the gear to accurately capture the tilting of the gear axes. The number of slices was chosen based on a fidelity study detailed in the Model Evaluation section. Tooth microgeometry modifications (tip, crown, and lead) are included in each model.
4.6 Test Comparison Cases and Load Application
Two test cases were used for model comparison; 1) dynamometer rated-torque case, and 2) field rated-torque case. The torque for cases 1 and 2 is shown in Figure 12. Torsion measurement time series data was input directly at the main shaft as an input function in the multibody model. The first 20 seconds of each test case were simulated.
Figure 12: Test comparison cases 1 (Dynamometer or
“Dyno”) and 2 (Field)
5 Model Evaluation A convergence study was conducted to determine
the minimum number of discrete gear tooth force elements needed to produce accurate mean and peak tooth loads. The optimum number of slices was determined to be 35, as shown in Figure 13. Accurate peak and mean tooth loads are needed for a gear designer to measure the gear design parameter KHβ [11]. An increase, from 3 to 35 gear slices, was found to increase computation time by 32%.
The results from the planetary stage model, P1, are compared to the rigid model M1A in Figure 14. As can be seen, P1 does not capture the 1p cyclical load variation observed in the field data and in M1A. Therefore, the simplified model cannot capture cyclical planet load share.
Figure 13: Ring tooth load convergence within 1.5% using
35 gear slices
Figure 14: Planet B upwind load comparison for dyno test
case 1
Figure 15 and Figure 16 show model-to-test comparisons for test case 1 from dynamometer testing. For the upwind bearings shown in Figure 15, all models capture the bearing loading well. Yet, the out-of-phase loading of the downwind row shown in Figure 16 is only captured by the fully flexible models, M3B and P2. This suggests that to accurately capture this dynamometer loading scenario, the flexibility of the carrier, pins, and shafts is necessary. Model P2 produces the best correlation to absolute load values,
0 20 40 60280
300
320
340
360
380
400
420
Time [sec]
Torq
ue [k
Nm
]
Field Dyno
0 5 10 15 20 25 30 35 40 45 50 55 60Number of Gear Slices
Toot
h Lo
ad
MeanPeak
0 50 100 150 200 250 300 35050
100
150
200
250
300
350Planet B Upwind Load
Carrier Rotation [deg]
Forc
e [k
N]
P1M1ATest

8
although the range or time series load variation is more accurately shown by the dynamic simulations. As noted earlier, model P2 includes a model of the masses and inertias of the dynamometer test setup, and includes more advanced bearing models. This highlights the importance of accurate boundary conditions and bearing stiffness in simulation.
Figure 15: Dyno test (case 1) planet A upwind loading
comparison
Figure 16: Dyno test (case 1) planet C downwind loading
comparison
For the field data, planet-bearing loading results from Models 1 and 2 were determined to be satisfactory. The results for planet C upwind and downwind loading are shown in Figure 17 and Figure 18, respectively. As shown previously, the bearing clearances in the planetary stage bearings have a negligible effect on the output value, as expected. M1A and M1B do a good job predicting the 1p cyclical load share of the bearings, with a mean value
prediction within 10%‒20% of the test mean load. Model 2 is able to predict the maximum load within 5% for upwind and downwind bearings. Both models over-predict the mean downwind bearing load by approximately 20%. It is expected that a better characterization of the rotor-side bending loads and pin to carrier stiffness would rectify this discrepancy.
Figure 17: Field test (case 2) planet C upwind bearing load
comparison
Figure 18: Field test (case 2) planet C downwind bearing
load comparison
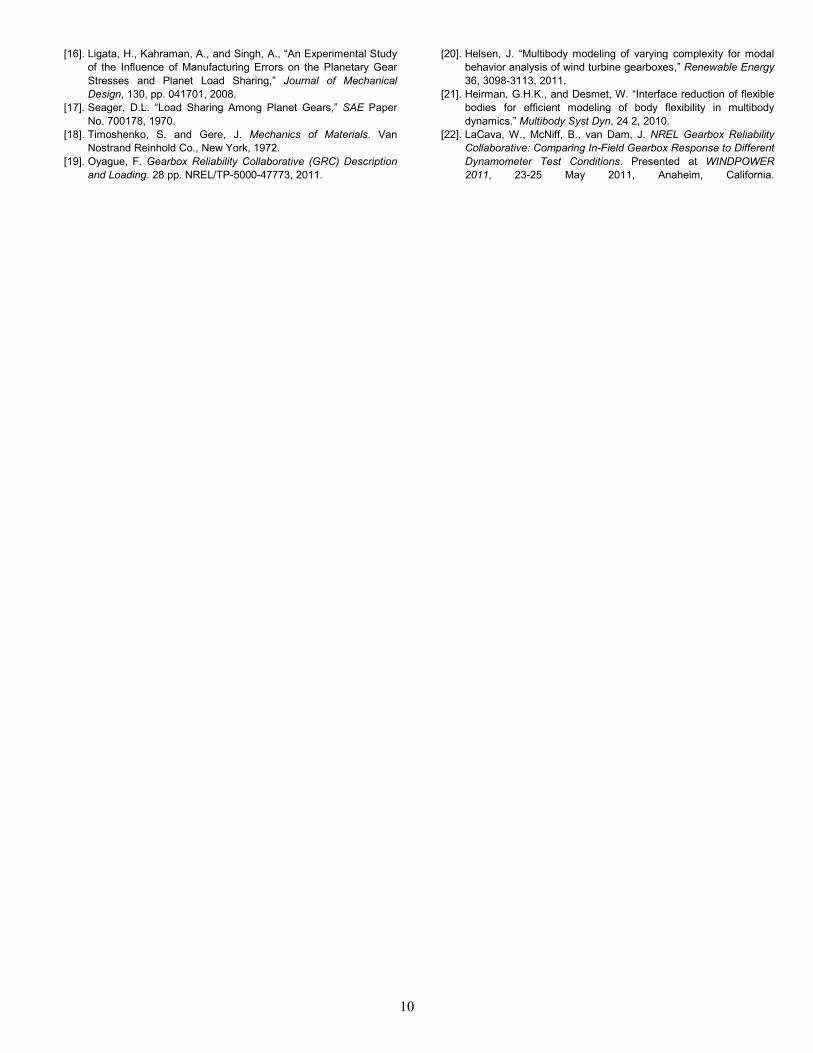
For the five levels of model fidelity, a cost comparison in terms of number of DOF and computation time is shown in Figure 19. Because of the large numbers of modes retained for the carrier and housing in Models 2 and 3, and the low number of modes retained for beam elements in Model 3, there is only a 26% change in the number of degrees of freedom between Model 2 and 3. The improved accuracy of the flexible model for the dynamometer test case therefore comes at a low cost. Conversely, there is a
0 50 100 150 200 250 300 35050
100
150
200
250
300
350
Carrier Rotation [deg]
Forc
e [k
N]
Planet A Upwind Tangential
TestM1AM1BM3BP2
0 50 100 150 200 250 300 35050
100
150
200
250
300
350
Carrier Rotation [deg]
Forc
e [k
N]
Planet C Downwind Load
TestM1AM1BM3BP2
0 50 100 150 200 250 300 35050
100
150
200
250
300
350
Carrier Rotation [deg]
Forc
e [k
N]
Planet C Upwind Load
TestM1AM1BM2AM2B
0 50 100 150 200 250 300 35050
100
150
200
250
300
350
Carrier Rotation [deg]
Forc
e [k
N]
Planet C Downwind Load
TestM1AM1BM2AM2B
9
small improvement in accuracy between Model 1 and 2, whereas computation time increases by nearly 400%. For test cases that show similar upwind and downwind loading of the planet bearings like the field test presented here, the rigid model is therefore a cost-effective option.
Figure 19: Cost comparison of different models
6 Conclusions Choosing the correct level of gearbox model
complexity is essential for simulating the dynamics of wind turbine gearboxes efficiently and accurately. GRC gearbox test data supports the need to include tilting of the gear axes in order to accurately simulate planet-bearing load share and planetary gear tooth loads. Test data also shows significant differences in upwind and downwind loading, which means independent bearing loading should be assumed when using ISO 281. Dynamometer and field testing have shown significant planet-loading differences which may be due to the weight of the rotor. Simulating bending in the dynamometer is a promising way to account for this.
In simulation, the number of gear slices needed to produce convergence on peak and mean tooth loads is presented. A total gearbox model is needed to capture the observed 1p cyclical load share. Simulated planet-bearing loads are sensitive to the scope of the model and the bearing stiffness. A full dynamometer model gives the best average value comparison for the planet-bearing rows. A more advanced bearing stiffness model may also improve results, as seen in model P2; however, inclusion of bearing clearance in the planetary stage has a negligible effect on planet-bearing load prediction. More work is needed to understand the effect that using different clearances among the bearings may have. Generally, the fully flexible gearbox model better simulates the dynamometer loading conditions. However, in the field case, when planet-bearing loads are in phase, a rigid model may be considered since there is a large cost advantage. It is recommended that the designer verify the bearing row loading with the test data and high
fidelity modeling before reducing for cost since large variations in load have been observed in some cases.
7 Acknowledgements The authors would like to thank Jonathan Keller,
Brian McNiff, and the GRC team at NREL for their contributions to this paper. The authors would also like to acknowledge Romax Technology Ltd. and SIMPACK for their contributions. The Gearbox Reliability Collaborative project at the National Renewable Energy Laboratory, Golden, Colorado, is funded by the Wind and Water Power Program of the U.S. Department of Energy. Collaborative work was financially supported by the Centre for Ships and Ocean Structures at the Faculty of Science and Technology, Norwegian University of Science and Technology, Trondheim, Norway.
References [1]. Link, H., LaCava, W., van Dam, J., McNiff, B., Sheng, S., Wallen,
R., McDade, M., Lambert, S., Butterfield, S., and Oyague, F. Gearbox Reliability Collaborative Project Report: Findings from Phase 1 and Phase 2 Testing. 88 pp. NREL/TP-5000-51885, 2011.
[2]. Musial, W., Butterfield, S., and McNiff, B. “Improving Wind Turbine Gearbox Reliability.” Presented at the 2007 European Wind Energy Conference, 7‒10 May 2007, Milan, Italy.
[3]. Rigaud, E. and Sabot, J. Effect of elasticity of shafts, bearings, casing and couplings on the critical rotational speeds of a gearbox. VDI Berichte, 1230, pp. 833–845, 2007.
[4]. Heege, A., Betran, J., and Radvcic, Y. “Fatigue load computation of wind turbine gearboxes by coupled finite element, multi-body system and aerodynamic analysis.” Wind Energy, 10:395-413, 2007.
[5]. Craig, R.R. “A review of time domain and frequency domain component mode synthesis methods.” Proceedings of the joint mechanics conference, Albuquerque, NM; 1985.
[6]. Craig, R.R., and Bampton, M. “Coupling of substructures for dynamic analysis.” AIAA Journal; 6:1313‒1319, 1968.
[7]. Oyague, F., Butterfield, C.P., and Sheng, S. Gearbox Reliability Collaborative Analysis Round Robin: Preprint. 23 pp. NREL/CP-500-45325, 2009.
[8]. Oyague, F., Gorman, D., and Sheng, S., NREL Gearbox Reliability Collaborative Experimental Data Overview and Analysis, Windpower 2010 Conference and Exhibition, Dallas, TX, NREL/CP-500-48232, May 23‒26 2010.
[9]. van Dam, J. Gearbox Reliability Collaborative Bearing Calibration. NREL/TP-5000-47852, 32 pp., 2011.
[10]. American Gear Manufacturers Association, ANSI/AGMA 6123-BXX, “Design Manual for Enclosed Epicyclic Gear Drives,” AGMA, Virginia, 2006.
[11]. International Organization for Standardization: ISO 6336-1:2010 “Calculation of load capacity of spur and helical gears,” ISO Geneva CH, 2010.
[12]. Hidaka, T., Terauchi, Y., and Dohi, K., “On the Relation Between the Run-Out Errors and the Motion of the Center of Sun Gear in a Stoeckicht Planetary Gear,” Bulletin of the JSME, 22, pp. 748‒754, 1979.
[13]. Singh, A. “Load sharing behavior in epicyclic gears: Physical explanation and generalized formulation.” Mechanism and Machine Theory, Volume 45, pp. 511-530, October 2009.
[14]. International Organization for Standardization: ISO 281:2007(E) “Rolling bearings — Dynamic load ratings and rating life,” ISO Geneva CH, 2007.
[15]. Singh, A. “Epicyclic Load Sharing Map—Development and validation.” Mechanics and Machine Theory, Volume 46, Issue 5, pp. 632‒646, May 2011.
0 100 200 300 400 500 600 700 800
0.0E+0
2.0E+3
4.0E+3
6.0E+3
8.0E+3
1.0E+4
1.2E+4
1.A 1.B 2.A 2.B 3.B D
egre
es o
f Fre
edom
Com
puta
tion
Tim
e [s
ec]
Computation Time #DOF
10
[16]. Ligata, H., Kahraman, A., and Singh, A., “An Experimental Study of the Influence of Manufacturing Errors on the Planetary Gear Stresses and Planet Load Sharing,” Journal of Mechanical Design, 130, pp. 041701, 2008.
[17]. Seager, D.L. “Load Sharing Among Planet Gears,” SAE Paper No. 700178, 1970.
[18]. Timoshenko, S. and Gere, J. Mechanics of Materials. Van Nostrand Reinhold Co., New York, 1972.
[19]. Oyague, F. Gearbox Reliability Collaborative (GRC) Description and Loading. 28 pp. NREL/TP-5000-47773, 2011.
[20]. Helsen, J. “Multibody modeling of varying complexity for modal behavior analysis of wind turbine gearboxes,” Renewable Energy 36, 3098-3113, 2011.
[21]. Heirman, G.H.K., and Desmet, W. “Interface reduction of flexible bodies for efficient modeling of body flexibility in multibody dynamics.” Multibody Syst Dyn, 24 2, 2010.
[22]. LaCava, W., McNiff, B., van Dam, J. NREL Gearbox Reliability Collaborative: Comparing In-Field Gearbox Response to Different Dynamometer Test Conditions. Presented at WINDPOWER 2011, 23-25 May 2011, Anaheim, California.
Related Documents