Tufts Data Lab 1 Raster Risk Assessment: Determining the Risk of Malaria Transmission in Ethiopia Written by Carolyn Talmadge and Madeline Wrable 4/6/2016 Introduction ............................................................................................................................................................................ 1 Accessing the Data and Preparing for the Tutorial ................................................................................................................... 1 Setting the Extent, Cell Size, and Snap Raster .......................................................................................................................... 2 Overview of the Analysis ......................................................................................................................................................... 3 Examining Distance to Rivers .................................................................................................................................................. 4 Creating a Slope Preference Grid ............................................................................................................................................. 7 Reclassifying Elevation ............................................................................................................................................................ 8 Reclassifying Land Cover ......................................................................................................................................................... 9 Creating Density Layer of Health Clinics ................................................................................................................................ 10 Using Raster Calculator to Create a Risk/Vulnerability Assessment ....................................................................................... 12 Using Zonal Statistics to Determine the Most to Least At Risk Zones. ................................................................................... 15 Introduction Malaria is a serious, acute illness transmitted via the bite of a mosquito. Symptoms include fever, headache, backache, joint pains, and vomiting. If not treated, malaria can quickly become life threatening. According to the World Health Organization (WHO), about 75% of the land and 60% of the population is exposed to malaria in Ethiopia. The purpose of this analysis is to determine the overall risk of Malaria transmission throughout Ethiopia, when considering the following factors: Proximity to Water bodies – This is a “water related” disease because it is transmitted via mosquitos who like to breed near waterbodies. Elevation – Elevation is directly linked to climate, and mosquitos prefer warmer climates and lower elevations, which increase population turnover. Slope – Gentle slopes equal higher susceptible areas for malaria incidence Land Cover – Mosquitos prefer damp areas, so land cover will affect the analysis. Accessibility of Health Clinics – If not treated, malaria can quickly become life threatening. Therefore, access to health clinics and hospitals will greatly affect the populations’ vulnerability. Accessing the Data and Preparing for the Tutorial 1. The data is stored in S:\Tutorials & Tip Sheets\Tufts\Tutorial Data\Malaria_Ethopia_RiskAnalysis. Copy the entire folder to your H: drive. 2. You need to make the copied folder “writable” – to do this, right-click on the folder in your H:, choose Properties, and uncheck the Read-Only box. When prompted say yes to apply to subfolders.

Welcome message from author
This document is posted to help you gain knowledge. Please leave a comment to let me know what you think about it! Share it to your friends and learn new things together.
Transcript

Tufts Data Lab
1
Raster Risk Assessment: Determining the Risk of Malaria Transmission in Ethiopia
Written by Carolyn Talmadge and Madeline Wrable 4/6/2016
Introduction ............................................................................................................................................................................ 1
Accessing the Data and Preparing for the Tutorial ................................................................................................................... 1
Setting the Extent, Cell Size, and Snap Raster .......................................................................................................................... 2
Overview of the Analysis ......................................................................................................................................................... 3
Examining Distance to Rivers .................................................................................................................................................. 4
Creating a Slope Preference Grid ............................................................................................................................................. 7
Reclassifying Elevation ............................................................................................................................................................ 8
Reclassifying Land Cover ......................................................................................................................................................... 9
Creating Density Layer of Health Clinics ................................................................................................................................ 10
Using Raster Calculator to Create a Risk/Vulnerability Assessment....................................................................................... 12
Using Zonal Statistics to Determine the Most to Least At Risk Zones. ................................................................................... 15
Introduction
Malaria is a serious, acute illness transmitted via the bite of a mosquito. Symptoms include fever, headache, backache, joint pains, and vomiting. If not treated, malaria can quickly become life threatening. According to the World Health Organization (WHO), about 75% of the land and 60% of the population is exposed to malaria in Ethiopia. The purpose of this analysis is to determine the overall risk of Malaria transmission throughout Ethiopia, when considering the following factors:
Proximity to Water bodies – This is a “water related” disease because it is transmitted via mosquitos who like to breed near waterbodies.
Elevation – Elevation is directly linked to climate, and mosquitos prefer warmer climates and lower elevations, which increase population turnover.
Slope – Gentle slopes equal higher susceptible areas for malaria incidence
Land Cover – Mosquitos prefer damp areas, so land cover will affect the analysis.
Accessibility of Health Clinics – If not treated, malaria can quickly become life threatening. Therefore, access to health clinics and hospitals will greatly affect the populations’ vulnerability.
Accessing the Data and Preparing for the Tutorial
1. The data is stored in S:\Tutorials & Tip Sheets\Tufts\Tutorial Data\Malaria_Ethopia_RiskAnalysis. Copy the entire folder to your H: drive.
2. You need to make the copied folder “writable” – to do this, right-click on the folder in your H:, choose Properties, and uncheck the Read-Only box. When prompted say yes to apply to subfolders.

Tufts Data Lab
2
3. Open the Malaira_Ethopopia_RiskAnalysis folder and double-click on MalariaRiskAnalysis.mxd – this will start ArcMap with the layers already added.
4. In ArcMap, go to Customize Extensions checkmark Spatial Analyst. You must do this on any computer whenever you plan to use spatial analyst tools!
5. Take a couple minutes to explore the different data sets.
Setting the Extent, Cell Size, and Snap Raster
When performing raster-based overlay analysis, it is very important to set the extent of the analysis, the cell size, and the mask. You can set these options before the analysis by going to Geoprocessing Environments.
Note: You have to set this with each session of ArcMap you start.
1. Click on Geoprocessing and select Environments…
2. In the Environment Setting box, click on Processing Extent to set the Extent to “Same as layer Ethopia_Country”
3. Scroll down further and click on Raster Analysis. Set the Cell Size to 3000. This means each cell is 3000 meters by 3000 meters.
4. Set the Mask to Ethiopia_Country.
6. Click OK to exit back to the map.

Tufts Data Lab
3
Overview of the Analysis
Here are the analysis steps you will follow to determine risk of malaria transmission throughout Ethiopia:
1. Rivers Euclidean Distance Reclassify 1-5 for distance preference (close = High Risk (5))
2. Elevation (DEM) layer Reclassify for elevation preferences (low elevations= Right Risk (5))
3. Elevation (DEM) layerDerive slope Reclassify for slope preferences (low slope= High Risk (5)) 4. Land Cover layer Reclassify 1-5 for land cover preferences
5. Health Centers layer Kernel Density Reclassify 1-5 for density preferences (low density = High Risk (5))
6. Use Raster calculator to combine the 5 reclassified layers. Do so for un/weighted calculations. 7. Use Zonal Statistics to determine the average un/weighted risk per Malaria Zone (Admin2). 8. Here are the reclassification schemes you will use: NOTE that HIGH RISK (BAD) is a 5
Here is a flow chart showing the same process:

Tufts Data Lab
4
Examining Distance to Rivers
Distance to water sources, such as rivers, is a very important part of the analysis since malaria is a “water related” disease. This means it is transmitted via mosquitos who like to breed near waterbodies. Therefore, the closer one is to water bodies, the higher the risk for contracting malaria.
1. In ArcToolbox, navigate to Spatial Analyst Tools Distance and double click on Euclidean Distance.
2. Fill the tool out as follows.
Choose Rivers_Ethiopia as the Input Raster.
Set the Output Raster to your H: drive with the name Dist_Rivers.
Leave the rest of the defaults. You will notice that the cell size is properly set to 3000 because we set it in the Geoprocessing Environments already.
Note: it is VERY important that there are no spaces in the entire file path or name. Raster tools will fail if this is the case.
After the process is completed, you will see the Dist_River add to your Table of Contents. The result is a raster grid, in which each cell is the distance from the closest river in meters (units determined by projection units).
3. In ArcToolbox, navigate to Spatial Analyst Tools Reclass and double click on Reclassify.
Now, we will use the reclassify tool to reclassify, or change the distance cell values to 1 to 5 to indicate low to high risk based of the distance to rivers based on the following classification break values.
Remember: These distance values we need to reclassify are in meters!

Tufts Data Lab
5
Distance Values Reclassify Values
(Ranking)
< 1 Mile (1609 m) 5 – Very High Risk
1 – 5 Miles (8046 m) 4 – High Risk
5-25 Miles (40233 m) 3 – Moderate Risk
25-75 Miles (120701 m) 2 – Low Risk
>75 Miles 1 – Very Low Risk
4. Set up the Reclassify tool as follows:
Set input raster to Dist_Rivers and keep the Reclass field as Value.
Click Classify to set the class values.
Set the number of classes to 5.
Set the Break Values (located on the right) to 1609, 8046, 40233, 120701, and leave max (as broken down in table above). Press OK to exit out of the Classification box.
Click Reverse New Values. This is IMPORTANT because it gives values with a short distance to rivers (0-1609m aka 1 mile) a high risk score of 5, while longer distances (120701m aka > 75 miles) a low risk score of 1.
Name the output Reclas_Rivers. It is important to change the name because there will be a lot of reclass layers by the end of the tutorial.

Tufts Data Lab
6
The Reclass_wind will appear automatically in your table of contents, but the colors aren’t helpful to interpretation.
5. Double click on the layer and then the symbology tab, assign a sequential color ramp – such blue to red. In this case, make sure that red shows high risk areas.
6. 16. Save your MalariaRiskAnaylsis.mxd. mapfile in your H Drive

Tufts Data Lab
7
Creating a Slope Preference Grid
Since stagnant water is a great breeding ground for mosquitos, low slopes are more likely to have higher risk of malaria because it allows water to pool. You’ll make a slope map from the elevation data (DEM_1km), and then reclassify it into a slope preference grid.
1. Turn on DEM_1km and turn off all other layers except Ethopia_Country.
2. In ArcToolbox, navigate to Spatial Analyst Tools Surface and double-click on Slope.
3. Fill out the dialog box as you see here. Be sure to give it the name Slope. You want a slope grid that shows PERCENT_RISE, not Degrees!
4. Click OK. Let the process run. The result is a slope grid where each cell is the percent slope. Give it the same color gradient for easy comparison.
5. Now, using the same steps as reclassify the distance to rivers, reclassify your slope using the break values below. Remember to reverse your break values so low slope = high risk (5). Save your output raster in your H drive and call it Reclass_Slope.
Slope Values Reclassify Values (Ranking)
< 2% 5 – Very High Risk
2 – 5 % 4 – High Risk
5 – 12% 3 – Moderate Risk
12 – 20% 2 – Low Risk
>20% 1 – Very Low Risk
6. Change the symbology to the same blue to red color scheme for easy comparison. Your reclassified slope layer should look like the following.

Tufts Data Lab
8
7. Save your map file.
Reclassifying Elevation
Elevation is an important factor when determining the overall risk for malaria transmission. Low elevations pose a higher risk because temperatures are generally warmer at lower elevations, resulting in a quicker life cycle and more breading for mosquitos. High elevations are often colder, resulting in fewer mosquitos.
1. Since we are interested in specific elevations, the DEM_1km (Digital Elevation Level) can be directly reclassified to reflect these specific ranges. We do not need to run any tool (such as Euclidean distance or slope) before reclassifying, since this layer already represents elevation.
2. We will reclassify the Elevation layer using the following ranges (meters). Open the reclassify tool and use the same methods as shown in the previous steps to change the break values. Remember to reverse your break values so low elevations = high risk (5) and high elevations = low risk (1). Save your output raster in your H drive and call it Reclass_DEM.
Elevation Values Reclassify Values
(ranking)
<0 m 5 – Very high risk
0 - 500m 4
500 - 1200m 3
1200 - 3000m 2
>3000 m 1 – Very low risk
3. Change the symbology to the same blue to red color scheme for easy comparison. Your reclassified DEM layer should look like the following:

Tufts Data Lab
9
Reclassifying Land Cover
Mosquitos also thrive in specific land covers (moist areas, such as wetlands), but die off quickly in others (deserts or barren land). Therefore, the type of land cover will certainly affect the risk for malaria transmission.
1. Similarly to elevation, LandCover can be directly reclassified without the need to run any other tool beforehand. However, since land cover is categorical data, and not numerical, the process of reclassifying is a bit different.
2. Open the reclassify tool. We will use the following land cover categories and reclassify them into their appropriate ranking.
3. In the input field, select Land Cover and keep the Reclass field as CLASS_NAME.
4. Since this is “categorical” data, you will notice the classify button is grayed out. We will directly type reclassified values for each land cover right into the Reclassification Table. Use the above Land Cover Types and associated values and keep no data as nodata.
5. Name the new layer Reclass_LC. The tool set up should look like the following:
Land Cover Types Reclassify Values
(ranking)
Water and All Wetlands 5 – Very high risk
Croplands and Natural Vegetation 4
All Shrublands, All Grasslands, and all Savannas
3
All Forests, Urban/Built up 2
Snow/Ice, Barren 1 – Very low risk

Tufts Data Lab
10
Creating Density Layer of Health Clinics
If not treated, malaria can quickly become life threatening. Therefore access to health clinics and hospitals in the area would greatly affect the populations’ vulnerability. We will use the kernel density tool to create a raster layer that represents access to health care. We will use the kernel density tool instead of euclidean distance because areas with many hospitals/health clinics will likely be less vulnerable than areas with only 1 health clinic. In this case, the number or density of health clinics will model access to health care. 1. Turn on HealthCenters and turn off the other layers so you can see it.
2. In ArcToolbox, navigate to Spatial Analyst Tools Density Kernel Density.
3. Fill out the dialog box as you see here and call the new layer Dens_Health
Tufts Data Lab
11
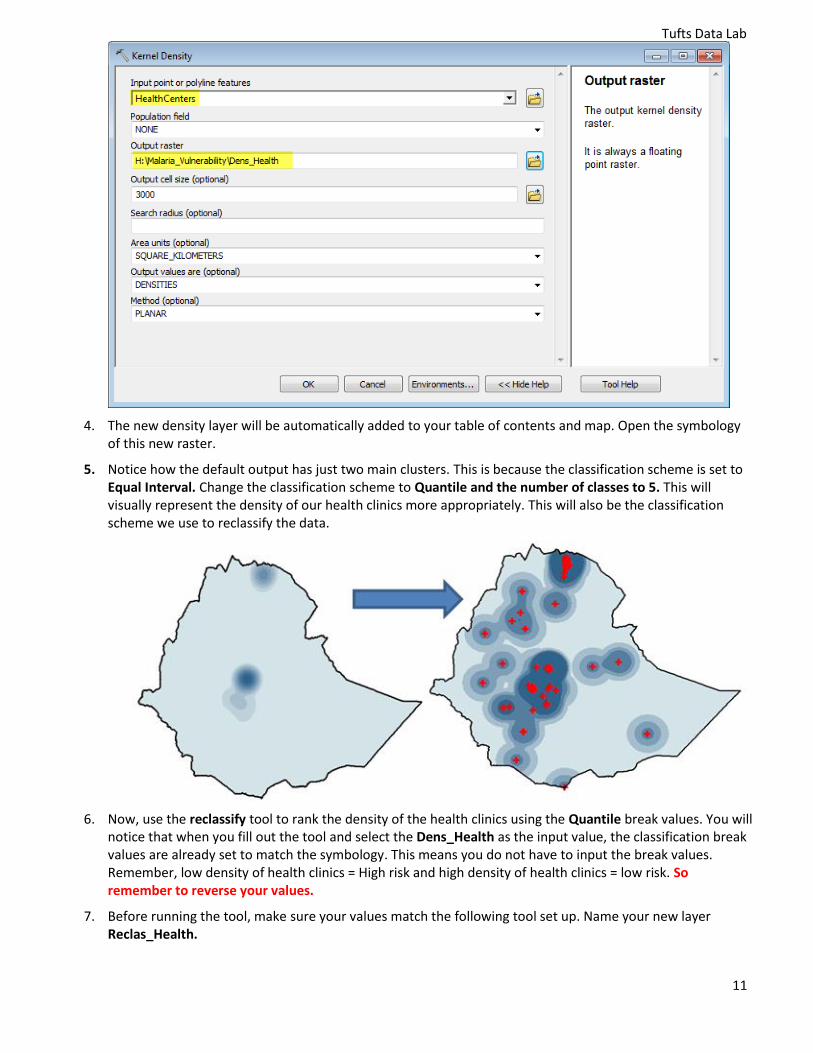
4. The new density layer will be automatically added to your table of contents and map. Open the symbology of this new raster.
5. Notice how the default output has just two main clusters. This is because the classification scheme is set to Equal Interval. Change the classification scheme to Quantile and the number of classes to 5. This will visually represent the density of our health clinics more appropriately. This will also be the classification scheme we use to reclassify the data.
6. Now, use the reclassify tool to rank the density of the health clinics using the Quantile break values. You will notice that when you fill out the tool and select the Dens_Health as the input value, the classification break values are already set to match the symbology. This means you do not have to input the break values. Remember, low density of health clinics = High risk and high density of health clinics = low risk. So remember to reverse your values.
7. Before running the tool, make sure your values match the following tool set up. Name your new layer Reclas_Health.

Tufts Data Lab
12
8. Change the symbology to the same blue to red color scheme for easy comparison. Your reclassified Health Center Density layer should look like the following:
9. Save your mapfile.
10. Now we should have the following reclassified rasters: Distance to rivers, slope, elevation, land cover, and density of health clinics.
Using Raster Calculator to Create a Risk/Vulnerability Assessment
Now that we have all the individual factors reclassified using the same ranking scale, 1(low risk) to 5 (high risk), we can use the raster calculator to combine the layers to create a final vulnerability or risk score.
We will create both an unweighted Vulnerability Score and a weighted Vulnerability Score.

Tufts Data Lab
13
Creating a Unweighted Vulnerability Score We will use a tool called Raster Calculator to combine our reclassified grids.
1. In ArcToolbox, navigate to Spatial Analyst Tools Map Algebra and open Raster Calculator.
2. Follow the diagram below to create an “Additive Model”. In this type of unweighted model, all values are ranked equally by simply adding them together. Therefore, the final raster will have values that range from 5 (lowest possible risk) to 25 (highest possible risk).
3. Fill out the raster calculator as follows and all the unweighted raster Risk_Add.
4. Change the symbology to match the same blue to red color scheme. Your final unweighted Vulnerability Assessment should look like the following map, with values ranging from 8 to 25.

Tufts Data Lab
14
Creating a Weighted Vulnerability Score If one of your “factors” is more important in a given analysis, we can create what’s called a weighted grid. We can use the Raster Calculator again to give different weights to each layer and create a weighted grid –as follows:
Distance to Rivers is the most important factor (weighted 30%)
Slope is the next most important factor (weighted 25%)
Land cover is an equally important factor (weighted 25%)
Elevation is somewhat less important (weighted 15%)
Hospitals are least important (5%)
1. In ArcToolbox, navigate to Spatial Analyst Tools Map Algebra and open Raster Calculator.
2. Follow the diagram below to create a “Weighted Model”. In this type of weighted model, all values multiplied by their weight percentages and then added together. With this type of raster, the hightest possible value will be a 5 and the lowest possible value will be a 1.
3. Fill out the raster calculator as follows and call it Risk_Weight.
Note: Always use the “buttons” to add to the expression box!
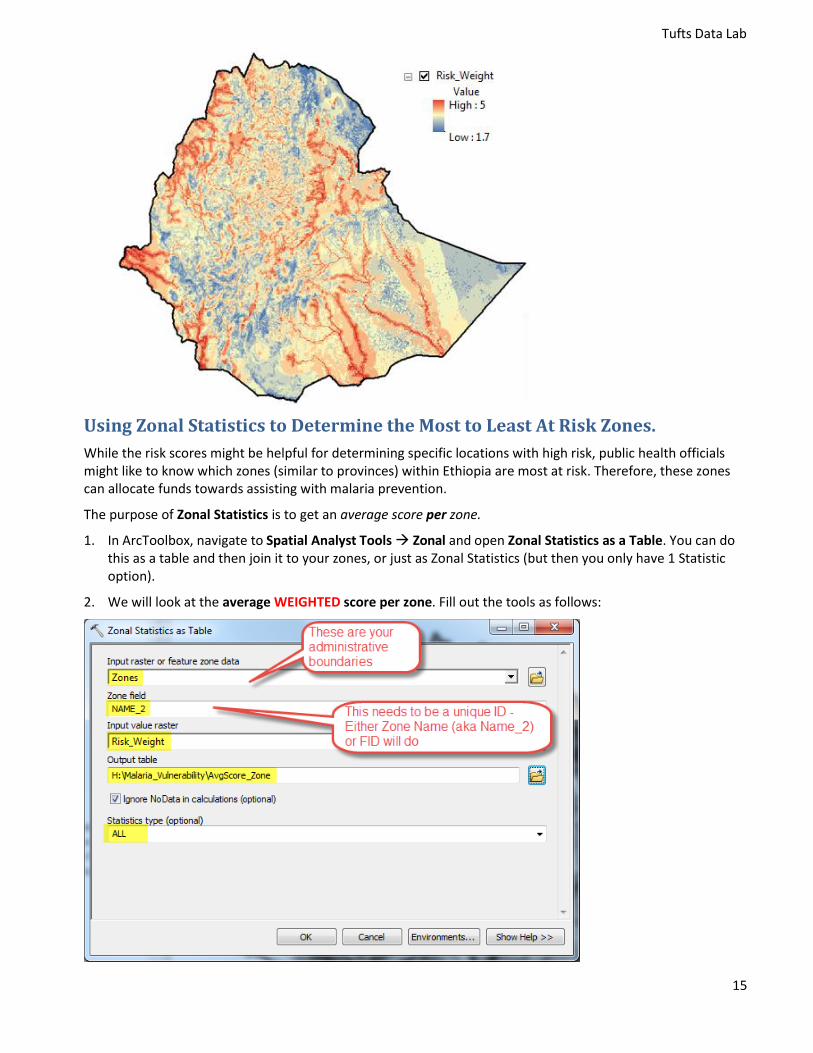
4. The result is a grid where the values have a continuous value from 1.7 to 5. Change the color ramp to the blue to red one we have been using for consistency. It should look something like this:
Tufts Data Lab
15
Using Zonal Statistics to Determine the Most to Least At Risk Zones.
While the risk scores might be helpful for determining specific locations with high risk, public health officials might like to know which zones (similar to provinces) within Ethiopia are most at risk. Therefore, these zones can allocate funds towards assisting with malaria prevention.
The purpose of Zonal Statistics is to get an average score per zone.
1. In ArcToolbox, navigate to Spatial Analyst Tools Zonal and open Zonal Statistics as a Table. You can do this as a table and then join it to your zones, or just as Zonal Statistics (but then you only have 1 Statistic option).
2. We will look at the average WEIGHTED score per zone. Fill out the tools as follows:

Tufts Data Lab
16
3. Your output will be a table showing various statistics about the risk scores per Ethiopia Zone. Now we must join this table to the Zone Shapefile.
4. Right click on Zones and select Joins and Relates… and then Join. Fill out the tool as follows:
5. Say yes when asked if you want to index the data.
6. Now, when you examine the Zones attribute table, all of the statistic information is added to the end of the table.
7. Let’s symbologize on the Mean Score per Zone. Open the symbology properties for the Zones layer.
8. Select Quantities and choose Mean as the value field. In Classify, choose 5 classes and equal interval. Then press ok.
9. Since this is an average, there are a lot of decimal places linked to these average risk scores. In symbology, click on Label. Then, change the number of decimal places to 1 and press ok.

Tufts Data Lab
17
10. Your final Risk Score per Zone map should look like this:
11. Save your map.
12. That’s it! Now we know where the high and low risk for malaria is in Ethiopia with/out weighting and which zones on a whole are at the highest risk. Think about what other factors you might use in analyses of this type.
Related Documents