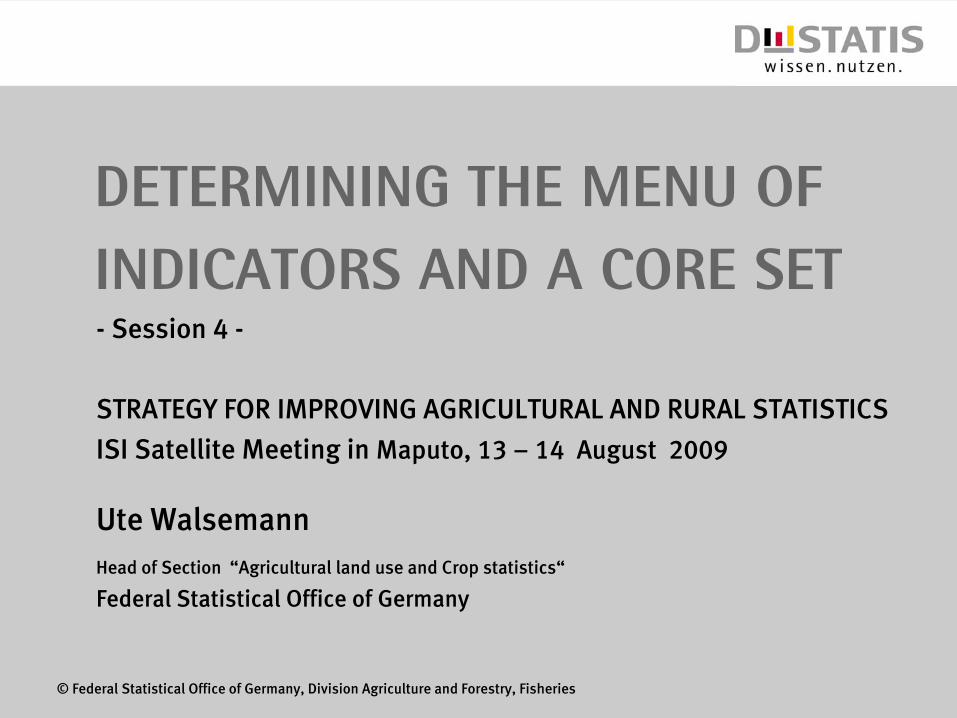
© Federal Statistical Office of Germany, Division Agriculture and Forestry, Fisheries Determining the Menu of Indicators and a Core Set - Session 4 - STRATEGY FOR IMPROVING AGRICULTURAL AND RURAL STATISTICS ISI Satellite Meeting in Maputo, 13 – 14 August 2009 Ute Walsemann Head of Section “Agricultural land use and Crop statistics“ Federal Statistical Office of Germany

Welcome message from author
This document is posted to help you gain knowledge. Please leave a comment to let me know what you think about it! Share it to your friends and learn new things together.
Transcript
© Federal Statistical Office of Germany, Division Agriculture and Forestry, Fisheries
Determining the Menu of Indicators and a Core Set-
Session 4 -
STRATEGY FOR IMPROVING AGRICULTURAL AND RURAL STATISTICS
ISI Satellite Meeting in Maputo, 13 –
14 August 2009
Ute WalsemannHead of Section “Agricultural land use and Crop statistics“
Federal Statistical Office of Germany
12.08.2009 Slide 2© Federal Statistical Office of Germany; Division Agriculture and Forestry, Fisheries - Ute Walsemann
Global Strategy to Improve Agricultural Statistics
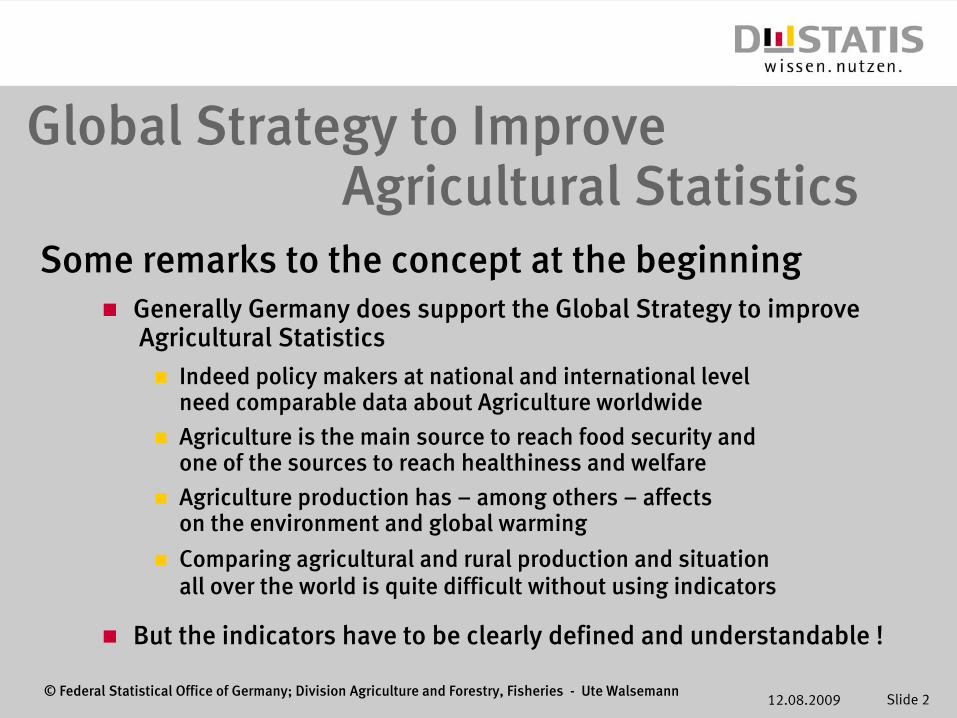
Some remarks to the concept at the beginning Generally Germany does support the Global Strategy to improve Agricultural Statistics
Indeed policy makers at national and international level need comparable data about Agriculture worldwide
Agriculture is the main source to reach food security and one of the sources to reach healthiness and welfare
Agriculture production has – among others – affects on the environment and global warming
Comparing agricultural and rural production and situation all over the world is quite difficult without using indicators
But the indicators have to be clearly defined and understandable !
12.08.2009 Slide 3© Federal Statistical Office of Germany; Division Agriculture and Forestry, Fisheries - Ute Walsemann
Aims to achieve with core indicators in Agricultural Statistics
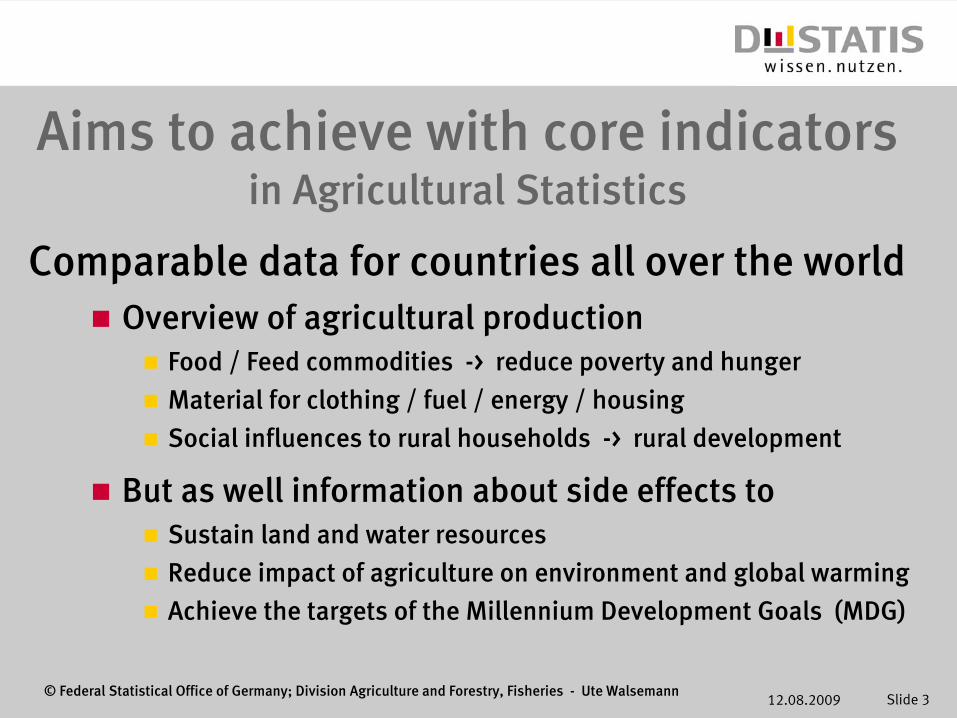
Comparable data for countries all over the worldOverview of agricultural production
Food / Feed commodities -> reduce poverty and hunger
Material for clothing / fuel / energy / housing
Social influences to rural households -> rural development
But as well information about side effects toSustain land and water resources
Reduce impact of agriculture on environment and global warming
Achieve the targets of the Millennium Development Goals (MDG)

12.08.2009 Slide 4© Federal Statistical Office of Germany; Division Agriculture and Forestry, Fisheries - Ute Walsemann
Menu of 19 proposed core indicators - are these the right ones ?Some attributes, core indicators should have
In general Convincing and significant for what they shall describeComparable – as well under different or long-term conditions
Data requirements should be clear and discoverable
Reasonable burden for data suppliers / statisticians
They should support reaching the targets of the MDG
SpecificSome indicators are not clear enough (2, 5, 7, 8, 13)Some indicators are not convincing (5, 7, 8, 13)
Some indicators are not discoverable (13, 18, 19)
12.08.2009 Slide 5© Federal Statistical Office of Germany; Division Agriculture and Forestry, Fisheries - Ute Walsemann
Menu of 19 core indicators -
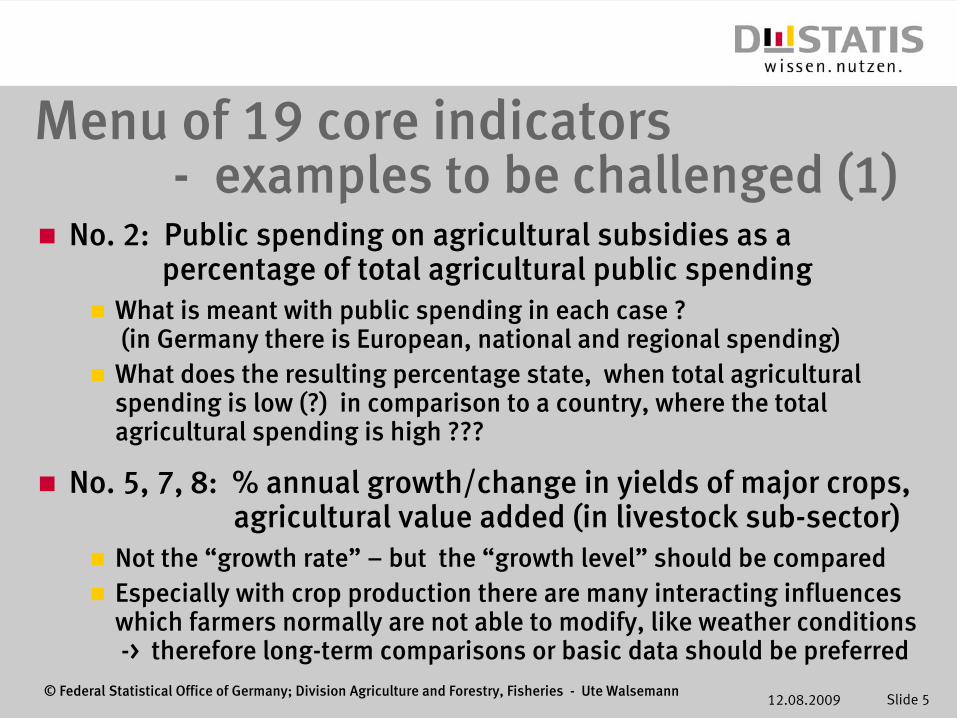
examples to be challenged (1)No. 2: Public spending on agricultural subsidies as a
percentage of total agricultural public spending What is meant with public spending in each case ?(in Germany there is European, national and regional spending) What does the resulting percentage state, when total agricultural spending is low (?) in comparison to a country, where the totalagricultural spending is high ???
No. 5, 7, 8: % annual growth/change in yields of major crops,agricultural value added (in livestock sub-sector)
Not the “growth rate” – but the “growth level” should be compared Especially with crop production there are many interacting influences which farmers normally are not able to modify, like weather conditions -> therefore long-term comparisons or basic data should be preferred

12.08.2009 Slide 6© Federal Statistical Office of Germany; Division Agriculture and Forestry, Fisheries - Ute Walsemann
Harvested production and yield of apples in Germany
1995 2000 2005
Yield in tons per hectareProduction in 1000 tons
30
10
20
1 200
800
400
Year
12.08.2009 Slide 7© Federal Statistical Office of Germany; Division Agriculture and Forestry, Fisheries - Ute Walsemann
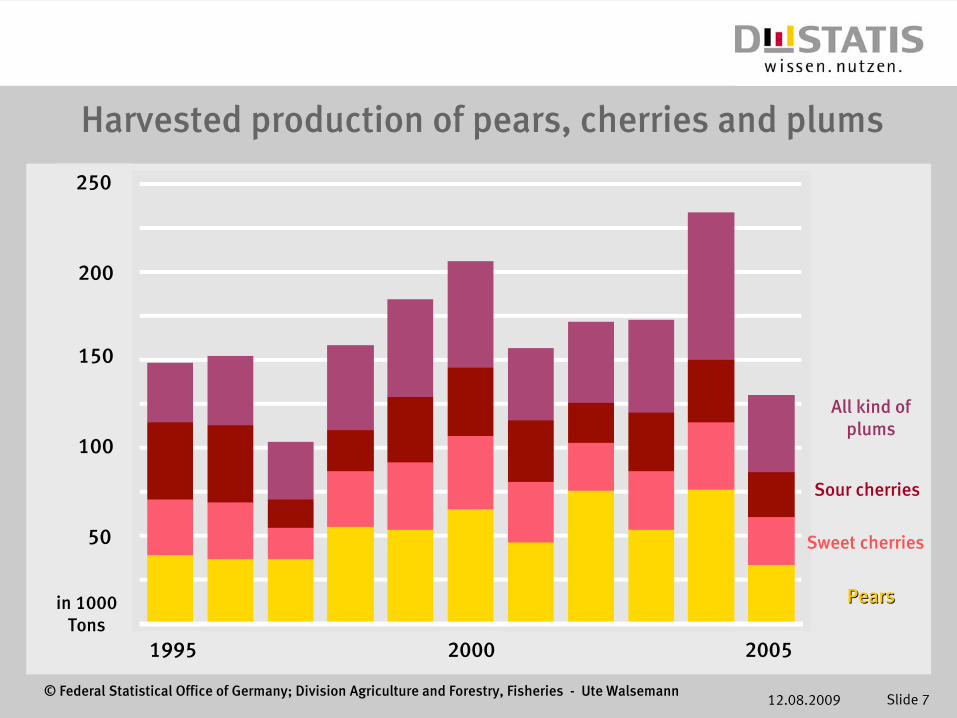
Harvested production of pears, cherries and plums
PearsPears
Sweet cherries
Sour cherries
All kind of plums
1995 2000 2005
100
50
200
150
in 1000 Tons
250

12.08.2009 Slide 8© Federal Statistical Office of Germany; Division Agriculture and Forestry, Fisheries - Ute Walsemann
Menu of 19 core indicators -
examples to be challenged (2)No. 7: % change in yields of major crops of the country
The pictures show the strongly fluctuating yields in fruit production – although sometimes a slightly increasing tendency is to be seen
This underlines the proposal using the “growth level” as the significant indicator – yearly change rates are not convincing /useful
No. 13: % of users who report significance increase in crop yields as a result of provision of irrigation and drainage service
This is a quite subjective question and therefore difficult to interpret
There is no information about irrigation and drainage service at all,which would be more interesting Proposal -> % arable area with irrigation and drainage service
(or % of utilised agricultural area)
12.08.2009 Slide 9© Federal Statistical Office of Germany; Division Agriculture and Forestry, Fisheries - Ute Walsemann
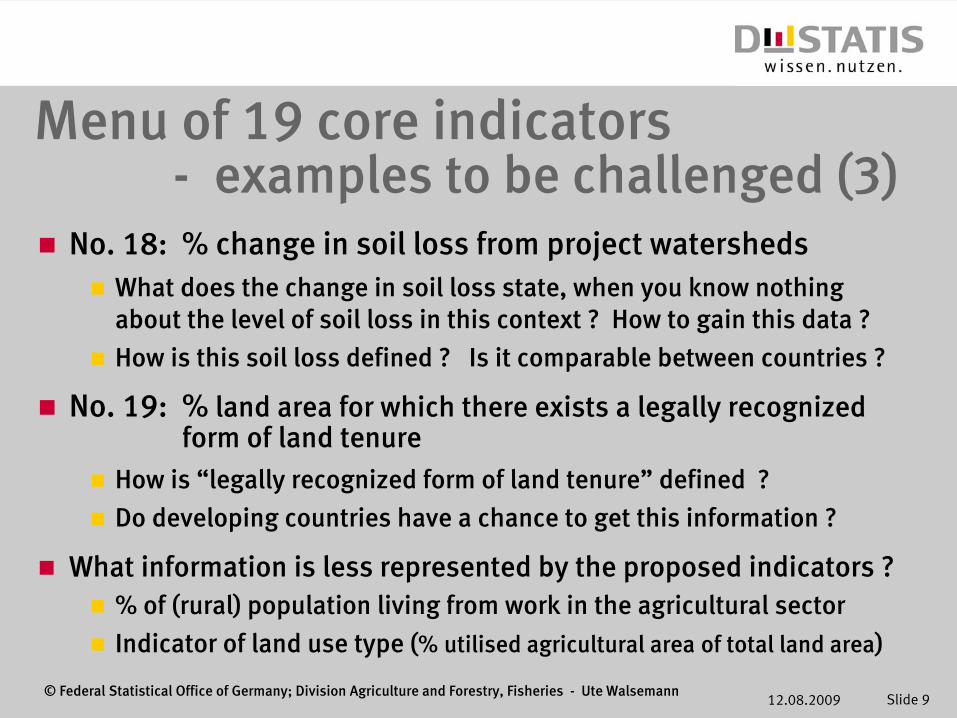
Menu of 19 core indicators -
examples to be challenged (3)No. 18: % change in soil loss from project watersheds
What does the change in soil loss state, when you know nothingabout the level of soil loss in this context ? How to gain this data ?
How is this soil loss defined ? Is it comparable between countries ?
No. 19: % land area for which there exists a legally recognized form of land tenure
How is “legally recognized form of land tenure” defined ?
Do developing countries have a chance to get this information ?
What information is less represented by the proposed indicators ?% of (rural) population living from work in the agricultural sector
Indicator of land use type (% utilised agricultural area of total land area)
12.08.2009 Slide 10© Federal Statistical Office of Germany; Division Agriculture and Forestry, Fisheries - Ute Walsemann
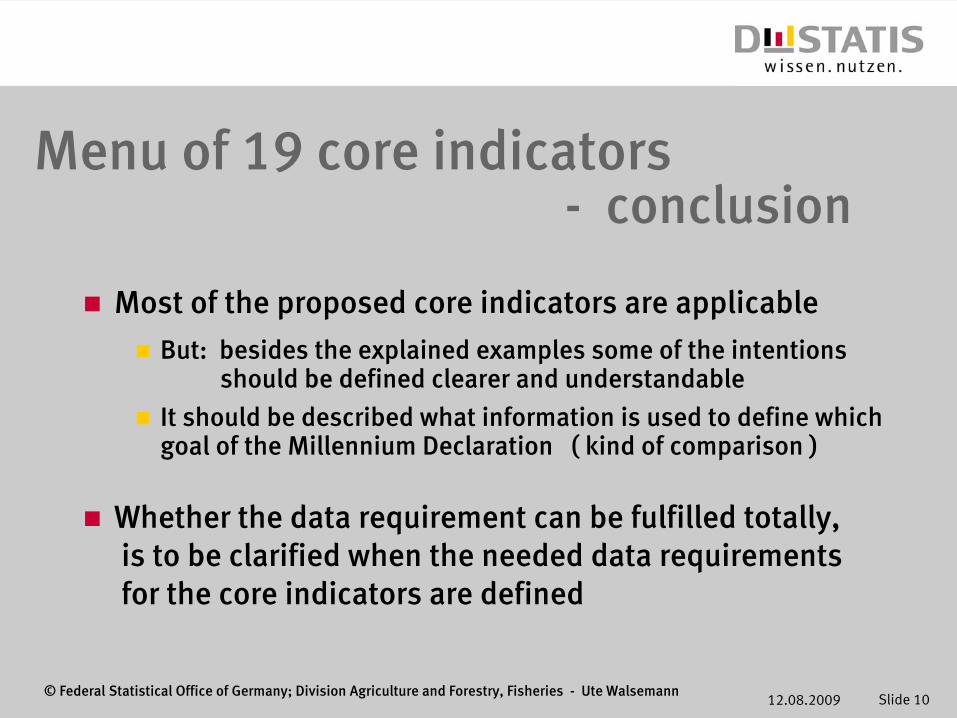
Menu of 19 core indicators - conclusion
Most of the proposed core indicators are applicable
But: besides the explained examples some of the intentions should be defined clearer and understandable
It should be described what information is used to define which goal of the Millennium Declaration ( kind of comparison )
Whether the data requirement can be fulfilled totally,is to be clarified when the needed data requirements for the core indicators are defined

12.08.2009 Slide 11© Federal Statistical Office of Germany; Division Agriculture and Forestry, Fisheries - Ute Walsemann
Some ideas to the core data items and data requirements underlying the core indicators :
First of all the core indicators have to be mostly fixed and definedAll countries worldwide should be able to meet the requirements basically
The possibility of misunderstanding or -interpreting should be unacceptable
Secondly it has to be cleared, what core data items are needed to describe the core indicators
The data items should be discussed and verifyed with regard to definition and relevance referring to the terms of all countries
It should be agreed and well-known, what data items are determining the core indicators and how they are used to calculate the indicators ( table )
Methodology to obtain the core data items shall be almost comparable

12.08.2009 Slide 12© Federal Statistical Office of Germany; Division Agriculture and Forestry, Fisheries - Ute Walsemann
Utilised agricultural area
1949 1971 1991 2007
Total 2
500
000 1
200
000 650
000 375
000
under
10
ha 2
000
000 720
000 320
000 140
000
10
-
50
ha 520
000 420
000 276
000 150
000
50
-
100 ha 16
000 18
000 44
000 53
000
100
ha
and more 4
000 12
000 12
000 32
000
Structure
of agricultural holdings in Germany
12.08.2009 Slide 13© Federal Statistical Office of Germany; Division Agriculture and Forestry, Fisheries - Ute Walsemann
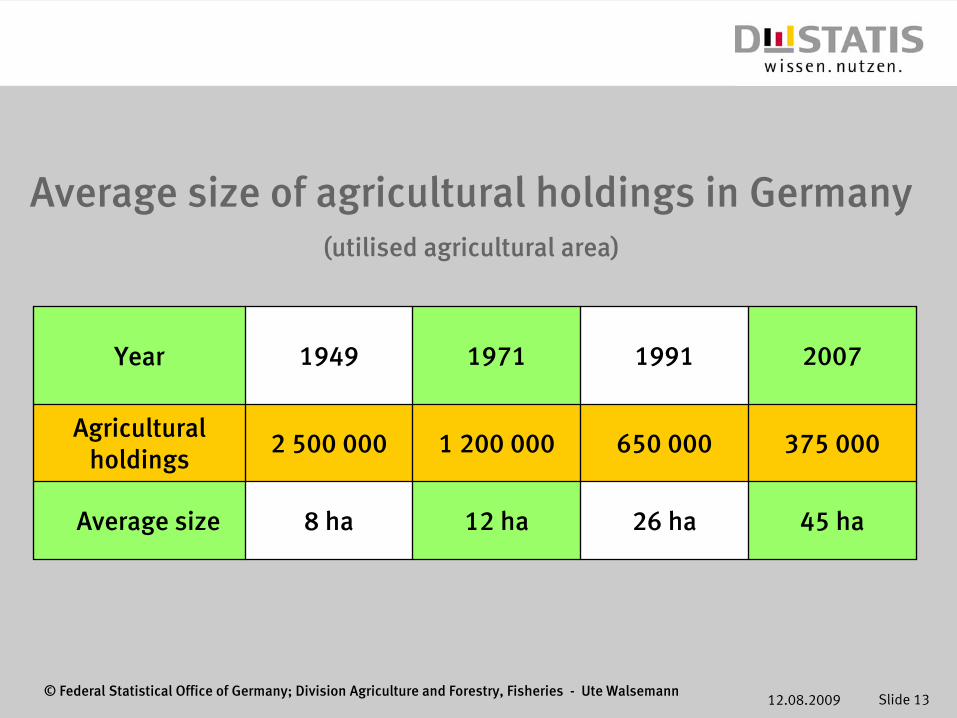
Average size of agricultural holdings in Germany (utilised agricultural area)
Year 1949 1971 1991 2007
Agricultural holdings
2
500
000 1
200
000 650
000 375
000
Average size 8 ha 12
ha 26 ha 45 ha
12.08.2009 Slide 14© Federal Statistical Office of Germany; Division Agriculture and Forestry, Fisheries - Ute Walsemann
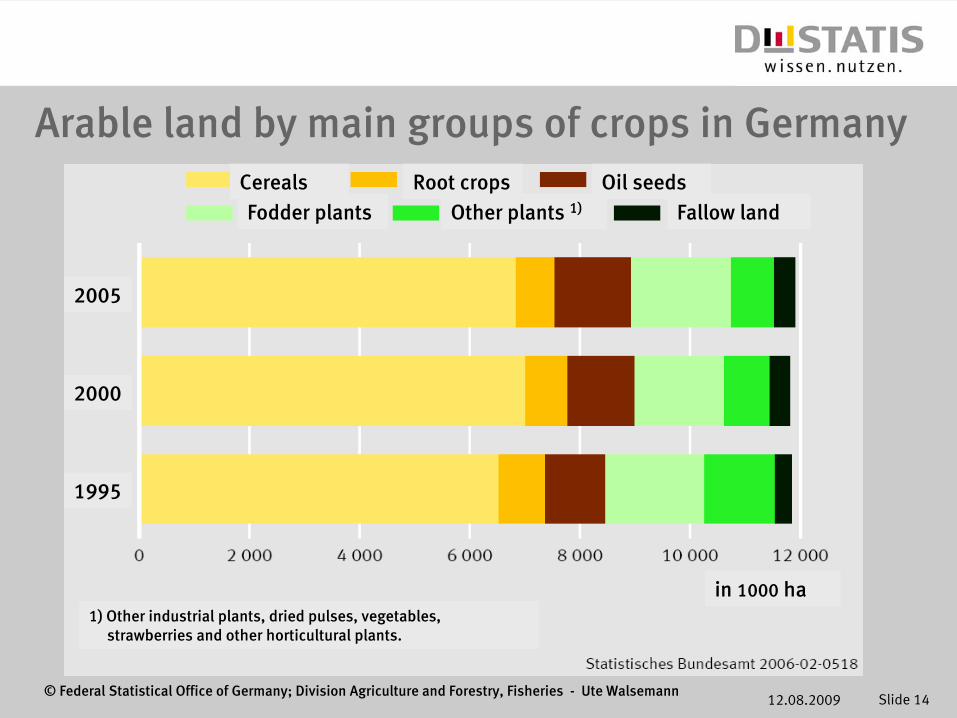
Arable land by main groups of crops in GermanyCereals Root crops Oil seedsFodder plants Fallow landOther plants 1)
1) Other industrial plants, dried pulses, vegetables, strawberries and other horticultural plants.
in 1000
ha
2005
2000
1995
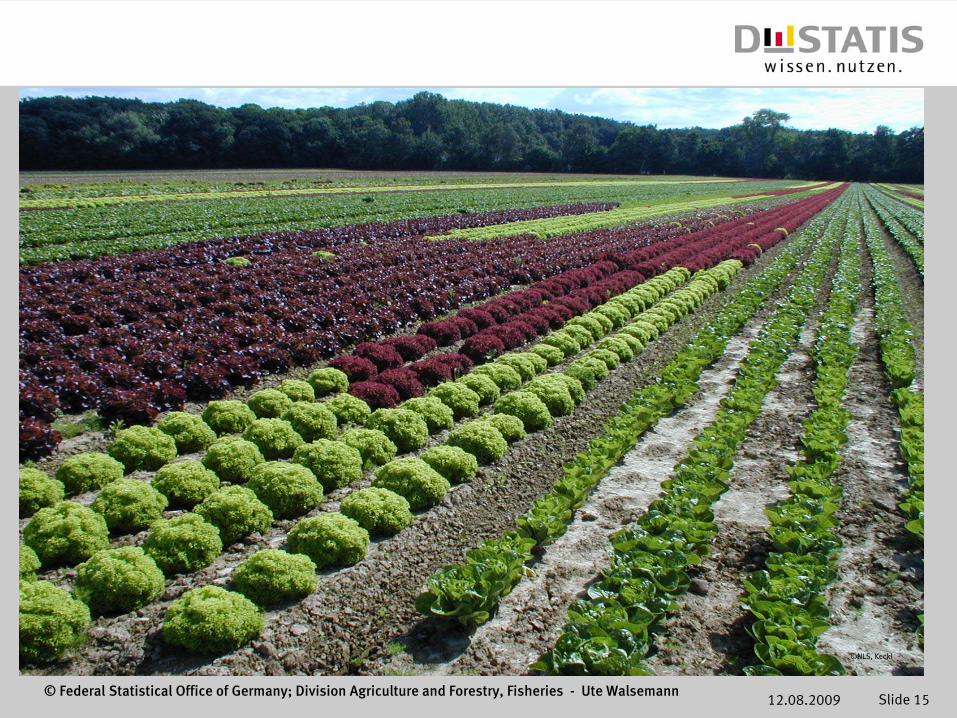
12.08.2009 Slide 15© Federal Statistical Office of Germany; Division Agriculture and Forestry, Fisheries - Ute Walsemann
©NLS, Keckl
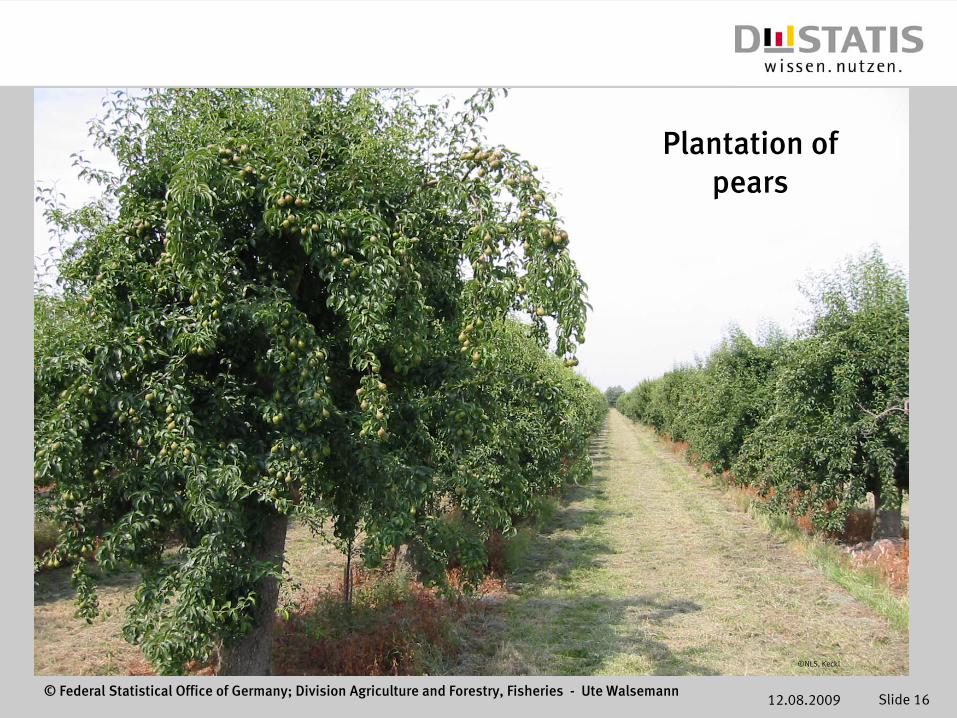
12.08.2009 Slide 16© Federal Statistical Office of Germany; Division Agriculture and Forestry, Fisheries - Ute Walsemann
Plantation
of pears
©NLS, Keckl
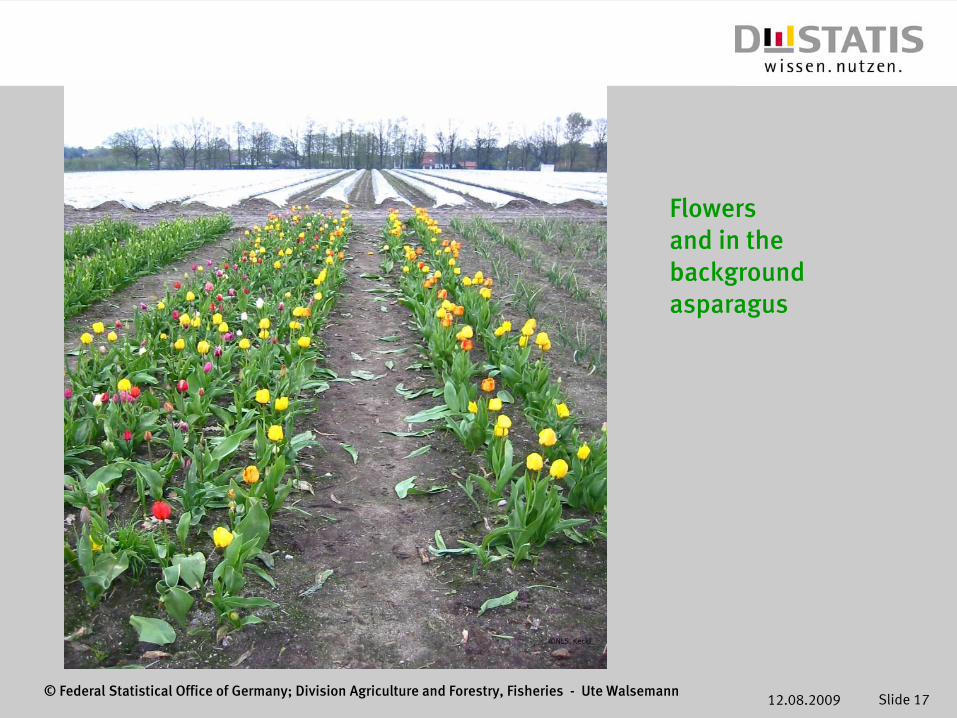
12.08.2009 Slide 17© Federal Statistical Office of Germany; Division Agriculture and Forestry, Fisheries - Ute Walsemann
©NLS, Keckl
Flowers and in the background asparagus

12.08.2009 Slide 18© Federal Statistical Office of Germany; Division Agriculture and Forestry, Fisheries - Ute Walsemann
12.08.2009 Slide 19© Federal Statistical Office of Germany; Division Agriculture and Forestry, Fisheries - Ute Walsemann
Thank you for your attention !
For subject-related information and queries please contact:
Agriculture and Forestry, Fisheries
Phone: +49 (0) 611 75-8660 (Ute Walsemann -8606)
Fax: +49 (0) 611 75-8983
E-mail: [email protected]
Http: www.destatis.de
Thank you for your attention !
Related Documents