Determining the influence of active cells and conditioning layer on early stage biofilm formation using cellulose acetate ultrafiltration membranes Amr Zaky a , Isabel Escobar b , Amir Mohaghegh Motlagh a , Cyndee Gruden a, ⁎ a Department of Civil Engineering, The University of Toledo, 2801 W Bancroft St, Toledo OH 43606, USA b Department of Chemical and Environmental Engineering, The University of Toledo, 2801 W Bancroft St, Toledo OH 43606, USA abstract article info Article history: Received 11 October 2011 Received in revised form 15 November 2011 Accepted 17 November 2011 Available online 12 December 2011 Keywords: Ultrafiltration Biofouling AFM Activity Characterization Membrane biofouling is a complicated process and can include both abiotic and biotic fouling. The objective of this research was to determine the contribution of conditioning layer in the presence of active cells to early stage membrane biofouling. Membranes were operated for 4, 11, and 24 h using buffered synthetic water composed of a conditioning layer (130.14 ppm sodium acetate trihydrate) and either inactive (fixed) or ac- tive cells (10 3 cells/mL). This study was performed using cross flow filtration through cellulose acetate (CA) ultrafiltration (UF) membranes. Flux decline, biofilm activity, biofilm surface area coverage, and biofilm morphology (surface roughness and skewness) were monitored over time. While biofilm surface area cover- age could not effectively distinguish membranes being filtered with active and inactive cells, permeate flux data indicated that the presence of active cells resulted in significantly more flux decline. Feature height an- alyses (TM-AFM) combined with biofilm metabolic activity assessment allowed the consideration of abiotic and biotic fouling. The membrane resistance increased in the presence of active bacterial cells, regardless of the level of abiotic fouling. However, abiotic fouling and bacterial cell activity are not independent since abiotic fouling serves as a food source that helps activate cells. © 2011 Elsevier B.V. All rights reserved. 1. Introduction Biofouling occurs when membranes are applied for drinking water production, water processing, and water desalination [1,2]. This is one of the most persistent challenges to the expansion of membrane ap- plications [3]. Biofouling involves formation of a biofilm due to pres- ence of bacterial cells. The first step of biofilm formation is the attachment of bacterial cells to the membrane surface. This initial at- tachment is controlled by electro-kinetic and hydrophobic interac- tions [4]. Bacterial cell growth and multiplication follows when nutrients or adsorbed organics are available in the feed water. The final stage encounters a biofilm surface of bacteria producing extra- cellular polymeric substances (EPS) which includes heteropolysac- charides, lipoproteins, and glycolproteins [4]. Previous studies focusing on biofilms and EPS [5–8], suggest that EPS contributes to the viability of bacterial cells. Before the excretion of EPS, cells may be viable but non-culturable due to the dynamics of the biofilm at this stage [9]. This study focuses on early stage biofilm formation prior to quantifiable EPS production. Membrane biofouling is a complicated process and can include both abiotic and biotic fouling [10]. Abiotic fouling may involve deposition of organic matter and soluble microbial products (SMP). Biotic fouling involves viable or nonviable bacteria and their excretion of EPS [11]. Cell activity rather than viability requires energy that can be found in the conditioning layer (i.e. abiotic and/or organic fouling) formed on the membrane surface. Through this process bacterial cells generate en- ergy and store this energy to utilize for growth and metabolism. How- ever, the contribution of the conditioning layer to cell activity in biofilm formation, and the built-up resistance on low pressure-driven membranes is not yet clearly understood. Therefore, it is hypothesized that, in the absence of EPS on membranes, abiotic fouling (the condi- tioning layer) is the principal contributor to cell activity on the formed biofilms on the membrane surface. Consequently, cell activity causes a modest increase in resistance on ultrafiltration membranes due to cell reproduction. To test this hypothesis, emerging biofilm characterization techniques were used including atomic force microscopy in tapping mode (TM-AFM) and biofilm surface area coverage. For this purpose, comprehensive morphological and cell activity analyses were per- formed to understand the processes associated with instantaneous bio- film formation on surfaces of cellulose acetate (CA) ultrafiltration (UF) membranes. 2. Materials and methods 2.1. Membranes CA UF membranes, with a molecular cut-off weight of 20,000 Da (General Electric Water and Process Technologies, Minnetonka, MN), Desalination 286 (2012) 296–303 ⁎ Corresponding author. Tel.: + 1 419 530 8128; fax: + 1 419 530 8116. E-mail address: [email protected] (C. Gruden). 0011-9164/$ – see front matter © 2011 Elsevier B.V. All rights reserved. doi:10.1016/j.desal.2011.11.040 Contents lists available at SciVerse ScienceDirect Desalination journal homepage: www.elsevier.com/locate/desal

Welcome message from author
This document is posted to help you gain knowledge. Please leave a comment to let me know what you think about it! Share it to your friends and learn new things together.
Transcript
Desalination 286 (2012) 296–303
Contents lists available at SciVerse ScienceDirect
Desalination
j ourna l homepage: www.e lsev ie r .com/ locate /desa l
Determining the influence of active cells and conditioning layer on early stage biofilmformation using cellulose acetate ultrafiltration membranes
Amr Zaky a, Isabel Escobar b, Amir Mohaghegh Motlagh a, Cyndee Gruden a,⁎a Department of Civil Engineering, The University of Toledo, 2801 W Bancroft St, Toledo OH 43606, USAb Department of Chemical and Environmental Engineering, The University of Toledo, 2801 W Bancroft St, Toledo OH 43606, USA
⁎ Corresponding author. Tel.: +1 419 530 8128; fax:E-mail address: [email protected] (C. Grude
0011-9164/$ – see front matter © 2011 Elsevier B.V. Alldoi:10.1016/j.desal.2011.11.040
a b s t r a c t
a r t i c l e i n f oArticle history:Received 11 October 2011Received in revised form 15 November 2011Accepted 17 November 2011Available online 12 December 2011
Keywords:UltrafiltrationBiofoulingAFMActivityCharacterization
Membrane biofouling is a complicated process and can include both abiotic and biotic fouling. The objectiveof this research was to determine the contribution of conditioning layer in the presence of active cells to earlystage membrane biofouling. Membranes were operated for 4, 11, and 24 h using buffered synthetic watercomposed of a conditioning layer (130.14 ppm sodium acetate trihydrate) and either inactive (fixed) or ac-tive cells (103 cells/mL). This study was performed using cross flow filtration through cellulose acetate(CA) ultrafiltration (UF) membranes. Flux decline, biofilm activity, biofilm surface area coverage, and biofilmmorphology (surface roughness and skewness) were monitored over time. While biofilm surface area cover-age could not effectively distinguish membranes being filtered with active and inactive cells, permeate fluxdata indicated that the presence of active cells resulted in significantly more flux decline. Feature height an-alyses (TM-AFM) combined with biofilm metabolic activity assessment allowed the consideration of abioticand biotic fouling. The membrane resistance increased in the presence of active bacterial cells, regardlessof the level of abiotic fouling. However, abiotic fouling and bacterial cell activity are not independent sinceabiotic fouling serves as a food source that helps activate cells.
© 2011 Elsevier B.V. All rights reserved.
1. Introduction
Biofouling occurs whenmembranes are applied for drinking waterproduction, water processing, and water desalination [1,2]. This is oneof the most persistent challenges to the expansion of membrane ap-plications [3]. Biofouling involves formation of a biofilm due to pres-ence of bacterial cells. The first step of biofilm formation is theattachment of bacterial cells to the membrane surface. This initial at-tachment is controlled by electro-kinetic and hydrophobic interac-tions [4]. Bacterial cell growth and multiplication follows whennutrients or adsorbed organics are available in the feed water. Thefinal stage encounters a biofilm surface of bacteria producing extra-cellular polymeric substances (EPS) which includes heteropolysac-charides, lipoproteins, and glycolproteins [4]. Previous studiesfocusing on biofilms and EPS [5–8], suggest that EPS contributes tothe viability of bacterial cells. Before the excretion of EPS, cells maybe viable but non-culturable due to the dynamics of the biofilm atthis stage [9]. This study focuses on early stage biofilm formationprior to quantifiable EPS production.
Membrane biofouling is a complicated process and can include bothabiotic and biotic fouling [10]. Abiotic foulingmay involve deposition oforganic matter and soluble microbial products (SMP). Biotic fouling
+1 419 530 8116.n).
rights reserved.
involves viable or nonviable bacteria and their excretion of EPS [11].Cell activity rather than viability requires energy that can be found inthe conditioning layer (i.e. abiotic and/or organic fouling) formed onthemembrane surface. Through this process bacterial cells generate en-ergy and store this energy to utilize for growth and metabolism. How-ever, the contribution of the conditioning layer to cell activity inbiofilm formation, and the built-up resistance on low pressure-drivenmembranes is not yet clearly understood. Therefore, it is hypothesizedthat, in the absence of EPS on membranes, abiotic fouling (the condi-tioning layer) is the principal contributor to cell activity on the formedbiofilms on the membrane surface. Consequently, cell activity causes amodest increase in resistance on ultrafiltration membranes due to cellreproduction. To test this hypothesis, emerging biofilm characterizationtechniques were used including atomic force microscopy in tappingmode (TM-AFM) and biofilm surface area coverage. For this purpose,comprehensive morphological and cell activity analyses were per-formed to understand the processes associated with instantaneous bio-film formation on surfaces of cellulose acetate (CA) ultrafiltration (UF)membranes.
2. Materials and methods
2.1. Membranes
CA UF membranes, with a molecular cut-off weight of 20,000 Da(General Electric Water and Process Technologies, Minnetonka, MN),
297A. Zaky et al. / Desalination 286 (2012) 296–303
were used and stored in deionizedwater (DI) at 5 °Cwith regularwaterreplacement.
2.2. Materials and chemicals used
The synthetic water used for membrane fouling analysis containedsodium acetate trihydrate (130.14 mg/L) and buffering in the form of0.050 mM NaHCO3, 0.010 mM CaCl2, 0.200 mM NaCl, 0.094 mMNH4Cl, 0.045 mM KH2PO4, and 0.060 mM MgSO4 all added to deio-nized water. Since the key goal of this study is fouling caused by ac-tive and inactive cells, a model biofouling organism, Pseudomonasfluorescens Migula (ATCC # 12842), was used because it is a knownmembrane biofoulant and can form EPS [7]. Prior to each experiment,P. fluorescens Migula, was grown on LB agar and harvested at the ex-ponential growth phase (18–22 h) and diluted in deionized waterfor addition to the feed reservoir (final concentration of 103 cells/mL).
2.3. Surface roughness and feature height analysis
Surface morphology of clean and fouled membranes was evaluat-ed using atomic force microscopy (AFM) in tapping mode (TM). AMulti-mode Nanoscope IIIa scanning probe microscopy (Santa Bar-bara, CA) at The University of Toledo, Ohio, was operated in ambientconditions. The membrane surface was imaged using silicon nitridecantilevers with integrated pyramidal tips (radiusb10 nm, force con-stant of 20–70 N/m, and resonance frequency in the range of300 kHz). AFM scans, Fig. 1, were performed on clean and fouledmembranes at permeate outlet (A2), where fouling can be observed.
Three scans were performed on samples collected to monitor thechange in the biofilm distribution on the membrane surface underdifferent fouling conditions. Samples were scanned at a relativelyslow scan rate (0.5 to 1.0 Hz) and a small scan area (4.0 μm2) to min-imize the effect of distortions during surface tapping, especially withthe drastic changes in height values on fouled membranes. Although,tapping mode in AFM is used to produce topography images, it de-pends on material property of the sample, tip properties (force con-stant and shape), and tip-sample interacting forces (set-pointamplitude ratio, rsp) [12,13]. In order to compare the feature heightdifference between clean and fouled membranes and among mem-branes fouled due to different conditions, all samples were calibratedin a light tapping regime. This was executed by performing the scan atan amplitude range of 20.2 to 39.5 nm, thus keeping the tip-sampleinteracting forces in a net attractive regime [14,15].
All samples were scanned using AFM at amplitudes 89.3 to 99.3%of the cantilever free amplitude. In the tapping mode, the cantileveroscillates near its resonance frequency, wo, resulting in a free ampli-tude, Ao. When the cantilever approaches the surface, the tip tapsthe surface and reaches its ‘tapping’ amplitude, A. Images were cap-tured during raster scanning of membrane surfaces by measuringthe adjustment in the vertical displacement of the peizo scanner to
Fig. 1. Fouled membrane sheets were analyzed at the permeate outlet region (A2).
maintain a constant set-point ratio, rsp=A/A0. In order to comparethe change in feature heights of clean and different regions on fouledmembranes, the tip resonance frequency was in the range of 300 kHz.In addition, the drive amplitude was adjusted as to provide amplitudein the range of 20.2 to 39.5 nm.
The software SPIP, version 4.7.4.0, was used to calculate surfaceroughness and skewness in order to evaluate the change in the mem-brane morphology under different fouling conditions. Description ofthese parameters and their significance for this case study is shownin Table 1.
2.4. Crossflow membrane filtration unit
Crossflow experiments were performed on 138.7 cm2 membranesheets. The feed water was pumped from the feed water reservoirto the cell membrane (Osmonics Sepa CF, Minnetonka, MN). Bothconcentrate and permeate fluxes were recycled to the reservoir.Crossflow filtration was performed for 4, 11, and 24 h in continuousmode at a constant pressure of 172.36 kPa (25 psi) and water temper-ature of 26 °C. Fouling experiments were performed to provide abasic understanding of the influence of cell activity and of key chem-ical and physical operating conditions, on the fouling behavior of thetested membranes. All membranes were precompacted for a mini-mum of 12 h until a constant flux value was reached and maintained.The permeate flux (J) and final permeate flux (Jf) were measured dur-ing and at the end of the filtration experiment, respectively. The finalpermeate flux was reported relative to the initial flux (Jo). Initial fluxvalues ranged from 25 to 32 L/m2h. Flux experiments were per-formed using synthetic water with inactive cells and the other fluxexperiments were performed using synthetic water with active cells.
Membrane coupons were cut from flat sheet membranes andstored in DI water at 5 °C. Since the key goal of this study is foulingcaused by active and inactive cells, a synthetic water compositionwas designed to promote and control microbial growth using carboncompounds and buffering [20]. The concentration ratio between car-bon source and cell solution was compiled from other studies[21–23]. For crossflow filtration experiments with inactive cells,10 mL of model organism were cultured in the same way (opticaldensity of 0.1 of 600 nm). In order to create inactive cells, 1 mL of abuffered formaldehyde solution was added to fix cells and the inac-tive cell solution was incubated at room temperature for 2 h. Theformaldehyde solution was supplemented with 10.5 g/L of NaH2PO4.To prevent any possible growth in the synthetic water, sodiumazide was added instead of NaCl at the same concentration [22].After 15 min incubation of the synthetic water, the inactive cellswere added to the feed reservoir to achieve a cell concentration of103 cells/mL. Two crossflow filtration experiments were performedon synthetic water compositions with either inactive or active cells.
2.5. Biofilm surface area coverage analysis
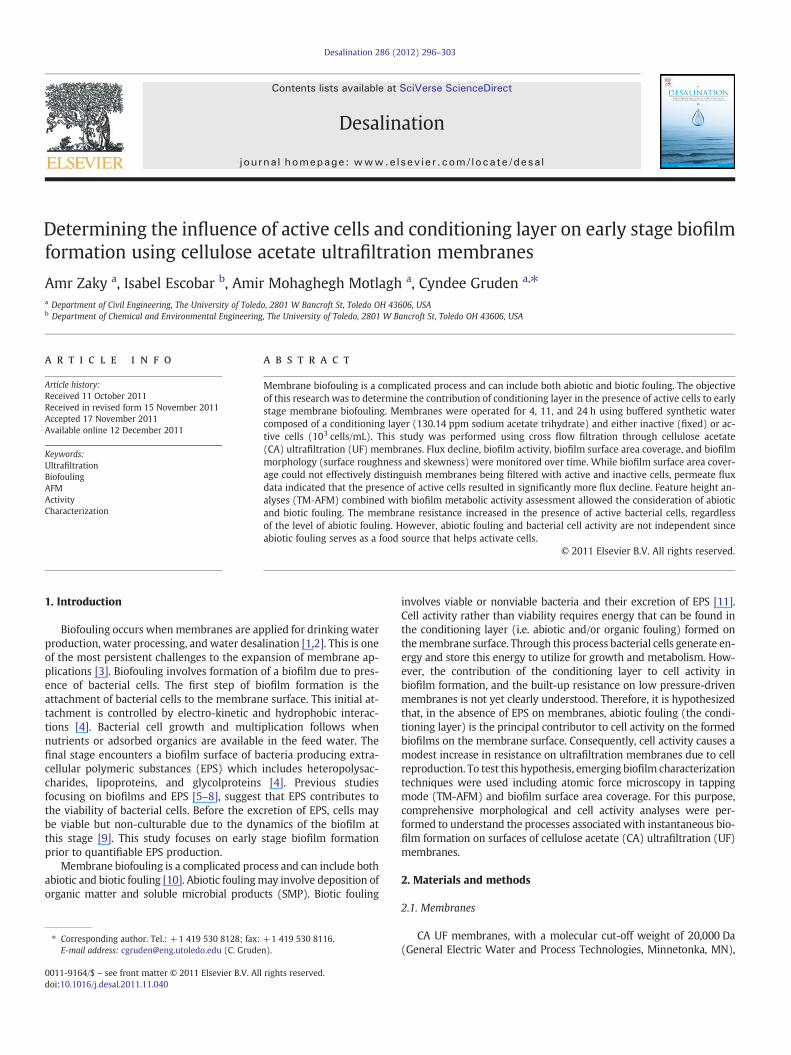
The surface area coverage of the formed biofilm on membranesheets was calculated using the software Image J 1.41. The commer-cially available software was freely downloaded (http://rsbweb.nih.gov/ij/). This technique was previously used as a direct observationmethod to detect area of biofilm coverage on membranes [24–27].After the crossflow experiments were performed, membrane sheets(14.6 cm×9.5 cm) were incubated at 26 °C for an hour. Then imageswere captured using a digital scanner (Visioneer 4800 USB with600×1200 dpi optical resolution). The luminescence intensity (i.e.pixel amplitude) of scanned membrane images would be affectedby the degree of biofilm intensity. The pixel amplitude on clean mem-branes was used as a reference to separate its intensity from any bio-films present on fouled membranes, as shown in Fig. 2. Ten cleanmembrane sheets, each with an area of 1 cm2, were captured at a res-olution of 1200 dpi. Contrast stretching by histogram equalization
Table 1AFM parameters and their significance.
Parameter Description Significance
Sq, Root MeanSquare (RMS)
Used to characterize the accuracy of a surface whencompared to a perfectly smooth surface [16]
Used in the literature to characterize the morphology of membranes [8,17,18]
Ssk, SurfaceSkewness
Describes the asymmetry of the height distributionhistogram
(i) used to evaluate the degree of surface texture uniformity through the distribution ofpeaks and valleys on clean membranes [19]
(ii) used to differentiate between the surface uniformity of biofilms formed on membranesused with different feed water and hydrodynamic conditions
298 A. Zaky et al. / Desalination 286 (2012) 296–303
was applied to all samples in order to eliminate noise and enhancecontrast [28]. In addition, in microbiological imaging where spatialcorrelation is more important than signal intensity, histogram equal-ization provides better detection of microorganisms as it enhancestheir capability to separate from the background [28,29]. Fouledmembrane sheets were subdivided into three areas as shown inFig. 1 and captured at a resolution of 1200 dpi. The maximum pixelamplitude, determined from clean membranes, was used as a thresh-old to separate formed biofilms.
2.6. Biofilm metabolic activity analysis
At the end of each fouling experiment with either inactive or ac-tive cells, membrane sheets (14.6 cm×9.5 cm) were incubated at26 °C for an hour. At the permeate outlet region (A2), two samples(5 mm×10 mm) were cut from the membrane sheet and analyzedwith a metabolic activity stain. A stock solution (20 mM) of 5-cyano-2, 3-ditolyl tetrazolium chloride (CTC); (Polyscience, Warring-ton, PA) (ex/em λ=475/600 nm) was prepared in ultrapure waterand stored at 4 °C for a maximum of 2 days [30,31]. To measure theactive biomass area per filter area, Ar, fouled membrane sampleswere stained in a 6-well plate with 1 mL of the CTC solution. Sampleswere incubated at 26 °C, for 9 to 12 h and in the absence of light. Tomeasure the total biomass area per filter area, Ag, after incubation a3.5 μL of DNA stain Picogreen (PG) (Picogreen, Invitrogen, Chicago,IL), (ex/em λ=502/523 nm), was added to each sample. Sampleswere then stirred in the absence of light at room temperature on aplatform shaker (114, New Brunswick Scientific, Edision, NJ) at thespeed of 20 rpm for 15 min. Samples were then transferred ontoslides and processed by fluorescence microscopy (Olympus BX 51with digital camera (Olympus DP70, Center Valley, PA)). A minimumof 20 random fields were analyzed at a magnification of 100 and nu-merical exposure of 0.5. Images were transferred to Image J 1.41 todetermine the biomass area of metabolic activity versus total biomassarea of formed biofilm samples.
Cell activity from the synthetic feed water was also measured atthe end of each filtration experiment. The prepared CTC stock was
Fig. 2. Biofilm surface area coverage optimized by the threshold clean membraneintensity.
added to feed water samples (33% vol/vol). After 9–12 h of incubationat 26 °C and in the absence of light, samples were stained with 1.5 μLPG. A minimum of 10 random fields or a total of 200 bacterium cellswere counted for each slide. Each slide has 46,691 fields under fluo-rescence microscope. Replicates were processed for each sample.
3. Results and discussion
3.1. Membrane biofouling experiments
Normalized flux was plotted as a function of filtration time forsynthetic feed water containing inactive cells (Fig. 3.a) and activecells (Fig. 3.b). The permeate flux decline for 4 hour filtration experi-ments was less than 2% in all cases. As membranes continued to be fil-tered up to 24 h, the normalized flux for experiments includinginactive cells (0.972±0.005) was higher than the normalized fluxfor experiments using active cells (0.912±0.010). Therefore, perme-ate flux data indicated that the presence of active cells during a shortperiod of filtration (≤24 h) was a significant contributor to flux de-cline as compared to filtration with inactive cells.
3.2. Biofilm surface area coverage analysis
Table 2 shows the biofilm surface area coverage (Abio) calculatedat the permeate outlet (A2) for all flux experiments. For 4 h of cross-flow experiments, the biofilm surface area coverage on fouled mem-branes using active cells (9.7±2.0%) was significantly higher thanwhen using inactive cells (1.1±0.3%). This indicates that fixation ofbacterial cells lowered the bacterial-membrane interactions and thefouling with inactive cells is due to abiotic fouling from salts and nat-ural organic matter.
For 11 h of crossflow experiments, the biofilm surface area coveragewith the active cells (11.5±3.0%) increased while it remained constantwith inactive cells (0.4±0.4%). However, for 24 hour crossflow exper-iments, the surface area coverage with inactive cells (17.2±1.4%) in-creased and was not significantly different than active cells (15.3±2.6%). Therefore, in case of 11 h of crossflow filtration with inactivecells, cell deposition was still hindered and abiotic fouling was thedominant fouling condition. On the other hand, after 24 h of filtrationwith the inactive cells, the surface area coverage increased andmatched the surface area coverage after filtration using active cells.However, the flux decline after filtration using active cells was higheras compared to the flux decline after filtration using inactive cells.This finding suggests that cell activity plays a significant role in increas-ing the fouling resistance on the membrane. Therefore, micrometerand nanometer scale analysis were performed in order to comprehen-sively explain its role.
3.3. Surface roughness and skewness analysis
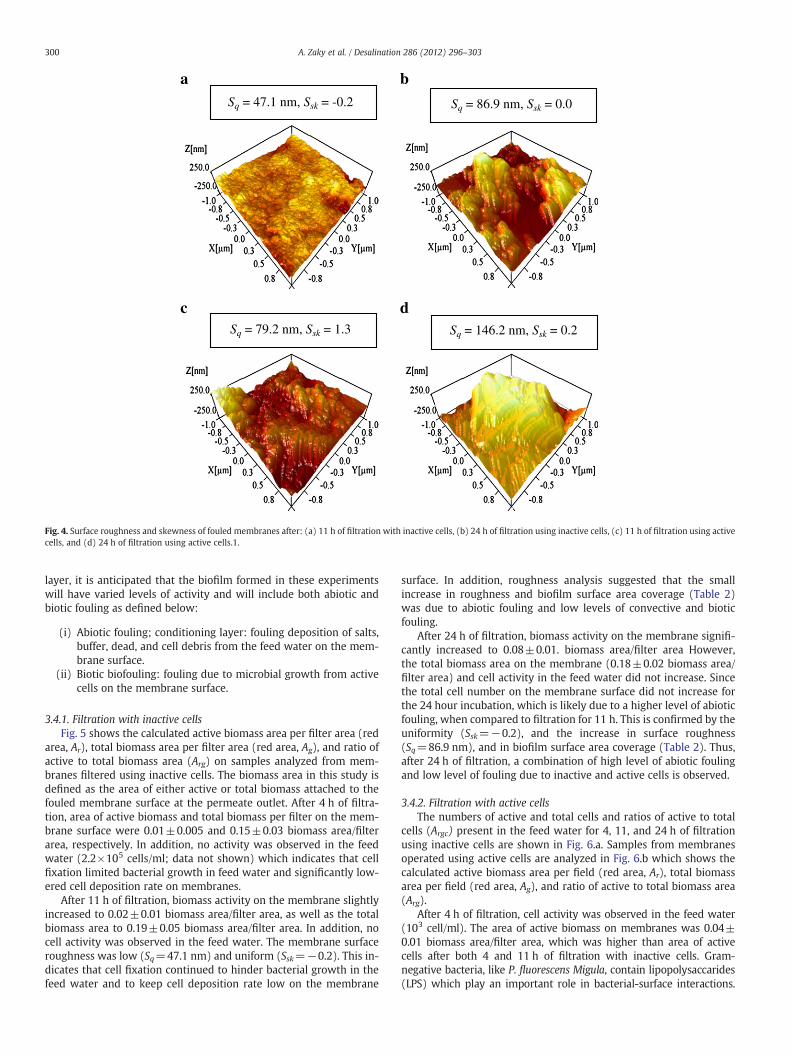
Fig. 4 shows surface roughness and skewness on fouled mem-branes filtered for 11 and 24 h with either inactive or active cells. Sur-face skewness (Ssk) or surface texture uniformity was calculated forscanned samples using the asymmetry of the height distributiondata about its mean. When Ssk=0, the height distribution fits a
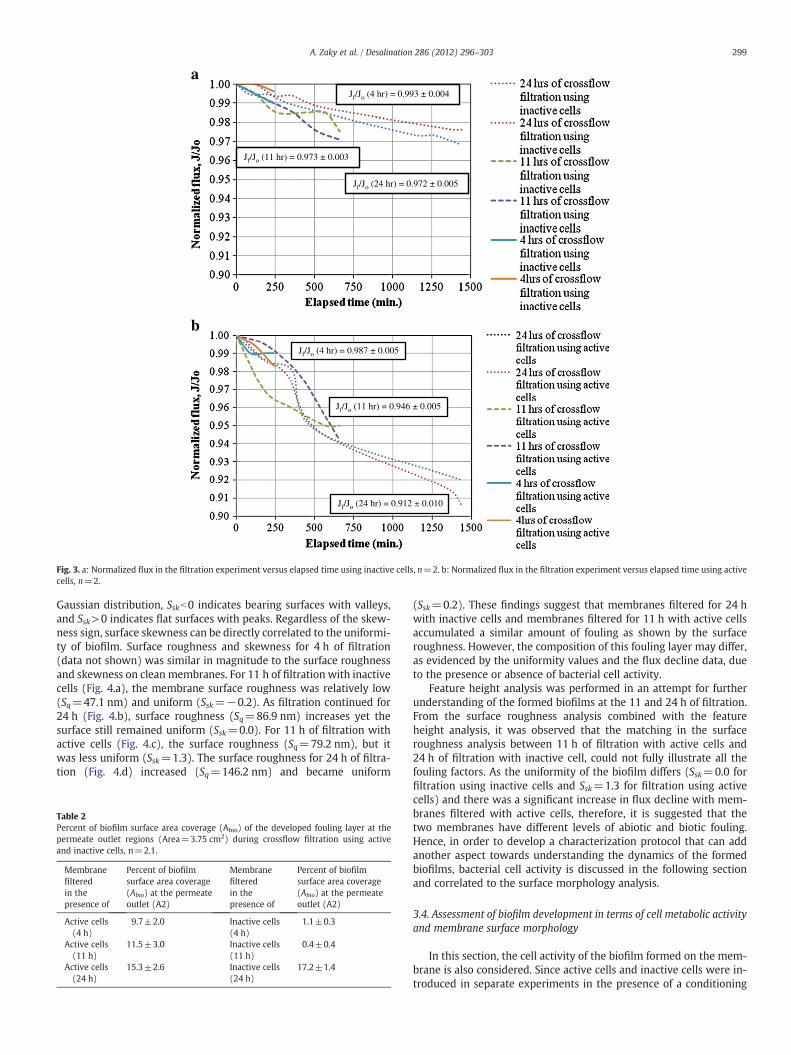
Jf/Jo (4 hr) = 0.993 ± 0.004
Jf/Jo (11 hr) = 0.973 ± 0.003
Jf/Jo (24 hr) = 0.972 ± 0.005
Jf/Jo (24 hr) = 0.912 ± 0.010
Jf/Jo (11 hr) = 0.946 ± 0.005
Jf/Jo (4 hr) = 0.987 ± 0.005
a
b
Fig. 3. a: Normalized flux in the filtration experiment versus elapsed time using inactive cells, n=2. b: Normalized flux in the filtration experiment versus elapsed time using activecells, n=2.
299A. Zaky et al. / Desalination 286 (2012) 296–303
Gaussian distribution, Sskb0 indicates bearing surfaces with valleys,and Ssk>0 indicates flat surfaces with peaks. Regardless of the skew-ness sign, surface skewness can be directly correlated to the uniformi-ty of biofilm. Surface roughness and skewness for 4 h of filtration(data not shown) was similar in magnitude to the surface roughnessand skewness on clean membranes. For 11 h of filtration with inactivecells (Fig. 4.a), the membrane surface roughness was relatively low(Sq=47.1 nm) and uniform (Ssk=−0.2). As filtration continued for24 h (Fig. 4.b), surface roughness (Sq=86.9 nm) increases yet thesurface still remained uniform (Ssk=0.0). For 11 h of filtration withactive cells (Fig. 4.c), the surface roughness (Sq=79.2 nm), but itwas less uniform (Ssk=1.3). The surface roughness for 24 h of filtra-tion (Fig. 4.d) increased (Sq=146.2 nm) and became uniform
Table 2Percent of biofilm surface area coverage (Abio) of the developed fouling layer at thepermeate outlet regions (Area=3.75 cm2) during crossflow filtration using activeand inactive cells, n=2.1.
Membranefilteredin thepresence of
Percent of biofilmsurface area coverage(Abio) at the permeateoutlet (A2)
Membranefilteredin thepresence of
Percent of biofilmsurface area coverage(Abio) at the permeateoutlet (A2)
Active cells(4 h)
9.7±2.0 Inactive cells(4 h)
1.1±0.3
Active cells(11 h)
11.5±3.0 Inactive cells(11 h)
0.4±0.4
Active cells(24 h)
15.3±2.6 Inactive cells(24 h)
17.2±1.4
(Ssk=0.2). These findings suggest that membranes filtered for 24 hwith inactive cells and membranes filtered for 11 h with active cellsaccumulated a similar amount of fouling as shown by the surfaceroughness. However, the composition of this fouling layer may differ,as evidenced by the uniformity values and the flux decline data, dueto the presence or absence of bacterial cell activity.
Feature height analysis was performed in an attempt for furtherunderstanding of the formed biofilms at the 11 and 24 h of filtration.From the surface roughness analysis combined with the featureheight analysis, it was observed that the matching in the surfaceroughness analysis between 11 h of filtration with active cells and24 h of filtration with inactive cell, could not fully illustrate all thefouling factors. As the uniformity of the biofilm differs (Ssk=0.0 forfiltration using inactive cells and Ssk=1.3 for filtration using activecells) and there was a significant increase in flux decline with mem-branes filtered with active cells, therefore, it is suggested that thetwo membranes have different levels of abiotic and biotic fouling.Hence, in order to develop a characterization protocol that can addanother aspect towards understanding the dynamics of the formedbiofilms, bacterial cell activity is discussed in the following sectionand correlated to the surface morphology analysis.
3.4. Assessment of biofilm development in terms of cell metabolic activityand membrane surface morphology
In this section, the cell activity of the biofilm formed on the mem-brane is also considered. Since active cells and inactive cells were in-troduced in separate experiments in the presence of a conditioning
a b
Sq = 86.9 nm, Ssk = 0.0Sq = 47.1 nm, Ssk = -0.2
Sq = 146.2 nm, Ssk = 0.2Sq = 79.2 nm, Ssk = 1.3
c d
Fig. 4. Surface roughness and skewness of fouled membranes after: (a) 11 h of filtration with inactive cells, (b) 24 h of filtration using inactive cells, (c) 11 h of filtration using activecells, and (d) 24 h of filtration using active cells.1.
300 A. Zaky et al. / Desalination 286 (2012) 296–303
layer, it is anticipated that the biofilm formed in these experimentswill have varied levels of activity and will include both abiotic andbiotic fouling as defined below:
(i) Abiotic fouling; conditioning layer: fouling deposition of salts,buffer, dead, and cell debris from the feed water on the mem-brane surface.
(ii) Biotic biofouling: fouling due to microbial growth from activecells on the membrane surface.
3.4.1. Filtration with inactive cellsFig. 5 shows the calculated active biomass area per filter area (red
area, Ar), total biomass area per filter area (red area, Ag), and ratio ofactive to total biomass area (Arg) on samples analyzed from mem-branes filtered using inactive cells. The biomass area in this study isdefined as the area of either active or total biomass attached to thefouled membrane surface at the permeate outlet. After 4 h of filtra-tion, area of active biomass and total biomass per filter on the mem-brane surface were 0.01±0.005 and 0.15±0.03 biomass area/filterarea, respectively. In addition, no activity was observed in the feedwater (2.2×10⁵ cells/ml; data not shown) which indicates that cellfixation limited bacterial growth in feed water and significantly low-ered cell deposition rate on membranes.
After 11 h of filtration, biomass activity on the membrane slightlyincreased to 0.02±0.01 biomass area/filter area, as well as the totalbiomass area to 0.19±0.05 biomass area/filter area. In addition, nocell activity was observed in the feed water. The membrane surfaceroughness was low (Sq=47.1 nm) and uniform (Ssk=−0.2). This in-dicates that cell fixation continued to hinder bacterial growth in thefeed water and to keep cell deposition rate low on the membrane
surface. In addition, roughness analysis suggested that the smallincrease in roughness and biofilm surface area coverage (Table 2)was due to abiotic fouling and low levels of convective and bioticfouling.
After 24 h of filtration, biomass activity on the membrane signifi-cantly increased to 0.08±0.01. biomass area/filter area However,the total biomass area on the membrane (0.18±0.02 biomass area/filter area) and cell activity in the feed water did not increase. Sincethe total cell number on the membrane surface did not increase forthe 24 hour incubation, which is likely due to a higher level of abioticfouling, when compared to filtration for 11 h. This is confirmed by theuniformity (Ssk=−0.2), and the increase in surface roughness(Sq=86.9 nm), and in biofilm surface area coverage (Table 2). Thus,after 24 h of filtration, a combination of high level of abiotic foulingand low level of fouling due to inactive and active cells is observed.
3.4.2. Filtration with active cellsThe numbers of active and total cells and ratios of active to total
cells (Argc) present in the feed water for 4, 11, and 24 h of filtrationusing inactive cells are shown in Fig. 6.a. Samples from membranesoperated using active cells are analyzed in Fig. 6.b which shows thecalculated active biomass area per field (red area, Ar), total biomassarea per field (red area, Ag), and ratio of active to total biomass area(Arg).
After 4 h of filtration, cell activity was observed in the feed water(103 cell/ml). The area of active biomass on membranes was 0.04±0.01 biomass area/filter area, which was higher than area of activecells after both 4 and 11 h of filtration with inactive cells. Gram-negative bacteria, like P. fluorescens Migula, contain lipopolysaccarides(LPS) which play an important role in bacterial-surface interactions.
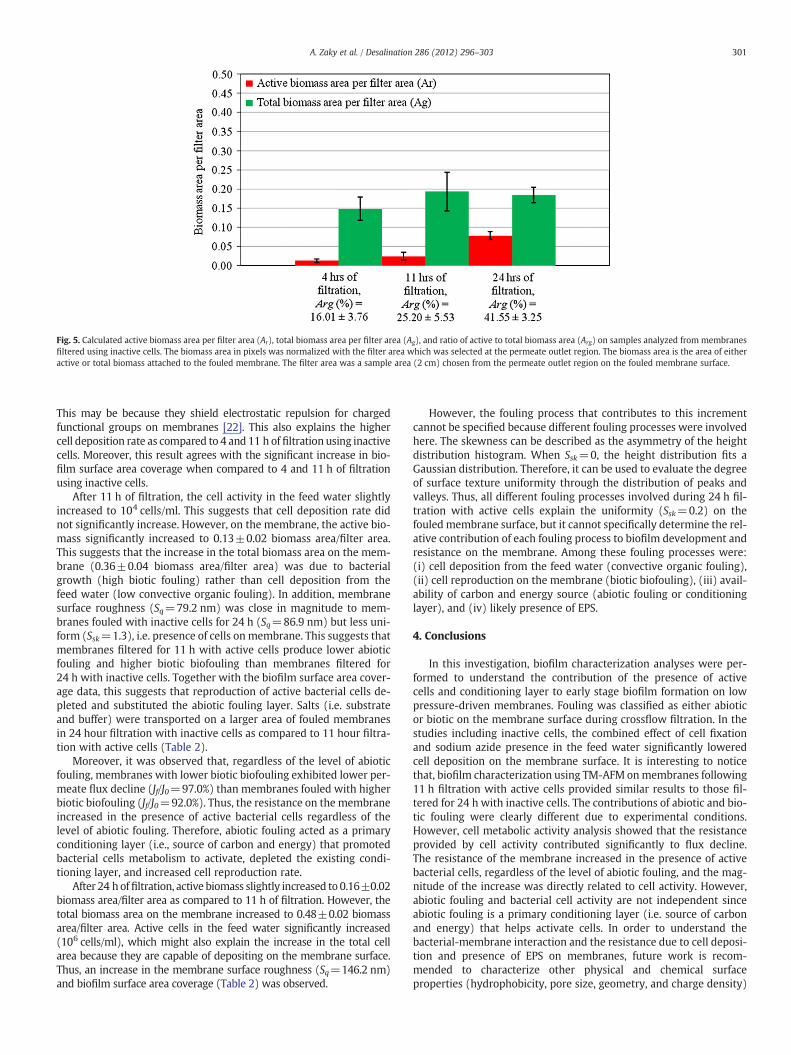
Fig. 5. Calculated active biomass area per filter area (Ar), total biomass area per filter area (Ag), and ratio of active to total biomass area (Arg) on samples analyzed from membranesfiltered using inactive cells. The biomass area in pixels was normalized with the filter area which was selected at the permeate outlet region. The biomass area is the area of eitheractive or total biomass attached to the fouled membrane. The filter area was a sample area (2 cm) chosen from the permeate outlet region on the fouled membrane surface.
301A. Zaky et al. / Desalination 286 (2012) 296–303
This may be because they shield electrostatic repulsion for chargedfunctional groups on membranes [22]. This also explains the highercell deposition rate as compared to 4 and 11 h of filtration using inactivecells. Moreover, this result agrees with the significant increase in bio-film surface area coverage when compared to 4 and 11 h of filtrationusing inactive cells.
After 11 h of filtration, the cell activity in the feed water slightlyincreased to 104 cells/ml. This suggests that cell deposition rate didnot significantly increase. However, on the membrane, the active bio-mass significantly increased to 0.13±0.02 biomass area/filter area.This suggests that the increase in the total biomass area on the mem-brane (0.36±0.04 biomass area/filter area) was due to bacterialgrowth (high biotic fouling) rather than cell deposition from thefeed water (low convective organic fouling). In addition, membranesurface roughness (Sq=79.2 nm) was close in magnitude to mem-branes fouled with inactive cells for 24 h (Sq=86.9 nm) but less uni-form (Ssk=1.3), i.e. presence of cells on membrane. This suggests thatmembranes filtered for 11 h with active cells produce lower abioticfouling and higher biotic biofouling than membranes filtered for24 h with inactive cells. Together with the biofilm surface area cover-age data, this suggests that reproduction of active bacterial cells de-pleted and substituted the abiotic fouling layer. Salts (i.e. substrateand buffer) were transported on a larger area of fouled membranesin 24 hour filtration with inactive cells as compared to 11 hour filtra-tion with active cells (Table 2).
Moreover, it was observed that, regardless of the level of abioticfouling, membranes with lower biotic biofouling exhibited lower per-meate flux decline (Jf/J0=97.0%) than membranes fouled with higherbiotic biofouling (Jf/J0=92.0%). Thus, the resistance on the membraneincreased in the presence of active bacterial cells regardless of thelevel of abiotic fouling. Therefore, abiotic fouling acted as a primaryconditioning layer (i.e., source of carbon and energy) that promotedbacterial cells metabolism to activate, depleted the existing condi-tioning layer, and increased cell reproduction rate.
After 24 h offiltration, active biomass slightly increased to 0.16±0.02biomass area/filter area as compared to 11 h of filtration. However, thetotal biomass area on the membrane increased to 0.48±0.02 biomassarea/filter area. Active cells in the feed water significantly increased(106 cells/ml), which might also explain the increase in the total cellarea because they are capable of depositing on the membrane surface.Thus, an increase in the membrane surface roughness (Sq=146.2 nm)and biofilm surface area coverage (Table 2) was observed.
However, the fouling process that contributes to this incrementcannot be specified because different fouling processes were involvedhere. The skewness can be described as the asymmetry of the heightdistribution histogram. When Ssk=0, the height distribution fits aGaussian distribution. Therefore, it can be used to evaluate the degreeof surface texture uniformity through the distribution of peaks andvalleys. Thus, all different fouling processes involved during 24 h fil-tration with active cells explain the uniformity (Ssk=0.2) on thefouled membrane surface, but it cannot specifically determine the rel-ative contribution of each fouling process to biofilm development andresistance on the membrane. Among these fouling processes were:(i) cell deposition from the feed water (convective organic fouling),(ii) cell reproduction on the membrane (biotic biofouling), (iii) avail-ability of carbon and energy source (abiotic fouling or conditioninglayer), and (iv) likely presence of EPS.
4. Conclusions
In this investigation, biofilm characterization analyses were per-formed to understand the contribution of the presence of activecells and conditioning layer to early stage biofilm formation on lowpressure-driven membranes. Fouling was classified as either abioticor biotic on the membrane surface during crossflow filtration. In thestudies including inactive cells, the combined effect of cell fixationand sodium azide presence in the feed water significantly loweredcell deposition on the membrane surface. It is interesting to noticethat, biofilm characterization using TM-AFM onmembranes following11 h filtration with active cells provided similar results to those fil-tered for 24 h with inactive cells. The contributions of abiotic and bio-tic fouling were clearly different due to experimental conditions.However, cell metabolic activity analysis showed that the resistanceprovided by cell activity contributed significantly to flux decline.The resistance of the membrane increased in the presence of activebacterial cells, regardless of the level of abiotic fouling, and the mag-nitude of the increase was directly related to cell activity. However,abiotic fouling and bacterial cell activity are not independent sinceabiotic fouling is a primary conditioning layer (i.e. source of carbonand energy) that helps activate cells. In order to understand thebacterial-membrane interaction and the resistance due to cell deposi-tion and presence of EPS on membranes, future work is recom-mended to characterize other physical and chemical surfaceproperties (hydrophobicity, pore size, geometry, and charge density)
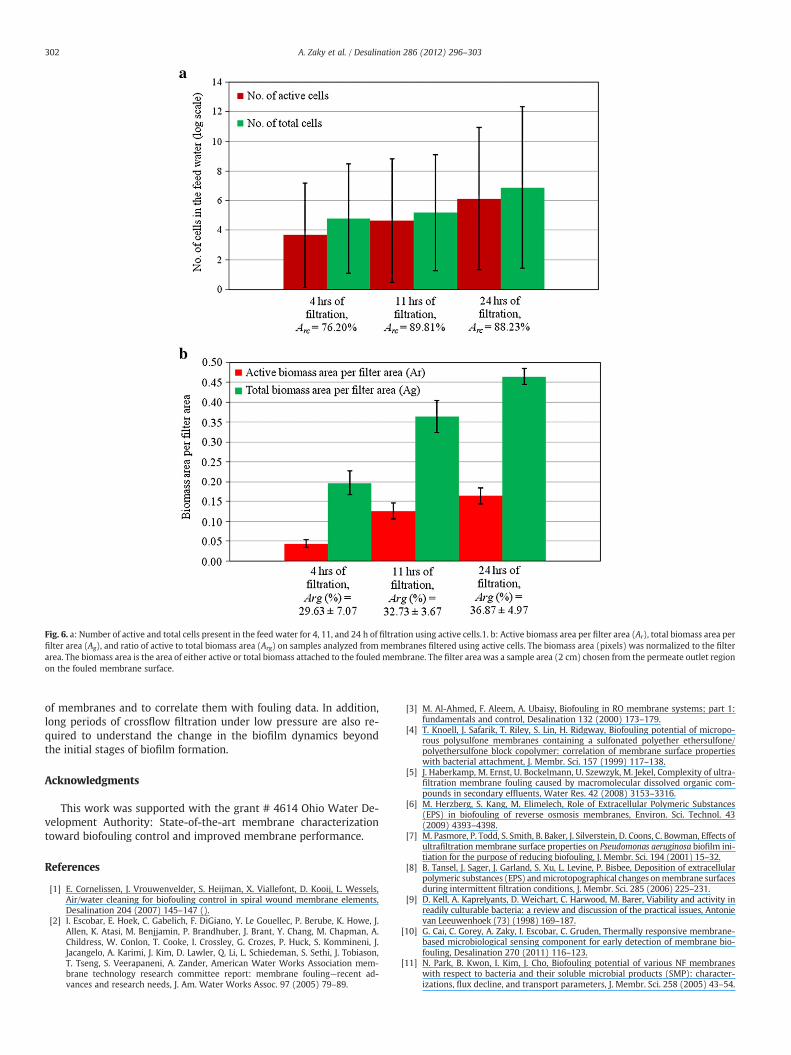
Fig. 6. a: Number of active and total cells present in the feed water for 4, 11, and 24 h of filtration using active cells.1. b: Active biomass area per filter area (Ar), total biomass area perfilter area (Ag), and ratio of active to total biomass area (Arg) on samples analyzed from membranes filtered using active cells. The biomass area (pixels) was normalized to the filterarea. The biomass area is the area of either active or total biomass attached to the fouled membrane. The filter area was a sample area (2 cm) chosen from the permeate outlet regionon the fouled membrane surface.
302 A. Zaky et al. / Desalination 286 (2012) 296–303
of membranes and to correlate them with fouling data. In addition,long periods of crossflow filtration under low pressure are also re-quired to understand the change in the biofilm dynamics beyondthe initial stages of biofilm formation.
Acknowledgments
This work was supported with the grant # 4614 Ohio Water De-velopment Authority: State-of-the-art membrane characterizationtoward biofouling control and improved membrane performance.
References
[1] E. Cornelissen, J. Vrouwenvelder, S. Heijman, X. Viallefont, D. Kooij, L. Wessels,Air/water cleaning for biofouling control in spiral wound membrane elements,Desalination 204 (2007) 145–147 ().
[2] I. Escobar, E. Hoek, C. Gabelich, F. DiGiano, Y. Le Gouellec, P. Berube, K. Howe, J.Allen, K. Atasi, M. Benjjamin, P. Brandhuber, J. Brant, Y. Chang, M. Chapman, A.Childress, W. Conlon, T. Cooke, I. Crossley, G. Crozes, P. Huck, S. Kommineni, J.Jacangelo, A. Karimi, J. Kim, D. Lawler, Q. Li, L. Schiedeman, S. Sethi, J. Tobiason,T. Tseng, S. Veerapaneni, A. Zander, American Water Works Association mem-brane technology research committee report: membrane fouling—recent ad-vances and research needs, J. Am. Water Works Assoc. 97 (2005) 79–89.
[3] M. Al-Ahmed, F. Aleem, A. Ubaisy, Biofouling in RO membrane systems; part 1:fundamentals and control, Desalination 132 (2000) 173–179.
[4] T. Knoell, J. Safarik, T. Riley, S. Lin, H. Ridgway, Biofouling potential of micropo-rous polysulfone membranes containing a sulfonated polyether ethersulfone/polyethersulfone block copolymer: correlation of membrane surface propertieswith bacterial attachment, J. Membr. Sci. 157 (1999) 117–138.
[5] J. Haberkamp, M. Ernst, U. Bockelmann, U. Szewzyk, M. Jekel, Complexity of ultra-filtration membrane fouling caused by macromolecular dissolved organic com-pounds in secondary effluents, Water Res. 42 (2008) 3153–3316.
[6] M. Herzberg, S. Kang, M. Elimelech, Role of Extracellular Polymeric Substances(EPS) in biofouling of reverse osmosis membranes, Environ. Sci. Technol. 43(2009) 4393–4398.
[7] M. Pasmore, P. Todd, S. Smith, B. Baker, J. Silverstein, D. Coons, C. Bowman, Effects ofultrafiltration membrane surface properties on Pseudomonas aeruginosa biofilm ini-tiation for the purpose of reducing biofouling, J. Membr. Sci. 194 (2001) 15–32.
[8] B. Tansel, J. Sager, J. Garland, S. Xu, L. Levine, P. Bisbee, Deposition of extracellularpolymeric substances (EPS) andmicrotopographical changes onmembrane surfacesduring intermittent filtration conditions, J. Membr. Sci. 285 (2006) 225–231.
[9] D. Kell, A. Kaprelyants, D. Weichart, C. Harwood, M. Barer, Viability and activity inreadily culturable bacteria: a review and discussion of the practical issues, Antonievan Leeuwenhoek (73) (1998) 169–187.
[10] G. Cai, C. Gorey, A. Zaky, I. Escobar, C. Gruden, Thermally responsive membrane-based microbiological sensing component for early detection of membrane bio-fouling, Desalination 270 (2011) 116–123.
[11] N. Park, B. Kwon, I. Kim, J. Cho, Biofouling potential of various NF membraneswith respect to bacteria and their soluble microbial products (SMP): character-izations, flux decline, and transport parameters, J. Membr. Sci. 258 (2005) 43–54.
303A. Zaky et al. / Desalination 286 (2012) 296–303
[12] R. Godehardt, W. Lebek, R. Adhikari, M. Rosenthal, C. Martin, S. Frangov, G. Michler,Optimum topographical and morphological information in AFM tapping modeinvestigation of multicomponent polyethylene, Eur. Polym. J. 40 (2004) 917–926.
[13] T. Kowalewski, J. Legleiter, Imaging stability and average tip-sample force in tappingmode atomic force microscopy, J. Appl. Phys. 99 (2006) 064903 -1-5.
[14] A. Kuhle, A. Sorensen, J. Bohr, Role of attractive forces in tapping tip force micro-scopy, J. Appl. Phys. 81 (1997) 6562–6569.
[15] J. Legleiter, The effect of drive frequency and set point amplitude on tappingforces in atomic force microscopy: simulation and experiment, Nanotechnology20 (2009) 245703-245703.
[16] E. Gadelmawla, M. Koura, T. Maksoud, I. Elewa, H. Soliman, Extraction of rough-ness properties from captured images of surfaces, Proc. Inst. Mech. Eng. Part BJ. Eng. Manuf. 215 (2001) 555–564.
[17] Y. Bessiere, B. Jefferson, E. Goslan, P. Bacchin, Effect of hydrophilic/hydrophobicfractions of natural organic matter on irreversible fouling of membranes, Desali-nation 249 (2006) 182–187.
[18] G. Zhang, S. Ji, X. Gao, Z. Liu, Adsorptive fouling of extracellular polymeric substanceswith polymeric ultrafiltration membranes, J. Membr. Sci. 309 (2008) 28–35.
[19] M. Kim, N. Lin, G. Lewis, Y. Cohen, Surface nano-structuring of reverse osmosismembranes via atmospheric pressure plasma-induced graft polymerization forreduction of mineral scaling propensity, J. Membr. Sci. 354 (2010) 142–149.
[20] I. Escobar, A. Randall, Sample storage impact on the assimilable organic carbon(AOC) bioassay, Water Res. 34 (2000) 1680–1686.
[21] J. Baker, L. Dudley, Biofouling in membrane systems: a review, Desalination 118(1998) 81–90.
[22] M. Herzberg, M. Elimelech, Biofouling of reverse osmosis membranes: role ofbiofilm-enhanced osmotic pressure, J. Membr. Sci. 295 (2007) 11–20.
[23] W. Peng, I. Escobar, D.White, Effect ofwater chemistries andproperties ofmembraneon the performance and fouling—a model development study, J. Membr. Sci. 238(2004) 33–46.
[24] M. Ferrando, A. Rozek, M. Zator, F. Lopez, C. Guell, An approach tomembrane foulingcharacterization by confocal scanning laser microscopy, J. Membr. Sci. 250 (2005)283–293.
[25] D. Hughes, Z. Cui, R. Field, U. Tirlapur, In situ three-dimensional characterizationof membrane fouling by protein suspensions using multi-photon microscopy,Langmuir 22 (2006) 6266–6272.
[26] S. Kang, E. Hoek, H. Choi, H. Shi, Effect of membrane surface properties during thefast evaluation of cell attachment, Sep. Sci. Technol. 41 (2006) 1475–1487.
[27] Y. Marselina, P. Le-Clech Lifia, R. Stuetz, V. Chen, Characterization of membranefouling deposition and removal by direct observation technique, J. Membr. Sci.341 (2009) 163–171.
[28] A. Petrisor, A. Cuc, A. Decho, Reconstruction and computation ofmicroscale biovolumesusing geographical information systems: potential difficulties, Res. Microbiol. 155(2004) 447–454.
[29] Y. Ginoris, A. Amaral, A. Nicolau, M. Coelho, E. Ferreira, Development of an imageanalysis procedure for identifying protozoa and metazoa typical of activatedsludge system, Water Res. 41 (2007) 2581–2589.
[30] C. Gruden, A. Khijniak, P. Adriaens, Activity assessment of microorganisms elutedfrom sediments using 5-cyano-2,3-ditolyl tetrazolium chloride: a quantitativecomparison of flow cytometry to epifluorescent microscopy, J. Microbiol.Methods 55 (2003) 865–874.
[31] C. Gruden, R. McCulloch, T. Towey, J. Wolfe, P. Adriaens, Hydrogen-based activityenhancement in sediment cultures and intact sediments, Environ. Eng. Sci. 24(2007) 696–706.
Related Documents