Nagaraj V.Dharwadkar & B. B. Amberker International Journal of Image Processing Volume (4): Issue (2) 89 Determining the Efficient Subband Coefficients of Biorthogonal Wavelet for Gray level Image Watermarking Nagaraj V. Dharwadkar [email protected] PhD Scholar, Department of Computer Science and Engineering National Institute of Technology (NIT) Warangal, (A.P), INDIA B. B. Amberker [email protected] Professor, Department of Computer Science and Engineering National Institute of Technology (NIT) Warangal, (A.P), INDIA Abstract In this paper, we propose an invisible blind watermarking scheme for the gray- level images. The cover image is decomposed using the Discrete Wavelet Transform with Biorthogonal wavelet filters and the watermark is embedded into significant coefficients of the transformation. The Biorthogonal wavelet is used because it has the property of perfect reconstruction and smoothness. The proposed scheme embeds a monochrome watermark into a gray-level image. In the embedding process, we use a localized decomposition, means that the second level decomposition is performed on the detail sub-band resulting from the first level decomposition. The image is decomposed into first level and for second level decomposition we consider Horizontal, vertical and diagonal subband separately. From this second level decomposition we take the respective Horizontal, vertical and diagonal coefficients for embedding the watermark. The robustness of the scheme is tested by considering the different types of image processing attacks like blurring, cropping, sharpening, Gaussian filtering and salt and pepper noise effect. The experimental result shows that the embedding watermark into diagonal subband coefficients is robust against different types of attacks. Keywords: Watermarking, DWT, RMS, MSE, PSNR. 1. INTRODUCTION The digitized media content is becoming more and more important. However, due to the popularity of the Internet and characteristics of digital signals, circumstantial problems are also on the rise. The rapid growth of digital imagery coupled with the ease by which digital information can be duplicated and distributed has led to the need for effective copyright protection tools. From this point of view, digital watermark is a promising technique to protect data from illicit copying [1][2]. The classification of watermarking algorithm is done on several view points. One of the viewpoints is based on usage of cover image to decode the watermark, which is known as Non- blind or private [3], if cover image is not used to decode the watermark bits that are known as

Welcome message from author
This document is posted to help you gain knowledge. Please leave a comment to let me know what you think about it! Share it to your friends and learn new things together.
Transcript
Nagaraj V.Dharwadkar & B. B. Amberker
International Journal of Image Processing Volume (4): Issue (2) 89
Determining the Efficient Subband Coefficients of Biorthogonal Wavelet for Gray level Image Watermarking
Nagaraj V. Dharwadkar [email protected] PhD Scholar, Department of Computer Science and Engineering National Institute of Technology (NIT) Warangal, (A.P), INDIA B. B. Amberker [email protected] Professor, Department of Computer Science and Engineering National Institute of Technology (NIT) Warangal, (A.P), INDIA
Abstract
In this paper, we propose an invisible blind watermarking scheme for the gray-level images. The cover image is decomposed using the Discrete Wavelet Transform with Biorthogonal wavelet filters and the watermark is embedded into significant coefficients of the transformation. The Biorthogonal wavelet is used because it has the property of perfect reconstruction and smoothness. The proposed scheme embeds a monochrome watermark into a gray-level image. In the embedding process, we use a localized decomposition, means that the second level decomposition is performed on the detail sub-band resulting from the first level decomposition. The image is decomposed into first level and for second level decomposition we consider Horizontal, vertical and diagonal subband separately. From this second level decomposition we take the respective Horizontal, vertical and diagonal coefficients for embedding the watermark. The robustness of the scheme is tested by considering the different types of image processing attacks like blurring, cropping, sharpening, Gaussian filtering and salt and pepper noise effect. The experimental result shows that the embedding watermark into diagonal subband coefficients is robust against different types of attacks. Keywords: Watermarking, DWT, RMS, MSE, PSNR.
1. INTRODUCTION The digitized media content is becoming more and more important. However, due to the popularity of the Internet and characteristics of digital signals, circumstantial problems are also on the rise. The rapid growth of digital imagery coupled with the ease by which digital information can be duplicated and distributed has led to the need for effective copyright protection tools. From this point of view, digital watermark is a promising technique to protect data from illicit copying [1][2]. The classification of watermarking algorithm is done on several view points. One of the viewpoints is based on usage of cover image to decode the watermark, which is known as Non-blind or private [3], if cover image is not used to decode the watermark bits that are known as
Nagaraj V.Dharwadkar & B. B. Amberker
International Journal of Image Processing Volume (4): Issue (2) 90
Blind or public watermarking algorithm [4]. Another view point is based on processing domain spatial domain or frequency. Many techniques have been proposed in the spatial domain, such as the LSB (least significant bit) insertion [5][6], these schemes usually have features of small computation and large hidden information, but the drawback is with weak in robustness. The others are based on the transformation techniques, such as, based on DCT domain, DFT domain and DWT domain etc. The latter becomes more popular due to the natural framework for incorporating perceptual knowledge into the embedded algorithm with conducive to achieve better perceptual quality and robustness [7]. Recently the Discrete Wavelet Transformation gained popularity since the property of multi-resolution analysis that it provides. There are two types of wavelets; Wavelets can be orthogonal (orthonormal) or Biorthogonal. Most of the wavelets used in watermarking were orthogonal wavelets. The scheme in [8] introduces a semi-fragile watermarking technique that uses orthogonal wavelets. Very few watermarking algorithms used Biorthogonal wavelets. The Biorthogonal wavelet transform is an invertible transform. It has some favorable properties over the orthogonal wavelet transform, mainly, the property of perfect reconstruction and smoothness. Kundur and Hatzinakos [9] suggested a non-blind watermarking model using Biorthogonal wavelets based on embedding a watermark in detail wavelet coefficients of the host image. The results showed that the model was robust against numerous signal distortions, but it is non-blind watermarking algorithm that required the presence of the watermark at the detection and extraction phases. One of the main differences of our technique than other wavelet watermarking scheme is in decomposing the host image. Our scheme decomposes the image using first level Biorthogonal wavelet then obtains the detail information of sub-band (LH or HL or HH) of it to be further decomposed as in [12], except we are directly embedding watermark bits by changing the frequency coefficients of subbands. Here we are not using pseudo random number sequence to represent watermark, directly the frequency coefficients are modified by multiplying with bits of watermark. In extraction algorithm we don’t need cover image its blind watermarking algorithm. The watermark is extracted by scanning the modified frequency coefficients. We evaluated essential elements of a proposed method, i.e. robustness and imperceptible under different embedding strengths. Robustness refers to the ability to survive intentional attacks as well as accidental modifications, for instance we took Blurring, noise insertion, region cropping, and sharpening as a intentional attacks. Imperceptibility or fidelity means the perceptual similarity between the watermarked image and its cover image using Entropy, Standard Deviation, RMS, MSE and PSNR parameters. The paper is organized as follows: In Section 2, we describe the Biorthogonal Wavelet Transformations. In Section 3, we describe the proposed watermark embedding and extraction model. In Section 4, we present our results. Finally, in section 5, we compare our method with reference and in Section 6, we conclude our paper
2. BIORTHOGONAL WAVELET TRANSFORMATIONS
The DWT (Discrete Wavelet Transform) transforms discrete signal from time domain into time-frequency domain. The transformation product is set of coefficients organized in the way that enables not only spectrum analyses of the signal, but also spectral behavior of the signal in time. Wavelets have the property of smoothness [10]. Such properties are available in both orthogonal and Biorthogonal wavelets. However, there are special properties that are not available in the orthogonal wavelets, but exist in Biorthogonal wavelets, that are the property of exact reconstruction and symmetry. Another advantageous property of Biorthogonal over orthogonal wavelets is that they have higher embedding capacity if they are used to decompose the image into different channels. All these properties make Biorthogonal wavelets promising in the watermarking domain [11].
Nagaraj V.Dharwadkar & B. B. Amberker
International Journal of Image Processing Volume (4): Issue (2) 91
2.1 Biorthogonal Wavelet System
Let (L, R) be the wavelet matrix pair of rank m and genus g and let :f Z mZ C be any discrete function. Then
1
0
'( )m
rrk n mk
r k Z
af n C
(1)
With
( ) r
n mkr n Zk
f n
m
aC
(2)
We can write this in the form
1
0
( ( ) )( )
'm
r r
n mk n mkr k Z n Z
f nf n
m
a a
(3)
We call r
n mkL a the analysis matrix of the wavelet matrix pair and 'r
n mkR a is the
synthesis matrix of wavelet matrix pair, and they can also be referred to simply left and right matrices in the pairing (L, R) The terminology refers to the fact that the left matrix in the above equation is used for analyzing the function in terms of wavelet coefficients and the right matrix is used for reconstructing or synthesizing the function as the linear combination of vectors formed from its coefficients. This is simply a convention, as a role of matrices can be interchanged, but in practice it can be quite useful convention. For instance, certain analysis wavelet functions can be chosen to be less smooth than the corresponding synthesis functions, and this trade-off is useful in certain contexts.
If f is a discrete function and
1
0
( )m
rrk n mk
r k Z
af n C
(4)
Equation (4) is its expansion relative to wavelet matrix A, then the formula
22
n r k
rkn c (5)
is valid. This equation describes "energy" represented by function f is partitioned among the
orthonormal basis functions *( )r
mla For wavelet matrix pairs the formula that describes the
Nagaraj V.Dharwadkar & B. B. Amberker
International Journal of Image Processing Volume (4): Issue (2) 92
partition of energy is more complicated, since the expansion of both the L-basis and R-basis are involved. The corresponding formula is
2
'r r
k kn r k
n c c (6)
Where
'( ) 'r
n mkr n Zk
f n
m
aC
(7)
Let ( )r
kL a , ( )'r
kR a be a wavelet matrix pair, then the compactly supported functions in 2( )ZL of the form
{ , ', , , 1,..., 1}'r r
r m (8)
this satisfies the scaling and wavelet equations
(9)
( ) ( ), 1,..., 1r r
kk
x mx k r ma (10)
0'( ) '( )'kk
x mx ka (11)
( ) '( ), 1,..., 1' 'r r
kk
x mx k r ma (12)
{ ( ), '( )}x x are called Biorthogonal scaling functions and { , 1,..., 1}, 'r r
r m
Biorthogonal wavelet functions, respectively. We call functions { , }r
the analysis functions and
the function { ', }'r
the synthesis functions. Using the rescaling and translates of these
functions we have general Biorthogonal wavelet system associated with wavelet matrix pair (L, R) of the form.
( ), ( ), 1,..., 1r
k jkx x r m (13)
( ), ( ), 1,..., 1' 'r
k jkx x r m (14)
0( ) ( )kk
x mx ka
Nagaraj V.Dharwadkar & B. B. Amberker
International Journal of Image Processing Volume (4): Issue (2) 93
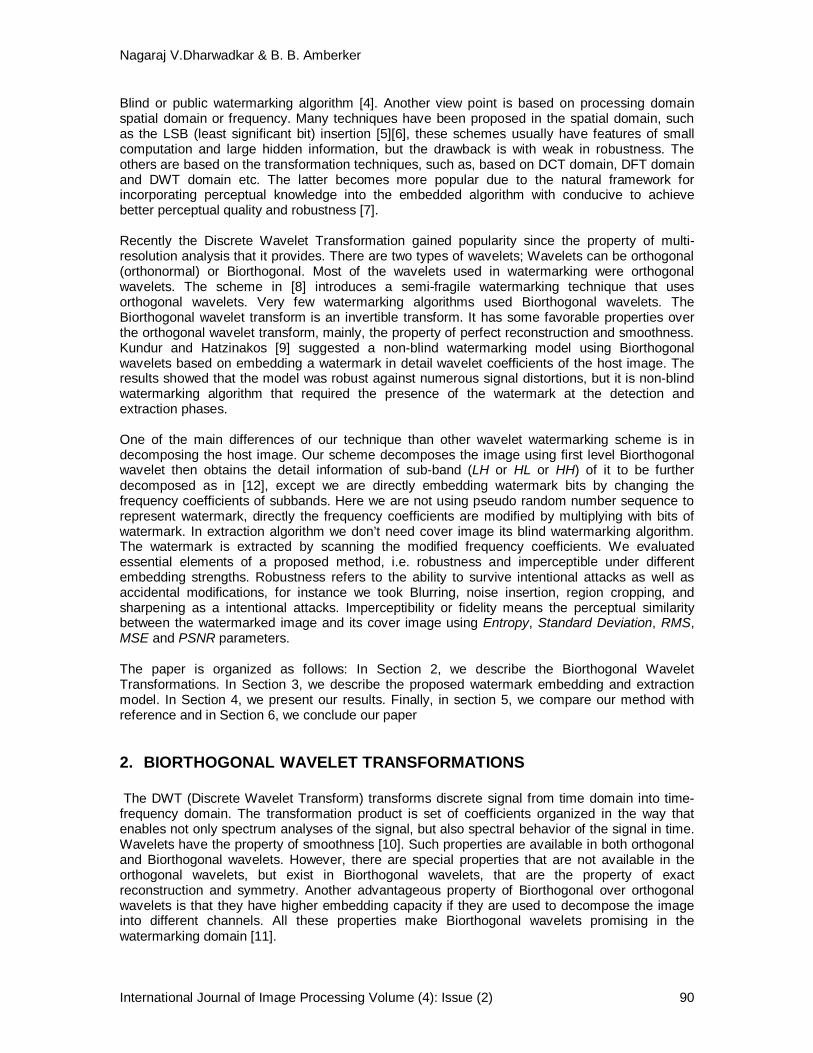
3. PROPOSED MODEL
In this section, we give a description about the proposed models used to embed and extract the watermark for gray-level image. The image is decomposed using Biorthogonal wavelet filters. Biorthogonal Wavelet coefficients are used in order to make the technique robust against several attacks, and preserve imperceptibility. The embedding algorithm and extraction algorithm for gray level images is explained in the following sections.
3.1 Watermark Embedding Algorithm
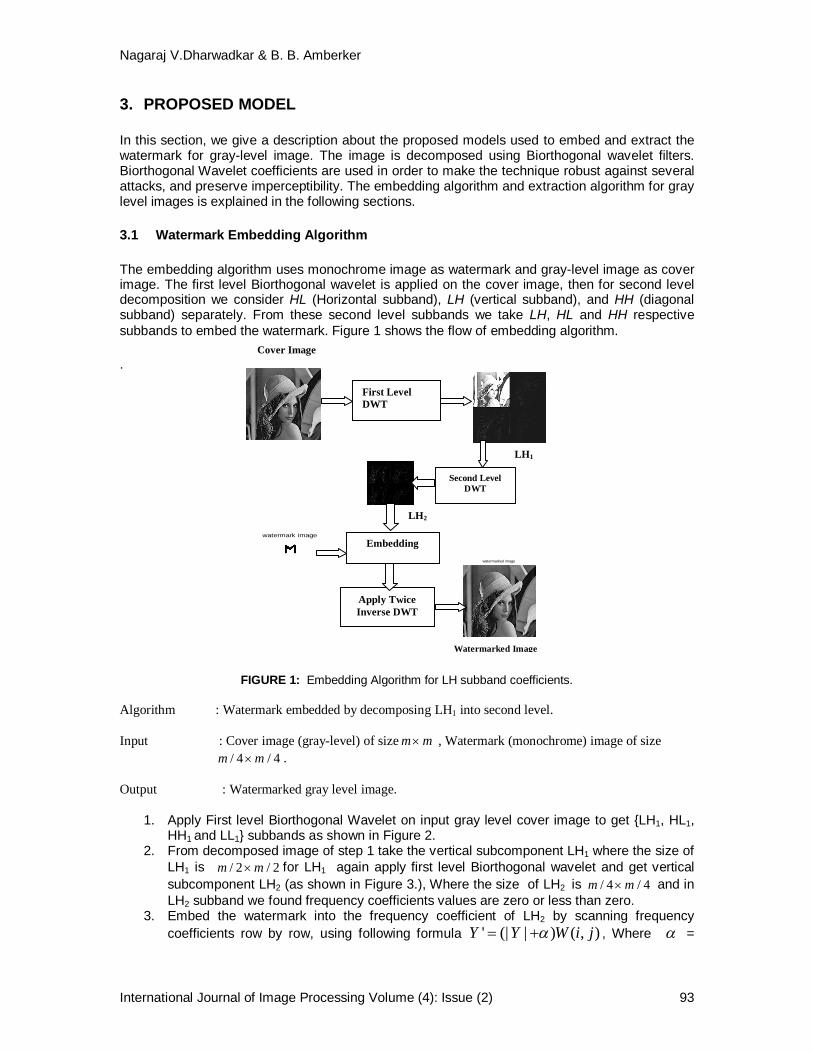
The embedding algorithm uses monochrome image as watermark and gray-level image as cover image. The first level Biorthogonal wavelet is applied on the cover image, then for second level decomposition we consider HL (Horizontal subband), LH (vertical subband), and HH (diagonal subband) separately. From these second level subbands we take LH, HL and HH respective subbands to embed the watermark. Figure 1 shows the flow of embedding algorithm.
.
FIGURE 1: Embedding Algorithm for LH subband coefficients. Algorithm : Watermark embedded by decomposing LH1 into second level. Input : Cover image (gray-level) of size m m , Watermark (monochrome) image of size
/ 4 / 4m m . Output : Watermarked gray level image.
1. Apply First level Biorthogonal Wavelet on input gray level cover image to get {LH1, HL1, HH1 and LL1} subbands as shown in Figure 2.
2. From decomposed image of step 1 take the vertical subcomponent LH1 where the size of LH1 is / 2 / 2m m for LH1 again apply first level Biorthogonal wavelet and get vertical subcomponent LH2 (as shown in Figure 3.), Where the size of LH2 is / 4 / 4m m and in LH2 subband we found frequency coefficients values are zero or less than zero.
3. Embed the watermark into the frequency coefficient of LH2 by scanning frequency coefficients row by row, using following formula ' (| | ) ( , )Y Y W i j , Where =
LH2
LH1
First Level DWT
watermark image
Embedding
Second Level DWT
Apply Twice Inverse DWT
watermarked image
Cover Image
Watermarked Image

Nagaraj V.Dharwadkar & B. B. Amberker
International Journal of Image Processing Volume (4): Issue (2) 94
0.009, Y is original frequency coefficient of LH2 subband, if watermark bit is zero then Y ' = 0 else Y’ > 1.
4. Apply inverse Biorthogonal Wavelet transformation two times to obtain watermarked gray level image.
5. Similarly the watermark is embedded separately into the HL (Horizontal) and HH (diagonal) subband frequency coefficients.
FIGURE 2: First Level Decomposition
FIGURE 3: Second Level Decomposition of LH1
3.2 Watermark Extraction Algorithm In extraction algorithm the first level Biorthogonal wavelet is applied on the watermarked gray-scale image. For second level decomposition we consider LH1 (Vertical subband) and from this second level decomposed image we take LH2 subband to extract the watermark. The extraction algorithm is as shown in Figure 4.
FIGURE 4: Extracting watermark from LH1 subband
LL1
HL1
HH1
LH1
LL1
HL1
HH1
LL2
LH2 HH2
HH2
LH2
LH1
First Level DWT
watermark image
Extraction
Second Level DWT
Cover Image
Nagaraj V.Dharwadkar & B. B. Amberker
International Journal of Image Processing Volume (4): Issue (2) 95
Algorithm : Watermark Extracted by decomposing LH1 into second level. Input : Watermarked Cover image (gray-level) of size m m . Output : Watermark.
1. Apply First level Biorthogonal Wavelet on watermarked gray level cover image to get {LH1, HL1, HH1 and LL1} subbands.
2. From decomposed image of step 1 take the vertical subcomponent LH1 where the size of LH1 is / 2 / 2m m for LH1 again apply first level Biorthogonal wavelet and get vertical subcomponent LH2 (as shown in Figure 3.), Where the size of LH2 is / 4 / 4m m .
3. From the subband LH2 extract the watermark by scanning frequency coefficients row by row. If frequency coefficient is greater than zero set watermark bit as 1 else set 0.
4. Similarly the watermark is extracted from the HL (Horizontal) and HH (diagonal) subband frequency coefficients.
4. RESULTS AND DISCUSSION The performance of embedding and extraction algorithm are analyzed by considering Lena image of size 256 256 as cover image and M-logo (Monochrome) image of size 30 35 as a watermark. The following parameters are used to measure the performance of embedding and extraction algorithms.
1. Standard Correlation ( SC) : It measures how the pixel values of original image is correlated with the pixel values of modified image. When there is no distortion in modified image, then SC will be 1.
Here, I(i, j) is original watermark, J(i, j) is extracted watermark, I' is the mean of original watermark and J’ is mean of extracted watermark.
2. Normalized Correlation (NC) : It measure the similarity representation between the original image and modified image.
Where I (i, j) is original image and I’(i, j) is modified image, M is Height of image and N is width of image
3. Mean Square Error (MSE): It measures the average of the square of the "error." The error is the amount by which the pixel value of original image differs to the pixel value of modified image.
[ ( ( , ) ' ) ( ( , ) ') ]1 1
2 2[ ( ( , ) ') ] [ ( ( , ) ' ) ]
1 1 1 1
M NI i j I J i j J
i jS CM N M NI i j I J i j Ji j i j
2
( , ) '( , )1 1
( , )1 1
M NI i j I i j
i j
M NI i j
i j
N C
2[ ( , ) '( , )]
1 1
M Nf i j f i j
i jMSEMN
Nagaraj V.Dharwadkar & B. B. Amberker
International Journal of Image Processing Volume (4): Issue (2) 96
Where, M and N are the height and width of image respectively. f(i, j) is the (i, j)th pixel value of the original image and f ′( i, j) is the (i, j)th pixel value of modified image.
4. Peak signal to noise ratio (PSNR): It is the ratio between the maximum possible
power of a signal and the power of corrupting noise that affects the fidelity of its representation. PSNR is usually expressed in terms of the logarithmic decibel. PSNR is given by.
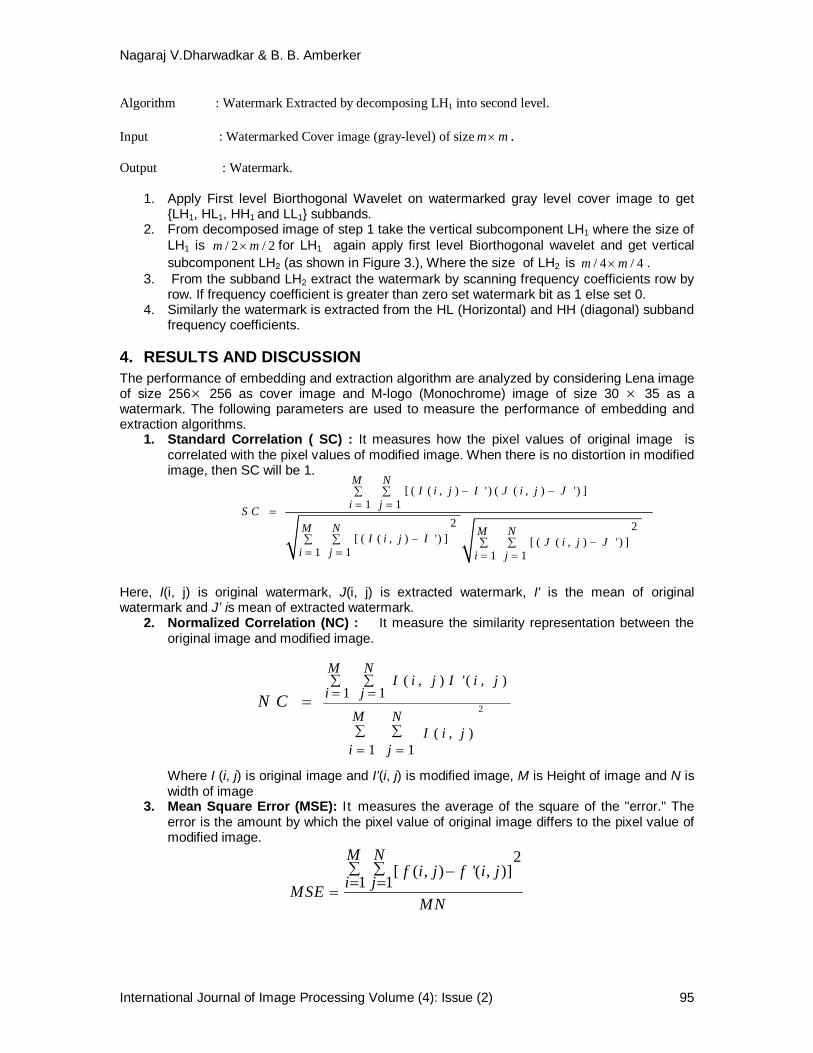
4.1 Measuring Perceptual quality of watermarked image In this section we discuss the effect of embedding algorithm on cover image in terms of perceptual similarity between the original image and watermarked image using Mean, Standard Deviation, RMS and Entropy. The effect of extraction algorithm is calculated using MSE, PSNR, NC and SC between extracted and original watermark. As shown in Figure 5, watermark is embedded by decomposing LH1, HL1, HH1 separately further in second level and the quality of original gray scale image and watermarked image are compared. The parameters such as Mean, Standard Deviation, RMS and Entropy are calculated between the original gray level image and watermarked image. The results shows that there is only slight variation exist in above mentioned parameters. This indicates that the embedding algorithm will modify the content of original image by negligible amount. The amount of noise added to gray-level cover image is calculated by using MSE and PSNR. Thus the results from the experiments indicates that the embedding watermark into HH (diagonal) subband produces the better results in terms of MSE and high PSNR compared to other subbands.
FIGURE 5: Effect of Embedding algorithm in LH, HL and HH subband of cover image
LH SUBBAND HL SUBBAND HH SUBBAND Paramete
r Original image
Watermarked image
Original image
Watermarked image Original image Watermarked
image
Mean 97.18
97.18
97.18 97.18 97.18 97.18
RMS 110.51
110.52
110.51 110.52 110.51 110.51
Standard deviation
52 . 62
52 . 63
52 . 61 52.63 52.61 52.62
Entropy 7.57
7.58
7.57 7.58 7.57
7.58
MSE 1.39
1.11 0.72
PSNR 46.68 47.68 49.54
2( 1)210log
nPSNR
MSE
lena256.bmp
Nagaraj V.Dharwadkar & B. B. Amberker
International Journal of Image Processing Volume (4): Issue (2) 97
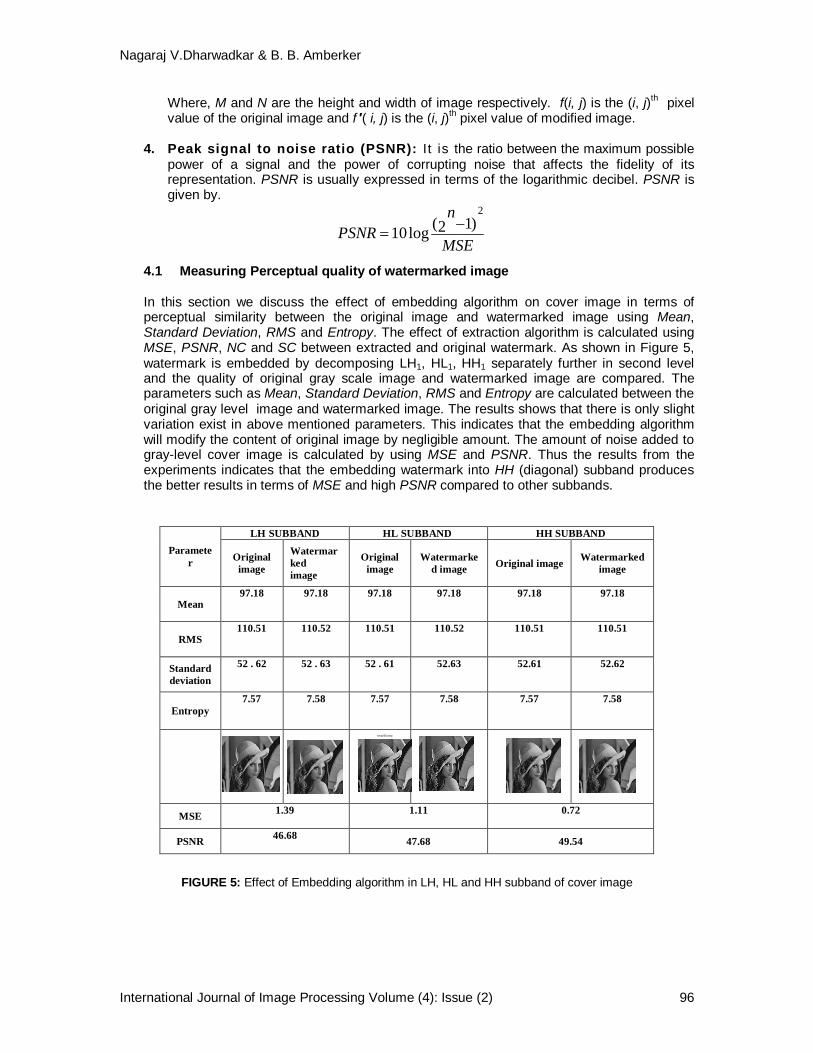
Parameter LH SUBBAND HL SUBBAND HH SUBBAND MSE 0.11 0.11 0.11 PSNR 57.41 57.44 57.48
Normalized correlation 1 1 1 Standard correlation 0.69 0.65 0.65
Original watermark
Extracted watermark
FIGURE 6: Effect of Extraction algorithm from LH, HL and HH subband coefficients on Watermark
Figure 6 shows the results of Watermark extraction by decomposing LH1, HL1, HH1 separately further in second level and the quality of Extracted watermark and original watermark are compared. The parameters such as MSE, PSNR, NC and SC are calculated between the extracted and original watermark. The results show that the extraction algorithm produces similar results for all subbands in terms above mentioned parameters.
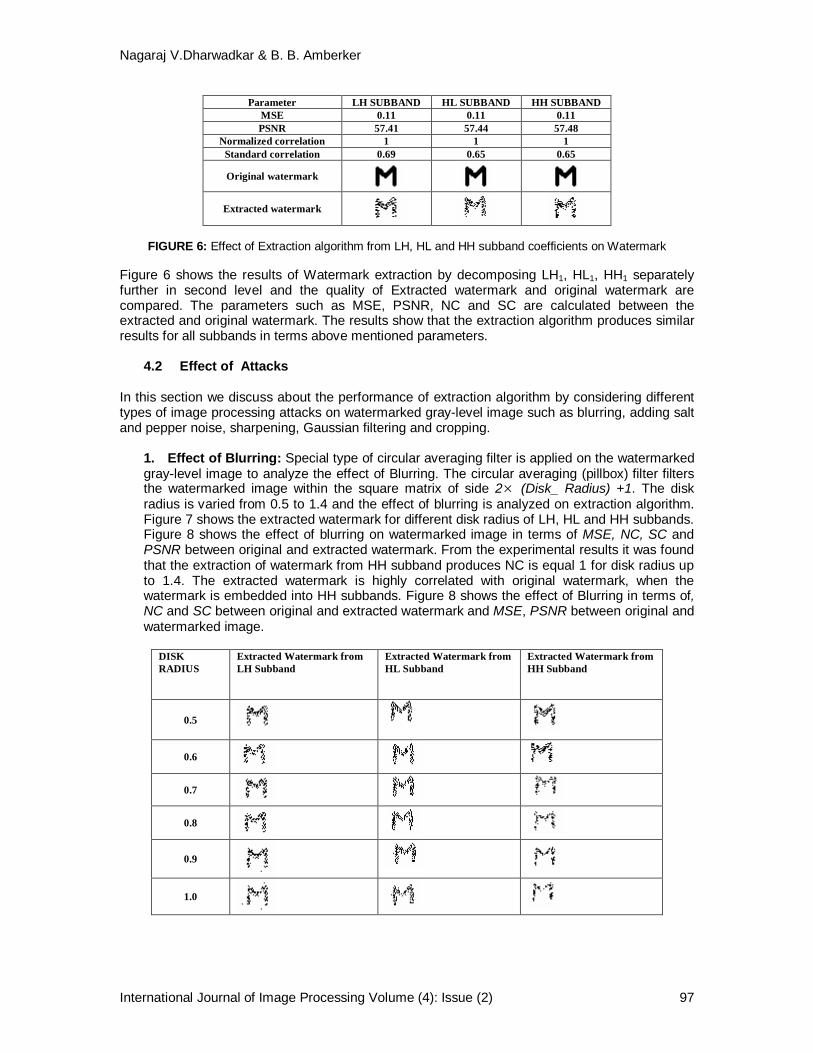
4.2 Effect of Attacks In this section we discuss about the performance of extraction algorithm by considering different types of image processing attacks on watermarked gray-level image such as blurring, adding salt and pepper noise, sharpening, Gaussian filtering and cropping.
1. Effect of Blurring: Special type of circular averaging filter is applied on the watermarked gray-level image to analyze the effect of Blurring. The circular averaging (pillbox) filter filters the watermarked image within the square matrix of side 2 (Disk_ Radius) +1. The disk radius is varied from 0.5 to 1.4 and the effect of blurring is analyzed on extraction algorithm. Figure 7 shows the extracted watermark for different disk radius of LH, HL and HH subbands. Figure 8 shows the effect of blurring on watermarked image in terms of MSE, NC, SC and PSNR between original and extracted watermark. From the experimental results it was found that the extraction of watermark from HH subband produces NC is equal 1 for disk radius up to 1.4. The extracted watermark is highly correlated with original watermark, when the watermark is embedded into HH subbands. Figure 8 shows the effect of Blurring in terms of, NC and SC between original and extracted watermark and MSE, PSNR between original and watermarked image.
DISK RADIUS
Extracted Watermark from LH Subband
Extracted Watermark from HL Subband
Extracted Watermark from HH Subband
0.5
0.6
0.7
0.8
0.9
1.0
Nagaraj V.Dharwadkar & B. B. Amberker
International Journal of Image Processing Volume (4): Issue (2) 98
1.1
1.2
1.3
1.4
FIGURE 7: Extracted watermark from Blurred watermarked Gray-level images using LH, HL
and HH subbands (a) MSE between Original and Extracted Watermark (b) NC between Original and Extracted Watermark
(c) SC between Original and Extracted Watermark (d ) PSNR between Original and Extracted Watermark
FIGURE 8: Effect of Blurring on watermarked Grayscale image
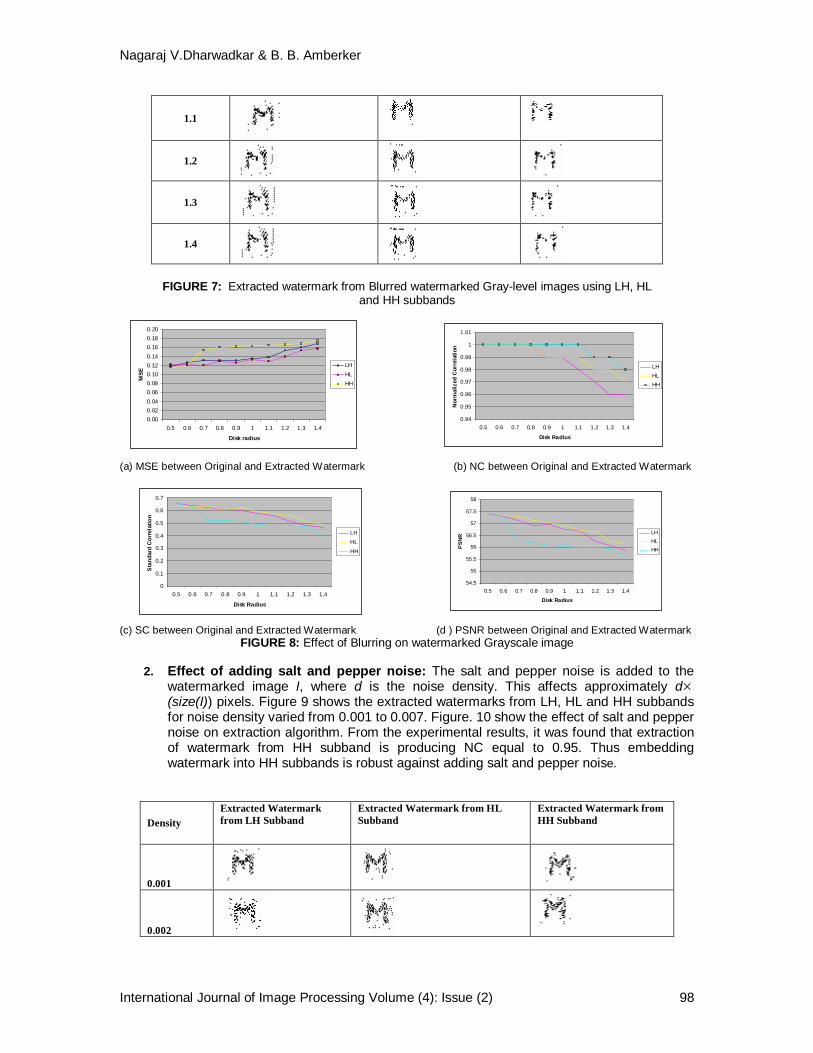
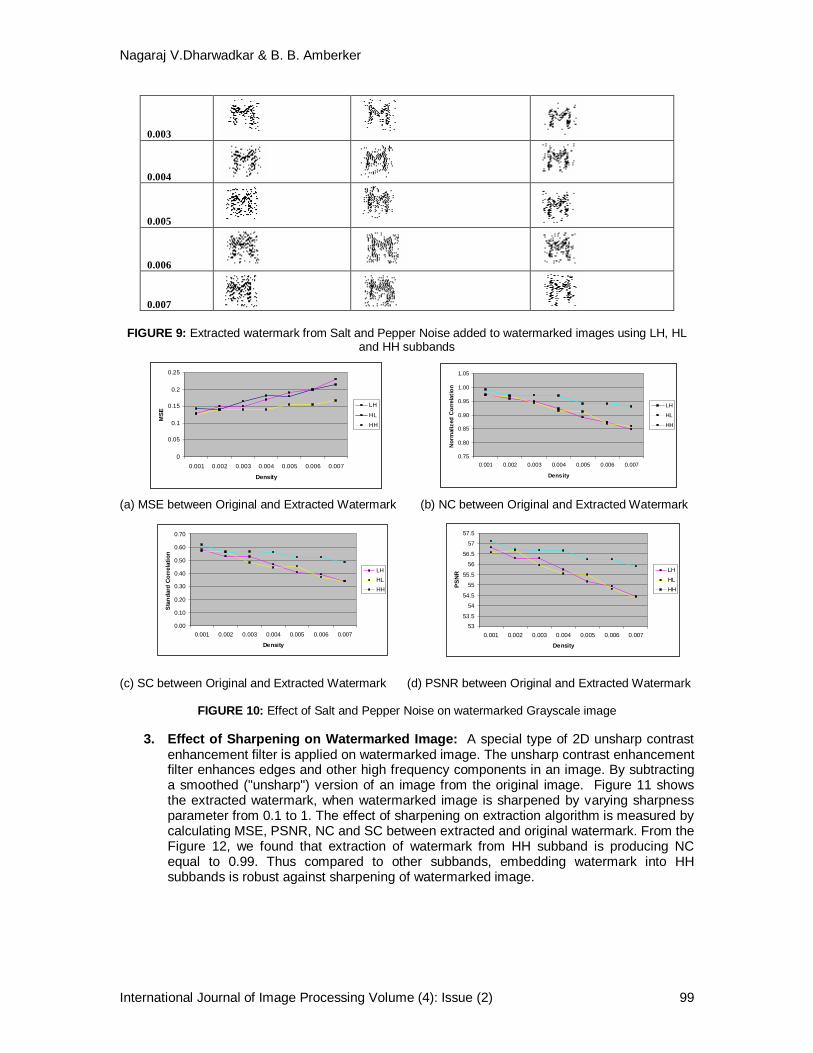
2. Effect of adding salt and pepper noise: The salt and pepper noise is added to the watermarked image I, where d is the noise density. This affects approximately d (size(I)) pixels. Figure 9 shows the extracted watermarks from LH, HL and HH subbands for noise density varied from 0.001 to 0.007. Figure. 10 show the effect of salt and pepper noise on extraction algorithm. From the experimental results, it was found that extraction of watermark from HH subband is producing NC equal to 0.95. Thus embedding watermark into HH subbands is robust against adding salt and pepper noise.
Density
Extracted Watermark from LH Subband
Extracted Watermark from HL Subband
Extracted Watermark from HH Subband
0.001
0.002
0.000.020.040.060.080.100.120.140.160.180.20
0.5 0.6 0.7 0.8 0.9 1 1.1 1.2 1.3 1.4
Disk radius
MSE
LHHLHH
0.94
0.95
0.96
0.97
0.98
0.99
1
1.01
0.5 0.6 0.7 0.8 0.9 1 1.1 1.2 1.3 1.4
Disk Radius
Nor
mal
ized
Cor
rela
tion
LHHLHH
0
0.1
0.2
0.3
0.4
0.5
0.6
0.7
0.5 0.6 0.7 0.8 0.9 1 1.1 1.2 1.3 1.4
Disk Radius
Sta
ndar
d C
orre
latio
n
LHHLHH
54.5
55
55.5
56
56.5
57
57.5
58
0.5 0.6 0.7 0.8 0.9 1 1.1 1.2 1.3 1.4
Disk Radius
PSN
R LHHLHH
Nagaraj V.Dharwadkar & B. B. Amberker
International Journal of Image Processing Volume (4): Issue (2) 99
0.003
0.004
0.005
0.006
0.007
FIGURE 9: Extracted watermark from Salt and Pepper Noise added to watermarked images using LH, HL and HH subbands
(a) MSE between Original and Extracted Watermark (b) NC between Original and Extracted Watermark
(c) SC between Original and Extracted Watermark (d) PSNR between Original and Extracted Watermark
FIGURE 10: Effect of Salt and Pepper Noise on watermarked Grayscale image
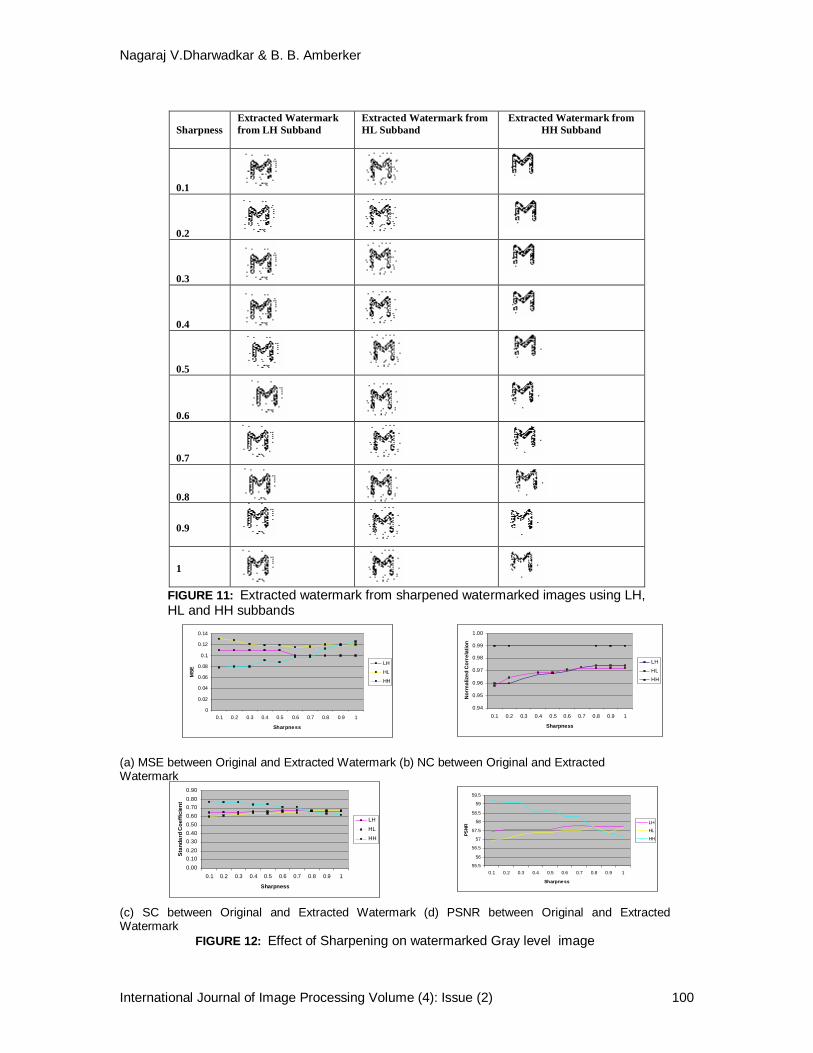
3. Effect of Sharpening on Watermarked Image: A special type of 2D unsharp contrast enhancement filter is applied on watermarked image. The unsharp contrast enhancement filter enhances edges and other high frequency components in an image. By subtracting a smoothed ("unsharp") version of an image from the original image. Figure 11 shows the extracted watermark, when watermarked image is sharpened by varying sharpness parameter from 0.1 to 1. The effect of sharpening on extraction algorithm is measured by calculating MSE, PSNR, NC and SC between extracted and original watermark. From the Figure 12, we found that extraction of watermark from HH subband is producing NC equal to 0.99. Thus compared to other subbands, embedding watermark into HH subbands is robust against sharpening of watermarked image.
0
0.05
0.1
0.15
0.2
0.25
0.001 0.002 0.003 0.004 0.005 0.006 0.007
Density
MSE
LH
HLHH
0.75
0.80
0.85
0.90
0.95
1.00
1.05
0.001 0.002 0.003 0.004 0.005 0.006 0.007
Density
Nor
mal
ized
Cor
rela
tion
LH
HL
HH
0.00
0.10
0.20
0.30
0.40
0.50
0.60
0.70
0.001 0.002 0.003 0.004 0.005 0.006 0.007
Density
Sta
ndar
d C
orre
latio
n
LHHLHH
5353.5
54
54.5
55
55.5
56
56.5
57
57.5
0.001 0.002 0.003 0.004 0.005 0.006 0.007
Density
PSN
R LHHLHH
Nagaraj V.Dharwadkar & B. B. Amberker
International Journal of Image Processing Volume (4): Issue (2) 100
Sharpness
Extracted Watermark from LH Subband
Extracted Watermark from HL Subband
Extracted Watermark from HH Subband
0.1
0.2
0.3
0.4
0.5
0.6
0.7
0.8
0.9
1
FIGURE 11: Extracted watermark from sharpened watermarked images using LH, HL and HH subbands
(a) MSE between Original and Extracted Watermark (b) NC between Original and Extracted Watermark (c) SC between Original and Extracted Watermark (d) PSNR between Original and Extracted Watermark
FIGURE 12: Effect of Sharpening on watermarked Gray level image
0
0.02
0.04
0.06
0.08
0.1
0.12
0.14
0.1 0.2 0.3 0.4 0.5 0.6 0.7 0.8 0.9 1
Sharpness
MSE
LH
HL
HH
0.94
0.95
0.96
0.97
0.98
0.99
1.00
0.1 0.2 0.3 0.4 0.5 0.6 0.7 0.8 0.9 1
Sharpness
Nor
mal
ized
Cor
rela
tion
LH
HLHH
0.000.100.200.300.400.500.600.700.800.90
0.1 0.2 0.3 0.4 0.5 0.6 0.7 0.8 0.9 1
Sharpness
Stan
dard
Coe
ffici
ent
LH
HL
HH
55.5
56
56.5
57
57.5
58
58.5
59
59.5
0.1 0.2 0.3 0.4 0.5 0.6 0.7 0.8 0.9 1
Sharpness
PSNR
LH
HL
HH
Nagaraj V.Dharwadkar & B. B. Amberker
International Journal of Image Processing Volume (4): Issue (2) 101
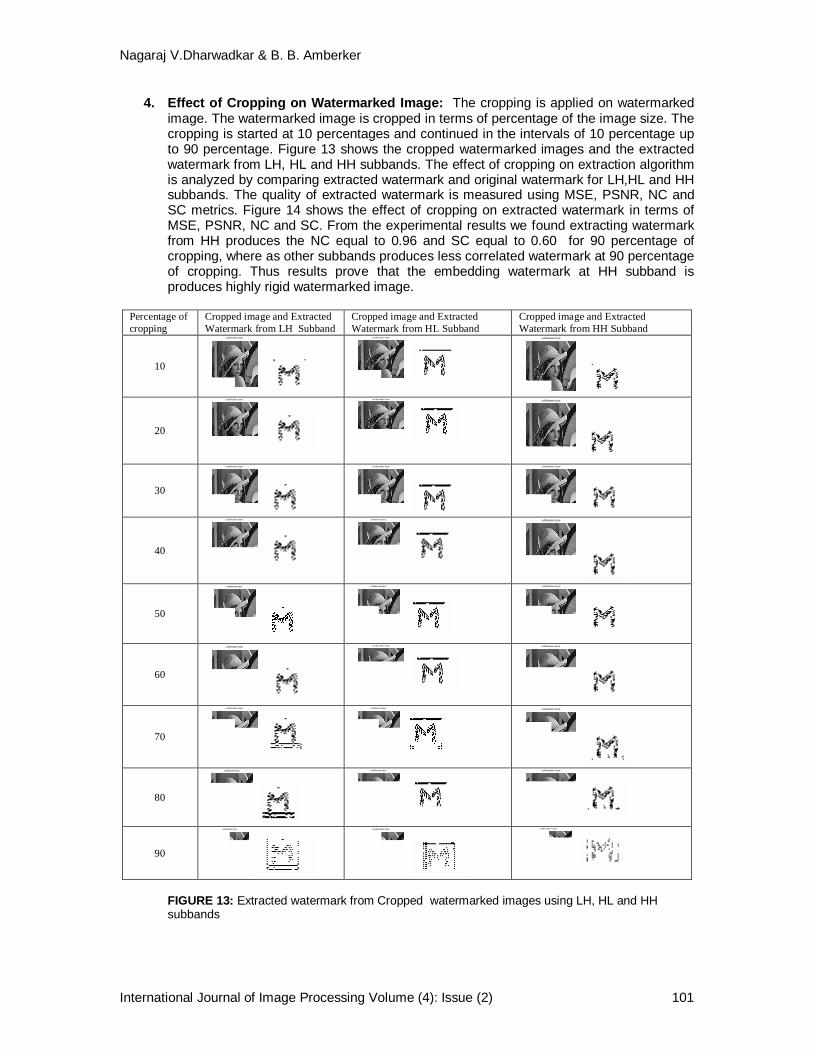
4. Effect of Cropping on Watermarked Image: The cropping is applied on watermarked image. The watermarked image is cropped in terms of percentage of the image size. The cropping is started at 10 percentages and continued in the intervals of 10 percentage up to 90 percentage. Figure 13 shows the cropped watermarked images and the extracted watermark from LH, HL and HH subbands. The effect of cropping on extraction algorithm is analyzed by comparing extracted watermark and original watermark for LH,HL and HH subbands. The quality of extracted watermark is measured using MSE, PSNR, NC and SC metrics. Figure 14 shows the effect of cropping on extracted watermark in terms of MSE, PSNR, NC and SC. From the experimental results we found extracting watermark from HH produces the NC equal to 0.96 and SC equal to 0.60 for 90 percentage of cropping, where as other subbands produces less correlated watermark at 90 percentage of cropping. Thus results prove that the embedding watermark at HH subband is produces highly rigid watermarked image.
Percentage of cropping
Cropped image and Extracted Watermark from LH Subband
Cropped image and Extracted Watermark from HL Subband
Cropped image and Extracted Watermark from HH Subband
10
out filename.bmp
out filename.bmp
outfilename.bmp
20
out filename.bmp
out filename.bmp
outfilename.bmp
30
out filename.bmp
out filename.bmp
outfilename.bmp
40
out filename.bmp
outfilename.bmp
outfilename.bmp
50
outfilename.bmp
outfilename.bmp
outfilename.bmp
60
out filename.bmp
out filename.bmp
outfilename.bmp
70
out filename.bmp
outfilename.bmp
outfilename.bmp
80
outfilename.bmp
outfilename.bmp
outfilename.bmp
90
outfi lename.bmp
out filename.bmp
out filename.bmp
FIGURE 13: Extracted watermark from Cropped watermarked images using LH, HL and HH subbands

Nagaraj V.Dharwadkar & B. B. Amberker
International Journal of Image Processing Volume (4): Issue (2) 102
(a) MSE between Original and Extracted Watermark (b) NC between Original and Extracted Watermark
(c) SC between Original and Extracted Watermark (d) PSNR between Original and Extracted Watermark FIGURE 14: Effect of Cropping on watermarked Gray-level image
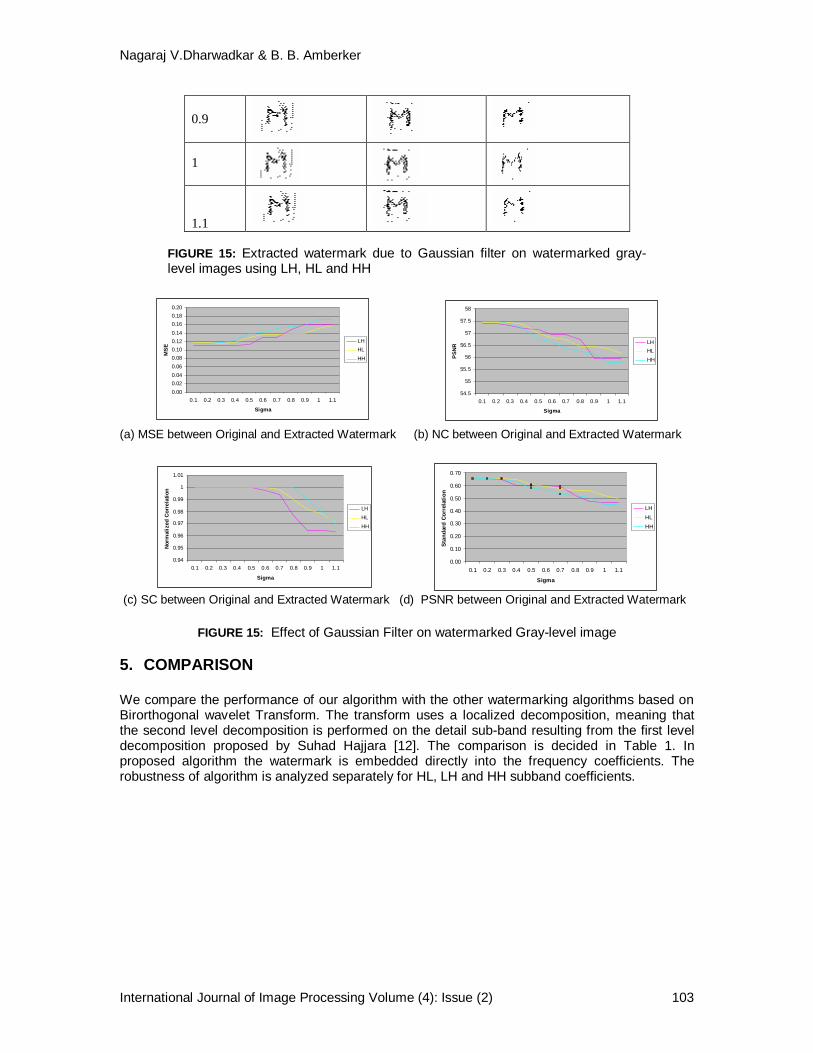
5. Effect of Gaussian filters: Two dimensional Gaussian filter is applied on the
watermarked image with standard deviation sigma (positive) varying from 0.1 to 1.1. Figure 15 shows the extracted watermark by applying Gaussian filter on watermarked image. The effect of Gaussian filter on extraction algorithm is analyzed by measuring MSE, PSNR, NC and SC parameters between the extracted and original watermark. These parameters are shown in the Figure 16. From the experimental results, we found that the extraction of watermark from HH subband producing SC and NC between extracted and original watermark is equal to 0.5 and 0.98 with standard deviation sigma equal to 1, which is higher than other subbands. Thus embedding watermark into HH subband produces the watermarked image which is robust against Gaussian filters.
Sigma
Extracted Watermark from LH Subband
Extracted Watermark from HL Subband
Extracted Watermark from HH Subband
0.1
0.2
0.3
0.4
0.5
0.6
0.7
0.8
0.00
0.05
0.10
0.15
0.20
0.25
0.30
10 20 30 40 50 60 70 80 90
Percentage of Cropping
MSE
LH
HL
HH
0.820.840.860.880.900.920.940.960.981.001.02
10 20 30 40 50 60 70 80 90
Percentage of Cropping
Nor
mal
ized
Cor
rela
tion
LH
HL
HH
0.00
0.10
0.20
0.30
0.40
0.50
0.60
0.70
10 20 30 40 50 60 70 80 90
Percentage of Cropping
Stan
dard
Cor
rela
tion
LhHLHH
52
53
54
55
56
57
58
10 20 30 40 50 60 70 80 90
Percentage of Cropping
PS
NR LH
HLHH
Nagaraj V.Dharwadkar & B. B. Amberker
International Journal of Image Processing Volume (4): Issue (2) 103
0.9
1
1.1
FIGURE 15: Extracted watermark due to Gaussian filter on watermarked gray-level images using LH, HL and HH
(a) MSE between Original and Extracted Watermark (b) NC between Original and Extracted Watermark
(c) SC between Original and Extracted Watermark (d) PSNR between Original and Extracted Watermark
FIGURE 15: Effect of Gaussian Filter on watermarked Gray-level image
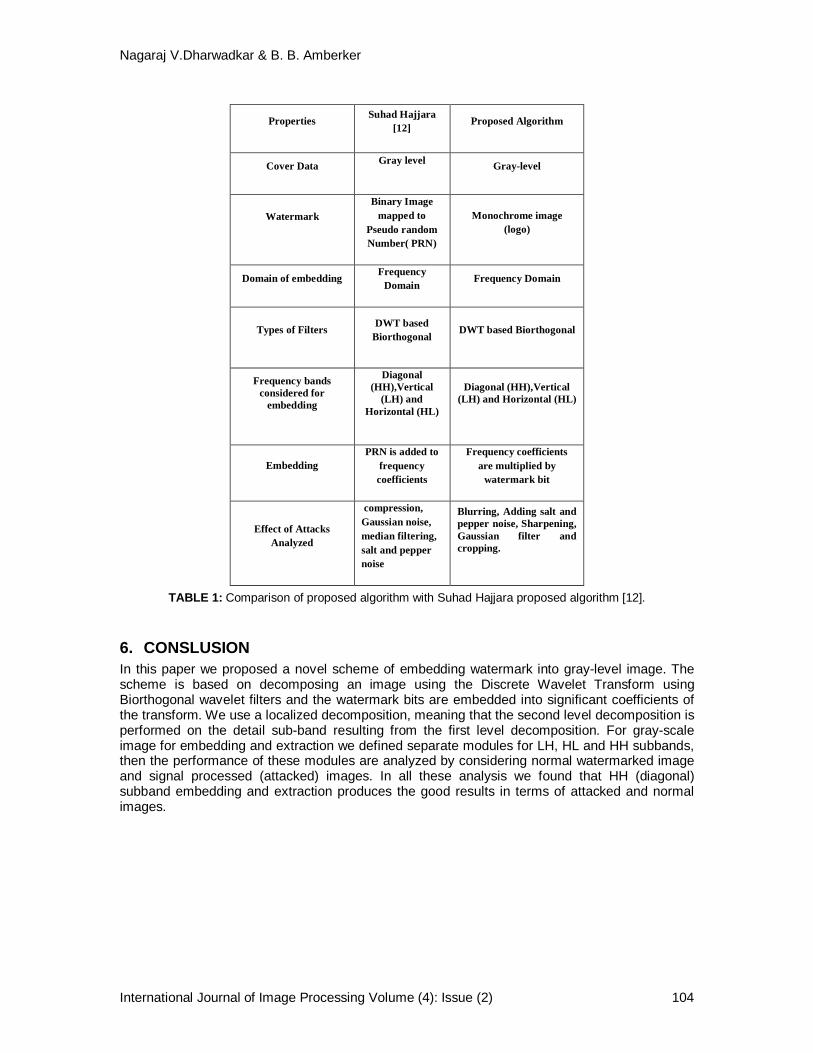
5. COMPARISON
We compare the performance of our algorithm with the other watermarking algorithms based on Birorthogonal wavelet Transform. The transform uses a localized decomposition, meaning that the second level decomposition is performed on the detail sub-band resulting from the first level decomposition proposed by Suhad Hajjara [12]. The comparison is decided in Table 1. In proposed algorithm the watermark is embedded directly into the frequency coefficients. The robustness of algorithm is analyzed separately for HL, LH and HH subband coefficients.
0.000.020.040.060.080.100.120.140.160.180.20
0.1 0.2 0.3 0.4 0.5 0.6 0.7 0.8 0.9 1 1.1
Sigma
MS
E
LHHLHH
54.5
55
55.5
56
56.5
57
57.5
58
0.1 0.2 0.3 0.4 0.5 0.6 0.7 0.8 0.9 1 1.1
Sigma
PSN
R LHHLHH
0.94
0.95
0.96
0.97
0.98
0.99
1
1.01
0.1 0.2 0.3 0.4 0.5 0.6 0.7 0.8 0.9 1 1.1
Sigma
Nor
mal
ized
Cor
rela
tion
LHHLHH
0.00
0.10
0.20
0.30
0.40
0.50
0.60
0.70
0.1 0.2 0.3 0.4 0.5 0.6 0.7 0.8 0.9 1 1.1
Sigma
Stan
dard
Cor
rela
tion
LHHLHH
Nagaraj V.Dharwadkar & B. B. Amberker
International Journal of Image Processing Volume (4): Issue (2) 104
TABLE 1: Comparison of proposed algorithm with Suhad Hajjara proposed algorithm [12].
6. CONSLUSION In this paper we proposed a novel scheme of embedding watermark into gray-level image. The scheme is based on decomposing an image using the Discrete Wavelet Transform using Biorthogonal wavelet filters and the watermark bits are embedded into significant coefficients of the transform. We use a localized decomposition, meaning that the second level decomposition is performed on the detail sub-band resulting from the first level decomposition. For gray-scale image for embedding and extraction we defined separate modules for LH, HL and HH subbands, then the performance of these modules are analyzed by considering normal watermarked image and signal processed (attacked) images. In all these analysis we found that HH (diagonal) subband embedding and extraction produces the good results in terms of attacked and normal images.
Properties Suhad Hajjara [12]
Proposed Algorithm
Cover Data Gray level Gray-level
Watermark
Binary Image mapped to
Pseudo random Number( PRN)
Monochrome image (logo)
Domain of embedding Frequency Domain
Frequency Domain
Types of Filters DWT based Biorthogonal
DWT based Biorthogonal
Frequency bands considered for
embedding
Diagonal (HH),Vertical
(LH) and Horizontal (HL)
Diagonal (HH),Vertical (LH) and Horizontal (HL)
Embedding PRN is added to
frequency coefficients
Frequency coefficients are multiplied by
watermark bit
Effect of Attacks Analyzed
compression, Gaussian noise, median filtering, salt and pepper noise
Blurring, Adding salt and pepper noise, Sharpening, Gaussian filter and cropping.
Nagaraj V.Dharwadkar & B. B. Amberker
International Journal of Image Processing Volume (4): Issue (2) 105
7. REFERENCES 1. Ingemar J. Cox and Matt L. Miller, “The First 50 Years of Electronic Watermarking”,
EURASIP Journal on Applied Signal Processing Vol. 2, pp. 126–132, 2002. 2. G. Voyatzis, I. Pitas, “ Protecting digital image copyrights: A framework”, IEEE Computer
Graphics Application, Vol. 19, pp. 18-23, Jan. 1999. 3. Katzenbeisser S. and Petitcolas F. A. P., “Information Hiding Techniques for Steganography
and Digital Watermarking”, Artech House, UK, 2000. 4. Peter H. W. Wong, Oscar C. Au, Y. M. Yeung, “A Novel Blind Multiple Watermarking
Technique for Images”, IEEE Transactions on Circuits and Systems for Video Technology, Vol. 13, No. 8, August 2003.
5. Celik, M.U., et al., “Lossless generalized-LSB data embedding”, IEEE Transactions on Image Processing,, 14(2), pp.253-26, .2005.
6. Cvejic, N. and T. Seppanen, “Increasing robustness of LSB audio steganography by reduced distortion LSB coding”. Journal of Universal Computer Science, 11(1), pp. 56-65, 2005.
7. Ingemar J. Cox, Matthew L Miller, Jeffrey A. Bloom, Jassica Fridrich, Tan Kalker, “ Digital Watermarking and Steganography”, Second edition, M.K. Publishers, 2008.
8. Wu, X., J., Hu, Z.Gu, and J., Huang, 2005. “A Secure Semi-Fragile Watermarking for Image Authentication Based on Integer Wavelet Transform with Parameters”, Technical Report. School of Information Science and Technology, Sun Yat-Sen University, China, 2005
9. Kundur, D., and D., Hatzinakos, 1998. “Digital watermarking using multiresolution wavelet decomposition”, Technical Report., Dept. of Electrical and Computer Engineering, University of Toronto
10. Burrus, C. S., R. A., Gopinath, and H., Guo,. “Introduction to Wavelets and Wavelet Transforms: A Primer”, Prentice-Hall, Inc. 1998.
11. Daubechies, I., 1994. “Ten lectures on wavelets”, CBMS, SIAM, pp 271-280. 12. Suhad Hajjara, Moussa Abdallah, Amjad Hudaib, “Digital Image Watermarking Using
Localized Biorthogonal Wavelets”, European Journal of Scientific Research, ISSN 1450-216X Vol.26 No.4 (2009), pp.594-608 © EuroJournals Publishing, Inc. 2009.
Related Documents