JOURNAL OF PHYSICAL AGENTS, VOL. 4, NO. 2, MAY 2010 27 Determining High Safety Risk Scenarios by Applying Context Information Stewart Worrall, David Orchansky, Favio Masson, Juan Nieto and Eduardo Nebot Abstract—When mining vehicle operators take risks, there is a increased probability of an accident that can cause injuries, fatalities and large financial costs to the mine operators. It can be assumed that the operators do not intentially take unnecessarily high risk, and that the risks are hidden due to factors such as adverse weather, fatigue, visual obstructions, boredom, etc. This paper examines the potential of measuring the risk of danger in a multi-agent situation by using the safe rules of operation defined by mining safety management. The problem with measuring safety is that the safe rules of operation are heavily dependent on the context of the situation. What is considered normal practice and safe in one part of the mine (such as performing a u-turn in a parking lot) is not safe on a haul road. To be able to measure safety, it is therefore necessary to understand the different context areas in a mine so that feedback of unsafe behaviour presented to the operator is relevant to the context of the situation. This paper presents a novel method for generating context area information using the vehicle trajectory information collected from a group of vehicles interacting in an area. Results are presented using real-life data collected from several operating fleets of mining vehicles. The algorithms presented have potential application to a large variety of environments including Intelligent Transportation Systems (ITS). Index Terms—Vehicle Safety, Collision Avoidance, Context, Data Mining. I. I NTRODUCTION E ACH year there are hundreds of mine haulage accidents that result in significant number of deaths, lost-time injuries and large financial costs due to machine downtime and the repair of equipment. The majority of these accidents occur as a result of a human operator failing to comprehend the risks involved when operating of the vehicle. This paper examines how high risk situations can be detected using rules of safe operation, and the importance of context in determining the level of risk. This allows feedback to be provided to the vehicle operator in the event a high risk situation, enabling the operator to alter their actions to reduce the risk. An automated process for determining important context locations in a mine is presented, with results provided using real data collected from mining operations. This paper mainly refers to mining operations but the algorithms derived have application to all areas where diverse type of mobile agent interact within shared areas. These includes industrial appli- cations such as stevedoring and construction where mixture of Stewart Worrall, David Orchansky, Juan Nieto and Eduardo Nebot are with the Australian Center for Field Robotics at the University of Syd- ney. Favio Masson is with the Universidad Nacional del Sur. E-mail: [email protected] vehicles and people operate in a confined environment. It is also applicable to the Intelligent Transportation System area where we have high density of different type of agents such as vehicles, bikes, people operating in restricted areas such as road, intersections and parking lot. Fig. 1. (a) Dusty or (b) foggy conditions make it difficult for a vehicle operator to determine how close they are travelling to other vehicles. Section II presents current research in this area, which focuses primarily on determining the likelihood of an colli- sion occuring and warning the operator when the threat of collision is above some threshold. The problem with existing approaches is that it is often not possible to determine whether a situation will result in a collision with sufficient certainty (to minimise false alarms) until it is almost too late to avoid. This is considered to be a form of reactive feedback, and

Welcome message from author
This document is posted to help you gain knowledge. Please leave a comment to let me know what you think about it! Share it to your friends and learn new things together.
Transcript

JOURNAL OF PHYSICAL AGENTS, VOL. 4, NO. 2, MAY 2010 27
Determining High Safety Risk Scenarios byApplying Context Information
Stewart Worrall, David Orchansky, Favio Masson, Juan Nietoand Eduardo Nebot
Abstract—When mining vehicle operators take risks, there isa increased probability of an accident that can cause injuries,fatalities and large financial costs to the mine operators. It can beassumed that the operators do not intentially take unnecessarilyhigh risk, and that the risks are hidden due to factors such asadverse weather, fatigue, visual obstructions, boredom, etc. Thispaper examines the potential of measuring the risk of dangerin a multi-agent situation by using the safe rules of operationdefined by mining safety management.
The problem with measuring safety is that the safe rules ofoperation are heavily dependent on the context of the situation.What is considered normal practice and safe in one part of themine (such as performing a u-turn in a parking lot) is not safeon a haul road. To be able to measure safety, it is thereforenecessary to understand the different context areas in a mine sothat feedback of unsafe behaviour presented to the operatorisrelevant to the context of the situation. This paper presents anovel method for generating context area information usingthevehicle trajectory information collected from a group of vehiclesinteracting in an area. Results are presented using real-life datacollected from several operating fleets of mining vehicles.Thealgorithms presented have potential application to a largevarietyof environments including Intelligent Transportation Systems(ITS).
Index Terms—Vehicle Safety, Collision Avoidance, Context,Data Mining.
I. I NTRODUCTION
EACH year there are hundreds of mine haulage accidentsthat result in significant number of deaths, lost-time
injuries and large financial costs due to machine downtimeand the repair of equipment. The majority of these accidentsoccur as a result of a human operator failing to comprehendthe risks involved when operating of the vehicle. This paperexamines how high risk situations can be detected using rulesof safe operation, and the importance of context in determiningthe level of risk. This allows feedback to be provided to thevehicle operator in the event a high risk situation, enabling theoperator to alter their actions to reduce the risk.
An automated process for determining important contextlocations in a mine is presented, with results provided usingreal data collected from mining operations. This paper mainlyrefers to mining operations but the algorithms derived haveapplication to all areas where diverse type of mobile agentinteract within shared areas. These includes industrial appli-cations such as stevedoring and construction where mixtureof
Stewart Worrall, David Orchansky, Juan Nieto and Eduardo Nebot arewith the Australian Center for Field Robotics at the University of Syd-ney. Favio Masson is with the Universidad Nacional del Sur. E-mail:[email protected]
vehicles and people operate in a confined environment. It isalso applicable to the Intelligent Transportation System areawhere we have high density of different type of agents suchas vehicles, bikes, people operating in restricted areas such asroad, intersections and parking lot.
Fig. 1. (a) Dusty or (b) foggy conditions make it difficult fora vehicleoperator to determine how close they are travelling to othervehicles.
Section II presents current research in this area, whichfocuses primarily on determining the likelihood of an colli-sion occuring and warning the operator when the threat ofcollision is above some threshold. The problem with existingapproaches is that it is often not possible to determine whethera situation will result in a collision with sufficient certainty (tominimise false alarms) until it is almost too late to avoid.This is considered to be a form of reactive feedback, and

28 JOURNAL OF PHYSICAL AGENTS, VOL. 4, NO. 2, MAY 2010
it requires the operator to react quickly when an imminentcollision is detected. An examples is presented in [1] wheredifferent level of warning are generated according to theproximity of the center or side of the road. Other approachesrequires the sensing of location of other vehicles in proximityto generate some sort of alarm when some level of collisionrisk is evaluated. Furthermore, significant research to reducefalse alarms has been done estimating roads and probabilisticmethods to estimate time to collision with the evaluated roads[2], [3] [4].
An alternate approach presented in this paper is to providepreventitive feedback to the operators, meaning that the oper-ator is warned when the risk of collision is considered highbased on a predetermined set of safety rules. In the case of amining environment, this includes rules governing minimumsafe distances between vehicles, and speed limits for differentareas of the mine. The problem is that the rules of safeoperation change depending on the context of the situation.Context is a term introduced here to refer to the high levelmeaning of the situation that alters the rules used to determinerisk. This can include concepts such as the semantics of thelocation, weather conditions, level of fatigue and many others.In a mining environment for example, vehicles on haul roadsare required to maintain particular distance of separationwhichis greater than if they are located in a parking area or refuellingbay. In this example, a haul road is a different context area tothe parking area and the refuelling bay. The paper focuses onthe role of context areas in changing the rules of safe operationfor a vehicle.
A digital map is required to determine the location of theroads and context areas. Determining the location of contextareas can be done manually, though this is a time consumingprocess requiring skilled operators that know and understandthe area very well. The mining environment presents a par-ticular challenge for generating map information due to thedynamic nature of mining operations. Roads and open areasare constantly created and removed as the areas being minedchange. These creates additional challenges to the operatorsince the environment and roads are changing all the time.
Sections III to V describe a novel technique for generat-ing context area information by processing collected vehicleposition information. Section III describes a system that auto-matically logs and collects vehicle trajectory information froma fleet of vehicles. Section IV examines techniques to filter thisinformation to extract the road information. Section V presentsa novel technique for extracting significant areas that can beused to form the context area map. Results showing the outputof the algorithms using data from real-life mining operations ispresented throughout the paper. Section VI provides discussionon the implementation. Finally, the conclusions are presentedin Section VII.
II. A METRIC FOR SAFETY
Research has found that the 93% of vehicle accidents havehuman error as a causal factor [5]. In mining operations, safetymanagers attempt to minimise this risk of human error bydesigning protocols for safe operation, and training operators
Fig. 2. Two areas of a mine that have different expected meaning for vehicleoperators (different context meaning): (a) A dumping area where trucks parkclose together and (b) A haul road where vehicles must maintain separationof at least 50 m.
to follow these protocols. The safety rules evolve over timeas the result of new research, and by analysing the cause ofnear misses and accidents. Despite the best efforts of minemanagement to implement rules and protocols for safe vehicleoperation, accidents and near misses still occur. Vehicle opera-tors do not normally take unacceptable risks knowningly. Highrisk situations can occur because of unknown risks causedby factors such as inexperience, adverse weather condition,lack of training, over confidence, boredom, fatigue and manyothers. Some examples of difficult environmental conditionsfrom a typical mine are shown in Figure 1.
There are many groups currently researching CollisionAvoidance Systems (CAS), which attempt to detect vehiclesin the nearby area and estimate the risk of a collision (someexamples include [11], [6], [7], [8]). Detection of the othervehicles can be either using sensors such as radar, stereo cam-eras, laser, etc, or using radio communication to broadcastthevehicle state wirelessly. In both cases, a warning is provided tothe vehicle operator when the threat is determined to be abovea certain threshold based on a variety of algorithms usingthe available vehicle state information of the nearby vehicles.The main issue with all of these approaches is that there isa trade-off between having a large number of false alarmsby providing an early warning of a collision, and providinga warning of a collision at the last possible moment withfewer false alarms when a collision is almost unavoidable.

WORRALL ET. AL.: DETERMINING HIGH SAFETY RISK SCENARIOS BY APPLYING CONTEXT INFORMATION 29
If the driver is presented with false alarms, it is likely thatthey will either not pay attention to the warnings or becomeannoyed at the unwanted distraction [9]. There are also clearbenefits to providing warnings early to allow drivers more timeto comprehend the situation [10]. This is a form of reactivefeedback, which requires the operator to react fast enough toavoid the imminent collision.
An alternative strategy introduced in this paper is to usepreventitive feedback in the case where a high risk scenariois detected, which is the precursor to a collision. The saferules of operation are well defined for vehicle operations,including rules governing parameters such as minimum sepa-ration between vehicles and speed limits. By collecting vehiclestate information from nearby vehicles, it is possible to detectbreaches of these rules and provide feedback to the operator.This preempts a dangerous situation as the probability of acollision is highest when one (or more) of the safety ruleshas been breached. The feedback can then be provided to theoperators allowing them time to process the information andmodify their actions to minimise the risk in the situation.
The main difficulty in measuring safety is that safety iscontext dependent. The safe rules of operation vary dependingon the circumstances of the situation which includes thelocation, speed, number of nearby vehicles as well as manyother factors. The concept of a ’context area’ is defined hereasthe human meaning attached to a specific area that defines thepurpose of the area, consequently defining the expectation ofbehaviour in this area. A example of this can be seen in Figure2, where two different context areas in a mine are illustrated.The top image shows a dumping area, where vehicles arequeued close together waiting for the opportunity to unloadthe ore into a crushing machine. The bottom figure showsa haul road, where safety rules dictate that vehicles are notallowed to come within 50m of each other. The expectation ofbehaviour in the loading area is for close vehicle interactionsat low speed, whereas in the haul road the vehicles travel athigher speed while maintaining more separation.
It is not feasible to provide feedback and warnings to thevehicle operators unless the context of the situation is takeninto account. Presenting unnecessary warnings to an operatorreduces the effectiveness of the system as the operator willbemuch less likely to trust the information, and will also likely beannoyed by the false information [9]. The remainder of thispaper focuses on a novel method for extracting informationabout important context areas in a mine environment usingdata collected from vehicles in operation. These areas canbe named by humans to provide the specific meaning, suchas loading area or parking lot. These areas are then usedto modify the rules as interpreted by the vehicle system toprovide feedback to the operator in the event of a breach ofthese rules.
III. C OLLECTING AND FILTERING DATA
The mine environment is highly dynamic, with roads and ar-eas being created and removed regularly. Mining roads are notsealed, and the colour and texture of the roads and traversibleareas are often not distinguishable from the surrounding areas.
In many roads or sections of the road there are no marks orberms to indicate the road boundaries. Furthermore the mineis a very dynamic process and roads are changing all the time.This means that image processing and aerial photography arenot feasible to be used in the generation of up to date minemaps. The alternative method is to use vehicle position andtrajectory information to generate the map.
data base
base
station
office
computers
LANwireless
data automatically
downloaded to base
station on return
Fig. 3. Data is automatically collected from the vehicles when they are inrange of a collection point (either directly or through the mesh).
A system has been designed and installed in several fleetsof mining vehicles that can determine the vehicle state infor-mation, and to communicate this information with vehiclesin the surrounding area using ad-hoc, mesh communication[12]. This system was designed to provide additional situationawareness to the vehicle operators, particularly in miningvehicles which often operate with poor visibility due toevnironmental conditions and visual obstructions from thevehicle cabin. Data is logged within each vehicle, includingposition information, heading, velocity and other vehiclestateinformation. This data is collected when the vehicles movewithin range of a data collection point, either directly orthough the mesh network of other vehicles. The data isdownloaded and stored in a database as described in Figure 3,and can be used for creating mapping information.
The first step in the mapping process is clustering, which isnecessary to reduce the amount of data and take the averageof potentially noisy position data. Heading information mustbe considered as a separate dimension to allow the discrim-ination of position information from vehicles travelling inopposing directions on the same road. Position informationfrom vehicles travelling in opposite directions often overlapsdue to the vehicles not staying completely on one side of theroad when overtaking or maneuvering around holes, etc. Inaddition, the position data is sourced from a GPS sensor whichcan potentially be noisy. These factors mean that the positioninformation can be spread in the axis perpendicular to thedirection of the road. To account for this variation, the clusters

30 JOURNAL OF PHYSICAL AGENTS, VOL. 4, NO. 2, MAY 2010
must consider the heading in order to maintain separate laneinformation for each direction of travel.
Fig. 4. Different cluster shapes used to group the GPS data (a) shows acurve with cluster size x=20m, y=20m, (b) shows cluster sizex=7m, y=7m,(c) shows cluster size x=20m, y=7m.
The road width in mining can vary significantly, rangingfrom 10 to 30 or more meters in width. To provide an idea ofthe variety of scale of the vehicles involved, small vehicles canbe around 2 meters wide, large vehicles can be over 7 metersin width. Tuning the parameters of a clustering algorithm toaccount for such variation is difficult, for example if pointswithin a certain radius are clustered together then the radiusrequired would need to be at least 20 to 30 meters to accountfor the maximum road width. Increasing the collection radiusfor a cluster means that the clusters are spread further apartalong the axis of the road and some fidelity of the road shape islost, especially around corners and at intersections. A solutionto this problem is to change the shape of the area used tocollect the position information into a cluster. Figure 4 showsthe outcome when using a rectangular shaped cluster area.Points are incorporated into a cluster differently in the x axis(perpendicular to the direction of travel) compared with the y-axis (following the direction of travel. If points are addedintoa cluster from a larger range in the x-axis, the fidelity of theroad shape is better maintained as seen in Figure 4(c). Figure4(b) shows the output if the clusters are too small, leadingto multiple lines of clusters representing the same sectionofroad.
IV. EXTRACTING ROADS
Once the point clusters are generated, the next step is todetermine the relationship between each cluster. This processinvolves linking the clusters, and is used to form the roadinformation. A road is defined here as a linked set of clusterswhere the motion of the vehicle is constrained to a singledimension (direction). This means that each cluster is linkedforward to a single cluster, and back to a single cluster. Thispaper describes three methods of linking clusters that containposition and heading information.
The above definition of roads and areas allows the minelayout to be represented as a directional graph, or digraph.The context areas are used to make the verticies of the graphand the roads form the directional edges that join the verticies.It is possible to form the graph representation by defining aroad as the single directional path between two context areas,which can be intersections, or other context areas. This formalrepresentation of this graph structure is presented in Equation1, and the graph structure can be seen in the roads and areasshown in Figure 8.
The roads are extracted from the cluster data as placeswhere normal motion is constrained to a single direction oftravel. Once these areas are determined, the remaining clusterscan be used form areas where the direction of travel is lessconstrained, where vehicles can move in different directions.These areas represent increased likelihood of an importantareawith contextual meaning as there is a large potential range ofmaneuvers in these areas.
Graph of MineG = (V, E)
verticesV = v1 ∪ v2 ∪ · · · ∪ vn
= Set ofn Context Areas
edgesE = e1,2 ∪ e2,1 ∪ . . . etc
= Set of Roads (1)
where
ei,j = directional link between area i and j
A. Geometric Relationship
The road information can be determined by consideringthe geometric relationship between the clusters. Equation2introduces a metric that is calculated using a function of thedistance between clusters (∆S), bearing of the other clusterrelative to the test cluster heading (φ), and the difference inheading between the clusters (∆θ). Each of these measuresare weighted using the parametersα, β and γ and addedto give the metric value. These parameters are tuned to suitthe application, though there is scope for future work inusing feedback to improve the parameter selection within aprobabilistic framework.
metric = α∆S+ βφ + γ∆θ (2)
The metric is calculated for each cluster relative to the othernearby surrounding clusters. When the metric is within a given

WORRALL ET. AL.: DETERMINING HIGH SAFETY RISK SCENARIOS BY APPLYING CONTEXT INFORMATION 31
threshold, the link is created between the clusters. This strategywas successful in most scenarios, with the exception being iftwo unconnected roads are too close together for the selecteddistance metric. In this case, there is a tendancy for incorrectlinks to be made as illustrated in Figure 5(a).
B. Temporal Relationship
The second approach for linking clusters considered in thispaper involves fitting the logged vehicle trajectories to theclusters. A link is strengthened when a vehicle trajectorypasses between two clusters. The strength of the link ismeasured by the number of times a vehicle moves betweenthe clusters. A threshold is used to determine what strengthof link is required to create the road, allowing this processtofilter out incorrect links. Using vehicle trajectories to generatethe links provides a robust linking method that is less likelyto fail when different roads are close together. This is becausethe links are only created between clusters where vehicles haveactually traveled. Part (b) of Figure 5 shows the result of thelinking process using vehicle trajectories. On the roads, thetwo approaches for linking clusters produces similar results.The main benefit of the vehicle trajectory approach is seenaround intersections.
C. α-Shape
The underlying shape of a set of points can be determinedby using the alpha shape technique [13]. This techniqueuses a circle of radiusα to essentially ‘scoop’ out the areasurrounding the border of the points. The process beginsby taking a set of points to be included in the shape, anddetermining the circumcircles that can be created using eachpair of points. The boundary of the shape is defined by allthe circumcircles that do not contain one of the other pointsin the set. This means that anα-shape can contain holes andconcave areas. Asα approaches infinity, the shape approachesthe convex hull. The value ofα was selected to be twice thesize of the distance between clusters, meaning that all clustersthat should be joined are within the range of the nearest pointswhen creating the circumcircles.
Figure 6(a) shows the set of clusters used to make theα-shape. Figure 6(b) shows the resultingα-shape, with thecircumcircles drawn when they do not contain a differentpoint from the remaining set. It can be seen in this shape thatwhen the roads are far apart, they are considered as separatelines both circumcircles created from the pair of points donot contain another point in the set. When the roads arecloser together, the inner circumcircles contain points from theopposing side of the road to create a filled in shape (indicatedas a black filled polygon in the image).
To provide the separation between roads, it is possible toconsider the heading as an additional dimension to theα-shapealgorithm. In this case, the test of other points that lie withinthe circumcircle excludes points that have a heading differencethat is larger than a particular threshold. This means that theclusters that belong to the opposing side of the road are notincluded, and theα-shape can represent the different sides ofthe roads as shown in Figure 6(c).
Fig. 5. Shows a potential issue with geometric based linkingof clusters (a)geometric linking where incorrect links are made to a nearbyroad (b) linkingusing the actual vehicle trajectories solves this problem.
V. CONTEXT AREA SHAPES
Section IV described the process of determining the lo-cation of roads within the mine where the vehicle motionis constrained to a single direction. The remaining clustersthen indicate the areas where the vehicle movement is lessconstrained and more complex than on a road. The additionalcomplexity generally means there is a greater chance of amisunderstanding between two nearby vehicles, and that thearea has some additional meaning to the vehicle operators.These areas include intersections and other open areas suchas parking lots, loading areas, dumping areas, refuelling bays,etc. These areas are of interest as the expectation of behaviourof other nearby vehicles is likely to be different to being ona road. In a parking lot for example, there is an expectationthat a vehicle is likely to drive slower and maneuver into aparking space at any moment.
32 JOURNAL OF PHYSICAL AGENTS, VOL. 4, NO. 2, MAY 2010
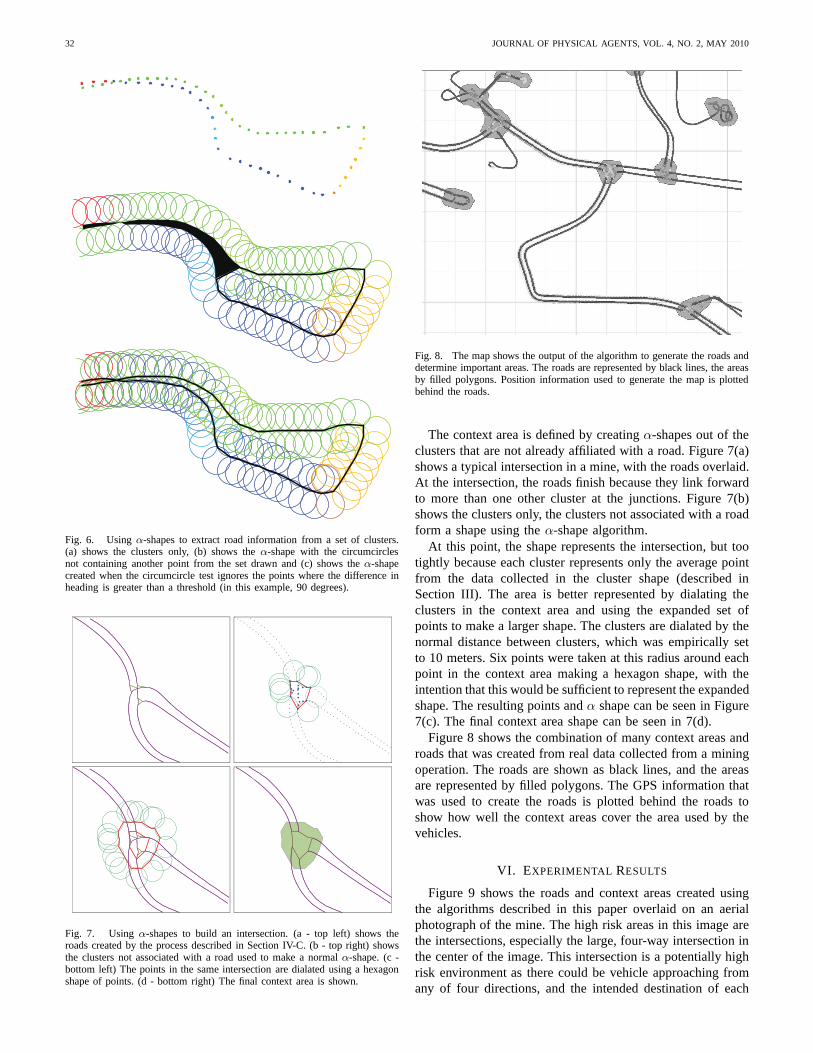
Fig. 6. Usingα-shapes to extract road information from a set of clusters.(a) shows the clusters only, (b) shows theα-shape with the circumcirclesnot containing another point from the set drawn and (c) showsthe α-shapecreated when the circumcircle test ignores the points wherethe difference inheading is greater than a threshold (in this example, 90 degrees).
Fig. 7. Usingα-shapes to build an intersection. (a - top left) shows theroads created by the process described in Section IV-C. (b - top right) showsthe clusters not associated with a road used to make a normalα-shape. (c -bottom left) The points in the same intersection are dialated using a hexagonshape of points. (d - bottom right) The final context area is shown.
Fig. 8. The map shows the output of the algorithm to generate the roads anddetermine important areas. The roads are represented by black lines, the areasby filled polygons. Position information used to generate the map is plottedbehind the roads.
The context area is defined by creatingα-shapes out of theclusters that are not already affiliated with a road. Figure 7(a)shows a typical intersection in a mine, with the roads overlaid.At the intersection, the roads finish because they link forwardto more than one other cluster at the junctions. Figure 7(b)shows the clusters only, the clusters not associated with a roadform a shape using theα-shape algorithm.
At this point, the shape represents the intersection, but tootightly because each cluster represents only the average pointfrom the data collected in the cluster shape (described inSection III). The area is better represented by dialating theclusters in the context area and using the expanded set ofpoints to make a larger shape. The clusters are dialated by thenormal distance between clusters, which was empirically setto 10 meters. Six points were taken at this radius around eachpoint in the context area making a hexagon shape, with theintention that this would be sufficient to represent the expandedshape. The resulting points andα shape can be seen in Figure7(c). The final context area shape can be seen in 7(d).
Figure 8 shows the combination of many context areas androads that was created from real data collected from a miningoperation. The roads are shown as black lines, and the areasare represented by filled polygons. The GPS information thatwas used to create the roads is plotted behind the roads toshow how well the context areas cover the area used by thevehicles.
VI. EXPERIMENTAL RESULTS
Figure 9 shows the roads and context areas created usingthe algorithms described in this paper overlaid on an aerialphotograph of the mine. The high risk areas in this image arethe intersections, especially the large, four-way intersection inthe center of the image. This intersection is a potentially highrisk environment as there could be vehicle approaching fromany of four directions, and the intended destination of each

WORRALL ET. AL.: DETERMINING HIGH SAFETY RISK SCENARIOS BY APPLYING CONTEXT INFORMATION 33
Fig. 9. Roads and context areas are overlayed on a aerial image of themine site. The important context areas in this image are the intersections,particularly the large, four-way intersection in the center of the image.
Fig. 10. The operator interface provides situation awareness information tothe driver. There are two vehicles displayed on the screen that outside theoperator’s line of sight. An area of interest is shown at the top of the screenrepresenting a large intersection.
vehicle is unknown to the other vehicles. These roads andcontext areas are then automatically distributed to the fleet ofvehicles and are used for the operator interface.
Figure 8 shows the quality of the areas generated fromthe algorithms introduced in this paper. The correctness ofthe areas can only be determined by the mine personnelwho are familiar with the roads and layout of the mine,and is essential before the maps can be used in the operatorinterface. The feedback from the mine personnel is that thealgorithm provides a good representation of the context areasin the majority of cases. This subjective analysis is not yetquantified. Future research in this area will examine metricsto automatically determine the quality of the generated maps.Two main factors were determined that impact the quality ofthe created map. In the event of poor GPS reception, it ispossible that the noise in the position estimate can cause errors
in the context area shape. In addition, data collected fromvehicles performing maneuvers that are uncharacteristic giventheir location presents another potential cause of incorrectlygenerated context areas. An example of this is if a vehicleperforms a u-turn maneuver on a section of haul road (whichthey are not supposed to do), this area could potentially beincorrectly interpreted as being a context area. Detectingandfiltering out these cases is an area of future work.
Figure 11 shows the operator interface in the vehicle cabindesigned to improve the operator’s situation awareness. Ataglance, it is possible for the operator to determine that theyare in a context, or important area (labelled in this case asa Crusher Area). The nearby vehicles are displayed, and thedistance icon accompanied by a short sound indicates thatthe distance is too close to the vehicle in front based on therules determined for that specific context area. When the rulesimplemented for this specific context area are breached, theicons shown on the bottom of the image are displayed alongwith the appropriate sound warning.
Figure 10 shows the interface working in a mine site,providing situation awareness to the operator. The screenshows two vehicles in front, neither of which can be seendirectly from the vehicle. The coloured area at the top of thedisplay indicates that there is an important area (in this casean intersection) around the next corner which is not in a lineof sight from the vehicle. This simplified representation oftheenvironment allows the operator at a glance to improve theirunderstanding of the current situation.
The current vehicle position relative to the roads and areason the map provide an important piece of information tothe vehicle operator. In poor weather conditions, it can bedifficult to determine the vehicle location relative to theintersections and other areas, especially for an inexperienceddriver. Providing the map with hilighted intersections andareasto the operator should improve the awareness of the currentlocation.
Fig. 11. Display implementation currently installed in mining vehicles. Thecontext area name can be seen in the bottom left of screen. Several warningicons representing breaches of the rules are presented.

34 JOURNAL OF PHYSICAL AGENTS, VOL. 4, NO. 2, MAY 2010
VII. C ONCLUSION
This paper introduced a method of determining risk usingcontext based rules. A method for generating up to dateroad maps including the evaluation of context areas waspresented using vehicle trajectory data collected from real-lifemining vehicle fleets. The context area was generated usinga process of clustering raw data, extracting road informationfrom the relationships between the clusters and finally usingthe remaining clusters to generate anα-shape representing apotential area of interest. The context areas can be providedwith a label by a human to make it more understandable to thevehicle operator. There is scope for future work in this areato automate this process by probabilistically determiningthesemantic meaning of each area.
Without the context information, it is not possible to mea-sure risk based on rules that vary depending on location. It isnecessary to consider the context of the situation before pro-viding potentially incorrect feedback to the vehicle operator.Unnecessary or false alarms are detrimental to the trust andusefulness of the system, and can potentially be distractingand annoying. This work can be extended outside the field ofmining operations. There are many parallels with the operationof mining vehicles and passenger vehicles. Mining operationsare generally present a much more difficult environment withunsealed roads, large range of vehicle sizes and 24 houroperation.
REFERENCES
[1] E. Nebot, J. Guivant, and S. Worrall, “Haul truck alignment monitoringand operator warning system,”Journal of Field Robotics, vol. 23, no. 2,pp. 141–161, March 2006.
[2] S. Worrall and E. Nebot, “Using non-parametric filters and sparseobservations to localise a fleet of mining vehicles,” inIEEE InternationalConference on Robotics and Automation, 2007, April 2007, pp. 509–516.
[3] S. Worrall and E. Nebot, “A probabilistic method for detecting impend-ing vehicle interactions,” inRobotics and Automation, 2008. ICRA 2008.IEEE International Conference on, 19-23 2008, pp. 1787 –1791.
[4] G. Agamennoni, J. Nieto, and E. Nebot, “Mining gps data for extractingsignificant places,” inICRA’09: Proceedings of the 2009 IEEE interna-tional conference on Robotics and Automation. Piscataway, NJ, USA:IEEE Press, 2009, pp. 1860–1867.
[5] M. S. Sanders and B. E. Shaw, “Research to determine the contributionof system factors in the occurrence of underground injury accidents,”USBM OFR 26-89, NTIS PB 89-219638/AS, 165 pp., Tech. Rep., 1988.
[6] Y.-J. Chen, C.-C. Chen, S.-N. Wang, H.-E. Lin, and R. Hsu,“Gpsensecar- a collision avoidance support system using real-time gps data in amobile vehicular network,” inSystems and Networks Communication,2006. ICSNC ’06. International Conference on, 2006, pp. 71–76.
[7] J. Huang and H.-S. Tan, “Impact of communication reliability on a co-operative collision warning system,”Intelligent Transportation SystemsConference, 2007. ITSC 2007. IEEE, pp. 355–360, September 2007.
[8] O. Gietelink, D. Verburg, K. Labibes, and A. Oostendorp,“Pre-crashsystem validation with prescan and vehil,”Intelligent Vehicles Sympo-sium, 2004 IEEE, pp. 913–918, June 2004.
[9] B. Donmez, L. N. Boyle, J. D. Lee, and D. V. McGehee,“Drivers’ attitudes toward imperfect distraction mitigationstrategies,” Transportation Research Part F: Traffic Psychologyand Behaviour, vol. 9, no. 6, pp. 387–398, Nov. 2006. [Online].Available: www.sciencedirect.com/science/article/B6VN8-4JJ2BVX-1/2/a091f0f1acc2864af9b5d9b66b33681e
[10] J. D. Lee, M. L. Ries, D. V. McGehee, and T. L. Brown, “Cancollision warning systems mitigate distraction due to in-vehicle de-vices?” NHTSA, Tech. Rep., May 2000. [Online]. Available: www-nrd.nhtsa.dot.gov/departments/nrd-13/driver-distraction/PDF/31.PDF
[11] S. Kodagoda, S. Sehestedt, A. Alempijevic, Z. Zhang, A.Donikian, andG. Dissanayake. Towards an enhanced driver situation awareness system.Industrial and Information Systems, 2007. ICIIS 2007. InternationalConference on, pages 295–300, Aug. 2007.
[12] S. Worrall, D. Orchansky, and E. Nebot, “Improving situation awarenesswith a high integrity proximity system,”Australasian Mine SafetyJournal, vol. 2, pp. 94–97, 2009.
[13] H. Edelsbrunner and E. Mucke, “Three-dimensional alpha shapes,” inProceedings of the 1992 workshop on Volume visualization. ACM,1992, p. 82.
Related Documents


![APriori“Imprinting”ofGeneralRelativityItselfon SomeTestsofIt?levels as high as 10−7–10−9 in determining γ,havebeen proposed [4–8]. Indeed, some theoretical scenarios predict](https://static.cupdf.com/doc/110x72/6124a13fe304431af9445920/aprioriaoeimprintingaofgeneralrelativityitselfon-sometestsofit-levels-as-high.jpg)


