1 DETERMINING EFFECTIVE MATERIAL PROPERTIES AND PARTICLES SIZE FOR ASPHALTIC COMPOSITES USING MICROSTRUCTURE APPROACH Samer Dessouky 1 , M. ASCE, A.T. Papagiannakis 2 , F. ASCE 1 Assistant Professor, email: [email protected]. 2 Professor, email: [email protected]. Department of Civil and Environmental Engineering, University of Texas at San Antonio, San Antonio, TX 78249, Ph. (210) 458-7072, Fax (210) 458-6475. ABSTRACT Asphaltic materials consist of wide range of distribution of particles. The several order of magnitude differences in the stiffness between the constituents (aggregate and binder) cause a wide range of stress and strain distribution within the microstructure. This study aims to using two schemes to analyze the microstructure of asphalt composites to identify the effective particle size and effective material properties. INTRODUCTION Asphaltic materials consist of wide range of distribution of particles. The several order of magnitude differences in the stiffness between the constituents (aggregate and binder) cause a wide range of stress and strain distribution within the microstructure. Constitutive models implemented by Finite Element methods have been used to analyze the asphalt mix microstructure (e.g. Kose et al. 2000, Masad et al. 2001). This approach is limited in capturing the details of the microstructure in a representative volume element (RVE). This study aims to using two schemes to analyze the microstructure of asphalt composites to identify the effective particle size. An approach using micromechanics principal is also presented to determine and effective material properties for the RVE. The purpose of these schemes is to evaluate the effective length scale, average particles size, of the RVE. These schemes can be used to introduce the RVE in a less heterogeneous representation. The two methods used in the study are moving window technique and Auto correlation function. The first is developed by Paley and Aboudi (1992). The moving window divides a repeating rectangular representative element into any selected number of rectangular subcells. The scheme is capable of predicting the behavior of periodic microstructure from given properties of their constituents. The second scheme describes the relative directional arrangement of the matrix constituents. The scheme has a significant impact in engineering characteristics such as fluid flow in porous media and strength anisotropy of granular materials. EXPERIMENTAL CHARACTERIZATION Six Superpave asphalt mix designs with different gradation are shown in Table 1. The mixes were prepared with different nominal maximum aggregate sizes

Welcome message from author
This document is posted to help you gain knowledge. Please leave a comment to let me know what you think about it! Share it to your friends and learn new things together.
Transcript
1
DETERMINING EFFECTIVE MATERIAL PROPERTIES AND PARTICLES
SIZE FOR ASPHALTIC COMPOSITES USING MICROSTRUCTURE
APPROACH
Samer Dessouky1, M. ASCE, A.T. Papagiannakis2, F. ASCE 1Assistant Professor, email: [email protected]. 2Professor, email: [email protected].
Department of Civil and Environmental Engineering, University of Texas at San
Antonio, San Antonio, TX 78249, Ph. (210) 458-7072, Fax (210) 458-6475.
ABSTRACT
Asphaltic materials consist of wide range of distribution of particles. The
several order of magnitude differences in the stiffness between the constituents
(aggregate and binder) cause a wide range of stress and strain distribution within the
microstructure. This study aims to using two schemes to analyze the microstructure
of asphalt composites to identify the effective particle size and effective material
properties.
INTRODUCTION
Asphaltic materials consist of wide range of distribution of particles. The
several order of magnitude differences in the stiffness between the constituents
(aggregate and binder) cause a wide range of stress and strain distribution within the
microstructure. Constitutive models implemented by Finite Element methods have
been used to analyze the asphalt mix microstructure (e.g. Kose et al. 2000, Masad et
al. 2001). This approach is limited in capturing the details of the microstructure in a
representative volume element (RVE). This study aims to using two schemes to
analyze the microstructure of asphalt composites to identify the effective particle size.
An approach using micromechanics principal is also presented to determine and
effective material properties for the RVE. The purpose of these schemes is to
evaluate the effective length scale, average particles size, of the RVE. These schemes
can be used to introduce the RVE in a less heterogeneous representation. The two
methods used in the study are moving window technique and Auto correlation
function. The first is developed by Paley and Aboudi (1992). The moving window
divides a repeating rectangular representative element into any selected number of
rectangular subcells. The scheme is capable of predicting the behavior of periodic
microstructure from given properties of their constituents. The second scheme
describes the relative directional arrangement of the matrix constituents. The scheme
has a significant impact in engineering characteristics such as fluid flow in porous
media and strength anisotropy of granular materials.
EXPERIMENTAL CHARACTERIZATION
Six Superpave asphalt mix designs with different gradation are shown in
Table 1. The mixes were prepared with different nominal maximum aggregate sizes
2
and two aggregate types (limestone and gravel). Specimens were compacted using
the Superpave gyratory compactor. Each specimen had a diameter of 150 mm and a
height close to 100 mm. A diamond saw was used to cut these specimens vertically
in 50mm diametral parts (Dessouky et al. 2003).
Table 1. Description of Asphalt Mixes
Aggregate Gradation NMAS
(mm)
% Natural
sand
Design
AC, %
Mix label
Limestone Fine 9.5 0 5.3 A
Coarse 19 0 4.4 C
40 4.7 D
Gravel Fine 9.5 0 6.3 I
Coarse 19 0 5.4 K
40 4.8 L
* Nominal maximum aggregate size.
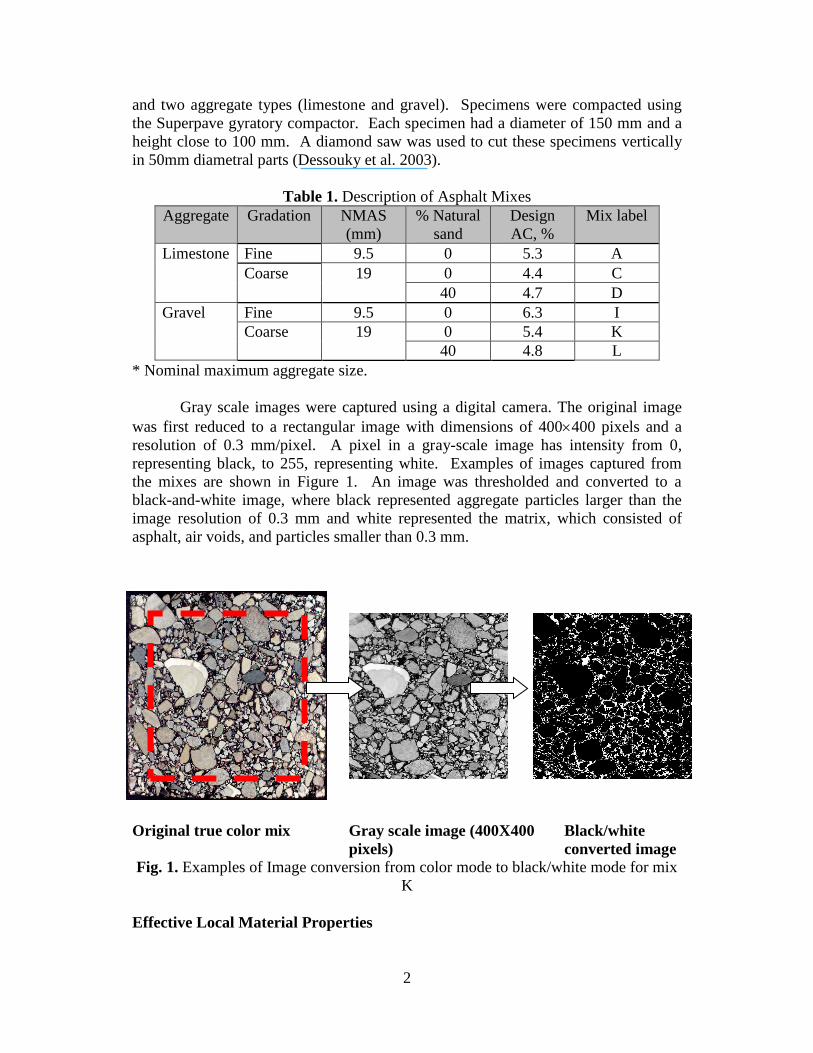
Gray scale images were captured using a digital camera. The original image
was first reduced to a rectangular image with dimensions of 400400 pixels and a
resolution of 0.3 mm/pixel. A pixel in a gray-scale image has intensity from 0,
representing black, to 255, representing white. Examples of images captured from
the mixes are shown in Figure 1. An image was thresholded and converted to a
black-and-white image, where black represented aggregate particles larger than the
image resolution of 0.3 mm and white represented the matrix, which consisted of
asphalt, air voids, and particles smaller than 0.3 mm.
Original true color mix Gray scale image (400X400
pixels)
Black/white
converted image
Fig. 1. Examples of Image conversion from color mode to black/white mode for mix
K
Effective Local Material Properties
3
The effective material properties are calculated using a micromechanics
solution that captures the influence of aggregate concentration within the moving
window on the effective material properties. Christensen (1990) developed a
differential dilute suspension method for effective shear and bulk moduli and ,
respectively to better represent nondilute composites. The concept of the differential
method is to add small percentages of particles (c) incrementally into the matrix.
New effective properties are obtained for the composite in each increment and are
subsequently used as matrix material properties in the following increments until c =
100%. The differential equations that represent this method are as follows:
01
3
4
0126
435
cdc
d
cdc
d
(1)
However, the / ratio for HMA depends on the concentration of aggregates,
and consequently, these solutions are not representative of asphalt mixes (Kim and
Little 2004). Therefore, the following exponential relation between and is
proposed to solve Eq. (1):
c
1exp (2)
where and are material constants determined based on experimental
measurements. Solution of Eq. 1 is obtained by defining the lower and upper limit of
Eq. 2, such that the composite material properties are equal to those of the binder
when c = 0 and equal to aggregate at c = 1. A Gaussian quadrature numerical scheme
was used and following expressions are obtained:
*
0 *
*
*
0 **
*
)1(
1exp)1ln(lnln
21exp)1(
1exp
6
5)1ln(
3
5lnln
dcc
cc
dccc
cc
c
m
c
m
(3)
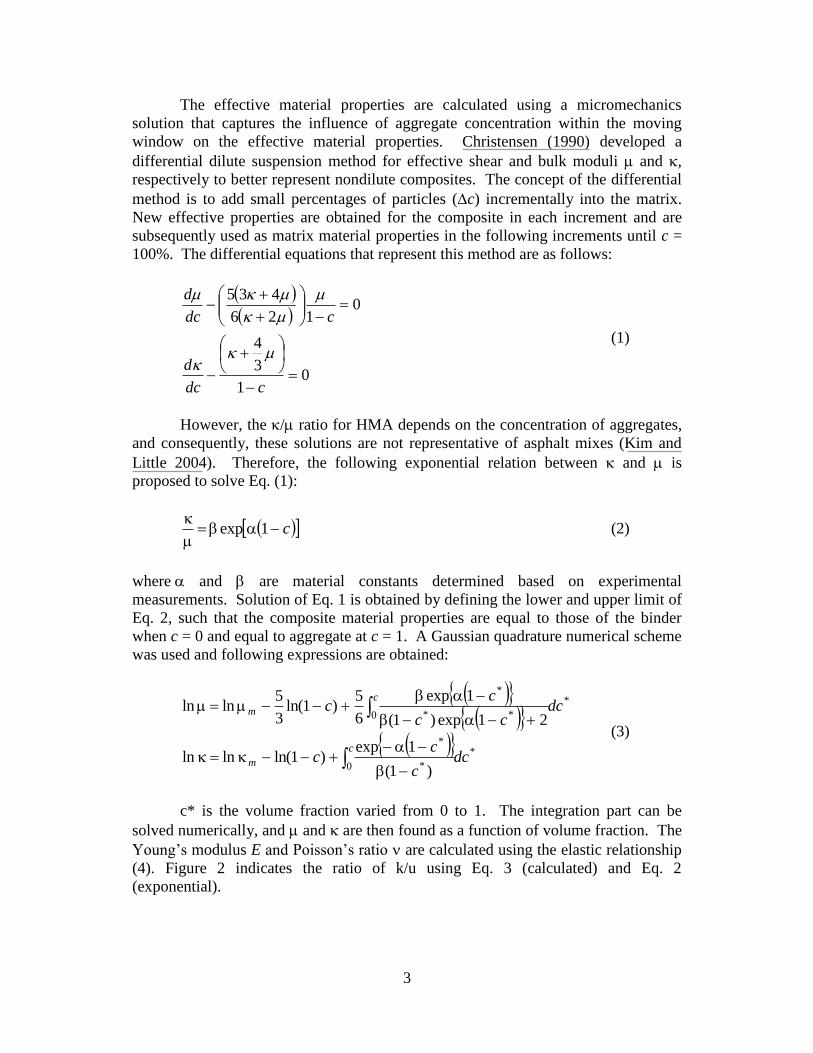
c* is the volume fraction varied from 0 to 1. The integration part can be
solved numerically, and and are then found as a function of volume fraction. The
Young’s modulus E and Poisson’s ratio are calculated using the elastic relationship
(4). Figure 2 indicates the ratio of k/u using Eq. 3 (calculated) and Eq. 2
(exponential).
4
)3(2
23
3
9
E
(4)
Fig 2. The bulk-shear modulus ratio versus volume fraction using Eqs. 2 and 3
Moving Window Technique
The average strain in asphalt mix microstructure can be obtained by the
Taylor’s series expansion limited to the second-order term of the function )( rx
around a point x in the RVE as follows (Zbib and Aifantis 1989):
22cl)x( (5)
where lc is a characteristic length scale (average particles size)of the material
microstructure. 2 is the strain gradient determined using the strain at x and
neighbors points in the RVE.
Baxter and Graham (2000) presented an approach using FE analysis of
composite material microstructure. The effective material properties are averaged
within a moving window of definite size over the macrostructure using the
Generalized Method of Cells proposed by Paley and Aboudi (1992). The moving
window technique was used to calculate the effective elastic material properties in
Eq. (3) and the characteristic length scale, lc, in Eqs. (5). In this method, an image
that represents the RVE of a mix is divided into square windows of equal sizes. Each
window is shifted in the horizontal direction of the RVE with one pixel at least as
overlap. A parametric analysis conducted by Dessouky et al. (2006) implied that the
5
size of the window capable to distinguish between mix design is 4040 pixels (1212
mm).
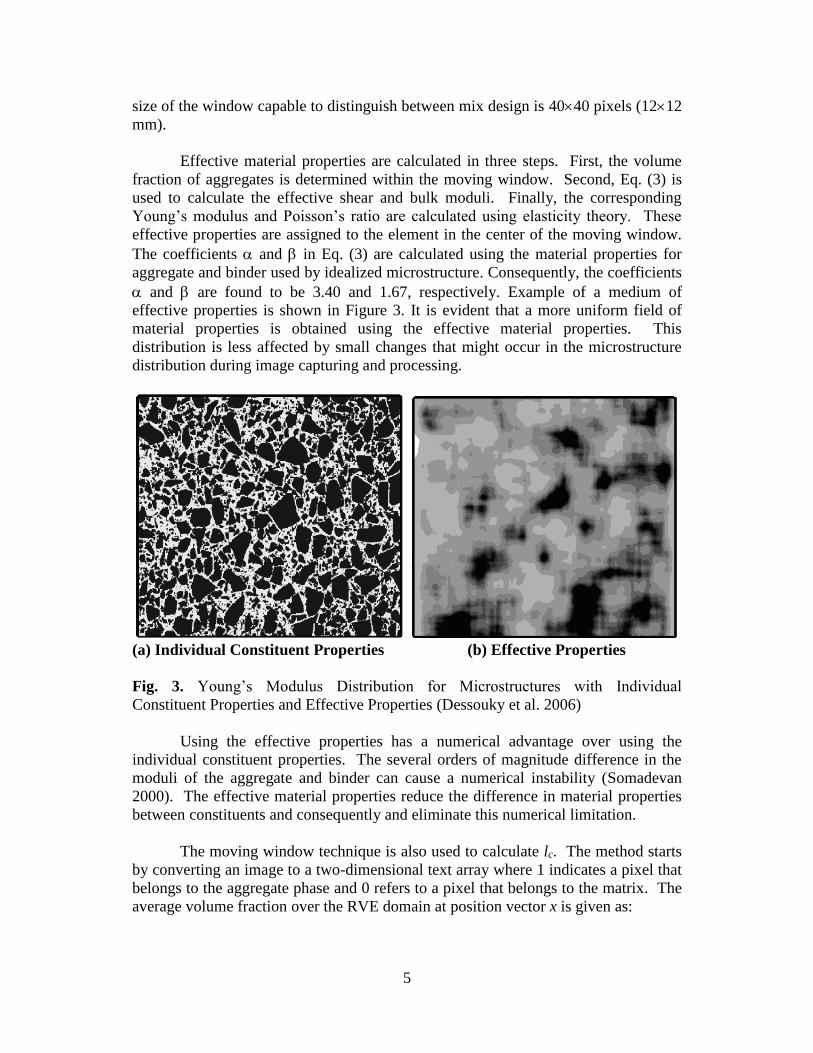
Effective material properties are calculated in three steps. First, the volume
fraction of aggregates is determined within the moving window. Second, Eq. (3) is
used to calculate the effective shear and bulk moduli. Finally, the corresponding
Young’s modulus and Poisson’s ratio are calculated using elasticity theory. These
effective properties are assigned to the element in the center of the moving window.
The coefficients and in Eq. (3) are calculated using the material properties for
aggregate and binder used by idealized microstructure. Consequently, the coefficients
and are found to be 3.40 and 1.67, respectively. Example of a medium of
effective properties is shown in Figure 3. It is evident that a more uniform field of
material properties is obtained using the effective material properties. This
distribution is less affected by small changes that might occur in the microstructure
distribution during image capturing and processing.
(a) Individual Constituent Properties (b) Effective Properties
Fig. 3. Young’s Modulus Distribution for Microstructures with Individual
Constituent Properties and Effective Properties (Dessouky et al. 2006)
Using the effective properties has a numerical advantage over using the
individual constituent properties. The several orders of magnitude difference in the
moduli of the aggregate and binder can cause a numerical instability (Somadevan
2000). The effective material properties reduce the difference in material properties
between constituents and consequently and eliminate this numerical limitation.
The moving window technique is also used to calculate lc. The method starts
by converting an image to a two-dimensional text array where 1 indicates a pixel that
belongs to the aggregate phase and 0 refers to a pixel that belongs to the matrix. The
average volume fraction over the RVE domain at position vector x is given as:

6
glxgg c
22)( (6)
where g is the percentage of particles at each window position and g is the average
percentage of particles in the entire image microstructure. )(xg is found by
averaging the volume fraction within each window in the RVE. g2 is calculated
between three adjacent windows positions in the horizontal direction. Example of lc is
shown in Figure 4.
Two types of RVE are examined to analyze the length scale, coarse and fine
with 19 and 9.5mm NMAS, respectively. Coarse RVE produces higher length scale
than fine microstructure. Measurements show that the effective length scale
distribution is larger for coarse particles (Figure 4). lc for the different mixes is
shown in Table 2. As the range of aggregate sizes becomes smaller, the probability
for the moving windows to have more uniform percentages of particles increases, and
consequently, lc becomes smaller.
0.0E+00
5.0E-05
1.0E-04
1.5E-04
2.0E-04
2.5E-04
0% 20% 40% 60% 80% 100%
Moving windows %
Le
ng
th s
ca
le (
m2)
Fig. 4. Length scale calculated for mixes with different gradation
Autocorrelation Function
The autocorrelation function (ACF) describes the relative arrangement of
different phases in a composite material. It evaluates the probability of locating two
points of the same material within the RVE. It is assumed that the microstructure of
asphalt mixes is statistically homogeneous, and consequently, ACF depends on the
average difference in the coordinate values between two points rather than the
locations of these points. Consequently, the two-point ACF is given as (Berryman
and Blair 1986):
iM
x
jN
y jNiM
jyixfyxfjiS
1 1 ))((
),(),(),( (7)
Coarse
Fine
7
where 1, yxf if a pixel at point yx, is located within the aggregate phase, and
0, yxf otherwise. i and j are the distances between any two pixels in two
orthogonal coordinate axes. M and N are the number of pixels in the HMA
microstructure image in two orthogonal coordinate axes.
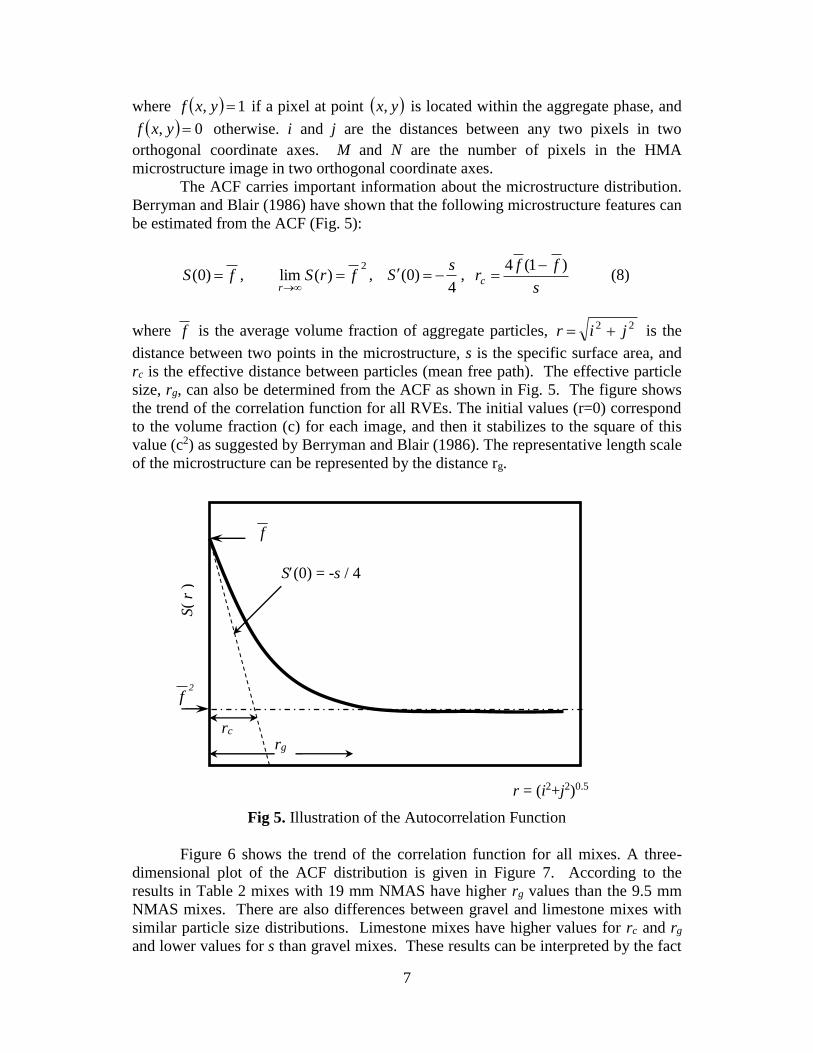
The ACF carries important information about the microstructure distribution.
Berryman and Blair (1986) have shown that the following microstructure features can
be estimated from the ACF (Fig. 5):
fS )0( , 2
)(lim frSr
, 4
)0(s
S , s
ffrc
)1(4 (8)
where f is the average volume fraction of aggregate particles, 22 jir is the
distance between two points in the microstructure, s is the specific surface area, and
rc is the effective distance between particles (mean free path). The effective particle
size, rg, can also be determined from the ACF as shown in Fig. 5. The figure shows
the trend of the correlation function for all RVEs. The initial values (r=0) correspond
to the volume fraction (c) for each image, and then it stabilizes to the square of this
value (c2) as suggested by Berryman and Blair (1986). The representative length scale
of the microstructure can be represented by the distance rg.
Fig 5. Illustration of the Autocorrelation Function
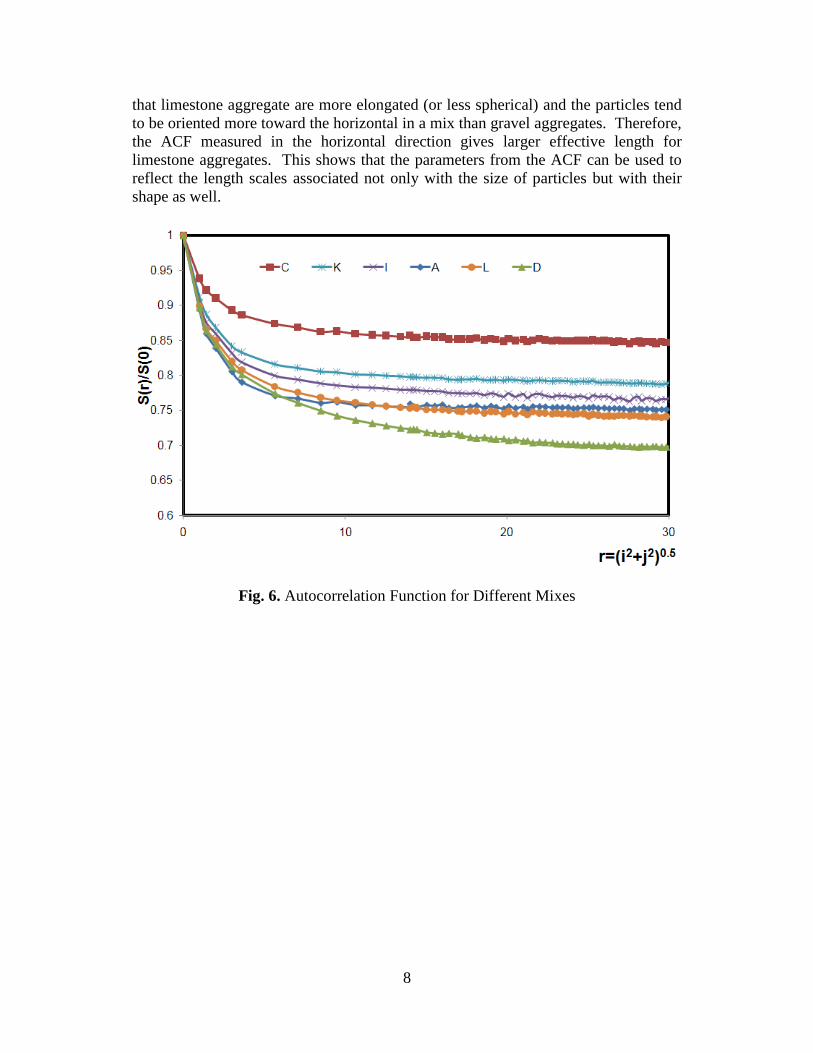
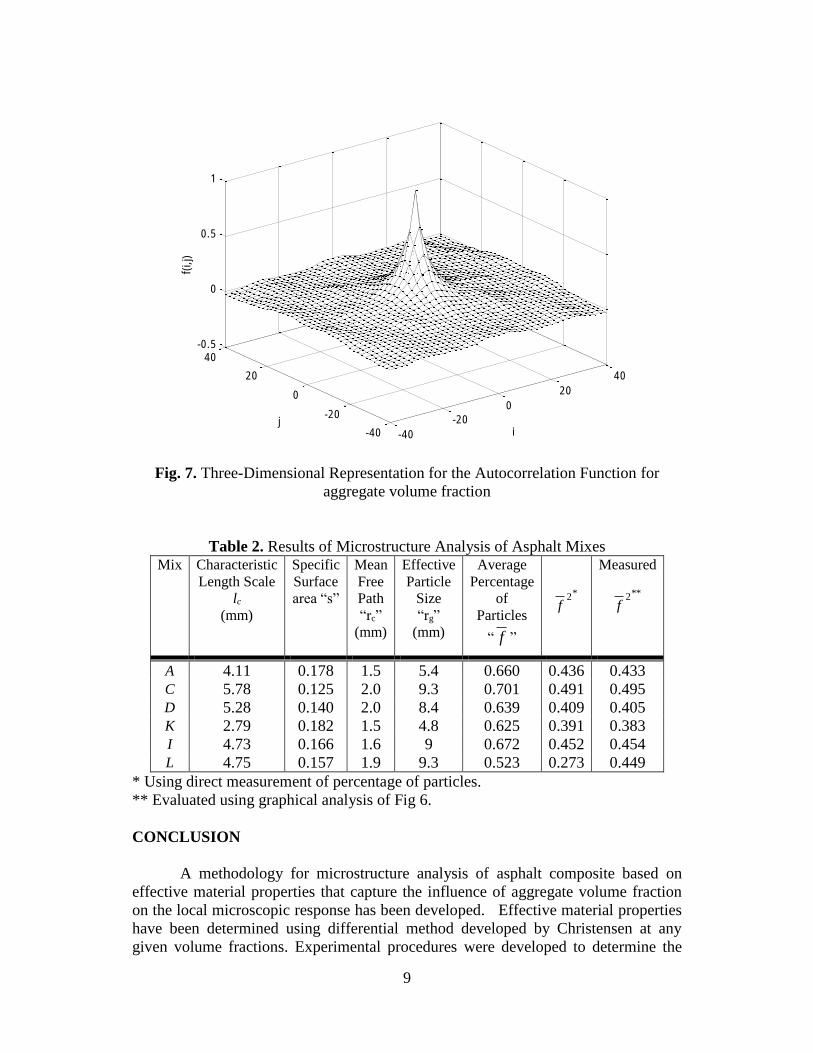
Figure 6 shows the trend of the correlation function for all mixes. A three-
dimensional plot of the ACF distribution is given in Figure 7. According to the
results in Table 2 mixes with 19 mm NMAS have higher rg values than the 9.5 mm
NMAS mixes. There are also differences between gravel and limestone mixes with
similar particle size distributions. Limestone mixes have higher values for rc and rg
and lower values for s than gravel mixes. These results can be interpreted by the fact
f
f
S(0) = -s / 4
rg rc
2
f
S(
r )
r = (i2+j2)0.5
8
that limestone aggregate are more elongated (or less spherical) and the particles tend
to be oriented more toward the horizontal in a mix than gravel aggregates. Therefore,
the ACF measured in the horizontal direction gives larger effective length for
limestone aggregates. This shows that the parameters from the ACF can be used to
reflect the length scales associated not only with the size of particles but with their
shape as well.
Fig. 6. Autocorrelation Function for Different Mixes
9
-40
-20
0
20
40
-40
-20
0
20
40-0.5
0
0.5
1
ij
f(i,j)
Fig. 7. Three-Dimensional Representation for the Autocorrelation Function for
aggregate volume fraction
Table 2. Results of Microstructure Analysis of Asphalt Mixes
Mix Characteristic
Length Scale
lc
(mm)
Specific
Surface
area “s”
Mean
Free
Path
“rc”
(mm)
Effective
Particle
Size
“rg”
(mm)
Average
Percentage
of
Particles
“ f ”
*
f2
Measured
**
f2
A 4.11 0.178 1.5 5.4 0.660 0.436 0.433 C 5.78 0.125 2.0 9.3 0.701 0.491 0.495 D 5.28 0.140 2.0 8.4 0.639 0.409 0.405 K 2.79 0.182 1.5 4.8 0.625 0.391 0.383 I 4.73 0.166 1.6 9 0.672 0.452 0.454 L 4.75 0.157 1.9 9.3 0.523 0.273 0.449
* Using direct measurement of percentage of particles.
** Evaluated using graphical analysis of Fig 6.
CONCLUSION
A methodology for microstructure analysis of asphalt composite based on
effective material properties that capture the influence of aggregate volume fraction
on the local microscopic response has been developed. Effective material properties
have been determined using differential method developed by Christensen at any
given volume fractions. Experimental procedures were developed to determine the
10
material characteristic length scale using the moving window technique and the ACF.
Asphalt mixes with course gradation have shown larger lc values compared to fine
mix. The moving window utilizes the effective materials properties to develop a
uniform field of transitioned material properties. This field can lead to more
stabilized numerical solutions for microstructural analysis of asphalt mixes. The ACF
was also used to provide more insight into the mixtures microstructure and to extract
geometric information for the particles. Limestone particles have shown more
effective length due to its elongated shape comparing to the gravel particles.
REFERENCES
Kose S, Guler M, Bahia HU, Masad E. Distribution of Strains Within Hot-Mix
Asphalt Binders. Journal of the Transportation Research Record 2000; 1391:
21-27.
Masad E, Niranjanan S, Bahia H, Kose S. Modeling and experimental measurements
of localized strain distribution in asphalt mixes. Journal of Transportation
Engineering 2001; 127: 477-485.
Paley, M., and Aboudi, J. (1992). “Micromechanical analysis of composites by the
generalized cells model.” Mechanics of Materials, 14(2), 127-139.
Dessouky, S., Masad, E., and Bayomy, F. (2003). “Evaluation of asphalt mix stability
using compaction properties and aggregate structure analysis,” International
Journal of Pavement Engineering, 4(2), 87-103.
Christensen, R. M. (1990). “Critical evaluation for a class of micro-mechanics
models.” Journal of the Mechanics and Physics of Solids, 38(3), 379-404.
Kim, Y. R., and Little, D. (2004). “Linear viscoelastic analysis of asphalt mastics.”
Journal of Materials in Civil Engineering, ASCE, 16(2), 122 – 132.
Zbib, H. M., and Aifantis, E. C. (1989). “A gradient dependent flow theory of
plasticity: Application to metal and soil instabilities.” Applied Mechanics, 42
(11), 295-304.
Baxter, S. C., and Graham, L. L. (2000). “Characterization of random composites
using moving-window technique.” Journal of Engineering Mechanics, ASCE,
126(4), 389-397.
Dessouky, S., Masad, E., Little, D., and Zbib, H. (2006). “Finite Element Analysis of
Hot Mix Asphalt Microstructure Using Effective Local Material Properties
and Strain Gradient Elasticity,” Journal of Engineering Mechanics, American
Society of Civil Engineers. Vol. 132, No. 2, pp. 158-171
Somadevan, N. (2000). “Measurements and modeling of strain distribution in asphalt
concrete mixes.” MSc thesis, Washington State University, Pullman, WA
Berryman, J., and Blair, S. (1986). “Use of digital image analysis to estimate fluid
permeability of porous materials: application of two-point correlation
functions.” Journal of applied Physics, 60(6), 1930-1938.
All in-text references underlined in blue are linked to publications on ResearchGate, letting you access and read them immediately.
Related Documents
![MICROSTRUCTURE-BASED FINITE ELEMENT · PDF file3 MICROSTRUCTURE-BASED FINITE ELEMENT MODELING OF PARTICLE REINFORCED METAL MATRIX COMPOSITES extensively [20, 21].](https://static.cupdf.com/doc/110x72/5a78bc737f8b9a83238bb5cc/microstructure-based-finite-element-microstructure-based-finite-element-modeling.jpg)