JOURNAL OF CIVIL ENGINEERING AND MANAGEMENT ISSN 1392-3730 / eISSN 1822-3605 2016 Volume 22(2): 271–278 10.3846/13923730.2015.1073174 DETERMINING CHARACTERISTIC SAND SHEAR PARAMETERS OF STRENGTH VIA A DIRECT SHEAR TEST Šarūnas SKUODIS a , Arnoldas NORKUS a , Neringa DIRGĖLIENĖ a , Liudvikas RIMKUS b a Department of Geotechnical Engineering, Civil Engineering Faculty, Vilnius Gediminas Technical University, Saulėtekio al. 11, LT-10223, Vilnius, Lithuania b Department of Structural Mechanics, Civil Engineering Faculty, Vilnius Gediminas Technical University, Saulėtekio al. 11, LT-10223, Vilnius, Lithuania Received 29 March 2015; accepted 11 Jun 2015 Abstract. The article considers the peculiarities of determining quartz sand shear strength according to the Mohr-Coulomb strength criterion, via a direct shear test and that of factors influencing the characteristic angle of internal friction and cohe- sion values of the obtained strength parameters. The air-dry sand of the Baltic Sea region from Lithuanian coastal area near Klaipėda city has been analyzed. The solid density of the investigated sand grains was ρ s = 2.65 g/cm 3 . The initial density of the tested samples made ~1.48–1.50 g/cm 3 . Processing data on the shear test yielded that the quantity of 18 tests was sufficient for the relevant accuracy of determining characteristic sand shear parameters of strength. This quantity of tests allow avoiding the influence of statistical coefficient t α that depends on a degree of freedom (K = n – 2). The paper presents additionally analyzed three different approaches to determining the characteristic shear parameters of strength and that of a comparative analysis of the applied approaches. Keywords: Mohr-Coulomb strength criterion, direct shear test, angle of internal friction, cohesion, loose sand, quartz, characteristic shear strength. Corresponding author: Šarūnas Skuodis E-mail: [email protected] 271 Copyright © 2016 Vilnius Gediminas Technical University (VGTU) Press www.tandfonline.com/tcem Introduction A direct shear test is a laboratory test for determining soil strength parameters most frequently applied in Lithu- ania. According to the Mohr-Coulomb strength criterion, strength parameters include the angle of internal friction φ ( ° ) and cohesion c (kPa). The tests can be performed under various conditions (Alikonis et al. 1999; Amšiejus 2000; Amšiejus et al. 2010; Skuodis et al. 2013), under constant vertical pressure on the top of the sample (Liu et al. 2005) and under the constant volume of the sam- ple (Heng et al. 2010). In addition, shearing (cutting) the sample can be realized under a constant horizontal dis- placement rate (Nakao, Fityus 2009; Sukumaran et al. 2008) or a constant horizontal load (Abedi et al. 2012). For determining soil strength parameters via a shear apparatus, one must choose a relevant strategy, namely, proper testing conditions (see description above), identify the rational quantity of tests and choose load magnitudes (Uchaipichat, Limsiri 2011; Rabbi et al. 2011). The above listed factors influence the reliability of determined soil properties for a certain geotechnical situation and applied loading levels. A rational quantity of tests is the most important. According to Bond and Harris (2008), “the volume of testing to be carried out depends on the qual- ity of data already available for the site and the extent of prior knowledge of the properties of materials on the site”. In cases of extensive experience, minimal amounts of tests are recommended. The number is also a function of potential variability in the parameters to be assessed. Due to the above given recommendation, Bond and Har- ris (2008) propose the minimal quantity of tests should be from 2 to 4. However, processing data on 2–4 tests ends in the large distribution of strength properties, which finally results in a significant reduction of characteristic shear parameters of strength. According to the Mohr-Coulomb strength criterion (Rericha 2004; Shen et al. 2012), the angle of internal friction and cohesion can be identified for two tests: + ⋅ = + ⋅ = c c f f ϕ σ τ ϕ σ τ tan tan 2 2 , 1 1 , , (1) where: τ f,1 and τ f,2 – the maximum shear strength of the first and second test respectively; σ 1 and σ 2 – normal stress at the maximum shear strength of the first and sec- ond test respectively; φ – the angle of internal friction, (°); c – cohesion, (kPa).

Welcome message from author
This document is posted to help you gain knowledge. Please leave a comment to let me know what you think about it! Share it to your friends and learn new things together.
Transcript
JOURNAL OF CIVIL ENGINEERING AND MANAGEMENT
ISSN 1392-3730 / eISSN 1822-3605
2016 Volume 22(2): 271–278
10.3846/13923730.2015.1073174
DETERMINING CHARACTERISTIC SAND SHEAR PARAMETERS OF STRENGTH VIA A DIRECT SHEAR TEST
Šarūnas SKUODISa, Arnoldas NORKUSa, Neringa DIRGĖLIENĖa, Liudvikas RIMKUSb
aDepartment of Geotechnical Engineering, Civil Engineering Faculty, Vilnius Gediminas Technical University, Saulėtekio al. 11, LT-10223, Vilnius, Lithuania
bDepartment of Structural Mechanics, Civil Engineering Faculty, Vilnius Gediminas Technical University, Saulėtekio al. 11, LT-10223, Vilnius, Lithuania
Received 29 March 2015; accepted 11 Jun 2015
Abstract. The article considers the peculiarities of determining quartz sand shear strength according to the Mohr-Coulomb strength criterion, via a direct shear test and that of factors influencing the characteristic angle of internal friction and cohe-sion values of the obtained strength parameters. The air-dry sand of the Baltic Sea region from Lithuanian coastal area near Klaipėda city has been analyzed. The solid density of the investigated sand grains was ρs = 2.65 g/cm3. The initial density of the tested samples made ~1.48–1.50 g/cm3. Processing data on the shear test yielded that the quantity of 18 tests was sufficient for the relevant accuracy of determining characteristic sand shear parameters of strength. This quantity of tests allow avoiding the influence of statistical coefficient tα that depends on a degree of freedom (K = n – 2). The paper presents additionally analyzed three different approaches to determining the characteristic shear parameters of strength and that of a comparative analysis of the applied approaches. Keywords: Mohr-Coulomb strength criterion, direct shear test, angle of internal friction, cohesion, loose sand, quartz, characteristic shear strength.
Corresponding author: Šarūnas SkuodisE-mail: [email protected]
271 Copyright © 2016 Vilnius Gediminas Technical University (VGTU) Presswww.tandfonline.com/tcem
Introduction
A direct shear test is a laboratory test for determining soil strength parameters most frequently applied in Lithu-ania. According to the Mohr-Coulomb strength criterion, strength parameters include the angle of internal friction φ (°) and cohesion c (kPa). The tests can be performed under various conditions (Alikonis et al. 1999; Amšiejus 2000; Amšiejus et al. 2010; Skuodis et al. 2013), under constant vertical pressure on the top of the sample (Liu et al. 2005) and under the constant volume of the sam-ple (Heng et al. 2010). In addition, shearing (cutting) the sample can be realized under a constant horizontal dis-placement rate (Nakao, Fityus 2009; Sukumaran et al. 2008) or a constant horizontal load (Abedi et al. 2012).
For determining soil strength parameters via a shear apparatus, one must choose a relevant strategy, namely, proper testing conditions (see description above), identify the rational quantity of tests and choose load magnitudes (Uchaipichat, Limsiri 2011; Rabbi et al. 2011). The above listed factors influence the reliability of determined soil properties for a certain geotechnical situation and applied loading levels. A rational quantity of tests is the most important. According to Bond and Harris (2008), “the volume of testing to be carried out depends on the qual-
ity of data already available for the site and the extent of prior knowledge of the properties of materials on the site”. In cases of extensive experience, minimal amounts of tests are recommended. The number is also a function of potential variability in the parameters to be assessed. Due to the above given recommendation, Bond and Har-ris (2008) propose the minimal quantity of tests should be from 2 to 4. However, processing data on 2–4 tests ends in the large distribution of strength properties, which finally results in a significant reduction of characteristic shear parameters of strength.
According to the Mohr-Coulomb strength criterion (Rericha 2004; Shen et al. 2012), the angle of internal friction and cohesion can be identified for two tests:
+⋅=
+⋅=
c
c
f
f
ϕστ
ϕστ
tan
tan
22,
11, , (1)
where: τf,1 and τf,2 – the maximum shear strength of the first and second test respectively; σ1 and σ2 – normal stress at the maximum shear strength of the first and sec-ond test respectively; φ – the angle of internal friction, (°); c – cohesion, (kPa).
272 Š. Skuodis et al. Determining characteristic sand shear parameters of strength via a direct shear test
For a larger number of tests, least square methods for determining strength parameters (Senatore, Iagnemma 2011) have been employed.
The current investigation is aimed at evaluating the influence of the quantity of tests on the magnitudes of soil strength parameters in case a vertical load is applied on the top of the sample. The influence of the shape of soil grains (Shinohara et al. 2000), the rate of the horizontal displacement (Al-Maihdib 2006), the initial density of the soil sample (Kalhor 2012) and the shearing method (Ba-thurst et al. 2008) for strength properties of soil has not considered in this paper.
Air-dry sand from the Klaipėda region was used for testing. The maximum diameters of the examined quartz sand particles varied within the boundaries of 0.063 and 2.0 mm. Size distribution defines three sand fractures identified by performing usual sieve analysis. Physical experiments were performed applying a universal oedom-eter and direct shear apparatus ADS 1/3 (WilleGeotec Group 2010). The characteristic values of shear strength were calculated applying the method of least squares (Skuodis, Norkus 2014). The angle of internal friction and cohesion was accepted in calculations as strength pa-rameters with a covariance:
1
cov(tan , ) / ( ( 2) ,n
ii
c S n=
= ⋅ ∆ ⋅ -∑φ σ (2)
where:
∑ -+⋅==
n
iifmmi cS
1
2, ,)tan( τϕσ (3)
∑ ∑= =
-⋅=∆n
i
n
iiin
1
2
1
2 ,)( σσ (4)
where: τf,i – the maximum value of shearing strength; σi – normal stress at maximum shearing strength; φm – the mean value of the angle of internal friction, (°); cm – the mean value of cohesion, (kPa); n – the quantity of tests.
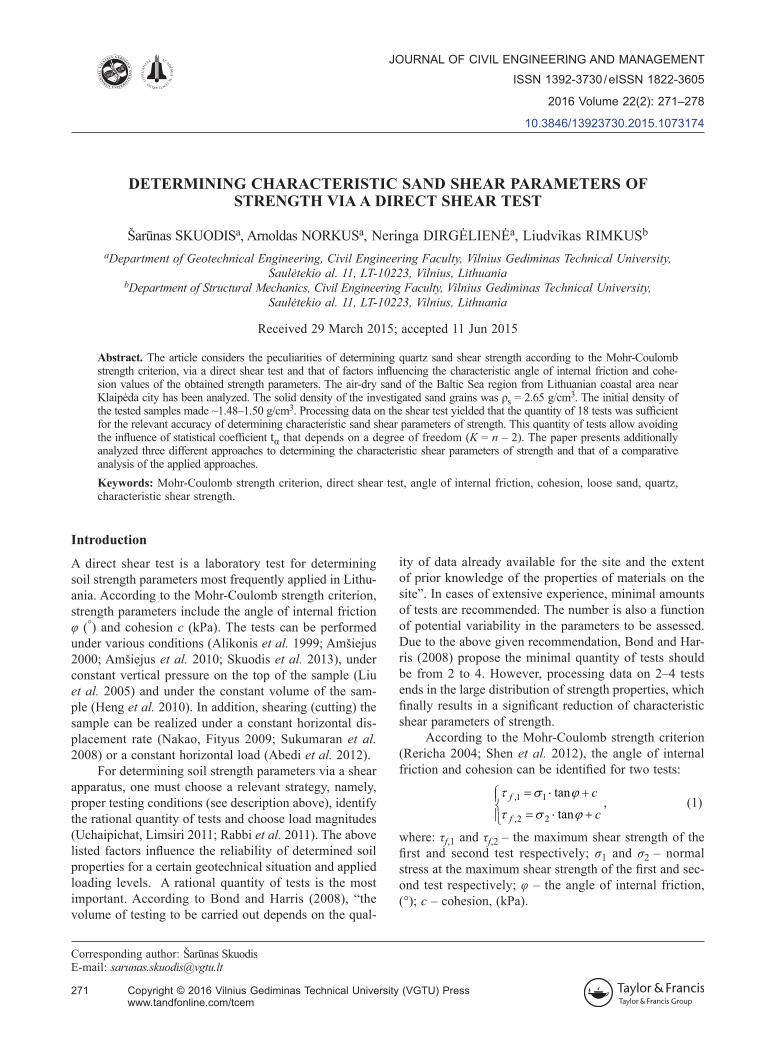
The covariance between the angle of internal fric-tion and cohesion means that for calculating the resource of bearing capacity dd ERZ -=
of footing according
to CSN EN 1997-1:2004 (2004), the same resource of strength Z (Užpolevičius 2006) is obtained for both limit-ing cases. The same bearing capacity is received referring to the big angle of internal friction and small cohesion and vice versa (see Fig. 1).
1. experimental set-up
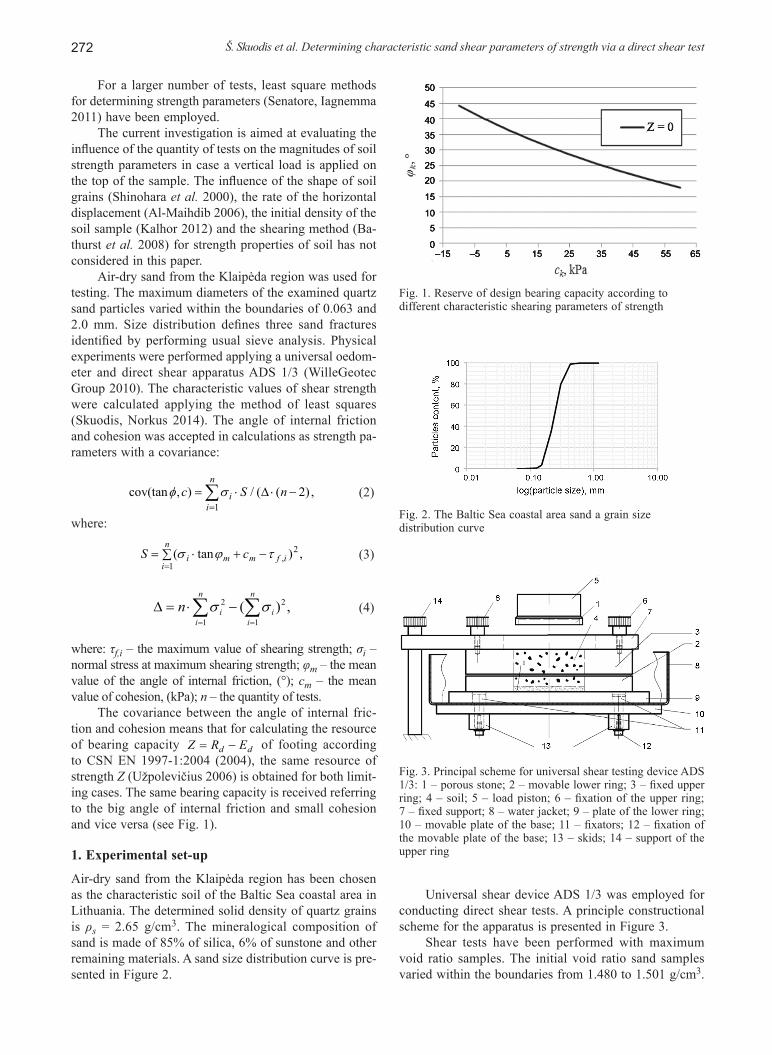
Air-dry sand from the Klaipėda region has been chosen as the characteristic soil of the Baltic Sea coastal area in Lithuania. The determined solid density of quartz grains is ρs = 2.65 g/cm3. The mineralogical composition of sand is made of 85% of silica, 6% of sunstone and other remaining materials. A sand size distribution curve is pre-sented in Figure 2.
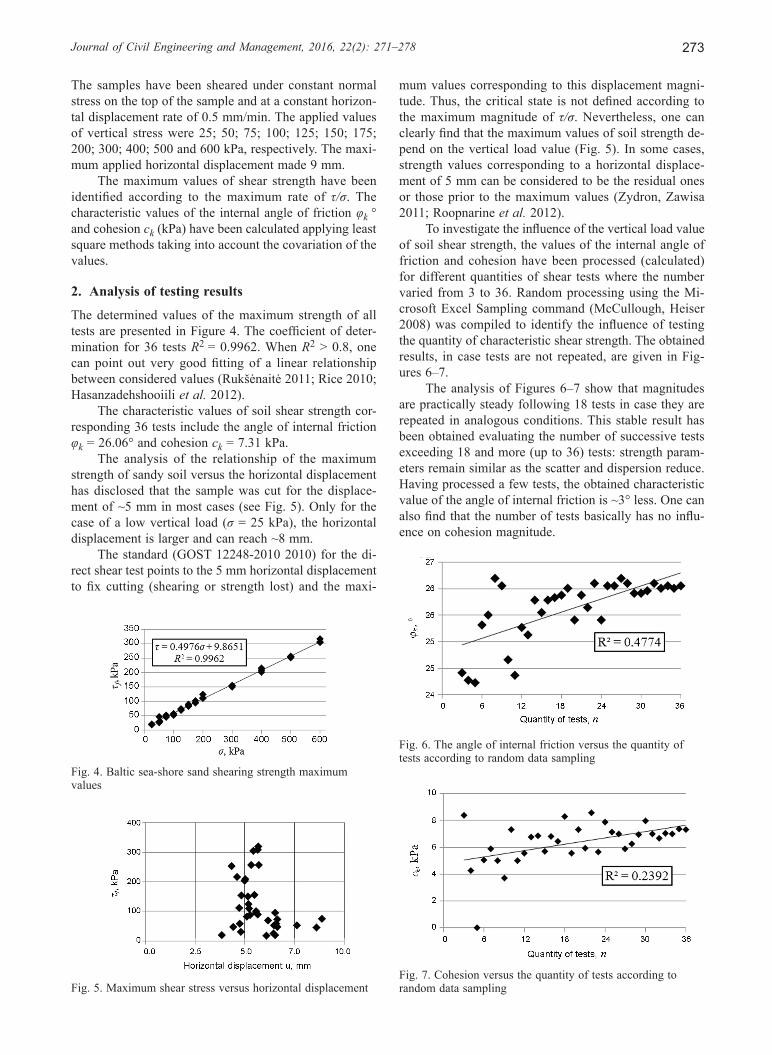
Universal shear device ADS 1/3 was employed for conducting direct shear tests. A principle constructional scheme for the apparatus is presented in Figure 3.
Shear tests have been performed with maximum void ratio samples. The initial void ratio sand samples varied within the boundaries from 1.480 to 1.501 g/cm3.
Fig. 1. Reserve of design bearing capacity according to different characteristic shearing parameters of strength
Fig. 3. Principal scheme for universal shear testing device ADS 1/3: 1 – porous stone; 2 – movable lower ring; 3 – fixed upper ring; 4 – soil; 5 – load piston; 6 – fixation of the upper ring; 7 – fixed support; 8 – water jacket; 9 – plate of the lower ring; 10 – movable plate of the base; 11 – fixators; 12 – fixation of the movable plate of the base; 13 – skids; 14 – support of the upper ring
Fig. 2. The Baltic Sea coastal area sand a grain size distribution curve
Journal of Civil Engineering and Management, 2016, 22(2): 271–278 273
The samples have been sheared under constant normal stress on the top of the sample and at a constant horizon-tal displacement rate of 0.5 mm/min. The applied values of vertical stress were 25; 50; 75; 100; 125; 150; 175; 200; 300; 400; 500 and 600 kPa, respectively. The maxi-mum applied horizontal displacement made 9 mm.
The maximum values of shear strength have been identified according to the maximum rate of τ/σ. The characteristic values of the internal angle of friction φk ° and cohesion ck (kPa) have been calculated applying least square methods taking into account the covariation of the values.
2. Analysis of testing results
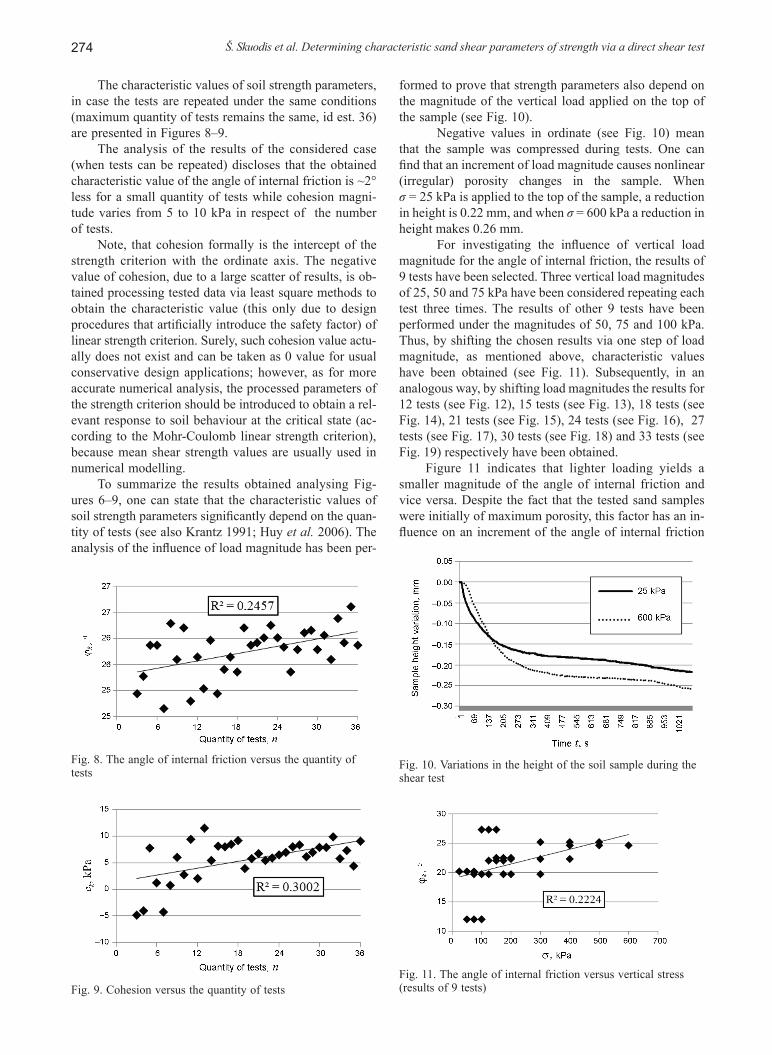
The determined values of the maximum strength of all tests are presented in Figure 4. The coefficient of deter-mination for 36 tests R2 = 0.9962. When R2 > 0.8, one can point out very good fitting of a linear relationship between considered values (Rukšėnaitė 2011; Rice 2010; Hasanzadehshooiili et al. 2012).
The characteristic values of soil shear strength cor-responding 36 tests include the angle of internal friction φk = 26.06° and cohesion ck = 7.31 kPa.
The analysis of the relationship of the maximum strength of sandy soil versus the horizontal displacement has disclosed that the sample was cut for the displace-ment of ~5 mm in most cases (see Fig. 5). Only for the case of a low vertical load (σ = 25 kPa), the horizontal displacement is larger and can reach ~8 mm.
The standard (GOST 12248-2010 2010) for the di-rect shear test points to the 5 mm horizontal displacement to fix cutting (shearing or strength lost) and the maxi-
mum values corresponding to this displacement magni-tude. Thus, the critical state is not defined according to the maximum magnitude of τ/σ. Nevertheless, one can clearly find that the maximum values of soil strength de-pend on the vertical load value (Fig. 5). In some cases, strength values corresponding to a horizontal displace-ment of 5 mm can be considered to be the residual ones or those prior to the maximum values (Zydron, Zawisa 2011; Roopnarine et al. 2012).
To investigate the influence of the vertical load value of soil shear strength, the values of the internal angle of friction and cohesion have been processed (calculated) for different quantities of shear tests where the number varied from 3 to 36. Random processing using the Mi-crosoft Excel Sampling command (McCullough, Heiser 2008) was compiled to identify the influence of testing the quantity of characteristic shear strength. The obtained results, in case tests are not repeated, are given in Fig-ures 6–7.
The analysis of Figures 6–7 show that magnitudes are practically steady following 18 tests in case they are repeated in analogous conditions. This stable result has been obtained evaluating the number of successive tests exceeding 18 and more (up to 36) tests: strength param-eters remain similar as the scatter and dispersion reduce. Having processed a few tests, the obtained characteristic value of the angle of internal friction is ~3° less. One can also find that the number of tests basically has no influ-ence on cohesion magnitude.
Fig. 4. Baltic sea-shore sand shearing strength maximum values
Fig. 5. Maximum shear stress versus horizontal displacement
Fig. 6. The angle of internal friction versus the quantity of tests according to random data sampling
Fig. 7. Cohesion versus the quantity of tests according to random data sampling
274 Š. Skuodis et al. Determining characteristic sand shear parameters of strength via a direct shear test
The characteristic values of soil strength parameters, in case the tests are repeated under the same conditions (maximum quantity of tests remains the same, id est. 36) are presented in Figures 8–9.
The analysis of the results of the considered case (when tests can be repeated) discloses that the obtained characteristic value of the angle of internal friction is ~2° less for a small quantity of tests while cohesion magni-tude varies from 5 to 10 kPa in respect of the number of tests.
Note, that cohesion formally is the intercept of the strength criterion with the ordinate axis. The negative value of cohesion, due to a large scatter of results, is ob-tained processing tested data via least square methods to obtain the characteristic value (this only due to design procedures that artificially introduce the safety factor) of linear strength criterion. Surely, such cohesion value actu-ally does not exist and can be taken as 0 value for usual conservative design applications; however, as for more accurate numerical analysis, the processed parameters of the strength criterion should be introduced to obtain a rel-evant response to soil behaviour at the critical state (ac-cording to the Mohr-Coulomb linear strength criterion), because mean shear strength values are usually used in numerical modelling.
To summarize the results obtained analysing Fig-ures 6–9, one can state that the characteristic values of soil strength parameters significantly depend on the quan-tity of tests (see also Krantz 1991; Huy et al. 2006). The analysis of the influence of load magnitude has been per-
formed to prove that strength parameters also depend on the magnitude of the vertical load applied on the top of the sample (see Fig. 10).
Negative values in ordinate (see Fig. 10) mean that the sample was compressed during tests. One can find that an increment of load magnitude causes nonlinear (irregular) porosity changes in the sample. When σ = 25 kPa is applied to the top of the sample, a reduction in height is 0.22 mm, and when σ = 600 kPa a reduction in height makes 0.26 mm.
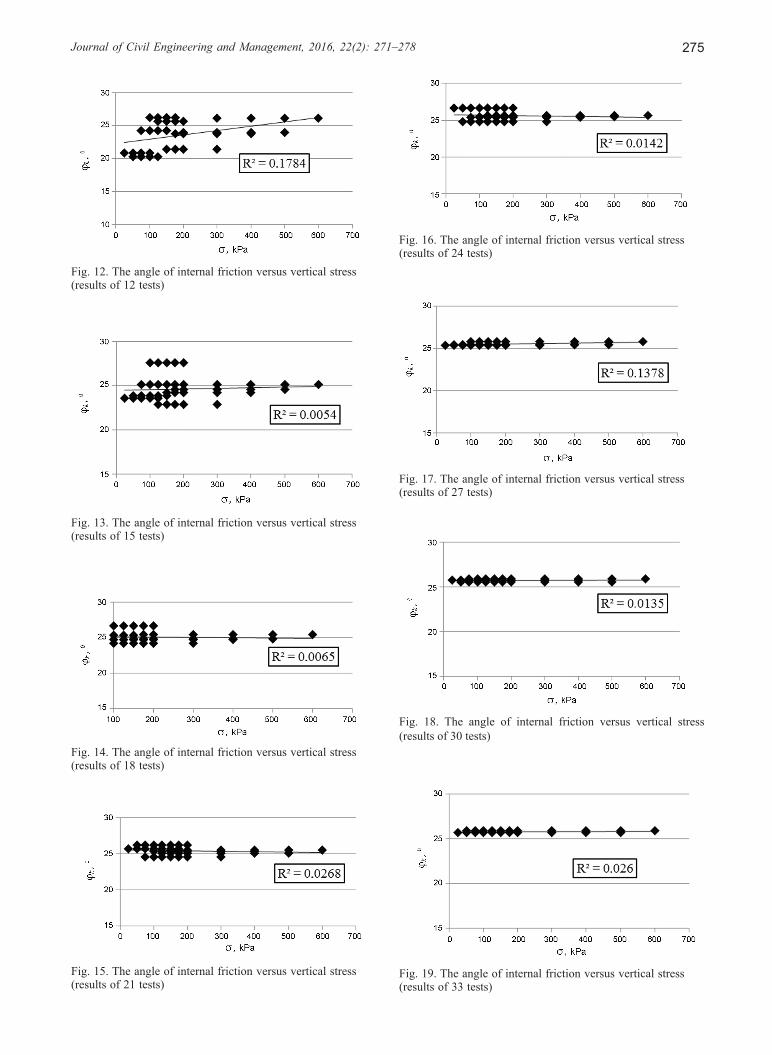
For investigating the influence of vertical load magnitude for the angle of internal friction, the results of 9 tests have been selected. Three vertical load magnitudes of 25, 50 and 75 kPa have been considered repeating each test three times. The results of other 9 tests have been performed under the magnitudes of 50, 75 and 100 kPa. Thus, by shifting the chosen results via one step of load magnitude, as mentioned above, characteristic values have been obtained (see Fig. 11). Subsequently, in an analogous way, by shifting load magnitudes the results for 12 tests (see Fig. 12), 15 tests (see Fig. 13), 18 tests (see Fig. 14), 21 tests (see Fig. 15), 24 tests (see Fig. 16), 27 tests (see Fig. 17), 30 tests (see Fig. 18) and 33 tests (see Fig. 19) respectively have been obtained.
Figure 11 indicates that lighter loading yields a smaller magnitude of the angle of internal friction and vice versa. Despite the fact that the tested sand samples were initially of maximum porosity, this factor has an in-fluence on an increment of the angle of internal friction
Fig. 8. The angle of internal friction versus the quantity of tests
Fig. 9. Cohesion versus the quantity of tests
Fig. 10. Variations in the height of the soil sample during the shear test
Fig. 11. The angle of internal friction versus vertical stress (results of 9 tests)
Journal of Civil Engineering and Management, 2016, 22(2): 271–278 275
Fig. 12. The angle of internal friction versus vertical stress (results of 12 tests)
Fig. 13. The angle of internal friction versus vertical stress (results of 15 tests)
Fig. 14. The angle of internal friction versus vertical stress (results of 18 tests)
Fig. 15. The angle of internal friction versus vertical stress (results of 21 tests)
Fig. 16. The angle of internal friction versus vertical stress (results of 24 tests)
Fig. 17. The angle of internal friction versus vertical stress (results of 27 tests)
Fig. 18. The angle of internal friction versus vertical stress (results of 30 tests)
Fig. 19. The angle of internal friction versus vertical stress (results of 33 tests)
276 Š. Skuodis et al. Determining characteristic sand shear parameters of strength via a direct shear test
versus an increment of load magnitude. In this case the angle of internal friction depends on changes in the den-sity of the sample due to load magnitude. The increment of the angle of the internal friction of loose sands only can be recognized (Ghazavi et al. 2008). The internal an-gle of the friction of dense sandy soils reduces when load magnitude increases (Bareither et al. 2008).
The magnitude of a vertical load basically has no in-fluence on the magnitude of the angle of internal friction in case the characteristic value was determined process-ing data on 18 and more direct shear tests (see Figs 14–19). For determining the characteristic angle of the inter-nal friction value via processing 18 tests (see Fig. 14) in the loading range from 25 to 200 kPa the variation of φk was insignificant and made ~1°.
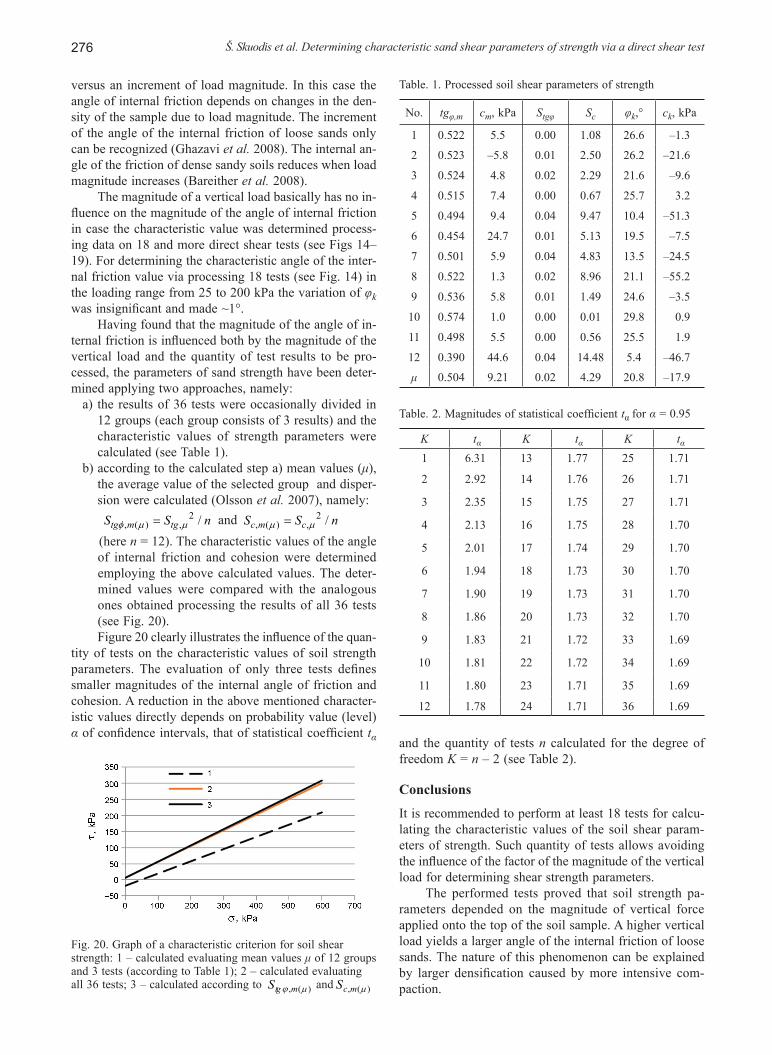
Having found that the magnitude of the angle of in-ternal friction is influenced both by the magnitude of the vertical load and the quantity of test results to be pro-cessed, the parameters of sand strength have been deter-mined applying two approaches, namely:
a) the results of 36 tests were occasionally divided in 12 groups (each group consists of 3 results) and the characteristic values of strength parameters were calculated (see Table 1).
b) according to the calculated step a) mean values (μ), the average value of the selected group and disper-sion were calculated (Olsson et al. 2007), namely: 2
, ( ) , /tg m tgS S n=φ µ µ and 2, ( ) , /c m cS S n=µ µ
(here n = 12). The characteristic values of the angle of internal friction and cohesion were determined employing the above calculated values. The deter-mined values were compared with the analogous ones obtained processing the results of all 36 tests (see Fig. 20). Figure 20 clearly illustrates the influence of the quan-
tity of tests on the characteristic values of soil strength parameters. The evaluation of only three tests defines smaller magnitudes of the internal angle of friction and cohesion. A reduction in the above mentioned character-istic values directly depends on probability value (level) α of confidence intervals, that of statistical coefficient tα and the quantity of tests n calculated for the degree of
freedom K = n – 2 (see Table 2).
Conclusions
It is recommended to perform at least 18 tests for calcu-lating the characteristic values of the soil shear param-eters of strength. Such quantity of tests allows avoiding the influence of the factor of the magnitude of the vertical load for determining shear strength parameters.
The performed tests proved that soil strength pa-rameters depended on the magnitude of vertical force applied onto the top of the soil sample. A higher vertical load yields a larger angle of the internal friction of loose sands. The nature of this phenomenon can be explained by larger densification caused by more intensive com-paction.
Table. 1. Processed soil shear parameters of strength
No. tgφ,m cm, kPa Stgφ Sc φk,° ck, kPa
1 0.522 5.5 0.00 1.08 26.6 –1.3
2 0.523 –5.8 0.01 2.50 26.2 –21.6
3 0.524 4.8 0.02 2.29 21.6 –9.6
4 0.515 7.4 0.00 0.67 25.7 3.2
5 0.494 9.4 0.04 9.47 10.4 –51.3
6 0.454 24.7 0.01 5.13 19.5 –7.5
7 0.501 5.9 0.04 4.83 13.5 –24.5
8 0.522 1.3 0.02 8.96 21.1 –55.2
9 0.536 5.8 0.01 1.49 24.6 –3.5
10 0.574 1.0 0.00 0.01 29.8 0.9
11 0.498 5.5 0.00 0.56 25.5 1.9
12 0.390 44.6 0.04 14.48 5.4 –46.7
μ 0.504 9.21 0.02 4.29 20.8 –17.9
Table. 2. Magnitudes of statistical coefficient tα for α = 0.95
K tα K tα K tα1 6.31 13 1.77 25 1.71
2 2.92 14 1.76 26 1.71
3 2.35 15 1.75 27 1.71
4 2.13 16 1.75 28 1.70
5 2.01 17 1.74 29 1.70
6 1.94 18 1.73 30 1.70
7 1.90 19 1.73 31 1.70
8 1.86 20 1.73 32 1.70
9 1.83 21 1.72 33 1.69
10 1.81 22 1.72 34 1.69
11 1.80 23 1.71 35 1.69
12 1.78 24 1.71 36 1.69
Fig. 20. Graph of a characteristic criterion for soil shear strength: 1 – calculated evaluating mean values μ of 12 groups and 3 tests (according to Table 1); 2 – calculated evaluating all 36 tests; 3 – calculated according to )(, µϕ mtgS and )(, µmcS
Journal of Civil Engineering and Management, 2016, 22(2): 271–278 277
The characteristic values of soil strength parameters depend on the quantity of tests as they are calculated ac-cording to statistical coefficient tα. Thus, it is obvious, it is not enough to perform 2–4 tests for an experienced re-searcher or technician. Processed strength parameters will be essentially smaller (id est. too conservative), where for 4 tests tα = 2.92, and for 18 tests tα = 1.75.
Acknowledgements
The equipment and infrastructure of the Civil Engineer-ing Research Centre of Vilnius Gediminas Technical Uni-versity have been employed for investigation purposes.
ReferencesAbedi, S.; Rechenmacher, A. L.; Orlando, A. D. 2012. Vortex
formation and dissolution in sheared sands, Granular Mat-ter 14: 695–705.
http://dx.doi.org/10.1007/s10035-012-0369-5Alikonis, A.; Amšiejus, J.; Stragys, V. 1999. Improvement of
shear box apparatus and methodology of test, in The 12th European Conference “Soil Mechanics and Geotechnical Engineering”, 7–10 June 1999, Amsterdam, The Neter-lands, 1053–1057.
Al-Maihdib, A. I. 2006. Influence of shearing rate on interfacial friction between sand and steel, Engineering Journal of University Qatar 19: 1–16.
Amšiejus, J. 2000. Analysis of methods for determining soil shear strength design, Statyba 6(2): 120–127 (in Lithua-nian). http://dx.doi.org/10.1080/13921525.2000.10531575
Amšiejus, J.; Dirgėlienė, N.; Norkus, A. 2010. Analysis of methods for evaluation of soil shear strength parameters, in The 10th International Conference “Modern Building Materials, Structures and Techniques”, 19–21 May 2010, Vilnius, Lithuania, 1077–1082.
Bareither, C. A.; Edil, T. B.; Benson, C. H.; Mickelson, D. M. 2008. Geological and physical factors affecting the friction angle of compacted soils, Journal of Geotechnical and Environmental Engineering 134(10): 1476–1489.
http://dx.doi.org/10.1061/(ASCE)1090-0241(2008) 134:10(1476)
Bathurst, R. J.; Althoff, S.; Linnenbaum, P. 2008. Influence of test method of direct shear behavior of segmental retain-ing wall units, Geotechnical Testing Journal 31(2): 1–9.
Bond, A.; Harris, A. 2008. Decoding Eurocode 7. London: Tay-lor & Francis. 621 p.
CSN EN 1997–1:2004. Eurocode 7: Geotechnical design – Part 1: General rules. European Committee for Standa-dization. Brussels, 2004. 171 p.
Ghazavi, M.; Hosseini, M.; Mollanouri, M. 2008. A comparison between angle of repose and friction angle of sand, in The 12th International Conference of International Association for Computer Methods and Advances in Geomechanics (IACMAG), 1–6 October 2008, Goa, India, 1272–1275.
GOST 12248–2010. Grunty. Metody laboratornogo opredele-niya kharakteristik prochnosti i deformiruemosti [Soils. Methods for soil laboratory strength criterion and defor-mations determination]. Russian standard. Moscow, Rus-sia, 2010 (in Russian).
Hasanzadehshooiili, H.; Lakirouhani, A.; Medzvieckas, J. 2012. Superiority of artificial neural networks over statistical methods in prediction of the optimal length of rock bolts, Journal of Civil Engineering and Management 18(5): 655–661. http://dx.doi.org/10.3846/13923730.2012.724029
Heng, S.; Ohta, H.; Pipatpongsa, T.; Takemoto, M.; Yokota, S. 2010. Constant-volume direct box-shear test on clay-seam
materials, in Proc. of the 17th Southeast Asian Geotechni-cal Conference, 10–13 May 2010, Taipei, Taiwan, 83-87.
Huy, N. Q.; Tol, A. F.; Hölscher, P. 2006. Laboratory investi-gation of the loading rate effects in sand. Report. Delft University of Technology, Delft, the Netherlands. 46 p.
Kalhor, A. 2012. The shear strength analyses of soil with vari-ous compactions under vertical load in direct shear test, International Research Journal of Applied and Basic Sciences 3: 2815–2821.
Krantz, R. W. 1991. Measurements of friction coefficients and cohesion for faulting and fault reactivation in laborato-ry models using sand and sand mixtures, Tectonophysics 188(1–2): 203–207.
http://dx.doi.org/10.1016/0040-1951(91)90323-KLiu, S. H.; Sun, D.; Matsuoka, H. 2005. On the interface friction
in direct shear test, Computers and Geotechnics 32: 317–325. http://dx.doi.org/10.1016/j.compgeo.2005.05.002
McCullough, B. D.; Heiser, D. A. 2008. On the accuracy of statistical procedures in Microsoft Excel 2007, Computa-tional Statistics & Data Analysis 52(10): 4570–4578.
http://dx.doi.org/10.1016/j.csda.2008.03.004Nakao, T.; Fityus, S. 2009. Direct shear testing of a margin-
al material using a large scale shear box, Geotechnical Testing Journal 31(5): 1–11.
Olsson, U.; Engstrand, U.; Rupšys, P. 2007. Statistiniai meto-dai: mokomoji knyga [Statistical methods. Course book]. Kaunas: Akademija. 138 p. (in Lithuanian).
Rabbi, A. T. M. Z.; Hossain, M. K.; Kuwano, J.; Tay, W. B. 2011. Experimental investigation on curing time and stress dependency of strength and deformation characteristics of cement–treated sand and it’s degradation phenomena, In-ternational Journal of Civil & Environmental Engineering 11(4): 36–46.
Rericha, P. 2004. Mohr-Coulomb failure condition and the direct shear test revisited, Acta Polytechnica 44(5–6): 93–96.
Rice, J. A. 2010. Mathematical statistics and data analysis. 3rd ed. Thomson Brooks: Cole. 34 p.
Roopnarine, R.; Eudoixe, G.; Gay, D. 2012. Soil physical prop-erties as predictors of soil strength indices: trinidad case study, Geomaterials 2: 1–9.
http://dx.doi.org/10.4236/gm.2012.21001Rukšėnaitė, J. 2011. Impact of factor rotation methods on simu-
lation composite indicators, Mathematical Modelling and Analysis 16(3): 418–431.
http://dx.doi.org/10.3846/13926292.2011.602436Senatore, C.; Iagnemma, K. D. 2011. Direct shear behavior of
dry, granular soils for low normal stress with application to lightweight robotic vehicle modeling, in Proc. of the 17th ISTVS International Conference, 18–22 September 2011, Blacksburg, VA, USA, 1–12.
Shen, J.; Priest, S. D.; Karakus, M. 2012. Determination of Mohr-Coulomb shear strength parameters from general-ized Hoek-Brown criterion for slope stability analysis, Rock Mechanics and Rock Engineering 45(1): 123–129.
http://dx.doi.org/10.1007/s00603-011-0184-zShinohara, K.; Oida, M.; Golman, B. 2000. Effect of particle
shape on angle of internal friction by triaxial compression test, Powder Technology 107(1–2): 131–136.
http://dx.doi.org/10.1016/S0032-5910(99)00179-5Skuodis, Š.; Norkus, A.; Dirgėlienė, N.; Šlečkuvienė, A. 2013.
Sand shearing peculiarities using direct shear device, Pro-cedia Engineering 57: 1052–1059.
http://dx.doi.org/10.1016/j.proeng.2013.04.133Skuodis, Š.; Norkus, A. 2014. Influence of test quantity on loose
sand shearing strength parameters, in Proc. of the Interna-tional Conference “Innovative Materials, Structures and Technologies”, 8 November 2013, Riga, Latvia. Riga: RTU Press, 170–175.
278 Š. Skuodis et al. Determining characteristic sand shear parameters of strength via a direct shear test
Sukumaran, B.; Das, N.; Ashmawy, A. K. 2008. Modeling gran-ular particle shape using discrete element method, in Proc. of the 1st International FLAC/DEM Symposium, 25–27 August 2008, Minneapolis, USA, 4293–4302.
Uchaipichat, A.; Limsiri, C. 2011. Shear strength characteristics of cemented loose sand, Australian Journal of Basic and Applied Sciences 5(10): 771–776.
Užpolevičius, B. 2006. Statinių tyrinėjimas, bandymas ir vertin-imas [Building research, testing and evaluation]. Vilnius: Technika. 136 p. (in Lithuanian).
http://dx.doi.org/10.3846/834-S
WilleGeotec Group. 2010. Universal direct shear test device ADS 1/3. Göttingen, Germany. 36 p.
Zydron, T.; Zawisa, E. 2011. Shear strength investigation of soils in landslide areas, Geologija 53(3): 147–155.
http://dx.doi.org/10.6001/geologija.v53i3.1895
Šarunas SKUOdiS. PhD candidate at the Department of Geotechnical Engineering, Vilnius Gediminas Technical University (VGTU), Lithuania. Research interests: modelling mechanical properties of soil, soil – structure interaction, foundation engineering.
Arnoldas nOrKUS. Dr Prof. Head of the Department of Geotechnical Engineering, Vilnius Gediminas Technical University (VGTU), Lithuania. Research interests: soil mechanics, modelling mechanical properties of soil, foundation and construction design.
neringa Dirgėlienė. Dr Assoc. Prof. at the Department of Geotechnical Engineering, Vilnius Gediminas Technical University (VGTU), Lithuania. Research interests: soil mechanics, mechanical properties of soils, foundation reconstruction.
liudvikas riMKUS. Dr Assoc. Prof. at the Department of Structural Mechanics, Vilnius Gediminas Technical University (VGTU), Lithuania. Research interests: elastic–plastic behaviour of material, structural analysis.
Related Documents