J Physiol 586.4 (2008) pp 1005–1015 1005 Determining Ca 2+ -sensor binding time and its variability in evoked neurotransmitter release Ava Chomee Yoon 1 , Vinnie Kathpalia 1 , Sahana D’Silva 1 , Aylin Cimenser 2 and Shao-Ying Hua 1 1 Department of Biological Sciences, Barnard College, Columbia University, 3009 Broadway, New York, NY 10027, USA 2 Center for Theoretical Neuroscience, Center for Neurobiology and Behavior, Kolb Research Annex, Columbia University, 1051 Riverside Drive, New York, NY 10032–2695, USA The speed and reliability of neuronal reactions are important factors for proper functioning of the nervous system. To understand how organisms use protein molecules to carry out very fast biological actions, we quantified single-molecule reaction time and its variability in synaptic transmission. From the synaptic delay of crayfish neuromuscular synapses the time for a few Ca 2 + ions to bind with their sensors in evoked neurotransmitter release was estimated. In standard crayfish saline at room temperature, the average Ca 2 + binding time was 0.12 ms for the first evoked quanta. At elevated extracellular Ca 2 + concentrations this binding time reached a limit due to saturation of Ca 2 + influx. Analysis of the synaptic delay variance at various Ca 2 + concentrations revealed that the variability of the Ca 2 + -sensor binding time is the major source of the temporal variability of synaptic transmission, and that the Ca 2 + -independent molecular reactions after Ca 2 + influx were less stochastic. The results provide insights into how organisms maximize reaction speed and reliability. (Resubmitted 27 July 2007; accepted after revision 4 December 2007; first published online 6 December 2007) Corresponding author S.-Y. Hua: Department of Biological Sciences, Barnard College, Columbia University, 3009 Broadway, New York, NY 10027, USA. Email: [email protected] High-speed biological functions such as neurotransmitter exocytosis depend on fast dynamics of molecular interactions. To understand how these interactions affect the speed and reliability of synaptic transmission, we studied the reaction time of Ca 2+ -dependent and Ca 2+ -independent molecular reactions in the process of synaptic transmission, and to what extent the uncertainty of neurotransmitter release is due to Ca 2+ -sensor binding and due to other protein reactions Proteins required for evoked neurotransmitter release include at least synaptotagmin and SNARE proteins (SNARE: SNAP receptors) (Schiavo et al. 1992; Blasi et al. 1993; Littleton et al. 1993). Synaptotagmin acts as the major Ca 2+ sensor in Ca 2+ triggering of synaptic vesicle fusion (reviewed by Chapman, 2002), and the SNARE complex brings closer the membranes to be fused (Sollner et al. 1993; Lin & Scheller, 1997). In addition, several other proteins such as Unc proteins and complexin were also found to be necessary for neurotransmitter release (Sollner, 2003). Although the chemical features of these proteins have been well studied, due to their complex arrangement at the neurotransmitter release site, the in vivo reaction probabilities of the proteins are poorly understood. In the first step of synaptic transmission, whether a primed synaptic vesicle can be released depends on the interaction of only a few Ca 2+ ions with their sensors. The probability of Ca 2+ -sensor reaction is particularly important for neuronal functions because the high Ca 2+ concentration at the release site lasts for only a few milliseconds. This reaction probability may well set the speed limit of interneuronal communications and even the signal processing capacity of neural networks. Since it has not been possible to measure the early change in the free Ca 2+ concentration at the release site ([Ca 2+ ] RS ) following an action potential, Ca 2+ -sensor binding rate was estimated by simulating synaptic responses induced with prolonged elevation in [Ca 2+ ] RS (Bollmann et al. 2000; Schneggenburger & Neher, 2000; Millar et al. 2005). We realized that although it is impossible to measure the reaction time of a few molecules in most biological and chemical reaction systems, synaptic transmission is an event where the total reaction time of a few molecules in the process can be accurately determined owing to the magnification of the reaction by thousands of neurotransmitter molecules released from one synaptic vesicle. This feature of synaptic transmission allowed us to quantify the reaction time of a few molecules in physiological synaptic transmission. Traditionally, synaptic transmission is studied from the magnitude of synaptic response. The measured total response amplitude is a nonlinear sum of quantal response C 2008 The Authors. Journal compilation C 2008 The Physiological Society DOI: 10.1113/jphysiol.2007.130740

Welcome message from author
This document is posted to help you gain knowledge. Please leave a comment to let me know what you think about it! Share it to your friends and learn new things together.
Transcript
J Physiol 586.4 (2008) pp 1005–1015 1005
Determining Ca2+-sensor binding time and its variabilityin evoked neurotransmitter release
Ava Chomee Yoon1, Vinnie Kathpalia1, Sahana D’Silva1, Aylin Cimenser2 and Shao-Ying Hua1
1Department of Biological Sciences, Barnard College, Columbia University, 3009 Broadway, New York, NY 10027, USA2Center for Theoretical Neuroscience, Center for Neurobiology and Behavior, Kolb Research Annex, Columbia University, 1051 Riverside Drive,
New York, NY 10032–2695, USA
The speed and reliability of neuronal reactions are important factors for proper functioning
of the nervous system. To understand how organisms use protein molecules to carry out very
fast biological actions, we quantified single-molecule reaction time and its variability in synaptic
transmission. From the synaptic delay of crayfish neuromuscular synapses the time for a few Ca2+
ions to bind with their sensors in evoked neurotransmitter release was estimated. In standard
crayfishsalineatroomtemperature, theaverageCa2+ bindingtimewas0.12 msforthefirstevoked
quanta. At elevated extracellular Ca2+ concentrations this binding time reached a limit due to
saturation of Ca2+ influx. Analysis of the synaptic delay variance at various Ca2+ concentrations
revealed that the variability of the Ca2+-sensor binding time is the major source of the temporal
variability of synaptic transmission, and that the Ca2+-independent molecular reactions after
Ca2+ influx were less stochastic. The results provide insights into how organisms maximize
reaction speed and reliability.
(Resubmitted 27 July 2007; accepted after revision 4 December 2007; first published online 6 December 2007)
Corresponding author S.-Y. Hua: Department of Biological Sciences, Barnard College, Columbia University, 3009
Broadway, New York, NY 10027, USA. Email: [email protected]
High-speed biological functions such as neurotransmitterexocytosis depend on fast dynamics of molecularinteractions. To understand how these interactions affectthe speed and reliability of synaptic transmission,we studied the reaction time of Ca2+-dependent andCa2+-independent molecular reactions in the process ofsynaptic transmission, and to what extent the uncertaintyof neurotransmitter release is due to Ca2+-sensor bindingand due to other protein reactions
Proteins required for evoked neurotransmitter releaseinclude at least synaptotagmin and SNARE proteins(SNARE: SNAP receptors) (Schiavo et al. 1992; Blasi et al.1993; Littleton et al. 1993). Synaptotagmin acts as themajor Ca2+ sensor in Ca2+ triggering of synaptic vesiclefusion (reviewed by Chapman, 2002), and the SNAREcomplex brings closer the membranes to be fused (Sollneret al. 1993; Lin & Scheller, 1997). In addition, severalother proteins such as Unc proteins and complexin werealso found to be necessary for neurotransmitter release(Sollner, 2003). Although the chemical features of theseproteins have been well studied, due to their complexarrangement at the neurotransmitter release site, the invivo reaction probabilities of the proteins are poorlyunderstood.
In the first step of synaptic transmission, whether aprimed synaptic vesicle can be released depends on the
interaction of only a few Ca2+ ions with their sensors.The probability of Ca2+-sensor reaction is particularlyimportant for neuronal functions because the high Ca2+
concentration at the release site lasts for only a fewmilliseconds. This reaction probability may well set thespeed limit of interneuronal communications and eventhe signal processing capacity of neural networks. Sinceit has not been possible to measure the early change inthe free Ca2+ concentration at the release site ([Ca2+]RS)following an action potential, Ca2+-sensor binding ratewas estimated by simulating synaptic responses inducedwith prolonged elevation in [Ca2+]RS (Bollmann et al.2000; Schneggenburger & Neher, 2000; Millar et al. 2005).We realized that although it is impossible to measurethe reaction time of a few molecules in most biologicaland chemical reaction systems, synaptic transmissionis an event where the total reaction time of a fewmolecules in the process can be accurately determinedowing to the magnification of the reaction by thousands ofneurotransmitter molecules released from one synapticvesicle. This feature of synaptic transmission allowedus to quantify the reaction time of a few molecules inphysiological synaptic transmission.
Traditionally, synaptic transmission is studied fromthe magnitude of synaptic response. The measured totalresponse amplitude is a nonlinear sum of quantal response
C© 2008 The Authors. Journal compilation C© 2008 The Physiological Society DOI: 10.1113/jphysiol.2007.130740

1006 A. C. Yoon and others J Physiol 586.4
amplitude, and the quantal amplitude is proportional tothe product of the probabilities of all molecular reactionsin synaptic transmission. Estimations of individualreaction probabilities from the total synaptic responseamplitude often carry huge errors. Synaptic delay, on thecontrary, is the linear sum of the Ca2+-dependent andCa2+-independent reaction times; and linear summationallows more accurate estimation of individual reactiontimes and their variances. By analysing the variability ofCa2+-dependent and Ca2+-independent reaction times insynaptic transmission, we found that the uncertainty ofsynaptic transmission is mostly due to the Ca2+-dependentmolecular reactions. This indicates that most of theCa2+-independent reactions in synaptic transmissionsuch as lipid bilayer fusion and other possible proteininteractions including SNARE protein binding occur witha relatively high probability.
Methods
Neuromuscular preparation
Crayfish (Procambarus clarkii) of two inches werepurchased from Atchafalaya Biological Supply Co.(Raceland, LA, USA), housed in fresh water at roomtemperature for up to 3 months and fed a diet of fish foodpellets. For each experiment, one of the first pair of walkinglegs was quickly detached from a crayfish, partially byautotomy. Care was taken to ensure that animaldiscomfort was kept to a minimum. Theneuromuscular preparations of leg muscle extensorwere dissected from the meropodite segment in crayfishsalines with different Ca2+ concentrations as required forelectrophysiological recordings. See Hoyle & Wiersma(1958) for anatomy of the walking leg. The frozen animaltissue was destroyed by a qualified biological hazardscontrol company.
The normal crayfish saline contained (mm): 205NaCl, 5.4 KCl, 13.5 CaCl2, 2.7 MgCl2, 10 Hepes(N-[2-hydroxyethyl]piperazine-N ′-[2-ethanesulphonicacid]) and 10 glucose, pH 7.39–7.41. When salines withdifferent Ca2+ concentrations were used, equinormalNaCl was added or reduced to maintain the salines’osmolarity, and Mg2+ concentration was kept constant.For salines containing Sr2+, glucose concentration wasadjusted to achieve equal osmolarity for the salines.
Electrophysiology
To induce synaptic activities, the crayfish leg nerve wasstimulated through a platinum wire placed close tothe proximal end of the nerve. Single square pulses of0.3 or 0.5 ms were applied at 0.1 Hz. Both the axonaction potentials and muscle fibre excitatory postsynapticpotentials (EPSPs) were recorded with intracellular sharp
microelectrodes filled with 3 m KCl (resistance: ∼3 M�)as described before (Hua & Charlton, 1999).
Single nerve terminal spikes and postsynaptic responseswere recorded extracellularly with a method describedby Millar et al. (2002). To locate the phasic nerveterminals, the preparation was incubated with 2 μm
4-(4-(diethylamino)styryl)-N-methylpyridinium iodide(4-Di-2-Asp; Molecular Probes, Eugene, OR, USA) ina saline for 4 min in order to visualize nerve terminalsunder a fluorescence microscope (modified from OlympusBX40). Micropipette electrodes (filled with a saline,resistance: ∼1.0 M�) were placed under a 40× waterimmersion objective (W.D. 3.3 mm) on single phasicterminals at an angle of about 30 deg for extracellularfocal recording. The tip of the micropipettes had beenground at 30 deg using a micropipette beveller (BV-10,Sutter Instrument Co., Novato, CA, USA) to obtain anopening of 5–15 μm across, and the opening was heatpolished to reduce possible damage to the preparation.
Standard preamplifiers (model 1600 of A-M Systems,Carlsborg, WA, USA) were used for both intracellular andextracellular recordings. To increase the time resolution,the low-pass filter of the amplifiers was set at 50 kHz.Tomahocq computer software (Thomas A. Goldhorpe,University of Toronto, Canada), combined with ananalog/digital interface (LM-12, Dagan, Minneapolis,MN, USA), was used for data acquisition. The interfaceallowed a sampling rate of 100 kHz.
All the experiments were conducted at roomtemperature (23–25◦C). To avoid incomplete changeof Ca2+ concentration at the nerve terminals due topipette seal, each preparation was kept only at one Ca2+
concentration for extracellular recordings.
Data analysis
The minimum synaptic delay was measured as the timeperiod from the negative peak of the presynaptic spikesto the start time of the excitatory postsynaptic currents(EPSCs). Since individual nerve spikes were often too smallto be measured accurately, 10 traces were averaged forthe measurement of spike peaks. This average was allowedbecause the variation of the nerve terminal spike timingwas very small compared to the synaptic delay variation.The start time of individual EPSCs and EPSP maximumderivative were determined using routines written inMATLAB (The Mathworks, Natick, MA, USA). Therecordings after the stimulus were first smoothed with amedian filter (temporal resolution: 0.1 ms). For recordingsof EPSCs, a section of the data that was continuouslybelow two standard deviations (∼0.1 mV) of the baselinefluctuation was extracted. The time corresponding to thebeginning of the extracted data section was defined as theEPSC starting time.
C© 2008 The Authors. Journal compilation C© 2008 The Physiological Society
J Physiol 586.4 Ca2+-sensor binding time and variance 1007
Curve fitting was conducted using the nonlinearregression function of SigmaStat 3.0 (Systat Software Inc.,San Jose, CA, USA). For curve fitting using the maximumderivative of EPSPs, 30 EPSPs were recorded from eachmuscle fibre, and the mean of the maximum derivativeof all the EPSPs at the same condition was used for curvefitting.
Results
Estimating Ca2+ concentration at the release site
To estimate the reaction time of Ca2+ with its sensor insynaptic transmission, we need to know the concentrationof free Ca2+ ions at the release site, [Ca2+]RS. Since it isimpossible to directly measure the submembrane Ca2+
concentration for a few milliseconds immediately after anaction potential, we estimated [Ca2+]RS as a function ofthe extracellular Ca2+ concentration ([Ca2+]o):
[Ca2+]RS= [Ca2+]RS-max/(1 + KD-Ca/[Ca2+]o), (1)
where [Ca2+]RS-max is the maximum [Ca2+]RS which isreached when [Ca2+]o is infinite and calcium influxis fully saturated, and K D-Ca is the [Ca2+]o at which[Ca2+]RS is half-maximal. This equation is based on theequilibrium binding reaction between Ca2+ ions and Ca2+
channels. The K D-Ca for Ca2+ influx has been estimatedfor several types of neurons (Akaike et al. 1978; Carbone& Lux, 1987). Assuming that neurotransmitter release istriggered by the binding of n Ca2+ ions with their sensors,synaptic responses at low Ca2+ influx are proportional to([Ca2+]RS)n. The synaptic response, R, at a given [Ca2+]o
can be expressed as:
R = β([Ca2+]RS)n
= β([Ca2+]RS-max/(1+KD-Ca/[Ca2+]o))n, (2)
where β is a constant; β([Ca2+]RS-max)n is the maximumsynaptic response (Rmax) which is achieved when [Ca2+]o
is infinite. A similar version of eqn (2) was introduced byDudel (1981). This equation provides a means to estimatethe value of K D-Ca from the synaptic responses at various[Ca2+]o. Later we used K D-Ca to estimate Ca2+-sensorbinding time (see the next section of Results).
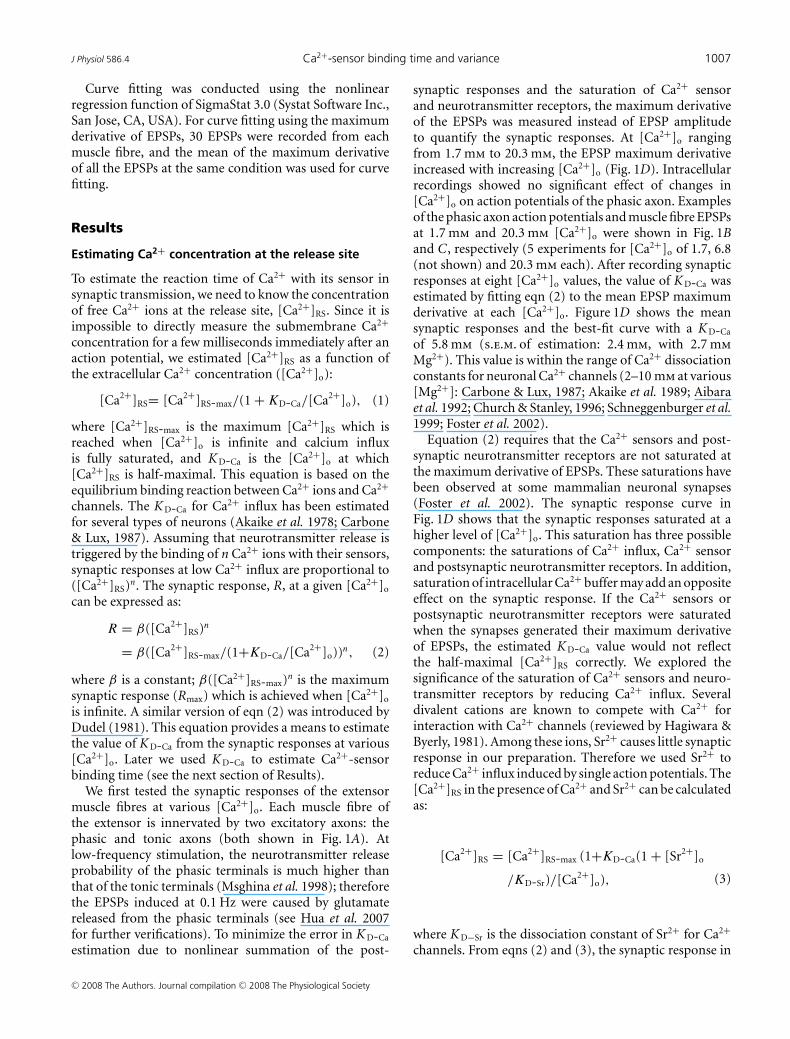
We first tested the synaptic responses of the extensormuscle fibres at various [Ca2+]o. Each muscle fibre ofthe extensor is innervated by two excitatory axons: thephasic and tonic axons (both shown in Fig. 1A). Atlow-frequency stimulation, the neurotransmitter releaseprobability of the phasic terminals is much higher thanthat of the tonic terminals (Msghina et al. 1998); thereforethe EPSPs induced at 0.1 Hz were caused by glutamatereleased from the phasic terminals (see Hua et al. 2007for further verifications). To minimize the error in K D-Ca
estimation due to nonlinear summation of the post-
synaptic responses and the saturation of Ca2+ sensorand neurotransmitter receptors, the maximum derivativeof the EPSPs was measured instead of EPSP amplitudeto quantify the synaptic responses. At [Ca2+]o rangingfrom 1.7 mm to 20.3 mm, the EPSP maximum derivativeincreased with increasing [Ca2+]o (Fig. 1D). Intracellularrecordings showed no significant effect of changes in[Ca2+]o on action potentials of the phasic axon. Examplesof the phasic axon action potentials and muscle fibre EPSPsat 1.7 mm and 20.3 mm [Ca2+]o were shown in Fig. 1Band C, respectively (5 experiments for [Ca2+]o of 1.7, 6.8(not shown) and 20.3 mm each). After recording synapticresponses at eight [Ca2+]o values, the value of K D-Ca wasestimated by fitting eqn (2) to the mean EPSP maximumderivative at each [Ca2+]o. Figure 1D shows the meansynaptic responses and the best-fit curve with a K D-Ca
of 5.8 mm (s.e.m. of estimation: 2.4 mm, with 2.7 mm
Mg2+). This value is within the range of Ca2+ dissociationconstants for neuronal Ca2+ channels (2–10 mm at various[Mg2+]: Carbone & Lux, 1987; Akaike et al. 1989; Aibaraet al. 1992; Church & Stanley, 1996; Schneggenburger et al.1999; Foster et al. 2002).
Equation (2) requires that the Ca2+ sensors and post-synaptic neurotransmitter receptors are not saturated atthe maximum derivative of EPSPs. These saturations havebeen observed at some mammalian neuronal synapses(Foster et al. 2002). The synaptic response curve inFig. 1D shows that the synaptic responses saturated at ahigher level of [Ca2+]o. This saturation has three possiblecomponents: the saturations of Ca2+ influx, Ca2+ sensorand postsynaptic neurotransmitter receptors. In addition,saturation of intracellular Ca2+ buffer may add an oppositeeffect on the synaptic response. If the Ca2+ sensors orpostsynaptic neurotransmitter receptors were saturatedwhen the synapses generated their maximum derivativeof EPSPs, the estimated K D-Ca value would not reflectthe half-maximal [Ca2+]RS correctly. We explored thesignificance of the saturation of Ca2+ sensors and neuro-transmitter receptors by reducing Ca2+ influx. Severaldivalent cations are known to compete with Ca2+ forinteraction with Ca2+ channels (reviewed by Hagiwara &Byerly, 1981). Among these ions, Sr2+ causes little synapticresponse in our preparation. Therefore we used Sr2+ toreduce Ca2+ influx induced by single action potentials. The[Ca2+]RS in the presence of Ca2+ and Sr2+ can be calculatedas:
[Ca2+]RS = [Ca2+]RS-max (1+KD-Ca(1 + [Sr2+]o
/KD-Sr)/[Ca2+]o), (3)
where K D−Sr is the dissociation constant of Sr2+ for Ca2+
channels. From eqns (2) and (3), the synaptic response in
C© 2008 The Authors. Journal compilation C© 2008 The Physiological Society
1008 A. C. Yoon and others J Physiol 586.4
the presence of Sr2+, denoted as RSr, is expressed as:
RSr = Rmax/(1 + KD-Ca(1 + [Sr2+]o/KD-Sr)/[Ca2+]o)n,(4)
where Rmax is the maximum synaptic response. If thesaturation of the synaptic response shown in Fig. 1D wassolely due to the saturation of Ca2+ influx, reducing Ca2+
influx by adding Sr2+ should not change the value ofestimated K D-Ca. But if the saturation of the synapticresponse was largely due to the saturation of Ca2+ sensors
A
50 μm
Phasic terminal
Tonic terminal
B
5 ms
20 mV
20 mV
10 ms
13.5 mM [Ca ]1.7 mM [Ca ]2+ o o
2+
C
20.3 mM [Ca ] 13.5 mM [Ca ]2+ o
5 ms
20 mV
20 mV
10 ms
2+ o
0
0.2
0.4
0.6
0.8
1.0
1.2
1.4
0 5 10 15 20 25
[Ca ] (mM)2+ o
No
rma
lize
dm
ax
de
riva
ti ve
D
Figure 1. Intracellular recordings of the activities of crayfish motor axons and muscle fibresA, fluorescence image of the phasic and tonic nerve terminals on an extensor muscle fibre (the image is shown incolour in the online version of this paper). B, action potentials of the phasic axon and EPSPs at 1.7 and 13.5 mM
[Ca2+]o. C, action potentials of the phasic axon and EPSPs at 20.3 mM and 13.5 mM [Ca2+]o. Recordings in B andC were from different preparations. Recordings at 13.5 mM [Ca2+]o were taken from the same axon and musclefibre after the recordings at 1.7 mM or 20.3 mM [Ca2+]o. D, the synaptic responses at various [Ca2+]o. The meanmaximum derivative of EPSPs (max derivative) was normalized to that in normal crayfish saline. For calibrationthe recordings in normal saline were also taken after each preparation was thoroughly washed in normal crayfishsaline. Data were from five preparations for each [Ca2+]o. Error bars show the S.D. The line is the best fit of eqn(2) to the mean maximum derivative.
or postsynaptic receptors, reducing Ca2+ influx by addingSr2+ would reduce the saturation of the sensors orreceptors, thus leading to a larger K D-Ca as estimated witheqn (4). We then tested K D-Ca in the presence of Sr2+.
Replacing Ca2+ with 10 mm Sr2+ blocked synapticresponses (example shown in Fig. 2A). In fourexperiments, the EPSP amplitude with 10 mm Sr2+
and without Ca2+ was 0.39 ± 0.07 mV, which is veryclose to the amplitude in Ca2+-free saline withoutSr2+ (0.38 ± 0.11 mV, mean ± s.d.). This observation
C© 2008 The Authors. Journal compilation C© 2008 The Physiological Society
J Physiol 586.4 Ca2+-sensor binding time and variance 1009
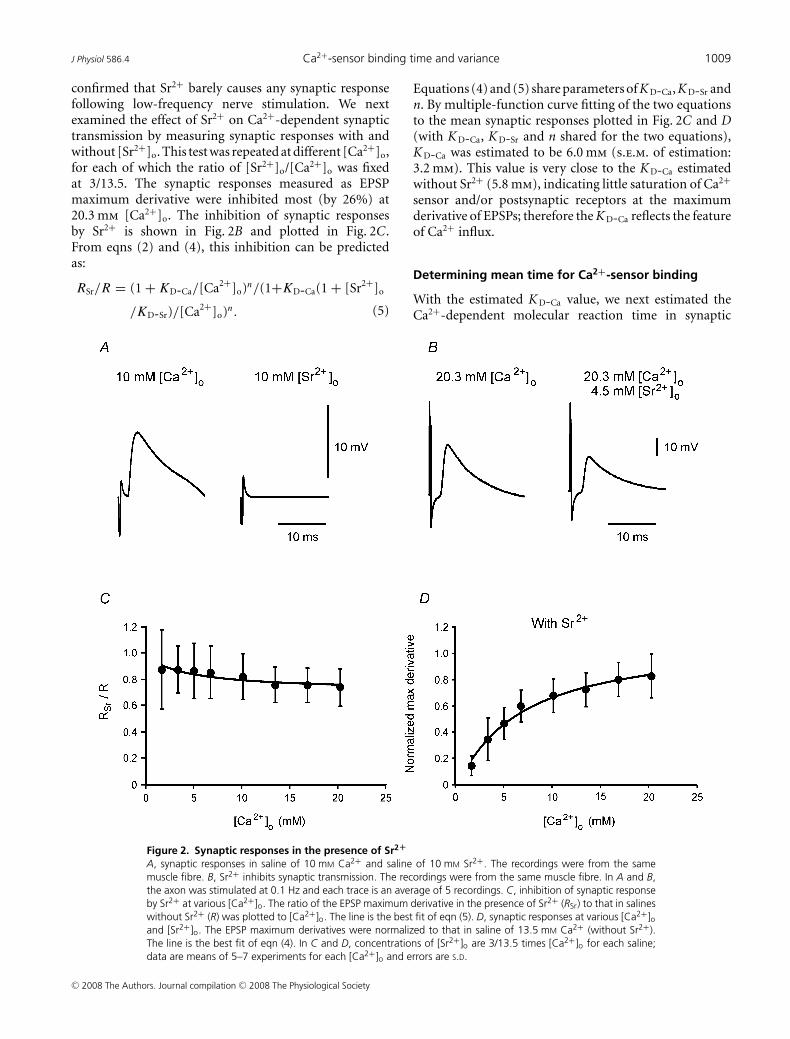
confirmed that Sr2+ barely causes any synaptic responsefollowing low-frequency nerve stimulation. We nextexamined the effect of Sr2+ on Ca2+-dependent synaptictransmission by measuring synaptic responses with andwithout [Sr2+]o. This test was repeated at different [Ca2+]o,for each of which the ratio of [Sr2+]o/[Ca2+]o was fixedat 3/13.5. The synaptic responses measured as EPSPmaximum derivative were inhibited most (by 26%) at20.3 mm [Ca2+]o. The inhibition of synaptic responsesby Sr2+ is shown in Fig. 2B and plotted in Fig. 2C.From eqns (2) and (4), this inhibition can be predictedas:
RSr/R = (1 + KD-Ca/[Ca2+]o)n/(1+KD-Ca(1 + [Sr2+]o
/KD-Sr)/[Ca2+]o)n. (5)
Figure 2. Synaptic responses in the presence of Sr2+
A, synaptic responses in saline of 10 mM Ca2+ and saline of 10 mM Sr2+. The recordings were from the samemuscle fibre. B, Sr2+ inhibits synaptic transmission. The recordings were from the same muscle fibre. In A and B,the axon was stimulated at 0.1 Hz and each trace is an average of 5 recordings. C, inhibition of synaptic responseby Sr2+ at various [Ca2+]o. The ratio of the EPSP maximum derivative in the presence of Sr2+ (RSr) to that in salineswithout Sr2+ (R) was plotted to [Ca2+]o. The line is the best fit of eqn (5). D, synaptic responses at various [Ca2+]oand [Sr2+]o. The EPSP maximum derivatives were normalized to that in saline of 13.5 mM Ca2+ (without Sr2+).The line is the best fit of eqn (4). In C and D, concentrations of [Sr2+]o are 3/13.5 times [Ca2+]o for each saline;data are means of 5–7 experiments for each [Ca2+]o and errors are S.D.
Equations (4) and (5) share parameters of K D-Ca, K D-Sr andn. By multiple-function curve fitting of the two equationsto the mean synaptic responses plotted in Fig. 2C and D(with K D-Ca, K D-Sr and n shared for the two equations),K D-Ca was estimated to be 6.0 mm (s.e.m. of estimation:3.2 mm). This value is very close to the K D-Ca estimatedwithout Sr2+ (5.8 mm), indicating little saturation of Ca2+
sensor and/or postsynaptic receptors at the maximumderivative of EPSPs; therefore the K D-Ca reflects the featureof Ca2+ influx.
Determining mean time for Ca2+-sensor binding
With the estimated K D-Ca value, we next estimated theCa2+-dependent molecular reaction time in synaptic
C© 2008 The Authors. Journal compilation C© 2008 The Physiological Society

1010 A. C. Yoon and others J Physiol 586.4
transmission from the minimum synaptic delays at various[Ca2+]o. Synaptic activities were recorded extracellularlyby placing pipette electrodes on single phasic nerveterminals. Following each stimulus, a presynaptic currentand an excitatory postsynaptic current (EPSC) were
Figure 3. The synaptic delay is Ca2+ dependentA, the nerve terminal spikes and postsynaptic responses at [Ca2+]o of13.5 mM and 3.4 mM as labelled. The arrows point to the negativepeak of the nerve terminal spikes and the onset of the postsynapticresponses. The large noise of the recordings was due to 50 kHzlow-pass filter used for recording. B, mean synaptic delays at various[Ca2+]o. Data were collected from 10–15 single nerve terminals foreach [Ca2+]o. Errors are S.E.M. The curve is the best fit of eqn (9) to themean synaptic delays.
detected as voltage signals (shown in Figs 3A and 4A).When the axon was stimulated at 0.1 Hz, the minimumsynaptic delay, which was the delay of the first quantum,was stable for the period of experiments as long as[Ca2+]o was not changed. In normal crayfish saline,the minimum synaptic delay of 15 single terminalsfrom 10 preparations was 0.61 ± 0.13 ms (mean ± s.d.),which was comparable to the synaptic delays forother types of synapses (Katz & Miledi, 1965; Llinaset al. 1981; Sabatini & Regehr, 1996; Waldeck et al.2000).
Synaptic responses were then induced in eightsalines differing in [Ca2+]o, and synaptic delays weremeasured. The presynaptic signal and EPSCs at twoCa2+ concentrations are shown in Fig. 3A. The minimumsynaptic delay at eight [Ca2+]o values (plotted in Fig. 3B)revealed that the synaptic delay was [Ca2+]o dependent,with longer delay at lower Ca2+ concentrations, and thatthe delay approached a steady level at high [Ca2+]o.These features allowed us to analyse Ca2+-dependent andCa2+-independent components of the minimum synapticdelay.
The synaptic delay is the total time for the followingevents in series: Ca2+ channel opening, Ca2+ influx andCa2+-sensor binding, the possible SNARE protein inter-action and other molecular reactions not well-definedyet, lipid membrane fusion, neurotransmitter release anddiffusion, and postsynaptic response generation. Thesynaptic delay and its variance were mainly attributed topresynaptic events, since neurotransmitter diffusion acrossthe synaptic cleft and postsynaptic events take little time(Katz & Miledi, 1965). Among the presynaptic events, therates of Ca2+ influx and Ca2+-sensor binding are [Ca2+]o
dependent. Since [Ca2+]o is much higher than [Ca2+]RS,the Ca2+-channel interaction takes much less time thanCa2+-sensor interaction; therefore the Ca2+-dependentportion of the synaptic delay is approximately the Ca2+
sensor binding time. For a first-order reaction withrespect to Ca2+ binding site, the probability of thetime length from Ca2+ influx to Ca2+-sensor bindingis exponentially distributed with the mean time length,t , and this time length is the inverse of the productof the binding rate constant and Ca2+ concentration(Colquhoun, 1971b). Thus the mean time required forthe binding of Ca2+ to Ca2+ sensor is expressed by theequation:
t = 1/(k[Ca2+]RS), (6)
where k is the binding rate constant. If the quantal releaserequires multiple Ca2+-sensor binding reactions that donot overlap in time and if no unbinding occurs before thesubsequent event in vesicle fusion, the total Ca2+-sensor
C© 2008 The Authors. Journal compilation C© 2008 The Physiological Society

J Physiol 586.4 Ca2+-sensor binding time and variance 1011
binding time can be calculated as:
d − c = 1/(Nk[Ca2+]RS) + 1/((N − 1)k[Ca2+]RS)
+ 1/((N − 2)k[Ca2+]RS)
+ . . . + 1/((N − N + 1)k[Ca2+]RS), (7)
where d denotes the minimum synaptic delay, c is thetime for all the Ca2+-independent reactions in synaptictransmission, and N is the number of the binding sitesrequired for one vesicle fusion. The unbinding rate ofthe Ca2+ sensor was not included in eqn (7) because theunbinding rate for the putative Ca2+ sensor in neuro-transmitter release was estimated to be low (Bollmann et al.2000) relative to our estimated Ca2+-sensor binding time,and only the vesicles that experienced no Ca2+ unbindinghave a high probability to be released first after each nerveterminal spike. The minimum synaptic delay we measuredwas the delay of these vesicles.
Combining eqns (1) and (7) we have the equation forsynaptic delay:
d = c+(γ /(k[Ca2+]RS-max)) × (1 + KD-Ca/[Ca2+]o),
(8)
where γ ≡ 1/N + 1/(N − 1) + 1/(N − 2) + . . .+ 1/(N −N + 1).
Let e1 = c + γ /(k[Ca2+]RS-max), and e2 = γ K D-Ca/(k[Ca2+]RS-max), eqn (8) can be simplified into:
d = e1 + e2/[Ca2+]o. (9)
Equation (9) was then fitted to the mean minimumsynaptic delay at each [Ca2+]o (Fig. 3B); the best fits ofe1 and e2 are 0.58 ms (s.e.m. 0.01 ms) and 0.47 ms mm
(s.e.m. 0.03 ms mm), respectively. From e1, e2 andK D-Ca = 5.8 mm, the Ca2+-independent portion of theminimum synaptic delay, c, was calculated to be 0.50 ms(c = e1 − e2/K D-Ca). The estimate of c carries errors of e1,e2 and K D-Ca. From these errors, we estimated the s.e.m. ofc to be less than 0.03 ms.
From eqn (9), e1 is the minimum synaptic delaywhen Ca2+ current is saturated at infinite [Ca2+]o,and is the lower limit of the synaptic delay ata particular temperature. The value of e2 is aconstant for [Ca2+]o-dependent change in synapticdelay. With these two parameters, the minimumsynaptic delay can be calculated if one knows [Ca2+]o
(d = 0.58 ms + 0.47 ms mM/[Ca2+]o). From eqns (8) and(9), the ratio of e2 over K D-Ca (= γ /(k[Ca2+]RS-max))denotes another constant (0.08 ms, s.e.m.: 0.03 ms), whichis the Ca2+-sensor binding time at [Ca2+]RS-max (see eqn(6) for the binding time). Thus the synaptic delay can alsobe calculated as 0.50 ms + 0.08 ms× (1 + K D-Ca/[Ca2+]o).
Once we know the Ca2+-independet reaction time,how long it takes for a single Ca2+ ion to bind to abinding site can be calculated if we know how many Ca2+
ions are required for one quantum and whether theybind with the sensors simultaneously or in series. SinceDodge & Rahamimoff (1967) proposed that ∼4 Ca2+ ionswere required for each quantum, experimental findingssuggested that 1–5 Ca2+ ions are required to release 1vesicle of neurotransmitter (Llinas et al. 1976; Charltonet al. 1982; Zucker & Stockbridge, 1983; Bollmann et al.2000; Schneggenburger & Neher, 2000). In normal crayfishsaline, if only 1 Ca2+ is required for a quantum, the bindingtime calculated from eqn (8) is 0.12 ms. If, on the otherhand, 5 Ca2+ ions are required to bind with their identicalsensors in sequence, the individual Ca2+-sensor bindingtime is 0.05 ms. If each binding increases the subsequentbinding affinity, or the binding times overlap, each bindingshould take 0.05–0.12 ms.
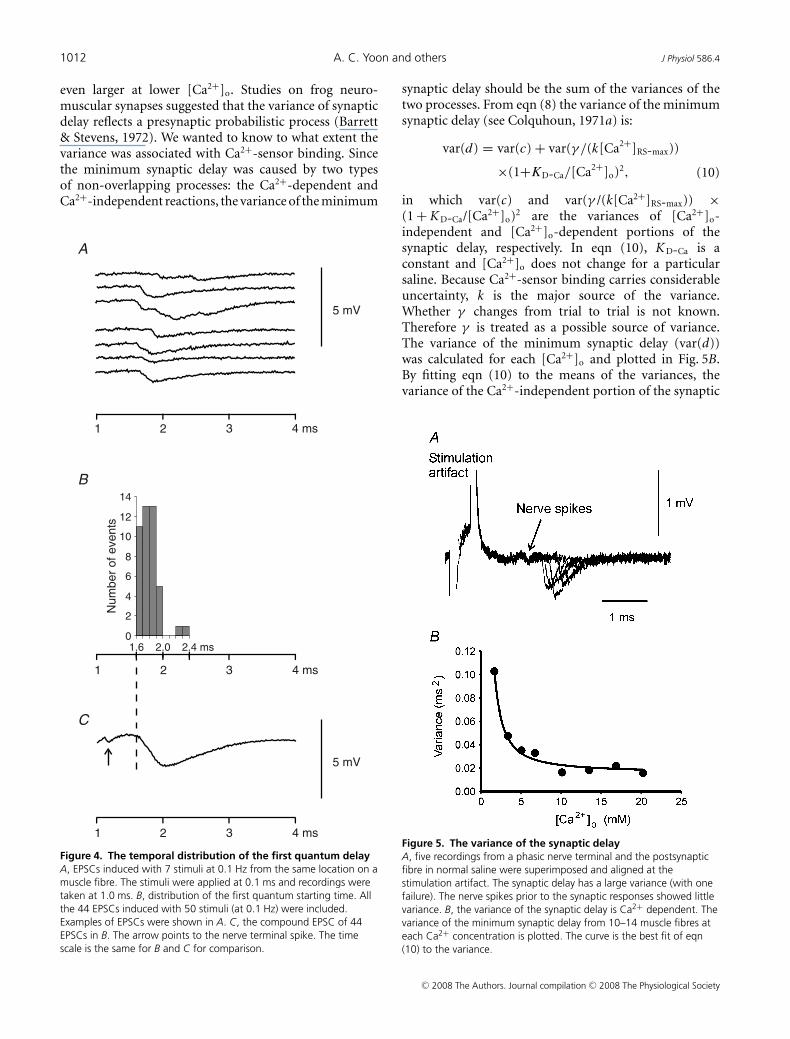
Using minimum synaptic delay measurements, we alsoexamined the delay distribution of the first quantal eventafter nerve spikes. At all the Ca2+ concentrations tested,single action potentials often caused multiple quantafrom single phasic nerve terminals, but most of thequanta were relatively synchronized (see Fig. 4A). Thedelay distribution of EPSCs induced with 50 stimuli at0.1 Hz (6 failures; [Ca2+]o: 16.9 mm; examples shown inFig. 4A) is shown in Fig. 4B, and these EPSCs were summedto construct a compound EPSC (Fig. 4C) illustrating anEPSC of a muscle fibre with 50 phasic terminals. Thedistribution of the minimum synaptic delay showed thatthe single terminal EPSCs started during the period fromthe onset to the negative peak of the compound EPSC.This distribution was common at various [Ca2+]o. Thismeans that the first quanta we analysed occurred up tothe negative peak of the compound EPSC. These firstquanta should result from the exocytosis of the vesiclesthat are relatively homogeneous in their priming statusand their access to Ca2+ source. In our estimation ofthe Ca2+-independent component of synaptic delay, weassumed that [Ca2+]RS is constant during Ca2+ channelopening and is very low before channel opening and afterchannel closing. This assumption is based on findings ofsimulation studies that in the vicinity of Ca2+ channels,[Ca2+]RS reaches a steady level in a few microseconds afterchannel opening and reduces quickly when the channelcloses (Simon & Llinas, 1985; Shahrezaei & Delaney, 2004).Consistent with this notion, the frequency of the firstquanta increased promptly after a short period followingthe nerve spike and most of the first quanta occurredduring a period of 400 μs in Fig. 4.
Determining synaptic delay variance
The synaptic delay of the phasic synapses had aconsiderable variance. This can be seen from Fig. 5A,which shows EPSCs induced with five consecutive stimuliof 0.1 Hz in normal crayfish saline. The variance was
C© 2008 The Authors. Journal compilation C© 2008 The Physiological Society
1012 A. C. Yoon and others J Physiol 586.4
even larger at lower [Ca2+]o. Studies on frog neuro-muscular synapses suggested that the variance of synapticdelay reflects a presynaptic probabilistic process (Barrett& Stevens, 1972). We wanted to know to what extent thevariance was associated with Ca2+-sensor binding. Sincethe minimum synaptic delay was caused by two typesof non-overlapping processes: the Ca2+-dependent andCa2+-independent reactions, the variance of the minimum
1 2 3 4 ms
A
B
C
1 2 3 4 ms
5 mV
5 mV
1 2 3 4 ms
1.6 2.0 2.4 ms0
2
4
6
8
10
12
14
Nu
mb
er
ofe
ve
nts
Figure 4. The temporal distribution of the first quantum delayA, EPSCs induced with 7 stimuli at 0.1 Hz from the same location on amuscle fibre. The stimuli were applied at 0.1 ms and recordings weretaken at 1.0 ms. B, distribution of the first quantum starting time. Allthe 44 EPSCs induced with 50 stimuli (at 0.1 Hz) were included.Examples of EPSCs were shown in A. C, the compound EPSC of 44EPSCs in B. The arrow points to the nerve terminal spike. The timescale is the same for B and C for comparison.
synaptic delay should be the sum of the variances of thetwo processes. From eqn (8) the variance of the minimumsynaptic delay (see Colquhoun, 1971a) is:
var(d) = var(c) + var(γ /(k[Ca2+]RS-max))
×(1+KD-Ca/[Ca2+]o)2, (10)
in which var(c) and var(γ /(k[Ca2+]RS-max)) ×(1 + K D-Ca/[Ca2+]o)2 are the variances of [Ca2+]o-independent and [Ca2+]o-dependent portions of thesynaptic delay, respectively. In eqn (10), K D-Ca is aconstant and [Ca2+]o does not change for a particularsaline. Because Ca2+-sensor binding carries considerableuncertainty, k is the major source of the variance.Whether γ changes from trial to trial is not known.Therefore γ is treated as a possible source of variance.The variance of the minimum synaptic delay (var(d))was calculated for each [Ca2+]o and plotted in Fig. 5B.By fitting eqn (10) to the means of the variances, thevariance of the Ca2+-independent portion of the synaptic
Figure 5. The variance of the synaptic delayA, five recordings from a phasic nerve terminal and the postsynapticfibre in normal saline were superimposed and aligned at thestimulation artifact. The synaptic delay has a large variance (with onefailure). The nerve spikes prior to the synaptic responses showed littlevariance. B, the variance of the synaptic delay is Ca2+ dependent. Thevariance of the minimum synaptic delay from 10–14 muscle fibres ateach Ca2+ concentration is plotted. The curve is the best fit of eqn(10) to the variance.
C© 2008 The Authors. Journal compilation C© 2008 The Physiological Society
J Physiol 586.4 Ca2+-sensor binding time and variance 1013
delay was estimated to be 0.011 ms2 (s.e.m. of estimation:0.002 ms2). Figure 5B shows the curve fitting to theexperimental data.
The variance of the Ca2+-sensor binding time nowcan be calculated form eqn (10). In normal crayfishsaline, the calculated total variance of minimum synapticdelay was 0.021 ms2, meaning that 0.010 ms2, or 48%of the delay variance, was from Ca2+-sensor binding. At1.7 mm [Ca2+]o, the variance of the Ca2+ sensor bindingtime was 89% of the total delay variance. The largevariance of Ca2+-sensor binding time is consistent withthe probabilistic feature of Ca2+ binding with its sensor. Ifthe Ca2+-sensor binding is close to a diffusion-controlledreaction as in vitro (Millet et al. 2002), a major sourceof this variance should be the random walk of Ca2+
ions.
Discussion
Although it has been shown that synaptic delay isCa2+-influx dependent for mammalian neuronal synapses(Sabatini & Regehr, 1996; Bollmann et al. 2000;Schneggenburger & Neher, 2000), the synaptic delays ofsome neuromuscular junctions of both mammals andcrustaceans are known to be Ca2+ independent (Datyner& Gage, 1980; Parnas et al. 1989; Dudel et al. 1991). Inthis study, we found that the delay is Ca2+ dependent atcrayfish phasic neuromuscular junctions. This discrepancymay be attributed to the difference in the synapses andthe range of [Ca2+]o tested. The crayfish phasic neuro-muscular synapses have a very high release probabilitywhich allowed us to measure the synaptic delay over awide range of [Ca2+]o.
In this study, we estimated Ca2+-sensor binding timefrom the synaptic delay of the first quanta in synaptictransmission. The synaptic vesicles that gave rise to thesefirst quanta should be relatively uniform in their moleculararrangement for fusion. The analysis and conclusions ofthis study should apply only to these vesicles, which areprobably already docked (or very close) to Ca2+ channelsat the moment of Ca2+ channel opening. This dockingis made possible by syntaxin, a protein integrated to thenerve terminal membrane. Syntaxin interacts with bothCa2+ channels (Bezprozvanny et al. 1995) and the vesicleassociated membrane protein (VAMP, synaptobrevin).Due to this docking, the minimum distance between avesicle and a Ca2+ channel has been estimated to be lessthan 20 nm (Shahrezaei & Delaney, 2004). Equation (8)cannot be used for vesicles with various distances fromCa2+ channels: the reaction time of Ca2+-sensor bindingfor these vesicles highly depends on the distances betweenthe vesicles and Ca2+ channels, and the synaptic delayfor these vesicles would more likely be affected by Ca2+
unbinding rate.
The challenge in estimating molecular reaction timesand variances is to reduce unknown factors in the processso that the estimates are relatively accurate. We strived toreduce the number of free parameters in curve fitting. Inthe equation for Ca2+-sensor binding time we have onlytwo unknown parameters (see eqn (9)). This equationprovided a unique set of estimates with reasonableestimation errors. Other factors related to estimation errorare discussed as follows. Synaptic vesicle fusion is believedto be caused by multiple Ca2+ bindings, but it is not knownwhether all the binding sites bind with Ca2+ with the sameprobability. Our method does not assume a fixed bindingprobability for all the binding sites, and the cooperativityof Ca2+-sensor binding does not affect the accuracy ofthe estimations of the total Ca2+-binding time. Withour approach, the value of K D-Ca for [Ca2+]o–[Ca2+]RS
conversion was estimated from synaptic responses, andtherefore the Ca2+ influx that was not related to neuro-transmitter release was not included. The major errorsource for our estimation resides in the estimation ofK D-Ca value. With three free parameters in eqn (2), theestimation of K D-Ca has a relatively large error. Anotherpossible source of estimation error is the assumption that[Ca2+]RS is constant during Ca2+-sensor reaction. If morethan one Ca2+ channel contributes to the fusion of thesame vesicle, [Ca2+]RS cannot be a constant value for Ca2+
sensor binding. However, this assumption affects [Ca2+]RS
estimations at all Ca2+ concentrations to a similar extent,and therefore would not affect the main conclusions of thisstudy. Lastly, the assumption that no unbinding occurs forthe first quanta may affect the accuracy of the estimation.
The length and variance of the Ca2+-independentreaction time in synaptic transmission reflect the overallreaction probability of several proteins and lipid moleculesinvolved in synaptic transmission. A simulation model bySchneggenburger & Neher (2000) provided a lower limitestimate of the rate constant for the Ca2+-independentevents in vesicle fusion (6000 s−1, mammalian neurons).With our method, these events take 0.50 ± 0.03 ms innormal saline. While this 0.5 ms accounts for 81% ofthe total synaptic delay for the first quanta in normalcrayfish saline, the variance of these reactions is only52% of the total delay variance. The low variabilityof the Ca2+-independent reaction time is importantfor reliability of synaptic transmission. Indeed, neuronscannot afford a large number of stochastic processesin synaptic transmission. The release machinery andthe structure of lipid bilayer are believed to be verysimilar between crustaceans and mammals. For both,the Ca2+-independent portion of the synaptic delay iscomposed of the time for Ca2+ channels to open, thetime for Ca2+ and molecular machinery to cause vesiclefusion with the nerve terminal membrane, the subsequentneurotransmitter release and the brief time for generationof the postsynaptic response. Among these events, Ca2+
C© 2008 The Authors. Journal compilation C© 2008 The Physiological Society
1014 A. C. Yoon and others J Physiol 586.4
channel opening is known to be a probabilistic process;the variability of the timing of channel opening shouldcontribute substantially to the synaptic delay variance.This leaves very little variance for other protein reactionsincluding SNARE complex formation. Therefore, thestochastic feature of the vesicular release cannot beexplained with SNARE protein interactions. Furthermore,the best way to achieve a low variability of reaction timeis to keep the proteins that interact following Ca2+-sensorbinding very close but separated from each other beforeCa2+ influx. This idea has been expressed in a model ofpartial SNARE complex (Hua & Charlton, 1999) combinedwith a negative switch in vesicle fusion (Hua et al.2007). The model allows very short synaptic delay andlow variability of Ca2+-independent protein reactions insynaptic transmission.
References
Aibara K, Ebihara S & Akaike N (1992). Voltage-dependentionic currents in dissociated paratracheal ganglion cells ofthe rat. J Physiol 457, 591–610.
Akaike N, Kostyuk PG & Osipchuk YV (1989).Dihydropyridine-sensitive low-threshold calcium channelsin isolated rat hypothalamic neurones. J Physiol 412,181–195.
Akaike N, Lee KS & Brown AM (1978). The calcium current ofHelix neuron. J Gen Physiol 71, 509–531.
Barrett EF & Stevens CF (1972). The kinetics of transmitterrelease at the frog neuromuscular junction. J Physiol 227,691–708.
Bezprozvanny I, Scheller RH & Tsien RW (1995). Functionalimpact of syntaxin on gating of N-type and Q-type calciumchannels. Nature 378, 623–626.
Blasi J, Chapman ER, Yamasaki S, Binz T, Niemann H & Jahn R(1993). Botulinum neurotoxin C1 blocks neurotransmitterrelease by means of cleaving HPC-1/syntaxin. EMBO J 12,4821–4828.
Bollmann JH, Sakmann B & Borst JG (2000). Calciumsensitivity of glutamate release in a calyx-type terminal.Science 289, 953–957.
Carbone E & Lux HD (1987). Kinetics and selectivity of alow-voltage-activated calcium current in chick and ratsensory neurones. J Physiol 386, 547–570.
Chapman ER (2002). Synaptotagmin: a Ca2+-sensor thattriggers exocytosis? Nat Rev Mol Cell Biol 3, 498–508.
Charlton MP, Smith SJ & Zucker RS (1982). Role of presynapticcalcium ions and channels in synaptic facilitation anddepression at the squid giant synapse. J Physiol 323, 173–193.
Church PJ & Stanley EF (1996). Single L-type calcium channelconductance with physiological levels of calcium in chickciliary ganglion neurons. J Physiol 496, 59–68.
Colquhoun D (1971a). Fundamental operations anddefinitions. In Lecture on Biostatistics, ed. Colquhoun D,pp. 9–42. Clarendon Press, Oxford.
Colquhoun D (1971b). Stochastic (or random) processes. InLecture on Biostatistics, ed. Colquhoun D, pp. 374–395.Clarendon Press, Oxford.
Datyner NB & Gage PW (1980). Phasic secretion ofacetylcholine at a mammalian neuromuscular junction. JPhysiol 303, 299–314.
Dodge FA Jr & Rahamimoff R (1967). Co-operative action ofcalcium ions in transmitter release at the neuromuscularjunction. J Physiol 193, 419–432.
Dudel J (1981). The effect of reduced calcium on quantal unitcurrent and release at the crayfish neuromuscular junction.Pflugers Arch 391, 35–40.
Dudel J, Parnas H & Parnas I (1991). Evoked phasic release infrog nerve terminals obtained after block of Ca2+ entry byCd2+. Pflugers Arch 419, 197–204.
Foster KA, Kreitzer AC & Regehr WG (2002). Interaction ofpostsynaptic receptor saturation with presynapticmechanisms produces a reliable synapse. Neuron 36,1115–1126.
Hagiwara S & Byerly L (1981). Calcium channel. Annu RevNeurosci 4, 69–125.
Hoyle G & Wiersma CA (1958). Excitation at neuromuscularjunctions in Crustacea. J Physiol 143, 403–425.
Hua SY & Charlton MP (1999). Activity-dependent changes inpartial VAMP complexes during neurotransmitter release.Nat Neurosci 2, 1078–1083.
Hua SY, Teylan MA & Cimenser A (2007). An antibody tosynaptotagmin I facilitates synaptic transmission.Eur J Neurosci 25, 3217–3225.
Katz B & Miledi R (1965). The measurement of synaptic delay,and the time course of acetylcholine release at theneuromuscular junction. Proc R Soc Lond B Biol Sci 161,483–895.
Lin RC & Scheller RH (1997). Structural organizationof the synaptic exocytosis core complex. Neuron 19,1087–1094.
Littleton JT, Stern M, Schulze K, Perin M & Bellen HJ (1993).Mutational analysis of Drosophila synaptotagmindemonstrates its essential role in Ca2+-activatedneurotransmitter release. Cell 74, 1125–1134.
Llinas R, Steinberg IZ & Walton K (1976). Presynaptic calciumcurrents and their relation to synaptic transmission: voltageclamp study in squid giant synapse and theoretical model forthe calcium gate. Proc Natl Acad Sci U S A 73, 2918–2922.
Llinas R, Steinberg IZ & Walton K (1981). Relationshipbetween presynaptic calcium current and postsynapticpotential in squid giant synapse. Biophys J 33,323–351.
Millar AG, Bradacs H, Charlton MP & Atwood HL (2002).Inverse relationship between release probability and readilyreleasable vesicles in depressing and facilitating synapses.J Neurosci 22, 9661–9667.
Millar AG, Zucker RS, Ellis-Davies GC, Charlton MP &Atwood HL (2005). Calcium sensitivity of neurotransmitterrelease differs at phasic and tonic synapses. J Neurosci 25,3113–3125.
Millet O, Bernado P, Garcia I, Rizo J & Pons M (2002). NMRmeasurement of the off rate from the first calcium-bindingsite of the synaptotagmin I C2A domain. FEBS Lett 516,93–96.
Msghina M, Govind CK & Atwood HL (1998). Synapticstructure and transmitter release in crustacean phasic andtonic motor neurons. J Neurosci 18, 1374–1382.
C© 2008 The Authors. Journal compilation C© 2008 The Physiological Society

J Physiol 586.4 Ca2+-sensor binding time and variance 1015
Parnas H, Hovav G & Parnas I (1989). Effect of Ca2+ diffusionon the time course of neurotransmitter release. Biophys J 55,859–874.
Sabatini BL & Regehr WG (1996). Timing ofneurotransmission at fast synapses in the mammalian brain.Nature 384, 170–172.
Schiavo G, Benfenati F, Poulain B, Rossetto O, Polverino deLaureto P, DasGupta BR & Montecucco C (1992). Tetanusand botulinum-B neurotoxins block neurotransmitterrelease by proteolytic cleavage of synaptobrevin. Nature 359,832–835.
Schneggenburger R, Meyer AC & Neher E (1999). Releasedfraction and total size of a pool of immediately availabletransmitter quanta at a calyx synapse. Neuron 23, 399–409.
Schneggenburger R & Neher E (2000). Intracellular calciumdependence of transmitter release rates at a fast centralsynapse. Nature 406, 889–893.
Shahrezaei V & Delaney KR (2004). Consequences ofmolecular-level Ca2+ channel and synaptic vesiclecolocalization for the Ca2+ microdomain andneurotransmitter exocytosis: a monte carlo study. Biophys J87, 2352–2364.
Simon SM & Llinas RR (1985). Compartmentalization of thesubmembrane calcium activity during calcium influx and itssignificance in transmitter release. Biophys J 48, 485–498.
Sollner TH (2003). Regulated exocytosis and SNARE function.Mol Membr Biol 20, 209–220.
Sollner T, Whiteheart SW, Brunner M, Erdjument-Bromage H,Geromanos S, Tempst P & Rothman JE (1993). SNAPreceptors implicated in vesicle targeting and fusion. Nature362, 318–324.
Waldeck RF, Pereda A & Faber DS (2000). Properties andplasticity of paired-pulse depression at a central synapse.J Neurosci 20, 5312–5320.
Zucker RS & Stockbridge N (1983). Presynaptic calciumdiffusion and the time courses of transmitter release andsynaptic facilitation at the squid giant synapse. J Neurosci 3,1263–1269.
Acknowledgements
We thank Dr Peter Balsam for his constructive comments for this
study. This work was supported by a Barnard start-up fund for
S.-Y.H.
C© 2008 The Authors. Journal compilation C© 2008 The Physiological Society
Related Documents
![Cannabinoid action in the olfactory epithelium · evoked ORN responses (black traces) were modulated (red traces). After 12 min of drug washout the odor-induced [Ca2] i transients](https://static.cupdf.com/doc/110x72/60c743d47659e2406d2fae13/cannabinoid-action-in-the-olfactory-epithelium-evoked-orn-responses-black-traces.jpg)