92 DETERMINATION OF TRIPOLYPHOSPHATE AND RELATED HYDROLYSIS PRODUCTS IN PROCESSED SHRIMP Douglas T. Heitkemper, Lisa A. Kaine, David S. Jackson, and Karen A. Wolnik National Forensic Chemistry Center U.S. Food and Drug Administration Cincinnati, Ohio The Food and Drug Administration is responsible for regulating the use of polyphosphates in seafood. Sodium tripolyphosphate is the most commonly used polyphosphate in the processed shrimp industry; and current regulations limit its use in accordance with Good Manufacturing Practice. The potential exists for economic fraud through mislabeling or excessive use of tripolyphosphate. At this point; the Agency is more concerned with excessive water uptake in treated samples than the amount of phosphate found in the product. However, there is a need for methodology which can 1) provide confirmation of the presence of tripolyphosphate in shrimp and 2) correlate the results obtained for added water with the use and/or abuse of tripolyphosphate. The determination of total phosphorus by ICP-AES or some other suitable technique will not allow for an accurate and reliable means of regulating polyphosphate use in shrimp because of the widely varying amounts of P found in shrimp naturally [7]. Therefore, it is necessary to analyze for individual polyphosphate species such as tripolyphosphate and pyrophosphate. There are a number of reports dealing with the determination of polyphosphates in detergents by high performance liquid chromatography and ion chromatography [l-4]; however, thin layer paper chromatography often has been used in investigations involving polyphosphates in seafoods [6,8]. The regulation of polyphosphate use is complicated by the fact that polyphosphates are known to undergo hydrolysis. Unfortunately, polyphosphate hydrolysis is catalyzed in shrimp (as well as in other meats) due to the action of tissue phosphatases [5,6,8]. One mole of tripolyphosphate hydrolyzes to one mole of orthophosphate and one mole of pyrophosphate, while one mole of pyrophosphate hydrolyzes to two moles of orthophosphate [5,6,8]. The development of a successful regulatory method for tripolyphosphate in seafood will depend on a number of factors.Of primary concern, is minimizing the amount of hydrolysis which takes place during sample treatment, storage, and analysis. In the case where a significant amount of orthophosphate is formed due to hydrolysis, development of an effective method may be impossible because of high naturally occurring orthophosphate levels. Additionally, it must be shown that higher concentrations of tripolyphosphate and pyrophosphate found in shrimp correlate with greater water retention. Tehnet and co-workers investigated the stability of STP in treated shrimp during frozen storage using P32 labeled tripolyphosphate and thin layer chromatography[8]. This

Welcome message from author
This document is posted to help you gain knowledge. Please leave a comment to let me know what you think about it! Share it to your friends and learn new things together.
Transcript

92
DETERMINATION OF TRIPOLYPHOSPHATE AND RELATED HYDROLYSISPRODUCTS IN PROCESSED SHRIMP
Douglas T. Heitkemper, Lisa A. Kaine, David S. Jackson, and Karen A. WolnikNational Forensic Chemistry CenterU.S. Food and Drug Administration
Cincinnati, Ohio
The Food and Drug Administration is responsible for regulating the use of polyphosphatesin seafood. Sodium tripolyphosphate is the most commonly used polyphosphate in the processedshrimp industry; and current regulations limit its use in accordance with Good ManufacturingPractice. The potential exists for economic fraud through mislabeling or excessive use oftripolyphosphate. At this point; the Agency is more concerned with excessive water uptake in treatedsamples than the amount of phosphate found in the product. However, there is a need formethodology which can 1) provide confirmation of the presence of tripolyphosphate in shrimp and2) correlate the results obtained for added water with the use and/or abuse of tripolyphosphate.
The determination of total phosphorus by ICP-AES or some other suitable technique will notallow for an accurate and reliable means of regulating polyphosphate use in shrimp because of thewidely varying amounts of P found in shrimp naturally [7]. Therefore, it is necessary to analyze forindividual polyphosphate species such as tripolyphosphate and pyrophosphate. There are a numberof reports dealing with the determination of polyphosphates in detergents by high performance liquidchromatography and ion chromatography [l-4]; however, thin layer paper chromatography oftenhas been used in investigations involving polyphosphates in seafoods [6,8].
The regulation of polyphosphate use is complicated by the fact that polyphosphates are knownto undergo hydrolysis. Unfortunately, polyphosphate hydrolysis is catalyzed in shrimp (as well asin other meats) due to the action of tissue phosphatases [5,6,8]. One mole of tripolyphosphatehydrolyzes to one mole of orthophosphate and one mole of pyrophosphate, while one mole ofpyrophosphate hydrolyzes to two moles of orthophosphate [5,6,8].
The development of a successful regulatory method for tripolyphosphate in seafood willdepend on a number of factors.Of primary concern, is minimizing the amount of hydrolysis whichtakes place during sample treatment, storage, and analysis. In the case where a significant amountof orthophosphate is formed due to hydrolysis, development of an effective method may beimpossible because of high naturally occurring orthophosphate levels. Additionally, it must be shownthat higher concentrations of tripolyphosphate and pyrophosphate found in shrimp correlate withgreater water retention. Tehnet and co-workers investigated the stability of STP in treated shrimpduring frozen storage using P32 labeled tripolyphosphate and thin layer chromatography[8]. This
93
study showed that some breakdown occurs during treatment; however, the tripolyphosphateconcentration remained essentially constant over the period studied (2 - 10 weeks frozen storage).Pyrophosphate and orthophosphate concentrations were not found to stay constant during the sameperiod of frozen storage.
In another study, Reddy found that tripolyphosphate and pyrophosphate concentrations werestable over a 10 month period when stored at -25°C [6]. This study also utilized thin layerchromatography to show that the rate of hydrolysis increased with increasing temperature (5, 10, 25,and 35°C). Additionally, the tissue enzymes responsible for catalyzing hydrolysis in uncookedshrimp were characterized.
Progress towards the development of an ion chromatographic method for the determinationof tripolyphosphate and pyrophosphate in processed shrimp will be discussed in this communication.
MATERIAL AND METHODS
Apparatus
The ion chromatograph used in this work consisted of a Dionex Automated Sampler Module,Gradient Pump Module, Liquid Chromatography Module-3, Reagent Delivery Module and VariableWavelength Detector Module-II. Data collection and reduction were accomplished using a DionexAdvanced Computer Interface and 386/25 microcomputer equipped with AI-450 chromatographysoftware. A Dionex IonPac AS7 anion separator column (4 X 250 mm) and IonPac NG1 guardcolumn (4 X 50 mm) were used.
Operating Conditions
The chromatographic mobile phase was 70 mM nitric acid [HNO3] at a flow rate of 0.5mL/min.. Detection of the phosphate species utilized post-column reaction with 1 g/L ferric nitrate(Fe(N03)3
.9 H2O) in 2 % (V/V) perchloric acid [HClO4] at a flow rate of 0.5 mL/min. The post-column reagent was mixed with the effluent from the IC column using a mixing tee and a Dionex 500µL packed reaction coil. Ultraviolet detection of the reaction products was made at 330 nm. Theinjection volume was 100 µL.
Standards
Food grade sodium tripolyphosphate [Na5P3O10] was obtained from Monsanto (St. Louis,MO). Sodium pyrophosphate decahydrate [Na4P2O7
.10 H2O] was obtained from Aldrich(Milwaukee, WI); and sodium phosphate monobasic [NaH2PO4
.H2O] was obtained from EMScience (Gibbstown, NJ).
Individual stock standards containing either 1,000 or 10,000 µg/g of analyte were preparedin distilled deionized water (DDW) and stored in HDPE bottles. When stored at room temperature,these stock standards were not found to be significantly affected by hydrolysis for at least 30 days.Working standards were prepared daily in the concentration range 5 - 100 µg/g.
Sample Preparation
Samples used in this work were various commercially treated products from a single shrimpprocessor. The samples obtained were packaged and ready for sale.
Frozen samples were placed in zip-lock plastic bags and thawed in cool water.Tails andshells were removed (when necessary). A representative sample (generally 15-20 shrimp) was thencomposited using a Cuisinart Food Processor (Greenwich, CT). Accurately weighed 0.5 g portionsof the composite were then placed in 60 mL HDPE bottles and diluted by a factor of 100 (w/w) withDDW. After thoroughly shaking for approximately 30 minutes on a mechanical shaker, the sampleswere centrifuged to separate the heavier particulate (the centrifugation step was skipped in lateranalyses). The analytical sample was then prepared by passing a portion of the extract through a 0.2or 0.45 µm Nylon 66 syringe filter (Alltech, Waukegan, IL) and an activated 300 mg C- 18 samplepreparation cartridge (Alltech) in series. The first 2 mL's of sample through the filter series wasdiscarded. The C-18 sample preparation cartridges were activated by passing approximately 10 mLof methanol followed by 10 mL of DDW.
RESULTS AND DISCUSSION
Chromatography and Quantitation
The ion chromatographic method used in this work has been described elsewhere for theanalysis of sequestering agents in detergents [3]. The method is well suited for the determination oftripolyphosphate and pyrophosphate; however, orthophosphate elutes very near the void. This limitsthe linear working range of orthophosphate and makes it susceptible to interferences from unretainedsample components. Non-linearity is commonly encountered in ion chromatography when a peak iseluted in the water dip.
It is diflicult to obtain sodium tripolyphosphate in a relatively pure form. Generally a smallamount of pyrophosphate is present. Because of this, it is best to calibrate the system using singlecomponent standards. For quantitative work it is necessary to assay the tripolyphosphate standard.This was done by first determining the concentration of pyrophosphate in a ~500 µg/gtripolyphosphate standard. The total amount of phosphorus in the tripolyphosphate standard is thendetermined using inductively coupled plasma atomic emission spectroscopy (ICP-AES). Finally, theassay is completed by calculating the amount of P due to tripolyphosphate by subtracting the amountof P coming from pyrophosphate (as determined by IC) from the total amount of P (as determinedby ICP-AES). Using this method it was determined that our food grade tripolyphosphate standardcontained 92% (w/w) tripolyphosphate. It should be noted that orthophosphate was not detectedabove the detection limit in either pyrophosphate or tripolyphosphate 500 µg/g standards.
Peak area responses were used in quantitating the phosphate species. The RSD of peak arearesponse for 12 replicate injections of a mixed standard containing 10 µg/g pyrophosphate and 25µg/g STP were found to be 0.9 % and 1.2 %, respectively. A linear working range of 0.5 to 50 µg/g
95
pyrophosphate was established. While for tripolyphosphate, the linear range was 10 to 500 µg/g andfor orthophosphate a linear range of 10 to 100 µg/g was established. Table 1 summarizes the figuresof merit obtained for this separation.
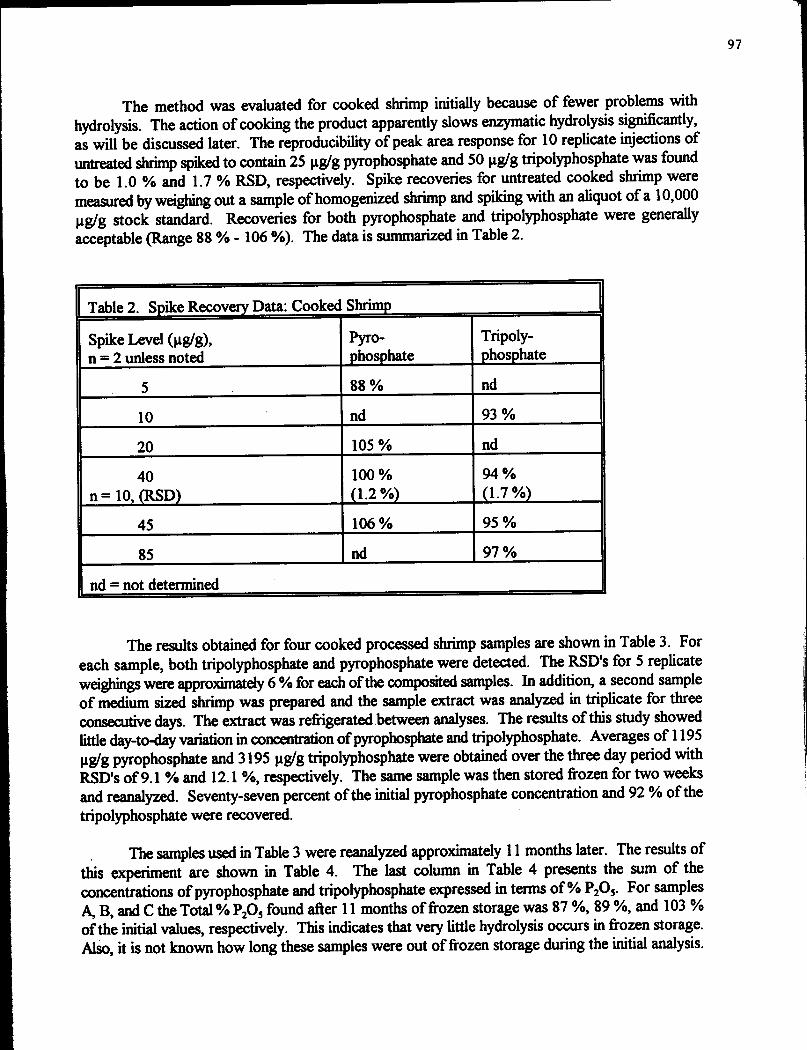
Results for Cooked Product
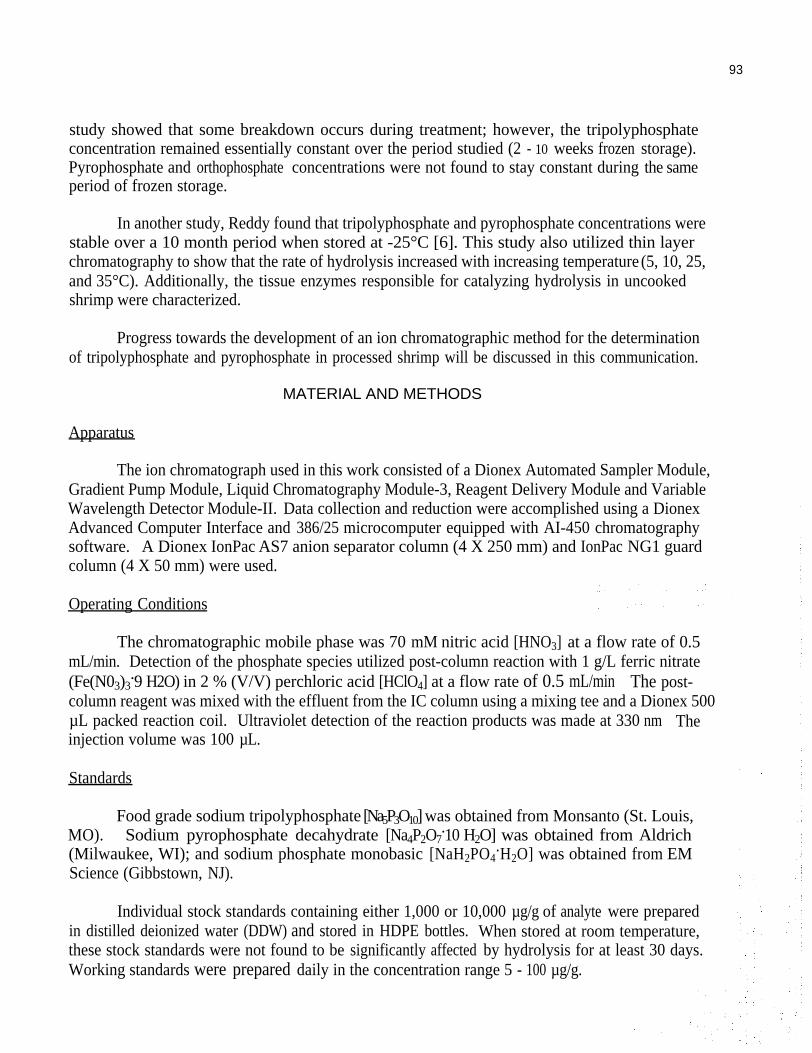
Figure 1 shows the chromatogram obtained for a commercial sample of cooked shrimp whichwas treated with tripolyphosphate by the processor. Ortho-, pyro-, and tripolyphosphate were foundin this particular sample. In addition, an unidentified peak at a retention time of 6.1 minutes is presentin most shrimp samples analyzed. To date, we have not identified this
nd = not determined
peak. We have demonstrated that the peak is not sulfate based on a sulfate spike. In addition,preliminary results obtained using an inductively coupled plasma atomic emission spectrometer as asecond IC detector (in series with the UV detector), indicate that the unknown peak also does notcontain P. No peak was detected at 6.1 minutes when monitoring the 214.9 nm P line.
As a practical note, tripolyphosphate is less strongly retained as the number of shrimp sampleinjections increases. After the peak moves out of an acceptable window of integration, the columncan often be cleaned up by running several column volumes of 200 mM nitric acid. Also, it was foundthat a 5 mL DDW rinse of the injector after every sample significantly minimized sample carryoverproblems.
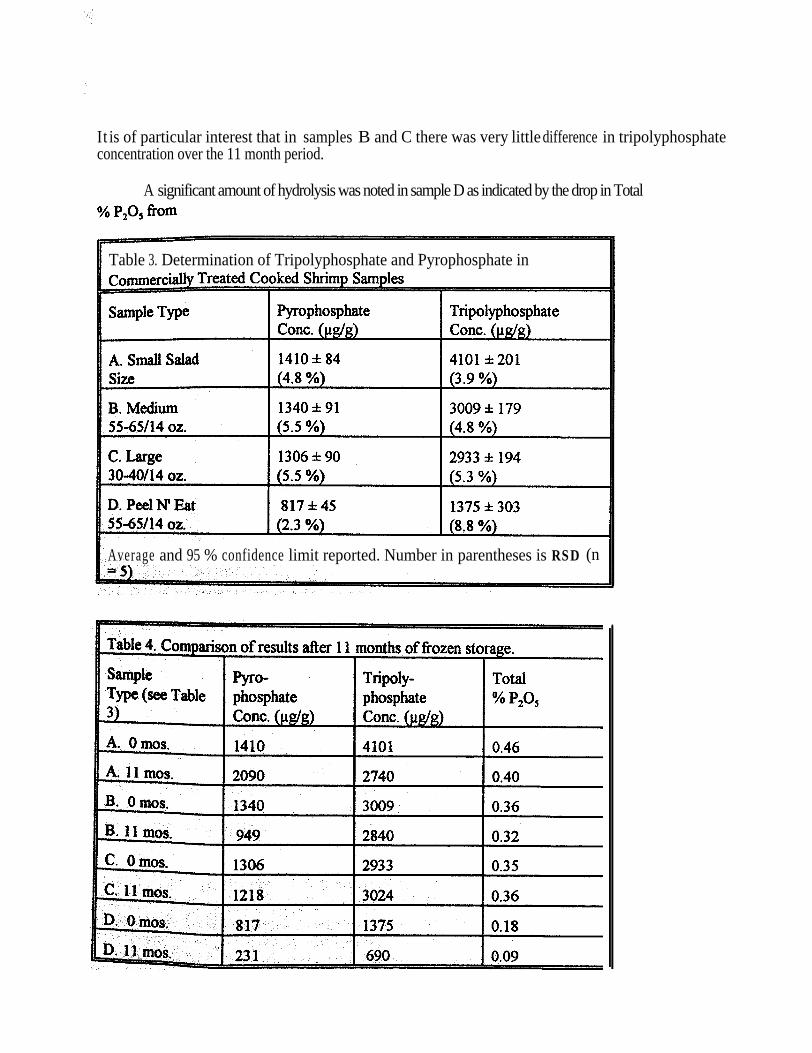
It is of particular interest that in samples B and C there was very little difference in tripolyphosphateconcentration over the 11 month period.
A significant amount of hydrolysis was noted in sample D as indicated by the drop in Total
Table 3. Determination of Tripolyphosphate and Pyrophosphate in
Average and 95 % confidence limit reported. Number in parentheses is RSDD (n
99
0. 18 % to 0.09 %. However, for this sample the appearance and odor indicated significanten place. It is not known whether this decomposition occurred during frozen
was not promptly frozen after initial analysis.The presence of pyrophosphateles treated with tripolyphosphate indicates the need to include pyrophosphate in any
quantitative evaluation of tripolyphosphate use. It is not known if the majority of pyrophosphateencountered in these samples originates from the use of tripolyphosphate which contains largeamounts of pyrophosphate or if a significant amount of hydrolysis has taken place during treatmentand storage. However, the preliminary results obtained for Total % P2O5 as described above, warrantfurther study. It is acknowledged here that any hydrolysis which has occurred producesorthophosphate. The inability to distinguish between the additional orthophosphate and naturallyoccurring orthophosphate induces a certain amount of error in the determination of how muchtripolyphosphate was used.
Results for Uncooked Product
Hydrolysis effects are even more of a concern for uncooked product due to enzymatichydrolysis. This was especially evident when performing spiked recoveries on untreated uncookedshrimp samples. Recoveries of 2700 µg/g pyrophosphate spikes in two different uncooked sampleswere 112 % and 84 %. However, recoveries of 5000 µg/g tripolyphosphate spikes resulted inrecoveries of 84 % and 46 %. In the latter sample a significant amount of pyrophosphate was found.If both pyrophosphate and tripolyphosphate were determined in the latter sample and the sum of thetwo species is used to calculate recovery (in terms of % P or % P205), the calculated recoveryincreases from 46% to 96%.
In a separate experiment the hydrolysis of tripolyphosphate was followed in prepared samplesover a period of 3 to 4 days. The same prepared samples were analyzed on successive days andrefrigerated between analysis. For two uncooked samples the tripolyphosphate concentrationdropped from approximately 2500 µg/g to less than the detection limit in 3 days. While in fourcooked samples the tripolyphosphate concentration averaged 94 % of the starting concentration after4 days.
If it could be shown that tripolyphosphate and pyrophosphate concentrations are stable infrozen storage, it should be possible to evaluate tripolyphosphate use in uncooked product.Obviously the amount of time between sample preparation and analysis would need to be minimized.The major concern then would be how much hydrolysis has taken place during treatment and priorto freezing and how much variation there is in the amount of hydrolysis.
CONCLUSIONS
A method for the determination of pyrophosphate and tripolyphosphate in processed shrimphas been described. The method is generally capable of confirming the use of tripolyphosphate.Recoveries for a 40 µg/g spike of pyrophosphate and tripolyphosphate in cooked shrimp sampleswere 100 % and 94 %, respectively. An RSD of approximately 6 % was obtained for five replicateweighings of commercially treated cooked shrimp samples.
100
Quantitative results should preferrably be reported in terms of a total concentration ofpyrophosphate + tripolyphosphate (expressed as % P2O5 or % P). Hydrolysis effects on cookedshrimp during frozen storage were found to be relatively small or non-existent. Whether or not hightripolyphosphate concentrations can be correlated with the amount of added moisture in shrimp needsto be established.
For uncooked processed shrimp the analysis is more difficult because of enzymatic hydrolysis.The same approach as used with cooked shrimp, determining pyrophosphate + tripolyphosphate as% P2O5, may prove useful if the amount of hydrolysis occuring during processing and storage isminimal.
REFERENCES
1, CHESTER T.L., C.A. SMITH AND S. CULSHAW. 1984. Determination of inorganicphosphates in detergents by high-performance liquid chromatography on PRP- 1 withphosphorus-selective detection. J. Chromatogr., 287: 447-451.
2, FITCHETT, A.W., A. WOODRUFF. 1983. Determination of polyvalent anions by ionchromatography. LC Magazine, 1: 48-49.
3. Determination of sequestering agents. 1984. Application Note 44R, Dionex Corporation,Sunnyvale, CA
4, MACMILLAN, W.D. 1984. The determination of sodium pyrophosphate and sodiumtripolyphosphate in detergent granules by nonsuppressed ion chromnatography J.High Res. Chrom. Comm., 7: 102-3.
5. MOLINS, R.A., A.A. KRAFT, and D.G. OLSON. 1985. Adaptation of a method for thedetermination of soluble orthophosphates in cooked and uncooked pork containingacid labile poly- and pyrophophates. J. Food Sci., 50: 1482-1483.
6. REDDY, B.R 1986. Hydrolytic and enzymatic breakdown of food grade condensedphosphates in white shrimp (Penaeus Setiferus). Ph.D. Dissertation, Texas A & MUniversity, UMI Dissertation Services, Ann Arbor, Michigan.
7. SIDWELL, V.D., D.H. BUZZELL, P.R FONCANNON, and AL. SMITH. 1977.Composition of the edible portion of raw (fresh or frozen) crustaceans, finfish, andmollusks. II. macroelements: sodium, potassium, chlorine, calcium, phosphorus, andmagnesium. Marine Fisheries Review, 39: 1-11.
8. TENHET, V., G. FINNE, R NICKELSON, and D. TOLODAY. 1981. Phosphorous levelsin peeled and deveined shrimp treated with sodium tripolyphosphate. J. Food Sci., 46:350-352.
101
CONSUMER EVALUATIONS OF PHOSPHATED SHRIMP AND SCALLOPS
1LeeAnn Applewhite, 2W. Steve Otwell and 1Laura Garrido1FL Dept. of Agriculture and Consumer Services,
Bureau of Seafood and Aquaculture2University of Florida,
Food Science and Human Nutrition DepartmentGainesville, Florida
Phosphates are used in the seafood industry primarily to reduce freeze/thaw drip loses thatoccur during processing and storage. Proper use of phosphates to influence the moisture content inshrimp and scallops is currently in debate relative to regulatory concerns for adulteration vs.commercial concerns for “good manufacturing practices”. The objective of the study was to recordconsumer ratings for various sensory attributes perceived when exposed to phosphated and non-phosphated shrimp and scallops.
Experienced panelist and consumers rated various sensory attributes perceived duringencounters with boiled shrimp and broiled scallops previously treated with phosphates. Increasingamounts of water were added to the meats by varying the concentrations of phosphate treatmentsolutions and exposure times. Initial triangle comparison test for differences in the treatmentsindicated that over half of the panelist could detect the phosphate treated samples and their ability todistinguish the treated products increased as the moisture content increased. Consumer judgmentsindicated a preference for the treated product and higher ratings for the phosphated shrimp andscallops were consistent for general appearance, flavor, purchase value and overall quality. Thefollowing condensed description of work is based on two papers submitted to Journal of FoodScience (Otwell et al. 1993).
METHODS
Pink shrimp (Peneaus duorarum harvested about Key West, Florida, were headed, peeled anddeveined without excessive water contact. Sea scallops (Placopecten were harvestedalong the New England coast and processed aboard the vessel by researchers from the VirginiaInstitute of Marine Sciences. Both products were exposed to various phosphate treatments to obtainincreasing amounts of water added, The shrimp were boiled using a standard cook procedure thewater was brought to a boil, the shrimp added, the water returned to boil and the shrimp boiled 1minute. The scallops were placed on broiler pans and the temperature monitored until the internaltemperatures reached 160°F.
The product evaluations occurred in two stages. The first stage was a discriminative testinvolving experienced panelists in a more analytical setting (FSHN labs, Univ. Florida). The panelistwere food scientists and students familiar with discriminative product and testing and seafood. Thistest focused on panelists abiity to detect differences between treatment variables. Judgements werebased on appearance and taste of cooked samples. The procedure was triangle testing where thepanelist were asked to distinguish the odd or different sample amongst three cooked samples
102
The second stage in organoleptic testing involved 100-125 consumers randomly recruited byphone and prescreened for age, sex, level of income and familiarity with eating boiled shrimp andbroiled scallops. The consumers were assembled and briefed before, during and after the productevaluations to assure their understanding of the questions and rating system.Ratings were based onactual product observations and consumption. The consumers were unaware of the test variables anda 1 to 7 point rating scale was used. The ratings were analyzed for mean differences and variancewith significance ( =0.05) based on the Walker-Duncan k-ratio test (SAS, 1992).
RESULTS AND DISCUSSION
In general, increasing STP concentration and soak time increased the moisture content in theraw and cooked meats (Tables 1 & 2). In the shrimp, the soaking procedure at 2.0% STP did notimpart or retain as much moisture uptake as the tumbling procedures. In tumbling, the higherphosphate treatments increased moisture uptake and retention in the cooked products. In thescallops, the most significant influence was a 6.0 percent change in raw moisture content from thefreshwater treated control to the 2.5% STP wash for 24 hours. In both cases, the control sampleslost the most water when thawed and cooked while the samples treated with the highestconcentrations of phosphates lost the least.
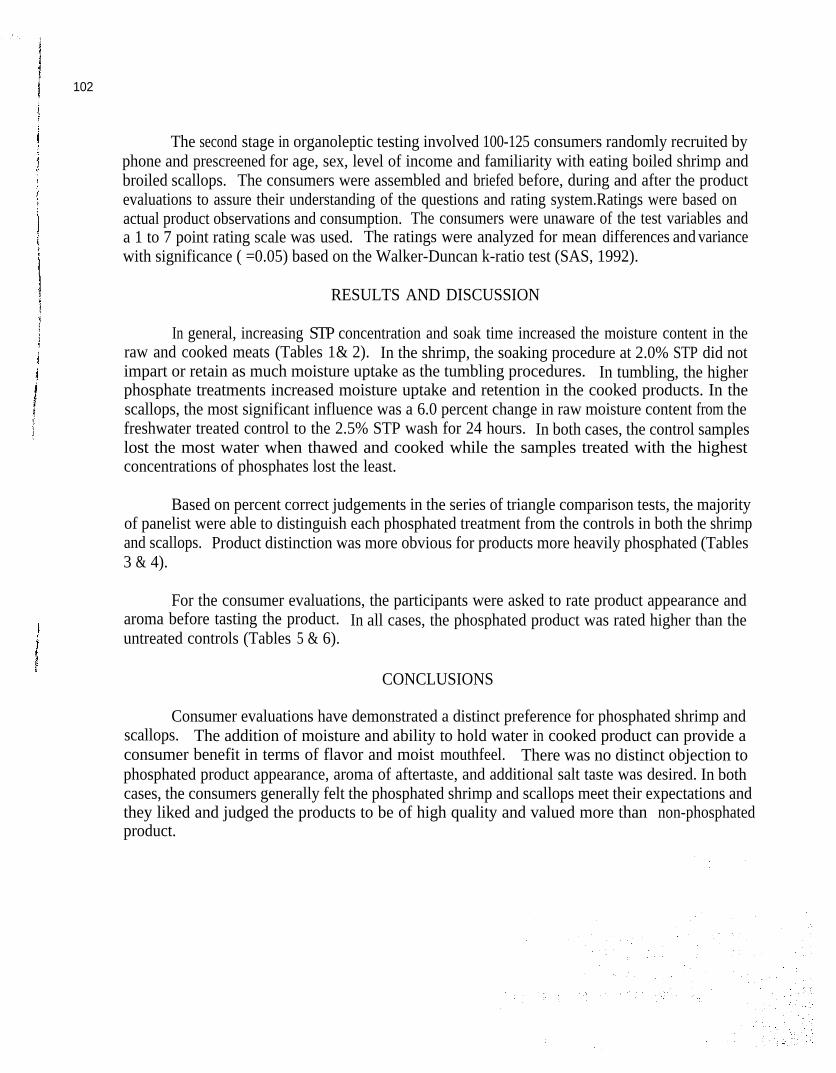
Based on percent correct judgements in the series of triangle comparison tests, the majorityof panelist were able to distinguish each phosphated treatment from the controls in both the shrimpand scallops.3 & 4).
Product distinction was more obvious for products more heavily phosphated (Tables
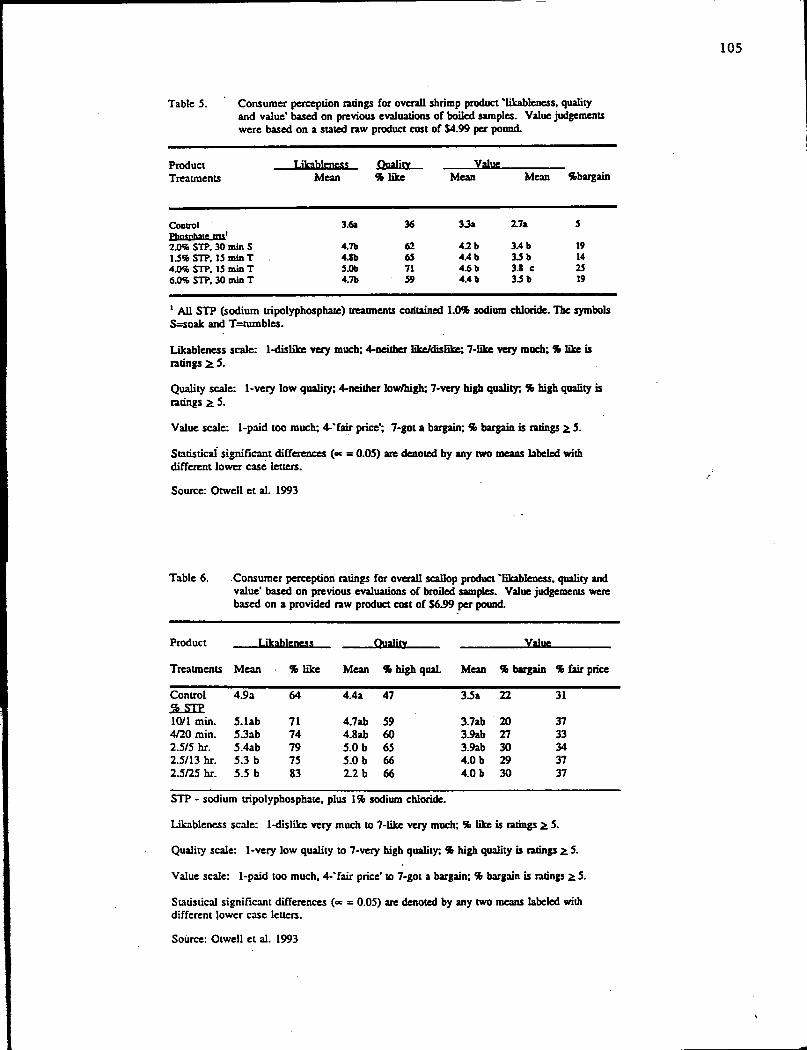
For the consumer evaluations, the participants were asked to rate product appearance andaroma before tasting the product.untreated controls (Tables 5 & 6).
In all cases, the phosphated product was rated higher than the
CONCLUSIONS
Consumer evaluations have demonstrated a distinct preference for phosphated shrimp andscallops. The addition of moisture and ability to hold water in cooked product can provide aconsumer benefit in terms of flavor and moist mouthfeel. There was no distinct objection tophosphated product appearance, aroma of aftertaste, and additional salt taste was desired. In bothcases, the consumers generally felt the phosphated shrimp and scallops meet their expectations andthey liked and judged the products to be of high quality and valued more than non-phosphatedproduct.
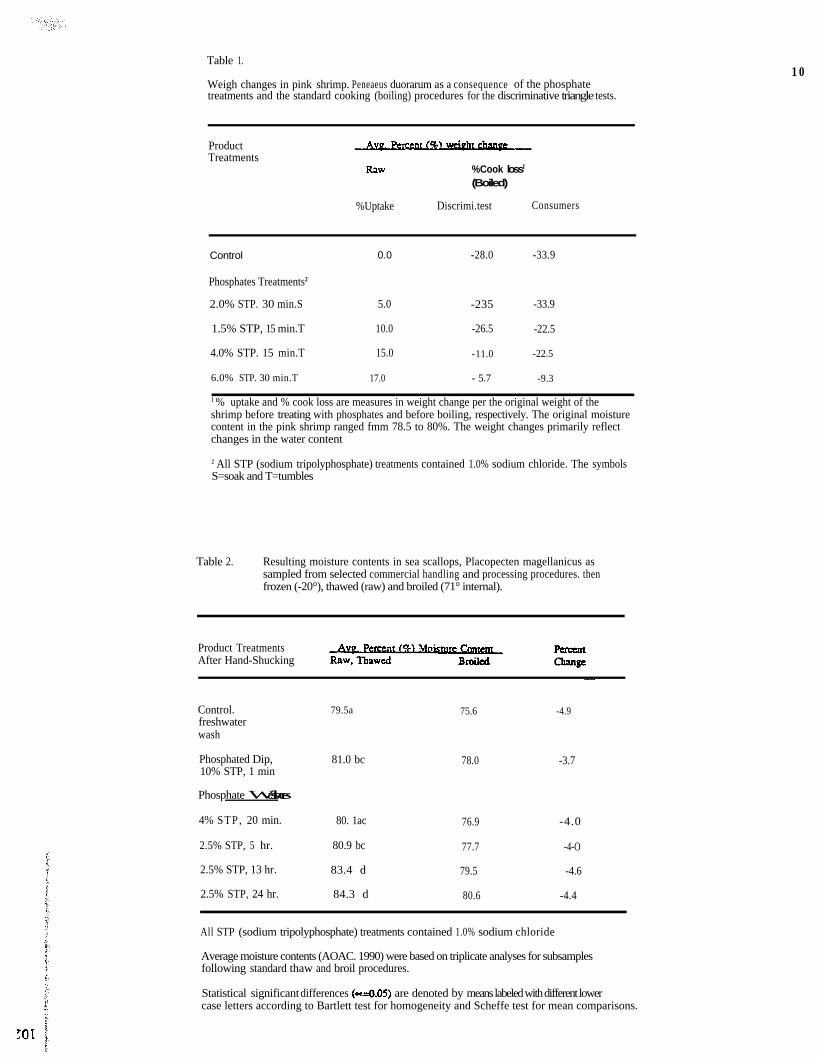
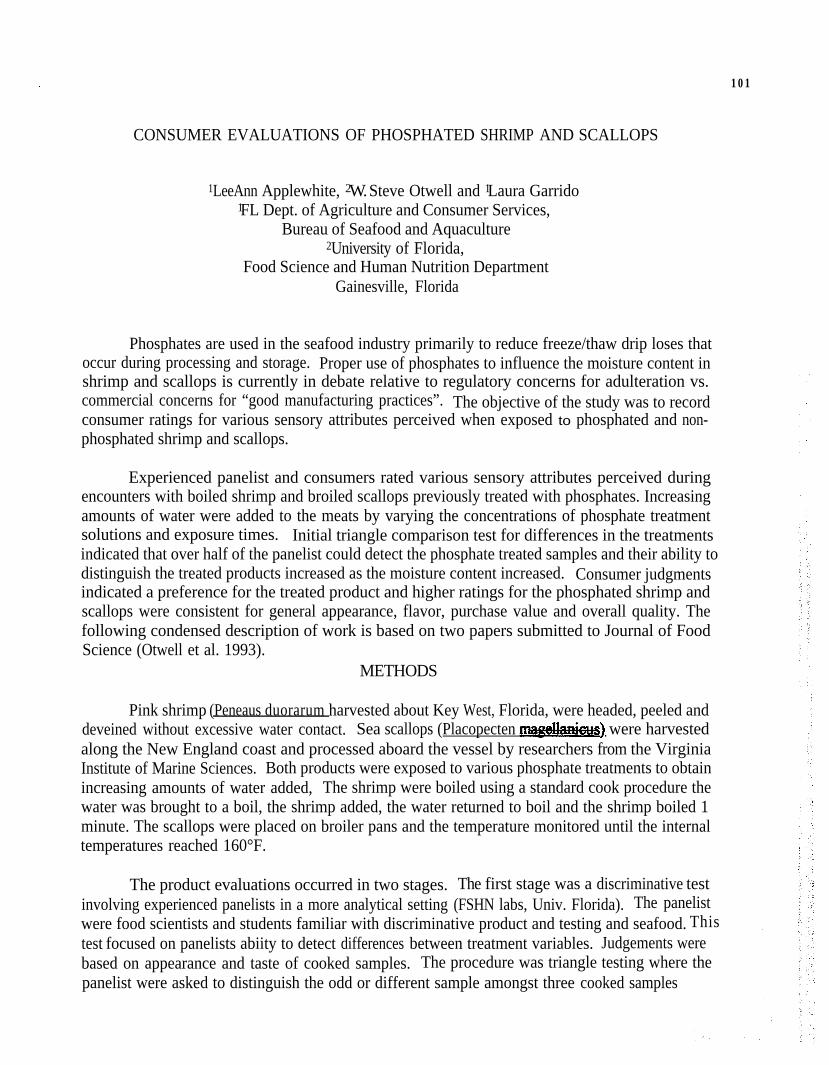
Table 1.
Weigh changes in pink shrimp. Peneaeus duorarum as a consequence of the phosphatetreatments and the standard cooking (boiling) procedures for the discriminative triangle tests.
10
ProductTreatments
%Cook loss1
(Boiled)
%Uptake Discrimi.test Consumers
Control 0.0 -28.0 -33.9
Phosphates Treatments2
2.0% STP. 30 min.S 5.0 -235 -33.9
1.5% STP, 15 min.T 10.0 -26.5 -22.5
4.0% STP. 15 min.T 15.0 -11.0 -22.5
6.0% STP. 30 min.T 17.0 - 5.7 -9.3
1 % uptake and % cook loss are measures in weight change per the original weight of theshrimp before treating with phosphates and before boiling, respectively. The original moisturecontent in the pink shrimp ranged fmm 78.5 to 80%. The weight changes primarily reflectchanges in the water content
2 All STP (sodium tripolyphosphate) treatments contained 1.0% sodium chloride. The symbolsS=soak and T=tumbles
Table 2. Resulting moisture contents in sea scallops, Placopecten magellanicus assampled from selected commercial handling and processing procedures. thenfrozen (-20°), thawed (raw) and broiled (71° internal).
Product TreatmentsAfter Hand-Shucking
Control.freshwaterwash
79.5a 75.6 -4.9
Phosphated Dip,10% STP, 1 min
81.0 bc 78.0 -3.7
Phosphate Washes
4% S T P , 20 min. 80. 1ac 76.9 -4.0
2.5% STP, 5 hr. 80.9 bc 77.7 -4-O
2.5% STP, 13 hr. 83.4 d 79.5 -4.6
2.5% STP, 24 hr. 84.3 d 80.6 -4.4
All STP (sodium tripolyphosphate) treatments contained 1.0% sodium chloride
Average moisture contents (AOAC. 1990) were based on triplicate analyses for subsamplesfollowing standard thaw and broil procedures.
Statistical significant differences (m&05) are denoted by means labeled with different lowercase letters according to Bartlett test for homogeneity and Scheffe test for mean comparisons.
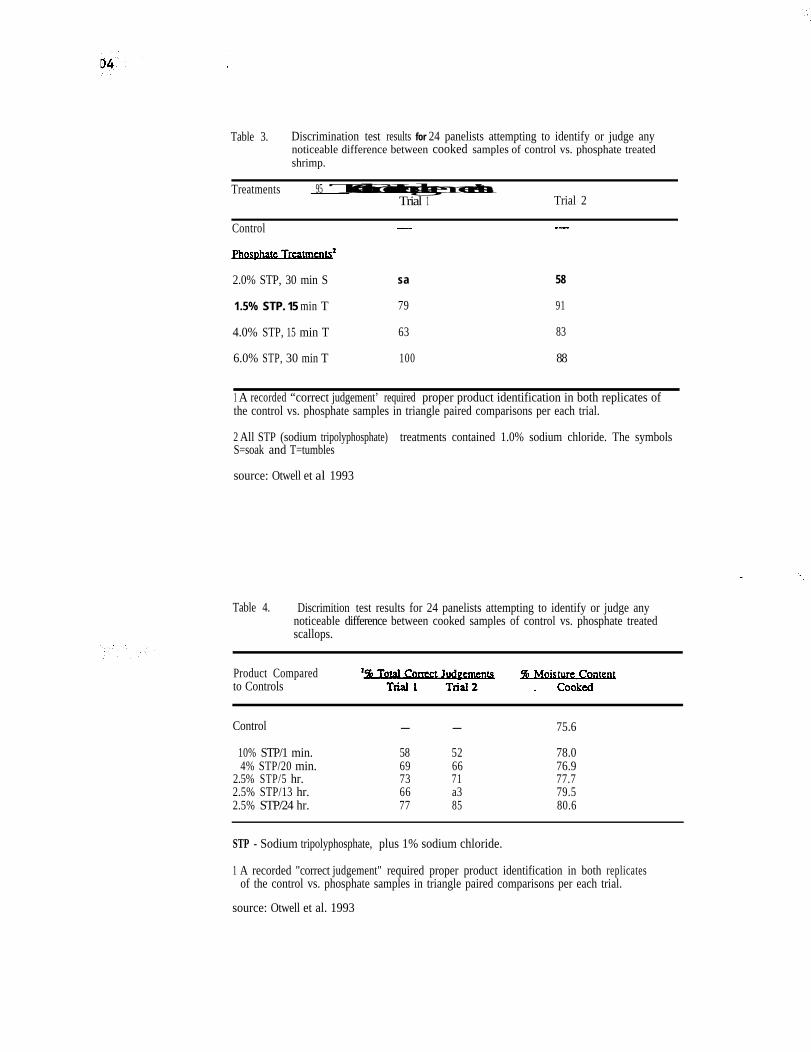
Table 3. Discrimination test results for 24 panelists attempting to identify or judge anynoticeable difference between cooked samples of control vs. phosphate treatedshrimp.
Treatments 95 Total Correct Judgements'Trial 1 Trial 2
Control --_ _--
2.0% STP, 30 min S
1.5% STP. 15 min T
sa
79
58
91
4.0% STP, 15 min T 63 83
6.0% STP, 30 min T 100 88
1 A recorded “correct judgement’ required proper product identification in both replicates ofthe control vs. phosphate samples in triangle paired comparisons per each trial.
2 All STP (sodium tripolyphosphate) treatments contained 1.0% sodium chloride. The symbolsS=soak and T=tumbles
source: Otwell et al 1993
Table 4. Discrimition test results for 24 panelists attempting to identify or judge anynoticeable difference between cooked samples of control vs. phosphate treatedscallops.
Product Comparedto Controls
Control - - 75.6
10% STP/1 min. 58 52 78.04% STP/20 min. 69 66 76.9
2.5% STP/5 hr. 73 71 77.72.5% STP/13 hr. 66 a3 79.52.5% STP/24 hr. 77 85 80.6
STP - Sodium tripolyphosphate, plus 1% sodium chloride.
1 A recorded "correct judgement" required proper product identification in both replicatesof the control vs. phosphate samples in triangle paired comparisons per each trial.
source: Otwell et al. 1993
106
REFERENCES
SAS, 1992. Statistical Analysis Systems, User’s Guide. SAS Institute, Inc. Corey, NC.
OTWELL, W.S., APPLEWHITE, L.D. AND GARRIDO, L.R 1993. Consumer Discrimination andAcceptance for Phosphated Shrimp. Submitted for publication to J Food Sci, 1993.
OTWELL, W.S., APPLEWHITE, L.D. AND GARRIDO, L.R 1993. Consumer Discrimination andAcceptance for Phosphated Scallops. Submitted for publication to J Food Sci, 1993.
107
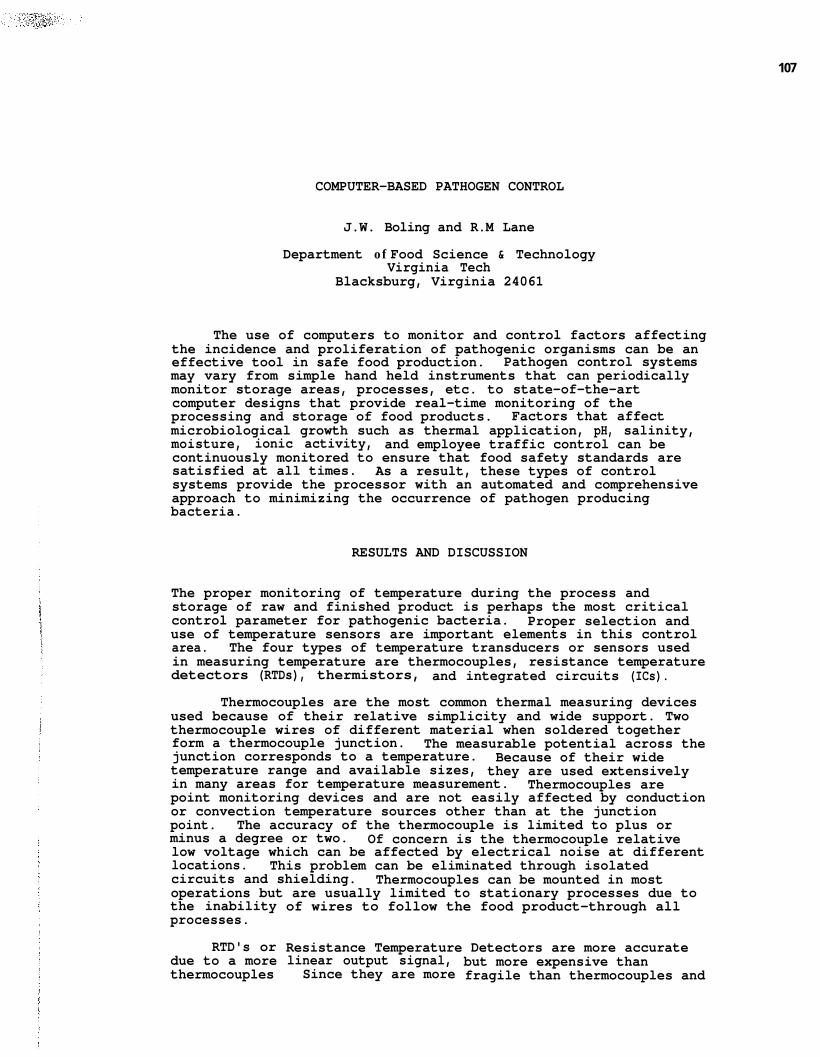
COMPUTER-BASED PATHOGEN CONTROL
J.W. Boling and R.M Lane
Department of Food Science & TechnologyVirginia Tech
Blacksburg, Virginia 24061
The use of computers to monitor and control factors affectingthe incidence and proliferation of pathogenic organisms can be aneffective tool in safe food production. Pathogen control systemsmay vary from simple hand held instruments that can periodicallymonitor storage areas, processes, etc. to state-of-the-artcomputer designs that provide real-time monitoring of theprocessing and storage of food products. Factors that affectmicrobiological growth such as thermal application, pH, salinity,moisture, ionic activity, and employee traffic control can becontinuously monitored to ensure that food safety standards aresatisfied at all times. As a result, these types of controlsystems provide the processor with an automated and comprehensiveapproach to minimizing the occurrence of pathogen producingbacteria.
RESULTS AND DISCUSSION
The proper monitoring of temperature during the process andstorage of raw and finished product is perhaps the most criticalcontrol parameter for pathogenic bacteria. Proper selection anduse of temperature sensors are important elements in this controlarea. The four types of temperature transducers or sensors usedin measuring temperature are thermocouples, resistance temperaturedetectors (RTDs), thermistors, and integrated circuits (ICs).
Thermocouples are the most common thermal measuring devicesused because of their relative simplicity and wide support. Twothermocouple wires of different material when soldered togetherform a thermocouple junction. The measurable potential across thejunction corresponds to a temperature. Because of their widetemperature range and available sizes, they are used extensivelyin many areas for temperature measurement. Thermocouples arepoint monitoring devices and are not easily affected by conductionor convection temperature sources other than at the junctionpoint. The accuracy of the thermocouple is limited to plus orminus a degree or two. Of concern is the thermocouple relativelow voltage which can be affected by electrical noise at differentlocations. This problem can be eliminated through isolatedcircuits and shielding. Thermocouples can be mounted in mostoperations but are usually limited to stationary processes due tothe inabilityprocesses.
RTD's ordue to a morethermocouples
Resistance Temperature Detectors are more accuratebut more expensive thanlinear output signal,
Since they are more fragile than thermocouples and
of wires to follow the food product-through all
108
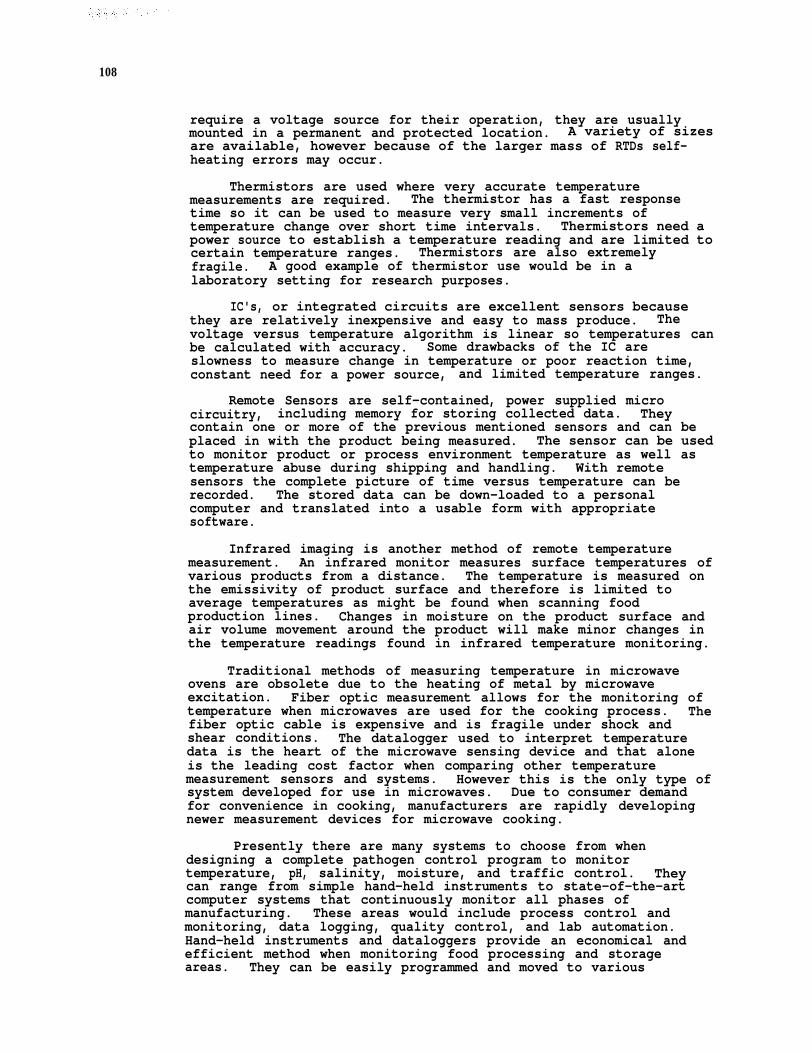
require a voltage source for their operation, they are usuallymounted in a permanent and protected location. A variety of sizesare available, however because of the larger mass of RTDs self-heating errors may occur.
Thermistors are used where very accurate temperaturemeasurements are required. The thermistor has a fast responsetime so it can be used to measure very small increments oftemperature change over short time intervals. Thermistors need apower source to establish a temperature reading and are limited tocertain temperature ranges. Thermistors are also extremelyfragile. A good example of thermistor use would be in alaboratory setting for research purposes.
IC's, or integrated circuits are excellent sensors becausethey are relatively inexpensive and easy to mass produce. Thevoltage versus temperature algorithm is linear so temperatures canbe calculated with accuracy. Some drawbacks of the IC areslowness to measure change in temperature or poor reaction time,constant need for a power source, and limited temperature ranges.
Remote Sensors are self-contained, power supplied microcircuitry, including memory for storing collected data. Theycontain one or more of the previous mentioned sensors and can beplaced in with the product being measured. The sensor can be usedto monitor product or process environment temperature as well astemperature abuse during shipping and handling. With remotesensors the complete picture of time versus temperature can berecorded. The stored data can be down-loaded to a personalcomputer and translated into a usable form with appropriatesoftware.
Infrared imaging is another method of remote temperaturemeasurement. An infrared monitor measures surface temperatures ofvarious products from a distance. The temperature is measured onthe emissivity of product surface and therefore is limited toaverage temperatures as might be found when scanning foodproduction lines. Changes in moisture on the product surface andair volume movement around the product will make minor changes inthe temperature readings found in infrared temperature monitoring.
Traditional methods of measuring temperature in microwaveovens are obsolete due to the heating of metal by microwaveexcitation. Fiber optic measurement allows for the monitoring oftemperature when microwaves are used for the cooking process. Thefiber optic cable is expensive and is fragile under shock andshear conditions. The datalogger used to interpret temperaturedata is the heart of the microwave sensing device and that aloneis the leading cost factor when comparing other temperaturemeasurement sensors and systems. However this is the only type ofsystem developed for use in microwaves. Due to consumer demandfor convenience in cooking, manufacturers are rapidly developingnewer measurement devices for microwave cooking.
Presently there are many systems to choose from whendesigning a complete pathogen control program to monitortemperature, pH, salinity, moisture, and traffic control. Theycan range from simple hand-held instruments to state-of-the-artcomputer systems that continuously monitor all phases ofmanufacturing. These areas would include process control andmonitoring, data logging, quality control, and lab automation.Hand-held instruments and dataloggers provide an economical andefficient method when monitoring food processing and storageareas. They can be easily programmed and moved to various
109
locations to monitor potential problem areas. Due to thepopularity and versatility of personal computers, they haveevolved into a cost effective and powerful solution for dataacquisition and control on the plant floor. In addition, theevolution of control software has made it easy for the averageuser to integrate measurement and control instrumentation into asystem Under current technology the user has a choice of fourinstrument interfacing techniques. They are IEEE 488, also knownas the GPIB or HB-lB, data acquisition plug-in boards, RS-232 orserial interface, and the VXI bus. The GPIB bus is available formany sophisticated analytical instruments such as chromatographsand other multiple signal devices. It provides high-speed datatransfer (1 Mbytes/sec) and can be used with a variety of computerplatforms such as IBM, Apple, and Sun. Plug-in data acquisitionboards are rapidly becoming the method of choice due to the lowcost and variety of functions. Transducers installed throughoutthe processing area are connected to the board through signalconditioners. Data collected can be analyzed and displayed astext or graphics, providing the user with a real-time informationwindow of plant floor operations. The RS-232 interface can befound on most simple measurement instruments such as balances andpH meters. It usually is standard on most computer systems and iswidely supported by most software programs. VXI was firstintroduced in 1987 and is regarded as a high performance andrugged interface for industry applications. It combines highspeed with a modular design that provides for easy control ofadvanced measurement systems. All of the above interfaces may becombined on a single system in order to take advantage ofinstrumentation that will satisfy your cost and performancespecifications.
Through the proper selection of sensors and controllers, anautomated and comprehensive computer system can be implemented inorder to monitor and control those factors that affect theincidence and proliferation of pathogenic organisms in foodprocessing operations.
REFERENCES
1. Omega, 1993. The Temperature Handbook. Omega Engineering,Inc., Stamford, CT.
2. National Instruments, 1994. IEEE 488 and Control, DataAcquisition, and Analysis. National Instruments,Austin, TX.
3. YSI, 1993. Temperature Sensors & Probes.Springs, OH.
YSI, Inc., Yellow
110
RAPID TEST KITS FOR DETECTION OF LISTERIA MONOCYTOGENES : A REVIEW
V.M. Garrido and W.S. Otwell.Food Science and Human Nutrition Department
University of FloridaGainesville, FL 326 11
Listeria monocytogenes is a pathogenic microorganism which can cause serious infections tohumans, some of which can be fatal. Estimates suggest that in the United States L.monocytogenes is the cause of approximately 1850 cases of serious illness annually, with a fatalityrate of 25 % (Pinner, et. al., 1992). This pathogen usually affects consumers with a weak immunesystem, including children, pregnant women, elderly and immunocompromised individuals,causing spontaneous abortion and death (Farber, et. al., 1991). Due to the severity of these cases,U . S. Food and Drug Administration has established a ‘zero tolerance’ for L. monocytogenes in allcooked ready-to-eat food product. Any product found to be contaminated has to be recalled anddestroyed. Several million dollars in product loss has resulted due to destruction of contaminatedfood products.
Ready-to-eat seafoods (i.e., smoked fish, crab meat, cooked shrimp, lobster meat) have shown asignificant degree of contamination incidents, according to State and FDA routine plantinspections. Ideally, before these products are released into commerce they should be tested ormonitored for L. monocytogenes contamination. Currently the official analytical methodologytakes 7 to 14 days to confirm the presence or absence of L. monocytogenes. This period makesit impossible for routine monitoring when working with highly perishable goods. Seafoodproduct, with a shelf-life of less than 14 days on the average, can not be held awaiting prolongedanalytical results. Faster methodologies are needed to better address this concern. Rapid test kitsfor the detection of Listeria have been developed which offer the industry reliable results in ashorter period of time, 1 to 3 days. Some of these methods do not require extensive training.
There are several test kits commercially available for the detection of L. monocytogenes onseafoods. Four of the most popular tests are: VIDAS ImmunoDiagnostic Assay System (bioMerieuxVitex, Inc.), GENE-TRAK Listeria DNA Hybridization Test (GENE-TRAK), LISTERIA-TEKELISA Test System (ORGANON TEKNIKA) and LISTERTEST Immuno-beads Test (VICAM).A comparison of these methodologies is provided to help direct judgements for use. Subsequent trialswill be necessary to verify their use in respective commercial settings.
GENE-TRAK Listeria monocytogenes is the only test specific for L. monocytogenes and is basedon a DNA hybridization test followed by a calorimetric detection. The procedure requires sampleenrichment and an overall average testing time of 2 l/2 days. Samples are mixed with modifiedUniversity of Vermont Medium (mUVM-2) for 24 hrs and then spread onto modified Lithiumchloride - ceftazidime agar (mLCA) and incubated for another 24 hrs (Appendix 1 A). With an sterileswab, growth from mLCA is suspend in 1 mL of Phosphate Buffered Saline (PBS). The suspensionis then heated, lysed and washed. The actual GENE-TRAK assay is preformed on a 5 ml aliquot of
,,
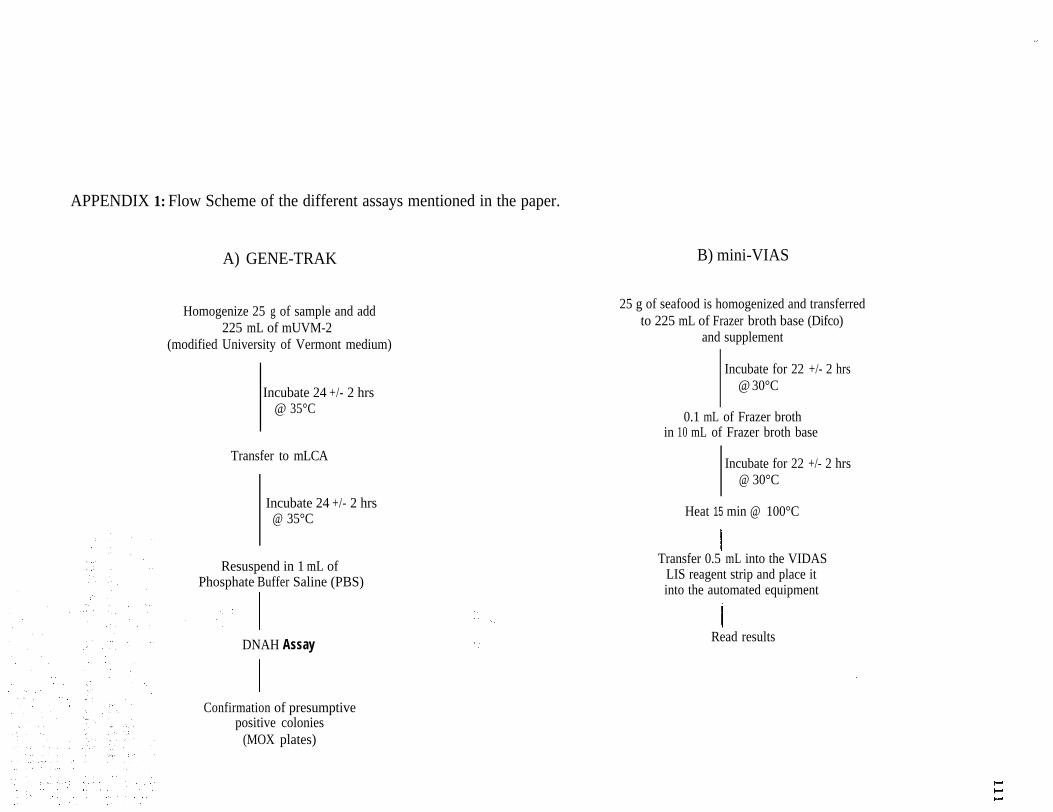
APPENDIX 1: Flow Scheme of the different assays mentioned in the paper.
A) GENE-TRAK
Homogenize 25 g of sample and add225 mL of mUVM-2
(modified University of Vermont medium)
Incubate 24 +/- 2 hrs@ 35°C
Transfer to mLCA
Incubate 24 +/- 2 hrs@ 35°C
Resuspend in 1 mL ofPhosphate Buffer Saline (PBS)
I
DNAH Assay
IConfirmation of presumptive
positive colonies(MOX plates)
B) mini-VIAS
25 g of seafood is homogenized and transferredto 225 mL of Frazer broth base (Difco)
and supplement
Incubate for 22 +/- 2 hrs@ 30°C
0.1 mL of Frazer brothin 10 mL of Frazer broth base
Incubate for 22 +/- 2 hrs@ 30°C
Heat 15 min @ 100°C
Transfer 0.5 mL into the VIDASLIS reagent strip and place itinto the automated equipment
Read results
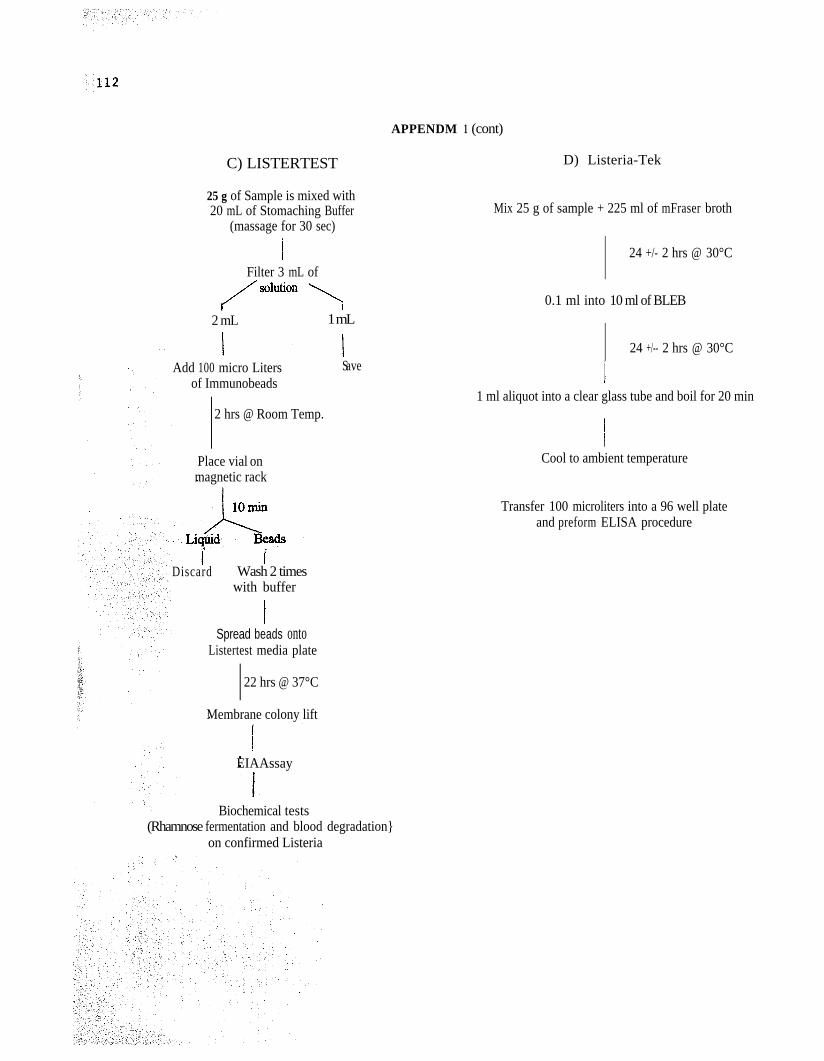
C) LISTERTEST
25 g of Sample is mixed with20 mL of Stomaching Buffer
(massage for 30 sec)
Filter 3 mL of
/*lution \2 mL 1 mL
Add 100 micro Litersof Immunobeads
Save
2 hrs @ Room Temp.
Place vial onmagnetic rack
I IDiscard Wash 2 times
with buffer
ISpread beads onto
Listertest media plate
22 hrs @ 37°C
Membrane colony lift
EIAAssay
Biochemical tests(Rhamnose fermentation and blood degradation}
on confirmed Listeria
APPENDM 1 (cont)
D) Listeria-Tek
Mix 25 g of sample + 225 ml of mFraser broth
24 +/- 2 hrs @ 30°C
0.1 ml into 10 ml of BLEB
24 +/-- 2 hrs @ 30°C
1 ml aliquot into a clear glass tube and boil for 20 min
Cool to ambient temperature
Transfer 100 microliters into a 96 well plateand preform ELISA procedure
113
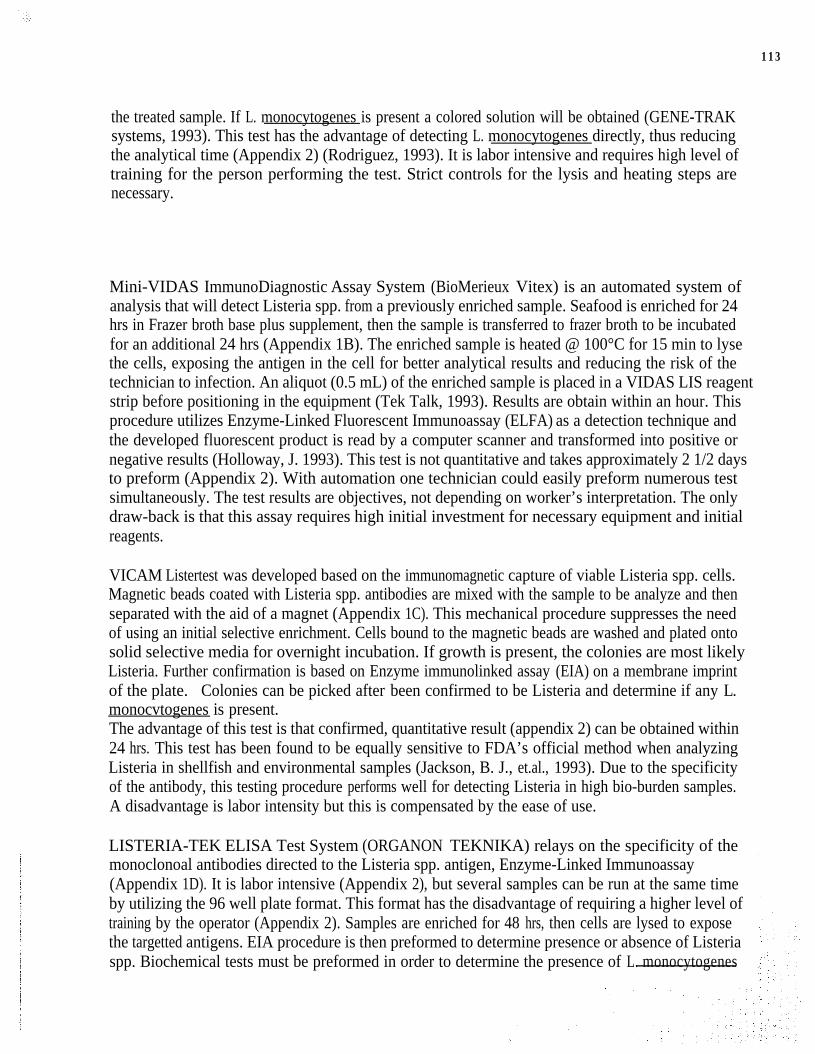
the treated sample. If L. monocytogenes is present a colored solution will be obtained (GENE-TRAKsystems, 1993). This test has the advantage of detecting L. monocytogenes directly, thus reducingthe analytical time (Appendix 2) (Rodriguez, 1993). It is labor intensive and requires high level oftraining for the person performing the test. Strict controls for the lysis and heating steps arenecessary.
Mini-VIDAS ImmunoDiagnostic Assay System (BioMerieux Vitex) is an automated system ofanalysis that will detect Listeria spp. from a previously enriched sample. Seafood is enriched for 24hrs in Frazer broth base plus supplement, then the sample is transferred to frazer broth to be incubatedfor an additional 24 hrs (Appendix 1B). The enriched sample is heated @ 100°C for 15 min to lysethe cells, exposing the antigen in the cell for better analytical results and reducing the risk of thetechnician to infection. An aliquot (0.5 mL) of the enriched sample is placed in a VIDAS LIS reagentstrip before positioning in the equipment (Tek Talk, 1993). Results are obtain within an hour. Thisprocedure utilizes Enzyme-Linked Fluorescent Immunoassay (ELFA) as a detection technique andthe developed fluorescent product is read by a computer scanner and transformed into positive ornegative results (Holloway, J. 1993). This test is not quantitative and takes approximately 2 1/2 daysto preform (Appendix 2). With automation one technician could easily preform numerous testsimultaneously. The test results are objectives, not depending on worker’s interpretation. The onlydraw-back is that this assay requires high initial investment for necessary equipment and initialreagents.
VICAM Listertest was developed based on the immunomagnetic capture of viable Listeria spp. cells.Magnetic beads coated with Listeria spp. antibodies are mixed with the sample to be analyze and thenseparated with the aid of a magnet (Appendix 1C). This mechanical procedure suppresses the needof using an initial selective enrichment. Cells bound to the magnetic beads are washed and plated ontosolid selective media for overnight incubation. If growth is present, the colonies are most likelyListeria. Further confirmation is based on Enzyme immunolinked assay (EIA) on a membrane imprintof the plate. Colonies can be picked after been confirmed to be Listeria and determine if any L.monocvtogenes is present.The advantage of this test is that confirmed, quantitative result (appendix 2) can be obtained within24 hrs. This test has been found to be equally sensitive to FDA’s official method when analyzingListeria in shellfish and environmental samples (Jackson, B. J., et.al., 1993). Due to the specificityof the antibody, this testing procedure performs well for detecting Listeria in high bio-burden samples.A disadvantage is labor intensity but this is compensated by the ease of use.
LISTERIA-TEK ELISA Test System (ORGANON TEKNIKA) relays on the specificity of themonoclonoal antibodies directed to the Listeria spp. antigen, Enzyme-Linked Immunoassay(Appendix 1D). It is labor intensive (Appendix 2), but several samples can be run at the same timeby utilizing the 96 well plate format. This format has the disadvantage of requiring a higher level oftraining by the operator (Appendix 2). Samples are enriched for 48 hrs, then cells are lysed to exposethe targetted antigens. EIA procedure is then preformed to determine presence or absence of Listeriaspp. Biochemical tests must be preformed in order to determine the presence of L. monocytogenes

114
Appendix 2: Advantages and disadvantages of rapid test kit assays compared
A.- GENE-TRAK
Advantages
-Sensitivity is 1 x 10⁵ cfu/ml - non AOAC Approved- Assay will work on high bio-burden - Needs close control on incubation temperatures and- High specificity procedure- Results ready in 3 hrs after enrichment- Low false positive rate
- Positive results will need 48 hrs tobe confirmed.
B.- LISTERIA-TEK
Advantages
- USDA Accepted- Very specific (EIA procedure)- False positive rate (5.9%)
Advantages
* Specific (EIA procedure)- USDA accepted- Low false positive (1. 5 % )
Disadvantages
Disadvantage
- High level of training is required- Easy cross-contamination during assay- False negative rate of 8.7%
Disadvantages
- High initial investment- Not AOAC approved
- Easy to use- Low level of involvement
D.- LISTERTEST
Advantages
- Specific (EIA procedure)- Results can be obtained within 24 hrs- Quantitative analysis- Low false positive
Disadvantages
- High level of involvement- Not AOAC approved- Recovery rate of 30 - 85 % depending on the sample
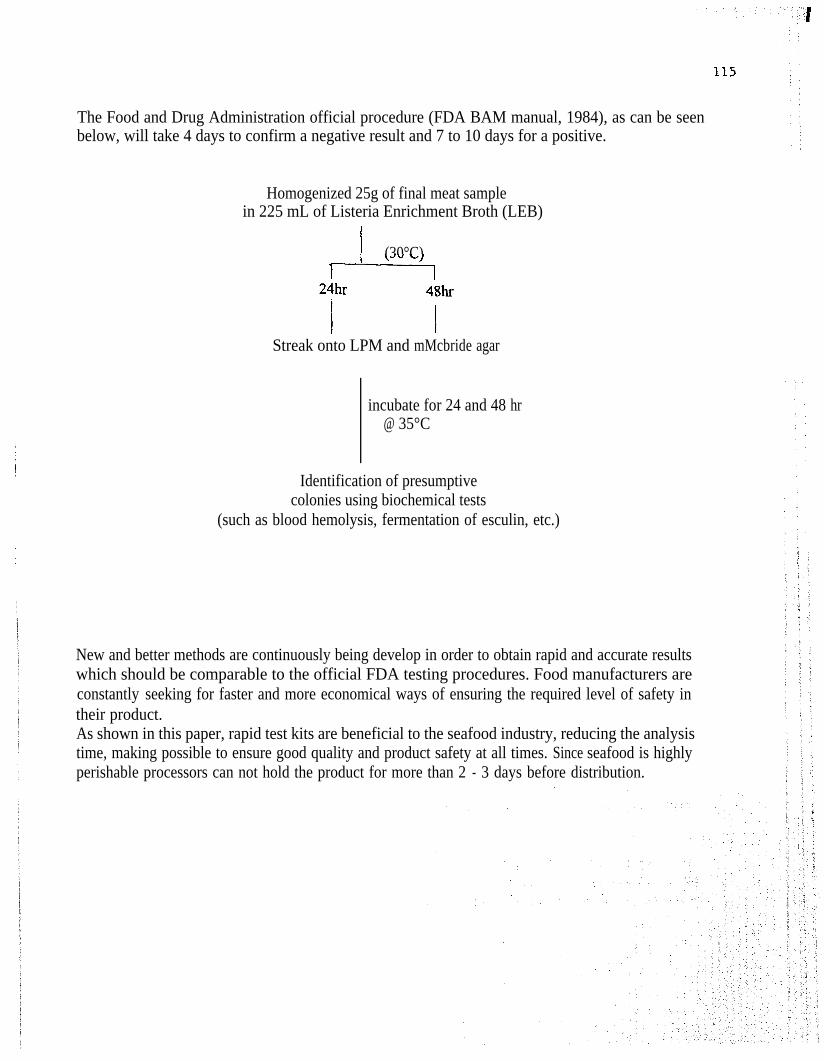
The Food and Drug Administration official procedure (FDA BAM manual, 1984), as can be seenbelow, will take 4 days to confirm a negative result and 7 to 10 days for a positive.
Homogenized 25g of final meat samplein 225 mL of Listeria Enrichment Broth (LEB)
I (30°C)T----l
Streak onto LPM and mMcbride agar
incubate for 24 and 48 hr@ 35°C
Identification of presumptivecolonies using biochemical tests
(such as blood hemolysis, fermentation of esculin, etc.)
New and better methods are continuously being develop in order to obtain rapid and accurate resultswhich should be comparable to the official FDA testing procedures. Food manufacturers areconstantly seeking for faster and more economical ways of ensuring the required level of safety intheir product.As shown in this paper, rapid test kits are beneficial to the seafood industry, reducing the analysistime, making possible to ensure good quality and product safety at all times. Since seafood is highlyperishable processors can not hold the product for more than 2 - 3 days before distribution.
REFERENCE
FARBER, J.M. AND PETERKIN, P.I. 1991. Listeria monocytogenes, a Food-Borne Pathogen.Microbiological Reviews, September 1991, p. 476 - 511.
GENE-TRAK Systems, February 1993. Gene-Trak Listeria monocytogenes Assay, DNAHybridization Test for detection of Listeria monocytogenes. Promotional literature (No. 8010-01).
HOLLOWAY, J., July 1993. Personal communication, technical support bioMerieux Vitek, Inc.
JACKSON, B. J., ET. AL. 1993. Detection of Listeria in Food and Environmental Samples byImmunomagnetic Bead Capture and by Cultural Methods. J. of Rapids methods and Automation inMicrobiology, September 1993, p.39 - 54.
ORGANON TECHNIKA, 1993. Promotional literature and personal communication with technicalsupport personnel.
PINNER R W., MD, ET. AL. 1992. Role of Foods in Sporadic Listeriosis, II. Microbiologic andEpidemiologic Investigation. Journal of the American Medical Association, April 15, 1992 - Vo1 267,No. 15, p. 2046 -2050.
RODRIGUEZ, D., June 1993. Personal communication, Regional sales representative, GENE-TRAKsystems.
TEK TALK, Meat and Poultry Update, January 1993. Promotional literature bioMerieux Vitek, Inc.
U. S. FOOD AND DRUG ADMINISTRATION 1984. Bacteriological Analytical Manual, 6thedition, Chapter 29 as revised 1988 and 1990. Association of Official Analytical Chemists, Arlington,Virginia. p.29.01 - 29.14.

117
LISTERIA IN SHELLFISH PLANT ENVIRONMENTS:PREVALENCE AND CONTROL IN VIRGINIA
A.A. Diallo1, D.R. Pate12, George R. Flick3,R. F. Wittman4, K. Skyles4, R.E. Croonenberghs4
1 Norfolk Dept of Public Health, Norfolk VA 235072Division of Consolidated Laboratory Services
Richmond, VA 232193Department of Food Science & Technology
VPI/VSU Blacksburg VA 240614Division of Shellfish Sanitation, Virginia Dept of Health
Richmond, VA 23219
Listeria monocytogenes is a pathogen of concern to the crab meat industry. Its pesistentpresence in plant environments may lead to contamination of finished product thereby becoming apotential health risk. This is particularly significant since crab meat is one the many products ofVirginia's shellfish industry. A preliminary investigation was carried out to determine the presence ofListeria monocytogenes in six crab meat plants from 1989 to 1991. Results obtained with 3057 swabsof differents areas showed a 5.1% overall frequency of Listeria monocytogenes in the plants.Incidence during plant operations and after plant cleaning and sanitizing were 6.56% and 4.34%respectively.
A follow up monitoring of 10 plants looking at finished product contact surfaces and non foodcontact surfaces was conducted during the 1990-91, 1991-92 and 1992-1993 crabbing seasons.Results of 1847 swabs showed overall listeria incidence of 4.0%, 8.5% and 9.0% respectively.
The results obtained from season to season in different plants indicate that control is afunction of how keen and persistent particicular operators are in setting up a HACCP program in theirrespective plants. It did not matter that the plant was a small operation or that it is a large operation.The floor, the scrap cans, crab carts, foot stools were the most likely places to recover Listeriamonocytogenes.
Listeria monocytogenes is a gram positive, catalase postive short bacillus found in theenvironment which earned renewed interest as a public health concern after the Jalisco cheeseoutbreak in 1985. Since then epidemiologic investigations have shown that Listeria is indeed afoodborne pathogen (2, 5, 6, 10, 11, 12).
118
Listeriosis in humans occurs more often in immunocompromized individuals, in pregnancycausing stillbirths, and a neonatal listeriosis which is often confused with group B streptococcalinfection. It is characterized by a central nervous system (CNS) infection with a primary bacteremiaand can include endocarditis (4, 5). All 13 serovars of L. monocvtogenes can cause listeriosis.However most reported cases are caused by serovars 1/2a, 1/2b, and 4b (3).
In animals it causes abortions, meningoencephalitis and in addition it can be carried in thegastrointestinal tract of animals as well as humans. Listeria monocvtonenes has been isolated inalmost all livestock species including cattle goats birds and other species (7, 8, 9, 14). In humans L.monocytogenes has been shown to be carried by healthy individuals in the gastrointestinal tract andit is also carried in urogenital tract of healthy females.
Listeria species have also been isolated from the environment and from foods withoutnecessarily a direct relation to human disease. Large scale investigations carried out by differentcenters have demonstrated that listeriosis is a foodborne disease with the suggestion that an infectingdose and the presence of underlying conditions such as extreme age, pregnancy,immunocompromized status, and other infections could be factors in developing listeriosis (18).
Incidence and growth of L. monocytogenes in seafood has been investigated by Lovett etal.( 17) who found the organism surviving and capable of five log growth in fish, shrimp, lobster andcold smoked salmond. Weagant et al (22) found L. monocvtogenes in 15 of 57 samples of frozenseafood which included shrimp, crabmeat, lobster tail, fish and surimi based seafood.
The presence of L. monocytogenes in picked crabmeat thus presents a public health hazardfor infants, persons with compromized immune systems, and others with underlying diseases. Becauseof this FDA has adopted a zero tolerance level for all processed ready to eat seafood items.
In light of the importance of the seafood industry to Virginia’s economy and the lack of strictcritical controls points win most establishments we investigated the presence of listeria in crabmeatplant environments.
This object of this investigation was: (i) to determine the incidence and foci of L.monocytogenes in crabmeat plant environments, (ii) to determine the colonization process of listeriaduring the crabbing season and to study the movement of listeria in the crab plants during operations;(iii) to evaluate standard cleaning procedures and develop a manual for cleaning crab plants.MATERIALS AND METHODSThe survey protocol was as follows:
In Phase I of the study, six of the sixty plants operating during the crabbing season wereselected. The owners and operators of the plants were consulted and participation was voluntary. Itwas estimated that isolation rates obtained from these plants would then serve as indicators of mostlikely contaminated areas of the plants. any plants showing contamination with L; monocytogenesduring this preliminary phase would be notified and a regiment of cleaning and sanitizing andadherence to Health Department guidelines would be instituted. The two plants serving as controlswere also going to be notified by the third swabbing of any potential listeria contamination.
119
Swabbing was carried out after the plant had finished a day’s operation and cleaned andsanitized. This set of swabs was labelled “Post Op”. The process was repeated again the next dayearly morning before the plant resumed its operation. Swabs were labelled “Pre Op”. Finallyenvironmental swabbing of designated sites continued during the day at regular intervals. Swabs werelabelled “During”.
When a cleaning protocole was instituted, swabbing was performed after proper cleaning andsanitization. If L. monocytogenes persisted the process was repeated.
Table A. Plant Areas Selected For Swabbing
A. Receiving Dock E. Picking Room floor &Contact surfaces
B. Retort Storage F. Scrap Cans, Chutes etc...
C. Cooling Room G. Packing Room
D. Picking Room H. Sinks, Dips etc...tables, pans, aprons I. Picking Room Scrap
In the follow up study, Phase II, ten plants were identified. Selection was again on the basisof size, locality and operating procedures. Except for two plants which were selected as control plantsduring the preliminary study and which continued to serve as controls.
Swabs were taken of food contact surfaces and of non food contact surfaces as outlined intable (A) above. These were kept in 2ml WM (BBL) and transported to the laboratory where theywere then transferred to 18mL UVM broth and incubated 18 to 24 hours at 30°C. After incubationthe enrichment was plated on LPM agar (BBL) and modified oxford agar(MOM) (Oxoid). Plateswere then incubated at 37°C for 48 hours and obrserved for growth of typical bluish colonies ofListeria on LPM with the oblique light. MOM plates yielded black creamy to grayish colonies witha black halo. Colonies picked were then identified using conventional biochemical and Listeria ID kits(Organon Teknica).
Laboratory results were reported to the Division of Shellfish Sanitation which then workedwith the plant operator on cleaning procedures and steps to take in order to reduce the risk ofcontaminating freshly picked crabmeat and thus risk a recall action.
1 2 0
RESULTS
Results of the study are summarized in tables 1 through 7.
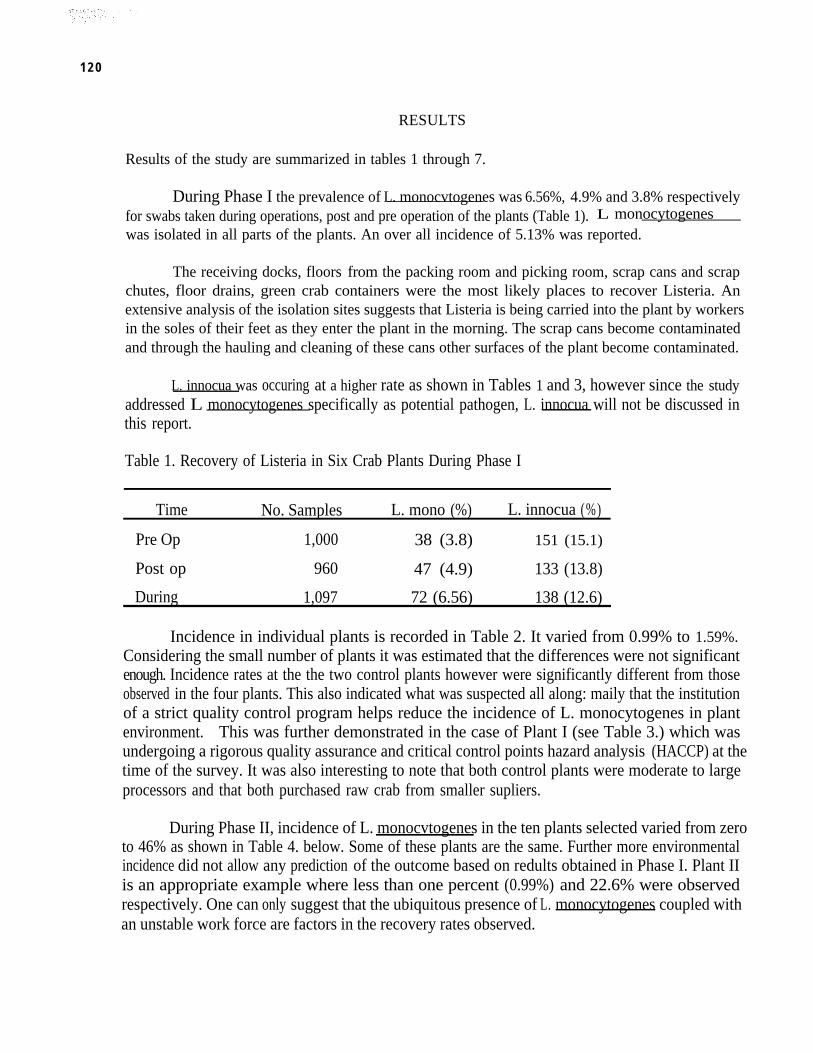
During Phase I the prevalence of L. monocvtogenes was 6.56%, 4.9% and 3.8% respectivelyfor swabs taken during operations, post and pre operation of the plants (Table 1). L monocytogeneswas isolated in all parts of the plants. An over all incidence of 5.13% was reported.
The receiving docks, floors from the packing room and picking room, scrap cans and scrapchutes, floor drains, green crab containers were the most likely places to recover Listeria. Anextensive analysis of the isolation sites suggests that Listeria is being carried into the plant by workersin the soles of their feet as they enter the plant in the morning. The scrap cans become contaminatedand through the hauling and cleaning of these cans other surfaces of the plant become contaminated.
L. innocua was occuring at a higher rate as shown in Tables 1 and 3, however since the studyaddressed L monocytogenes specifically as potential pathogen, L. innocua will not be discussed inthis report.
Table 1. Recovery of Listeria in Six Crab Plants During Phase I
Time No. Samples L. mono (%) L. innocua (%)
Pre Op 1,000 38 (3.8) 151 (15.1)
Post op 960 47 (4.9) 133 (13.8)
During 1,097 72 (6.56) 138 (12.6)
Incidence in individual plants is recorded in Table 2. It varied from 0.99% to 1.59%.Considering the small number of plants it was estimated that the differences were not significantenough. Incidence rates at the the two control plants however were significantly different from thoseobserved in the four plants. This also indicated what was suspected all along: maily that the institutionof a strict quality control program helps reduce the incidence of L. monocytogenes in plantenvironment. This was further demonstrated in the case of Plant I (see Table 3.) which wasundergoing a rigorous quality assurance and critical control points hazard analysis (HACCP) at thetime of the survey. It was also interesting to note that both control plants were moderate to largeprocessors and that both purchased raw crab from smaller supliers.
During Phase II, incidence of L. monocvtogenes in the ten plants selected varied from zeroto 46% as shown in Table 4. below. Some of these plants are the same. Further more environmentalincidence did not allow any prediction of the outcome based on redults obtained in Phase I. Plant IIis an appropriate example where less than one percent (0.99%) and 22.6% were observedrespectively. One can only suggest that the ubiquitous presence of L. monocytogenes coupled withan unstable work force are factors in the recovery rates observed.
121
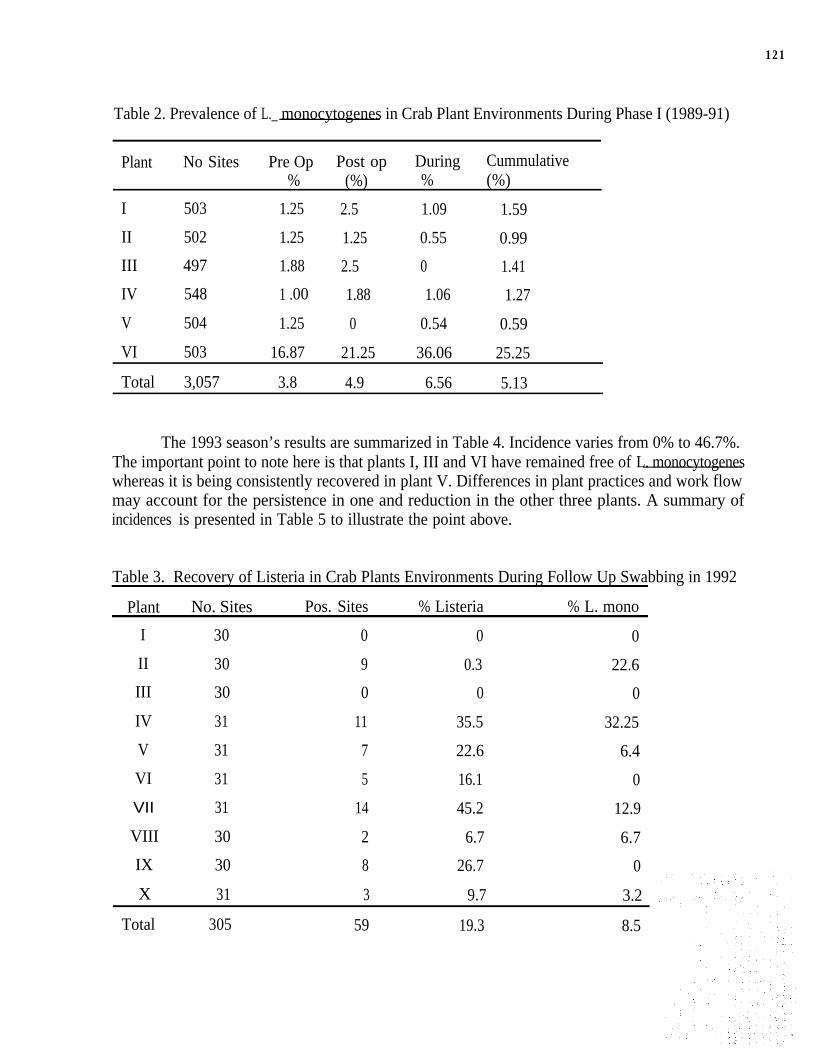
Table 2. Prevalence of L._ monocytogenes in Crab Plant Environments During Phase I (1989-91)
Plant No Sites
I 503
II 502
Pre Op Post op During Cummulative% (%) % (%)
1.25 2.5 1.09 1.59
1.25 1.25 0.55 0.99
III 497 1.88 2.5 0 1.41
IV 548 1 .00 1.88 1.06 1.27
V 504 1.25 0 0.54 0.59
VI 503 16.87 21.25 36.06 25.25
Total 3,057 3.8 4.9 6.56 5.13
The 1993 season’s results are summarized in Table 4. Incidence varies from 0% to 46.7%.The important point to note here is that plants I, III and VI have remained free of L. monocytogeneswhereas it is being consistently recovered in plant V. Differences in plant practices and work flowmay account for the persistence in one and reduction in the other three plants. A summary ofincidences is presented in Table 5 to illustrate the point above.
Table 3. Recovery of Listeria in Crab Plants Environments During Follow Up Swabbing in 1992
Plant No. Sites Pos. Sites % Listeria % L. mono
I 30 0 0 0
II 30 9 0.3 22.6
III 30 0 0 0
IV 31 11 35.5 32.25
V 31 7 22.6 6.4
VI 31 5 16.1 0
VII 31 14 45.2 12.9
VIII 30 2 6.7 6.7
IX 30 8 26.7 0
X 31 3 9.7 3.2
Total 305 59 19.3 8.5
122
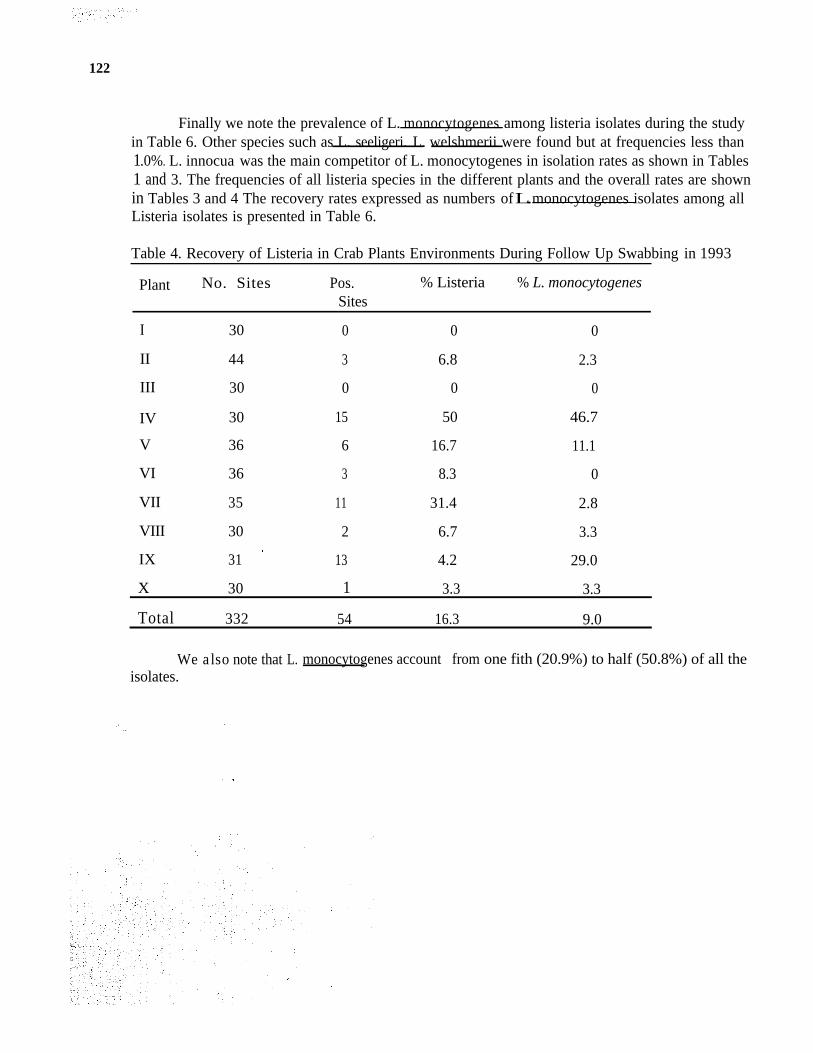
Finally we note the prevalence of L. monocytogenes among listeria isolates during the studyin Table 6. Other species such as L. seeligeri. L. welshmerii were found but at frequencies less than1 .0%. L. innocua was the main competitor of L. monocytogenes in isolation rates as shown in Tables1 and 3. The frequencies of all listeria species in the different plants and the overall rates are shownin Tables 3 and 4 The recovery rates expressed as numbers of L. monocytogenes isolates among allListeria isolates is presented in Table 6.
Table 4. Recovery of Listeria in Crab Plants Environments During Follow Up Swabbing in 1993
Plant No. Sites Pos. % Listeria % L. monocytogenesSites
I 30 0 0 0
II 44 3 6.8 2.3
III 30 0 0 0
IV 30 15 50 46.7
V 36 6 16.7 11.1
VI 36 3 8.3 0
VII 35 11 31.4 2.8
VIII 30 2 6.7 3.3
*IX 31 13 4.2 29.0
X 30 1 3.3 3.3
Total 332 54 16.3 9.0
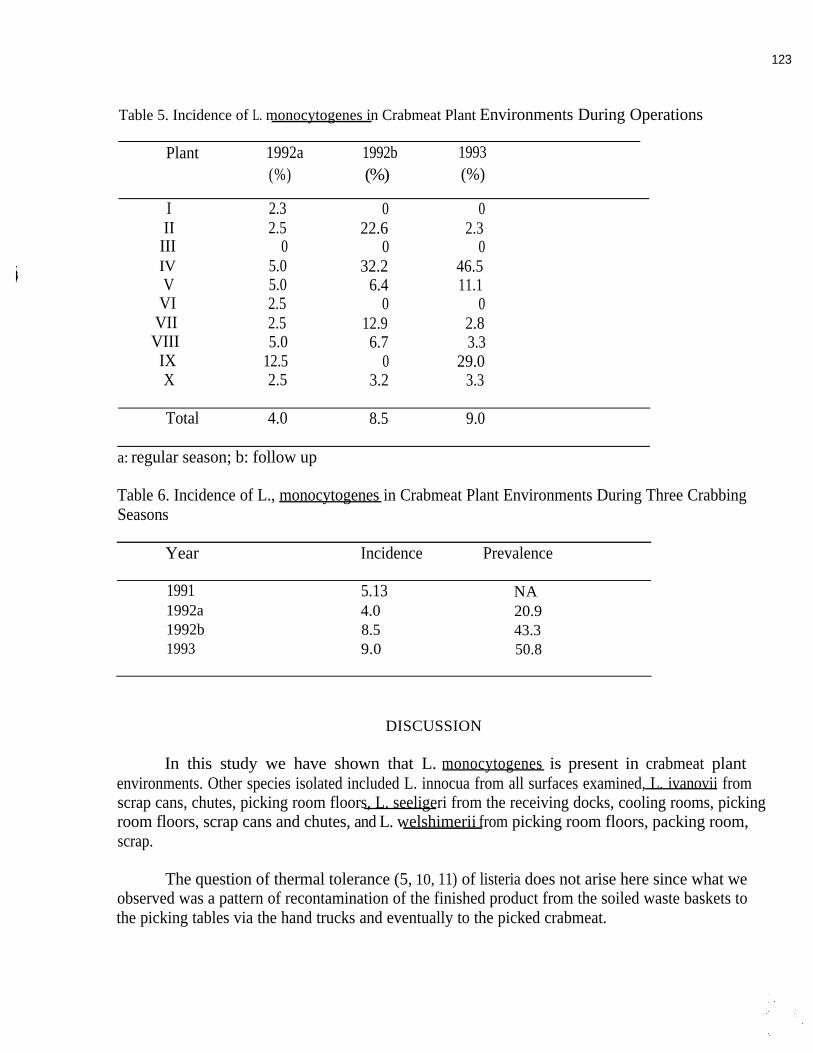
We also note that L. monocytogenes account from one fith (20.9%) to half (50.8%) of all theisolates.
123
Table 5. Incidence of L. monocytogenes in Crabmeat Plant Environments During Operations
Plant
IIIIIIIVV
VIVIIVIII
IXX
Total
1992a 1992b 1993(%) (%) (%)
2.3 0 02.5 22.6 2.3
0 0 05.0 32.2 46.55.0 6.4 11.12.5 0 02.5 12.9 2.85.0 6.7 3.3
12.5 0 29.02.5 3.2 3.3
4.0 8.5 9.0
a: regular season; b: follow up
Table 6. Incidence of L., monocytogenes in Crabmeat Plant Environments During Three CrabbingSeasons
Year Incidence Prevalence
1991 5.13 NA1992a 4.0 20.91992b 8.5 43.31993 9.0 50.8
DISCUSSION
In this study we have shown that L. monocytogenes is present in crabmeat plantenvironments. Other species isolated included L. innocua from all surfaces examined, L. ivanovii fromscrap cans, chutes, picking room floors, L. seeligeri from the receiving docks, cooling rooms, pickingroom floors, scrap cans and chutes, and L. welshimerii from picking room floors, packing room,scrap.
The question of thermal tolerance (5, 10, 11) of listeria does not arise here since what weobserved was a pattern of recontamination of the finished product from the soiled waste baskets tothe picking tables via the hand trucks and eventually to the picked crabmeat.
124
The method of isolation used a combination of FDA and USDA in that swabs were kept incold enrichement for two weeks and replated before final results were reported.
The incidence rates for different plants cannot be used as predictors for incidence from seasonto season. Rather the institution of a rigorous cleaning and sanitizing program and strict adherenceto it are most important factors in controlling the incidence in plant environments thereby reducingthe risk of product contamiantion. L. monocytogenes is suceptible to range of disinfectants andsanitizers which are readily available to plant operators. Rossmoore and Drenzek (18) and Chermack(6) have shown that efficacy differences existed among biocides approved for use in the food industryand the seafood industry in particular. These products are usually adversely affected by the organicload present at the the time of their application.
Farber and Peterkin (7) have summarized a series of listerioses in which listeria wasimplicated. This table reaffirms the general statement that Listeria is a potential food borne pathogenin the elderly, the young, and the immunocompromized hosts. The association of listeria withfoodborne outbreaks in which seafood was implicated was described by Lenon et al. (15) in NewZealand.
While a a zero tolerance for Listeria in shellfish plants is a goal of FDA’s Office of SeafoodSafety, it might be argued that the frequency rates reported here show the difficulty in eliminating L.
cytogenes from seafood plant environments without pushing the cost of the product beyondaffordable levels. This was noted in other studies presented at the Listeria Conference of Baltimoresponsored by the National Sea Grant, Virginia Sea Grant and the National Blue Crab IndustryAssociation in 1992.
Finally a manual of blue crab operation was developed. It is available through the UniversityExtension Service and the Department of Health’s Division of Shellfish. Even in instances whereHACCP could be effective the size of the plant did not make a difference in the outcome of seasonalswabbings. What was most important was the commitment of the owners and operators and theirperceived risk of economic loss.
REFERENCES
1. AUDURIER, A., R. CHATELAIN, F. CHALONS, AND M. PEICHAUD. 1979. Lysotypiede 823 souches de L. monocytoge isolees en France de 1958 a 1978. Ann.Microbiol (Paris). 130B: 179-l 89.
2.
3.
BILLE, J. 1990. Epidemilogy of human in Europe, with special reference to the Swissoutbreak, p. 71-74. in A. J. Miller, J. L. Smith, and G. A. Somkuti (ed.), Foodbornelisteriosis. Elsevier, Amsterdam.
BORTULUSSI, R., A. ISSEKUTZ, AND G. FAULKNER. 1986. Opsonization of Listeriamonocytogenes type 4b by human adult and newborn sera. Infect. Immun. 52:493-498.
125
4.
5.
6.
7.
8.
9
10.
11.
12.
13.
14.
15.
BOUCHER, M., AND M. L. YONEKURA, 1984. Listeria meningitis during pregnancy,Am. J. Perinatol. 1:312-318.
BRADSHAW, J.G., T.J. PEELER, J.J. CORWIN, J.M. HUNT, J.T. TIERNEY, E.P.LARKIN, AND R.M. TWEDT. 1985. Thermal resistance of Listeria monocytogenesin milk. J. Food Prot. 48:743-745
CHERMACK M.T. 1992. Listeria monocytogenes in Shellfish Processing Plants; The Effectof Biofilm on Biocide Efficacy. M S Thesis VA Commonwealth Univ. Richmond, VA
FARBER J.M., P.I. PETERKIN, 1991. Listeria monocytogenes, a Food-Borne PathogenMicrobiol. Reviews 55:476-511
FILICE, G. A., H. F. CANTRELL, A. B. SMITH, P. S. HAYES, J.C. FEELY, AND D.W.FRASER, 1978. Listeria monocytogenes infection in neonates: investigation of anepidemic. J. Infect. Dis. 138:17-23.
FLEMING, D. W., S. L. COCHI, K. L. MACDONALD, J. BRONDUM, P.S. HAYES, B.D. PLIKAYTIS, M. B. HOLMES, A. AUDURIER, C. V. BROOME, AND A. L.REINGOLD. 1985. Pasteurized milk as a vehicle of infection in an outbreak oflisteriosis. N. Engl. J. Med. 312:404-407.
GARAYZABAL, J.F.F., L.D. RODRIGUEZ, J.A.V. BOLAND, E.F.R. FERRI, V.B.DIESTE, J.L.B. CANCELO, AND G.S. FERNANDEZ. 1987. Survival of Listeriamonocytogenes in raw milk treated in a pilot plant size pasteurizer. J. Appl. Bacteriol.63:533-537.
HARRISON, M.A., AND Y.W. HUANG. 1990. Thermal death times for Listeriamonocytogenes (Scott A) in crabmeat. J. Food Prot. 53:878-880.
KAMPELMACHER, E. H., W. T. HUYSINGA, AND L. M. VAN NOORLE JANSEN.1972. The presence of Listeria monocytogenes in feces of pregnant women andneonates. Zentralbl. Bakteriol. Mikrobiol. Hyg. Abt. 1 Orig. Reihe A 222:258-262.
KAMPELMACHER, E. H., AND L. M. VAN NOORLE JANSEN. 1969. Isolation ofListeria monocytogenes from feces of clinically healthy humans and animals.Zentralbl. Bakteriol. Microbiol. Hyg. Abt. 1 211:353-359.
KAMPELMACHER, E. H., AND L. M. VAN NOORLE JANSEN. 1972. Further studieson the isolation of Listeria monocytogenes in clinically healthy individuals. Zentralbl.Bakteriol. Microbiol. Hyg. Abt 1 Orig. Reihe A 221:70-77.
LENNON, D., B. LEWIS, C. MANTELL, D. BECROFT, B. DOVE, K FARMER, S.TONKIN, N. YEATES, R. STAMP, AND K. MICKLESON. 1984. Epidemicperinatal listeriosis, Pediatr. Infect. Dis. 3:30-34.
126
16.
17.
18.
19.
20.
21.
22.
23.
24.
LINNAN, M. J., L. MASCOLA, X. D. LOU, V. GOULET, S. MAY, C. SALMINEN, D.W. HIRD, L. YONEKURA, P. HAYES, R. WEAVER A. AUDURIER, B.D.PLIKAYTIS, S. L. FANNIN, A. KLEKS, AND C. V. BROOME. 1988. Epidemiclisteriosis associated with Mexican-style cheese. N. Engl. J. Med. 3 19:823-828.
LOVETT, J. 1988. Isolation and identification of Listeria monocytogenes in dairy products.J. Assoc. off. Anal. Chem. 71:658-660.
ROSSMOORE, K., AND C. DRENZEK. 1990. Control of Listeria monocytogenes bybiocide in the food industry environment. p.211-219. In A.J Miller, J.L. Smith, andG.A. Somkuti (edit). Foodborne listeriosis, Society for Industrial Microbiology,Elsiever Science Publishing Inc. New York.
SCHLECH, W. F., P.M. LAVIGNE, R. A. BORTOLUSSI, A. C. ALLEN, E. V.HALDANE, A. J. WORT, A. W. HIGHTOWER, S. E. JOHNSON, S.H. KING,E. S. NICHOLLS, AND C. V. BROOME. 1983. Epidemic listeriosis-evidence fortransmission by food. N. Engl. J. Med. 308:203-206.
SCHWARTZ, B., C. A. CIESIELSKI, C. V. BROOME, S. GAVENTA, G. R. BROWN, B.G. GELLIN, A. W. HIGHTOWER, L. MASCOLA, AND THE LISTERIOSISSTUDY GROUP. 1988. Association of sporadic listeriosis with consumption ofuncooked hotdogs and undercooked chicken. Lancet ii:779-782.
SEELIGER, H. P. R, AND D. JONES. 1986. Listeria, p, 1235-1245. In P. H. Sneath et al.(ed.), Bergey’s manual of systematic bacteriology, vol. 2. The Williams & WilkinsCo., Baltimore.
WEAGANT, S.D., P .N . SADO, K.G. COLBURN; J.D. TORKELSON, F.A.STANLEY,M.H. KRANE, SC. SHIELDS, AND C.F. THAYER. 1988. Incidence of Listeriaspecies in frozen seafood products. J.Food Prot. 51:655-657
WELSHIMER H. J. 1960. Survival of Listeria monocytogenes in soil. J. bacteriol. 80 :3 16-320.
U.S. FOOD AND DRUG ADMINISTRATION. 1988. Bacteriological analytical manual,Chapter 29-Listeria isolation; revised method of analysis: notice. Fed. Regist.53:44147-44153.
127
SURVIVAL OF LISTERIA MONOCYTOGENES IN LOBSTER MEATDURING SELECTED HEAT TREATMENT CONDITIONS
Auréa Cormier, Solange Chiasson and Hélène MalouinFood Research Centre, Université de Moncton
Moncton, N.B., Canada ElA 3E9
The occurrence of Listeria monocytogenes (LM) in crustaceans is a cause of concern forconsumers, processors and regulatory agencies. Researchers have reported the presence of LM inlobster (8, 9). The thermal death time for LM in lobster meat has been studied by Budu-Amoakoet al (2). The Department of Fisheries and Oceans Canada (DFO) has published heat tables todestroy LM in establishments where environment samples have tested positive. In-plant heattreatment of contaminated lobster is often carried out at 80°C or higher. Given that elevatedtemperatures considerably reduce drained weight and quality of lobster, the present studyattempted to determine if LM would survive less harsh heat treatments, yet still be LM-free. Theobjectives were: (1) To verify if, in the 60 to 80°C range, the partial or full heating times proposedin DFO table A are adequate to completely destroy LM cells inoculated in 320g cans of lobstermeat; (2) To evaluate the effect of such heating exposures on processed meat yields.
MATERIALS AND METHODS
Preparation of LM strainsFive strains of LM were provided by Health and Welfare Canada (Sir Frederic G.
Banting Research Centre, Tunney’s Pasture, Ottawa, Canada): HPB #4 (milk); Scott A (patient);HPB #563 (ground meat).; HPB #395 (Ker Noella brie) and HPB #397 (alfalfa). The strains werekept at 4°C on Triticase soy agar (TSA).The preparation of the inocula was done according tothe procedure recommended by Brown for thermal studies (1). Prior to each thermal study, thefive strains were transferred twice on Triticase soy broth (BBL) with 0.5% yeast extract (BBL)and incubated at 35°C for 24 hours. Two mL of each strain were mixed, centrifuged at 2900 rpm,and the cells were suspended in 10 mL of 0.1% peptone water. The average number of LM cellswas 6.4 x 10⁴/mL.
Preparation of lobster meat cansForty eight hours before each thermal study, live lobster was purchased from a local
processor (Paturel's Seafood Ltd, Shediac). It was cooked 15 min in boiling water and immediatelycooled in cold water for 5 min. The meat was shucked and kept overnight at 4°C. Each metal can(404x 206) was fitted with a thermocouple (T-type) placed in the geometric centre. A port of entryfor inoculation was also screwed in the can, Each can was filled with 320g of lobster meat, and 140g
of a brine solution containing 1.5% NaCl and 1.5% sodium tripolyphosphate. A lobster tail was fixedon the tip of the thermocouple with fine polyester thread and the can was hermetically sealed (Seamermodel HO, American Can Canada Inc). For each trial, two non-inoculated cans were immediatelyset aside at 4°C to determine initial aerobic count. For each of the experimental cans, the screw ofthe inoculation port was opened and 1 mL of inoculum was injected in the geometric centre of thecan, within the tail fixed on the thermocouple. Nine additional milliliters of brine were added soas to adjust the amount of liquid to 150g. The inoculated cans were kept overnight at 4°C since ithas been suggested that LM cells may need time to adjust to their environment in order tomultiply (4). Given that freezing at -18°C can inactivate LM cells (3), the lobster cans were notfrozen but kept at 4°C.
Heat treatment of lobster cansTable 1 summarizes the temperatures and time exposures of lobster. Each treatment was
repeated six times.
In order to reduce come-up time and better simulate in-plant processing conditions, theexperimental lobster cans were submerged in a circulating water bath (Blue M, Electric Co.) whichwas set at 10°C higher than the projected temperature of exposure. All thermocouples utilized tofollow heat penetration were connected to a data logger (Beckman Industrial, model 245). Assoon as the central internal temperature of the cans reached 10°C less than the projected studytemperature, they were transferred to another circulating water bath (Tecator, model 1024) preciselyset at the desired temperature of exposure. When the latter temperature was reached, the cans wereremoved at the exact exposure time appearing in table 1, and they were cooled in a 7°C water bathuntil they reached an internal temperature of 30°C. They were kept overnight at 4°C prior tomicrobiological analyses.
Drained weightEach can subjected to heat treatment was opened and drained for 90 sec according to the
technique used by DFO (AB. Dewar, 1980, DFO-Halifax, personal communication). The meat wasweighed in order to calculate changes in yield attributable to treatment.
Microbiological analysesAerobic plate count was determined on two non-inoculated cans for all treatment
temperatures studied. The official DFO method (7) was used to enumerate the aerobic organismspresent prior to heat treatment.. Appropriate dilutions were made and the Petri plates were incubatedat 25 ± 0.5°C for 72 ± 3 hours. All dilutions were done in duplicate.
The LM count in lobster meat was determined after inoculation according to the followingmethod : the lobster can content was macerated in a Waring blender; a 1: 10 dilution was made withsterile 0.1% peptone water and subsequent dilutions were made with the same medium; TSA platescontaining 5% yeast extract were prepared in duplicate to obtain LM counts. The Petri plates wereincubated at 35°C for 72 hours. The microbiological analysis system devised by VITEK (Biomérieux
Vitek Inc, Hazelwood Missouri) was used to identify LM. A modified method devised by Health andWelfare Canada which utilizes the Fraser broth (6) was used to confirm the presence of surviving LMcells at the level of less than 1 cell/l00g.
129
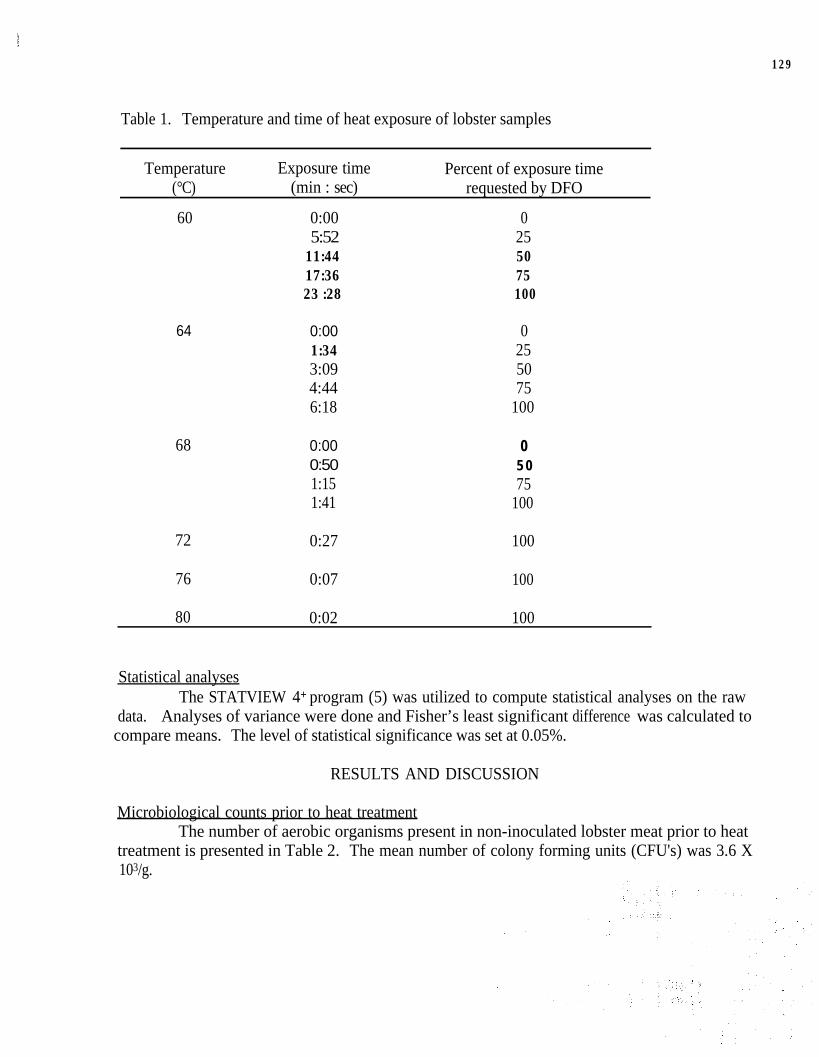
Table 1. Temperature and time of heat exposure of lobster samples
Temperature(°C)
60
Exposure time Percent of exposure time(min : sec) requested by DFO
0:00 05:52 25
11:44 5017:36 7523 :28 100
64
68
0:00 01:34 253:09 504:44 756:18 100
0:00 00:50 5 01:15 751:41 100
72 0:27 100
76 0:07 100
80 0:02 100
Statistical analysesThe STATVIEW 4+ program (5) was utilized to compute statistical analyses on the raw
data. Analyses of variance were done and Fisher’s least significant difference was calculated tocompare means. The level of statistical significance was set at 0.05%.
RESULTS AND DISCUSSION
Microbiological counts prior to heat treatmentThe number of aerobic organisms present in non-inoculated lobster meat prior to heat
treatment is presented in Table 2. The mean number of colony forming units (CFU's) was 3.6 X10³/g.
130
Table 2. Microbiological data on non-inoculated and inoculated lobster samples prior to heattreatment
Planned temp. Aerobic count Listeria monocytogenes inof exposure (CFU/g)1 inoculated lobster
60 2.7 X lo3 6.6 x lo664 1.3 x lo3 5.0 x lo668 9.3 x lo3 8.8 X lo672 2.9 x 10³ 3.8 X lo676 2.9 x 10³ 3.8 x lo680 2.9 x lo3 3.8 x lo6
Mean 3.6 X 10³ 6.4 X lo6* n = 2 for each temperature
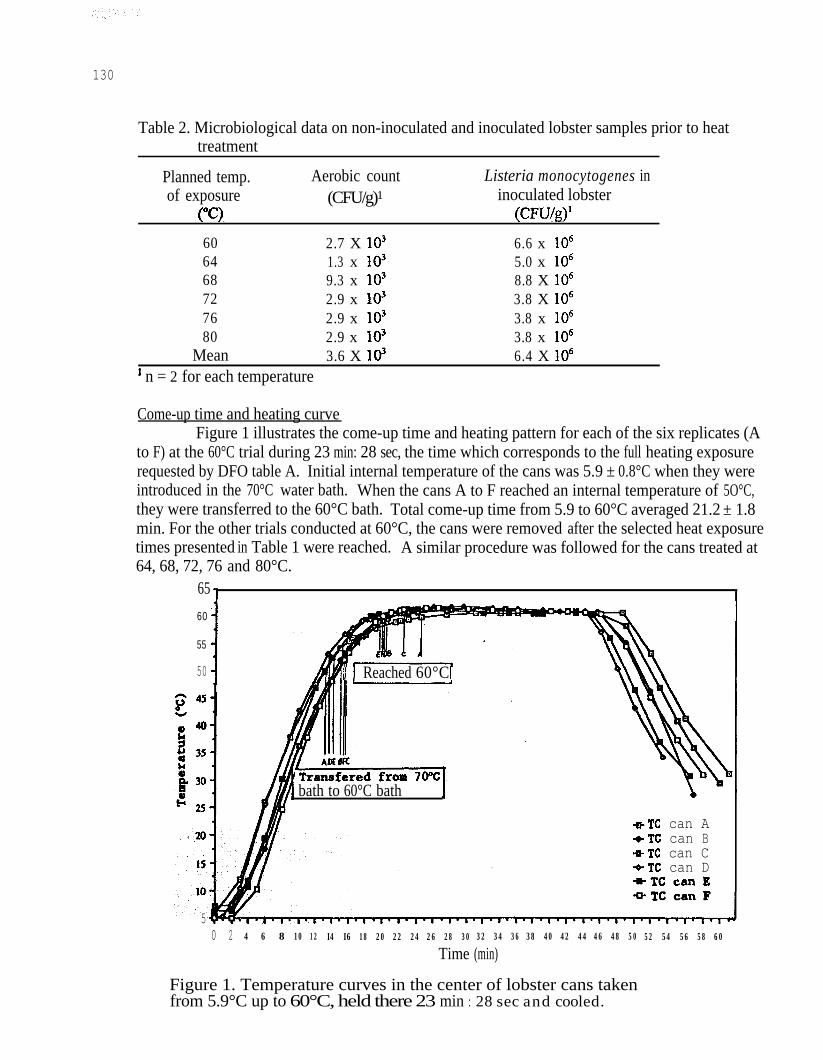
Come-up time and heating curveFigure 1 illustrates the come-up time and heating pattern for each of the six replicates (A
to F) at the 60°C trial during 23 min: 28 sec, the time which corresponds to the full heating exposurerequested by DFO table A. Initial internal temperature of the cans was 5.9 ± 0.8°C when they wereintroduced in the 70°C water bath. When the cans A to F reached an internal temperature of 5O°C,they were transferred to the 60°C bath. Total come-up time from 5.9 to 60°C averaged 21.2 ± 1.8min. For the other trials conducted at 60°C, the cans were removed after the selected heat exposuretimes presented in Table 1 were reached. A similar procedure was followed for the cans treated at64, 68, 72, 76 and 80°C.
65 7 I60 -4 I
f55
50 i I/ j Reached 60°C 1
bath to 60°C bath
+TC can A+TC can B-bTC can C-o-TC can D
50 2 4 6 8 10 12 I4 I6 18 20 22 24 26 28 30 32 34 36 38 40 42 44 46 48 50 52 54 56 58 60
Time (min)
Figure 1. Temperature curves in the center of lobster cans takenfrom 5.9°C up to 60°C, held there 23 min : 28 sec and cooled.
J

131
Mean come-up times to arrive at the targeted temperatures of exposure were between 21and 25 minutes (Fig. 2). This must kept in mind when interpreting the data on LM inactivation sincepartial destruction of LM cells can occur during the come-up time.
35
33
31
29
27
25
23
21
19
17
1560 64 66 72 76 60
Set temperature of water bath (°C)
Figure 2. Mean and standard deviation of come-up time for 320g of lobster meat heated at selectedtemperatures between 60°C and 80°C.
Microbiological data after heat treatmentTable 3 summarizes the microbiological data on the occurrence of LM cells in 320g samples
of lobster meat subjected to selected heating treatments.
It was found that at 60°C, unless heat exposure was longer than 11 min : 44 sec, LMcolonies were found on TSA plates. However, with a heat treatment of 17 min :36 sec, LM coloniesno longer occurred on TSA plates but, in 5 out of 6 samples, there was a darkening of the Fraserbroth and the VITEK system confirmed the presence of LM. A heat treatment of 23 min : 28 sec at60°C, as requested by DFO, prevented colony growth on TSA but some LM survived in four out ofsix trials. The four LM positive Fraser broth samples were submitted to the VITEK analytical systemand indeed, LM was identified in each case. This finding indicates that a contamination level of 6.6X 10⁶ with LM requires a longer heat treatment at 60°C than the 23 min : 28 sec requested in TableA issued by DFO.
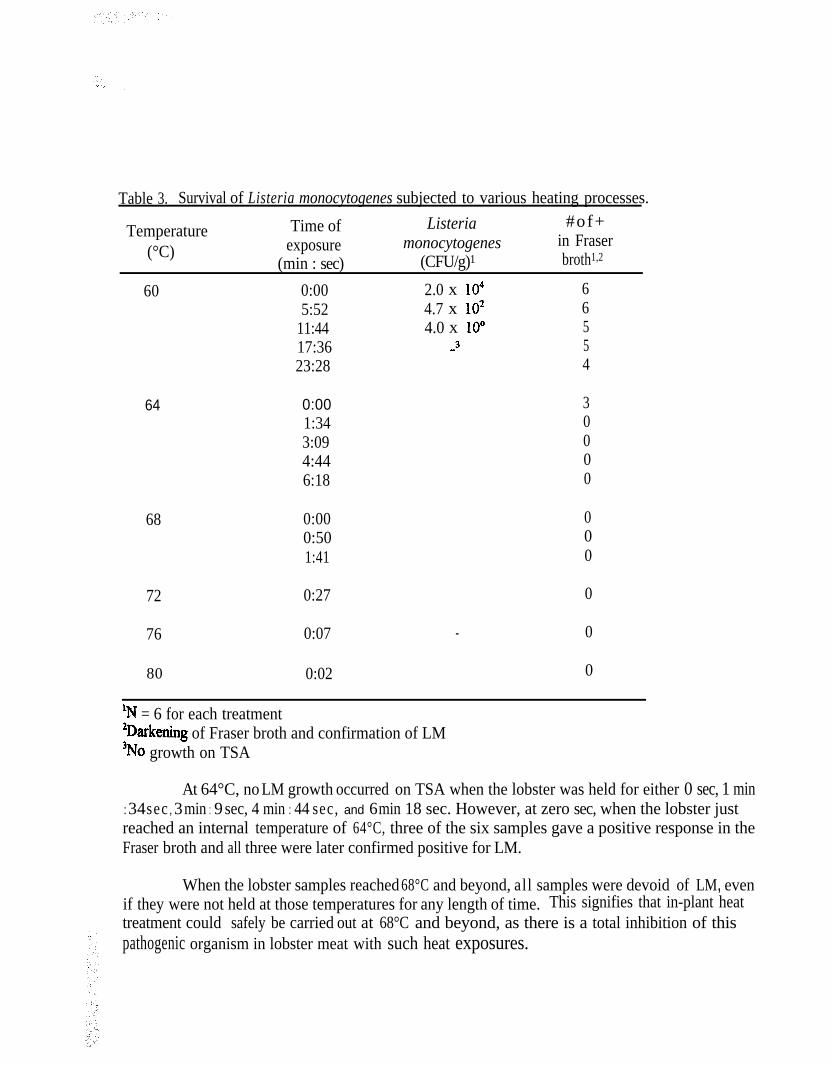
Table 3. Survival of Listeria monocytogenes subjected to various heating processes.
Temperature Time of Listeria #of+
(°C) exposure monocytogenes in Fraser(min : sec) (CFU/g)1 broth1,2
60 0:00 2.0 x lo4 65:52 4.7 x lo2 6
11:44 4.0 x IO” 517:36 -3 523:28 4
64 0:00 31:34 03:09 04:44 06:18 0
68 0:00 00:50 01:41 0
72 0:27 0
76 0:07 - 0
80 0:02 0
‘N = 6 for each treatment~arkenin, of Fraser broth and confirmation of LM‘No growth on TSA
At 64°C, no LM growth occurred on TSA when the lobster was held for either 0 sec, 1 min: 34 sec , 3 min : 9 sec, 4 min : 44 sec, and 6 min : 18 sec. However, at zero sec, when the lobster justreached an internal temperature of 64°C, three of the six samples gave a positive response in theFraser broth and all three were later confirmed positive for LM.
When the lobster samples reached 68°C and beyond, all samples were devoid of LM, evenif they were not held at those temperatures for any length of time. This signifies that in-plant heattreatment could safely be carried out at 68°C and beyond, as there is a total inhibition of thispathogenic organism in lobster meat with such heat exposures.

133
Relationship between lobster meat yield and heat treatment
Table 4 presents the percent weight changes observed in lobster meat after subjecting it toselected heat treatments.
Table 4. Percent weight changes observed in 320g of lobster meat subjected. to selected heattreatments
Temperature oftreatment
(°C)
Exposure time Weight change(min : sec) (%)
60 0:OO +-0.52l f o.9gcd5:52 +0.14 f 1.3P
11:44 -0.38 f o.97M17:36 -0.28 f l.llM23:28 +0.17 f 0.64”6
64 o:oo +0.58 f 1.03”61:34 +0.81 f 0.90d3:09 -0.43 f 0.43”4:44 -0.27 f 0.84b”d6:18 +0.14 f 0.81ti
68 0:00 -0.06 f 0.87M0:50 0.00 f 1.9Pj1:41 -0.37 f 1.58F
72 0:27 -0.24 f 0.43bcd
-1.13 f 0.15b
80 0:02 -3.33 f 1.48’
’ Means associated with the same letter are not significantly different according to Fisk’s least significantdifference (p<0.05)
Very little weight changes occurred between 60 and 72°C at the specific heating times tested. Evenat the 76°C exposure for 7 sec, the 1.13% weight loss observed did not differ significantly from someof the samples heated between 60 to 72°C. However, at 80°C, there was a 3.33% weight loss andthis value was significantly different from all of the other temperatures tested. It must be kept in mindhowever, that the canned lobster used in this study was not frozen prior to measuring the drainedweight, a procedure which departs from current industrial practices. Nevertheless, it can be statedthat heat treatment of lobster meat at 80°C is detrimental to yield, Extensive protein denaturation isconducive to a loss in water holding capacity.
134
CONCLUSION
The results obtained in the course of this study indicate the following:
At 6O°C, heat treatment for 23 min : 28 sec is not sufficient to completely destroy Listeriamonocytogenes.
At 64°C, a short heat exposure is required to completely inactivate Listeria monocytogenes.With a 1 min: 34 sec exposure, complete destruction has occurred. Given that very little lossin yield is observed at 64°C, contamination risks are reduced by heat treating the lobster for 6min: 18 sec which is the exposure time recommended in DFO table A.
At 68°C, Listeria monocytogenes is completely destroyed. Treatment at a higher temperatureis not necessary for lobster meat.
Short time heat exposures between 60 and 72°C have minimal effects on the drained weight oflobster meat.
Optimal heat treatment for 320g of canned lobster lies between 68 and 76°C when come-uptime is between 21 and 25 min.
REFERENCES
1. BROWN, W.L. 1991. Designing Listeria monocytogenes thermal inactivation studies forextended self-life refrigerated foods. Food Technology 45(4): 152-l53.
2. BUDU-AMOAKO, E., WALTON, C., ABLETT, RF. and SMITH J. 1991. Thermal deathtime for Listeria monocytogenes in lobster meat. J. Food Prot. 55: 212-213.
3. EL-KEST, S., YOUSEF, A.E. and MARTH, E.H. 1991. Fate of Listeria monocytogenes duringfreezing and frozen storage. J. Food Sci. 56: 1068-1071.
4. FARBER J.M., SANDERS, G.W., SPEERS, J.I., D’AOUST, J.Y., EMMONS, D.B. andMCKELLAR R 1988. Thermal resistance of Listeria monocytogenes in inoculated andnaturally contaminated raw milk. Int. J. of Food Microbiol. 7: 277-286.
5. FELDMAN, D.S., HOFMAN, R, GAGNON, J. and SIMPSON, J. 1987. Statview SE+: T h eSolution for Data Analysis and Presentation Graphics. Abacus Concepts Inc., Berkeley,CA
6. HEALTH AND WELFARE CANADA. 1992. Isolation of Listeria monocytogenes from allfood and environmental samples (MFHPB-30). In Compendium of Analytical Methods,Polysciences Publication, Ottawa.
135
7. MINISTÉRE DES PÊCHES ET OCÉANS CANADA 1988. Marche à suivre pour lanumération sur plaques des bactéries aérobies In Procédures pour analysesmicrobiologiques 3ième édition. Direction générale des services d'inspection, Ottawa.
8. RYSER, T.E. and TH, E.H. 1990. Incidence and behaviour of Listeria monocytogenesin fish and seafood.. In Listeria, Listeriosis and Food Safety, 123-456. Marcel Dekker Inc.,New York.
9. WEAGANT, S.D., SADO, P.N., COLBURN, K.G., TORKELSON, J.D., STANLEY, F.A.,KRANE, M.H., SHIELDS, S.C. and THAYER, C.F. 1988. The incidence of Listeriaspecies in frozen seafood products. J. Food Prot. 51: 655-657.
LISTERIA MONOCYTOGENES AND SALMONELLA SSP,IN MODIFIED ATMOSPHERE PACKAGED CHANNEL CATFISH
Juan L. Silva, Tess D. White and Nawarut SunyavivatDepartment of Food Science and Technology
Mississippi State UniversityMississippi State, MS
Fish consumption has been on the rise, especially fresh fish products. However, fish arevery susceptible to spoilage and losses may be as high as 50% (10). Spoilage of fresh fishis caused mainly by microbial action. Fish are usually in cold waters and thus the predominantgram negative bacteria are able to grow well in refrigeration. One promising technology toextend shelf-life of fresh fish is modified atmosphere packaging, MAP (2). This technology isusually used in combination with refrigeration. This has proven to extend the shelf-life ofhybrid bass strips (7) and channel catfish strips (16). Some pathogens may be able to grow inMAP products due to lack of competitive spoilage bacteria and anaerobic conditions created.Salmonella spp (3) and Listeria monocytogenes (5) have been found in fish. Salmonella spp.have been isolated from channel catfish (CC) fillets (17) and L. monocytogenes has been found inCC visceras and fish flesh (9, 17). Some of these pathogens are able to grow at low temperaturesand under microenvironments. The objectives of this work were to study the growth of Salmonellaspp. and L. monocytogenes at various temperatures under MAP and look at the effect of a marinadeon pathogenic growth inhibition.
MATERIALS AND METHODS
Fresh channel catfish fillets were packaged in 3.0 mil polyethy-lene bags, packed on iceand within 2 h, cut into strips weighing approximately 10 g. Strips were packaged under thecorresponding environment after being dipped in 200 ppm chlorine (1: 10 fish/chlorine solutionv/w) for 2 min, inoculated with 104 CFU/mL of the appropriate bacteria (L. monocytogenes andSalmonella spp.), and stored at 0°C or 10°C. Evaluations were performed for 28 d.
PackagingStrips were packaged either under air (AIR) or under 90% carbon dioxide balanced with
air (MAP). Sixteen strips were placed in 2.7 mil polyethylene bags (Dow Chemical Co., Indianapolis,IN) - AIR, or in preformed 21.5 x 25 cm2 B700 barrier bags (Cryovac Division, W. R. Grace Co.,Duncan, SC) - MAP. The MAP bags were evacuated and backflushed with CO, using a Multivac“AGW” (Koch, Kansas City, MO) packaging machine.
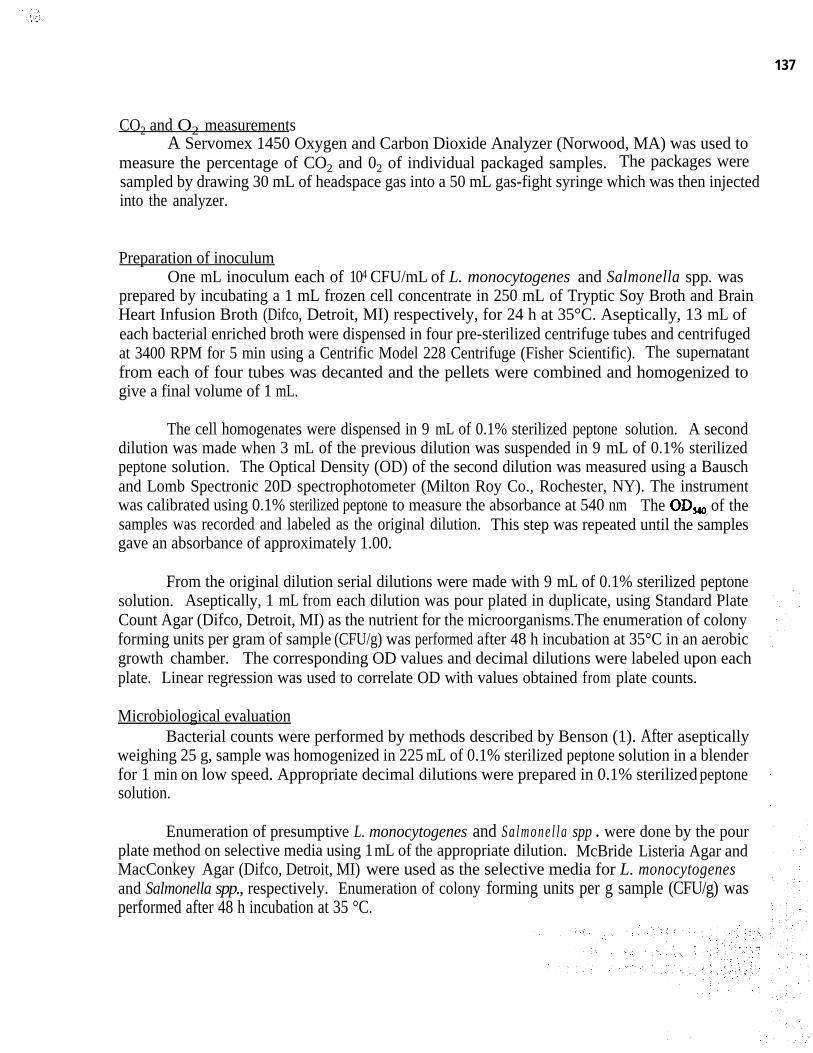
137
CO2 and O2 measurementsA Servomex 1450 Oxygen and Carbon Dioxide Analyzer (Norwood, MA) was used to
measure the percentage of CO2 and 02 of individual packaged samples. The packages weresampled by drawing 30 mL of headspace gas into a 50 mL gas-fight syringe which was then injectedinto the analyzer.
Preparation of inoculumOne mL inoculum each of 104 CFU/mL of L. monocytogenes and Salmonella spp. was
prepared by incubating a 1 mL frozen cell concentrate in 250 mL of Tryptic Soy Broth and BrainHeart Infusion Broth (Difco, Detroit, MI) respectively, for 24 h at 35°C. Aseptically, 13 mL ofeach bacterial enriched broth were dispensed in four pre-sterilized centrifuge tubes and centrifugedat 3400 RPM for 5 min using a Centrific Model 228 Centrifuge (Fisher Scientific). The supernatantfrom each of four tubes was decanted and the pellets were combined and homogenized togive a final volume of 1 mL.
The cell homogenates were dispensed in 9 mL of 0.1% sterilized peptone solution. A seconddilution was made when 3 mL of the previous dilution was suspended in 9 mL of 0.1% sterilizedpeptone solution. The Optical Density (OD) of the second dilution was measured using a Bauschand Lomb Spectronic 20D spectrophotometer (Milton Roy Co., Rochester, NY). The instrumentwas calibrated using 0.1% sterilized peptone to measure the absorbance at 540 nm. The CD, of thesamples was recorded and labeled as the original dilution. This step was repeated until the samplesgave an absorbance of approximately 1.00.
From the original dilution serial dilutions were made with 9 mL of 0.1% sterilized peptonesolution. Aseptically, 1 mL from each dilution was pour plated in duplicate, using Standard PlateCount Agar (Difco, Detroit, MI) as the nutrient for the microorganisms.The enumeration of colonyforming units per gram of sample (CFU/g) was performed after 48 h incubation at 35°C in an aerobicgrowth chamber. The corresponding OD values and decimal dilutions were labeled upon eachplate. Linear regression was used to correlate OD with values obtained from plate counts.
Microbiological evaluationBacterial counts were performed by methods described by Benson (1). After aseptically
weighing 25 g, sample was homogenized in 225 mL of 0.1% sterilized peptone solution in a blenderfor 1 min on low speed. Appropriate decimal dilutions were prepared in 0.1% sterilized peptonesolution.
Enumeration of presumptive L. monocytogenes and Sa lmone l la spp . were done by the pourplate method on selective media using 1 mL of the appropriate dilution. McBride Listeria Agar andMacConkey Agar (Difco, Detroit, MI) were used as the selective media for L. monocytogenesand Salmonella spp., respectively. Enumeration of colony forming units per g sample (CFU/g) wasperformed after 48 h incubation at 35 °C.
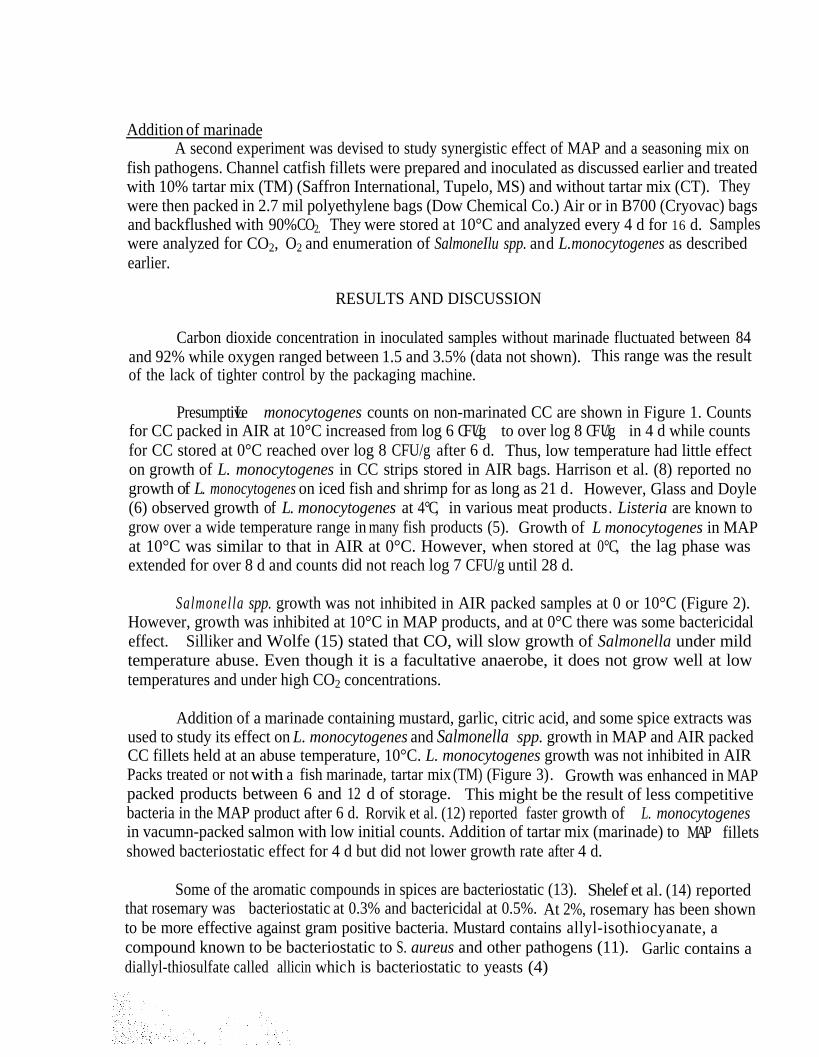
Addition of marinadeA second experiment was devised to study synergistic effect of MAP and a seasoning mix on
fish pathogens. Channel catfish fillets were prepared and inoculated as discussed earlier and treatedwith 10% tartar mix (TM) (Saffron International, Tupelo, MS) and without tartar mix (CT). Theywere then packed in 2.7 mil polyethylene bags (Dow Chemical Co.) Air or in B700 (Cryovac) bagsand backflushed with 90% CO2. They were stored at 10°C and analyzed every 4 d for 16 d. Sampleswere analyzed for CO2, O2 and enumeration of SalmoneIlu spp. and L. monocytogenes as describedearlier.
RESULTS AND DISCUSSION
Carbon dioxide concentration in inoculated samples without marinade fluctuated between 84and 92% while oxygen ranged between 1.5 and 3.5% (data not shown). This range was the resultof the lack of tighter control by the packaging machine.
Presumptive L monocytogenes counts on non-marinated CC are shown in Figure 1. Countsfor CC packed in AIR at 10°C increased from log 6 CFU/g to over log 8 CFU/g in 4 d while countsfor CC stored at 0°C reached over log 8 CFU/g after 6 d. Thus, low temperature had little effecton growth of L. monocytogenes in CC strips stored in AIR bags. Harrison et al. (8) reported nogrowth of L. monocytogenes on iced fish and shrimp for as long as 21 d. However, Glass and Doyle(6) observed growth of L. monocytogenes at 4°C, in various meat products. Listeria are known togrow over a wide temperature range in many fish products (5). Growth of L monocytogenes in MAPat 10°C was similar to that in AIR at 0°C. However, when stored at 0°C, the lag phase wasextended for over 8 d and counts did not reach log 7 CFU/g until 28 d.
Salmonella spp. growth was not inhibited in AIR packed samples at 0 or 10°C (Figure 2).However, growth was inhibited at 10°C in MAP products, and at 0°C there was some bactericidaleffect. Silliker and Wolfe (15) stated that CO, will slow growth of Salmonella under mildtemperature abuse. Even though it is a facultative anaerobe, it does not grow well at lowtemperatures and under high CO2 concentrations.
Addition of a marinade containing mustard, garlic, citric acid, and some spice extracts wasused to study its effect on L. monocytogenes and Salmonella spp. growth in MAP and AIR packedCC fillets held at an abuse temperature, 10°C. L. monocytogenes growth was not inhibited in AIRPacks treated or not with a fish marinade, tartar mix (TM) (Figure 3). Growth was enhanced in MAPpacked products between 6 and 12 d of storage.bacteria in the MAP product after 6 d.
This might be the result of less competitiveRorvik et al. (12) reported faster growth of L. monocytogenes
in vacumn-packed salmon with low initial counts. Addition of tartar mix (marinade) to MAP filletsshowed bacteriostatic effect for 4 d but did not lower growth rate after 4 d.
Some of the aromatic compounds in spices are bacteriostatic (13).that rosemary was bacteriostatic at 0.3% and bactericidal at 0.5%.
Shelef et al. (14) reportedAt 2%, rosemary has been shown
to be more effective against gram positive bacteria. Mustard contains allyl-isothiocyanate, acompound known to be bacteriostatic to S. aureus and other pathogens (11). Garlic contains adiallyl-thiosulfate called allicin which is bacteriostatic to yeasts (4)
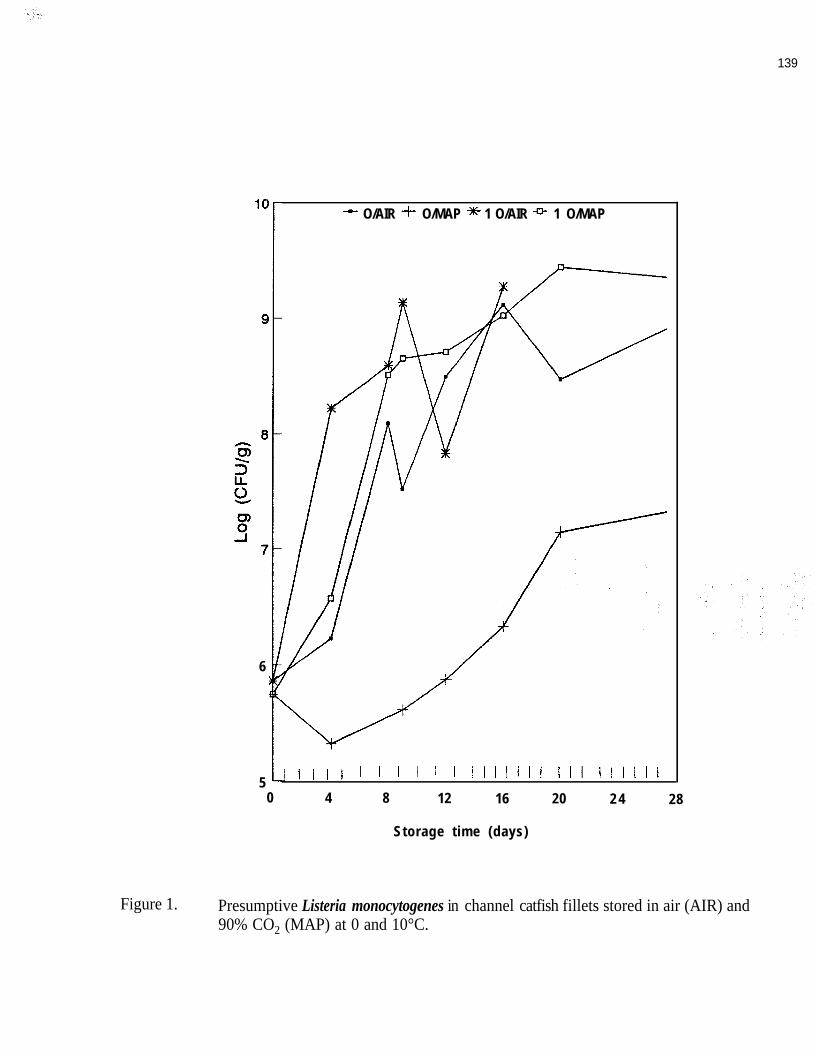
139
IC- O/AIR + O/MAP * 1 O/AIR -o- 1 O/MAP
6
Figure 1.
5 J 1 l l I I I I I I I I I I I I I I I I I I I I I I I0 4 8 12 16 20 2 4 28
Storage time (days)
Presumptive Listeria monocytogenes in channel catfish fillets stored in air (AIR) and90% CO2 (MAP) at 0 and 10°C.
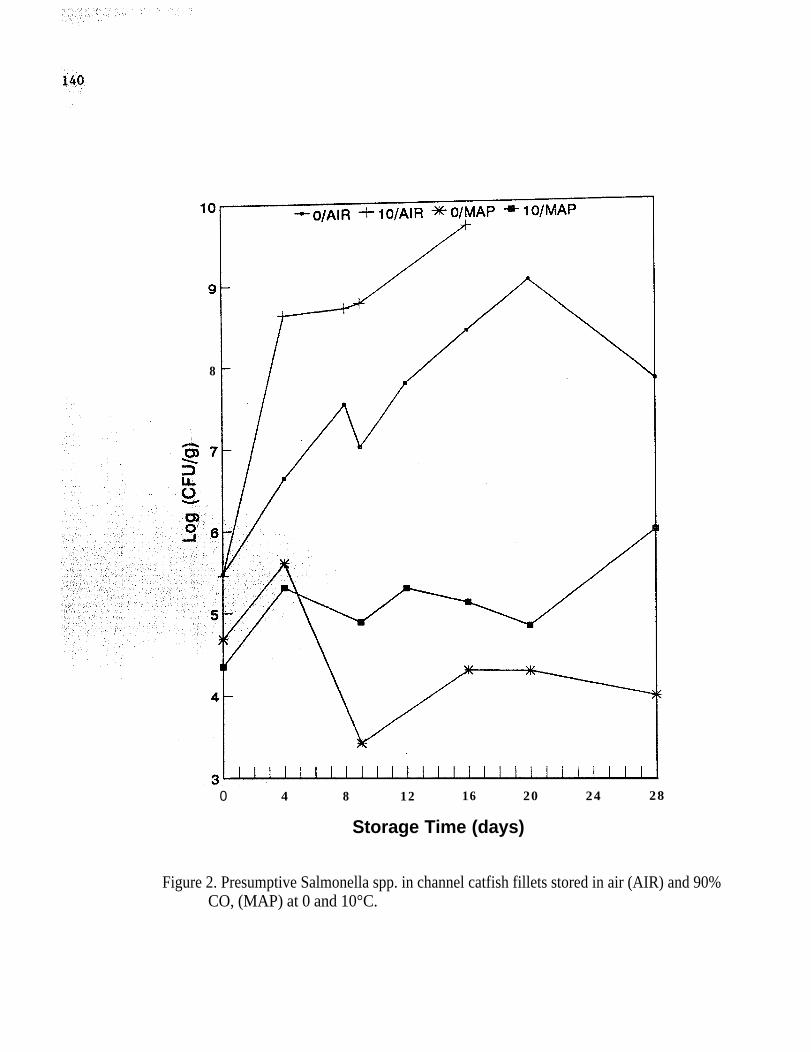
8
0 4 8 12 16 20 24 28
Storage Time (days)
Figure 2. Presumptive Salmonella spp. in channel catfish fillets stored in air (AIR) and 90%CO, (MAP) at 0 and 10°C.
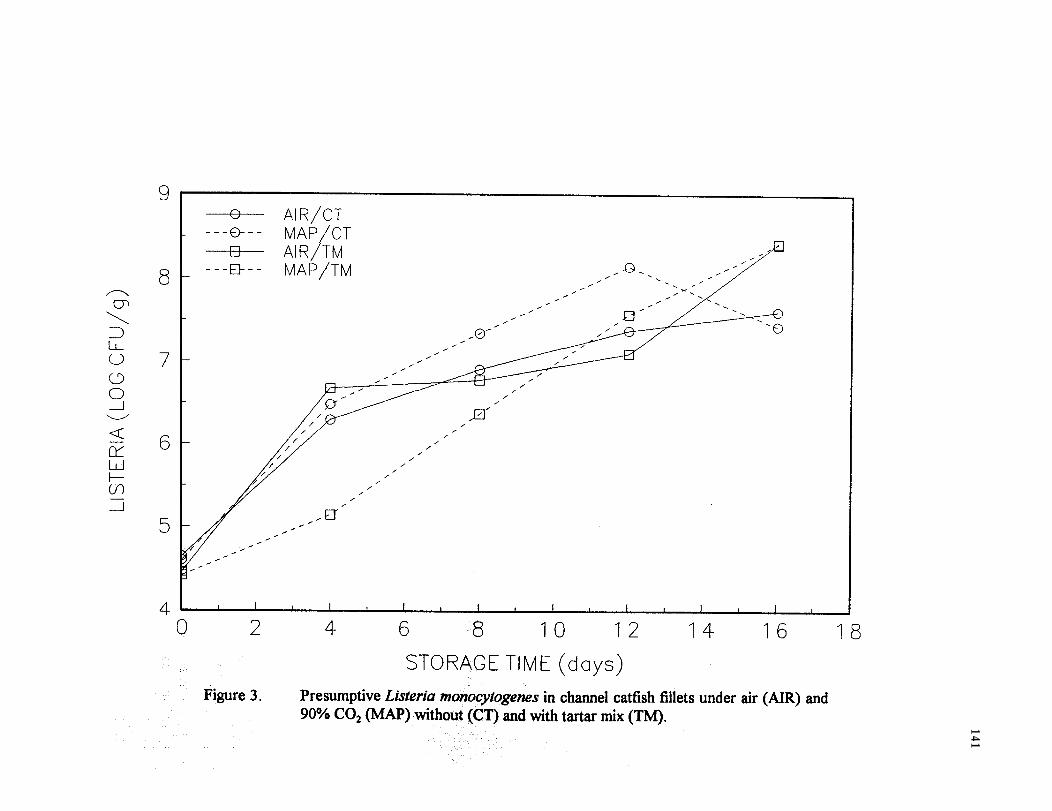
141
CDa3
r\Lo
u-ld-
p/l-w
301)
bw
tllsIl
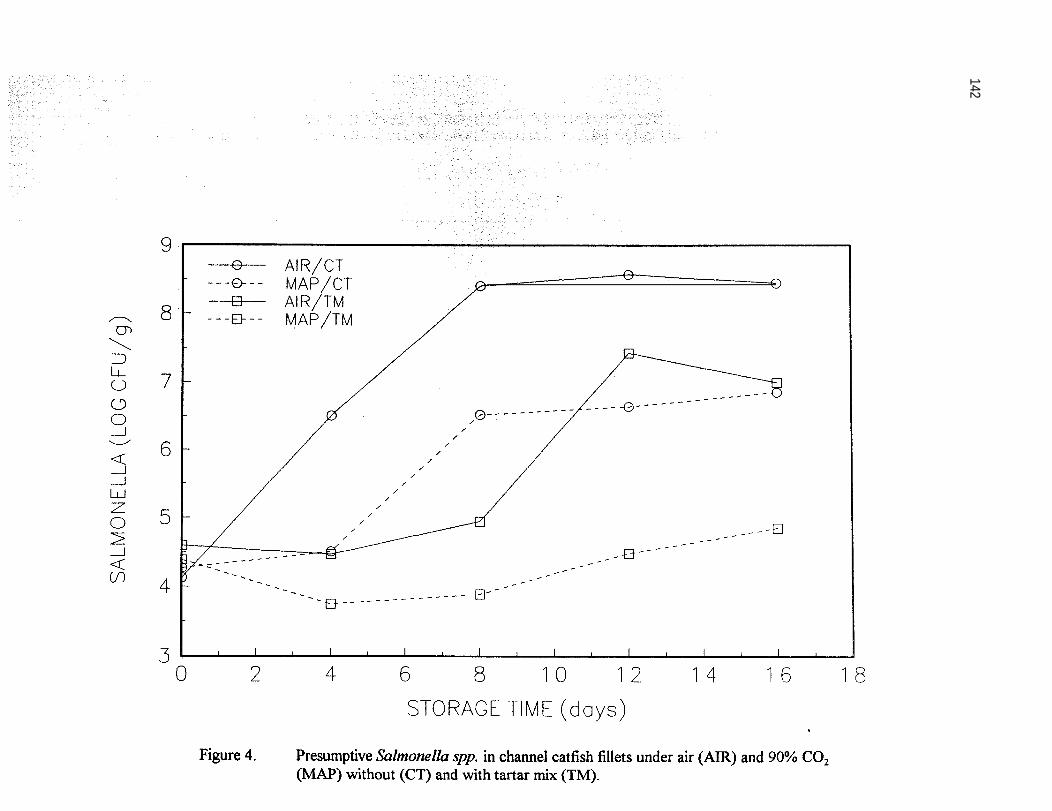
142
\\\\\\\\\El,I1I!1,,,II\\\ilIIII/IIII/
CDco
r-CD
u-ld-
m
(6/n~3301)vll3NOlnil~S
143
Salmonella spp. lag phase was extended in CC fillets with tartar mix packed under AIR(Figure 4). Growth was inhibited for 8 d at 10°C. In combination with MAP, tartar mix wasbacteriostatic to Salmonella spp. for 16 d in fish held at 10°C.
CONCLUSIONS
It is necessary to combine MAP with very low refrigeration temperatures (-O°C) to beeffective in delaying growth of L. monocytogenes in CC fillets.Abuse temperatures may increase therate of growth of L. monocytogenes in CC fillets under MAP. Salmonella spp. growth is inhibitedby MAP even at 10°C but some growth may still occur. Addition of a fish marinade containingspices, essential oils and organic acids will extend lag phase of L. monocytogenes in MAP CC filletsat 10°C. Thus, the use of a marinade with antimicrobials may inhibit the growth of L. monocytogenesin CC fillets refrigerated at low temperatures.
ACKNOWLEDGMENTS
This work was partially funded by USDA Food Safety Grant #58-6202-0-001. Thanks to Ms.Donna Bland for her patience and work in the manuscript.
REFERENCES
1.
2.
3.
4.
5.
6.
7.
BENSON, II. J. 1985. Microbiological Applications: A Laboratory Manual in GeneralMicrobiology. 4th ed. Wm. C. Brown Pub., Dubuque, IA.
BRODY, A. L. 1989. Controlled/Modified Atmosphere Vacuum Packaging of Foods.Food and Nutrition Press, Trumbull, CT.
BUTTAIOX, R. 1962. Salmonella problems in the sea. In: Borgstrom, G. (ed.), Fish asFood, Vol. 2, p. 503. Academic Press, NY.
CONNER, D. E. and L. R. BEAUCHAT. 1984. Effects of essential oils from plantson growth of food spoilage yeasts. J. Food Sci. 49:429-434.
FARBER, J. M. 1991. Listeria monocytogenes in fish products. J. Food Prot. 54:922-924,934.
GLASS, K. A and M. P. DOYLE. 1989. Fate of Listeria monocytogenes in processed meatproducts during refrigerated storage. Appl. Environ. Microbiol. 55: 1565-l569.
HANDUMRONGKUL, C. and J. L. SILVA. 1993. Aerobic counts, color and adeninenucleotide changes in CO2 packed refrigerated striped bass strips. J. Food Sci. Inpress.
144
8.
9.
10.
11.
12.
13.
14.
15.
16.
17.
HARRISON, M. A, Y. W. HUANG, C. H. CHAO and T. SHINEMAN. 1991. Fateof Listeria monocytogenes on packaged, refrigerated and frozen seafood. 54: 524-527.
LEUNG, C. K., Y. W. HUANG and 0. C. PANCORBO. 1992. Bacterial pathogensand indicators in catfish and environments. J. Food Prot. 55:424-427
PEDROSA-MENABRITO, A. and J. M. REGENSTEIN. 1988. Shelf-life extensionof fresh fish - A review. Part I - Spoilage of fish. J. Food Qual. 11: 117-127.
PRUTHI, J. S. 1980. Spices and Condiments: Chemistry, Microbiology Technology. AVI,Westport, CT.
RORVIK, L. M,, M. YNDESTAD and E. SKJERVE. 1991. Growth of Listeriamonocytogenes in vacuum-packed, smoked salmon during storage at 4°C. Intl. J.Food Microbiol. 14:111-118.
SHELEF, L. A. 1983. Antimicrobial effects of spices, J. Food Safety. 6:29-44.
SHELEF, L. A., O. A. NAGLIK and D. W. BOGEN 1980. Sensitivity of some commonfoodborne bacteria to the spices sage, rosemary and allspice. J. Food Sci. 45: 1042-1044.
SILLIKER J. H. and S. K. WOLFE. 1980. Microbiological safety considerationsin controlled atmosphere storage of meats. Food Technol. 34(3):59-62.
SILVA, J. L., E. HARKNESS and T. D. WHITE. 1993. Residual effect of CO2 onbacterial counts and surface pH of channel catfish. J. Food Prot. In press.
WHITE, T. D. 1993. The effects of modified atmosphere packaging and storagetemperature on total microbial counts, pH, color and some pathogens of refrigeratedcatfish strips. M. S. Thesis. Miss. State Univ.
Related Documents