Ioannis Fiamegkos, Beatriz de la Calle, Fernando Cordeiro, Håkan Emteborg, John Seghers, Hanne Leys, James Snell, Mitja Vahcic, Aneta Cizek-Stroh, and Piotr Robouch EURL-HM-20 Proficiency test Report Determination of total As, Cd, Pb, Hg and inorganic As in chocolate 2015 JRC 98502

Welcome message from author
This document is posted to help you gain knowledge. Please leave a comment to let me know what you think about it! Share it to your friends and learn new things together.
Transcript

Ioannis Fiamegkos, Beatriz de la Calle,
Fernando Cordeiro, Håkan Emteborg,
John Seghers, Hanne Leys, James Snell,
Mitja Vahcic, Aneta Cizek-Stroh, and
Piotr Robouch
EURL-HM-20 Proficiency test
Report
Determination of total As, Cd, Pb, Hg and inorganic As in chocolate
2015
JRC 98502

1
This publication is a Technical report by the Joint Research Centre, the European Commission’s in-house science
service. It aims to provide evidence-based scientific support to the European policy-making process. The scientific
output expressed does not imply a policy position of the European Commission. Neither the European
Commission nor any person acting on behalf of the Commission is responsible for the use which might be made
of this publication.
JRC Science Hub
https://ec.europa.eu/jrc
JRC 98502
© European Union, 2015
Reproduction is authorised provided the source is acknowledged.
All images © European Union 2015
2
Determination of total As, Cd, Pb, Hg and inorganic As in chocolate EURL-HM-20 Proficiency test Report
3
Table of contents
Executive summary ............................................................................................... 4 Acknowledgements ................................................................................................ 5
1. Introduction ................................................................................................... 6 2. Scope and aim ............................................................................................... 6 3. Set up of the exercise ..................................................................................... 7
3.1 Time frame ............................................................................................. 7 3.2 Confidentiality ......................................................................................... 7 3.3 Distribution ............................................................................................ 7 3.4 Instructions to participants ....................................................................... 7
4.Test item ........................................................................................................ 8 4.1 Preparation ............................................................................................. 8 4.2 Homogeneity and stability ........................................................................ 9
5. Assigned values and their uncertainties ............................................................. 9 5.1 Assigned value, Xref ................................................................................. 9 5.2 Associated uncertainty, uref ..................................................................... 10 5.3 Standard deviation of the proficiency test assessment, σ ............................ 11
6. Evaluation of results ..................................................................................... 13 6.1 Scores and evaluation criteria ................................................................. 13 6.2 General observations .......................................................................... 14 6.3 Laboratory results and scorings ............................................................... 15
6.3.1 Performances .................................................................................. 15 6.3.2 Analysis of the information extracted from the questionnaire ................ 17
Conclusion ....................................................................................................... 18 References ......................................................................................................... 19 List of abbreviations and definitions ....................................................................... 20 Annexes ............................................................................................................. 21
Annex 1: List of Participants .............................................................................. 22 Annex 2: JRC web announcement ....................................................................... 24 Annex 3: Invitation letter to NRLs....................................................................... 25 Annex 4: Invitation letter to European Collaboration for Accreditation (EA) .............. 26 Annex 5: Invitation letter to Asian Pacific Laboratory Accreditation Cooperation
(APLAC) .......................................................................................................... 27 Annex 6: Invitation letter to Inter-American Accreditation Cooperation (IAAC) ......... 28 Annex 7: Invitation letter to African Accreditation Cooperation (AFRAC) .................. 29 Annex 8: Test item accompanying letter .............................................................. 30 Annex 9: Confirmation of receipt form ................................................................ 31 Annex 10: Questionnaire ................................................................................... 32 Annex 11: Homogeneity and stability studies ....................................................... 34
11.1 Homogeneity studies (all values in mg kg-1)............................................... 34 11.2 Stability studies (all values in mg kg-1) ...................................................... 34
Annex 12: Results for total As ............................................................................ 35 Annex 13: Results for total Cd ........................................................................... 37 Annex 14: Results for total Pb ............................................................................ 39 Annex 15: Results for inorganic arsenic, iAs ......................................................... 41 Annex 16: Results for total Hg ........................................................................... 43 Annex 17: Experimental details .......................................................................... 44
4
Executive summary
The European Union Reference Laboratory for Heavy Metals in Feed and Food (EURL-HM)
organised a proficiency test (EURL-HM-20) for the determination of total As, Cd, Pb, Hg
and inorganic As (iAs) in chocolate in support to Commission Regulation (EC) 1881/2006
setting maximum levels for certain contaminants in foodstuffs. This PT was open to
National Reference Laboratories (NRLs), official control laboratories (OCLs) and other
interested laboratories.
One hundred and six participants from 42 countries registered to the exercise. Only five
participants did not report results. Thirty two NRLs (out of the 33 that registered)
reported results.
The material used as test item was commercially available chocolate which, after
appropriate processing, was bottled, labelled and dispatched to the participants during
the first half of May 2015. Seven laboratories with demonstrated measurement
capabilities in the field provided results to establish the assigned values. The standard
uncertainties associated to the assigned values were calculated according to ISO Guide
35.
Laboratory results were rated using z- and zeta (ζ-) scores in accordance with ISO
13528:2005. The relative standard deviation for proficiency assessment was set to 19%
for total Cd, to 22 % for total As and Pb and to 25% for iAs. The expert laboratories
reported "less than" values for the total Hg mass fraction; therefore no scoring was
provided for this measurand.
All NRLs (100%) and 94 % of the other laboratories performed satisfactorily for the
determination of the total Cd mass fraction in chocolate demonstrating that the recently
amended European Regulation (EC) No 1881/2006 setting MLs for cadmium in cocoa and
chocolate can be implemented The percentage of satisfactory scores decreased to 61, 67
and 64%, (63, 77 and 78% for NRLs) due to the low mass fractions of total As, Pb and
iAs in the chocolate. Several laboratories reported "less than" values. Only 27% of the
participants (50% of the NRLs) reported results for iAs, half of which were "less than"
values.
In all cases, the percentage of satisfactory ζ-scores was lower than the corresponding
one for z-scores indicating that several laboratories should improve their estimate of
measurement uncertainty.
5
Acknowledgements
The authors wish to thank colleagues from the IRMM for their valuable contributions they
made during preparation and testing of the proficiency test matrix.
The hundred and one laboratories having participating in this exercise, listed in Annex 1,
are kindly acknowledged.

6
1. Introduction
Contamination with toxic elements is a global environmental and food safety concern.
The consumption of contaminated food leads to uptake of toxic elements by humans,
with the risk increasing proportionally with the quantity consumed. Heavy metal toxicity
can affect mental development and central nervous system function, alter the blood
composition and disturb the function of organs like kidneys, lungs and liver [1].
The European Food Safety Authority (EFSA) carried out in 2012 an in-depth evaluation of
the dietary exposure to cadmium (Cd) via different food commodities, over specific
groups of population [2]. Data indicated that high levels of Cd were found (among
others) in cocoa-based products. According to previous EFSA opinions published in 2009
and 2011 certain population groups (such as children, vegetarians and people living in
highly contaminated areas) can easily exceed by a factor of two the tolerable weekly Cd
intake of 2.5 μg kg-1 body weight. Cocoa powder and cocoa-based products are critical
food commodities, especially for children due to high consumption, their lower body
weight and their higher digestive absorption of metals. Following these findings, the
European Commission published an amendment to Regulation (EC) No 1881/2006
setting maximum levels (MLs) for certain contaminants in food, in order to include MLs
for Cd in cocoa and chocolate [3-5]. The following limits are effective from 1 January
2019:
0.10 mg kg-1 for milk chocolate with < 30 % total dry cocoa solids; 0.3 mg kg-1 for chocolate with < 50 % total dry cocoa solids; and milk chocolate
with ≥ 30 % total dry cocoa solids, and 0.8 mg kg-1 for chocolate with ≥ 50 % total dry cocoa solids.
The European Union Reference Laboratory for Heavy Metals in Feed and Food (EURL-HM)
organised the proficiency test (EURL-HM-20) to assess the performance of National
Reference Laboratories (NRLs) and other food control laboratories in the determination
of total arsenic (As), cadmium (Cd), lead (Pb), mercury (Hg) and inorganic Arsenic (iAs)
mass fractions in chocolate, as agreed with the Directorate General for Health and Food
Safety (DG SANTE) in the annual work programme of the EURL-HM. This report
summarises the outcome of this PT.
2. Scope and aim
As stated in Regulation (EC) No 882/2004 one of the core duties of the European Union
Reference Laboratories is to organise interlaboratory comparisons for the benefit of NRLs
[6].
The present proficiency test (PT) aims to assess the performance of NRLs and other
interested laboratories in the determination of total As, Cd, Pb, Hg and iAs mass
fractions in chocolate.
The assessment of measurement results follows the administrative and logistic
procedures of the EC-JRC-IRMM for the organisation of PTs which is accredited according
to ISO 17043:2010 [7].
This PT is identified as EURL-HM-20.

7
3. Set up of the exercise
3.1 Time frame
The organisation of the EUR-HM-20 exercise was agreed upon by the NRL network at the
8th EURL-HM Workshop held in Brussels on September 24, 2013. The exercise was
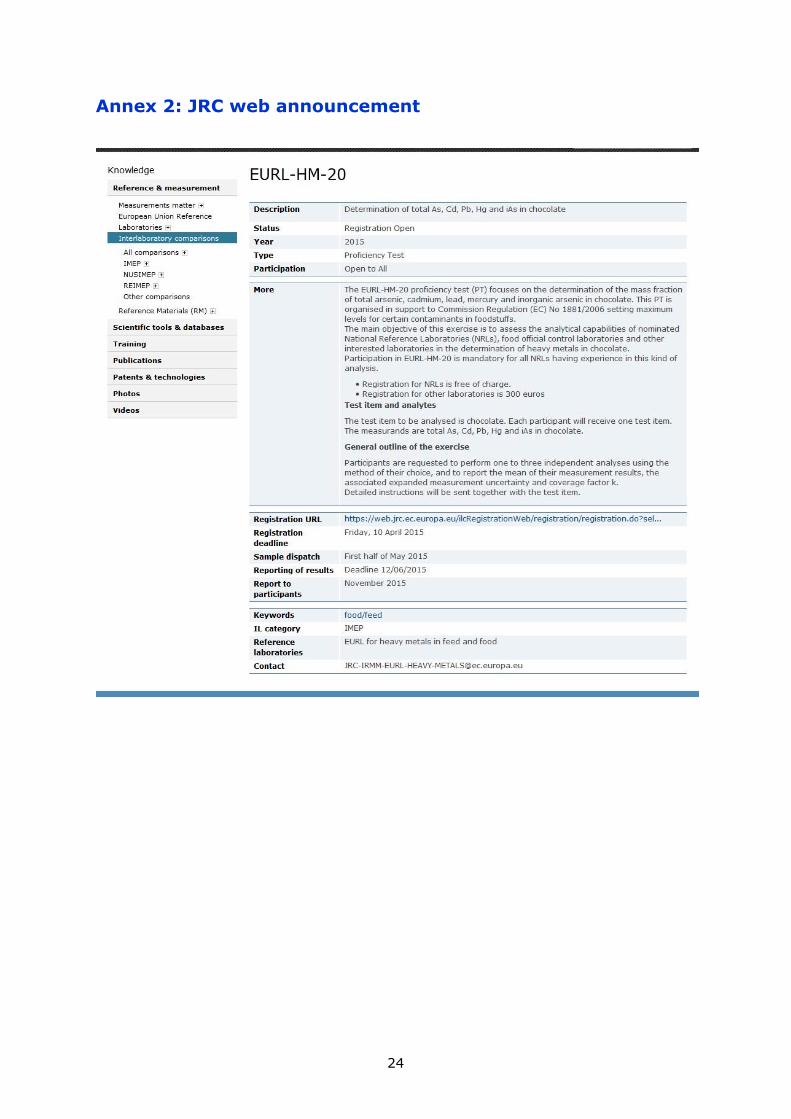
announced on the JRC webpage on February 25, 2015 (Annex 2). Invitation letters were
sent to NRLs as well as to the European Cooperation for Accreditation (EA), to the Asian
Pacific Laboratory Accreditation Cooperation (APLAC), to Inter-American Accreditation
Cooperation (IAAC) and to African Accreditation Cooperation (AFRAC) on March 4, 2015
(Annex 3-7). The registration deadline was set to April 10, 2015. The reporting deadline
was set to June 12, 2015. Dispatch was monitored by the PT coordinator using the
messenger's parcel tracking system on the internet.
3.2 Confidentiality
The following confidentiality statement was made to the EA, APLAC, IAAC and AFRAC:
"Confidentiality of the participants and their results towards third parties is guaranteed.
In the case of EA and NRLs having appointed OCLs to participate in the PT an additional
statement of disclosure was added (Annex 3,4): "The organisers will disclose to you the
details of the participants that have been nominates by you".
3.3 Distribution
Test items were dispatched to participants during the first half of May (4-13 May). Each
participant received:
One pack of six vials containing the test item (approx. 0.5 g / bottle);
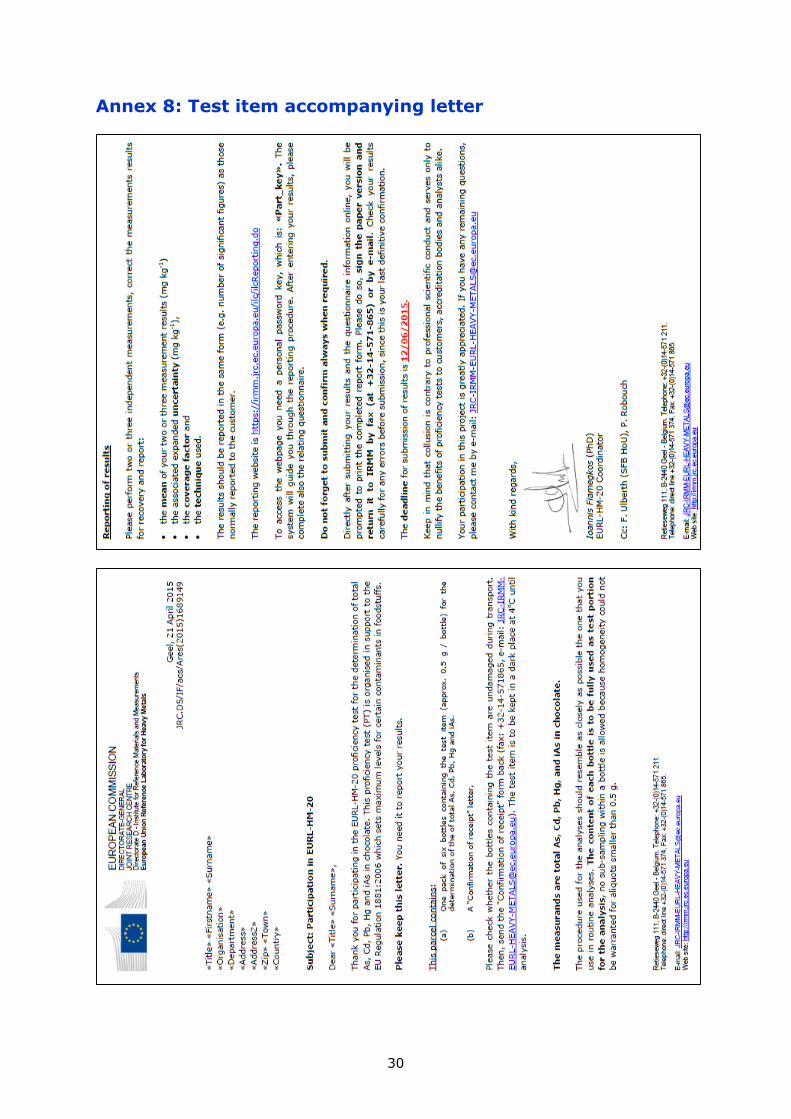
A "Test item accompanying letter" (Annex 8); and
A "Confirmation of receipt form" to be sent back to IRMM after receipt of
the test item (Annex 9).
3.4 Instructions to participants
Detailed instructions were given to participants in the "Test item accompanying letter"
mentioned above. Measurands were defined as "the mass fractions of total As, Cd, Pb,
Hg and iAs in chocolate".
Participants were asked to perform two or three independent measurements, to report
their calculated mean (Xlab) and the associated expanded measurement uncertainty
(Ulab).
Participants received an individual code to access the on-line reporting interface, to
report their measurement results and to complete the related questionnaire. A dedicated
questionnaire was used to gather additional information related to measurements and
laboratories (Annex 9).
Participants were informed that the procedure used for the analysis should resemble as
closely as possible their routine procedures for this type of matrix/analytes and
concentration levels.
The laboratory codes were given randomly and communicated to the participants by
e-mail.

8
4.Test item
4.1 Preparation
Dark south-American chocolate (1kg of 64% cocoa content) was purchased in a local
market. Its origin and the batch number was clearly stated on the package. Chocolate
from four different batch numbers were screened for cadmium, lead and arsenic
contents using an Agilent 7500 series ICP-MS (Diegem, BE) after digestion. The batches
showed high content of cadmium and lower amounts of lead and arsenic. All results were
within the legal limits set by the amended European Regulation (EC) 1881:2006.
In order to provide test items that could be easily removed from their containers, it was
decided to supply single units of 0.5 g chocolate pellets in acid washed 10-mL vial. Six
vials were placed in an aluminised sachet, resulting in a kit of six pellets. At the time of
analysis, pellets were to be accurately weighed and placed directly in the proper
digestion vessel. Due to the relatively low mass of the pellets, the fat content and the
amount of other organic material were not expected to produce over-pressure conditions
during digestion with strong mineral acids. A total of 250 sachets (1,500 pellets) were
prepared for the EURL-HM-20 project.
The vials (10-mL) and rubber lyo-inserts were first acid washed for 30 minutes with
nitric acid 10 % in a three dimensional mixer (Dynamix CM-200, WAB, Basel, CH) and
subsequently rinsed with Type I water. Vials were then soaked in 10 % nitric acid for 24
h and rinsed three times with Type I water. Thereafter the glass vials and rubber inserts
were left to dry on acid washed nylon meshes placed in a clean cell, flushed with a HEPA
filtered air. The cleaned vials were then placed in plastic crates awaiting filling with the
chocolate pellets.
Having contacted the chocolate industry at Barry Callebaut Services, (Lebbeke-Wieze,
BE), it was decided to use polycarbonate moulds to produce the 0.5-g chocolate pellets.
Each mould consisted of 88 uniform volume pits where melted chocolate would solidify
into pellets. The necessary moulds were prepared by the IRMM workshop using
computerised milling equipment. The pits were made conical to simplify removal of the
pellets after cooling down.
For the production of pellets, IRMM processing staff assisted the industry experts. The
day before production the chocolate was melted using a Hermes JKV-30 equipment (JKV,
Gilze, NL) at 45 °C. The chocolate was allowed to recirculate over-night at about 5 L
min-1 in order to thoroughly homogenize the bulk. On the day of production the
temperature of chocolate was set to 32 °C (optimal temperature to work with dark
chocolate) and chocolate was allowed to recirculate for another 30 min. After the moulds
were filled, chocolate solidified in a fridge and was later transferred into properly labelled
polyethylene bags. All parts of the machine that were in contact with the chocolate were
made of AISI 304-grade stainless steel which is not expected to contaminate chocolate
with cadmium, lead or arsenic.
Finally, the plastic bags were emptied on an acid washed plastic tray and each pellet was
manually introduced into one vial using acid washed Teflon tweezers. All operations were
performed inside a clean cell flushed with HEPA filtered air. Once the vials were filled,
the rubber inserts were placed in the neck of the vial and placed in a Martin Christ
Epsilon 2-100D freeze dryer (Osterode, DE). Air was then removed from the freeze
drying chamber and replaced by argon. The shelves of the freeze dryer were used to
press down the inserts firmly into the necks of the vials resulting in chocolate pellets
sealed under oxygen free atmosphere. Subsequent capping and labelling according to fill
order took place using the Bausch und Ströbel (Ilshofen, DE) and BBK (Beerfelden, DE)
equipments.

9
4.2 Homogeneity and stability
Measurements for the homogeneity and stability studies were performed by the Centro
de Salud Pública de Alicante (CSPA, Alicante, Spain). Inductively coupled plasma mass
spectrometry (ICP-MS) was used, after microwave digestion (using 0.50 g of chocolate
sample and 5 ml of a mixture of HNO3/H2O2 1:1).
An elemental mercury analyser (EMA) was used to quantify the total Hg mass fraction,
using approximately 60 mg of chocolate per analysis.
The statistical treatment of data was performed by the EURL-HM.
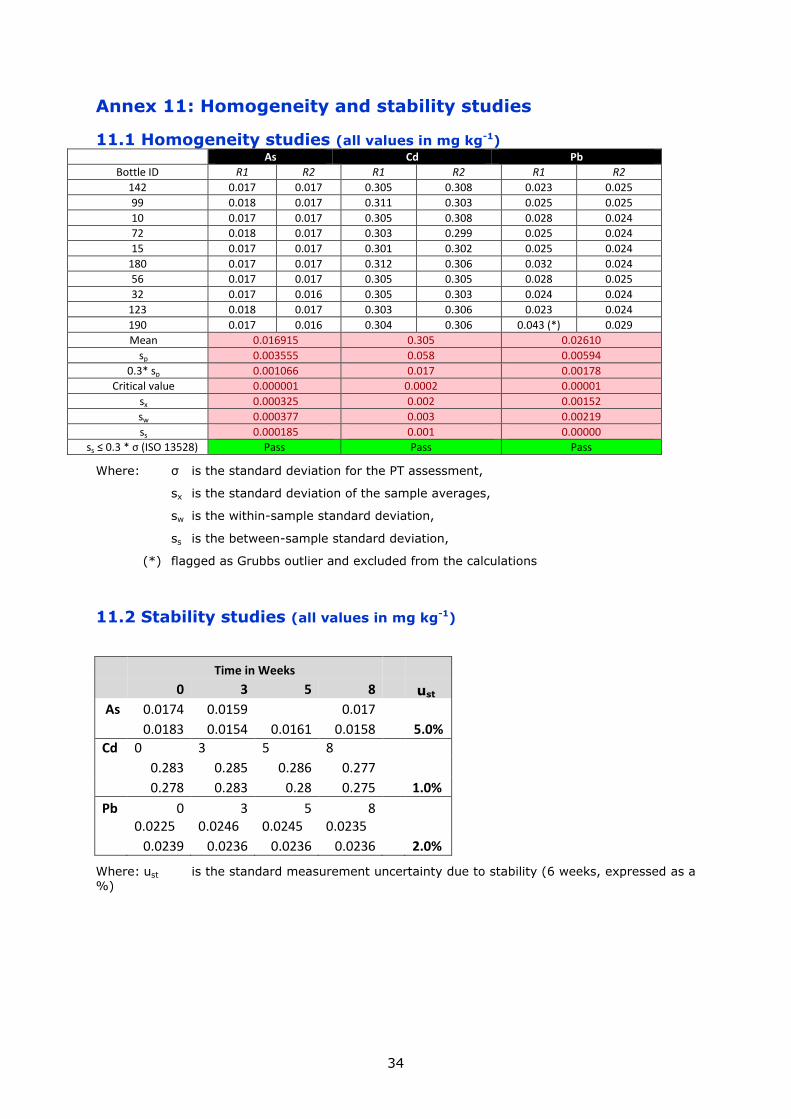
Homogeneity was evaluated according to ISO 13528:2005 [8]. The test item proved to
be adequately homogeneous for all the investigated measurands.
The stability study was conducted applying the isochronous design [9, 10]. The test item
proved to be adequately stable for all measurands at 18oC during the 6 weeks that
elapsed between the dispatch of the samples and the deadline for reporting.
From previous experience (IMEP-107, IMEP-118), it was assumed that the homogeneity
and stability of the total As mass fraction are representative of those of iAs.
The contribution from homogeneity (ubb) and stability (ust) to the standard measurement
uncertainty of the assigned value (uref) was calculated using SoftCRM [11]. The
analytical results reported by the expert laboratories and the statistical evaluation of the
homogeneity and stability studies are presented in Table 1 and in Annex 10.
5. Assigned values and their uncertainties
5.1 Assigned value, Xref
The assigned values for the five measurands (total As, Cd, Pb, Hg and iAs in chocolate)
were determined by seven laboratories, all selected on the basis of on their
demonstrated measurement capabilities (later referred to as expert laboratories):
ALS Scandinavia AB (Luleå, Sweden);
SCK-CEN - Studiecentrum voor Kernenergie (Mol, Belgium);
Umweltbundesamt GmbH (Vienna, Austria);
CSPA - Centro de Salud Pública de Alicante (Alicante, Spain);
VITO - Vlaamse Instelling voor Technologisch Onderzoek (Mol, Belgium);
IRMM – Institute for Reference Materials and Measurements (Geel, Belgium); and
Institut für Chemie, Bereich Analytische Chemie, University of Graz (Graz,
Austria)
Expert laboratories were asked to use the method of analysis of their choice and no
further requirements were imposed regarding methodology. They were also requested to
report their results together with the associated expanded measurement uncertainty and
with a clear and detailed description on how their measurement uncertainty was
calculated. However, they were not required to report values for all measurands.
ALS Scandinavia used inductively coupled plasma sector field mass spectrometry
(ICP-SFMS) after closed microwave digestion of the sample (approx.. 0.5 g in
closed Teflon containers) using HNO3, H2O2 and HF. Analyses were made
according to the modified EPA 200.8 method. ALS reported results for the total
As, Cd, Pb and Hg mass fractions.
10
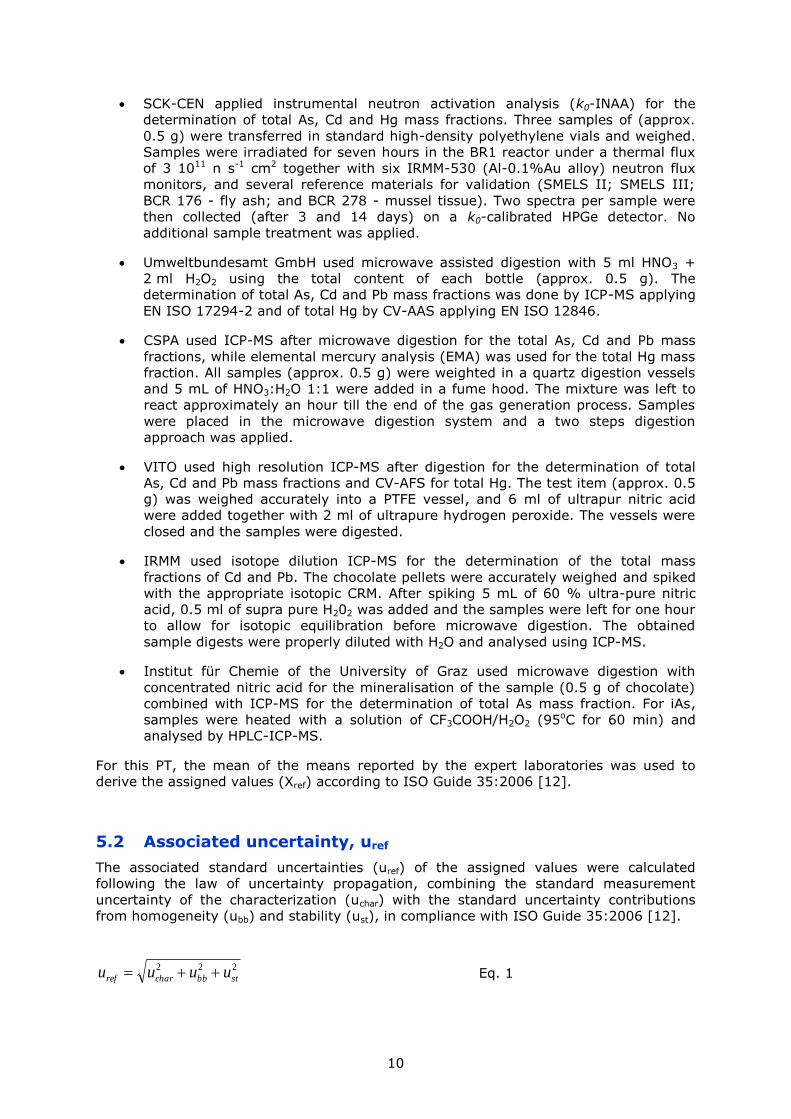
SCK-CEN applied instrumental neutron activation analysis (k0-INAA) for the
determination of total As, Cd and Hg mass fractions. Three samples of (approx.
0.5 g) were transferred in standard high-density polyethylene vials and weighed.
Samples were irradiated for seven hours in the BR1 reactor under a thermal flux
of 3 1011 n s-1 cm2 together with six IRMM-530 (Al-0.1%Au alloy) neutron flux
monitors, and several reference materials for validation (SMELS II; SMELS III;
BCR 176 - fly ash; and BCR 278 - mussel tissue). Two spectra per sample were
then collected (after 3 and 14 days) on a k0-calibrated HPGe detector. No
additional sample treatment was applied.
Umweltbundesamt GmbH used microwave assisted digestion with 5 ml HNO3 +
2 ml H2O2 using the total content of each bottle (approx. 0.5 g). The
determination of total As, Cd and Pb mass fractions was done by ICP-MS applying
EN ISO 17294-2 and of total Hg by CV-AAS applying EN ISO 12846.
CSPA used ICP-MS after microwave digestion for the total As, Cd and Pb mass
fractions, while elemental mercury analysis (EMA) was used for the total Hg mass
fraction. All samples (approx. 0.5 g) were weighted in a quartz digestion vessels
and 5 mL of HNO3:H2O 1:1 were added in a fume hood. The mixture was left to
react approximately an hour till the end of the gas generation process. Samples
were placed in the microwave digestion system and a two steps digestion
approach was applied.
VITO used high resolution ICP-MS after digestion for the determination of total
As, Cd and Pb mass fractions and CV-AFS for total Hg. The test item (approx. 0.5
g) was weighed accurately into a PTFE vessel, and 6 ml of ultrapur nitric acid
were added together with 2 ml of ultrapure hydrogen peroxide. The vessels were
closed and the samples were digested.
IRMM used isotope dilution ICP-MS for the determination of the total mass
fractions of Cd and Pb. The chocolate pellets were accurately weighed and spiked
with the appropriate isotopic CRM. After spiking 5 mL of 60 % ultra-pure nitric
acid, 0.5 ml of supra pure H202 was added and the samples were left for one hour
to allow for isotopic equilibration before microwave digestion. The obtained
sample digests were properly diluted with H2O and analysed using ICP-MS.
Institut für Chemie of the University of Graz used microwave digestion with
concentrated nitric acid for the mineralisation of the sample (0.5 g of chocolate)
combined with ICP-MS for the determination of total As mass fraction. For iAs,
samples were heated with a solution of CF3COOH/H2O2 (95oC for 60 min) and
analysed by HPLC-ICP-MS.
For this PT, the mean of the means reported by the expert laboratories was used to
derive the assigned values (Xref) according to ISO Guide 35:2006 [12].
5.2 Associated uncertainty, uref
The associated standard uncertainties (uref) of the assigned values were calculated
following the law of uncertainty propagation, combining the standard measurement
uncertainty of the characterization (uchar) with the standard uncertainty contributions
from homogeneity (ubb) and stability (ust), in compliance with ISO Guide 35:2006 [12].
222
stbbcharref uuuu Eq. 1

11
In all cases expert laboratories reported values with overlapping expanded measurement
uncertainties (Table 1 and Figure 1), hence uchar was calculated according to ISO
13528:2005 [8]:
p
ichar up
u1
225.1 Eq. 2
where p is the number of expert laboratories used to assign the reference value; and ui
is the standard measurement uncertainty reported by the experts.
For iAs, results were requested from one expert laboratory only; his measurement
uncertainty was used to set the corresponding uchar.
Table 1 presents the average measurement values reported by the expert laboratories
and their associated expanded measurement uncertainties; the assigned values (Xref, uref
and Uref); all standard measurement uncertainty contributions (uchar, ubb, ust); and the
standard deviation for the PT assessment (σ).
5.3 Standard deviation of the proficiency test assessment, σ
The relative standard deviation for PT assessment (σ, in %) was derived from the
Horwitz equation modified by Thompson [13] and was set to 19 % for total Cd, 22 % for
total As and Pb. Since the mass fraction of iAs in the test item was low , the scientific
board of the PT has set the σ to 25% for iAs.
For total Hg mass fractions all expert laboratories stated that their measurement results
were below their limit of quantification; therefore the performance of participants for
total Hg determination was not scored.

12
Table 1 – Average measurement values reported by the expert laboratories, assigned values, their associated expanded measurement uncertainties and the standard deviation for the PT assessment (all values in mg kg-1).
tot-As tot-Cd tot-Pb tot-Hg iAs
Expert 1 0.0175 ± 0.0023 0.274 ± 0.008 0.0255 ± 0.0013 <0.005
Expert 2 0.01552 ± 0.0024 0.347 ± 0.06 <0.030
Expert 3 0.0163 ± 0.002 0.302 ± 0.042 0.0242 ± 0.003 <0.010
Expert 4 0.015 ± 0.0018 0.0114 ± 0.0028
Expert 5 0.01647 ± 0.0013 0.286 ± 0.02 0.0325 ± 0.0061 <0.001
Expert 6 0.3017 ± 0.0046 0.02391 ± 0.00061
Expert 7 <0.040 0.31 ± 0.061 0.029 ± 0.006
XRef 0.0162 0.303 0.0270 0.0114
uchar 0.0006 0.010 0.0011 0.0014
uhom 0.0002 0.002 0.0012 0.0002
ust 0.0008 0.003 0.0005 0.0006
uref 0.0010 0.011 0.0017 0.0015
Uref (*) 0.0020 0.021 0.0030 0.0030
σ 0.0040 0.058 0.0060 0.0029
σ (%) 22.0% 19.0% 22.0% 25.0%
Xref is the assigned value; Uref= k·uref is the estimated associated expanded uncertainty; (*)k=2 coverage factor corresponding to a level of confidence of about 95 %.
Note: Expert laboratories do not correspond to the order they are presented in the text.
Figure 1: The assigned values of the PT for the chocolate test item. The rhombuses represent the reported values from the expert laboratories (± Ucert); Black solid line represents the assigned value (Xref); the red dashed lines represent the expanded assigned uncertainty interval (Xref ± Uref).

13
6. Evaluation of results
6.1 Scores and evaluation criteria
Individual laboratory performance was expressed in terms of z- and -scores in
accordance with ISO 13528:2005 [8]:
z = σ
refXx lab Eq. 3
22
labref
lab
uu
refXx
Eq. 4
where: xlab is the measurement result reported by a participant;
ulab is the standard measurement uncertainty reported by a participant;
Xref is the assigned value;
uref is the standard measurement uncertainty of the assigned value;
σ is the standard deviation for proficiency test assessment.
The interpretation of the z- and ζ-score is done according ISO 17043:2010 [7]:
|score| ≤ 2 satisfactory performance (green in Annexes 11 to 15)
2 < |score| < 3 questionable performance (yellow in Annexes 11 to 15)
|score| ≥ 3 unsatisfactory performance (red in Annexes 11 to 15)
The z-score compares the participant's deviation from the assigned value with the
standard deviation for proficiency test assessment (σ) used as common quality criterion.
The ζ-score states whether the laboratory's result agrees with the assigned value within
the respective uncertainty. The denominator is the combined uncertainty of the assigned
value (uref) and the measurement uncertainty as stated by the laboratory (ulab). The
ζ-score includes all parts of a measurement result, namely the expected value (assigned
value), its measurement uncertainty in the unit of the result as well as the uncertainty of
the reported values. An unsatisfactory ζ-score can either be caused by an inappropriate
estimation of the concentration, or of its measurement uncertainty, or both.
The standard measurement uncertainty of the laboratory (ulab) was obtained by dividing
the reported expanded measurement uncertainty by the reported coverage factor, k.
When no uncertainty was reported, it was set to zero (ulab = 0). When k was not
specified, the reported expanded measurement uncertainty was considered as the half-
width of a rectangular distribution; ulab was then calculated by dividing this half-width by
√3, as recommended by Eurachem and CITAC [14].
Uncertainty estimation is not trivial, therefore an additional assessment was provided to
each laboratory reporting measurement uncertainty, indicating how reasonable their
measurement uncertainty estimation was.
The standard measurement uncertainty from the laboratory (ulab) is most likely to fall in
a range between a minimum and a maximum allowed uncertainty (Case "a":
umin ≤ ulab≤ umax). The minimum allowed uncertainty (umin) is set to the standard
uncertainties of the assigned values (uref). It is unlikely that a laboratory carrying out the
analysis on a routine basis would determine the measurand with a smaller measurement

14
uncertainty than the expert laboratories chosen to establish the assigned value. The
maximum allowed uncertainty is set to the standard deviation accepted for the PT
assessment (σ). Consequently, Case "a" becomes: uref ≤ ulab≤ σ.
If ulab is smaller than uref (Case "b": ulab<uref) the laboratory may have underestimated
its measurement uncertainty. Such a statement has to be taken with care as each
laboratory reported only measurement uncertainty, whereas the uncertainty associated
with the assigned value also includes contributions for homogeneity and stability of the
test item. If those are large, measurement uncertainties smaller than uref are possible
and plausible.
If ulab is larger than σ (Case "c": ulab>σ) the laboratory may have overestimated its
measurement uncertainty. An evaluation of this statement can be made when looking at
the difference between the reported value and the assigned value: if the difference is
smaller than Uref then overestimation is likely. If the difference is larger but xlab agrees
with Xref within their respective expanded measurement uncertainties, then the
measurement uncertainty is properly assessed resulting in a satisfactory performance
expressed as a ζ-score, though the corresponding performance, expressed as a z-score,
may be questionable or unsatisfactory.
It should be pointed out that umax is a normative criterion when set by legislation.
6.2 General observations
One hundred and six participants from 42 countries of which 33 NRLs, registered to the
exercise (Fig 2). The Estonian and Luxemburg NRLs did not participate in the PT. Five
laboratories did not report results
Figure 2: Countries having registered in EURL-HM-20 from the European Union and the rest of the
world. 106 laboratories registered of which 101 reported. The number of laboratories that did not return results is indicated in parentheses.
EU countries Non-EU countries
15
6.3 Laboratory results and scorings
6.3.1 Performances
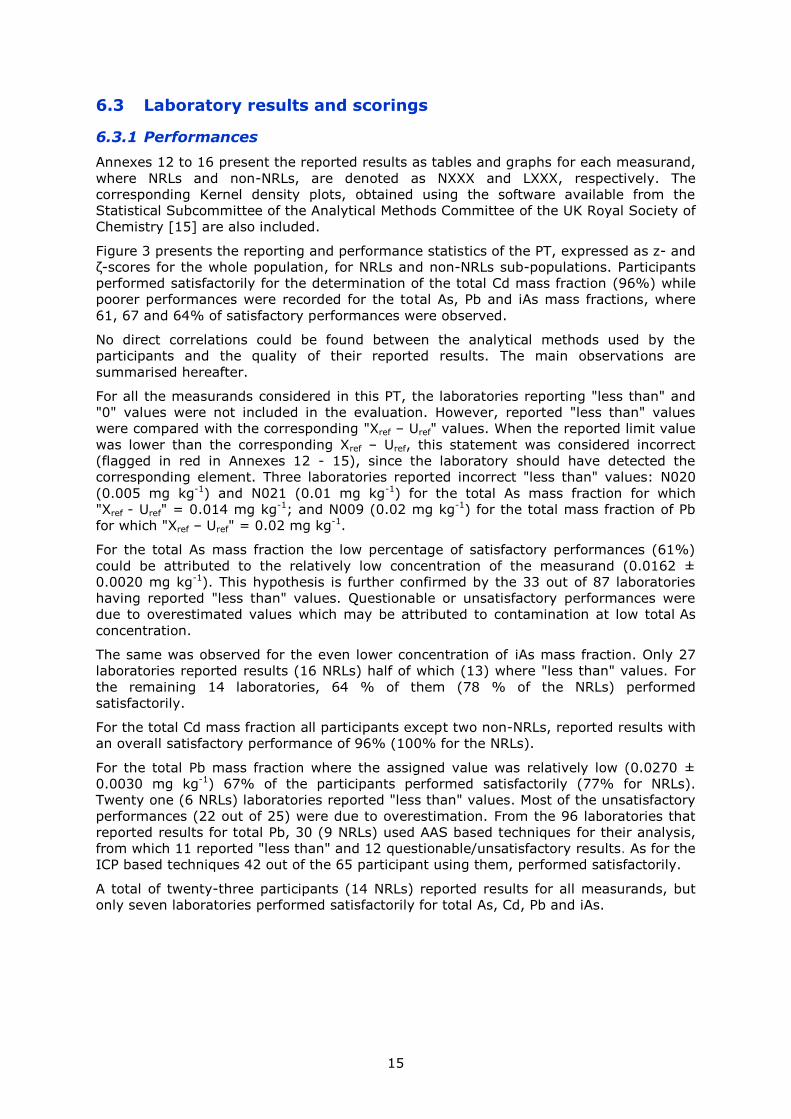
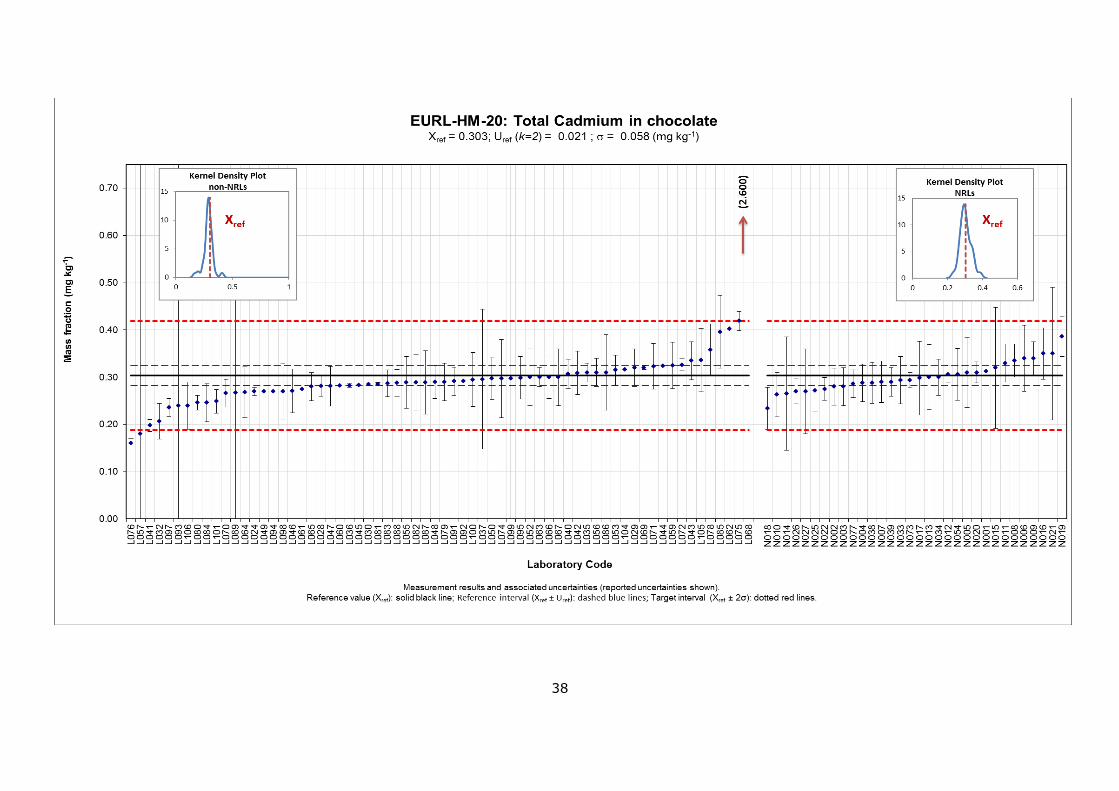
Annexes 12 to 16 present the reported results as tables and graphs for each measurand,
where NRLs and non-NRLs, are denoted as NXXX and LXXX, respectively. The
corresponding Kernel density plots, obtained using the software available from the
Statistical Subcommittee of the Analytical Methods Committee of the UK Royal Society of
Chemistry [15] are also included.
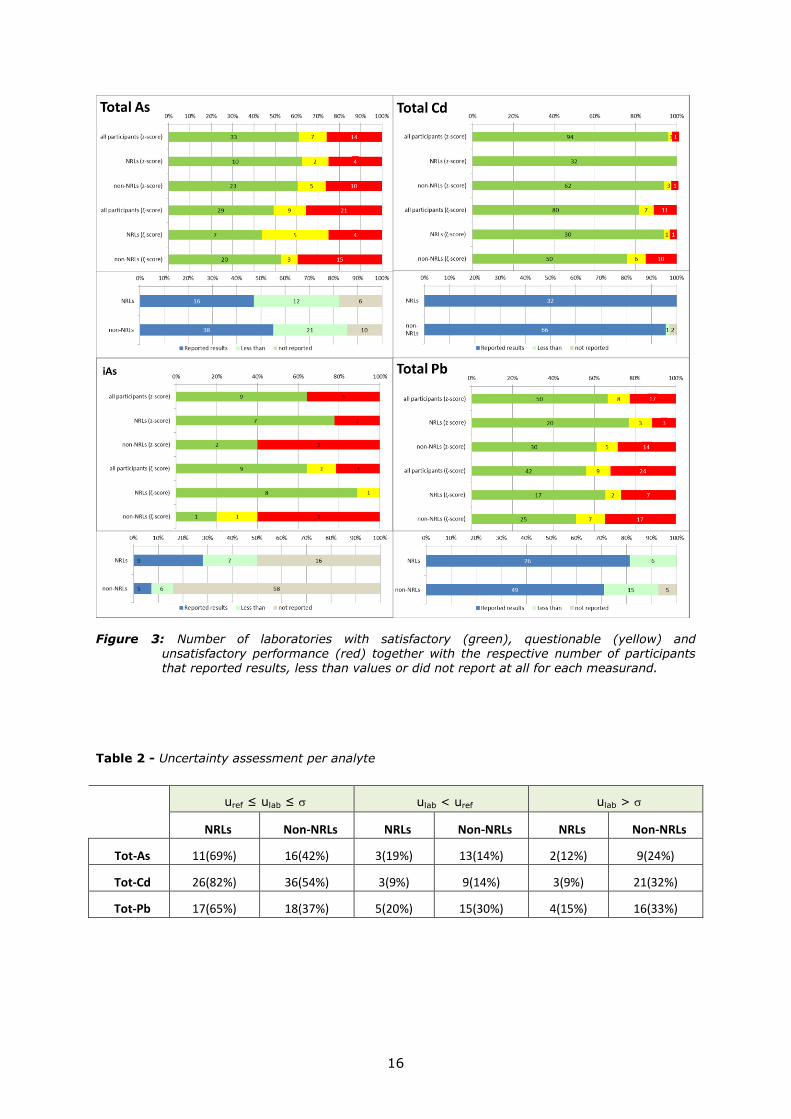
Figure 3 presents the reporting and performance statistics of the PT, expressed as z- and
ζ-scores for the whole population, for NRLs and non-NRLs sub-populations. Participants
performed satisfactorily for the determination of the total Cd mass fraction (96%) while
poorer performances were recorded for the total As, Pb and iAs mass fractions, where
61, 67 and 64% of satisfactory performances were observed.
No direct correlations could be found between the analytical methods used by the
participants and the quality of their reported results. The main observations are
summarised hereafter.
For all the measurands considered in this PT, the laboratories reporting "less than" and
"0" values were not included in the evaluation. However, reported "less than" values
were compared with the corresponding "Xref – Uref" values. When the reported limit value
was lower than the corresponding Xref – Uref, this statement was considered incorrect
(flagged in red in Annexes 12 - 15), since the laboratory should have detected the
corresponding element. Three laboratories reported incorrect "less than" values: Ν020
(0.005 mg kg-1) and N021 (0.01 mg kg-1) for the total As mass fraction for which
"Xref - Uref" = 0.014 mg kg-1; and N009 (0.02 mg kg-1) for the total mass fraction of Pb
for which "Xref – Uref" = 0.02 mg kg-1.
For the total As mass fraction the low percentage of satisfactory performances (61%)
could be attributed to the relatively low concentration of the measurand (0.0162 ±
0.0020 mg kg-1). This hypothesis is further confirmed by the 33 out of 87 laboratories
having reported "less than" values. Questionable or unsatisfactory performances were
due to overestimated values which may be attributed to contamination at low total As
concentration.
The same was observed for the even lower concentration of iAs mass fraction. Only 27
laboratories reported results (16 NRLs) half of which (13) where "less than" values. For
the remaining 14 laboratories, 64 % of them (78 % of the NRLs) performed
satisfactorily.
For the total Cd mass fraction all participants except two non-NRLs, reported results with
an overall satisfactory performance of 96% (100% for the NRLs).
For the total Pb mass fraction where the assigned value was relatively low (0.0270 ±
0.0030 mg kg-1) 67% of the participants performed satisfactorily (77% for NRLs).
Twenty one (6 NRLs) laboratories reported "less than" values. Most of the unsatisfactory
performances (22 out of 25) were due to overestimation. From the 96 laboratories that
reported results for total Pb, 30 (9 NRLs) used AAS based techniques for their analysis,
from which 11 reported "less than" and 12 questionable/unsatisfactory results. As for the
ICP based techniques 42 out of the 65 participant using them, performed satisfactorily.
A total of twenty-three participants (14 NRLs) reported results for all measurands, but
only seven laboratories performed satisfactorily for total As, Cd, Pb and iAs.
16
Figure 3: Number of laboratories with satisfactory (green), questionable (yellow) and unsatisfactory performance (red) together with the respective number of participants that reported results, less than values or did not report at all for each measurand.
Table 2 - Uncertainty assessment per analyte
uref ≤ ulab ≤ ulab < uref ulab >
NRLs Non-NRLs NRLs Non-NRLs NRLs Non-NRLs
Tot-As 11(69%) 16(42%) 3(19%) 13(14%) 2(12%) 9(24%)
Tot-Cd 26(82%) 36(54%) 3(9%) 9(14%) 3(9%) 21(32%)
Tot-Pb 17(65%) 18(37%) 5(20%) 15(30%) 4(15%) 16(33%)

17
For the total Hg mass fraction the expert laboratories reported "less than" values ranging
from 0.001 to 0.03 mg kg-1. However, Annex 15 shows that 41 participants (14 NRLs)
reported values for total Hg, from which only one was lower than 0.001 mg kg-1. In five
cases (L052, L059, L083, L102, N002, N027) the values reported were higher than 0.03
mg kg-1. Three laboratories (L052, L074 and N018) reported values lower than their
respective LODs.
In all cases, the percentage of satisfactory ζ-scores was lower than the corresponding
one for z-scores, indicating that that several laboratories should improve their estimate
of measurement uncertainty.
In general NRLs performed better than non-NRLs, not only in terms of z- and ζ- scores
but also for their reasonable measurement uncertainty statements. Most of the NRLs
reported realistic measurement uncertainties (case "a" uref ≤ ulab ≤ , cf. Table 2 and
Annexes 12-15): 69%/42% for total As; 82%/54% for total Cd; and 65%/37% for total
Pb (NRLs/non-NRLs). Table 2 does not include data for iAs due to the low number of
reported results.
6.3.2 Analysis of the information extracted from the questionnaire
The questionnaire was answered by 93 (out of 101) participants. Several approaches
were used to evaluate measurement uncertainties (Table 3). The majority of the NRLs
(30 out of 32) report uncertainty to their customers, 26 out of the 61 non-NRLs do the
same. A total of 152 out of 229 results were assessed with satisfactory ζ-score, from
which 87 corresponded to realistic uncertainty estimates (case "a"). 71% of the latter
were obtained by laboratories reporting regularly measurement uncertainty to their
customers.
Laboratories were asked to report the LODs of the methods used for the determination
of the six measurands. LODs, the respective techniques and the general experimental
conditions used are summarised in Annex 17. Large discrepancies in reported LODs are
observed even among laboratories using the same technique.
Sixty laboratories determined recovery factors for their analyses ranging from 25 to 132
%. NRLs reported recoveries in the range of 74 - 111 %. Laboratories that reported
recoveries lower than 80 % and higher than 120 % must be aware that such recoveries
indicate that the analytical method used is significantly biased and that corrective
actions should be undertaken. Several approaches for the determination of recovery
were used by the participants, as shown in Table 4.
Table 3 - Approaches used by the participants in EURL-HM-20 to estimate the uncertainty of their measurements. Multiple selections were possible.
Approach followed for uncertainty calculation Number of labs.
Uncertainty budget (ISO-GUM), validation 32
Known uncertainty of the standard method (ISO 21748) 2
Uncertainty of the method (in-house) 65
Measurement of replicates (precision) 31
Estimation based on judgment 2
Use of intercomparison data 17
Other: Calculation based on guidelines of NORDTEST: 1 lab Quantifying Uncertainty in Analytical Measurement-Eurachem: 1 lab
2

18
Table 4 - Methods applied by the laboratories to determine the recovery factors of the exercise. Multiple selections were possible.
How did you determine the recovery factor? Number of labs.
Adding a known amount of the same analyte to be measured (spiking) 42
Using a certified reference material 34
Other: - "Using internal standard or RM" 5
Seventy nine participants (30 NRLs) stated that they are accredited for one or more of
the investigated measurands, according to ISO/IEC 17025. Slightly better perfomances
were observed for the accredited laboratories (accredited/non-accredited): 70%/61% for
total As; 97%/84% for total Cd; 69%/57% for total Pb; and 57%/60% for iAs.
The majority of the laboratories (86) regularly take part in PTs.
No correlation between performance and experience (evaluated as number of analyses
per year) on the specific analysis could be identified for all measurands.
Conclusion
The overall performance of the participating laboratories on the determination of the
total mass fraction of Cd in the chocolate test items, was satisfactory. (96% for non-
NRLs, 100% for the NRLs). This clearly confirms the analytical capabilities of the
participating laboratories to enforce the newly amended European Regulation (EC) No
1881/2006 setting MLs for cadmium in cocoa and chocolate.
For low natural concentrations of total As, Pb and iAs (ranging from 0.011 to 0.027 mg
kg-1) the laboratories performed satisfactorily (from 61 to 67 %; from 63 to 89% for
NRLs). These concentrations were below the LODs of several laboratories. In the case of
iAs only 27% of the participants reported results.
In general NRLs performed better than non-NRLs, when referring to z- and ζ-scores as
well as for their reasonable measurement uncertainty statements. However, the
percentage of satisfactory ζ-scores was lower than the corresponding one for z-scores,
indicating that several laboratories should improve their estimate of measurement
uncertainty. Measurement uncertainty is of paramount importance in case of litigations
and the capability of control laboratories to estimate it correctly is a fundamental
requirement.
Another area of improvement relates to the proper determination and/or declaration of
limits of detection and quantification. Significant discrepancies were observed for the
LODs reported even for similar analytical methods, which may be attributed to the
confusion between the LOD of an analytical method and the instrumental LOD.
19
References
1. Hajeb, P., Sloth, J.J., Shakibazadeh, S., Mahyudin, N.A., and Afsah-Hejri, L.,
Toxic Elements in Food: Occurrence, Binding, and Reduction Approaches.
Comprehensive Reviews in Food Science and Food Safety, 2014. 13(4): p. 457-
472.
2. European Food Safety Authority, Cadmium dietary exposure in the European
population. . EFSA Journal 2012;10(1):2551., 2012. 10 (1): p. 37.
3. Commission Regulation, (EC) 1881/2006 setting maximum levels for certain
contaminants in foodstuffs, issued by the European Commission, . Official Journal
of the European Union, L364/5 (2006), 2006.
4. Commission Regulation, (EU) No 488/2014 of 12 May 2014 amending Regulation
(EC) No 1881/2006 as regards maximum levels of cadmium in foodstuffs. 2014.
5. Commission Recommendation, of 4 April 2014 on the reduction of the presence of
cadmium in foodstuffs. Official Journal of the European Union, 2014. L104/80.
6. Commission Regulation, (EC) No 882/2004 of the European Parliament and of the
Council of 29 April 2004 on official controls performed to ensure the verification of
compliance with feed and food law, animal health and animal welfare rules.
Official Journal of the European Union, 2004. L165/1.
7. ISO 17043:2010, Conformity assessment - General requirements for proficiency
testing. issued by ISO-Geneva (CH), International Organization for
Standardization., 2010.
8. ISO 13528:2005, "Statistical Methods for Use in Proficiency Testing by
Interlaboratory Comparisons", issued by ISO-Geneva (CH), International
Organization for Standardization. 2005.
9. Lamberty, A., Schimmel, H., and Pauwels, J., The study of the stability of
reference materials by isochronous measurements. Fresenius' Journal of
Analytical Chemistry, 1998. 360(3-4): p. 359-361.
10. Linsinger, T.P.J., Pauwels, J., Lamberty, A., Schimmel, H.G., Van Der Veen,
A.M.H., and Siekmann, L., Estimating the uncertainty of stability for matrix CRMs.
Analytical and Bioanalytical Chemistry, 2001. 370(2-3): p. 183-188.
11. Soft CRM, http://www.eie.gr/iopc/softcrm/index.html, (Accessed at date of
publication of this report).
12. ISO Guide 35, Reference Materials - general and statistical principles for
certification (2006), issued by ISO-Geneva (CH). 2006.
13. Thompson, M., Analyst, 2000. 125: p. 385-386.
14. Eurachem/CITAC, Quantifying Uncertainty in Analytical Measurement.
http://www.eurachem.org. 3rd Ed. 2012., 2000.
15. AMC/RSC, Representing data distributions with Kernel density estimates. Issued
by the Statistical Subcommittee of the Analytical Methods Committee (AMC) of
the Royal Society of Chemistry (RSC), AMC Technical Brief, 2006.

20
List of abbreviations and definitions
AMC Analytical Methods Committee of the Royal Society of Chemistry
BIPM Bureau International des Poids et Mesures
CITAC Co-operation for International Traceability in Analytical Chemistry
CONTAM Panel on Contaminants in the Food Chain
CV-AAS Cold Vapour Atomic Absorption Spectrometry
DG SANTE Directorate General for Health and Food Safety
EA European Co-operation for Accreditation
EFSA European Food Safety Authority
ETAAS Electrothermal atomic absorption spectrometry
EU European Union
EURACHEM A focus for Analytical Chemistry in Europe
EURL-HM European Union Reference Laboratory for Heavy Metals in Feed and Food
HG-AAS Hydride generation atomic absorption spectrometry
GUM Guide for the Expression of Uncertainty in Measurement
ID-ICP/MS Isotope dilution - inductively coupled plasma - mass spectrometry
ILC Interlaboratory Comparison
IRMM Institute for Reference Materials and Measurements
JRC Joint Research Centre
LOD Limit of detection
NAA Neutron Activation Analysis
NRL National Reference Laboratory
OCL Official Control Laboratory
PE Polyethylene
PT Proficiency Test

21
Annexes
22
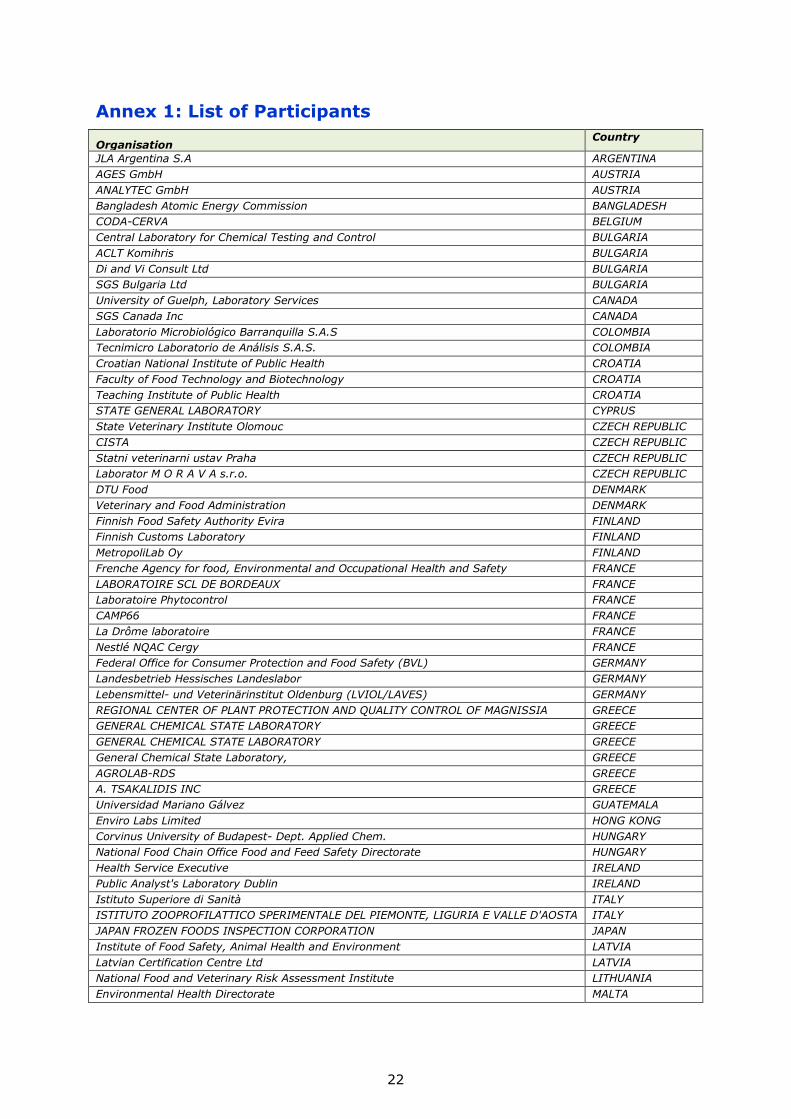
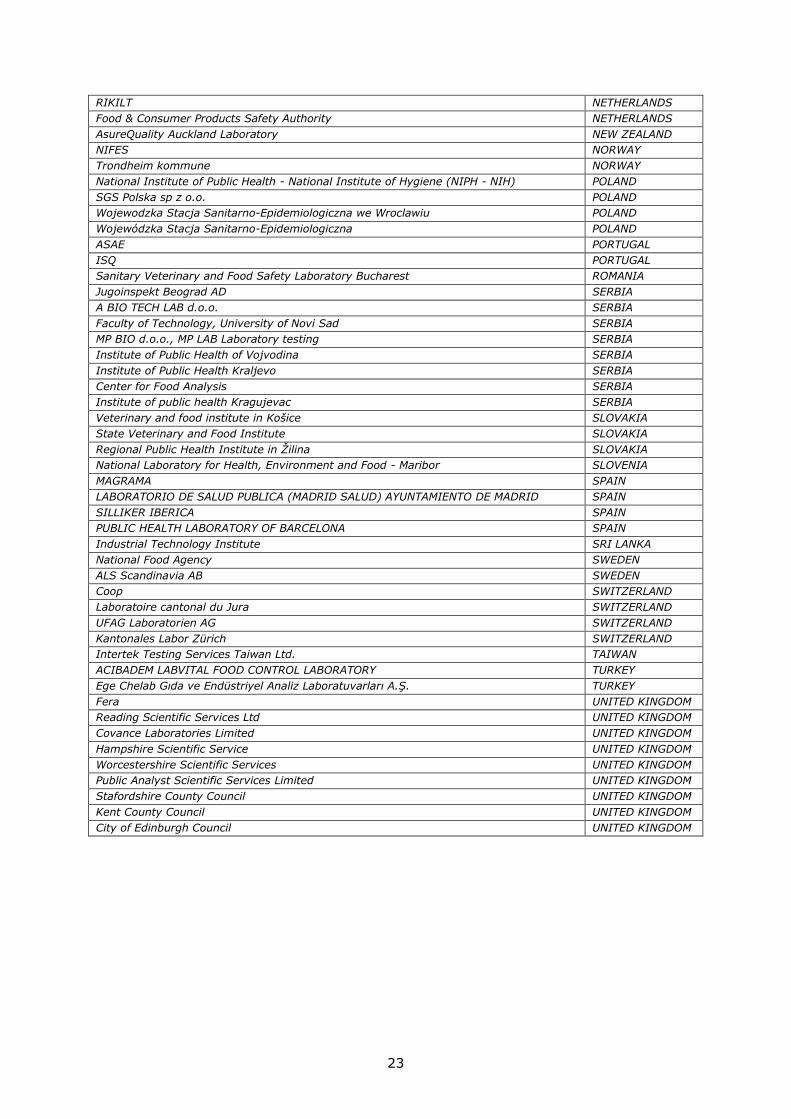
Annex 1: List of Participants
Organisation Country
JLA Argentina S.A ARGENTINA
AGES GmbH AUSTRIA
ANALYTEC GmbH AUSTRIA
Bangladesh Atomic Energy Commission BANGLADESH
CODA-CERVA BELGIUM
Central Laboratory for Chemical Testing and Control BULGARIA
ACLT Komihris BULGARIA
Di and Vi Consult Ltd BULGARIA
SGS Bulgaria Ltd BULGARIA
University of Guelph, Laboratory Services CANADA
SGS Canada Inc CANADA
Laboratorio Microbiológico Barranquilla S.A.S COLOMBIA
Tecnimicro Laboratorio de Análisis S.A.S. COLOMBIA
Croatian National Institute of Public Health CROATIA
Faculty of Food Technology and Biotechnology CROATIA
Teaching Institute of Public Health CROATIA
STATE GENERAL LABORATORY CYPRUS
State Veterinary Institute Olomouc CZECH REPUBLIC
CISTA CZECH REPUBLIC
Statni veterinarni ustav Praha CZECH REPUBLIC
Laborator M O R A V A s.r.o. CZECH REPUBLIC
DTU Food DENMARK
Veterinary and Food Administration DENMARK
Finnish Food Safety Authority Evira FINLAND
Finnish Customs Laboratory FINLAND
MetropoliLab Oy FINLAND
Frenche Agency for food, Environmental and Occupational Health and Safety FRANCE
LABORATOIRE SCL DE BORDEAUX FRANCE
Laboratoire Phytocontrol FRANCE
CAMP66 FRANCE
La Drôme laboratoire FRANCE
Nestlé NQAC Cergy FRANCE
Federal Office for Consumer Protection and Food Safety (BVL) GERMANY
Landesbetrieb Hessisches Landeslabor GERMANY
Lebensmittel- und Veterinärinstitut Oldenburg (LVIOL/LAVES) GERMANY
REGIONAL CENTER OF PLANT PROTECTION AND QUALITY CONTROL OF MAGNISSIA GREECE
GENERAL CHEMICAL STATE LABORATORY GREECE
GENERAL CHEMICAL STATE LABORATORY GREECE
General Chemical State Laboratory, GREECE
AGROLAB-RDS GREECE
A. TSAKALIDIS INC GREECE
Universidad Mariano Gálvez GUATEMALA
Enviro Labs Limited HONG KONG
Corvinus University of Budapest- Dept. Applied Chem. HUNGARY
National Food Chain Office Food and Feed Safety Directorate HUNGARY
Health Service Executive IRELAND
Public Analyst's Laboratory Dublin IRELAND
Istituto Superiore di Sanità ITALY
ISTITUTO ZOOPROFILATTICO SPERIMENTALE DEL PIEMONTE, LIGURIA E VALLE D'AOSTA ITALY
JAPAN FROZEN FOODS INSPECTION CORPORATION JAPAN
Institute of Food Safety, Animal Health and Environment LATVIA
Latvian Certification Centre Ltd LATVIA
National Food and Veterinary Risk Assessment Institute LITHUANIA
Environmental Health Directorate MALTA
23
RIKILT NETHERLANDS
Food & Consumer Products Safety Authority NETHERLANDS
AsureQuality Auckland Laboratory NEW ZEALAND
NIFES NORWAY
Trondheim kommune NORWAY
National Institute of Public Health - National Institute of Hygiene (NIPH - NIH) POLAND
SGS Polska sp z o.o. POLAND
Wojewodzka Stacja Sanitarno-Epidemiologiczna we Wroclawiu POLAND
Wojewódzka Stacja Sanitarno-Epidemiologiczna POLAND
ASAE PORTUGAL
ISQ PORTUGAL
Sanitary Veterinary and Food Safety Laboratory Bucharest ROMANIA
Jugoinspekt Beograd AD SERBIA
A BIO TECH LAB d.o.o. SERBIA
Faculty of Technology, University of Novi Sad SERBIA
MP BIO d.o.o., MP LAB Laboratory testing SERBIA
Institute of Public Health of Vojvodina SERBIA
Institute of Public Health Kraljevo SERBIA
Center for Food Analysis SERBIA
Institute of public health Kragujevac SERBIA
Veterinary and food institute in Košice SLOVAKIA
State Veterinary and Food Institute SLOVAKIA
Regional Public Health Institute in Žilina SLOVAKIA
National Laboratory for Health, Environment and Food - Maribor SLOVENIA
MAGRAMA SPAIN
LABORATORIO DE SALUD PUBLICA (MADRID SALUD) AYUNTAMIENTO DE MADRID SPAIN
SILLIKER IBERICA SPAIN
PUBLIC HEALTH LABORATORY OF BARCELONA SPAIN
Industrial Technology Institute SRI LANKA
National Food Agency SWEDEN
ALS Scandinavia AB SWEDEN
Coop SWITZERLAND
Laboratoire cantonal du Jura SWITZERLAND
UFAG Laboratorien AG SWITZERLAND
Kantonales Labor Zürich SWITZERLAND
Intertek Testing Services Taiwan Ltd. TAIWAN
ACIBADEM LABVITAL FOOD CONTROL LABORATORY TURKEY
Ege Chelab Gıda ve Endüstriyel Analiz Laboratuvarları A.Ş. TURKEY
Fera UNITED KINGDOM
Reading Scientific Services Ltd UNITED KINGDOM
Covance Laboratories Limited UNITED KINGDOM
Hampshire Scientific Service UNITED KINGDOM
Worcestershire Scientific Services UNITED KINGDOM
Public Analyst Scientific Services Limited UNITED KINGDOM
Stafordshire County Council UNITED KINGDOM
Kent County Council UNITED KINGDOM
City of Edinburgh Council UNITED KINGDOM
24
Annex 2: JRC web announcement

25
Annex 3: Invitation letter to NRLs

26
Annex 4: Invitation letter to European Collaboration for
Accreditation (EA)

27
Annex 5: Invitation letter to Asian Pacific Laboratory
Accreditation Cooperation (APLAC)

28
Annex 6: Invitation letter to Inter-American Accreditation
Cooperation (IAAC)

29
Annex 7: Invitation letter to African Accreditation
Cooperation (AFRAC)
30
Annex 8: Test item accompanying letter

31
Annex 9: Confirmation of receipt form

32
Annex 10: Questionnaire

33
34
Annex 11: Homogeneity and stability studies
11.1 Homogeneity studies (all values in mg kg-1)
As Cd Pb
Bottle ID R1 R2 R1 R2 R1 R2
142 0.017 0.017 0.305 0.308 0.023 0.025
99 0.018 0.017 0.311 0.303 0.025 0.025
10 0.017 0.017 0.305 0.308 0.028 0.024
72 0.018 0.017 0.303 0.299 0.025 0.024
15 0.017 0.017 0.301 0.302 0.025 0.024
180 0.017 0.017 0.312 0.306 0.032 0.024
56 0.017 0.017 0.305 0.305 0.028 0.025
32 0.017 0.016 0.305 0.303 0.024 0.024
123 0.018 0.017 0.303 0.306 0.023 0.024
190 0.017 0.016 0.304 0.306 0.043 (*) 0.029
Mean 0.016915 0.305 0.02610
sp 0.003555 0.058 0.00594
0.3* sp 0.001066 0.017 0.00178
Critical value 0.000001 0.0002 0.00001
sx 0.000325 0.002 0.00152
sw 0.000377 0.003 0.00219
ss 0.000185 0.001 0.00000
ss ≤ 0.3 * σ (ISO 13528) Pass Pass Pass
Where: σ is the standard deviation for the PT assessment,
sx is the standard deviation of the sample averages,
sw is the within-sample standard deviation,
ss is the between-sample standard deviation,
(*) flagged as Grubbs outlier and excluded from the calculations
11.2 Stability studies (all values in mg kg-1)
Time in Weeks
0 3 5 8
ust
As 0.0174 0.0159
0.017
0.0183 0.0154 0.0161 0.0158 5.0%
Cd 0 3 5 8
0.283 0.285 0.286 0.277
0.278 0.283 0.28 0.275 1.0%
Pb 0 3 5 8
0.0225 0.0246 0.0245 0.0235
0.0239 0.0236 0.0236 0.0236 2.0%
Where: ust is the standard measurement uncertainty due to stability (6 weeks, expressed as a %)

35
Annex 12: Results for total As
Assigned range: Xref = 0.016; Uref (k=2) = 0.002; σ = 0.004
(all values in mg kg-1)
Lab code Xlab Ulab Ka technique ulab z-scoreb ζ scoreb Uncert.c
N001 < 0.1000 v3 AAS
N002 < 0.0670 v3 AAS
N003 0.018 0.002 2 ICP-MS 0.001 0.52 1.3 b
N004 0.0392 0.0071 2 ICP-MS 0.0036 6.48 6.24 a
N005 0.022 0.004 2 ICP-MS 0.002 1.64 2.61 a
N007 0.0128 0.0042 2 ICP-MS 0.0021 -0.94 -1.44 a
N008 0.0126 0.0013 2 ICP-MS 0.0006 -1 -2.97 b
N009 < 0.1000 HG-AAS
N011 0.019 0.005 2 ICP-MS 0.0025 0.8 1.05 a
N012 0.044 0.004 2 ICP-MS 0.002 7.83 12.43 a
N013 0.016 0.005 2 ICP-MS 0.0025 -0.04 -0.06 a
N014 0.014 0.007 2 HG-AAS 0.0035 -0.61 -0.59 a
N015 0.018 0.0072 2 ICP-MS 0.0036 0.52 0.49 c
N016 < 0.0250 ICP-MS
N017 < 0.0200 ICP-MS
N018 0.0475 0.009 v3 ICP-MS 0.0052 8.82 5.91 c
N019 0.0259 0.007 2 ETAAS 0.0035 2.74 2.67 a
N020 < 0.0050 ICP-MS
N021 < 0.0100 ICP-MS
N022 0.026 0.004 2 ICP-MS 0.002 2.77 4.39 a
N025 < 0.0750 HG-AAS
N026 < 0.2000 ICP-MS
N027 < 0.0200 ICP-MS
N033 0.015 0.0026 2 ICP-MS 0.0013 -0.33 -0.7 a
N034 < 0.0400 AAS
N038 < 0.0300 ICP-MS
N073 0.022 0.004 2 ICP-MS 0.002 1.64 2.61 a
N077 0.045 0.02 2 ICP-MS 0.01 8.11 2.87 c
L029 < 0.0300 ICP-MS
L030 0.0167 ICP-MS 0 0.15 0.54 b
L032 < 0.1000 ICP-OES
L035 0.26 0.07 2 ICP-MS 0.035 68.6 6.96 c
L036 0.2024 0.0023 2 ICP-OES 0.0012 52.39 120.89 a
L037 0.028 0.014 2 ICP-MS 0.007 3.33 1.67 c
L040 0.022 0.002 v3 ICP-MS 0.0012 1.64 3.81 a
L041 < 0.0280 2 AAS-GF
L042 0.022 0.004 2 ICP-MS 0.002 1.64 2.61 a
L044 0.0172 20 2 ICP-MS 10 0.29 0 c
L045 0.075 H-AAS 0 16.55 58.38 b
L046 0.021 0.003 2 ICP-MS 0.0015 1.36 2.68 a
L047 0.017 0.003 2 FIAS. 0.0015 0.24 0.47 a
L049 < 0.0400 2.94 ICP-MS
L050 < 0.0500 ICP-MS
L051 < 2.5000 ICP-OES
L052 0.03 0.002 0 HG-AAS 0.5 3.89 0.03 c
L053 0.089 0.02 2 HG-AAS 0.01 20.49 7.25 c
Lab code Xlab Ulab Ka technique ulab z-scoreb ζ scoreb Uncert.c
L055 < 1.0000 ICP-OES
L056 < 0.2400 HG-AAS
L057 0.02 16 2 AAS-VGA 8 1.08 0 c
L059 0.021 0.005 2 ICP-MS 0.0025 1.36 1.8 a
L060 0.0255 v3 ICP-MS 0 2.63 9.27 b
L061 < 0.1000 ICP-MS
L063 < 0.1000 AAS
L065 < 0.0300 ICP-MS
L066 0.02 0.004 2 ICP-MS 0.002 1.08 1.72 a
L067 0.02 0.004 2 ICP-MS 0.002 1.08 1.72 a
L068 < 0.1000 ICP-MS
L069 0.024 0.004 v3 ICP-MS 0.0023 2 3.11 a
L071 0.017 0.003 2 SEM-ICP-MS 0.0015 0.24 0.47 a
L072 0.024 0.0157 2 ICP-MS 0.0078 2 0.99 c
L074 0.019 0.006 2 ICP-MS 0.003 0.8 0.9 a
L075 < 0.0700 HG-AAS
L076 0.2 0.01 2 ICP-OES 0.005 51.72 36.04 c
L078 < 0.2000 AAS
L079 < 0.5000 AAS
L080 0.014 0.002 2 ICP-MS 0.001 -0.61 -1.52 b
L081 0.0157 0.0007 1.96 HG-AAS 0.0004 -0.13 -0.43 b
L082 0.04 0.01 2 HG-AAS 0.005 6.71 4.67 c
L083 0.022 0.002 2 ICP-MS 0.001 1.64 4.11 b
L084 < 0.0200 HG-AAS
L085 < 0.1000 AAS
L086 0.02 0.01 2 ICP-MS 0.005 1.08 0.75 c
L087 0.031 0.007 2 ICP-MS 0.0035 4.18 4.07 a
L088 0.01 0.0015 2 HG-AAS 0.0008 -1.73 -4.9 b
L089 0.0252 0.245 2 ICP-MS 0.1225 2.54 0.07 c
L091 0.0105 0.0001 v3 ICP-MS 0.0001 -1.59 -5.6 b
L092 < 0.0200 ICP-MS
L094 < 0.0700 ICP-MS
L095 0.0142 0.0021 2 ICP-MS 0.0011 -0.55 -1.34 a
L097 0.016 0.01 2 HG-AAS 0.005 -0.04 -0.03 c
L099 < 0.0500 100 AAS
L100 0.015 0.003 2 ICP-OES 0.0015 -0.33 -0.64 a
L101 0.054 0.005 2 AFS 0.0025 10.65 14.04 a
L102 < 0.1000 HG-AAS
L104 0.022 v3 ICP-MS 0 1.64 5.8 b
L105 0.024 0.005 2 ICP-MS 0.0025 2 2.91 a
L106 0.02 0.01 2 ICP-MS 0.005 1.08 0.75 c
a √3 is set by the ILC coordinator when no expansion factor k is reported. The reported uncertainty was assumed to have a rectangular distribution with k=√3, bperformance: satisfactory, questionable, unsatisfactory,
ca : umin(uref) ≤ ulab ≤ umax(σ); b : ulab<umin; and c :ulab>umax

36

37
Annex 13: Results for total Cd Assigned range: Xref = 0.303; Uref (k=2) = 0.021; σ = 0.058
(all values in mg kg-1) Lab code Xlab Ulab Ka technique ulab z-scoreb ζ-scoreb Uncert.c
N001 0.313 AAS 0 0.17 0.89 b
N002 0.28 0.039 2 AAS 0.0195 -0.41 -1.05 a
N003 0.28 0.04 2 ICP-MS 0.02 -0.41 -1.03 a
N004 0.288 0.04 2 ICP-MS 0.02 -0.27 -0.68 a
N005 0.31 0.074 2 ICP-MS 0.037 0.11 0.17 a
N006 0.34 0.07 2 ICP-MS 0.035 0.63 1 a
N007 0.29 0.044 2 ICP-MS 0.022 -0.23 -0.55 a
N008 0.335 0.035 2 ICP-MS 0.0175 0.55 1.54 a
N009 0.34 0.035 2 AAS 0.0175 0.63 1.78 a
N010 0.263 0.047 2 GF-AAS 0.0235 -0.70 -1.57 a
N011 0.33 0.04 2 ICP-MS 0.02 0.46 1.17 a
N012 0.306 0.018 2 ICP-MS 0.009 0.04 0.18 b
N013 0.3 0.069 2 ICP-MS 0.0345 -0.06 -0.1 a
N014 0.265 0.12 2 ET-AAS 0.06 -0.67 -0.63 c
N015 0.32 0.128 2 ICP-MS 0.064 0.29 0.26 c
N016 0.35 0.054 2 ICP-MS 0.027 0.81 1.6 a
N017 0.298 0.078 2 ICP-MS 0.039 -0.09 -0.13 a
N018 0.2344 0.0445 v3 ICP-MS 0.0257 -1.2 -2.48 a
N019 0.386 0.042 2 ETAAS 0.021 1.43 3.5 a
N020 0.31 0.022 2 ICP-MS 0.011 0.11 0.43 a
N021 0.35 0.14 2 ICP-MS 0.07 0.81 0.66 c
N022 0.275 0.024 2 ICP-MS 0.012 -0.49 -1.77 a
N025 0.272 0.045 2 AAS 0.0225 -0.55 -1.26 a
N026 0.27 0.0265 2 ICP-MS 0.0132 -0.58 -1.96 a
N027 0.27 0.09 2 ICP-MS 0.045 -0.58 -0.72 a
N033 0.294 0.05 2 ICP-MS 0.025 -0.16 -0.35 a
N034 0.3 0.038 2 AAS 0.019 -0.06 -0.16 a
N038 0.288 0.043 2 ICP-MS 0.0215 -0.27 -0.64 a
N039 0.29 0.03 2 ICP-MS 0.015 -0.23 -0.73 a
N054 0.306 0.055 2 AAS 0.0275 0.04 0.09 a
N073 0.294 0.016 2 ICP-MS 0.008 -0.16 -0.71 b
N077 0.286 0.029 2 ICP-MS 0.0145 -0.30 -0.97 a
L024 0.27 0.0089 v3 GFAAS 0.0051 -0.58 -2.81 b
L028 0.281 0.021 2 AAS 0.0105 -0.39 -1.49 b
L029 0.32 0.04 2 ICP-MS 0.02 0.29 0.73 a
L030 0.285 ICP-MS 0 -0.32 -1.72 b
L032 0.207 0.038 v3 ICP-OES 0.0219 -1.67 -3.95 a
L035 0.31 0.02 2 ICP-MS 0.01 0.11 0.45 b
L036 0.2822 0.0036 2 ICP-OES 0.0018 -0.37 -1.95 b
L037 0.296 0.148 2 ICP-MS 0.074 -0.13 -0.1 c
L040 0.307 0.031 v3 ICP-MS 0.0179 0.06 0.17 a
L041 0.198 0.013 2 GF-AAS 0.0065 -1.83 -8.4 b
L042 0.309 0.046 2 ICP-MS 0.023 0.1 0.22 a
L043 0.335 0.04 v3 ICP-MS 0.0231 0.55 1.24 a
L044 0.324 20 2 ICP-MS 10 0.36 0.00 c
L045 0.283 GFAAS 0 -0.35 -1.9 b
L046 0.271 0.046 2 ICP-MS 0.023 -0.56 -1.28 a
L047 0.281 0.042 2 ET-AAS 0.021 -0.39 -0.95 a
Lab code Xlab Ulab Ka technique ulab z-scoreb ζ-scoreb Uncert.c
L048 0.29 0.035 2 AAS 0.0175 -0.23 -0.66 a
L049 0.27 7 3.5 ICP-MS 2 -0.58 -0.02 c
L050 0.297 0.044 2 ICP-MS 0.022 -0.11 -0.26 a
L051 < 0.5000 v3 ICP-OES
L052 0.3 0.06 0.12 GF-AAS 0.5 -0.06 -0.01 c
L053 0.315 0.032 2 AAS 0.016 0.2 0.6 a
L055 0.289 0.055 2 ICP-OES 0.0275 -0.25 -0.49 a
L056 0.31 0.03 v3 ICP-AES 0.0173 0.11 0.32 a
L057 0.18 17 2 AAS-GTA 8.5 -2.14 -0.01 c
L059 0.325 0.049 2 ICP-MS 0.0245 0.37 0.81 a
L060 0.282 ICP-MS 0 -0.37 -2 b
L061 0.275 ICP-MS 0 -0.49 -2.65 b
L062 0.402 CV-AAS 0 1.71 9.18 b
L063 0.3 0.02 2 AAS 0.01 -0.06 -0.24 b
L064 0.268 0.054 2 ET-AAS 0.027 -0.61 -1.22 a
L065 0.28 0.03 v3 ICP-MS 0.0173 -0.41 -1.15 a
L066 0.3 0.045 2 ICP-MS 0.0225 -0.06 -0.14 a
L067 0.3 0.06 2 ICP-MS 0.03 -0.06 -0.11 a
L068 2.6 0.3 v3 ICP-MS 0.1732 39.83 13.23 c
L069 0.32 0.004 v3 ICP-MS 0.0023 0.29 1.51 b
L070 0.2664 0.0293 2 GF-AAS 0.0146 -0.64 -2.04 a
L071 0.323 0.048 2 SEM-ICP-MS 0.024 0.34 0.74 a
L072 0.326 0.0126 2 ICP-MS 0.0063 0.39 1.81 b
L074 0.297 0.083 2 ICP-MS 0.0415 -0.11 -0.15 a
L075 0.419 0.02 2 ET-AAS 0.01 2 7.87 b
L076 0.16 0.01 2 ICP-OES 0.005 -2.49 -12.11 b
L078 0.358 0.055 2 AAS 0.0275 0.95 1.85 a
L079 0.29 0.04 2 AAS 0.02 -0.23 -0.59 a
L080 0.246 0.016 2 ICP-MS 0.008 -1 -4.29 b
L081 0.2853 0.0034 1.96 ICP-MS 0.0017 -0.31 -1.67 b
L082 0.289 0.059 2 FAAS 0.0295 -0.25 -0.46 a
L083 0.287 0.028 2 ICP-MS 0.014 -0.29 -0.93 a
L084 0.246 0.04 2 AAS 0.02 -1.00 -2.53 a
L085 0.396 0.077 2 AAS 0.0385 1.61 2.32 a
L086 0.31 0.08 2 ICP-MS 0.04 0.11 0.16 a
L087 0.289 0.067 2 ICP-MS 0.0335 -0.25 -0.41 a
L088 0.288 0.0288 2 ICP-MS 0.0144 -0.27 -0.86 a
L089 0.2676 0.282 2 ICP-MS 0.141 -0.62 -0.25 c
L091 0.2917 0.0297 v3 ICP-MS 0.0171 -0.2 -0.58 a
L092 0.292 ICP-MS 0 -0.2 -1.07 b
L093 0.24 0.6 2 FAAS 0.3 -1.1 -0.21 c
L094 0.27 ICP-MS 0 -0.58 -3.11 b
L095 0.2986 0.0448 2 ICP-MS 0.0224 -0.08 -0.2 a
L097 0.236 0.019 2 GF-AAS 0.0095 -1.17 -4.7 b
L098 0.27 0.06 2 AAS 0.03 -0.58 -1.05 a
L099 0.297 25 100 AAS 0.25 -0.11 -0.03 c
L100 0.295 0.057 2 ICP-OES 0.0285 -0.15 -0.28 a
L101 0.249 0.025 2 ICP-AES 0.0125 -0.94 -3.3 a
L104 0.316 ICP-MS 0 0.22 1.17 b
L105 0.336 0.067 2 ICP-MS 0.0335 0.56 0.93 a
L106 0.24 0.05 2 ICP-MS 0.025 -1.10 -2.33 a a √3 is set by the ILC coordinator when no expansion factor k is reported. The reported uncertainty was assumed to have a rectangular distribution with k=√3, bperformance: satisfactory, questionable, unsatisfactory,
ca : umin(uref) ≤ ulab ≤ umax(σ); b : ulab<umin; and c :ulab>umax
38

39
Annex 14: Results for total Pb Assigned range: Xref = 0.027; Uref (k=2) = 0.003; σ = 0.006
(all values in mg kg-1) Lab code Xlab Ulab Ka technique ulab z-scoreb ζ-scoreb Uncert.c
N001 < 0.0500 v3 AAS
N002 0.013 0.0047 2 AAS 0.0024 -2.36 -4.81 a
N003 0.031 0.006 2 ICP-MS 0.0030 0.67 1.15 a
N004 0.0265 0.0087 2 ICP-MS 0.0043 -0.09 -0.11 a
N005 0.029 0.01 2 ICP-MS 0.0050 0.33 0.37 a
N006 0.02 0.004 2 ICP-MS 0.0020 -1.18 -2.66 a
N007 0.0111 0.0037 2 ICP-MS 0.0019 -2.68 -6.30 a
N008 0.037 0.0038 2 ICP-MS 0.0019 1.68 3.89 a
N009 < 0.0200 AAS
N010 0.047 0.01 2 GF-AAS 0.0050 3.36 3.78 a
N011 0.027 0.006 2 ICP-MS 0.0030 0.00 -0.01 a
N012 0.019 0.002 2 ICP-MS 0.0010 -1.35 -4.03 b
N013 0.024 0.007 2 ICP-MS 0.0035 -0.51 -0.77 a
N014 0.035 0.0086 2 ET-AAS 0.0043 1.34 1.72 a
N015 0.024 0.012 2 ICP-MS 0.0060 -0.51 -0.48 c
N016 0.0216 0.0091 2 ICP-MS 0.0046 -0.91 -1.11 a
N017 0.03 0.008 2 ICP-MS 0.0040 0.50 0.68 a
N018 0.0832 0.0166 v3 ICP-MS 0.0096 9.45 5.76 c
N019 0.0288 0.0037 2 ETAAS 0.0019 0.30 0.70 a
N020 0.024 0.0023 2 ICP-MS 0.0011 -0.51 -1.46 b
N021 0.025 0.013 2 ICP-MS 0.0065 -0.34 -0.30 c
N022 0.027 0.003 2 ICP-MS 0.0015 0.00 -0.01 b
N025 < 0.0500 AAS
N026 < 0.1200 ICP-MS
N027 0.033 0.012 2 ICP-MS 0.0060 1.01 0.96 c
N033 0.023 0.0032 2 ICP-MS 0.0016 -0.68 -1.71 b
N034 0.22 0.07 2 AAS 0.0350 32.46 5.51 c
N038 0.0257 0.0049 2 ICP-MS 0.0024 -0.22 -0.44 a
N039 0.029 0.006 2 ICP-MS 0.0030 0.33 0.57 a
N054 < 0.5000 AAS
N073 0.04 0.01 2 ICP-MS 0.0050 2.18 2.45 a
N077 < 0.3000 ICP-MS
L024 0.03 0.008 v3 GFAAS 0.0046 0.50 0.60 a
L028 0.055 0.016 2 AAS 0.0080 4.71 3.42 c
L029 < 0.0400 ICP-MS
L030 0.0233 0 ICP-MS 0 -0.63 -2.16 b
L032 < 0.2000 ICP-OES
L035 0.04 0.01 2 ICP-MS 0.0050 2.18 2.45 a
L036 0.0903 0.0029 2 ICP-OES 0.0015 10.64 28.01 b
L037 0.02 0.01 2 ICP-MS 0.0050 -1.18 -1.33 a
L040 < 0.0500 ICP-MS
L041 0.02 0.002 2 GF-AAS 0.0010 -1.18 -3.53 b
L042 0.031 0.003 2 ICP-MS 0.0015 0.67 1.74 b
L044 0.0308 20 2 ICP-MS 10.0000 0.64 0.00 c
L045 0.027 0 v3 GFAAS 0 0.00 -0.01 b
L046 0.032 0.007 2 ICP-MS 0.0035 0.84 1.28 a
L047 0.033 0.006 2 ET-AAS 0.0030 1.01 1.73 a
L048 0.039 0.012 2 AAS 0.0060 2.01 1.92 c
Lab code Xlab Ulab Ka technique ulab z-scoreb ζ-scoreb Uncert.c
L049 0.022 0.51 0.26 ICP-MS 1.9615 -0.84 0.00 c
L050 0.022 0.003 2 ICP-MS 0.0015 -0.84 -2.20 b
L051 < 1.0000 ICP-OES
L052 0.23 0.01 0.02 GF-AAS 0.5000 34.14 0.41 c
L053 0.054 0.011 2 AAS 0.0055 4.54 4.68 a
L055 < 0.5000 ICP-OES
L056 < 0.3000 ICP-AES
L057 0.08 15 2 GF-AAS 7.5000 8.91 0.01 c
L059 0.024 0.006 2 ICP-MS 0.0030 -0.51 -0.87 a
L060 0.0357 0 v3 ICP-MS 0 1.46 5.04 b
L061 0.024 0 v3 ICP-MS 0 -0.51 -1.76 b
L062 1.267 0 v3 CV-AAS 0 208.58 720.85 b
L063 < 0.0500 AAS
L064 0.042 0.011 2 ET AAS 0.0055 2.52 2.60 a
L065 < 0.0500 ICP-MS
L066 0.025 0.005 2 ICP-MS 0.0025 -0.34 -0.67 a
L067 0.02 0.004 2 ICP-MS 0.0020 -1.18 -2.66 a
L068 0.75 0.08 v3 ICP-MS 0.0462 121.61 15.64 c
L069 0.025 0.002 v3 ICP-MS 0.0012 -0.34 -0.98 b
L070 < 0.0500 GF-AAS
L071 0.02 0.005 2 SEM-ICP-MS 0.0025 -1.18 -2.31 a
L072 0.039 0.0124 2 ICP-MS 0.0062 2.01 1.86 c
L074 0.032 0.014 2 ICP-MS 0.0070 0.84 0.69 c
L075 0.367 0.03 2 EET-AAS 0.0150 57.19 22.52 c
L076 0.25 0.01 2 ICP-AES 0.0050 37.51 42.17 a
L078 < 0.1000 AAS
L079 0.25 0.06 2 AAS 0.0300 37.51 7.42 c
L080 0.027 0.002 2 ICP-MS 0.0010 0.00 -0.01 b
L081 0.0357 0.0023 1.96 AAS 0.0012 1.46 4.17 b
L083 0.174 0.017 2 ICP-MS 0.0085 24.72 16.95 c
L084 < 0.1000 AAS
L085 < 0.1200 AAS
L086 0.03 0.01 2 ICP-MS 0.0050 0.50 0.56 a
L087 0.026 0.006 2 ICP-MS 0.0030 -0.17 -0.30 a
L088 < 0.1000 ICP-MS
L089 0.0096 0.0924 2 ICP-MS 0.0462 -2.93 -0.38 c
L091 0.0368 0.0027 v3 ICP-MS 0.0016 1.64 4.21 b
L092 0.031 0 v3 ICP-MS 0 0.67 2.31 b
L094 0.037 0 v3 ICP-MS 0 1.68 5.80 b
L095 0.0274 0.0041 2 ICP-MS 0.0021 0.07 0.15 a
L097 0.03 0.023 2 GF-AAS 0.0115 0.50 0.26 c
L098 < 0.0800 AAS
L099 < 0.0500 100 AAS
L100 0.28 0.055 2 ICP-OES 0.0275 42.55 9.18 c
L101 0.086 0.009 2 ICP-AES 0.0045 9.92 12.24 a
L102 v3
L104 0.21 0 v3 ICP-MS 0 30.78 106.37 b
L105 0.025 0.005 2 ICP-MS 0.0025 -0.34 -0.67 a
L106 0.02 0.01 2 ICP-MS 0.0050 -1.18 -1.33 a a √3 is set by the ILC coordinator when no expansion factor k is reported. The reported uncertainty was assumed to have a rectangular distribution with k=√3, bperformance: satisfactory, questionable, unsatisfactory, ca : umin(uref) ≤ ulab ≤ umax(σ); b : ulab<umin; and c : ulab>umax

40
41
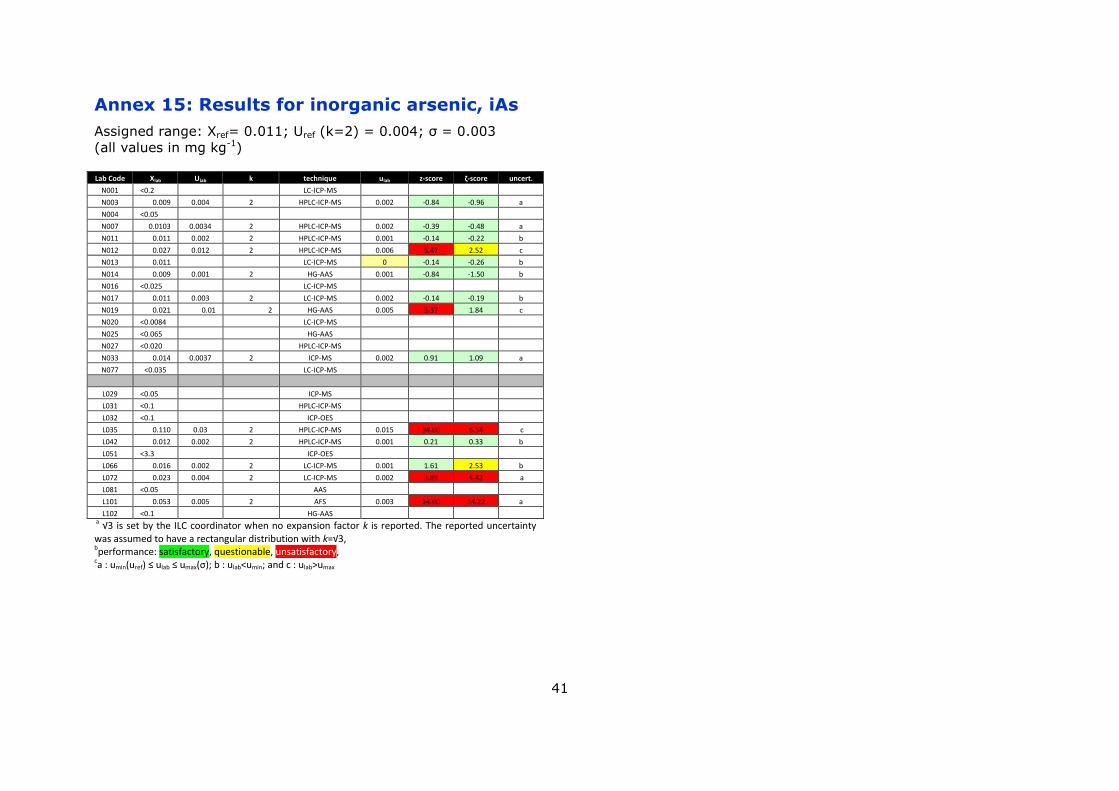
Annex 15: Results for inorganic arsenic, iAs
Assigned range: Xref= 0.011; Uref (k=2) = 0.004; σ = 0.003
(all values in mg kg-1)
Lab Code Xlab Ulab k technique ulab z-score ζ-score uncert.
N001 <0.2 LC-ICP-MS
N003 0.009 0.004 2 HPLC-ICP-MS 0.002 -0.84 -0.96 a
N004 <0.05
N007 0.0103 0.0034 2 HPLC-ICP-MS 0.002 -0.39 -0.48 a
N011 0.011 0.002 2 HPLC-ICP-MS 0.001 -0.14 -0.22 b
N012 0.027 0.012 2 HPLC-ICP-MS 0.006 5.47 2.52 c
N013 0.011 LC-ICP-MS 0 -0.14 -0.26 b
N014 0.009 0.001 2 HG-AAS 0.001 -0.84 -1.50 b
N016 <0.025 LC-ICP-MS
N017 0.011 0.003 2 LC-ICP-MS 0.002 -0.14 -0.19 b
N019 0.021 0.01 2 HG-AAS 0.005 3.37 1.84 c
N020 <0.0084 LC-ICP-MS
N025 <0.065 HG-AAS
N027 <0.020 HPLC-ICP-MS
N033 0.014 0.0037 2 ICP-MS 0.002 0.91 1.09 a
N077 <0.035 LC-ICP-MS
L029 <0.05 ICP-MS
L031 <0.1 HPLC-ICP-MS
L032 <0.1 ICP-OES
L035 0.110 0.03 2 HPLC-ICP-MS 0.015 34.60 6.54 c
L042 0.012 0.002 2 HPLC-ICP-MS 0.001 0.21 0.33 b
L051 <3.3 ICP-OES
L066 0.016 0.002 2 LC-ICP-MS 0.001 1.61 2.53 b
L072 0.023 0.004 2 LC-ICP-MS 0.002 3.89 4.42 a
L081 <0.05 AAS
L101 0.053 0.005 2 AFS 0.003 14.60 14.22 a
L102 <0.1 HG-AAS a √3 is set by the ILC coordinator when no expansion factor k is reported. The reported uncertainty was assumed to have a rectangular distribution with k=√3, bperformance: satisfactory, questionable, unsatisfactory, ca : umin(uref) ≤ ulab ≤ umax(σ); b : ulab<umin; and c : ulab>umax

42

43
Annex 16: Results for total Hg
Lab Code Xlab Ulab k technique
N001 0.005
CV-AFS
N002 0.08 0.018 2 HG-AAS
N003 0.02 0.002 2 ICP-MS
N004 <0.005
CV-AAS
N005 0.0013 0.00031 2 AAS
N006 <0.006
FIMS
N007 <0.0075
ICP-MS
N008 <0.02
CV-AAS
N009 <0.1
CV-AAS
N011 0.0012 0.0003 2 Direct Mercury Analysis
N012 0.0005 0.0002 2 Direct mercury analysis
N013 <0.01
Autoanalyser
N014 <0.05
CV-AAS
N015 0.007 0.0028 2 ICP-MS
N016 <0.004
CV-AFS
N017 <0.04
ICP-IDMS
N018 0.00114 0.000228
AAS
N019 0.0011 0.0005 2 Mercury Analyser, AMA 254
N020 <0.001
ICP-MS
N021 0.013 0.005 2 ICP-MS
N022 <0.006
ICP-MS
N025 0.002 0.0003 2 CV-AAS
N026 <0.05
ICP-MS
N027 0.103 0.031 2 thermal decomposition-amalgamation-AAS (AMA 254)
N033 <0.001
ICP-MS
N034 <0.05
CV-AAS
N038 0.0101 0.0026 2 ICP-MS
N054 <0.1
CV-AAS
N073 <0.02
ICP-MS
N077 0.002 0.001 2 direct mercury analysis
. L024 0.001 0.0001
AAS
L029 <0.005
ICP-MS
L030 <0.002
ICP-MS
L032 <0.05
ICP-OES
L035 <0.03
ICP-MS
L036 <0.01
ICP-OES
L037 <0.017
ICP-MS
L040 <0.02
ICP-MS
L042 0.012 0.001 2 ICP-MS
L043 <0.01
CV-AAS
L044 0.00792 20 2 ICP-MS
L045 <0.02
CV-AAS
L047 0.029 0.005 2 FIAS
Lab Code Xlab Ulab k technique
L049 <0.02 2.33 1.16 ICP-MS
L050 <0.003
FIMS
L051 <2.5
ICP-OES
L052 0.03 0.003 0.006 CV-AAS
L053 0.0177 0.002 2 AAS
L055 <0.5
ICP-OES
L057 <0.05
CV-AAS
L059 0.03 0.011 2 ICP-MS
L060 <0.01
ICP-MS
L061 <0.05
ICP-MS
L063 <0.05
CV-AAS
L065 0.0018 0.0002
CV-AAS
L066 <0.004
ICP-MS
L067 0.003 0.0002 2 ICP-MS
L068 0.0058 0.0006
CV-AAS
L069 0.004
ICP-MS
L070 <0.0004
Advanced mercury atomizer AMA 254
L072 <0.02
ICP-MS
L074 0.005 0.004 2 ICP-MS
L075 <0.2
CV-AAS
L076 0.0025 0.0001 2 DMA-80 Millestone
L078 <0.008
H-AAS
L079 <0.05
CV-AAS
L080 0.0046 0.0005 2 ICP-MS
L081 <0.005
HG-AAS
L083 0.1 0.02 2 ICP-MS
L084 <0.0007
CV-AAS
L086 0.011 0.002 2 ICP-MS
L087 0.003 0.001 2 ICP-MS
L088 0.001 0.00024 2 Atomic absorption spectroscopy – AMA 254
L089 <0.0043
ICP-MS
L091 0.0035 0.0003
ICP-MS
L092 0.005
ICP-MS
L093 <0.004
DMA
L095 0.01255 0.00188 2 ICP-MS
L097 0.025 0.018 2 CV-AAS
L098 <0.05
HG-AAS
L099 <0.001 13 100 AAS
L100 0.029 0.007 2 ICP-OES
L101 0.011 0.001 2 LECO AMA
L102 0.13 0.03 2 CV-AAS
L104 <0.01
ICP-MS
L105 0.015 0.003 2 ICP-MS
L106 0 ICP-MS

44
Annex 17: Experimental details
Part. key
Measurand CRM - method
validation CRM - instrument
calibration Standard Method Used Digestion type Digestion mixture Digestion temperature
Analytical method for the iAs determination
Recovery (%)
LODs Technique
L024 As
HRN EN 14084:2005, EPA method 7473
X X
not analysed
L024 Cd
Merck 1.19777 Closed microwave H2O2, HNO3 93.2 0.001 GFAAS
L024 Hg
Fluka 16482 Mercury analyzer X
0.0001 AAS
L024 iAs
X X
L024 Pb
Merck 1.19776 Closed microwave H2O2, HNO3 75.4 0.01 GFAAS
L028 As
true
X X
500-800W/30min
L028 Cd
Closed microwave H2O2, HNO3 100
AAS
L028 Hg
X X
L028 iAs
X X
L028 Pb
Closed microwave H2O2, HNO3 100
AAS
L029 As
No Dry ashing HNO3 90
0.015 ICP-MS
L029 Cd
0.01 ICP-MS
L029 Hg
0.0025 ICP-MS
L029 iAs
0.025 ICP-MS
L029 Pb
0.02 ICP-MS
L030 As
US EPA 200.8
Ultraclave HNO3, HF
200ºC, 25 min.
ICP-MS
L030 Cd
ICP-MS
L030 Hg
ICP-MS
L030 iAs
X X
L030 Pb
Ultraclave HNO3, HF
ICP-MS
L031 As
No
X X
1 hour at 60 then 2 hours at 80.
Arsenic species are extracted with TMAOH, neutralised,
centrifuged separated by IC determined by ICP-MS.
L031 Cd
X X
L031 Hg
X X
L031 iAs No No TMAOH 25% TMAOH aq 106 0.03 HPLC-ICP-MS
L031 Pb
X X
L032 As
ICP-OES
L032 Cd
ICP-OES
L032 Hg
ICP-OES
L032 iAs
ICP-OES
L032 Pb
ICP-OES
L035 As
EN 15763:2009; EN 13805:2002; EPA
Method 6020A:2007; EN 13804:2013
Closed microwave H2O2, HNO3, HCl for total element concentration: 20 min up to 250 psi, 15 min hold at 250
psi
Extraction with diluted (1%) nitric acid and H2O2 (3%), HPLC-
ICP-MS analysis with a SAX column, pH 8.9, (NH4)2CO3
buffer as eluent
ICP-MS
L035 Cd
ICP-MS
L035 Hg
ICP-MS
L035 iAs ERM-BC211
closed vessel, 95 C degree, 1 hour
H2O2, HNO3 97 0.02 HPLC-ICP-MS
L035 Pb
Closed microwave H2O2, HNO3, HCl
ICP-MS
L036 As
IRMM JT Baker
EPA 6010C, EPA 3052
Closed microwave H2O2, HNO3 180 degrees of Celsius for
half an hour
107 0.001 ICP-OES
L036 Cd
97 0.001 ICP-OES
L036 Hg
87 0.001 ICP-OES
L036 iAs
X X
L036 Pb IRMM JT Baker Closed microwave H2O2, HNO3
89 0.001 ICP-OES
L037 As
method ANSES Cime 8 and 12
Pressure bomb HNO3
100°C
0.002 ICP-MS
L037 Cd
0.002 ICP-MS
L037 Hg
0.002 ICP-MS
L037 iAs
X X
L037 Pb
Pressure bomb HNO3
0.002 ICP-MS
L040 As
EN ISO 15763 Pressure bomb HNO3
240°C/1h
0.001 ICP-MS
L040 Cd
0.0004 ICP-MS
L040 Hg
0.01 ICP-MS
L040 iAs
X X

45
Part. key
Measurand CRM - method
validation CRM - instrument
calibration Standard Method Used Digestion type Digestion mixture Digestion temperature
Analytical method for the iAs determination
Recovery (%)
LODs Technique
L040 Pb
Pressure bomb HNO3
0.0025 ICP-MS
L041 As Atomic Absorption
standar
Atomic Absorption standard
No
Closed microwave H2O2, HNO3
200 Celsius degrees/30 min
- 66.48 0.028 GF-AAS
L041 Cd - 76.03 0.01 GF-AAS
L041 Hg
X X -
L041 iAs
X X -
L041 Pb Atomic
Absorption standar
Atomic Absorption
standar Closed microwave H2O2, HNO3 - 70.14 0.005 GF-AAS
L042 As
NCS ZC73013
NF EN 17852 and PR NF EN 16802
Closed microwave
HNO3
20 min at 200°C PR NF EN 16802
103 0.01 ICP-MS
L042 Cd
94 0.01 ICP-MS
L042 Hg
104 0.01 ICP-MS
L042 iAs
H2O2, HNO3 60 0.01 HPLC-ICP-MS
L042 Pb NCS ZC7301
HNO3 82 0.02 ICP-MS
L043 As
L043 Cd
ICP-MS
L043 Hg
CV-AAS
L043 iAs
L043 Pb
L044 As
In-house developed and validated method
Closed microwave H2O2, HNO3
250/1hr N/A
111 0.00001 ICP-MS
L044 Cd
102 0.000004 ICP-MS
L044 Hg
96 0.000003 ICP-MS
L044 iAs
Followed by addition of HCl (post-
digestion)
L044 Pb
Closed microwave H2O2, HNO3 96 0.000005 ICP-MS
L045 As
Yes
Closed microwave H2O2, HNO3
200/30 min
H-AAS
L045 Cd
GFAAS
L045 Hg
CV-AAS
L045 iAs
X X
L045 Pb
Closed microwave H2O2, HNO3
GFAAS
L046 As
SRPS EN 13805:2008
Closed microwave H2O2, HNO3
Temperature 210 degree Celsius/25 minutes
91.5 0.01 ICP-MS
L046 Cd
100.5 0.01 ICP-MS
L046 Hg
X X
L046 iAs
X X
L046 Pb
Closed microwave H2O2, HNO3 100.2 0.015 ICP-MS
L047 As
No
Closed microwave H2O2, HNO3
180ºC/120min
80 0.005 FIAS
L047 Cd
92 0.005 ET-AAS
L047 Hg
80 0.005 FIAS
L047 iAs
X X / /
L047 Pb
Closed microwave H2O2, HNO3 88 0.01 ET-AAS
L048 As
No X X
200oC/15min
L048 Cd
FAPAS T07143 Closed microwave H2O2, HNO3
0.001 AAS
L048 Hg
X X
L048 iAs
X X
L048 Pb
FAPAS T07143 Closed microwave H2O2, HNO3
0.006 AAS
L049 As
NA NA No
Hot Acid Digestion
HNO3, HF 100 degrees celsius for 1
Hour NA
NA <0.04 ICP-MS
L049 Cd NA <0.002 ICP-MS
L049 Hg NA <0.02 ICP-MS
L049 iAs X X NA NA
L049 Pb Hot Acid Digestion HNO3, HF NA <0.02 ICP-MS
L050 As
DOLT4, GBW
NS-EN 17294-2 (basis), NS-EN 1483 (basis)
Closed microwave, Pressure bomb
H2O2, HNO3 170 °C
0.05 ICP-MS
L050 Cd
0.005 ICP-MS
L050 Hg
0.003 FIMS
L050 iAs
X X

46
Part. key
Measurand CRM - method
validation CRM - instrument
calibration Standard Method Used Digestion type Digestion mixture Digestion temperature
Analytical method for the iAs determination
Recovery (%)
LODs Technique
L050 Pb DOLT4, GBW
Closed microwave, Pressure bomb
H2O2, HNO3
0.01 ICP-MS
L051 As
GB CRM GB CRM No Closed microwave HNO3 175Celsius/40min By calculation according to As
content
99 2.5 ICP-OES
L051 Cd 94 0.5 ICP-OES
L051 Hg 96 2.5 ICP-OES
L051 iAs 99 3.3 ICP-OES
L051 Pb 101 1 ICP-OES
L052 As
No
Closed microwave HNO3
120 degree celcious
105 0.02 HG-AAS
L052 Cd
107 0.01 GF-AAS
L052 Hg
101 0.03 CV-AAS
L052 iAs
X X
L052 Pb
Closed microwave HNO3
98.4 0.05 GF-AAS
L053 As
No
Pressure bomb HNO3
185/6
100 0.05 HG-AAS
L053 Cd
100 0.005 AAS
L053 Hg
X X 100 0.0002 AAS
L053 iAs
X X
L053 Pb
Pressure bomb HNO3 100 0.03 AAS
L055 As
No
Closed microwave HNO3
255°C/45min.
none 1 ICP-OES
L055 Cd
none 0.05 ICP-OES
L055 Hg
none 0.5 ICP-OES
L055 iAs
X X
L055 Pb
Closed microwave HNO3 none 0.5 ICP-OES
L056 As
Panreac 313171.1208
No
Digestion with Magnesium Nitrate, Magnesium Oxide
and Acid Nitric
HNO3, Magnesium Nitrate and
Magnesium Oxide For Cd and Pb 25 min at
190ºC; For As 48 h at 450ºC none
1 0.24 HG-AAS
L056 Cd
VHG-ACDN-100 b) No Closed microwave H2O2, HNO3 1.02 0.02 ICP-AES
L056 Hg
b) No X X
L056 iAs
b) No X X
L056 Pb
VHG-APBN-100 b) No Closed microwave H2O2, HNO3 0.97 0.3 ICP-AES
L057 As
NIST Traceable spectrosol AOAC 986.15
(2012),AOAC 999.10(2012)
Closed microwave, Dry ashing
1. H2O2, 4. HNO3
172 0C for 20 minutes- microwave digestion and 500
0C for 3 hours-dry ashing Not analysed
atomic absorption spectrophotometry-vapour generation
accessory(VGA)
L057 Cd Closed microwave H2O2, HNO3
atomic absorption spectrophotometry-GTA
L057 Hg
CV-AAS
L057 iAs
X X
L057 Pb
NIST Traceable spectrosol
Closed microwave H2O2, HNO3
atomic absorption spectrophotometry-GTA
L059 As
No
Pressure bomb HNO3
180 °C/60 minutes not analysed
25 0.009 ICP-MS
L059 Cd
25 0.002 ICP-MS
L059 Hg
35 0.007 ICP-MS
L059 iAs
Other
L059 Pb
Pressure bomb HNO3 25 0.005 ICP-MS
L060 As
Yes a) Yes 1. Closed microwave 4. HNO3 20 min Ramp to 200'c Hold
20 min 0.01 ICP-MS
L060 Cd
Yes a) Yes 1. Closed microwave 4. HNO3 20 min Ramp to 200'c Hold
20 min 0.01 ICP-MS
L060 Hg
Yes a) Yes 1. Closed microwave 4. HNO3 20 min Ramp to 200'c Hold
20 min 0.01 ICP-MS
L060 iAs
a) Yes
X 20 min Ramp to 200'c Hold
20 min
L060 Pb
Yes a) Yes 1. Closed microwave 4. HNO3 20 min Ramp to 200'c Hold
20 min 0.005 ICP-MS

47
Part. key
Measurand CRM - method
validation CRM - instrument
calibration Standard Method Used Digestion type Digestion mixture Digestion temperature
Analytical method for the iAs determination
Recovery (%)
LODs Technique
L061 As
ICP-MS
L061 Cd
ICP-MS
L061 Hg
ICP-MS
L061 iAs
L061 Pb
ICP-MS
L062 As
No
X X
450°C 16hours
L062 Cd
Dry ashing HNO3, HCl 100 0.075 CV-AAS
L062 Hg
X X
L062 iAs
X X
L062 Pb
Dry ashing HNO3, HCl 100 0.5 CV-AAS
L063 As
BCR-186
No
Closed microwave H2O2, HNO3
200ºC/10 minutes not tested
100 0.1 AAS
L063 Cd
103 0.05 AAS
L063 Hg
114 0.05 CV-AAS
L063 iAs
X X
L063 Pb BCR-186
Closed microwave H2O2, HNO3 101 0.05 AAS
L064 As
EN 14084
X X
L064 Cd CRM CRM Closed microwave HNO3 90 0.01 Electrothermal AAS
L064 Hg
X X
L064 iAs
X X
L064 Pb CRM CRM Closed microwave HNO3 85 0.02 Electrothermal AAS
L065 As
ICP-MS
L065 Cd
ICP-MS
L065 Hg
CV-AAS
L065 iAs
L065 Pb
ICP-MS
L066 As YES YES No
Closed microwave
H2O2, HNO3
200ºC/20 min for digestion of As, Cd, Pb, Hg. And up to 95
ºC/20 min for iAs
We have used 2 different methods with same result. Same
microwave extraction for both (0,25 g of sample + 10 mL of a
mix H2O2/HNO3 0,1M). Measuring with LC-ICP-MS and
SPE-ICP-MS too.
100 0.004 ICP-MS
L066 Cd YES YES
100 0.002 ICP-MS
L066 Hg YES YES H2O2, HNO3, HCl 100 0.002 ICP-MS
L066 iAs YES YES
H2O2, HNO3, diluted nitric acid for iAs
instead of concentrated as for
As,Cd,Hg,Pb
100 0.002 LC-ICP-MS
L066 Pb YES YES H2O2, HNO3 100 0.004 ICP-MS
L067 As NCS DC 73349
Yes
Closed microwave
H2O2, HNO3
In total 6 min (4 min ramping + 2 min holding) in 200
degrees. No determination and results
0.00001 ICP-MS
L067 Cd INCT-MPH-2
0.000002 ICP-MS
L067 Hg CRM Dolt 4 Fish Liver
H2O2, HNO3, HCl
3E-07 ICP-MS
L067 iAs
X X
L067 Pb INCT-MPH-2
Closed microwave H2O2, HNO3
0.00001 ICP-MS
L068 As
No Pressure bomb HNO3 200°C, 30 minutes We measured only total As
ICP-MS
L068 Cd
ICP-MS
L068 Hg
CV-AAS
L068 iAs
L068 Pb
ICP-MS
L069 As
No
Closed microwave H2O2, HNO3
ICP-MS
L069 Cd
ICP-MS
L069 Hg
ICP-MS
L069 iAs
X X
L069 Pb
Closed microwave H2O2, HNO3
ICP-MS
L070 As
No
X X
Cd, Pb - 520 temperature/15 ours, Hg - 550 temperature/ 8
min.
L070 Cd Tea, White Cabbege
RM Cd Dry ashing
HNO3 86.3 0.0002 ET-AAS
L070 Hg Milk Powder RM Hg Dry ashing 97 0.0004 AMA 254
L070 iAs
X X

48
Part. key
Measurand CRM - method
validation CRM - instrument
calibration Standard Method Used Digestion type Digestion mixture Digestion temperature
Analytical method for the iAs determination
Recovery (%)
LODs Technique
L070 Pb Tea, White Cabbage
RM Pb Dry ashing HNO3 99.9 0.01 ET-AAS
L071 As
No
Open acid digestion H2O2, HNO3
110℃/230min
112.5 0.002 SEM-ICP-MS
L071 Cd
106.3 0.002 SEM-ICP-MS
L071 Hg
X X
L071 iAs
X X
L071 Pb
Open acid digestion H2O2, HNO3 99.5 0.005 SEM-ICP-MS
L072 As Yes
Official test method in Taiwan (TFDA).
Closed microwave
HNO3 100 C 15 min to 160 C 15 min
Sample was cuted into small pieces. Add 10 ml 1% HNO3 into
sample tube. Sample was extracted by ultrasonic device
and followed by LC-ICP/MS analysis.
105 0.02 ICP-MS
L072 Cd Yes 102.6 0.02 ICP-MS
L072 Hg Yes 94.9 0.02 ICP-MS
L072 iAs Yes
Sample was extracted with 1% HNO3 and analysis
by LC-ICP/MS.
114.9 0.02 LC-ICP-MS
L072 Pb Yes Closed microwave 93.5 0.02 ICP-MS
L074 As
NIST-1570a NIST-1570a
AOAC 2013.06
Closed microwave H2O2, HNO3 Maximum: T=180ºC / Total
time: 45min
107 0.01 ICP-MS
L074 Cd 90 0.01 ICP-MS
L074 Hg 82 0.005 ICP-MS
L074 iAs
X X
L074 Pb NIST-1570a NIST-1570a Closed microwave H2O2, HNO3 84 0.01 ICP-MS
L075 As yes yes As: AOAC Ed 19 (2012) 986.15; Cd and Pb: AOAC Ed 19(2012)
999.11; Hg: Chemical Methods Manual for
fish and seafoods-Canadian Food
Inspection. Agency, Amed 4, 1999
Dry ashing
HNO3
As: 2 h at 150 C, drying at 375 C, 0.5 h at 450 C; Cd and Pb: 4
h at 450 C; Hg: 2 h at 60 C
95 0.001 HG-AAS
L075 Cd yes yes HNO3, HCl 96 0.002 ET-AAS
L075 Hg yes yes HNO3, H2SO4 93 0.003 CV-AAS
L075 iAs
X X
L075 Pb yes yes Dry ashing HNO3, HCl 97 0.015 ET-AAS
L076 As X
No
Closed microwave
H2O2, HNO3
180ºC/ 10 MINUTES
99.75 0.001 ICP-OES
L076 Cd X
99.88 0.001 ICP-OES
L076 Hg X
99.79 0.00005 DMA-80 Millestone
L076 iAs
X X
L076 Pb X
Closed microwave H2O2, HNO3 99.56 0.001 ICP-AES
L078 As
AAS
L078 Cd
AAS
L078 Hg
H-AAS
L078 iAs
L078 Pb
AAS
L079 As
No
Closed microwave H2O2, HNO3 15min untill 180C , 10 min
180C Not Analysed
AAS
L079 Cd
AAS
L079 Hg
CV-AAS
L079 iAs
X X
L079 Pb
Closed microwave H2O2, HNO3
AAS
L080 As
1000 mg/l As Certipur
EN ISO 15763:2010
Closed microwave H2O2, HNO3
0.002 ICP-MS
L080 Cd ERM-BD151 1000 mg/l Cd
Certipur 0.0001 ICP-MS
L080 Hg
1000 mg/l Hg Certipur
0.00005 ICP-MS
L080 iAs
X X
L080 Pb ERM-BD151 1000 mg/ Pb
Certipur Closed microwave H2O2, HNO3
0.0004 ICP-MS
L081 As many many As-DIN EN ISO11969:1996-11 , Cd-
Pressure bomb H2O2, HNO3 240 °C for 30 min Hydrid-AAS measurement of
acicic extracted sample.
0.01 HG-AAS
L081 Cd many many
0.025 ICP-MS
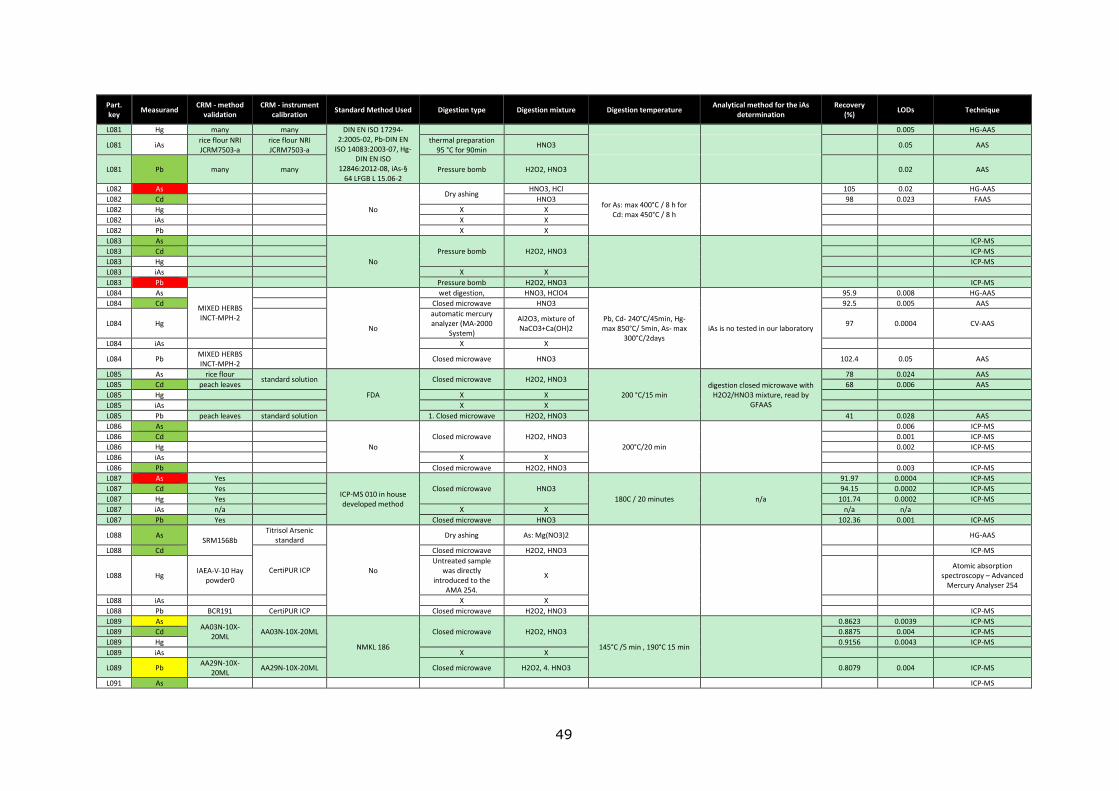
49
Part. key
Measurand CRM - method
validation CRM - instrument
calibration Standard Method Used Digestion type Digestion mixture Digestion temperature
Analytical method for the iAs determination
Recovery (%)
LODs Technique
L081 Hg many many DIN EN ISO 17294-2:2005-02, Pb-DIN EN
ISO 14083:2003-07, Hg- DIN EN ISO
12846:2012-08, iAs-§ 64 LFGB L 15.06-2
0.005 HG-AAS
L081 iAs rice flour NRI JCRM7503-a
rice flour NRI JCRM7503-a
thermal preparation 95 °C for 90min
HNO3
0.05 AAS
L081 Pb many many Pressure bomb H2O2, HNO3
0.02 AAS
L082 As
No
Dry ashing HNO3, HCl
for As: max 400°C / 8 h for Cd: max 450°C / 8 h
105 0.02 HG-AAS
L082 Cd
HNO3 98 0.023 FAAS
L082 Hg
X X
L082 iAs
X X
L082 Pb
X X
L083 As
No
Pressure bomb H2O2, HNO3
ICP-MS
L083 Cd
ICP-MS
L083 Hg
ICP-MS
L083 iAs
X X
L083 Pb
Pressure bomb H2O2, HNO3
ICP-MS
L084 As
MIXED HERBS INCT-MPH-2
No
wet digestion, HNO3, HClO4
Pb, Cd- 240°C/45min, Hg- max 850°C/ 5min, As- max
300°C/2days iAs is no tested in our laboratory
95.9 0.008 HG-AAS
L084 Cd
Closed microwave HNO3 92.5 0.005 AAS
L084 Hg
automatic mercury analyzer (MA-2000
System)
Al2O3, mixture of NaCO3+Ca(OH)2
97 0.0004 CV-AAS
L084 iAs
X X
L084 Pb MIXED HERBS INCT-MPH-2
Closed microwave HNO3 102.4 0.05 AAS
L085 As rice flour standard solution
FDA
Closed microwave H2O2, HNO3
200 °C/15 min digestion closed microwave with
H2O2/HNO3 mixture, read by GFAAS
78 0.024 AAS
L085 Cd peach leaves 68 0.006 AAS
L085 Hg
X X
L085 iAs
X X
L085 Pb peach leaves standard solution 1. Closed microwave H2O2, HNO3 41 0.028 AAS
L086 As
No
Closed microwave H2O2, HNO3
200°C/20 min
0.006 ICP-MS
L086 Cd
0.001 ICP-MS
L086 Hg
0.002 ICP-MS
L086 iAs
X X
L086 Pb
Closed microwave H2O2, HNO3
0.003 ICP-MS
L087 As Yes
ICP-MS 010 in house developed method
Closed microwave HNO3
180C / 20 minutes n/a
91.97 0.0004 ICP-MS
L087 Cd Yes 94.15 0.0002 ICP-MS
L087 Hg Yes 101.74 0.0002 ICP-MS
L087 iAs n/a X X n/a n/a
L087 Pb Yes Closed microwave HNO3 102.36 0.001 ICP-MS
L088 As SRM1568b
Titrisol Arsenic standard
No
Dry ashing As: Mg(NO3)2
HG-AAS
L088 Cd
CertiPUR ICP
Closed microwave H2O2, HNO3
ICP-MS
L088 Hg IAEA-V-10 Hay
powder0
Untreated sample was directly
introduced to the AMA 254.
X
Atomic absorption spectroscopy – Advanced
Mercury Analyser 254
L088 iAs
X X
L088 Pb BCR191 CertiPUR ICP Closed microwave H2O2, HNO3
ICP-MS
L089 As AA03N-10X-
20ML AA03N-10X-20ML
NMKL 186
Closed microwave H2O2, HNO3
145°C /5 min , 190°C 15 min
0.8623 0.0039 ICP-MS
L089 Cd 0.8875 0.004 ICP-MS
L089 Hg 0.9156 0.0043 ICP-MS
L089 iAs
X X
L089 Pb AA29N-10X-
20ML AA29N-10X-20ML Closed microwave H2O2, 4. HNO3 0.8079 0.004 ICP-MS
L091 As
ICP-MS

50
Part. key
Measurand CRM - method
validation CRM - instrument
calibration Standard Method Used Digestion type Digestion mixture Digestion temperature
Analytical method for the iAs determination
Recovery (%)
LODs Technique
L091 Cd
ICP-MS
L091 Hg
ICP-MS
L091 iAs
L091 Pb
ICP-MS
L092 As
No
Closed microwave HNO3, HCl 180 degrees Celcius for 15
minutes
0.02 ICP-MS
L092 Cd
0.0024 ICP-MS
L092 Hg
0.0004 ICP-MS
L092 iAs
X X
L092 Pb
Closed microwave HNO3, HCl
0.004 ICP-MS
L093 As
No
X X
400ºC >24h
L093 Cd
Dry ashing X
0.07 FAAS
L093 Hg
DMA X
0.004 DMA
L093 iAs
X X
L093 Pb
X X
L094 As
ICP-AES
L094 Cd
ICP-AES
L094 Hg
L094 iAs
L094 Pb
ICP-AES
L095 As
internal SOP
Closed microwave HNO3, HClO4
250°C / 20 min
0.013 ICP-MS
L095 Cd
0.002 ICP-MS
L095 Hg
0.006 ICP-MS
L095 iAs
X
n.a.
L095 Pb
Closed microwave HNO3, HClO4
0.003 ICP-MS
L097 As
NMKL and ISO methods
Closed microwave H2O2, HNO3 180°C/15min; 220°C/10min;
240°C/15min
0.01 HG-AAS
L097 Cd
0.004 GF_AAS
L097 Hg
0.02 CV-AAS
L097 iAs
X X
L097 Pb
Closed microwave H2O2, HNO3
0.08 GF_AAS
L098 As
true
X X
L098 Cd Closed microwave H2O2, HNO3
AAS
L098 Hg
HG-AAS
L098 iAs
X X
L098 Pb
Closed microwave H2O2, HNO3
AAS
L099 As
AAS
L099 Cd
AAS
L099 Hg
AAS
L099 iAs
L099 Pb
AAS
L100 As FAPAS_07190 -
Arsenic (to J/8003/05
Closed microwave H2O2, HNO3
30-150°C/40min
86.25 0.0076 ICP-OES
L100 Cd 89.5 0.0061 ICP-OES
L100 Hg 84.83 0.0095 ICP-OES
L100 iAs
X X
ICP-OES
L100 Pb FAPAS_07190 -
Arsenic (to J/8035/05 Closed microwave H2O2, HNO3 90.5 0.0074 ICP-OES
L101 As
Arsenic - oxidation and acid digestion
HCl
450 4h Acid digestion - flurescence
spectrocopy.
98.3 0.06 AFS
L101 Cd
Dry ashing HNO3 88 0.0004 ICP-AES
L101 Hg
Mercury analyser (LECO)
Hg - no preparation 105.6 0.0025 LECO AMA
L101 iAs
Arsenic - oxidation and acid digestion
HCl 102.1 0.06 AFS
L101 Pb
Dry ashing HNO3 81 0.005 ICP-AES
L102 As
Dry ashing HCl 1 hour/approx 70°C
digest in HCl, add hydrobromic acid and hydrazine and extract
97 0.1 HG-AAS
L102 Cd
X X
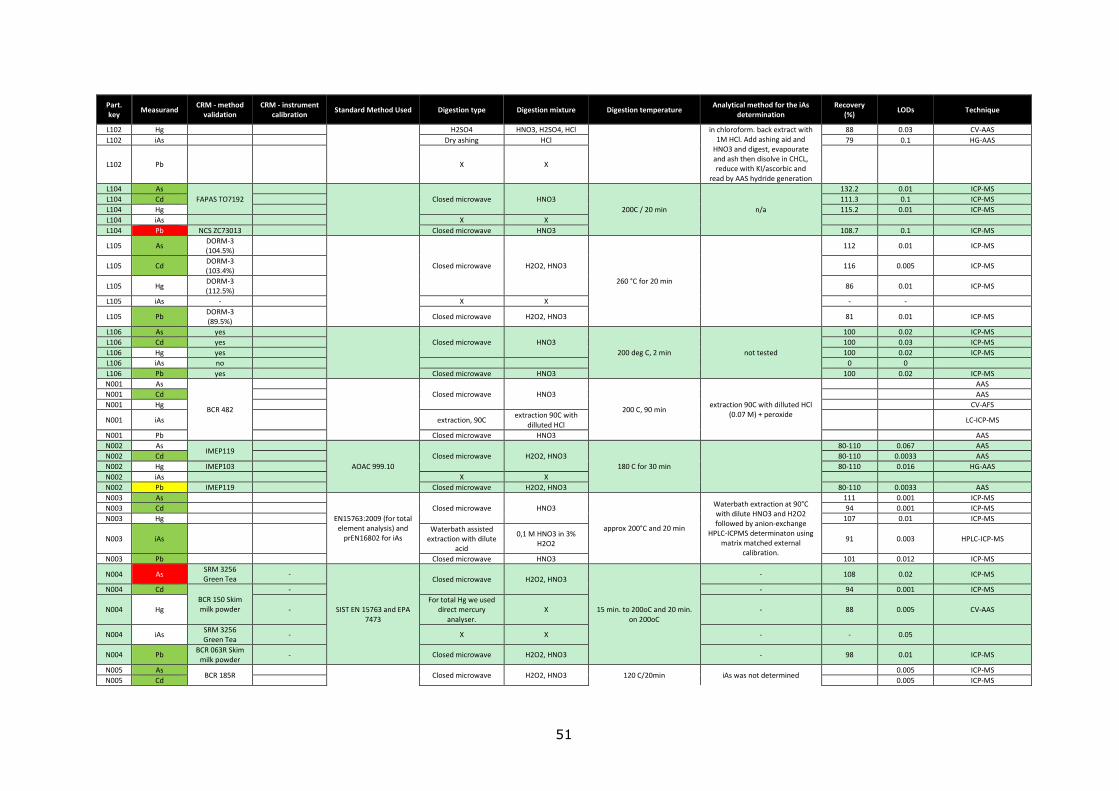
51
Part. key
Measurand CRM - method
validation CRM - instrument
calibration Standard Method Used Digestion type Digestion mixture Digestion temperature
Analytical method for the iAs determination
Recovery (%)
LODs Technique
L102 Hg
H2SO4 HNO3, H2SO4, HCl in chloroform. back extract with 1M HCl. Add ashing aid and
HNO3 and digest, evapourate and ash then disolve in CHCL, reduce with KI/ascorbic and
read by AAS hydride generation
88 0.03 CV-AAS
L102 iAs
Dry ashing HCl 79 0.1 HG-AAS
L102 Pb
X X
L104 As
FAPAS TO7192
Closed microwave HNO3
200C / 20 min n/a
132.2 0.01 ICP-MS
L104 Cd
111.3 0.1 ICP-MS
L104 Hg
115.2 0.01 ICP-MS
L104 iAs
X X
L104 Pb NCS ZC73013
Closed microwave HNO3 108.7 0.1 ICP-MS
L105 As DORM-3 (104.5%)
Closed microwave H2O2, HNO3
260 °C for 20 min
112 0.01 ICP-MS
L105 Cd DORM-3 (103.4%)
116 0.005 ICP-MS
L105 Hg DORM-3 (112.5%)
86 0.01 ICP-MS
L105 iAs -
X X - -
L105 Pb DORM-3 (89.5%)
Closed microwave H2O2, HNO3 81 0.01 ICP-MS
L106 As yes
Closed microwave HNO3
200 deg C, 2 min not tested
100 0.02 ICP-MS
L106 Cd yes 100 0.03 ICP-MS
L106 Hg yes 100 0.02 ICP-MS
L106 iAs no
0 0
L106 Pb yes Closed microwave HNO3 100 0.02 ICP-MS
N001 As
BCR 482
Closed microwave HNO3
200 C, 90 min extraction 90C with dilluted HCl
(0.07 M) + peroxide
AAS
N001 Cd
AAS
N001 Hg
CV-AFS
N001 iAs
extraction, 90C extraction 90C with
dilluted HCl LC-ICP-MS
N001 Pb
Closed microwave HNO3
AAS
N002 As IMEP119
AOAC 999.10
Closed microwave H2O2, HNO3
180 C for 30 min
80-110 0.067 AAS
N002 Cd
80-110 0.0033 AAS
N002 Hg IMEP103
80-110 0.016 HG-AAS
N002 iAs
X X
N002 Pb IMEP119
Closed microwave H2O2, HNO3 80-110 0.0033 AAS
N003 As
EN15763:2009 (for total element analysis) and
prEN16802 for iAs
Closed microwave HNO3
approx 200°C and 20 min
Waterbath extraction at 90°C with dilute HNO3 and H2O2 followed by anion-exchange
HPLC-ICPMS determinaton using matrix matched external
calibration.
111 0.001 ICP-MS
N003 Cd
94 0.001 ICP-MS
N003 Hg
107 0.01 ICP-MS
N003 iAs
Waterbath assisted extraction with dilute
acid
0,1 M HNO3 in 3% H2O2
91 0.003 HPLC-ICP-MS
N003 Pb
Closed microwave HNO3 101 0.012 ICP-MS
N004 As SRM 3256 Green Tea
-
SIST EN 15763 and EPA 7473
Closed microwave H2O2, HNO3
15 min. to 200oC and 20 min. on 200oC
- 108 0.02 ICP-MS
N004 Cd
BCR 150 Skim milk powder
- - 94 0.001 ICP-MS
N004 Hg - For total Hg we used
direct mercury analyser.
X - 88 0.005 CV-AAS
N004 iAs SRM 3256 Green Tea
- X X - - 0.05
N004 Pb BCR 063R Skim
milk powder - Closed microwave H2O2, HNO3 - 98 0.01 ICP-MS
N005 As BCR 185R Closed microwave H2O2, HNO3 120 C/20min iAs was not determined
0.005 ICP-MS
N005 Cd
0.005 ICP-MS

52
Part. key
Measurand CRM - method
validation CRM - instrument
calibration Standard Method Used Digestion type Digestion mixture Digestion temperature
Analytical method for the iAs determination
Recovery (%)
LODs Technique
N005 Hg SRM 2974a
No digestion. No digestion
0.0005 AAS
N005 iAs
X X
N005 Pb BCR185 R
Closed microwave H2O2, HNO3
0.005 ICP-MS
N006 As
EN 15763:2009; EN 13806:2002.
X X
Main step 180°C 30 min
N006 Cd
MR 1 g/l MR 1 g/l Closed microwave H2O2, HNO3 97 0.0001 ICP-MS
N006 Hg 96.7 0.003 FIMS
N006 iAs
X X
N006 Pb MR 1 g/l MR 1 g/l Closed microwave H2O2, HNO3 104 0.0005 ICP-MS
N007 As
NIST 1547
EN 15763
Closed microwave
4. HNO3
230 Extraction with HNO3 + H2O2,
determination with HPLC-ICPMS - EN 16802
100 0.013 ICP-MS
N007 Cd HNO3
100 0.0036 ICP-MS
N007 Hg
100 0.0075 ICP-MS
N007 iAs
Extraction with HNO3 and H2O2
H2O2, HNO3 100 0.01 HPLC-ICP-MS
N007 Pb NIST 1547
Closed microwave HNO3 100 0.011 ICP-MS
N008 As IMEP-118
Sigma-Aldrich
Closed microwave
H2O2, HNO3 For As, Cd, Pb: first stage: ramp 20 min, hold 40 min,
temperature 150 ºC; second stage: ramp 20 min, hold 40
min, temperature 180 ºC
100 0.005 ICP-MS
N008 Cd 100 0.005 ICP-MS
N008 Hg
H2SO4 100 0.02 CV-AAS
N008 iAs
X X
N008 Pb IMEP-118 Sigma-Aldrich Closed microwave H2O2, HNO3 100 0.01 ICP-MS
N009 As Y Y
EN 14084:2003
Closed microwave H2O2, HNO3
165oC / 15min
1.1 0.03 HG-AAS
N009 Cd Y Y 0.856 0.005 AAS
N009 Hg Y Y 0.993 0.03 CV-AAS
N009 iAs
X X
N009 Pb Y Y Closed microwave H2O2, HNO3 0.91 0.02 AAS
N010 As
X X
200oC/ 25min, cooling/20min
N010 Cd BCR 191 BCR 610 1. Closed microwave 4. HNO3
100 0.003 GF-AAS
N010 Hg
X X
N010 iAs
X X
N010 Pb BCR 191 BCR 713 1. Closed microwave 4. HNO3
100 0.008 GF-AAS
N011 As IRMM-804
Closed microwave HNO3
Total As, Cd, Pb: 180°C, 30 minutes; iAs: 90°C, 60
minutes
0.5 g sample + 9 ml HNO3 0.11M + 1 ml H2O2 30%; MAE at 90°C for 60 minutes with constant
stirring
0.0012 ICP-MS
N011 Cd
0.0003 ICP-MS
N011 Hg BCR-150
No sample digestion,
direct mercury analysis
X
0.0001 Direct Mercury Analysis
N011 iAs NMIJ-7503a, NMIJ-7532a
Closed microwave
H2O2, HNO3
0.0006 HPLC-ICP-MS
N011 Pb IRMM-804
HNO3
0.0018 ICP-MS
N012 As DORM-4
Closed microwave
H2O2, HNO3
We have used 150C / 20 min and 180C/ 10min.
Determination by HPLC-ICP-MS after microwave assisted
extraction.
102 0.0003 ICP-MS
N012 Cd
H2O2, HNO3 102 0.0001 ICP-MS
N012 Hg IAEA-336
direct mercury
analyser without digestion
X 99.8 0.0001 Direct mercury analysis
N012 iAs IMEP32-7
for iAs microwave
assisted extraction. H2O2, HCl 88 0.008 HPLC-ICP-MS
N012 Pb DORM-4
Closed microwave H2O2, HNO3 100 0.002 ICP-MS
N013 As
Closed microwave HNO3
200ºc y 20´ HPLC-ICP-MS
ICP-MS
N013 Cd
ICP-MS
N013 Hg
Autoanalyser
N013 iAs
X X
LC-ICP-MS
N013 Pb
Closed microwave HNO3
ICP-MS
N014 As
Total Arsenic - EN 14546:2005
Dry ashing
HNO3, Magnesium nitrate hexahydrate
and magnesium oxide ashing aid
mixture, HCl
Closed microwave - 200C / 20min, Dry Ashing - 450C / 24
to 48hours
1. Hydrolysis step using HCl. 2. Reduction and chloroform
extraction. 3. Clean-up step. 4. Back extraction in 1M HCl. 5. Dry ashing and quantification by HG-
0.006 HG-AAS
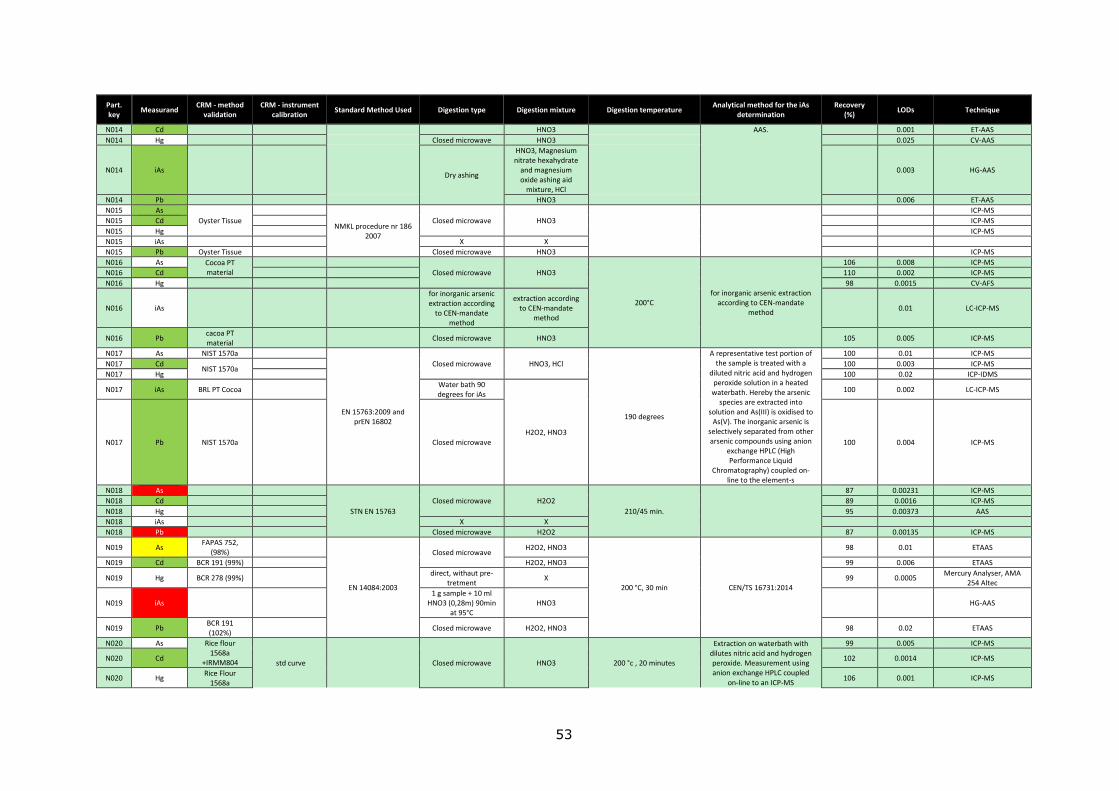
53
Part. key
Measurand CRM - method
validation CRM - instrument
calibration Standard Method Used Digestion type Digestion mixture Digestion temperature
Analytical method for the iAs determination
Recovery (%)
LODs Technique
N014 Cd
HNO3 AAS.
0.001 ET-AAS
N014 Hg
Closed microwave HNO3
0.025 CV-AAS
N014 iAs Dry ashing
HNO3, Magnesium nitrate hexahydrate
and magnesium oxide ashing aid
mixture, HCl
0.003 HG-AAS
N014 Pb
HNO3
0.006 ET-AAS
N015 As
Oyster Tissue
NMKL procedure nr 186 2007
Closed microwave HNO3
ICP-MS
N015 Cd
ICP-MS
N015 Hg
ICP-MS
N015 iAs
X X
N015 Pb Oyster Tissue
Closed microwave HNO3
ICP-MS
N016 As Cocoa PT material
Closed microwave HNO3
200°C for inorganic arsenic extraction
according to CEN-mandate method
106 0.008 ICP-MS
N016 Cd
110 0.002 ICP-MS
N016 Hg
98 0.0015 CV-AFS
N016 iAs
for inorganic arsenic extraction according
to CEN-mandate method
extraction according to CEN-mandate
method
0.01 LC-ICP-MS
N016 Pb cacoa PT material
Closed microwave HNO3 105 0.005 ICP-MS
N017 As NIST 1570a
EN 15763:2009 and prEN 16802
Closed microwave HNO3, HCl
190 degrees
A representative test portion of the sample is treated with a
diluted nitric acid and hydrogen peroxide solution in a heated
waterbath. Hereby the arsenic species are extracted into
solution and As(III) is oxidised to As(V). The inorganic arsenic is
selectively separated from other arsenic compounds using anion
exchange HPLC (High Performance Liquid
Chromatography) coupled on-line to the element-s
100 0.01 ICP-MS
N017 Cd NIST 1570a
100 0.003 ICP-MS
N017 Hg
100 0.02 ICP-IDMS
N017 iAs BRL PT Cocoa
Water bath 90 degrees for iAs
H2O2, HNO3
100 0.002 LC-ICP-MS
N017 Pb NIST 1570a
Closed microwave 100 0.004 ICP-MS
N018 As
STN EN 15763
Closed microwave H2O2
210/45 min.
87 0.00231 ICP-MS
N018 Cd
89 0.0016 ICP-MS
N018 Hg
95 0.00373 AAS
N018 iAs
X X
N018 Pb
Closed microwave H2O2 87 0.00135 ICP-MS
N019 As FAPAS 752,
(98%)
EN 14084:2003
Closed microwave H2O2, HNO3
200 °C, 30 min CEN/TS 16731:2014
98 0.01 ETAAS
N019 Cd BCR 191 (99%)
H2O2, HNO3 99 0.006 ETAAS
N019 Hg BCR 278 (99%)
direct, withaut pre-tretment
X 99 0.0005 Mercury Analyser, AMA
254 Altec
N019 iAs
1 g sample + 10 ml HNO3 (0,28m) 90min
at 95°C HNO3
HG-AAS
N019 Pb BCR 191 (102%)
Closed microwave H2O2, HNO3 98 0.02 ETAAS
N020 As Rice flour 1568a
+IRMM804 std curve Closed microwave HNO3 200 °c , 20 minutes
Extraction on waterbath with dilutes nitric acid and hydrogen peroxide. Measurement using anion exchange HPLC coupled
on-line to an ICP-MS
99 0.005 ICP-MS
N020 Cd 102 0.0014 ICP-MS
N020 Hg Rice Flour
1568a 106 0.001 ICP-MS

54
Part. key
Measurand CRM - method
validation CRM - instrument
calibration Standard Method Used Digestion type Digestion mixture Digestion temperature
Analytical method for the iAs determination
Recovery (%)
LODs Technique
N020 iAs Rice flour ERM
BC 211 Waterbath H2O2, HNO3 not done 0.0084 LC-ICP-MS
N020 Pb Rice flour IRMM804
Closed microwave 4. HNO3 97 0.0033 ICP-MS
N021 As DORM-3
EN 15763 (modified)
Closed microwave H2O2, HNO3
180 C/ 10 minutes
87 0.005 ICP-MS
N021 Cd BCR-191 83 0.0003 ICP-MS
N021 Hg DORM-3 88 0.001 ICP-MS
N021 iAs
X X
N021 Pb BCR-191 Closed microwave H2O2, HNO3 87 0.0015 ICP-MS
N022 As ERM 278k
standard solution
Closed microwave HNO3
200°C / 25 min
0.006 ICP-MS
N022 Cd NIST 2384
0.001 ICP-MS
N022 Hg ERM 278k
0.006 ICP-MS
N022 iAs
X X
N022 Pb NIST 2384 standard solution Closed microwave HNO3
0.003 ICP-MS
N025 As NIST 1566b
EN 14083:2003,. EN 14546:2005.
Dry ashing HNO3
according to the instruction of the producer of the
microwave digestion system
Sample was hydrolysed using concentrated hydrochloric acid. After reduction by hydrobromic acid and htdrazine sulfate, the
inorganic arsenic was extracted into chloroform, then back-extracted into 1M HCl, dry-
ashed and quantified by HG-AAS
95 0.025 HG-AAS
N025 Cd NIST 1566b, CTA-OTL-1
Closed microwave H2O2, 4. HNO3 102 0.003 AAS
N025 Hg NIST 1566b,
BCR-422,1568a
in case of mercury direct determination
was performed without any
digestion mixture (AMA 254)
X 100 0.0002 CV-AAS
N025 iAs control
material(after PT
Dry ashing HNO3 74 0.04 HG-AAS
N025 Pb CTA-OTL-1,
1566b Closed microwave H2O2, 4. HNO3 87 0.025 AAS
N026 As LGC 7162
As Stds
Closed microwave H2O2, 4. HNO3
22 Minutes The laboratory does not carry
out iAs analyses
78.8 0.05 ICP-MS
N026 Cd Cd Stds. 107.8 0.003 ICP-MS
N026 Hg TORT 3 Hg Stds 93.1 0.01 ICP-MS
N026 iAs
X X
N026 Pb LGC 7162 Pb Stds Closed microwave H2O2, 4. HNO3 99.9 0.03 ICP-MS
N027 As CRM - ERM CRM - ERM Closed microwave HNO3
For Cd, Pb, As : 5 minutes at 140°C then 20 minutes at
200°C - For iAs : 4 minutes at 80°C
100 0.02 ICP-MS
N027 Cd
ERM ERM
100 0.01 ICP-MS
N027 Hg thermal
decomposition (AAS-gold amalgamation)
no digestion mixture
100 0.01 thermal decomposition-
amalgamation-AAS (AMA254)
N027 iAs Closed microwave
H2O
100 0.05 HPLC-ICP-MS
N027 Pb HNO3
100 0.01 ICP-MS
N033 As
BCR185R
Closed microwave
4. HNO3, HCl
ramp to 220C over 20 minutes, held 220C for 15
minutes
hydrochloric acid solubilization, reduction, chloroform extraction
& back-extraction into hydrochloric acid
97 0.001 ICP-MS
N033 Cd
4. HNO3, HCl 95 0.001 ICP-MS
N033 Hg
4. HNO3, HCl 91 0.001 ICP-MS
N033 iAs IMEP107
room temperature acid solubilization
HCl 83 0.004 ICP-MS
N033 Pb BCR185R
Closed microwave 4. HNO3, HCl 95 0.003 ICP-MS
N034 As
AOAC, 974.14 (2005), AOAC, 999.10: (2010)
Closed microwave H2O2, 4. HNO3
200 0 C/40 minutes
0.012 AAS
N034 Cd
91.6
AAS
N034 Hg
0.016 CV-AAS
N034 iAs
X X
N034 Pb
Closed microwave H2O2, 4. HNO3
83.1
AAS
N038 As
LST EN 15763:2010 Closed microwave H2O2, 4. HNO3 200 degres of Celsium, 30
min.
0.017 ICP-MS
N038 Cd
0.0033 ICP-MS
N038 Hg
0.0017 ICP-MS
N038 iAs
X X
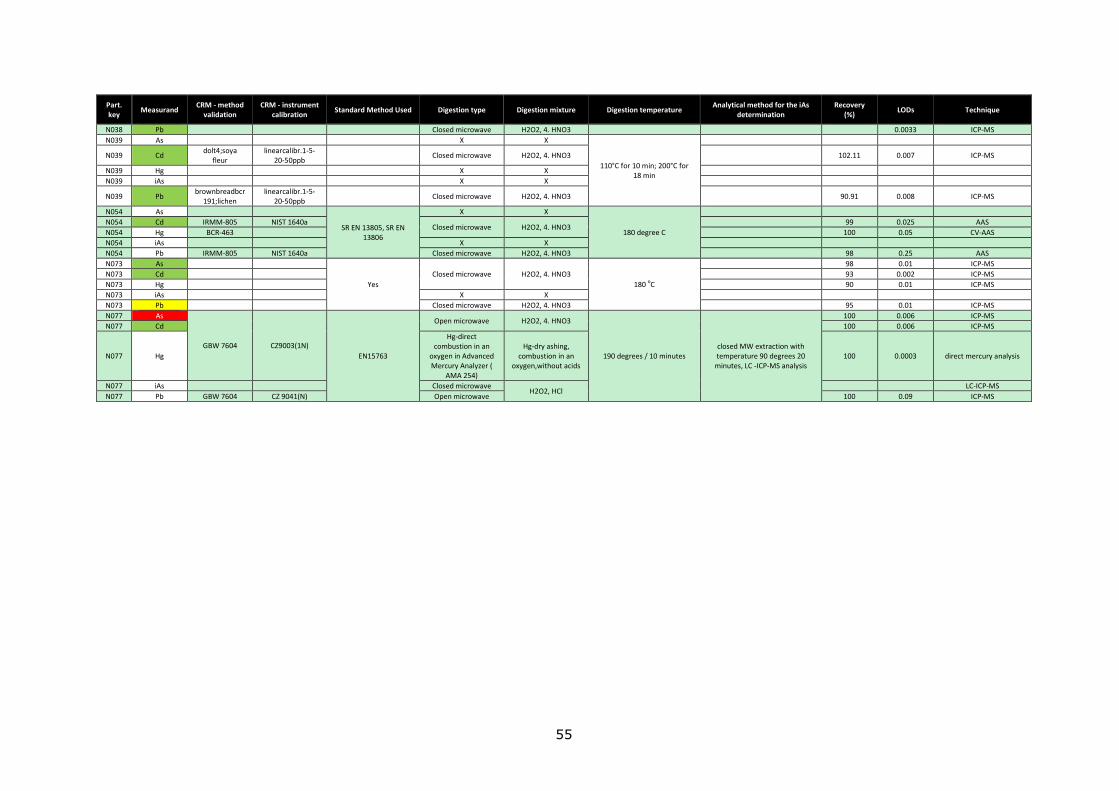
55
Part. key
Measurand CRM - method
validation CRM - instrument
calibration Standard Method Used Digestion type Digestion mixture Digestion temperature
Analytical method for the iAs determination
Recovery (%)
LODs Technique
N038 Pb
Closed microwave H2O2, 4. HNO3
0.0033 ICP-MS
N039 As
X X
110°C for 10 min; 200°C for 18 min
N039 Cd dolt4;soya
fleur linearcalibr.1-5-
20-50ppb Closed microwave H2O2, 4. HNO3
102.11 0.007 ICP-MS
N039 Hg
X X
N039 iAs
X X
N039 Pb brownbreadbcr
191;lichen linearcalibr.1-5-
20-50ppb Closed microwave H2O2, 4. HNO3
90.91 0.008 ICP-MS
N054 As
SR EN 13805, SR EN 13806
X X
180 degree C
N054 Cd IRMM-805 NIST 1640a Closed microwave H2O2, 4. HNO3
99 0.025 AAS
N054 Hg BCR-463
100 0.05 CV-AAS
N054 iAs
X X
N054 Pb IRMM-805 NIST 1640a Closed microwave H2O2, 4. HNO3 98 0.25 AAS
N073 As
Yes
Closed microwave H2O2, 4. HNO3
180 oC
98 0.01 ICP-MS
N073 Cd
93 0.002 ICP-MS
N073 Hg
90 0.01 ICP-MS
N073 iAs
X X
N073 Pb
Closed microwave H2O2, 4. HNO3
95 0.01 ICP-MS
N077 As
GBW 7604 CZ9003(1N)
EN15763
Open microwave H2O2, 4. HNO3
190 degrees / 10 minutes closed MW extraction with temperature 90 degrees 20
minutes, LC -ICP-MS analysis
100 0.006 ICP-MS
N077 Cd 100 0.006 ICP-MS
N077 Hg
Hg-direct combustion in an
oxygen in Advanced Mercury Analyzer (
AMA 254)
Hg-dry ashing, combustion in an
oxygen,without acids 100 0.0003 direct mercury analysis
N077 iAs
Closed microwave H2O2, HCl
LC-ICP-MS
N077 Pb GBW 7604 CZ 9041(N) Open microwave 100 0.09 ICP-MS

1
How to obtain EU publications
Our publications are available from EU Bookshop (http://publications.europa.eu/howto/index_en.htm),
where you can place an order with the sales agent of your choice.
The Publications Office has a worldwide network of sales agents.
You can obtain their contact details by sending a fax to (352) 29 29-42758.
Europe Direct is a service to help you find answers to your questions about the European Union
Free phone number (*): 00 800 6 7 8 9 10 11
(*) Certain mobile telephone operators do not allow access to 00 800 numbers or these calls may be billed.
A great deal of additional information on the European Union is available on the Internet.
It can be accessed through the Europa server http://europa.eu

2
JRC Mission
As the Commission’s
in-house science service,
the Joint Research Centre’s
mission is to provide EU
policies with independent,
evidence-based scientific
and technical support
throughout the whole
policy cycle.
Working in close
cooperation with policy
Directorates-General,
the JRC addresses key
societal challenges while
stimulating innovation
through developing
new methods, tools
and standards, and sharing
its know-how with
the Member States,
the scientific community
and international partners.
Serving society Stimulating innovation Supporting legislation
Related Documents