Determination of Tolerable Transmitter EIRP Levels for High Precision GNSS Receivers 57th Meeting of the CGSIC at the ION GNSS+ 2017 Conference Portland, Oregon September 25, 2017 Advancing transportation innovation for the public good Hadi Wassaf, Stephen Mackey, Karen Van Dyke

Welcome message from author
This document is posted to help you gain knowledge. Please leave a comment to let me know what you think about it! Share it to your friends and learn new things together.
Transcript

Determination of Tolerable Transmitter EIRP
Levels for High Precision GNSS Receivers
57th Meeting of the CGSIC at the ION GNSS+ 2017 Conference Portland, Oregon
September 25, 2017
Advancing transportation innovation for the public good
Hadi Wassaf, Stephen Mackey, Karen Van Dyke
Determination of Tolerable Transmitter EIRP
Levels for High Precision GNSS Receivers
57th Meeting of the CGSIC at the ION GNSS+ 2017 Conference Portland, Oregon
September 25, 2017
Advancing transportation innovation for the public good
Hadi Wassaf, Stephen Mackey, Karen Van Dyke

3
Acknowledgement
George Dimos
Pratik Gandhi
Chris Hegarty
Karl Shallberg

4
Outline
GPS Adjacent Band Compatibility Assessment Background
Technical approach
Receiver testing and results for high precision (HPR) receivers
HPR example use case
Transmit network and handset/mobile device parameters
Receive antenna patterns
Results and sensitivity analysis
Summary and Conclusion

5
GPS Adjacent Band Compatibility Assessment
Background
Propose adjacent band transmit power levels that can be tolerated by existing GNSS receivers for civil applications [excluding certified aviation applications - those are considered in a parallel FAA effort]
Accomplish this through: Seeking users, manufacturers, and other
stakeholders’ inputs and feedback throughout the planning, testing and analysis phases of this effort
Investigating use cases to determine practical limiting scenarios
GNSS receiver testing and antenna characterization
Data analysis to develop 1 dB CNR degradation interference tolerance masks (ITMs) for each GNSS receiver
Development of generic transmitter (base station and handheld) scenarios
Analysis and modeling to determine tolerable transmit power levels and regions of impact
6
Technical Approach
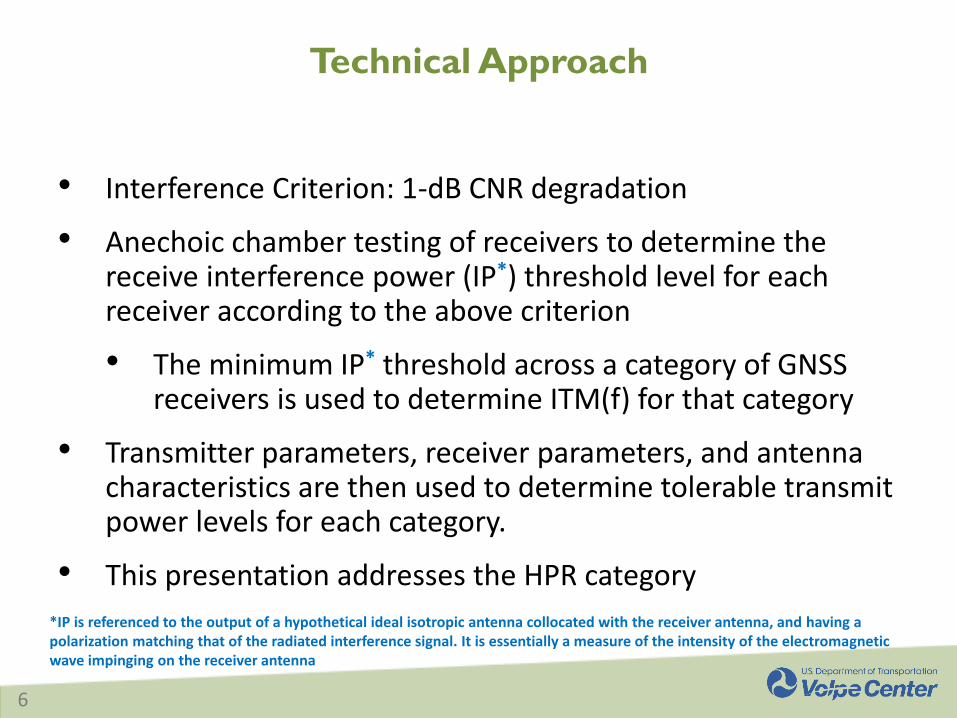
• Interference Criterion: 1-dB CNR degradation
• Anechoic chamber testing of receivers to determine the receive interference power (IP*) threshold level for each receiver according to the above criterion
• The minimum IP* threshold across a category of GNSS receivers is used to determine ITM(f) for that category
• Transmitter parameters, receiver parameters, and antenna characteristics are then used to determine tolerable transmit power levels for each category.
• This presentation addresses the HPR category *IP is referenced to the output of a hypothetical ideal isotropic antenna collocated with the receiver antenna, and having a
polarization matching that of the radiated interference signal. It is essentially a measure of the intensity of the electromagnetic wave impinging on the receiver antenna
7
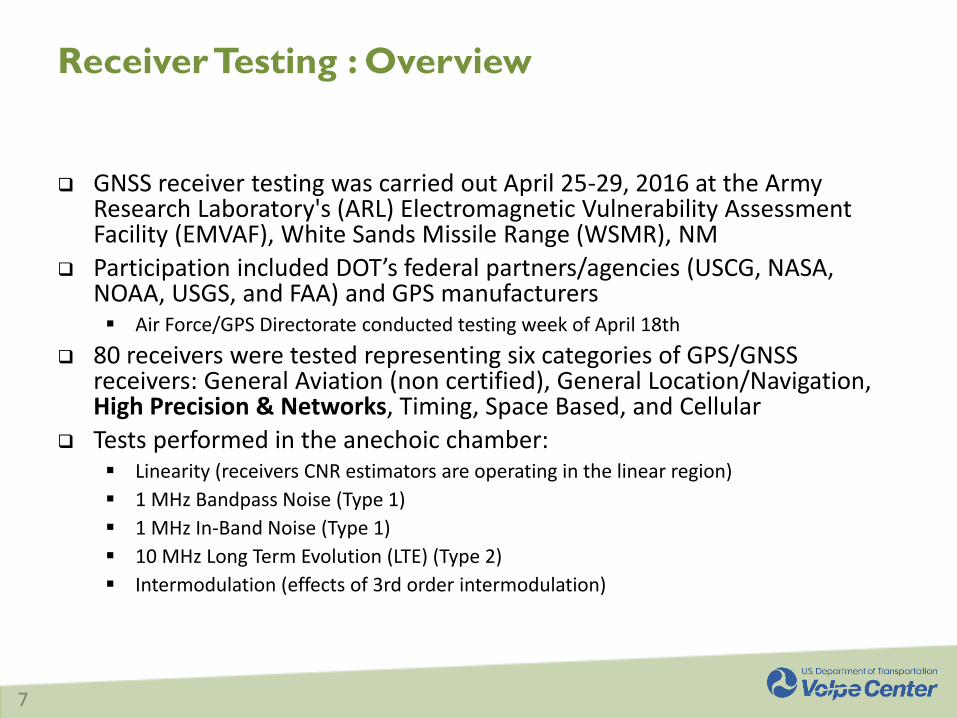
Receiver Testing : Overview
GNSS receiver testing was carried out April 25-29, 2016 at the Army Research Laboratory's (ARL) Electromagnetic Vulnerability Assessment Facility (EMVAF), White Sands Missile Range (WSMR), NM
Participation included DOT’s federal partners/agencies (USCG, NASA, NOAA, USGS, and FAA) and GPS manufacturers Air Force/GPS Directorate conducted testing week of April 18th
80 receivers were tested representing six categories of GPS/GNSS receivers: General Aviation (non certified), General Location/Navigation, High Precision & Networks, Timing, Space Based, and Cellular
Tests performed in the anechoic chamber: Linearity (receivers CNR estimators are operating in the linear region)
1 MHz Bandpass Noise (Type 1)
1 MHz In-Band Noise (Type 1)
10 MHz Long Term Evolution (LTE) (Type 2)
Intermodulation (effects of 3rd order intermodulation)

8
Receiver Testing: Chamber Test Grid and Setup

9
Receiver Testing: Interference Test Signal
Frequencies and Power Profiles
1450 1460 1470 1480 1490 1500 1510 1520 1530 1540 1550 1560 1570 1580 1590 1600 1610 1620 1630 1640 1650 1660 1670 1680 1690 1700-140
-120
-100
-80
-60
-40
-20
0
Frequency (MHz)
Targ
ete
d R
eceiv
e P
ow
er
(dB
m)
Type 1 & 2
Type 1
RNSS Band

10
Receiver Testing: GNSS Signals Used in Testing
Signal
GPS C/A-code
GPS L1 P-code
GPS L1C
GPS L1 M-code
GPS L2 P-code
SBAS L1
GLONASS L1 C
GLONASS L1 P
BeiDou B1I
Galileo E1 B/C

11
Receiver Testing: Data Processed to Produce a 1
dB Interference Tolerance Mask
Example for determining ITM(f) for 1 frequency (f=1545) for PRN 31 for one of the Devices Under Test (DUT)
IP vs. Time
CNR vs. Time
1 (dB)
𝑰𝑻𝑴 𝒇
12
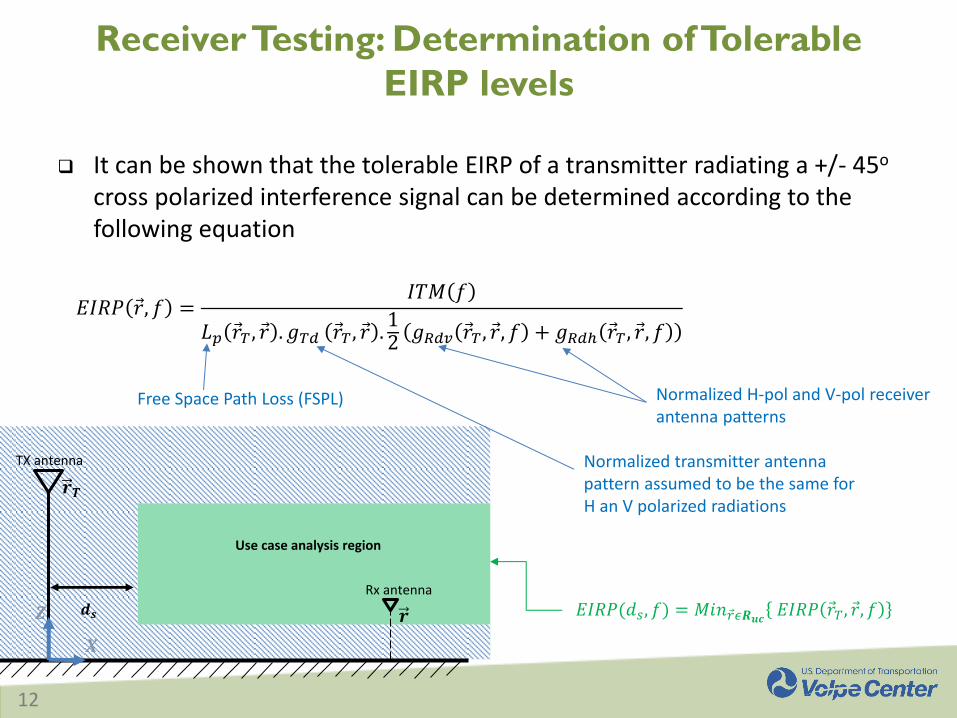
Receiver Testing: Determination of Tolerable
EIRP levels
It can be shown that the tolerable EIRP of a transmitter radiating a +/- 45o cross polarized interference signal can be determined according to the following equation
𝒅𝒔
Use case analysis region
TX antenna
Rx antenna
𝒓
𝑿
𝒓𝑻
𝒁
𝐸𝐼𝑅𝑃 𝑟 , 𝑓 =𝐼𝑇𝑀 𝑓
𝐿𝑝 𝑟 𝑇 , 𝑟 . 𝑔𝑇𝑑 𝑟 𝑇, 𝑟 .12
𝑔𝑅𝑑𝑣 𝑟 𝑇, 𝑟 , 𝑓 + 𝑔𝑅𝑑ℎ 𝑟 𝑇, 𝑟 , 𝑓
𝐸𝐼𝑅𝑃(𝑑𝑠, 𝑓) = 𝑀𝑖𝑛𝑟 𝜖𝑹𝒖𝒄 𝐸𝐼𝑅𝑃 𝑟 𝑇 , 𝑟 , 𝑓
Normalized H-pol and V-pol receiver antenna patterns
Free Space Path Loss (FSPL)
Normalized transmitter antenna pattern assumed to be the same for H an V polarized radiations
13
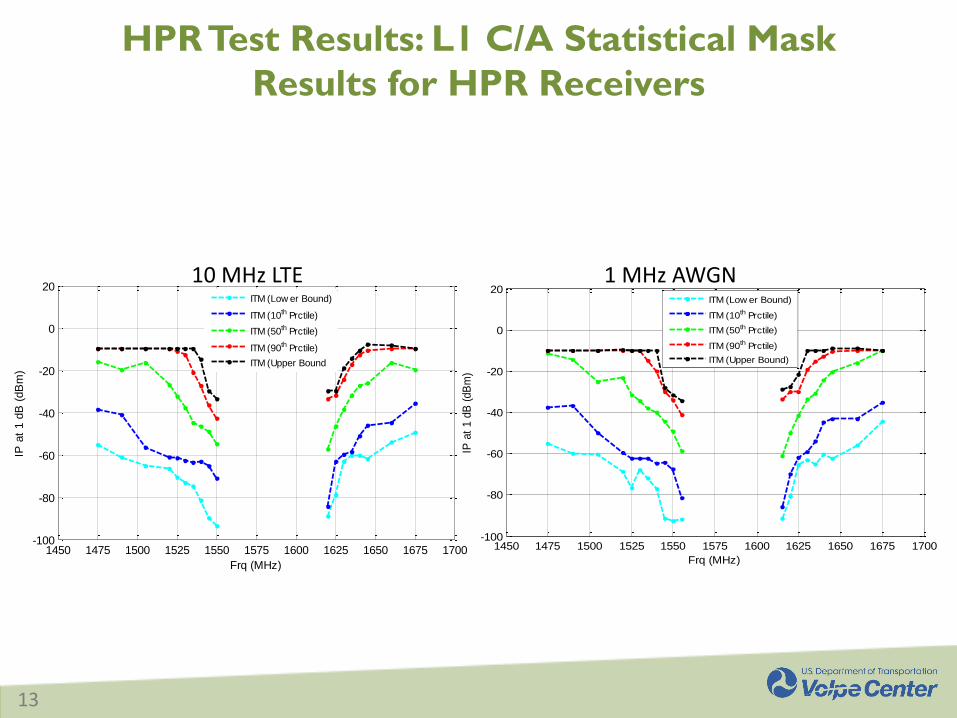
HPR Test Results: L1 C/A Statistical Mask
Results for HPR Receivers
1450 1475 1500 1525 1550 1575 1600 1625 1650 1675 1700-100
-80
-60
-40
-20
0
20
Frq (MHz)
IP a
t 1 d
B (
dB
m)
ITM (Low er Bound)
ITM (10th Prctile)
ITM (50th Prctile)
ITM (90th Prctile)
ITM (Upper Bound
10 MHz LTE 1 MHz AWGN
1450 1475 1500 1525 1550 1575 1600 1625 1650 1675 1700-100
-80
-60
-40
-20
0
20
Frq (MHz)
IP a
t 1 d
B (
dB
m)
ITM (Low er Bound)
ITM (10th Prctile)
ITM (50th Prctile)
ITM (90th Prctile)
ITM (Upper Bound)
14
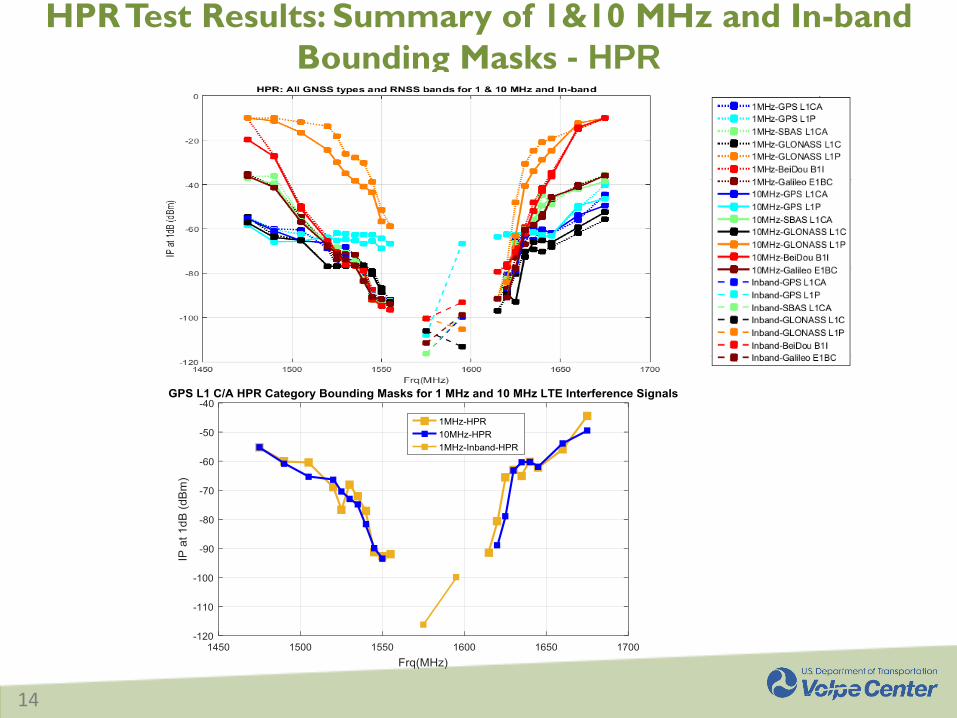
HPR Test Results: Summary of 1&10 MHz and In-band
Bounding Masks - HPR

15
HPR Example Use Case: Construction and Machine
Control
Photo courtesy of WSP Canada Inc
Surveying
Photo courtesy of WSP Canada Inc
Photo courtesy ThinkStock Photo courtesy Kadmy/ThinkStock
Photo courtesy Medvedkov/ThinkStock
16
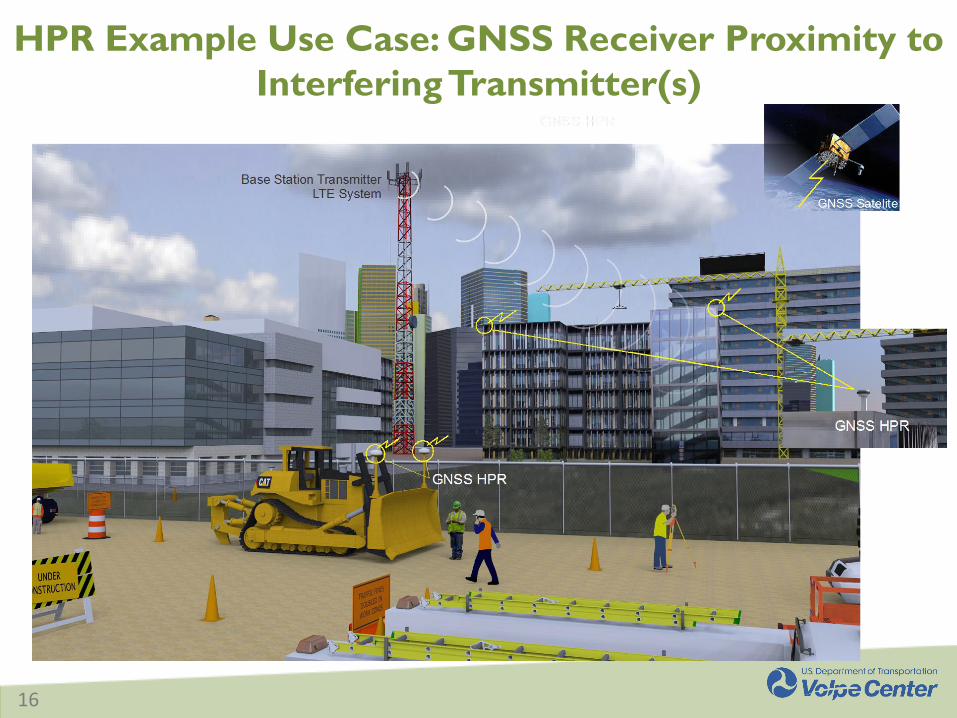
HPR Example Use Case: GNSS Receiver Proximity to
Interfering Transmitter(s)

17
Transmit Network Parameters: ITU-R M.2292 Macro Base
Stations
Macro Urban • 16 dBi antenna gain • +/-45° polarization • 3 sectors • EIRP: 59 dBm • 25 m height • 10 deg downtilt • 0.25 – 1 km cell radius
Elevation Cut
Azimuth Cut (1 Sector)
18
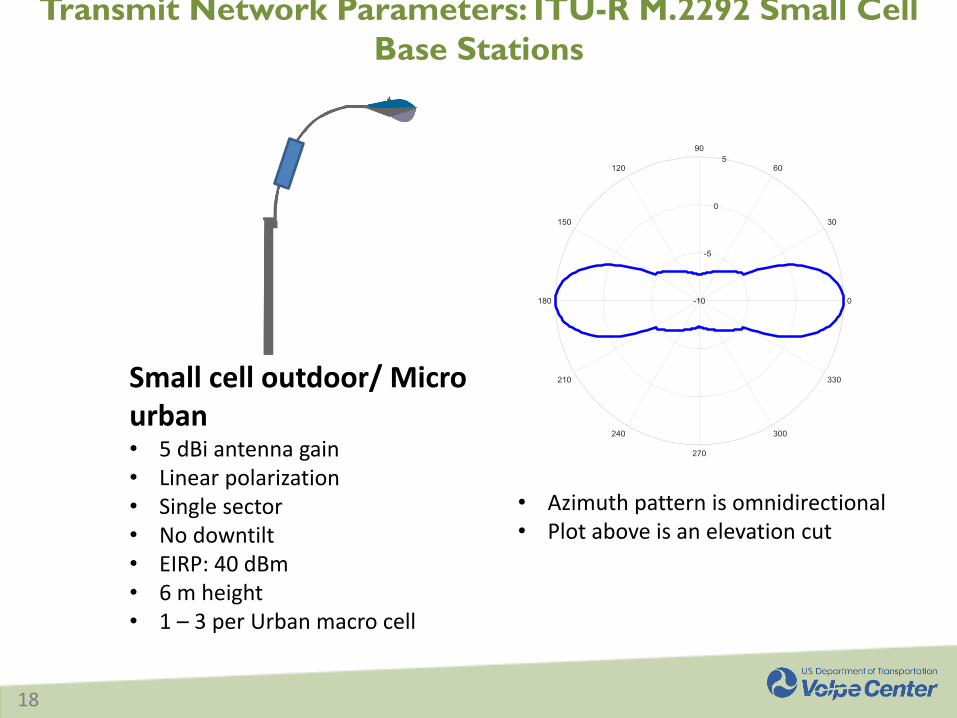
Transmit Network Parameters: ITU-R M.2292 Small Cell
Base Stations
Small cell outdoor/ Micro urban • 5 dBi antenna gain • Linear polarization • Single sector • No downtilt • EIRP: 40 dBm • 6 m height • 1 – 3 per Urban macro cell
• Azimuth pattern is omnidirectional • Plot above is an elevation cut
19
Handset/Mobile Device Parameters
23 dBm EIRP (assumes 0 dBi antenna gain and no body loss)
Isotropic transmit antenna gain
Vertical polarization
Assumed to be at 2 m height above ground
20
Receive Antenna Characteristics: VPOL and
HPOL Patterns
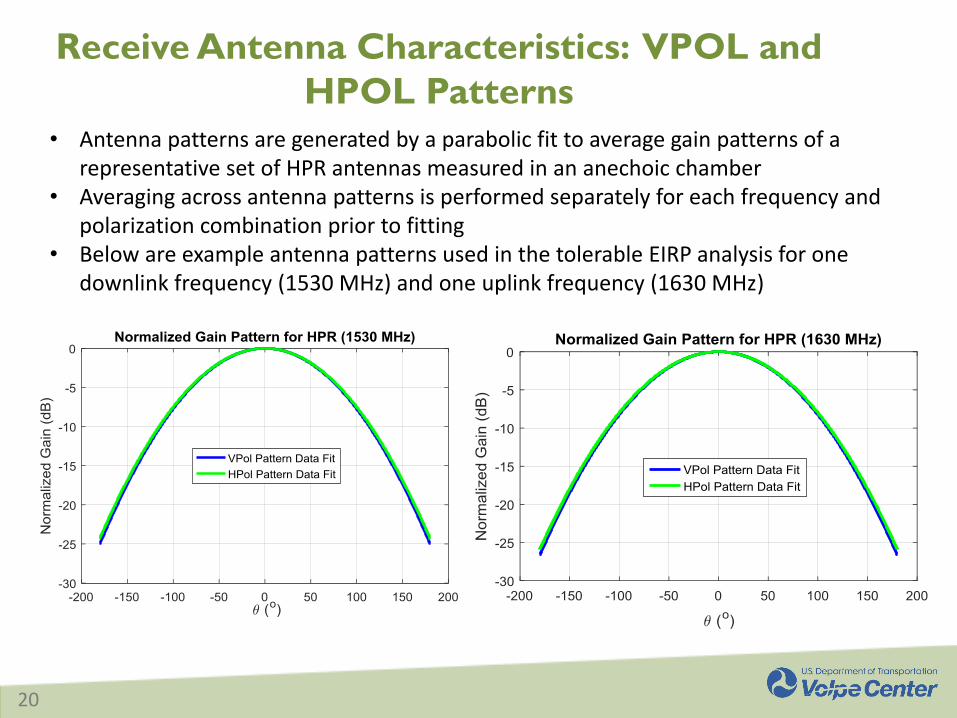
• Antenna patterns are generated by a parabolic fit to average gain patterns of a representative set of HPR antennas measured in an anechoic chamber
• Averaging across antenna patterns is performed separately for each frequency and polarization combination prior to fitting
• Below are example antenna patterns used in the tolerable EIRP analysis for one downlink frequency (1530 MHz) and one uplink frequency (1630 MHz)

21
Results: Tolerable EIRP Levels: Single Base Station
Transmitter, FSPL
For a 1530 MHz interference signal, the tolerable EIRP Levels are below 0.25 watts at a standoff distance of ½ km
At 10m stand-off distance the tolerable EIRP ranges from 1 𝜇𝑊 to 1 𝑚𝑊 for interference for an interference signal with center frequency in the 1500 to 1550 frequency range
For a 1675 MHz interference signal the tolerable EIRP is on the order of 30 𝑚𝑊 for the same 10m stand-off distance
22
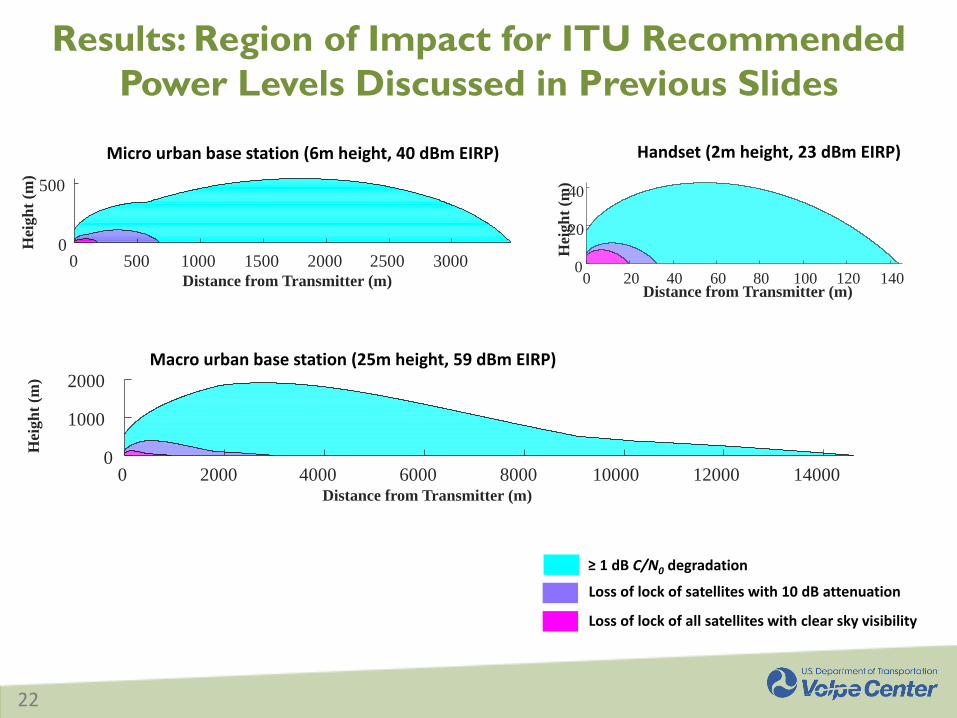
Handset (2m height, 23 dBm EIRP)
Results: Region of Impact for ITU Recommended
Power Levels Discussed in Previous Slides
≥ 1 dB C/N0 degradation
Loss of lock of satellites with 10 dB attenuation
Loss of lock of all satellites with clear sky visibility
Micro urban base station (6m height, 40 dBm EIRP)
Macro urban base station (25m height, 59 dBm EIRP)
0 500 1000 1500 2000 2500 3000 Distance from Transmitter (m)
0
500
Hei
gh
t (m
)
0 20 40 60 80 100 120 140 Distance from Transmitter (m)
0
20
40
Hei
gh
t (m
)
0 2000 4000 6000 8000 10000 12000 14000 Distance from Transmitter (m)
0
1000
2000
Hei
gh
t (m
)
23
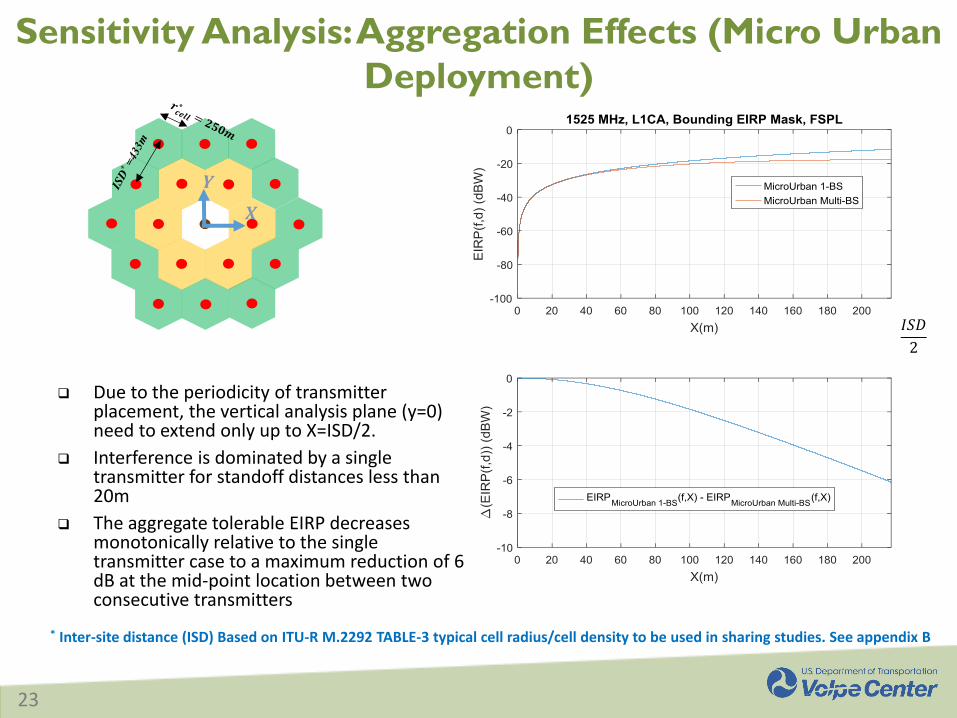
Sensitivity Analysis: Aggregation Effects (Micro Urban
Deployment)
Due to the periodicity of transmitter placement, the vertical analysis plane (y=0) need to extend only up to X=ISD/2.
Interference is dominated by a single transmitter for standoff distances less than 20m
The aggregate tolerable EIRP decreases monotonically relative to the single transmitter case to a maximum reduction of 6 dB at the mid-point location between two consecutive transmitters
𝑿
𝐼𝑆𝐷
2
* Inter-site distance (ISD) Based on ITU-R M.2292 TABLE-3 typical cell radius/cell density to be used in sharing studies. See appendix B
24
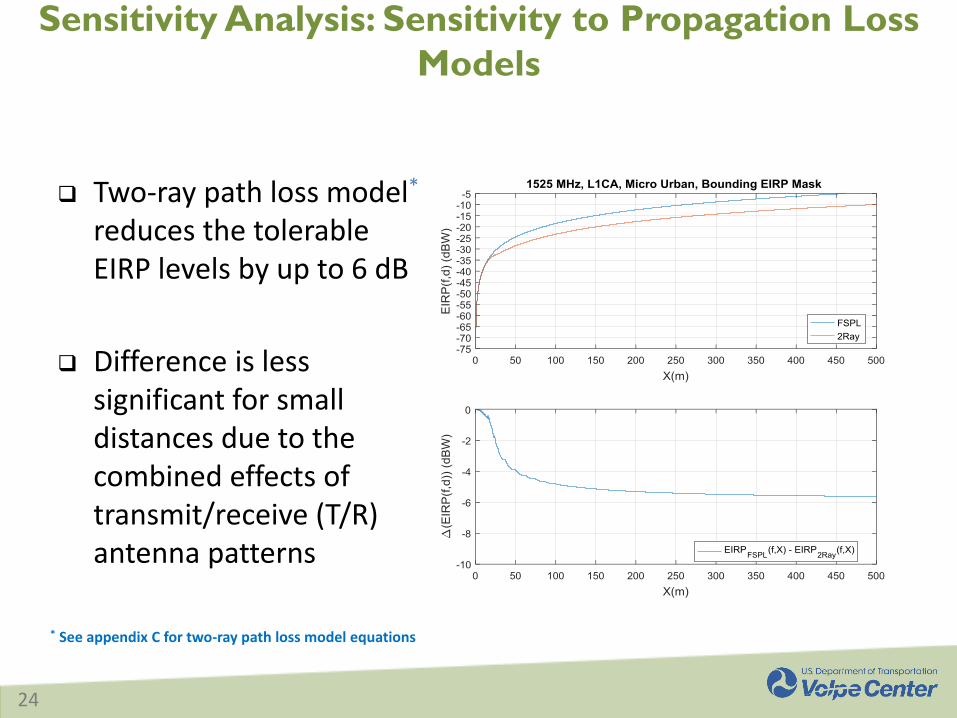
Sensitivity Analysis: Sensitivity to Propagation Loss
Models
Two-ray path loss model* reduces the tolerable EIRP levels by up to 6 dB
Difference is less significant for small distances due to the combined effects of transmit/receive (T/R) antenna patterns
* See appendix C for two-ray path loss model equations

25
Summary and Conclusion
Inverse modeling allows determination of tolerable EIRP levels when the receiver tolerable IP levels are known
Model takes into account the polarization dependent gain pattern of T/R antennas and is capable of considering aggregation and propagation model effects from multiple transmitters
For a micro-urban base station radiating a 10 MHz LTE signal, the tolerable transmit EIRP levels ranges from 1𝜇𝑊 𝑡𝑜 1𝑚𝑊 for center frequencies between 1500 and 1550, and is 30 𝑚𝑊 for the 1675 center frequency
Sensitivity analysis results for micro urban network configuration: Aggregation effects will limit the maximum tolerable power at larger distances up to the maximum
distance of ISD/2
Two ray path loss model results in a reduction of up to 6 dB at the maximum distance of ISD/2
When the recommended ITU power levels for transmitters are used, the maximum extent of the impact regions are
Transmitter type Extent of impact Region
Macro urban base station 14.5 km
Micro Urban base station 3.5 km
Mobile transmitter 140 m

26
Appendices
27
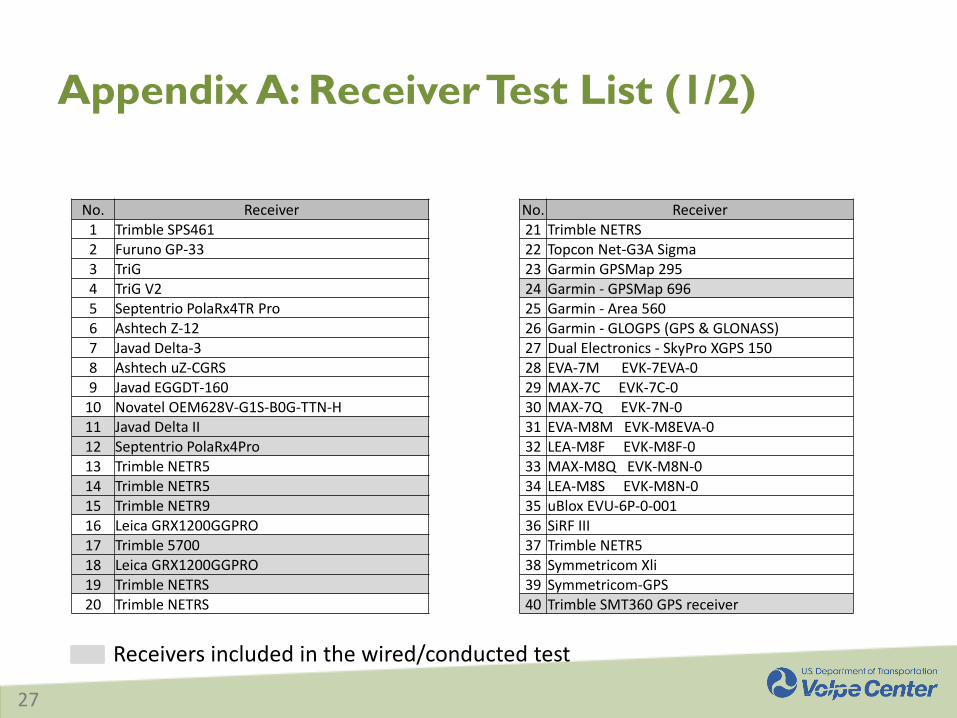
Appendix A: Receiver Test List (1/2)
No. Receiver 1 Trimble SPS461 2 Furuno GP-33 3 TriG 4 TriG V2 5 Septentrio PolaRx4TR Pro 6 Ashtech Z-12 7 Javad Delta-3 8 Ashtech uZ-CGRS 9 Javad EGGDT-160
10 Novatel OEM628V-G1S-B0G-TTN-H 11 Javad Delta II 12 Septentrio PolaRx4Pro 13 Trimble NETR5 14 Trimble NETR5 15 Trimble NETR9 16 Leica GRX1200GGPRO 17 Trimble 5700 18 Leica GRX1200GGPRO 19 Trimble NETRS 20 Trimble NETRS
No. Receiver 21 Trimble NETRS 22 Topcon Net-G3A Sigma 23 Garmin GPSMap 295 24 Garmin - GPSMap 696 25 Garmin - Area 560 26 Garmin - GLOGPS (GPS & GLONASS) 27 Dual Electronics - SkyPro XGPS 150 28 EVA-7M EVK-7EVA-0 29 MAX-7C EVK-7C-0 30 MAX-7Q EVK-7N-0 31 EVA-M8M EVK-M8EVA-0 32 LEA-M8F EVK-M8F-0 33 MAX-M8Q EVK-M8N-0 34 LEA-M8S EVK-M8N-0 35 uBlox EVU-6P-0-001 36 SiRF III 37 Trimble NETR5 38 Symmetricom Xli 39 Symmetricom-GPS 40 Trimble SMT360 GPS receiver
Receivers included in the wired/conducted test
28
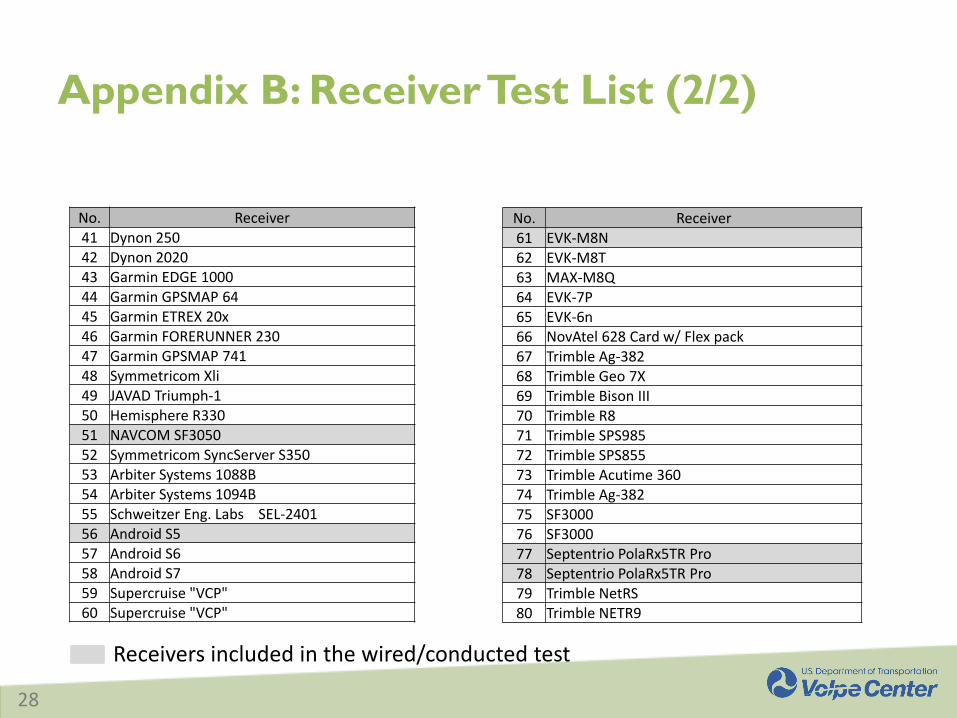
Appendix B: Receiver Test List (2/2)
No. Receiver 41 Dynon 250 42 Dynon 2020 43 Garmin EDGE 1000 44 Garmin GPSMAP 64 45 Garmin ETREX 20x 46 Garmin FORERUNNER 230 47 Garmin GPSMAP 741 48 Symmetricom Xli 49 JAVAD Triumph-1 50 Hemisphere R330 51 NAVCOM SF3050 52 Symmetricom SyncServer S350 53 Arbiter Systems 1088B 54 Arbiter Systems 1094B 55 Schweitzer Eng. Labs SEL-2401 56 Android S5 57 Android S6 58 Android S7 59 Supercruise "VCP" 60 Supercruise "VCP"
No. Receiver 61 EVK-M8N 62 EVK-M8T 63 MAX-M8Q 64 EVK-7P 65 EVK-6n 66 NovAtel 628 Card w/ Flex pack 67 Trimble Ag-382 68 Trimble Geo 7X 69 Trimble Bison III 70 Trimble R8 71 Trimble SPS985 72 Trimble SPS855 73 Trimble Acutime 360 74 Trimble Ag-382 75 SF3000 76 SF3000 77 Septentrio PolaRx5TR Pro 78 Septentrio PolaRx5TR Pro 79 Trimble NetRS 80 Trimble NETR9
Receivers included in the wired/conducted test
29
Appendix B: Inter-Site Distance
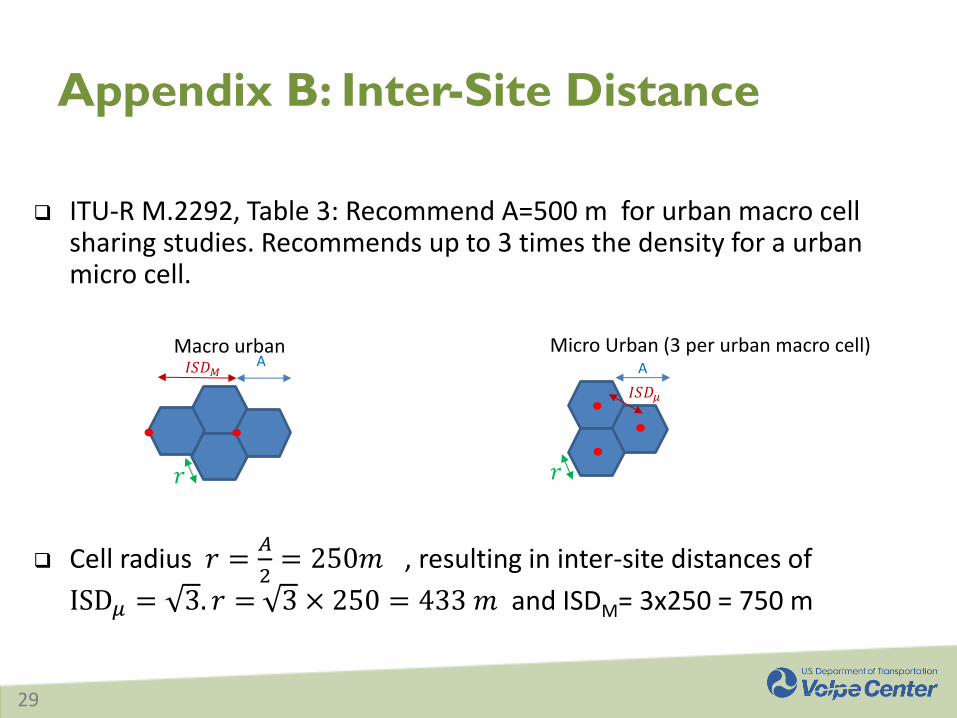
ITU-R M.2292, Table 3: Recommend A=500 m for urban macro cell sharing studies. Recommends up to 3 times the density for a urban micro cell.
Cell radius 𝑟 =𝐴
2= 250𝑚 , resulting in inter-site distances of
ISD𝜇 = 3. 𝑟 = 3 × 250 = 433 𝑚 and ISDM= 3x250 = 750 m
A Macro urban
𝑟
𝐼𝑆𝐷𝜇
A
Micro Urban (3 per urban macro cell)
𝑟
𝐼𝑆𝐷𝑀
30
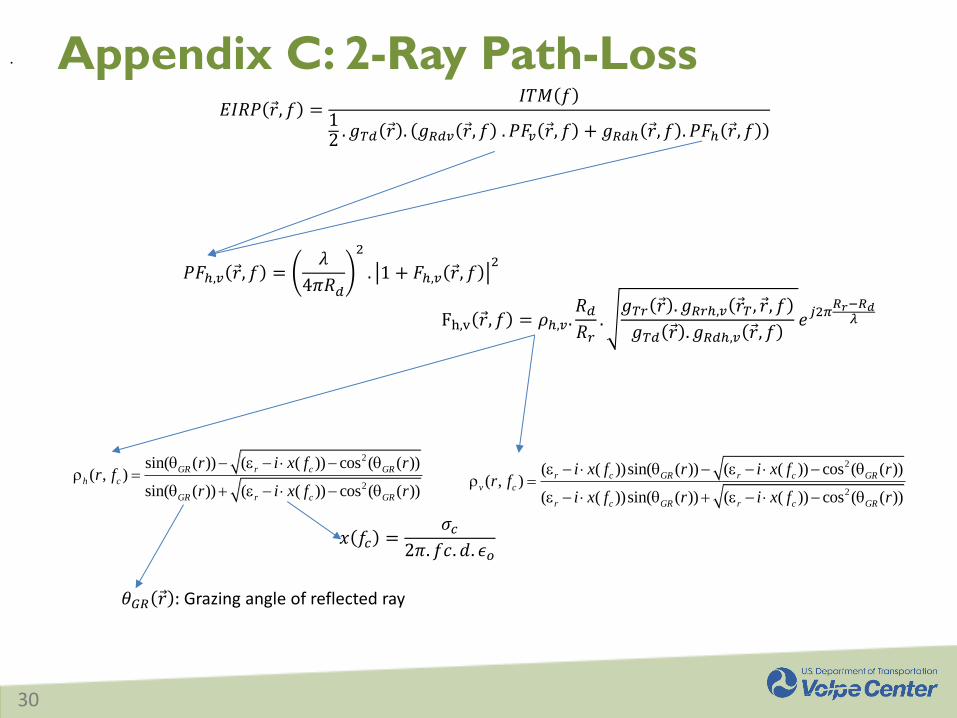
Appendix C: 2-Ray Path-Loss 𝐸𝐼𝑅𝑃 𝑟 , 𝑓 =
𝐼𝑇𝑀 𝑓
12. 𝑔𝑇𝑑 𝑟 . 𝑔𝑅𝑑𝑣 𝑟 , 𝑓 . 𝑃𝐹𝑣 𝑟 , 𝑓 + 𝑔𝑅𝑑ℎ 𝑟 , 𝑓 . 𝑃𝐹ℎ 𝑟 , 𝑓
𝑃𝐹ℎ,𝑣 𝑟 , 𝑓 =𝜆
4𝜋𝑅𝑑
2
. 1 + 𝐹ℎ,𝑣 𝑟 , 𝑓2
Fh,v 𝑟 , 𝑓 = 𝜌ℎ,𝑣.𝑅𝑑
𝑅𝑟.
𝑔𝑇𝑟 𝑟 . 𝑔𝑅𝑟ℎ,𝑣 𝑟 𝑇 , 𝑟 , 𝑓
𝑔𝑇𝑑 𝑟 . 𝑔𝑅𝑑ℎ,𝑣 𝑟 , 𝑓 𝑒
𝑗2𝜋𝑅𝑟−𝑅𝑑
𝜆
2
2
sin( ( )) ( ( )) cos ( ( ))( , )
sin( ( )) ( ( )) cos ( ( ))
GR r c GR
h c
GR r c GR
r i x f rr f
r i x f r
.
2
2
( ( ))sin( ( )) ( ( )) cos ( ( ))( , )
( ( ))sin( ( )) ( ( )) cos ( ( ))
r c GR r c GR
v c
r c GR r c GR
i x f r i x f rr f
i x f r i x f r
𝑥 𝑓𝑐 =𝜎𝑐
2𝜋. 𝑓𝑐. 𝑑. 𝜖𝑜
𝜃𝐺𝑅 𝑟 : Grazing angle of reflected ray
Related Documents