IOSR Journal of Applied Chemistry (IOSR-JAC) e-ISSN: 2278-5736. Volume 6, Issue 2 (Nov. – Dec. 2013), PP 30-57 www.iosrjournals.org www.iosrjournals.org 30 | Page Determination of the viability of an agricultural solid waste; corncob as an oil spill sorbent mop Kelle, H.I. 1 , Eboatu, A.N. 2 ,Ofoegbu O. 3 and 4 Udeozo I.P. 1 Chemistry Unit, National Open University of Nigeria, Lagos, Nigeria. 2 Department of Chemistry, Nnamdi Azikiwe University, Awka, Anambra State, Nigeria. 3 Department of Chemistry, Federal University of Agriculture, Makurdi, Benue State,Nigeria 4 Department of Chemical Sciences, Tansian University, Umunya, Anambra State , Nigeria. Abstract: Solid waste management has been a serious challenge facing most nations especially the developing nations. In Nigeria most of the cities are littered with solid waste. Corn cob an agricultural waste during its season is found littered in places where they are sold. As a way of managing the waste generated by corn cob, this study was undertaken to ascertain its viability and utilization as an oil spill sorbent mop. The absorption and recoverability of crude oil and its fractions namely; petrol, kerosene and diesel was studied and compared with a standard, a conventional synthetic absorbent mat used in oil spill mop which was subjected to the same experimental condition as corn cob. The experiment was performed with crude oil and its fraction only and a mixture of crude oil and its fraction on water. The result of the study reveals that the synthetic absorbent mat absorbed about five (5) times of crude oil and its fraction more than corn cob and recovered about ten (10) of the absorbed oil more than corn cob. The synthetic absorbent mat did not absorb water while sorbing the oils on water whereas corn cob did. Increase in contact time between corn cob and the oils and synthetic absorbent mat and the oils had no effect in the quantity of oil absorbed. Keywords: Corn cob, Synthetic absorbent mat, absorption, Recoverability, Solid waste . I. Introduction Solid wastes comprises all the wastes arising from human and animal activities that are normally solid, discarded as useless or unwanted (1). They emanate from residentially, commercial, industrial, mining and agricultural activities and they cause environmental problem (2). There are many ways of categorizing solid waste, such as source of the solid waste. Based on source, solid waste can be classified into domestic, municipal, industrial waste, agricultural waste and others (1, 2). Agricultural solid waste are those waste emanating from farm activities such as paddy husk, cassava stalks, corn residues, slaughter house residues etc. In Nigeria, a major feature of the urban environment, particularly from the beginning of the oil boom in the 1970’s was the rapid takeover of cities by all kinds of solid waste (3). Most state capitals and other large cities are littered with solid waste despite the presence of state and local government owned waste management agencies including private waste collectors (3). Solid waste is a general problem all over the world, the developing nations such as Nigeria, are having serious challenges managing their waste. The effects of not properly managed solid waste in the environment are numerous and includes forming haven for worms, flies, insects, vermins, rats, rodents, snakes and all forms of disease causing microorgasms (2). Solid waste littered in the environment makes it unsightly, When runoff from the land deposit solid waste into water bodies, it mars the natural beauty of the water source and reduces the natural quality of the water, rendering it unfit for sustenance of aquatic life (2). During decay of solid waste in water, such as food waste and agricultural waste (vegetable waste), bacteria and other disease causing microorgasms flourish. Insects and vermins abound and unpleasant odour is produced. Solid waste in water blocks traffic flow and may lead to accidents (2.) In Nigeria there have been so many reported cases of blocking of drainage channels and water ways with solid waste, eventually leading to flood. Corn cob is the hard thick cylindrical centre core on which are borne the grains or kernels of an ear of corn, usually in rows (4). It is chemically composed of 32.3 – 45.6 % cellulose, 39.8 % hemicelluloses and 6.7 – 13.9 % lignin (5, 6, 7). Corn cob is a solid waste product from subsistence food consumption and agricultural processing industries (8). These materials constitute environmental challenges (8). Corn is widely grown all over the world and a greater weight of corn is produced than the other grains. It is the most important staple food for Latin America and more than 1.2 billion people in sub-Saharan Africa. The worldwide production of maize is more than 785 million tonnes. United States is the leading country which is harvesting 40% of world’s total corn yield (9). South Africa, the Africa continents largest maize producer

Welcome message from author
This document is posted to help you gain knowledge. Please leave a comment to let me know what you think about it! Share it to your friends and learn new things together.
Transcript

IOSR Journal of Applied Chemistry (IOSR-JAC)
e-ISSN: 2278-5736. Volume 6, Issue 2 (Nov. – Dec. 2013), PP 30-57
www.iosrjournals.org
www.iosrjournals.org 30 | Page
Determination of the viability of an agricultural solid waste;
corncob as an oil spill sorbent mop
Kelle, H.I.1, Eboatu, A.N.
2 ,Ofoegbu O.
3 and
4 Udeozo I.P.
1 Chemistry Unit, National Open University of Nigeria, Lagos, Nigeria.
2 Department of Chemistry, Nnamdi Azikiwe University, Awka, Anambra State,
Nigeria. 3 Department of Chemistry, Federal University of Agriculture, Makurdi, Benue State,Nigeria 4 Department of Chemical Sciences, Tansian University, Umunya, Anambra State , Nigeria.
Abstract: Solid waste management has been a serious challenge facing most nations especially the developing
nations. In Nigeria most of the cities are littered with solid waste. Corn cob an agricultural waste during its
season is found littered in places where they are sold. As a way of managing the waste generated by corn cob,
this study was undertaken to ascertain its viability and utilization as an oil spill sorbent mop. The absorption
and recoverability of crude oil and its fractions namely; petrol, kerosene and diesel was studied and compared
with a standard, a conventional synthetic absorbent mat used in oil spill mop which was subjected to the same
experimental condition as corn cob. The experiment was performed with crude oil and its fraction only and a
mixture of crude oil and its fraction on water. The result of the study reveals that the synthetic absorbent mat
absorbed about five (5) times of crude oil and its fraction more than corn cob and recovered about ten (10) of
the absorbed oil more than corn cob. The synthetic absorbent mat did not absorb water while sorbing the oils
on water whereas corn cob did. Increase in contact time between corn cob and the oils and synthetic absorbent
mat and the oils had no effect in the quantity of oil absorbed.
Keywords: Corn cob, Synthetic absorbent mat, absorption, Recoverability, Solid waste .
I. Introduction Solid wastes comprises all the wastes arising from human and animal activities that are normally solid,
discarded as useless or unwanted (1). They emanate from residentially, commercial, industrial, mining and
agricultural activities and they cause environmental problem (2). There are many ways of categorizing solid
waste, such as source of the solid waste. Based on source, solid waste can be classified into domestic, municipal,
industrial waste, agricultural waste and others (1, 2).
Agricultural solid waste are those waste emanating from farm activities such as paddy husk, cassava
stalks, corn residues, slaughter house residues etc.
In Nigeria, a major feature of the urban environment, particularly from the beginning of the oil boom in
the 1970’s was the rapid takeover of cities by all kinds of solid waste (3). Most state capitals and other large
cities are littered with solid waste despite the presence of state and local government owned waste management
agencies including private waste collectors (3). Solid waste is a general problem all over the world, the
developing nations such as Nigeria, are having serious challenges managing their waste.
The effects of not properly managed solid waste in the environment are numerous and includes forming
haven for worms, flies, insects, vermins, rats, rodents, snakes and all forms of disease causing microorgasms (2).
Solid waste littered in the environment makes it unsightly, When runoff from the land deposit solid waste into
water bodies, it mars the natural beauty of the water source and reduces the natural quality of the water,
rendering it unfit for sustenance of aquatic life (2). During decay of solid waste in water, such as food waste and
agricultural waste (vegetable waste), bacteria and other disease causing microorgasms flourish. Insects and
vermins abound and unpleasant odour is produced. Solid waste in water blocks traffic flow and may lead to
accidents (2.)
In Nigeria there have been so many reported cases of blocking of drainage channels and water ways
with solid waste, eventually leading to flood.
Corn cob is the hard thick cylindrical centre core on which are borne the grains or kernels of an ear of
corn, usually in rows (4). It is chemically composed of 32.3 – 45.6 % cellulose, 39.8 % hemicelluloses and 6.7 –
13.9 % lignin (5, 6, 7). Corn cob is a solid waste product from subsistence food consumption and agricultural
processing industries (8). These materials constitute environmental challenges (8).
Corn is widely grown all over the world and a greater weight of corn is produced than the other grains.
It is the most important staple food for Latin America and more than 1.2 billion people in sub-Saharan Africa.
The worldwide production of maize is more than 785 million tonnes. United States is the leading country which
is harvesting 40% of world’s total corn yield (9). South Africa, the Africa continents largest maize producer

Determination of the viability of an agricultural solid waste; corncob as an oil spill sorbent mop
www.iosrjournals.org 31 | Page
harvested its biggest crop in three decades at 12.85 million tons in the 2009/2010 season (8). Nigeria was the
second largest producer of maize in Africa in the year 2001 with 4.62 million tons (8).
Initially solid waste management efforts were directed merely at the removal of waste from the urban
centres and the subsequent destruction of such waste. Later, attention shifted to waste utilization, waste
reduction, re – use and recycling, management of hazardous substances and the prevention of pollution
emanating from waste disposal (3).
Waste utilization means utilizing materials that might go into waste (10). Waste utilization can also be
defined as the application of agricultural waste or other waste on the land in an environmentally acceptable
manner while maintaining or improving the natural resources (11).
As a way of indulging in waste utilization to solve solid waste problems, this study was undertaken to
determine if corn cob an agricultural waste can be managed by utilizing it in oil spill mob thereby solving
another daunting environmental problem ” oil spillage “.
II. Materials and Methods Crude oil and its fractions namely Petrol, Kerosene and Diesel are the sorbates used in this study. The
crude oil was obtained from Shell Petroleum Development Company, located in Warri, Delta State of Nigeria,
while, petrol, kerosene and diesel were obtained from Total Filling Station, Asaba, Delta State, Nigeria. Corn
cob was obtained from the corn sellers, thoroughly washed with detergent and rinsed severally with copious
amount of water. They were sundried for two weeks, ground and sieved through a scientific sieve of mesh 2mm.
2.1 Determine of absorption of petrol, kerosene, diesel and crude oil by corn cob.
5 grams of ground corn cob was encased in a polyester case of size 21cm x 9cm x 9cm whose
absorption and recovery profile had been predetermined (the polyester case was stitched while its profile was
determined). The polyester case with the ground corn cob content was stitched and introduced into 2 litres of a
specific petroleum fraction( whose absorption by corn cob was to be determined) contained in a transparent
bowl of 10 litre capacity. The introduced content was left in the bowl containing the sorbate for the required
contact time used in this study. At the end of the contact time, the polyester case was removed from the sorbate
and hung to drip off unabsorbed sorbate, weighed and subjected to pressing using a carver hydraulic press to
express out the absorbed sorbate. After expressing, the polyester case with its content was reweighed and the
weight recorded. The experiment was repeated three times for each contact time for a specific sorbate and the
average and standard deviation calculated.
To ascertain the efficacy of corn cob in mopping the sorbates, a conventional synthetic absorbent mat
was obtained from Shell Development Company, Port Harcourt, Nigeria and used as a standard to compare the
mopping ability of corn cob. The conventional synthetic absorbent mat was subjected to the same experimental
condition and procedure as the corn cob.
2.2 Determination of absorption of mixture of petrol on water, kerosene on water, diesel on water and crude
oil on water
In order to determine the behavior and mopping ability of corn cob when crude oil and its fractions
spill on water, the experiment was repeated following the same procedure used above, but , this time, 5 grams of
ground corn cob was encased in a polyester case whose absorption profile was predetermined in a mixture of
each of the petroleum fraction and crude oil on water. The polyester case with its content was introduced into a
transparent bowl of 10 litre capacity containing 2 litres of a specific sorbate on 4 litres of water.
The functional group of the synthetic absorbent material was determined by FTIR spectroscopy since,
its name and chemical composition was not disclosed by the petroleum company from which it was obtained.
The quantity of petroleum fraction absorbed by corn cob was determined as follows:
Quantity of petroleum fraction absorbed by polyester case =
Weight of polyester case after immersion Weight of polyester case before immersion
In petroleum fraction (X2) --- in petroleum fraction (X1)
Quantity of petroleum fraction absorbed by corn cob =
Weight of corn cob encased in polyester Weight of polyester bag + weight of corn cob +
bag after immersion in sorbate (X4) _ weight of petroleum fraction absorbed by corn cob
(X3)
Determination of the viability of an agricultural solid waste; corncob as an oil spill sorbent mop
www.iosrjournals.org 32 | Page
% Absorption =
X4 - X3 X IOO
Weight of corn cob 1
The quantity of petroleum fraction recovered from corn cob was obtained as follows:
Quantity of petroleum fraction recovered from polyester case =
Weight of polyester case after immersion Weight of polyester case after expressing out
In petroleum fraction (Y1) -- absorbed petroleum fraction (Y2)
Quantity of petroleum fraction recovered from corn cob =
Weight of corn cob encased in polyester Weight of corn cob encased in polyester case after
case after immersion in petroleum fraction (Y4) -- expressing out absorbed petroleum fraction +
weight of petroleum fraction recovered from
polyester case (Y3)
% Recovery =
Y4 - Y3 X 100
Weight of corn cob 1
At the end of the experiment the percentage absorptions and percentage recoveries of each petroleum fraction
by corn cob and the synthetic absorbent mat were each summed up and the average taken. The standard
deviation was calculated using the formular for calculating the sum of standard deviations
√
III. Results and discussion Figures 2, 6, 10 and 14 shows the average percentage absorption of petrol, kerosene, diesel and crude
oil by corn cob and the conventional synthetic absorbent mat. Obviously the synthetic absorbent mat absorbed
more of the sorbates than the corn cob. Sorption (absorption and adsorption) which is the transfer of molecules
from an aqueous phase to an environmental solid phase results from a variety of different types of attractive
forces between solute molecules, solvent molecules and the molecules of a sorbent ( 12, 13 ). Solutes which
undergo sorption are commonly termed sorbates, the sorbing phase the sorbent and the primary phase from
which sorption occurs the solution (13 ). The distribution of the solute between phase results from its relative
affinity for each phase, which in turn relates to the nature of the forces which exist between molecules of sorbate
and those of the solvent and sorbent phase (12). The organic sorbate may chemically bond to the solid, if the
sorbate and sorbent have mutually reactive moieties (12 ).
The FTIR spectrum of the synthetic absorbent mat. Shows that the prominent peaks of the IR spectrum
are those corresponding to the alkanes and alkenes which suggest that the synthetic absorbent mat is a
polyhydrocarbon. Corn cob is chemically composed of cellulose, hemicellulose and lignin (5, 6). Cellulose is a
polysaccharide while hemicelluloses contains different sugar molecules (14,15). Lignin is a complex aromatic
polymer that contains three different alcohol units; corniferyl alcohol, p-courmaryl alcohol and sinapyl alcohol
(16). Apart from crude oil which is a complex mixture containing 50-90 % hydrocarbon, the remainder is
chiefly organic compounds containing oxygen, nitrogen or sulphur as well as trace amounts of organic metallic
compounds (17), the crude oil fractions; petrol, kerosene and diesel are hydrocarbons. Since the synthetic
absorbent mat is a polyhydrocarbon, it would therefore absorb more of the petroleum fractions than corn cob.
The extent of intermolecular forces between sorbate and sorbent which give rise to sorption, have effect on
the quantity of sorbate absorbed by a sorbent. intermolecular forces depend on two features of molecular
structure: firstly they increase as molecular weight/chain increases and secondly, intermolecular forces depend
upon molecular shape via the surface area over which two molecules can be in contact (18). The larger the
surface area of contact, the more the intermolecular interaction . This implies also that the synthetic absorbent
mat has a larger surface area than corn cob. Apart from the intermolecular forces between crude oil and its
fractions and the synthetic absorbent mat, the crude oil fractions were retained more within the sorbent
(synthetic absorbent mat) void by mere entanglement.
The slopes of the graph of the percentage absorption of the sorbates by the sorbents against contact
time shows that in contact with petrol both corn cob and the synthetic absorbent mat had positive values which
implies that there was increase in percentage absorbed with increase in contact time. The sorbents in contact

Determination of the viability of an agricultural solid waste; corncob as an oil spill sorbent mop
www.iosrjournals.org 33 | Page
with kerosene and crude oil had negative values for slope which implies that there was no increase in percentage
absorbed with increase in contact time.
Table 1: % absorption, % recovery and % retention of petrol by corn cob
Table 2: % absorption, % recovery and % retention of petrol by the synthetic absorbent
mat % absorption % Recovery
Recovery
%Retention
Retention
Contact time
(Min) 550±0.6 430±0.11 120 0.1
552±0.37 426±0.45 126 0.2
556±0.59 432±1.18 124 0.3
550±1.58 432±0.12 118 0.4
554±0.63 440±0.79 114 0.5
550±1.82 440±0.97 110 0.6
552±0.98 426±0.15 126 0.7
550±0.46 432±0.26 118 0.8
544±0.79 440±0.32 114 0.9
554±0.65 434±0.01 120 1.0
550±1.23 422±0.02 128 1.5
554±0.47 426±1.16 128 2.0
548±1.02 438±0.17 110 2.5
552±0.38 442±0.01 110 3.0
548±0.53 436±0.54 112 3.5
550±0.51 430±0.51 120 4.0
550±0.67 442±0.91 108 4.5
556±0.36 440±0.01 116 5.0
552±0.64 430±0.31 122 10
554±0.7 422±1.43 132 30
550±0.85 432±0.17 118 60
550±0.93 434±1.16 116 100
551.18 ± 3.97 Ave. 431.54±3.10 118.64 11
% absorption % Recovery
Recovery
% Retention
Retention
Contact time
(Min)
56±1.37 32±0.13 24 0.1 80±0.84 42±0.97 38 0.2
84±0.96 42±0.28 42 0.3
89±0.47 55±1.19 34 0.4 102±0.23 62±0.6 40 0.5
100±0.37 64±0.34 36 0.6
104±0.74 60± 0.41 44 0.7 113±0.76 63±0.36 50 0.8 110±0.58 66±0.43 44 0.9
112±0.72 66±0.51 46 1.0 111±0.44 57±0.15 54 1.5 112±0.57 68±0.27 44 2.0
110±0.33 62±0.34 48 2.5 112±1.62 72±0.37 40 3.0 118±0.59 72±0.33 46 3.5
116±0.55 74±0.92 42 4.0
115±0.0.51 71±1.39 44 4.5
116±0.48 72±0.98 44 5.0 111±1.3 70±1.06 41 10
111±0.97 70±1.01 41 30 111±0.88 69±0.82 42 60
116±0.31 70± 0.9 46 100
105 ± 3.40 Ave. 63±3.39 42 11

Determination of the viability of an agricultural solid waste; corncob as an oil spill sorbent mop
www.iosrjournals.org 34 | Page
Figure 1: % absorption of petrol by corn cob and synthetic absorbent mat
The slope of the graph was calculated using the slope function of Excel : slope =dy/dx
Slope = 0.1650 (corn cob), 0.0482 (synthetic absorbent mat)
Figure 2: Ave. % absorption of petrol by corn cob and synthetic absorbent mat
Figure 3: % recovery of petrol from corn cob and synthetic absorbent mat
0
100
200
300
400
500
600
0 0.1 0.2 0.3 0.4 0.5 0.6 0.7 0.8 0.9 1 1.5 2 2.5 3 3.5 4 4.5 5 10 30 60 100
Time(min)
% A
bsor
ptio
n
synthetic
corn cob
0
100
200
300
400
500
600
synthetic corncob
synthetic absorbent mat & corn cob
Ave. %
ab
so
rpti
on
0
50
100
150
200
250
300
350
400
450
500
0 0.1 0.2 0.3 0.4 0.5 0.6 0.7 0.8 0.9 1 1.5 2 2.5 3 3.5 4 4.5 5 10 30 60 100
Time (min)
% R
eco
very
syntheic
corn cob

Determination of the viability of an agricultural solid waste; corncob as an oil spill sorbent mop
www.iosrjournals.org 35 | Page
Figure 4: Ave. % recovery of petrol from corn cob and synthetic absorbent mat
Table 3: % absorption, % recovery and % retention of kerosene by corn cob % absorption ecevocer % % Retention Contact time (Min)
76±0.51 43.00±0.73 33.00 0.1
78±0.11 50.80±0.75 27.20 0.2
84±0.52 46.80±2.20 37.20 0.3
82±1.27 34.80±0.07 47.20 0.4
86±0.36 42.00±0.25 44.00 o.5
96±0.58 60.20±1.70 35.80 0.6
112±0.91 66.80±0.56 45.20 0.7
116±1.48 66.00±2.15 50.00 0.8
106±1.94 66.80±1.73 39.20 0.9
106±0.37 74.00±1.15 32.00 1.0
136±1.40 84.40±1.01 51.60 1.5
134±2.22 86.80±0.57 47.20 2.0
130±0.71 90.80±0.80 39.20 2.5
130±2.13 92.40±0.78 37.60 3.0
120±1.21 72.80±1.61 47.20 3.5
120±0.33 76.20±1.46 43.80 4.0
122±0.36 74.80±0.69 47.20 4.5
128±0.30 94.80±0.71 33.20 5.0
130±0.99 90.80±2.23 39.20 10
126±0.42 84.80±0.12 41.20 30
130±0.17 74.40±0.08 55.60 60
128±0.31 90.60±1.28 37.40 100
112.55± 4.97 Ave =. 71.13±5.75 41.42 11
0
50
100
150
200
250
300
350
400
450
500
synthetic corncob
synthetic absorbent mat & corn cob
Av
e. %
rec
ov
ery
Determination of the viability of an agricultural solid waste; corncob as an oil spill sorbent mop
www.iosrjournals.org 36 | Page
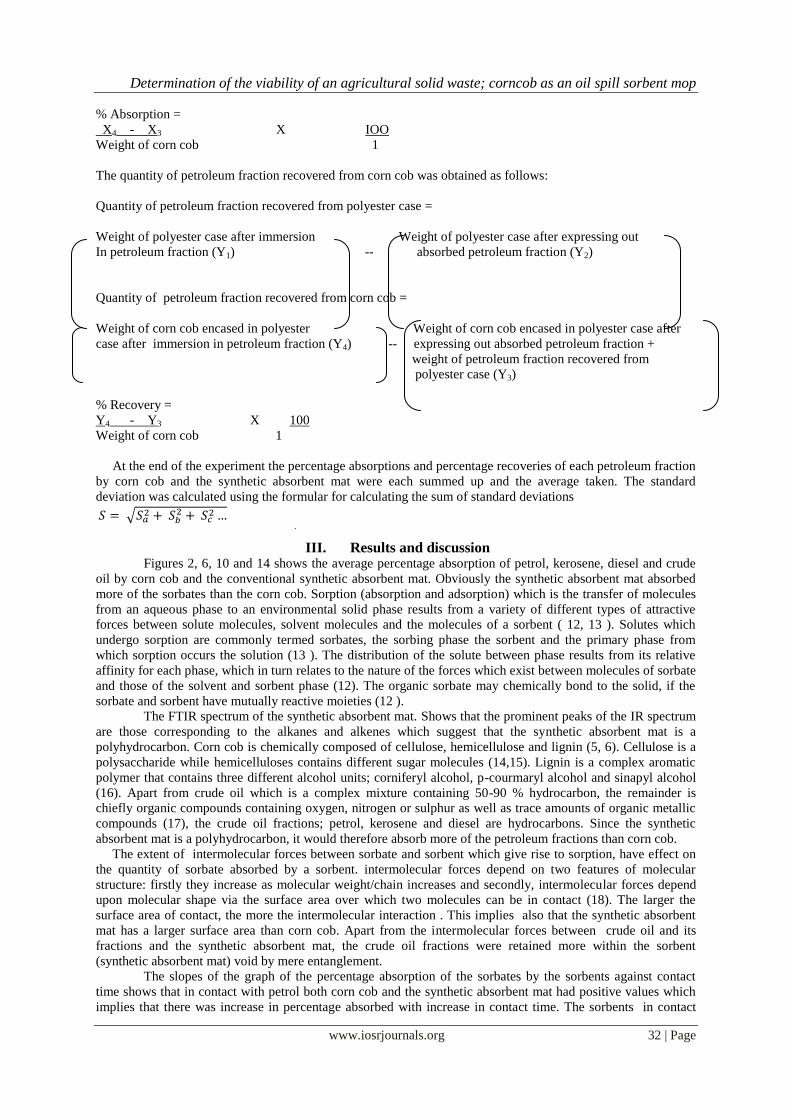
Table 4:% absorption, % recovery and % retention of Kerosene by synthetic absorbent mat
% absorption
% recovery Recovery
% retention Retention
Contact time (Min)
542±0.82 384±0.34 158 0.1
548±0.29 389±0.42 159 0.2
560±0.71 400±0.71 160 0.3
554±0.58 394±0.90 157 0.4
546±0.61 394±0.21 152 0.5
564±0.38 403±0.93 161 0.6
552±0.23 392±0.25 160 0.7
552±0.22 394±0.60 158 0.8
554±0.24 395±0.65 159 0.9
550±0.55 389±0.55 161 1.0
564±0.37 402±0.86 162 1.5
544±0.81 383±0.75 161 2.0
550±0.51 394±0.80 156 2.5
554±0.07 395±0.91 159 3.0
556±0.06 393±0.52 163 3.5
556±0.19 400±0.47 156 4.0
550±0.31 389±0.25 161 4.5
552±0.42 391±0.04 161 5.0
548±0.21 389±0.01 159 10
570±0.11 410±0.71 160 30
570±0.19 407±0.02 163 60
564±0.50 402±0.16 162 100
Ave. 554.40±2.87 ±3.92394.95 159.45 11
Figure 5: % Absorption of kerosene by corn cob and synthetic absorbent mat
Slope = -0.0205(corn cob , -0.0678 (synthetic absorbent mat)
0
100
200
300
400
500
600
0 0.1 0.2 0.3 0.4 0.5 0.6 0.7 0.8 0.9 1 1.5 2 2.5 3 3.5 4 4.5 5 10 30 60 100
Time(min)
% A
bso
rpti
on
Synthetic
Corn cob
Determination of the viability of an agricultural solid waste; corncob as an oil spill sorbent mop
www.iosrjournals.org 37 | Page
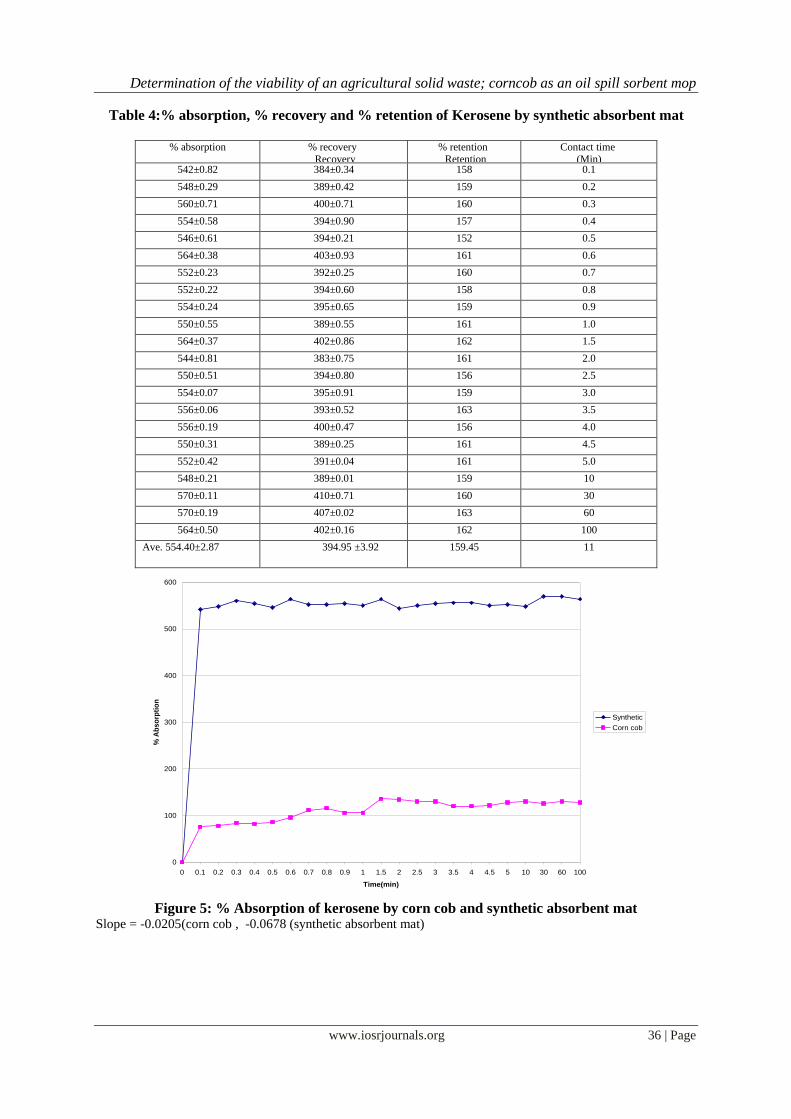
Figure 6: Ave. % absorption of by corn cob and synthetic absorbent mat kerosene
Figure 7: % Recovery of kerosene from corn cob and synthetic absorbent mat
Figure 8: Ave. % recovery of kerosene from corn cob and synthetic absorbent mat.
0
100
200
300
400
500
600
synthetic corncob
synthetic absorbent mat & corn cob
Av
e. %
ab
so
rpti
on
0
50
100
150
200
250
300
350
400
450
0 0.1 0.2 0.3 0.4 0.5 0.6 0.7 0.8 0.9 1 1.5 2 2.5 3 3.5 4 4.5 5 10 30 60 100
Time (min)
% R
eco
very
Corn cob
Synthetic
0
50
100
150
200
250
300
350
400
450
synthetic corncob
synthetic absorbent mat & corn cob
Ave. %
reco
very

Determination of the viability of an agricultural solid waste; corncob as an oil spill sorbent mop
www.iosrjournals.org 38 | Page
Table 5: % absorption, % recovery and% retention of diesel by corn cob %
absorption %
Recovery %
Retention Contact time
(Min)
108±2.12 40±0.53 68 0.1
114±0.96 34±0.24 80 0.2
116±3.01 42±0.75 74 0.3
120±1.17 36±0.43 84 0.4
120±0.32 36±0.30 84 0.5
124±1.30 44±1.10 80 0.6
126±0.05 38±0.98 88 0.7
128±1.13 44±0.28 84 0.8
128±0.64 40±0.16 88 0.9
130±1.91 48±0.48 82 1.0
128±0.61 52±0.15 76 1.5
130±0.98 42±0.25 88 2.0
134±1.51 46±0.38 88 2.5
134±1.14 42±0.29 92 3.0
152±2.81 58±0.70 94 3.5
158±2.31 62±0.58 96 4.0
150±0.35 56±0.09 94 4.5
146±2.75 48±0.69 98 5.0
146±0.85 50±0.21 96 10
146±0.04 64±0.50 82 30
144±2.21 56±0.06 88 60
146±3.21 48±0.80 96 100
133 ± 8.04 Ave. 47±4.34 86 11
Table 6: % absorption, % recovery and % retention of diesel by the synthetic absorbent mat
% absorption
% Recovery
% Retention
Contact time (Min)
622±0.56 452±0.20 170 0.1
622±0.23 453±0.53 169 0.2
624±1.00 453±0.80 171 0.3
624±0.50 453±0.30 171 0.4
624±0.36 453±0.38 172 0.5
624±0.43 456±0.43 168 0.6
624±1.13 454±0.13 170 0.7
624±1.00 453±0.15 171 0.8
623±0.08 452±0.14 171 0.9
620±0.51 453±0.40 167 1.0
626±0.36 454±0.25 172 1.5
626±0.04 453±0.18 173 2.0
621±0.03 454±0.12 167 2.5
624±1.00 453±0.30 172 3.0
626±0.03 453±0.09 173 3.5
622±0.04 454±0.50 168 4.0
621±0.60 453±0.08 168 4.5
618±0.16 452±0.42 166 5.0
625±0.43 453±0.11 172 10
624±0.59 454±0.10 170 30
624±0.02 454±0.36 170 60
622±1.75 454±0.03 168 100
Ave. 623.27 ± 4.41 ± 3.08453.32 169.95 11

Determination of the viability of an agricultural solid waste; corncob as an oil spill sorbent mop
www.iosrjournals.org 39 | Page
Figure 9: % absorption of diesel by corn cob and synthetic absorbent mat
Slope = 0.2213 (corn cob), -0.0042 (synthetic absorbent mat)
Figure 10: Ave. % absorption of diesel by corn cob and synthetic absorbent mat.
Figure 11: % recovery of diesel from corn cob and synthetic absorbent mat
Figure 12: Ave. % recovery of diesel from corn cob and synthetic absorbent mat.
0
100
200
300
400
500
600
700
0 0.1 0.2 0.3 0.4 0.5 0.6 0.7 0.8 0.9 1 1.5 2 2.5 3 3.5 4 4.5 5 10 30 60 100
Time(min)
% A
bso
rpti
on
synthetic
corn cob
0
100
200
300
400
500
600
700
synthetic corncob
syntheic absorbent mat
Ave
. % a
bso
rpti
on
0
50
100
150
200
250
300
350
400
450
500
0 0.1 0.2 0.3 0.4 0.5 0.6 0.7 0.8 0.9 1 1.5 2 2.5 3 3.5 4 4.5 5 10 30 60 100
Time(min)
% R
eco
very
synthetic
corn cob
0
50
100
150
200
250
300
350
400
450
500
synthetic corncob
synthetic absorbent mat & corn cob
Ave
.% r
eco
very

Determination of the viability of an agricultural solid waste; corncob as an oil spill sorbent mop
www.iosrjournals.org 40 | Page
Table 7: % absorption, % recovery and % retention of crude oil by corn cob %
absorption
%
Recovery
%
Retention
Contact time
(Min)
70±0.81 2±1.01 68 0.1
86±0.71 6±0.17 80 0.2
80±0.90 2±0.51 78 0.3 96±0.81 18±1.01 78 0.4
72±0.92 12±0.76 60 0.5
124±1.19 36±0.64 88 0.6
106±0.65 26±0.06 80 0.7
104±0.45 24±0.41 80 0.8
116±0.10 38±1.12 78 0.9
132±1.07 56±1.01 76 1.0
114±0.74 40±0.98 74 1.5
140±1.01 56±0.71 84 2.0
150±1.12 72±0.19 78 2.5
150±0.61 72±1.10 78 3.0
140±0.08 62±0.71 78 3.5
124±1.32 40±0.53 84 4.0
116±0.94 46±0.64 70 4.5
116±2.31 42±0.33 74 5.0
126±1.15 42±0.54 84 10
114±1.73 46±1.19 68 30
120±0.40 44±0.90 76 60
102±1.13 28±0.29 74 100
Ave. 113.55 ±4.81 36.82 ± 4.72 76.73 11
Table 8: % absorption, % recovery and % retention of crude oil by the synthetic absorbent % absorption %
Recovery %
Retention Contact time
(Min)
580±0.37 400±1.21 180 0.1
580±0.17 420±0.51 160 0.2
581±0.69 420±1.12 170 0.3
576±0.10 410±0.31 166 0.4
587±0.42 400±0.81 184 0.5
582±0.32 416±1.91 166 0.6
580±0.10 412±0.15 168 0.7
580±0.13 420±1.11 160 0.8
586±0.55 416±1.43 170 0.9
582±1.22 420±0.36 162 1.0
582±0.28 420±1.16 162 1.5
580±0.24 414±1.76 166 2.0
580±0.52 416±1.45 164 2.5
576±0.44 416±1.50 160 3.0
578±0.22 420±0.71 158 3.5
580±1.56 420±0.55 160 4.0
578±1.83 420±1.19 156 4.5
580±1.13 420±0.10 160 5.0
576±0.70 416±1.33 164 10
580±0.07 414±1.42 162 30
576±0.47 412±1.19 162 60
574±0.58 414±1.27 166 100
57.738 ± 3.78 Ave. 414.91 ± 4.61 164.82 11

Determination of the viability of an agricultural solid waste; corncob as an oil spill sorbent mop
www.iosrjournals.org 41 | Page
Figure 13: % absorption of crude oil by corn cob and synthetic absorbent mat
Slope = -0.0205 (corn cob), - 0.0678 (synthetic absorbent mat)
Figure 14: Ave. % absorption of crude oil by corn cob and synthetic absorbent mat
Figure 15: % recovery of crude oil from corn cob and synthetic mat
0
100
200
300
400
500
600
700
0 0.1 0.2 0.3 0.4 0.5 0.6 0.7 0.8 0.9 1 1.5 2 2.5 3 3.5 4 4.5 5 10 30 60 100
Time(min)
% A
bso
rpti
on
corn cob
synthetic
0
100
200
300
400
500
600
700
synthetic corncob
synthetic absorbent mat & corn cob
Av
e. %
ab
so
rpti
on
0
50
100
150
200
250
300
350
400
450
0 0.1 0.2 0.3 0.4 0.5 0.6 0.7 0.8 0.9 1 1.5 2 2.5 3 3.5 4 4.5 5 10 30 60 100
Time(min)
% R
ecov
ery
synthetic
corn cob

Determination of the viability of an agricultural solid waste; corncob as an oil spill sorbent mop
www.iosrjournals.org 42 | Page
Figure 16: Ave. % recovery of crude oil from corn cob and synthetic absorbent mat
Table 9: % absorption,% recovery &% retention of petrol on water by corn cob
% absorption % Recovery
% Retention
Contact time (Min)
142±1.29 12±2.18 130 0.1
178±0.51 48±0.25 130 0.2
174±2.31 52±2.13 122 0.3
178±1.14 72±0.05 106 0.4
178±1.73 74±1.73 104 0.5
178±0.79 72±0.79 106 0.6
178±1.15 62±1.15 116 0.7
182±0.06 78±1.06 104 0.8
185±1.65 60±0.56 125 0.9
182±0.67 74±0.77 108 1.0
185±0.56 68±0.55 117 1.5
174±0.89 70±0.78 104 2.0
180±1.58 72±1.58 108 2.5
0
50
100
150
200
250
300
350
400
450
synthetic corncob
synthetic absorbent mat & corn cob
Av
e. %
R
ec
ov
ery

Determination of the viability of an agricultural solid waste; corncob as an oil spill sorbent mop
www.iosrjournals.org 43 | Page
174±1.43 72±1.43 102 3.0
184±0.66 84±0.69 100 3.5
186±0.56 78±0.65 108 4.0
182±1.83 82±2.19 100 4.5
188±0.07 60±0.09 128 5.0
178±2.11 54±0.11 124 10.0
180±1.22 80±1.22 100 30.0
174±1.61 70±1.61 104 60.0
178±2.01 86±2.32 92 100.0
178.09±6.24 Ave. 67.27±6.07 110.82 11
Tab
le 10: % absorption, % recovery and % retention of petrol on water by the synthetic
absorbent mat % absorption
% Recovery
% Retention
Contact time
(Min)
540±1.13 400±0.04 140 0.1
541±0.52 408±1.15 142 0.2
540±2.07 396±1.13 144 0.3
536±0.3 402±0.04 134 0.4
544±1.27 392±0.73 152 0.5
542±0.98 404±0.94 138 0.6
540±0.17 400±1.15 140 0.7
542±0.06 402±2.31 140 0.8
532±1.65 398±1.32 134 0.9
536±0.67 396±0.08 140 1.0
544±0.56 402±0.61 142 1.5
540±0.73 404±0.67 136 2.0
540±1.58 402±1.17 138 2.5
542±1.34 406±0.01 136 3.0
536±0.66 396±0.54 140 3.5
540±0.56 398±0.55 142 4.0
548±1.83 402±1.19 146 4.5
544±0.07 402±0.1 142 5.0
530±2.11 400±0.33 130 10
542±0.22 402±0.07 140 30
540±1.43 394±0.17 146 60
542±1.75 402±1.61 140 100
540.45± 5.52 Ave. 400.36±4.40 140.09 11
Determination of the viability of an agricultural solid waste; corncob as an oil spill sorbent mop
www.iosrjournals.org 44 | Page
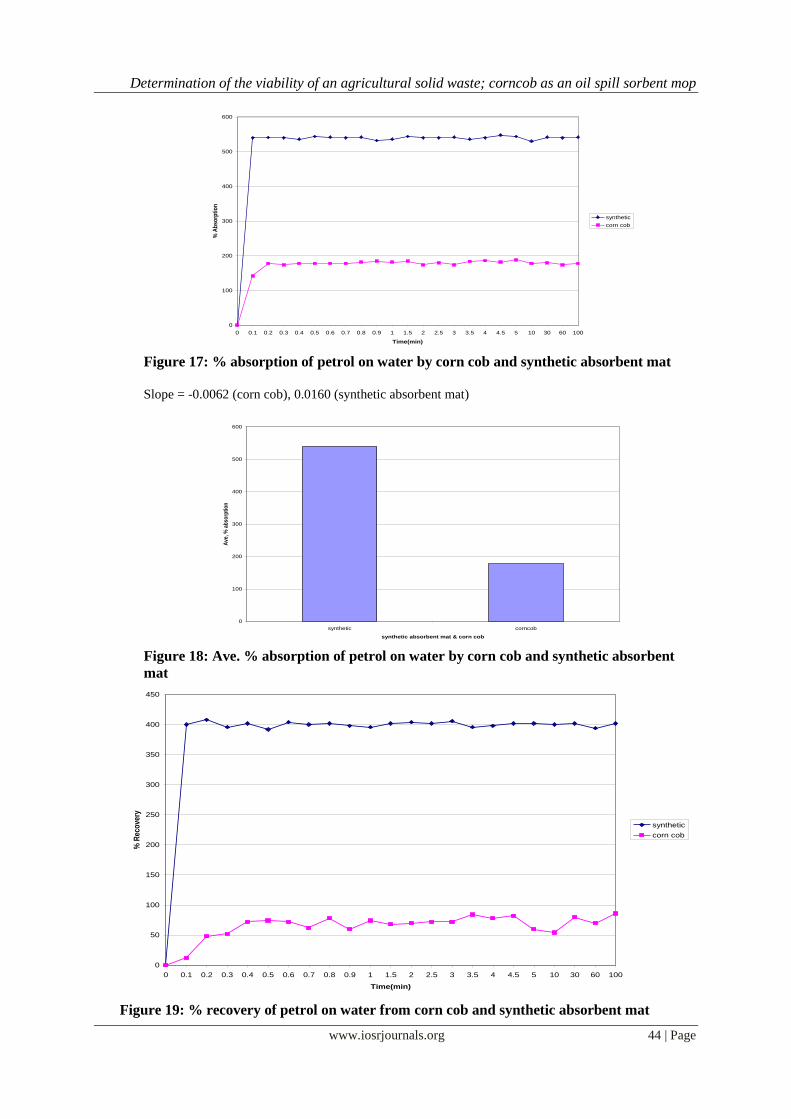
Figure 17: % absorption of petrol on water by corn cob and synthetic absorbent mat
Slope = -0.0062 (corn cob), 0.0160 (synthetic absorbent mat)
Figure 18: Ave. % absorption of petrol on water by corn cob and synthetic absorbent
mat
Figure 19: % recovery of petrol on water from corn cob and synthetic absorbent mat
0
100
200
300
400
500
600
0 0.1 0.2 0.3 0.4 0.5 0.6 0.7 0.8 0.9 1 1.5 2 2.5 3 3.5 4 4.5 5 10 30 60 100
Time(min)
% A
bso
rpti
on
synthetic
corn cob
0
100
200
300
400
500
600
synthetic corncob
synthetic absorbent mat & corn cob
Ave
, % a
bso
rpti
on
0
50
100
150
200
250
300
350
400
450
0 0.1 0.2 0.3 0.4 0.5 0.6 0.7 0.8 0.9 1 1.5 2 2.5 3 3.5 4 4.5 5 10 30 60 100
Time(min)
% R
eco
very
synthetic
corn cob
Determination of the viability of an agricultural solid waste; corncob as an oil spill sorbent mop
www.iosrjournals.org 45 | Page
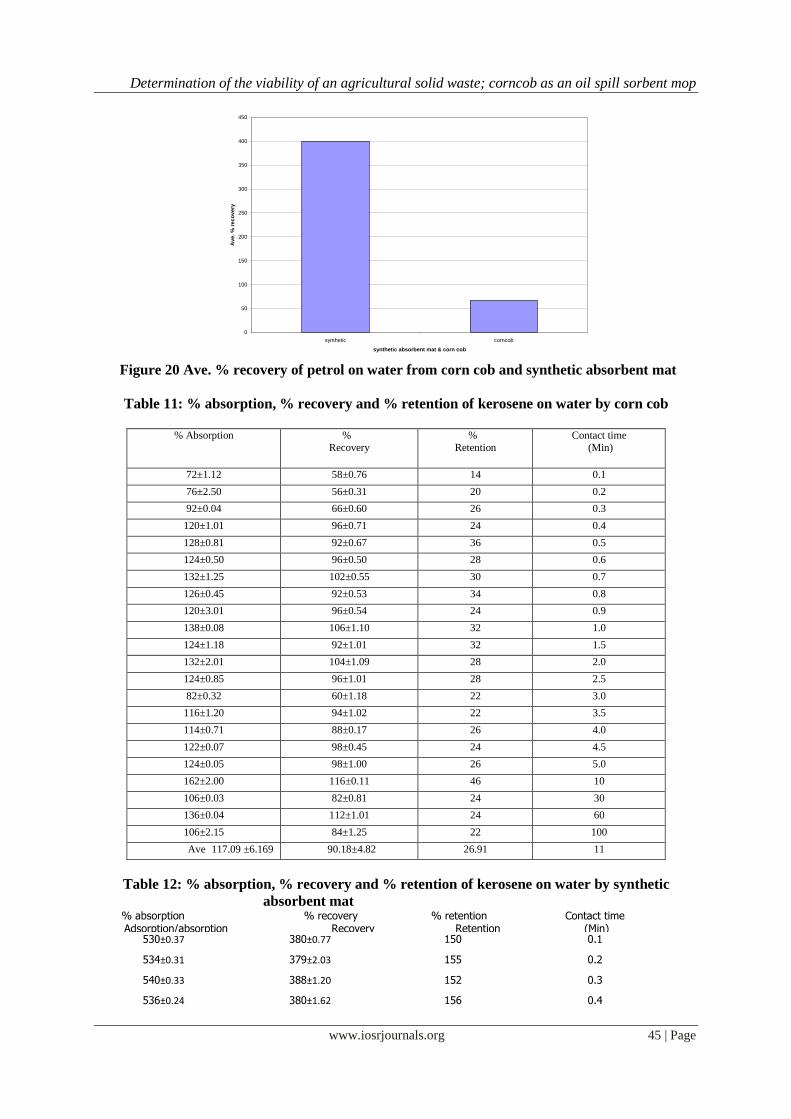
Figure 20 Ave. % recovery of petrol on water from corn cob and synthetic absorbent mat
Table 11: % absorption, % recovery and % retention of kerosene on water by corn cob
% Absorption %
Recovery
%
Retention
Contact time
(Min)
72±1.12 58±0.76 14 0.1
76±2.50 56±0.31 20 0.2
92±0.04 66±0.60 26 0.3
120±1.01 96±0.71 24 0.4
128±0.81 92±0.67 36 0.5
124±0.50 96±0.50 28 0.6
132±1.25 102±0.55 30 0.7
126±0.45 92±0.53 34 0.8
120±3.01 96±0.54 24 0.9
138±0.08 106±1.10 32 1.0
124±1.18 92±1.01 32 1.5
132±2.01 104±1.09 28 2.0
124±0.85 96±1.01 28 2.5
82±0.32 60±1.18 22 3.0
116±1.20 94±1.02 22 3.5
114±0.71 88±0.17 26 4.0
122±0.07 98±0.45 24 4.5
124±0.05 98±1.00 26 5.0
162±2.00 116±0.11 46 10
106±0.03 82±0.81 24 30
136±0.04 112±1.01 24 60
106±2.15 84±1.25 22 100
117.09 ±6.169 Ave ±4.8290.18 26.91 11
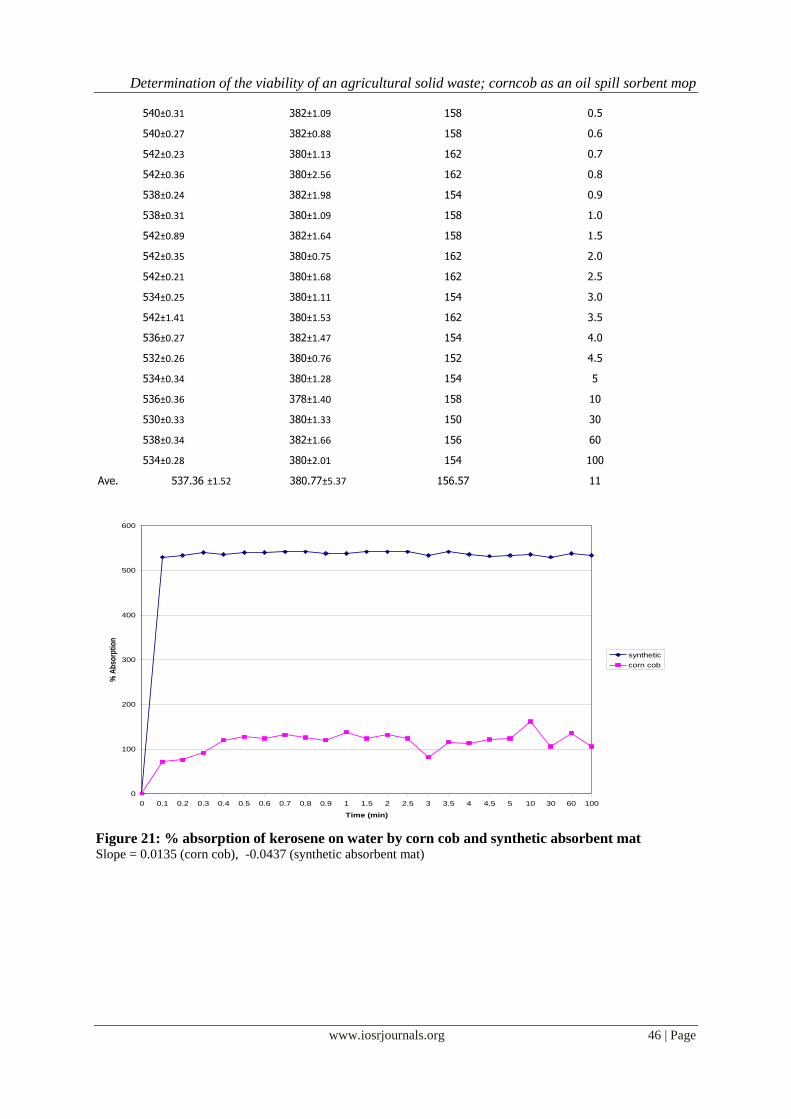
Table 12: % absorption, % recovery and % retention of kerosene on water by synthetic
absorbent mat % absorption Adsorption/absorption
% recovery Recovery
Recovery
% retention Retention
Contact time (Min)
530±0.37 380±0.77 150 0.1
534±0.31 379±2.03 155 0.2
540±0.33 388±1.20 152 0.3
536±0.24 380±1.62 156 0.4
0
50
100
150
200
250
300
350
400
450
synthetic corncob
synthetic absorbent mat & corn cob
Av
e. %
rec
ov
ery
Determination of the viability of an agricultural solid waste; corncob as an oil spill sorbent mop
www.iosrjournals.org 46 | Page
540±0.31 382±1.09 158 0.5
540±0.27 382±0.88 158 0.6
542±0.23 380±1.13 162 0.7
542±0.36 380±2.56 162 0.8
538±0.24 382±1.98 154 0.9
538±0.31 380±1.09 158 1.0
542±0.89 382±1.64 158 1.5
542±0.35 380±0.75 162 2.0
542±0.21 380±1.68 162 2.5
534±0.25 380±1.11 154 3.0
542±1.41 380±1.53 162 3.5
536±0.27 382±1.47 154 4.0
532±0.26 380±0.76 152 4.5
534±0.34 380±1.28 154 5
536±0.36 378±1.40 158 10
530±0.33 380±1.33 150 30
538±0.34 382±1.66 156 60
534±0.28 380±2.01 154 100
537.36 ±1.52 Ave. ±5.37380.77 156.57 11
Figure 21: % absorption of kerosene on water by corn cob and synthetic absorbent mat Slope = 0.0135 (corn cob), -0.0437 (synthetic absorbent mat)
0
100
200
300
400
500
600
0 0.1 0.2 0.3 0.4 0.5 0.6 0.7 0.8 0.9 1 1.5 2 2.5 3 3.5 4 4.5 5 10 30 60 100
Time (min)
% A
bso
rpti
on
synthetic
corn cob

Determination of the viability of an agricultural solid waste; corncob as an oil spill sorbent mop
www.iosrjournals.org 47 | Page
Figure 22: Ave. % absorption of kerosene on water by corn cob and synthetic absorbent mat.
Figure 23: % recovery of kerosene from corn cob and synthetic absorbent mat
Figure 24: Ave. % recovery of kerosene on water from corn cob and synthetic absorbent mat
0
100
200
300
400
500
600
synthetic corncob
synthetic absorbent mat & corn cob
Av
e. %
Ab
so
rpti
on
0
50
100
150
200
250
300
350
400
450
0 0.1 0.2 0.3 0.4 0.5 0.6 0.7 0.8 0.9 1 1.5 2 2.5 3 3.5 4 4.5 5 10 30 60
Time (min)
% R
eco
very
synthetic
corn cob
0
50
100
150
200
250
300
350
400
synthetic corncob
synthetic absorbent mat & corn cob
Av
e. %
rec
ov
ery
Determination of the viability of an agricultural solid waste; corncob as an oil spill sorbent mop
www.iosrjournals.org 48 | Page
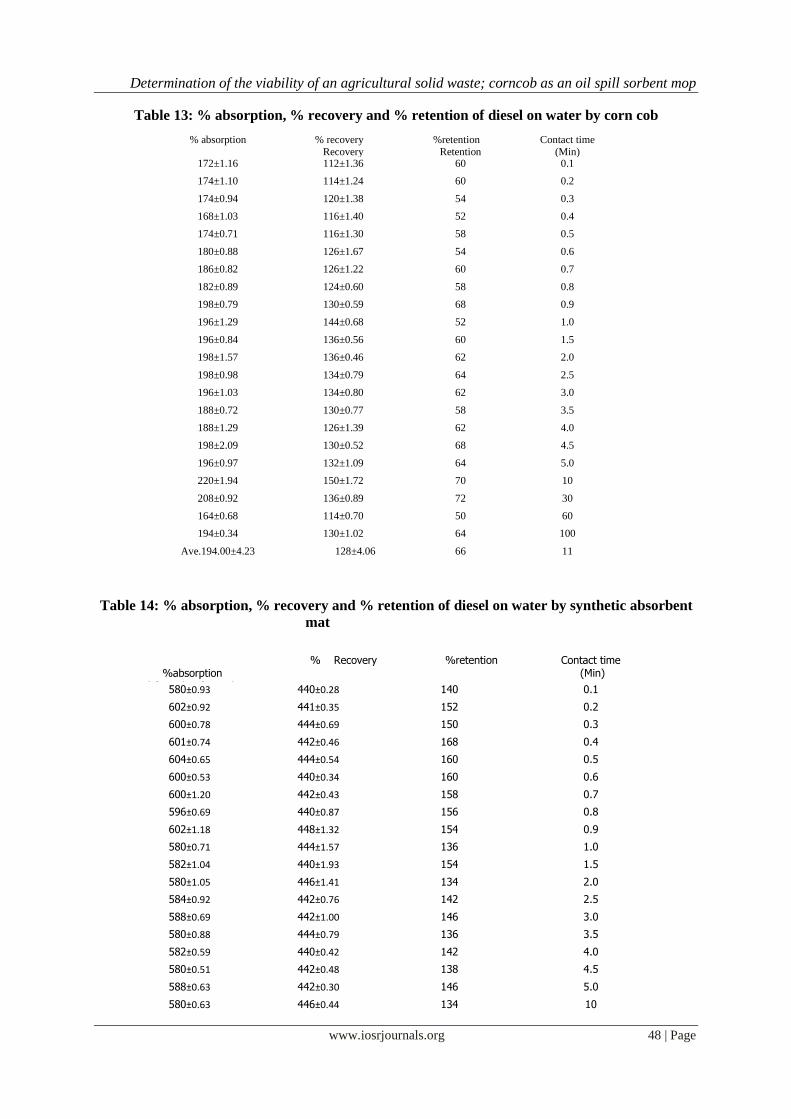
Table 13: % absorption, % recovery and % retention of diesel on water by corn cob
Table 14: % absorption, % recovery and % retention of diesel on water by synthetic absorbent
mat
% absorption % recovery Recovery
%retention Retention
Contact time (Min)
172±1.16 112±1.36 60 0.1
174±1.10 114±1.24 60 0.2
174±0.94 120±1.38 54 0.3
168±1.03 116±1.40 52 0.4
174±0.71 116±1.30 58 0.5
180±0.88 126±1.67 54 0.6
186±0.82 126±1.22 60 0.7
182±0.89 124±0.60 58 0.8
198±0.79 130±0.59 68 0.9
196±1.29 144±0.68 52 1.0
196±0.84 136±0.56 60 1.5
198±1.57 136±0.46 62 2.0
198±0.98 134±0.79 64 2.5
196±1.03 134±0.80 62 3.0
188±0.72 130±0.77 58 3.5
188±1.29 126±1.39 62 4.0
198±2.09 130±0.52 68 4.5
196±0.97 132±1.09 64 5.0
220±1.94 150±1.72 70 10
208±0.92 136±0.89 72 30
164±0.68 114±0.70 50 60
194±0.34 130±1.02 64 100
Ave.194.00±4.23 128±4.06 66 11
%absorption
Adsorptionabsorption
% Recovery %retention Contact time (Min)
580±0.93 440±0.28 140 0.1
602±0.92 441±0.35 152 0.2
600±0.78 444±0.69 150 0.3
601±0.74 442±0.46 168 0.4
604±0.65 444±0.54 160 0.5
600±0.53 440±0.34 160 0.6
600±1.20 442±0.43 158 0.7
596±0.69 440±0.87 156 0.8
602±1.18 448±1.32 154 0.9
580±0.71 444±1.57 136 1.0
582±1.04 440±1.93 154 1.5
580±1.05 446±1.41 134 2.0
584±0.92 442±0.76 142 2.5
588±0.69 442±1.00 146 3.0
580±0.88 444±0.79 136 3.5
582±0.59 440±0.42 142 4.0
580±0.51 442±0.48 138 4.5
588±0.63 442±0.30 146 5.0
580±0.63 446±0.44 134 10

Determination of the viability of an agricultural solid waste; corncob as an oil spill sorbent mop
www.iosrjournals.org 49 | Page
Figure 25: % absorption of diesel by corn cob and synthetic absorbent mat
Slope = 0.0095 (corn cob), - 0.1211 (synthetic absorbent mat)
Figure 26: Ave. % absorption of diesel on water by corn cob and synthetic absorbent mat
0
100
200
300
400
500
600
700
0 0.1 0.2 0.3 0.4 0.5 0.6 0.7 0.8 0.9 1 1.5 2 2.5 3 3.5 4 4.5 5 10 30 60 100
Time (min)
% A
bso
rpti
on
synthetic
corn cob
0
100
200
300
400
500
600
700
synthetic corncob
Synthetic absorbent mat & corn cob
Av
e. %
ab
so
rpti
on
582±0.78 440±0.38 142 30
576±0.62 448±0.38 128 60
584±0.61 442±0.62 142 100
588.95 ±2.94 Ave.
±2.91442.68 146.27 11

Determination of the viability of an agricultural solid waste; corncob as an oil spill sorbent mop
www.iosrjournals.org 50 | Page
Figure 27: % recovery of diesel on water from corn cob and synthetic absorbent mat
Figure 28: Ave. % recovery of diesel on water from corn cob and synthetic absorbent mat.
Table 15: % absorption, % recovery and % retention of crude oil on water by corn cob
%absorption % recovery
y
% retention Contact time
(Min)
90±0.90 24±0.62 66 0.1
102±1.25 32±1.03 70 0.2
104±1.74 36±1.25 68 0.3
128±0.93 54±1.47 74 0.4
148±1.22 62±0.71 86 0.5
156±1.12 66±0.62 90 0.6
168±1.13 76±0.69 92 0.7
170±2.72 78±0.85 92 0.8
168±1.79 76±1.47 92 0.9
158±0.36 62±1.32 96 1.0
0
50
100
150
200
250
300
350
400
450
500
0 0.1 0.2 0.3 0.4 0.5 0.6 0.7 0.8 0.9 1 1.5 2 2.5 3 3.5 4 4.5 5 10 30 60 100
Time(min)
% R
ec
ov
ery
synthetic
corn cob
0
50
100
150
200
250
300
350
400
450
500
synthetic corncob
synthetic absorbent mat & corn cob
Av
e. %
rec
ov
ery
Determination of the viability of an agricultural solid waste; corncob as an oil spill sorbent mop
www.iosrjournals.org 51 | Page
170±0.92 72±1.74 98 1.5
168±0.96 76±1.12 92 2
156±1.51 72±1.05 84 2.5
172±0.32 78±0.87 94 3
176±0.72 80±1.27 96 3.5
172±0.58 80±0.94 92 4
178±1.47 86±0.50 92 4.5
174±0.33 82±0.37 92 5
172±1.36 76±0.70 96 10
172±0.46 76±1.17 96 30
206±1.13 110±1.03 96 60
140±2.07 58±1.95 82 100
±5.06 156.73 Ave. ±4.04 68.73 88.00 11
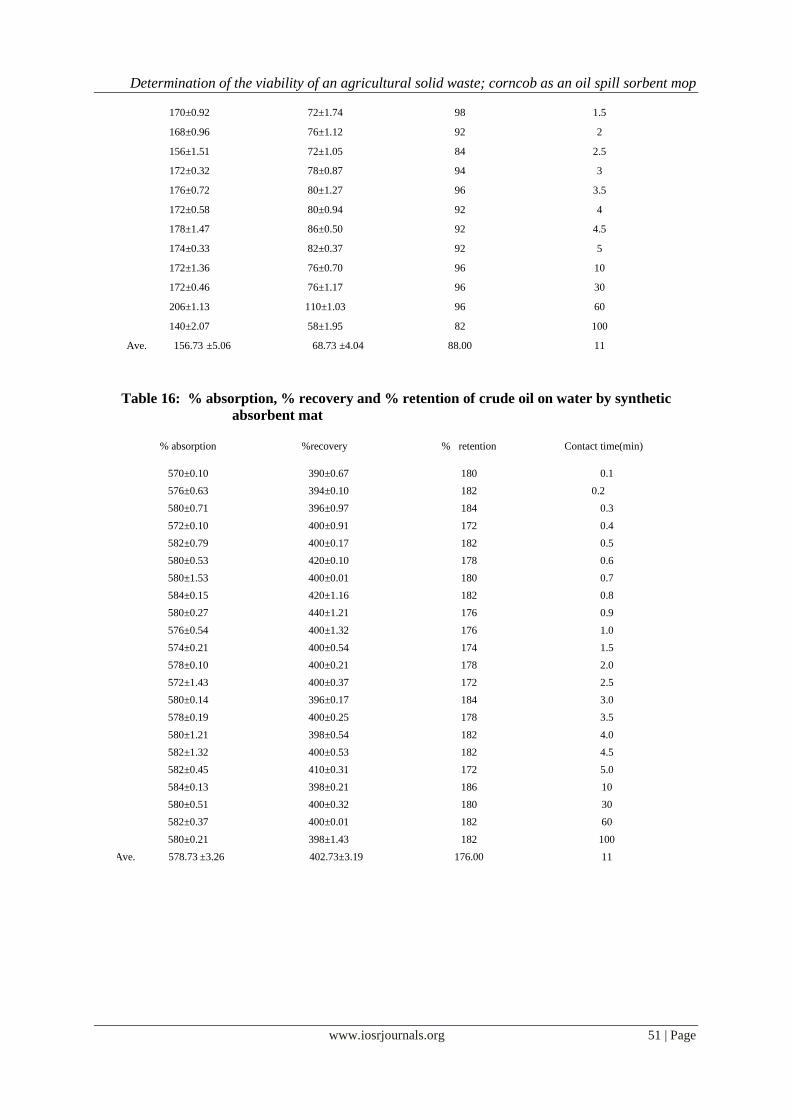
Table 16: % absorption, % recovery and % retention of crude oil on water by synthetic
absorbent mat
% absorption %recovery % retention (min)Contact time
570±0.10 390±0.67 180 0.1
576±0.63 394±0.10 182 0.2
580±0.71 396±0.97 184 0.3
572±0.10 400±0.91 172 0.4
582±0.79 400±0.17 182 0.5
580±0.53 420±0.10 178 0.6
580±1.53 400±0.01 180 0.7
584±0.15 420±1.16 182 0.8
580±0.27 440±1.21 176 0.9
576±0.54 400±1.32 176 1.0
574±0.21 400±0.54 174 1.5
578±0.10 400±0.21 178 2.0
572±1.43 400±0.37 172 2.5
580±0.14 396±0.17 184 3.0
578±0.19 400±0.25 178 3.5
580±1.21 398±0.54 182 4.0
582±1.32 400±0.53 182 4.5
582±0.45 410±0.31 172 5.0
584±0.13 398±0.21 186 10
580±0.51 400±0.32 180 30
582±0.37 400±0.01 182 60
580±0.21 398±1.43 182 100
±3.26 578.73 Ave. ±3.19402.73 176.00 11

Determination of the viability of an agricultural solid waste; corncob as an oil spill sorbent mop
www.iosrjournals.org 52 | Page
Figure 29: % absorption of crude oil on water by corn cob and synthetic absorption mat Slope = 0.1853 (corn cob), 0.0350 (synthetic absorbent mat)
Figure 30: Ave. % absorption of crude oil on water by corn cob and synthetic absorbent mat
Figure 31: % recovery of crude oil on water from corn cob and synthetic absorbent mat
0
100
200
300
400
500
600
700
0 0.1 0.2 0.3 0.4 0.5 0.6 0.7 0.8 0.9 1 1.5 2 2.5 3 3.5 4 4.5 5 10 30 60 100
Time(min)
% A
bso
rpti
on
synthetic
corn cob
0
100
200
300
400
500
600
700
synthetic corncob
synthetic absorbent mat & corn cob
Av
e. %
ab
so
rpti
on
0
50
100
150
200
250
300
350
400
450
500
0 0.1 0.2 0.3 0.4 0.5 0.6 0.7 0.8 0.9 1 1.5 2 2.5 3 3.5 4 4.5 5 10 30 60 100
Time(min)
% R
ecov
ery
synthetic
corn cob

Determination of the viability of an agricultural solid waste; corncob as an oil spill sorbent mop
www.iosrjournals.org 53 | Page
Figure 32: Ave. % recovery of crude oil on water from corn cob and synthetic absorbent mat
corn cob
Figure:33
Synthetic
Figure:34
0
50
100
150
200
250
300
350
400
450
synthetic corncob
synthetic absorbent mat & corn cob
Ave
. % r
eco
very
0
20
40
60
80
100
120
140
160
180
200
0 0.1 0.2 0.3 0.4 0.5 0.6 0.7 0.8 0.9 1 1.5 2 2.5 3 3.5 4 4.5 5 10 30 60 100
Time (min)
% a
bsor
ptio
n of
cor
n co
b
petrol on water
petrol
0
100
200
300
400
500
600
0 0.1 0.2 0.3 0.4 0.5 0.6 0.7 0.8 0.9 1 1.5 2 2.5 3 3.5 4 4.5 5 10 30 60 100
Time(min)
% a
bso
rpti
on
of
syn
thet
ic
petrol on water
petrol

Determination of the viability of an agricultural solid waste; corncob as an oil spill sorbent mop
www.iosrjournals.org 54 | Page
Corn cob
Figure: 35
Synthetic
Figure:36
corn cob
Figure: 37
0
20
40
60
80
100
120
140
160
180
0 0.1 0.2 0.3 0.4 0.5 0.6 0.7 0.8 0.9 1 1.5 2 2.5 3 3.5 4 4.5 5 10 30 60 100
Time (min)
% A
bs
orp
tio
n o
f c
orn
co
b
kerosine
kerosine on water
0
100
200
300
400
500
600
0 0.1 0.2 0.3 0.4 0.5 0.6 0.7 0.8 0.9 1 1.5 2 2.5 3 3.5 4 4.5 5 10 30 60 100
Time(min)
% a
bso
rpti
on
of
syn
thet
ic
kerosine
kero in water
0
50
100
150
200
250
0 0.1 0.2 0.3 0.4 0.5 0.6 0.7 0.8 0.9 1 1.5 2 2.5 3 3.5 4 4.5 5 10 30 60 100
Time(min)
% a
bso
rpti
on
of
co
rn c
ob
diesel on water
diesel
Determination of the viability of an agricultural solid waste; corncob as an oil spill sorbent mop
www.iosrjournals.org 55 | Page
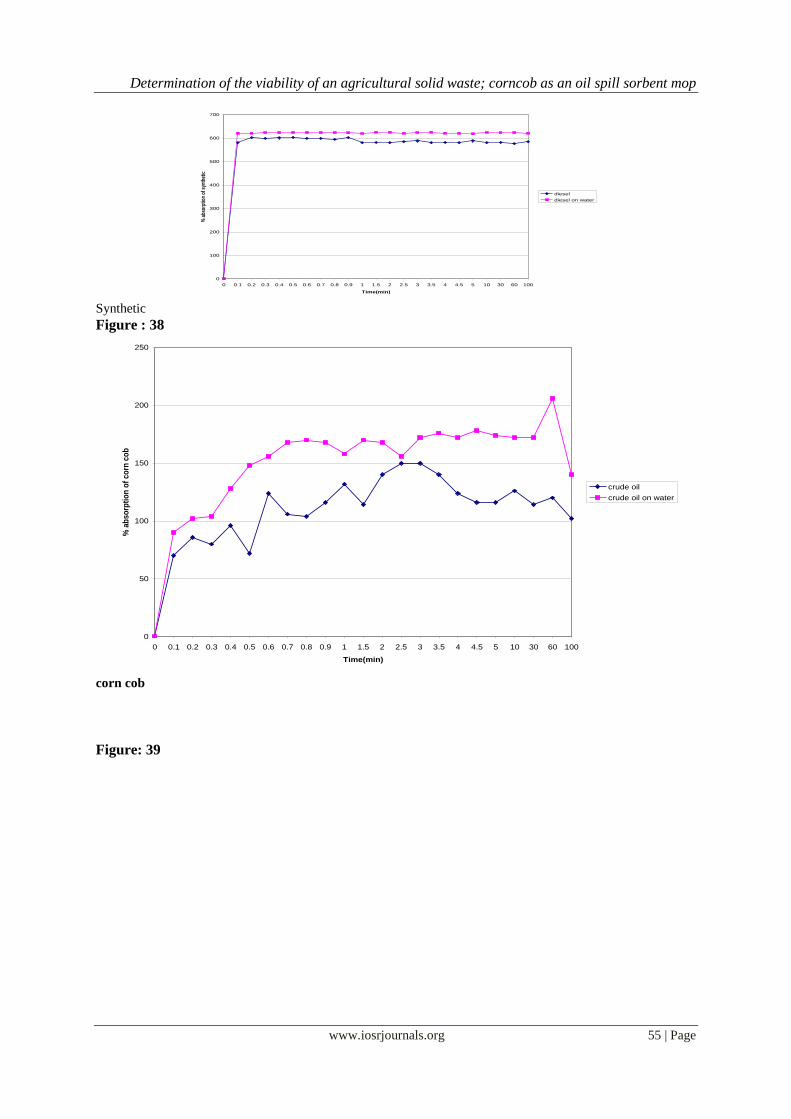
Synthetic
Figure : 38
corn cob
Figure: 39
0
100
200
300
400
500
600
700
0 0.1 0.2 0.3 0.4 0.5 0.6 0.7 0.8 0.9 1 1.5 2 2.5 3 3.5 4 4.5 5 10 30 60 100
Time(min)
% a
bsor
ptio
n of
syn
thet
ic
diesel
diesel on water
0
50
100
150
200
250
0 0.1 0.2 0.3 0.4 0.5 0.6 0.7 0.8 0.9 1 1.5 2 2.5 3 3.5 4 4.5 5 10 30 60 100
Time(min)
% a
bs
orp
tio
n o
f c
orn
co
b
crude oil
crude oil on water

Determination of the viability of an agricultural solid waste; corncob as an oil spill sorbent mop
www.iosrjournals.org 56 | Page
Synthetic
Figure: 40
Figure: 41 Figures 33, 37 and 39 shows that corn cob absorbs water while sorbing the sorbates; petrol, diesel and crude oil.
This is a disadvantage because for a sorbent to be useful in combating oil spills, sorbents need to be both
oleophilic (oil- attracting) and hydrophobic (water-repellent) (20).
Figure 34, 36, 38 and 40 shows the percentage absorption of the sorbates on water by the synthetic absorbent
mat with increase in contact time. The figures reveal that the synthetic absorbent mat did not absorb water while
sorbing the sorbates. This further makes it a better sorbent than corn cob.
On the whole, both corn cob and the synthetic absorbent mat sorbed as much of the sorbate on water as they
did the sorbates when not mixed with water. This is very significant as it implies that the sorbents can be used to
mop up oil spills both on land or on water. Figure 41 shows that generally speaking the amount of sorbates
absorbed by the sorbents increases with increase in molecular chain of the hydrocarbons (sorbates).This is in
agreement with the findings of Nduka et al (2008). This is hardly surprising as longer chain hydrocarbons are
more likely to be retained within the sorbent voids, apart from intermolecular forces, but also by mere
entanglement
IV. Conclusion The result of the study shows that the synthetic absorbent mat is a better absorbent than corn cob, the
average percentage absorption of petrol, kerosene, diesel and crude oil by corn cob are 105%, 112%,133% and
113% respectively while the average percentage absorption of petrol, kerosene,, diesel and crude oil by the
synthetic absorbent mat are 551%, 554%, 623% and 579% respectively. The synthetic absorbent mat does not
absorb water, so it is a good absorbent for mopping oil spill both on land and water. Corn cob absorbs water
0
100
200
300
400
500
600
700
0 0.1 0.2 0.3 0.4 0.5 0.6 0.7 0.8 0.9 1 1.5 2 2.5 3 3.5 4 4.5 5 10 30 60 100
Time (min)
% a
bs
orp
tio
n o
f s
yn
the
tic
crude oil on water
crude oil
0
100
200
300
400
500
600
700
synthetic corn cob
petrol
kerosine
diesel
crude oil

Determination of the viability of an agricultural solid waste; corncob as an oil spill sorbent mop
www.iosrjournals.org 57 | Page
while mopping petrol, kerosene and diesel, this is a disadvantage as oil spill on water mopped with corn cob will
undergo additional recovery process, i.e. removal of water from the oil before the oil can be used again/recycled.
Increase in contact time has no significance on the quantity of kerosene, diesel and crude oil absorbed by corn
cob and the synthetic absorbent mat. The quantity of the sorbates absorbed by the sorbents increases with
increase in chain length of the sorbates.. Though the synthetic absorbent mat absorbed more of the sorbates than
corn cob, corn cob has the compensating advantage in that it is biodegrable, inexpensive and readily available as
a waste material. Its disposal after usage in mopping oil spill is easier in that it can serve as a compost in solid
waste management whereas, the conventional synthetic absorbent mat cost the oil companies money to take
care of the wastes generated when it is utilized in oil spill mop.
References [1]. S. Momodu, K.O. Dimuna and J.E. Dimuna, Mitigating the impact of solid wastes in urban centres in Nigeria , J. Hum , Ecol 34(2),
2011, 125-133.
[2]. E. M. Okonkwo and A.N. Eboatu, Environmental pollution and degradation (Zaria : Onis Excel Publishing, 1999).
[3]. I. E. Ukpong and E. P. Udofia, Domestic solid waste management in a rapidly growing Nigerian city of Uyo, J. Hum Ecol, 36(3),
2011, 229-235.
[4]. Corn cob, available at www.thefreedictionary.com/corncob , Retrieved 5/9/13.
[5]. O. Zych, The viability of corn cob as abioenergy feed stock : A summer internship in renewable energy at the West Central Research and Out Reach Center, University of Minnesota,2008.
[6]. G. Garrote, Autohydrolysis of corn cob : Study of non isothermal operation for xylooligosacharide production, Journal of Food
Engineering, 52(3), 2002,211-218. [7]. F. D. Davidson, Gasification and liquefaction of corn cob, J. Fuel Science and Technology, 11(8), 1993, 1037-1045.
[8]. E. B. Ogunbode and J. A. Apeh, Waste to wealth : A study of laterite bricks produced using blended incinerated corn cob ash
cement, Proc. 4th West Africa Built Environment Research (WABER) Conference, Abuja, 2012, 1023-1031. [9]. Top 10 largest maize producing countries in the world, available at http://www.whichcountry.co/top-10-largest-maize-producing-
countries-in-the-world , Retrieved 25/10/13.
[10]. Waste utilization, available at http://issuu.com/aznemo/docs/wu , Retrieved 5/10/13. [11]. Waste utilization, http://webhost.bridgew.edu/c2king/CH489/Lec%202_Waste%20Minimzn_ModSpring%202012.pdf , Retrieved
5/10/13.
[12]. Sorption available at http://people.ok.ubc.ca/neggers/Chem317/SORPTION.doc , accessed 31/10/13. [13]. W. J. Wener, P.M. McGinley and L.E. Katz, Sorption phenomena in subsurface systems: Concepts, models and effects on
contaminant fate and transport, Wat. Res., 25(5) 1991, 499-528.
[14]. Cellulose available at http://en.wikipedia.org/wiki/Cellulose , Retrieved 30/10/13. [15]. Hemicellulose available at http://en.wikipedia.org/wiki/Hemicellulose , Retrieved 30/10/13.
[16]. Lignin available at http://en.wikipedia.org/wiki/Lignin , Retrieved 30/10/13. [17]. Encyclopaedia Britannica, 15th Ed. Vol 9, 343-345
[18]. E.M. Katchy, Principles of polymer science(Enugu: El’Demark, 2000)
[19]. Slope available at http://www.sparknotes.com/math/algebra1/graphingequations/section4.rhtml , Retrieved 1/11/13 [20]. Carl Baugh, Key techniques employed to curtail oilspill, International Business Times Companys, 2010, available at
http://www.btimes.com/articles/2464/20/00524/oil.htm , Retrieved 2010
[21]. J.K. Nduka, I. O. Ezenweke and T.E. Ezenwa, Comparison of the mopping ability of chemical modified and unmodified biological wastes on crude oil and its lower fractions , Bioresource Technology, 99(16), 2008, 7902-7905.
Related Documents