doi: 10.1098/rsta.2004.1443 , 2311-2336 362 2004 Phil. Trans. R. Soc. Lond. A A. Jorio, R. Saito, G. Dresselhaus and M. S. Dresselhaus spectroscopy Determination of nanotubes properties by Raman Email alerting service here right-hand corner of the article or click Receive free email alerts when new articles cite this article - sign up in the box at the top http://rsta.royalsocietypublishing.org/subscriptions go to: Phil. Trans. R. Soc. Lond. A To subscribe to This journal is © 2004 The Royal Society on July 15, 2011 rsta.royalsocietypublishing.org Downloaded from

Welcome message from author
This document is posted to help you gain knowledge. Please leave a comment to let me know what you think about it! Share it to your friends and learn new things together.
Transcript

doi: 10.1098/rsta.2004.1443, 2311-2336362 2004 Phil. Trans. R. Soc. Lond. A
A. Jorio, R. Saito, G. Dresselhaus and M. S. Dresselhaus spectroscopyDetermination of nanotubes properties by Raman
Email alerting service hereright-hand corner of the article or click Receive free email alerts when new articles cite this article - sign up in the box at the top
http://rsta.royalsocietypublishing.org/subscriptions go to: Phil. Trans. R. Soc. Lond. ATo subscribe to
This journal is © 2004 The Royal Society
on July 15, 2011rsta.royalsocietypublishing.orgDownloaded from

10.1098/rsta.2004.1443
Determination of nanotubes propertiesby Raman spectroscopy
By A. Jorio1, R. Saito
2, G. Dresselhaus
3and M. S. Dresselhaus
3
1Departamento de Fısica, Universidade Federal de Minas Gerais,Caixa Postal 702, Av. Antonio Carlos 6627,
Belo Horizonte-MG 30123-970, Brazil ([email protected])2Department of Physics, Tohoku University and CREST JST,
Aramaki, Aoba Sendai 980-8578, Japan3Massachusetts Institute of Technology, 77 Massachusetts Avenue,
Room 13-3005, Cambridge, MA 02139-4307, USA
Published online 27 September 2004
The basic concepts and characteristics of Raman spectra from single-wall carbonnanotubes (SWNTs, both isolated and bundled) are presented. The physical proper-ties of the SWNTs are introduced, followed by the conceptual framework and char-acteristics of their Raman spectra. Each Raman feature, namely the radial breathingmode, the tangential G band, combination modes and disorder-induced bands arediscussed, addressing their physical origin, as well as their capability for character-izing SWNT properties.
Keywords: carbon nanotubes; Raman spectra; one-dimensional system;electronic structure; phonons
1. Introduction
Since the first observation of carbon nanotubes, in 1991 (Iijima 1991), as multi-wallcarbon nanotubes (MWNTs), and in 1993 (Bethune et al. 1993; Iijima & Ichihashi1993) as single-wall carbon nanotubes (SWNTs), Raman spectroscopy has been usedto characterize the synthesis and purification processes of carbon nanotubes (Dres-selhaus et al. 2001; Journet et al. 1997; Tohji et al. 1996), as well as their physicalproperties. However, it was not until 1997 that the power of Raman spectroscopyfor studying and characterizing carbon nanotubes started to be appreciated. Raoet al. (1997a) first demonstrated the dependence on the laser excitation energy,Elaser, which results from the diameter-selective resonance Raman scattering fromthe vibrational modes in carbon nanotubes. In 1998 Pimenta et al. (1998) showedthat Raman spectra could be used to differentiate between metallic and semicon-ducting SWNTs. In 2001, it was established that resonance Raman spectra couldbe observed at the single-nanotube level (Jorio et al. 2001a). In combination withthe unique one-dimensional (1D) electronic structure and strong electron–phononcoupling of SWNTs under resonance conditions, Raman scattering experiments atthe single-nanotube level allow one to identify the nanotube structure, including its
One contribution of 13 to a Theme ‘Raman spectroscopy in carbons: from nanotubes to diamond’.
Phil. Trans. R. Soc. Lond. A (2004) 362, 2311–23362311
c© 2004 The Royal Society
on July 15, 2011rsta.royalsocietypublishing.orgDownloaded from
2312 A. Jorio and others
diameter dt and chiral angle θ, and to obtain much detailed information about thevibrational and electronic properties of nanotubes. The confinement of electrons andphonons in a 1D structure gives rise to an unexpected Raman line-shape depen-dence on Elaser, interesting effects such as Stokes/anti-Stokes asymmetry, and manyphenomena not previously observed in other systems.
In this paper, the basic concepts and characteristics of Raman spectra from single-wall carbon nanotubes, both isolated and bundled (see figure 1) are presented. Sec-tion 2 discusses the physical properties of the SWNTs. The following sections discuss,separately, the Raman features allowed in a first-order Raman scattering process,originating from a single-resonance process and the combination or disorder-inducedmodes, which originate from the double-resonance process. Each Raman feature,namely the radial breathing mode (RBM), the tangential G band, the combinationmodes and disorder-induced bands, are discussed, and their physical origin and theircapability for characterizing the remarkable vibrational and electronic properties ofSWNTs are addressed. Raman spectra from aligned 0.4 nm diameter SWNTs insidethe pores of zeolite templates and from MWNTs are presented at the end, togetherwith a discussion on what can be learned about graphite using the Raman spectraof SWNTs.
2. Physical properties of SWNTs
The Raman spectra of carbon nanotubes consist of a rich set of features (see figure 1)with an intricate dependence on the laser energy Elaser, and careful spectral analy-sis gives detailed information on both their vibrational and electronic structures.Usually Raman spectra only explicitly involve phonons, being independent of theelectronic structure of the material and the laser energy used to excite the Ramanspectra. However, the scattering efficiency becomes larger when Elaser matches theenergy between optically allowed electronic transitions in the material, in the so-called resonance Raman scattering effect (Martin & Falicov 1983). The resonanceRaman intensity depends on the density of electronic states (DOS) available forthe optical transitions, and this property is especially important for 1D systems, asdiscussed below.
An SWNT is constructed by rolling up a graphene layer into a seamless cylinder.Therefore, carbon nanotubes are strongly related to their parent material, graphite,which exhibits interesting higher-order and defect-induced Raman bands, not usuallyseen in typical Raman spectra of solids. It is, therefore, fruitful to develop a jointstudy searching for similarities between the Raman spectra of graphite and nano-tubes, and for differences in these spectra related to the 1D structure of nanotubes.
(a) Unit cell of SWNTs
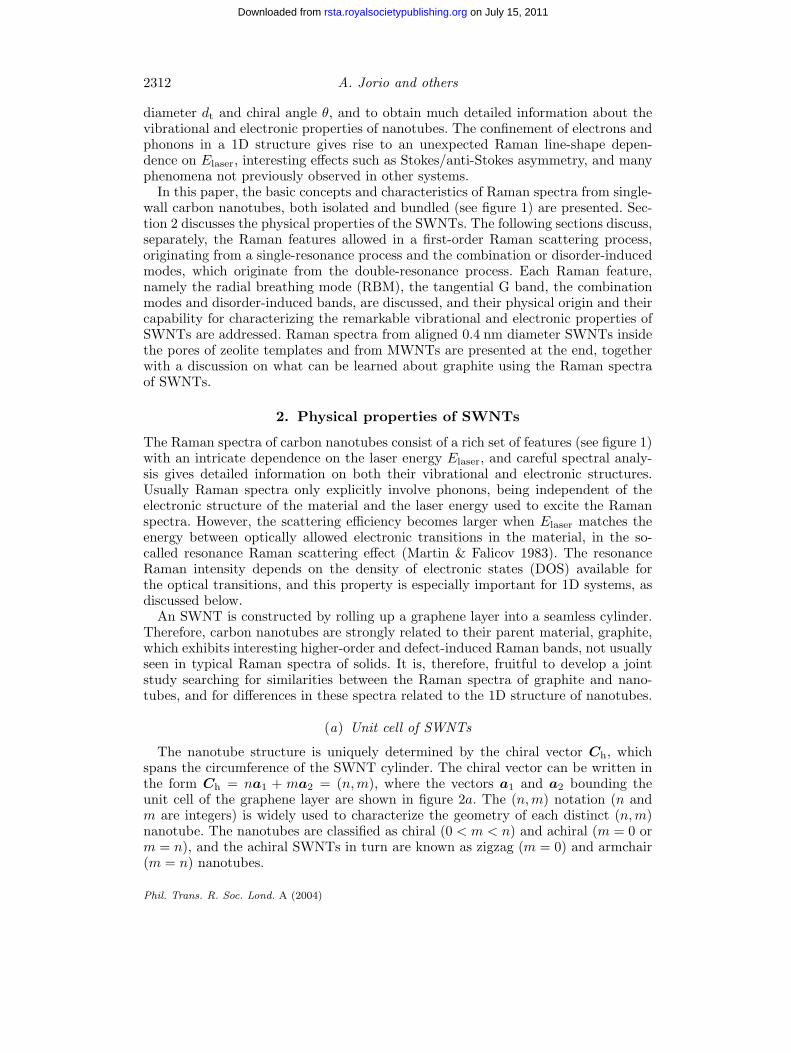
The nanotube structure is uniquely determined by the chiral vector Ch, whichspans the circumference of the SWNT cylinder. The chiral vector can be written inthe form Ch = na1 + ma2 = (n, m), where the vectors a1 and a2 bounding theunit cell of the graphene layer are shown in figure 2a. The (n, m) notation (n andm are integers) is widely used to characterize the geometry of each distinct (n, m)nanotube. The nanotubes are classified as chiral (0 < m < n) and achiral (m = 0 orm = n), and the achiral SWNTs in turn are known as zigzag (m = 0) and armchair(m = n) nanotubes.
Phil. Trans. R. Soc. Lond. A (2004)
on July 15, 2011rsta.royalsocietypublishing.orgDownloaded from

Determination of nanotubes properties by Raman spectroscopy 2313
0 500 1000 1500 20000 500 1000 1500 2000 2500
785 nm 1.58 eVisolated SWNTs
iTOLA
M
— Si/SiO2*
metallic
semiconducting
RB M
RBM
*
*
*
*
*
*
D
D
G
G
G'
G'
Ti:sapphire laser
Ram
an in
tens
ity
frequency (cm−1)
frequency (cm−1)
×30RBM
IFM
D M
GAr laser514 nm 2.41 eVSWNT bundles
(a) (b)
Figure 1. (a) Raman spectra taken at 1.58 eV from one metallic and one semiconducting SWNTgrown by the CVD method on an Si/SiO2 substrate. The first-order single-resonance RBM andG band features are the most intense Raman peaks. Many other harmonics and combinationmodes (i.e. iTOLA, M, G′) are observed, as well as disorder-induced bands (e.g. D band). Thepeaks marked with an ‘*’ come from the Si/SiO2 substrate. Relatively high laser powers (up to40 × 109 W m−2) can be used to probe isolated SWNTs because of the unusually high thermalconductivity values for carbon nanotubes (3000 W mK−1) (Berber et al. 2000; Kim et al. 2001;Small et al. 2003), their excellent high-temperature stability, and their good thermal contactwith the substrate. (b) Raman spectra taken at 2.41 eV from an SWNT bundle sample grown bythe arc method. The intensity for the intermediate frequency mode (IFM) region is multipliedby 30 to clearly show the richness of the Raman spectra. The power used to measure the Ramanspectra for SWNT bundles without burning the sample should be much lower than for isolatedSWNTs, usually not higher than 1 mW using a 100× objective lens.
y
xa2
a1
T
θ Ch
A
ax
ay
RK2 K1
ky
kx
b2
b1
K'KMΓ−13
140
Γbx
by
B
Figure 2. (a) Unit cell for a (4, 2) SWNT formed from a graphene layer. The chiral vector Ch
is given by Ch = 4a1 + 2a2. A (4, 2) nanotube is one of the smallest-diameter nanotubes eversynthesized (Wang et al. 2000). (b) Reciprocal space of the graphene layer. Parallel equidistantlines represent the cutting lines for the (4, 2) nanotube, labelled by the cutting line index µ,which assumes values from 1 − N/2 = −13 to N/2 = 14. The reciprocal lattice unit vectors(K1, K2) of the nanotube (shown in close-up) are indicated (Samsonidze et al. 2003a).
The unit cell of an unrolled nanotube on a graphene layer is a rectangle bounded bythe vectors Ch and T (see the rectangle shown in figure 2a for the (4, 2) nanotube).The nanotube unit cell projected on the graphene layer consists of N hexagons
Phil. Trans. R. Soc. Lond. A (2004)
on July 15, 2011rsta.royalsocietypublishing.orgDownloaded from

2314 A. Jorio and others
bounded by the vectors Ch and T as shown in figure 2a. The translation vector Tis given by
T =√
3z × Ch
dR=
(2m + n)a1
dR− (2n + m)a2
dR,
where z is a unit vector normal to the graphene sheet and dR = gcd(2n+m, 2m+n))†.The nanotube diameter dt and chiral angle θ, which determine the length L of the
chiral vector Ch = |Ch| = πdt ≡ L and the orientation of Ch on the graphene layer(see figure 2a) can both be expressed in terms of the indices n and m by the relations
dt =a√
n2 + nm + m2
πand tan θ =
√3m
2n + m,
as one can derive from figure 2a, where a =√
3aC–C = 0.246 nm is the latticeconstant for the graphene layer and aC–C = 0.142 nm is the nearest neighbour C–Cdistance (Saito et al. 1998).
(b) Reciprocal space of SWNTs
When a slice of graphene sheet is rolled up to form a carbon nanotube, thewave vectors along the circumferential direction become quantized due to peri-odic boundary conditions (k⊥ = �K1, where K1 = 2/dt and � = 1, . . . N , whereN = 2(n2 + m2 + nm)/dR), while the wave vectors k‖ along the tube-axis direc-tion K2 remain quasi-continuous. The resulting lines of permitted wave vectors inthe reciprocal space of the SWNT can be represented in the two-dimensional (2D)graphene-sheet Brillouin zone by cutting lines of allowed wave vectors, as shown infigure 2b (Samsonidze et al. 2003a).
The reciprocal space vectors for the nanotube, K1 and K2, can be constructedusing the standard definition, Ch · K1 = T · K2 = 2π and Ch · K2 = T · K1 = 0.The vector K2 is directed along the nanotube axis, so that the cutting lines arealso aligned along the tube axis. K1 can be written in the form K1 ∝ t2b1 − t1b2 toprovide its orthogonality to the vector T , taking into account that ai · bj = 2πδij .Similarly, K2 ∝ mb1 − nb2 is orthogonal to Ch. The normalization conditionsCh · K1 = T · K2 = 2π are used to calculate the proportionality coefficients, yieldingthe magnitudes of the reciprocal lattice vectors,
|K1| =2dt
and |K2| =2π
|T | .
The length and orientation of each cutting line in reciprocal space is given by thewave vector K2, while the separation between two adjacent cutting lines is given bythe wave vector K1. In the case of the (4, 2) nanotube, the N = 28 cutting lines areshown in figure 2b and are numbered by the index µ varying from 1 − N/2 = −13 toN/2 = 14, where the middle cutting line µ = 0 crosses the Γ point, the centre of thefirst Brillouin zone of the graphene layer.
(c) Electronic structure and selection rules for optical transitions
The electronic structure of a carbon nanotube can be obtained from its parentmaterial, graphite, accounting for quantum confinement of the electronic states in
† gcd(k, l) denotes the greatest common division of the integers k and l
Phil. Trans. R. Soc. Lond. A (2004)
on July 15, 2011rsta.royalsocietypublishing.orgDownloaded from

Determination of nanotubes properties by Raman spectroscopy 2315
−5
0
5
10
15
−5
0
5
10
15
ener
gy (
eV)
wave vector DOS (statesC atom−1 eV−1)
ener
gy (
eV)
−π /T π /T0 0 1.0
(a) (b) (c)
0.5 1.5
Figure 3. (a) The conduction and valence bands of the graphene layer in the first Brillouin zonecalculated according to the π band nearest-neighbour TB model (Saito et al. 1998). Solid curvesshow the cutting lines for the (4, 2) nanotube (Samsonidze et al. 2003a). (b) Band diagram forthe (4, 2) nanotube obtained by zone-folding from (a). (c) Density of electronic states for theband diagram shown in (b).
these 1D materials. The electronic σ bands are responsible for the strong in-planecovalent bonds within the 2D graphene sheets, while the π bands are responsiblefor weak van der Waals interactions between such sheets in graphite. In contrast tothe σ bands, the π bands get close to the Fermi level at the K(K′) points in theBrillouin zone (see figure 2b), so that electrons can be excited from the valence (π)to the conduction (π∗) band optically. Figure 3a shows the electronic dispersion forthe π and π∗ bands of 2D graphite in the first Brillouin zone obtained with thetight-binding (TB) method (Saito et al. 1998).
The electronic band structure of the nanotube can be easily obtained by super-imposing the 1D cutting lines on the 2D electronic constant energy surfaces, asshown in figure 3a, where the cutting lines shown in figure 2b were translated to thefirst Brillouin zone in a K2-extended representation (Samsonidze et al. 2003a). TheSWNT electronic structures in figure 3a, b are given for a (4, 2) SWNT (diameterdt = 0.4 nm), which is used here for illustrative purposes. For such a small dt SWNT,however, the large curvature of the graphene sheet induces changes in the C–C bonddistances and causes a mixing of the σ and π bonds, and more accurate methodsthan TB with a nearest-neighbour interaction must be used to describe the electronicstructure for small-diameter SWNTs (dt < 1 nm).
The cutting line µ = 0 crossing the Γ point of the graphene sheet belongs to thetotally symmetric irreducible representation A. In general, the next cutting lines(µ = 1, 2, 3, . . . ) belong to doubly degenerate E1, E2, E3, . . . irreducible representa-tions, and are related to the wave harmonics along the nanotube circumference, theireigenvectors exhibiting 2, 4, 6, . . . nodes, respectively.
The unique optical properties observed in SWNTs are related to their 1D con-finement of electronic states, resulting in van Hove singularities (VHSs) in the DOS.Although the 1D electronic band structure of this small-diameter tube, shown in fig-
Phil. Trans. R. Soc. Lond. A (2004)
on July 15, 2011rsta.royalsocietypublishing.orgDownloaded from

2316 A. Jorio and others
1
2
3
s = 0
t = 2.89 eV
0 1 2 3nanotube diameter dt (nm)
tran
sitio
n en
ergy
Eii (
eV)
Figure 4. Electronic transition energies Eii for all the (n, m) SWNTs with diameters from0.4 nm to 3.0 nm, using a simple first-neighbour TB model (Saito et al. 1998). Deviations fromthis simple one-electron model are expected due to curvature and many-body effects.
ure 3b, appears to be complex, it becomes clear when considering the DOS, as shownin figure 3c, that the optical absorption or emission rate in SWNTs is related pri-marily to the electronic states at the VHSs, thereby greatly simplifying the analysisof the optical experiments.
These singularities in the DOS, and correspondingly in the joint density of states(JDOS), are of great relevance for the resonance Raman scattering of SWNTs. When-ever the energy of incident photons matches a VHS in the JDOS for the joint valenceand conduction bands (subject to selection rules for optical transitions), one expectsto find resonant enhancement of the corresponding Raman process. Owing to thedivergent character of VHSs in these one-dimensional systems, such enhancementcan be extremely confined in energy, appearing almost like the sharp transitionsthat are excited in a molecular system.
In spite of the large number of VHSs in the valence and conduction bands (seefigure 3c), very few optical transitions are allowed, because of symmetry restric-tions. The selection rules governing the optical transitions are commonly derivedfrom group theory and, for light polarized parallel to the nanotube axis, only tran-sitions between the valence and conduction subbands (Ev
µ ↔ Ecµ′) belonging to the
same cutting line (µ′ = µ) in reciprocal space (see figure 3) are dipole allowed. Lightpolarized perpendicular to the nanotube induces optical transitions between adja-cent cutting lines (µ′ = µ ± 1), but they are much weaker due to a depolarizationeffect that screens optical absorption and emission of light in such a geometry (Ajiki& Ando 1994; Marinopoulos et al. 2003).
Each (n, m) SWNT exhibits a different set of VHSs in its valence and conduc-tion bands, and a different set of electronic transition energies between valence Ev
µ
and conduction Ecµ′ band VHSs. For the characterization of nanotubes by Raman
spectroscopy, it is useful to consider plots of the optically allowed transition ener-gies for light polarized along the nanotube axis, Eµµ, versus the nanotube diameter,
Phil. Trans. R. Soc. Lond. A (2004)
on July 15, 2011rsta.royalsocietypublishing.orgDownloaded from

Determination of nanotubes properties by Raman spectroscopy 2317
0
400
800
1200
1600
0
400
800
1200
1600
wave vector−π /T π /T0 0
(a) (b)
0.02 0.04
freq
uenc
y (c
m−1
)
freq
uenc
y (c
m−1
)
DOS (statesC atom−1 cm−2)
(c)
Figure 5. (a) The phonon dispersion relations of the graphene layer in the first Brillouin zonecalculated with the force constants fitted to the Raman scattering data for various graphiticmaterials (Gruneis et al. 2002). Solid curves show the cutting lines for the (4, 2) nanotube in thefully reduced representation. Solid dots show the ends of the cutting lines in the K2-extendedrepresentation. (b) Phonon modes versus wave vector for the (4, 2) nanotube obtained by zonefolding from (a). (c) Density of states for the phonon modes shown in (b).
dt, as shown in the so-called Kataura plot of figure 4 (Kataura et al. 1999). Thetransition energies are labelled as Eii, the subscript i = 1, 2, 3 . . . labelling the tran-sition energy values for a given SWNT as their energy magnitude increases (Saito etal. 1998). SWNTs can be classified in three different families according to whethermod(2n + m, 3) = 0, 1 or 2, where the integers 0, 1, 2 denote the remainders when(2n + m) is divided by 3. Here mod 1 (type 1) and mod 2 (type 2) SWNTs are semi-conducting. mod 0 SWNTs (n < m) are metallic at room temperature, exhibitinga small (of the order of millielectronvolts) chirality-dependent gap (quasi-metallic)at lower temperatures, while n = m armchair tubes are truly metallic. Frequently,superscripts ‘S’ or ‘M’ are used to denote the electronic transition energies EM
ii formetallic SWNTs and ES
ii for semiconducting SWNTs. Each point in the Katauraplot represents one optically allowed electronic transition energy (Eii) from a given(n, m) SWNT. Crosses denote semiconducting SWNTs, and circles denote metallicSWNTs. This plot should be considered as a guide for analysing SWNT Ramanspectra.
(d) Phonon structure of SWNTs
A zone-folding picture, similar to figure 3 for electrons, gives good insights intothe 1D structure of phonons in SWNTs. Two atoms ‘A’ and ‘B’ in the unit cellof the graphene layer (see figure 2a) give rise to six phonon modes, because of thethree degrees of freedom per atom. Figure 5a shows a 2D representation of the sixphonon branches in the first Brillouin zone (Samsonidze et al. 2003a). Superimposingthe N cutting lines in the K2-extended representation on the six phonon frequencysurfaces in the reciprocal space of the graphene layer, according to the zone-foldingscheme as described in § 2 c, yields 6N phonon modes for each carbon nanotube (seefigure 5b). The 6(N/2− 1) pairs of phonon modes arising from the cutting lines with
Phil. Trans. R. Soc. Lond. A (2004)
on July 15, 2011rsta.royalsocietypublishing.orgDownloaded from

2318 A. Jorio and others
indices µ and −µ, where µ = 1, . . . , (N/2−1), are expected to be doubly degenerate,similar to the case of the electronic subbands discussed in § 2 c, while the phononmodes arising from the cutting lines with indices µ = 0 and µ = N/2 are non-degenerate, so the total number of distinct phonon branches is 3(N + 2). For the(4, 2) nanotube, there are 90 distinct phonon branches, as shown in figure 5b.
Similar to electrons, phonons belonging to the cutting line µ = 0, which crossesthe Γ point of the graphene sheet, belong to the totally symmetric irreducible repre-sentation A. Phonons belonging to the next cutting lines (µ = 1, 2, 3, . . . ) belong todouble degenerate E1, E2, E3, . . . irreducible representations, and are related to thewave harmonics along the nanotube circumference.
However, the zone-folding scheme neglects the curvature of the nanotube wall,and it is not accurate for the low-frequency phonon modes (zone-centre acousticmodes), while it does provide reliable results for the high-frequency phonon modes(optical modes). The zone-folding scheme predicts zero frequencies for the perfectlysymmetric radial breathing mode (RBM) and twist phonon mode of the nanotubeat the centre of the Brillouin zone, since they arise from the acoustic phonon modesof the graphene layer. Meanwhile, the frequency of the perfectly symmetric RBM foran isolated SWNT is inversely proportional to the nanotube diameter, varying fromca. 100 to 250 cm−1 for typical diameters of 1–2 nm, as was first predicted within theforce constant model (Jishi et al. 1993).
In order to avoid the limitations of the zone-folding scheme for the low-frequencyphonon modes, the force constant model can be used directly for nanotubes byconstructing and solving the 6N × 6N dynamical matrix for the unit cell of thenanotube, instead of using the 6×6 dynamical matrix for the unit cell of the graphenelayer with consequent zone-folding (Saito et al. 1998). Alternatively, first-principlesmethods can be used instead of force constant models to calculate the phonon modes,but in this case the size of the unit cell should not be too large for ab initio methods.More details about phonon dispersion relations of carbon nanotubes can be found inKresse (2003). Also, at the present time, the accuracy in energy resolution of Ramanexperiments significantly exceeds what ab initio calculational methods can presentlyachieve.
Spikes (or VHSs) appear in the density of phonon states of the SWNTs (see fig-ure 5c), similar to the VHSs appearing in the electronic DOS, except for a muchlarger number of spikes in the phonon DOS than in the electronic DOS, due to thelarger number of phonon modes relative to the number of electronic bands, and themore complex structure of the dispersion relations for phonons than for electrons inthe graphene layer.
3. First-order single-resonance Raman spectroscopy
The first-order single-resonance Raman scattering process involves the followingsteps: light absorption, scattering by a phonon and light emission. The Raman signalfor a given SWNT is sufficiently enhanced when either the incident or the scatteredphoton energy matches a VHS Eii in the JDOS (see figure 4), so that, under stronglyresonance conditions, the spectrum from just one nanotube can be observed. WhenRaman spectra of SWNT bundle samples are taken, only those SWNTs with Eii
Phil. Trans. R. Soc. Lond. A (2004)
on July 15, 2011rsta.royalsocietypublishing.orgDownloaded from

Determination of nanotubes properties by Raman spectroscopy 2319
Γ K1300
1500
1700
ω(κ
) (c
m−1
)
q
LO
TO
A E1 E2
E2
E1 E1g
E2g
A1g
Raman active modes
achiralchiral
XZ YZ
XX − YY
basis functions
XX + YY ZZ
XY
A
G band(a) (b) (c)
Figure 6. (a) Schematic of the G band atomic vibrations along the nanotube circumference andalong the nanotube axis. (b) The Raman active modes of A, E1 and E2 symmetries come from theinterception of the corresponding cutting lines µ = 0, µ = ±1 and µ = ±2 with the dispersionrelation in the unfolded 2D Brillouin zone. The Γ points of the cutting lines are shown by soliddots. (c) The table gives irreducible representations and basis functions for the Raman activemodes according to group theory. The Z-axis is parallel and the (X, Y )-plane is perpendicularto the nanotube axis.
in resonance with the laser excitation energy Elaser will contribute strongly to thespectrum. Because of the resonance process, Raman spectra allow us to study theelectronic and phonon structure of SWNTs in great detail. Momentum conservationrequires only phonons at the centre of the Brillouin zone (wave vector q ≈ 0) toparticipate in the first-order scattering process.
This section begins with a summary of the symmetry selection rules and thendiscusses the two strongest features in the Raman spectra of SWNTs, namely theRBM and the graphite-like G band, which are the main Raman features used forthe characterization of SWNTs. The strong RBM and the G band features appearin the Raman spectra through a first-order resonance Raman process.
(a) Selection rules
There are five classes of permitted first-order resonance Raman scattering processesbetween the VHSs Ev
µ and Ecµ′ (Jorio et al. 2003):
(I) Evµ
Z−→ Ecµ
A−→ Ecµ
Z−→ Evµ,
(II) Evµ
X−→ Ecµ±1
A−→ Ecµ±1
X−→ Evµ,
(III) Evµ
Z−→ Ecµ
E1−→ Ecµ±1
X−→ Evµ,
(IV) Evµ
X−→ Ecµ±1
E1−→ Ecµ
Z−→ Evµ,
(V) Evµ
X−→ Ecµ±1
E2−→ Ecµ∓1
X−→ Evµ,
⎫⎪⎪⎪⎪⎪⎪⎪⎪⎪⎪⎬⎪⎪⎪⎪⎪⎪⎪⎪⎪⎪⎭
(3.1)
where A, E1, and E2 denote phonon modes of different symmetries of the cuttinglines µ = 0, µ = ±1, and µ = ±2, respectively, near the Γ-point (Damnjanovicet al. 1999; Saito et al. 1998, 2001). The (X, Z)-plane is parallel to the substrateon which the nanotubes lie, the Z-axis is directed along the nanotube axis, andthe Y -axis is directed along the light propagation direction, so that the Z and Xin equation (3.1) stand for the light polarized parallel and perpendicular to thenanotube axis, respectively. The five processes of equation (3.1) result in differentpolarization configurations for different phonon modes, ZZ and XX for A, ZX and
Phil. Trans. R. Soc. Lond. A (2004)
on July 15, 2011rsta.royalsocietypublishing.orgDownloaded from

2320 A. Jorio and others
100 150 200 250 300 350
frequency (cm−1)
148 (9)
(20, 2)
164 (8)
(11, 11)
237 (5)
(10, 5)
SiRBM
inte
nsit
y (a
rb. u
nits
)
Figure 7. Schematic of the atomic vibrations in the RBM mode and Raman spectra of isolatedSWNTs grown by the CVD method on an Si/SiO2 substrate (Jorio et al. 2001a). The spectraare taken at three different spots on the substrate where the RBM Raman signal from resonantSWNTs are found. The RBM frequencies (line widths) are displayed in cm−1. Also shown are the(n, m) indices assigned from the Raman spectra for each resonant tube. The step at 225 cm−1
and the peak at 303 cm−1 come from the Si/SiO2 substrate.
XZ for E1, and XX for E2, in agreement with the basis functions predicted by grouptheory as discussed below in connection with the table in figure 6. Among the largenumber of phonon modes in carbon nanotubes, only up to 16 are Raman active (A,E1 and E2 symmetry modes), as predicted by group theory (Alon 2001; Dresselhaus& Eklund 2000). Also, equation (3.1) predicts different resonance conditions fordifferent phonon modes. While the A and E1 modes can be observed in resonancewith both the Eµµ and Eµ,µ±1 VHSs in the JDOS, the E2 modes can only be observedin resonance with the Eµ,µ±1 VHSs.
(b) The radial breathing mode
As suggested by the name, in the RBM all the C atoms are vibrating in theradial direction with the same phase (totally symmetric A mode), as if the tubewere breathing (see figure 7). This Raman feature is very useful for characterizingnanotube diameters through the relation
ωRBM =A
dt,
where the A = 248 cm−1 nm parameter has been determined experimentally within5% accuracy for isolated SWNTs on an Si/SiO2 substrate (Jorio et al. 2001a).
Figure 7 shows the Raman spectra at three different spots on an Si/SiO2 sub-strate where resonant SWNTs were observed. The step at 225 cm−1 and the peak at303 cm−1 come from the Si/SiO2 substrate, while the three peaks at 148, 164 and237 cm−1 are RBM features from three different (n, m) SWNTs, as assigned in fig-ure 7. The (n, m) assignment is possible by identifying two tube properties, i.e. theirdiameter (from ωRBM) and the resonant electronic transition energy Eii, as discussedbelow.
Phil. Trans. R. Soc. Lond. A (2004)
on July 15, 2011rsta.royalsocietypublishing.orgDownloaded from

Determination of nanotubes properties by Raman spectroscopy 2321
−400 −300 −200frequency (cm−1)
0
2500
5000
7500
10000
12500
15000
17500
inte
nsity
100 200 300 400frequency (cm−1)
173.6 cm−1−173.6 cm−1Si Si
1.60 1.75
El (eV)
1.60 1.65 1.70 1.75Elaser (eV)
0
250
500
0
0.2
0.4
JDO
S
1.60 1.65 1.70 1.75Elaser (eV)
0
500
1000
inte
nsity
(ar
b. u
nits
)
−100
1 2
(a) (b)
(c) (d )
Figure 8. (a) The Elaser dependence of the anti-Stokes Raman spectra from an SWNT grown onan Si/SiO2 substrate using the CVD method. The spectra from bottom to top were taken byvarying Elaser from 1.623 eV up to 1.772 eV. The peak at ±303 cm−1 comes from the substrateand was used for calibration of the Raman signal. The peak at ±173.6 cm−1 is related to theRBM from an SWNT. It appears and disappears as the laser is tuned to achieve resonance.(c) Resonance profile (RBM intensity versus Elaser) for the anti-Stokes RBM spectra shown in(a). (d) Resonance profile for the Stokes spectra (shown in (b)). The Stokes signal is noisierbecause the scattered light energy falls in the range where the spectrometer gratings are losingefficiency. The solid and dashed lines in (c) and (d) are fitted to experimental points (see text).The upper inset in (c) shows the Stokes and anti-Stokes fitting curves together. The lower insetto (c) shows the sharp JDOS obtained to reproduce the fit in (c) and (d) (Jorio et al. 2001b).
Phil. Trans. R. Soc. Lond. A (2004)
on July 15, 2011rsta.royalsocietypublishing.orgDownloaded from

2322 A. Jorio and others
1450 1550 1650frequency (cm−1)
Ram
an in
tens
ity
SWNT
HOPG
MWNT
SWNT
metallic
semicond
1582
1582
1570 G −
G +1592
1587
1550
G +G−
140 170 200 230ω RBM (cm−1)
1530
1555
1580
1605
freq
uenc
y (c
m−1
)
1/dt (nm−1)
E1AE2
0.56 0.69 0.81 0.93(a) (b)
Figure 9. (a) G band for highly ordered pyrolytic graphite (HOPG), MWNT bundles, one iso-lated semiconducting SWNT and one isolated metallic SWNT. (b) ωG (open symbols) versusωRBM (bottom axis) and 1/dt (top axis) for several isolated semiconducting SWNTs. Experimen-tal data obtained with Elaser = 1.58, 2.41 and 2.54 eV. The ωG are clearly dependent on dt, butthere is no clear evidence for any ωG dependence on Elaser. The spectra with ωRBM > 200 cm−1
were obtained with Elaser = 1.58 eV. Solid symbols connected by solid lines come from ab initiocalculations (Dubay et al. 2002) downshifted by 18, 12, 12, 7, 7, 11 cm−1 from the bottom tothe top of these six ab initio curves, respectively.
The resonant window for a first-order Raman feature, such as the RBM mode, canbe calculated within third-order time dependent perturbation theory,
I(El) =∑
k
|K(k)|2,
K(k) =Mabs
opt (k)MS/ASel-ph (k)M ems
opt (k)[El − E(k) − iΓ ][El ∓ �ωph − E(k) − iΓ ]
,
⎫⎪⎪⎪⎬⎪⎪⎪⎭
(3.2)
where K(k) is the third-order matrix element; k is the wave vector of the initialelectronic state; Mabs
opt , MS/ASel-ph and M ems
opt are, respectively, the transition matrix ele-ments for the optical absorption, electron–phonon interaction for either the Stokes(phonon emission) or anti-Stokes (phonon absorption) processes, and optical emis-sion; El is the laser excitation energy; ωph is the zone-centre phonon frequency;E(k) = Ec(k) − Ev(k) is the electronic transition energy; Γ is proportional to theinverse lifetime for the scattering process; the ‘∓’ signs correspond to the Stokes(−)/anti-Stokes (+) processes, i.e. phonon emission (−)/absorption (+) (Martin &Falicov 1983).
By using a tunable system and tuning over one electronic transition Eii of a singleisolated nanotube, it is possible to determine Eii and Γ . Such an experiment wasperformed (see figure 8) (Jorio et al. 2001b), for an SWNT with ωRBM = 173.6 cm−1,
Phil. Trans. R. Soc. Lond. A (2004)
on July 15, 2011rsta.royalsocietypublishing.orgDownloaded from

Determination of nanotubes properties by Raman spectroscopy 2323
i.e. dt = 248/173.6 = 1.43 nm. Values for Eii = 1.655 ± 0.003 eV and Γ = 8 meVwere also found from figure 8. Knowing dt and Eii allowed the assignment of themeasured SWNT as the (18, 0) metallic SWNT (Jorio et al. 2001b).
In the upper inset of figure 8c, it is shown that the resonance window for theStokes and anti-Stokes spectra are displaced from each other, due to the ±�ωphfactor. This displacement makes it possible to find Eii experimentally without using atunable system, by just measuring the anti-Stokes/Stokes intensity ratio with a singlelaser line (Souza Filho et al. 2001, 2004). Measurements of the anti-Stokes/Stokesintensity ratio for the RBM feature of many isolated SWNTs on Si/SiO2 substratesshow that the simple nearest-neighbour TB model describes the Eii values well fornanotubes with diameters larger than 1.2 nm. These measurements are well describedconsidering γ0 = 2.89 eV. The experimental and calculated Eii values start to deviatefrom each other for smaller diameter SWNTs, with the experimental values of ES
22lying below the TB calculated ES
22 for SWNTs with smaller diameters (Souza Filhoet al. 2004).
The natural line widths for the RBM feature observed for isolated SWNTs onan Si/SiO2 substrate are γRBM = 3 cm−1, although larger ΓRBM values are usuallyobserved due to broadening effects (Jorio et al. 2002a). The broadening has beenobserved to increase as the SWNT diameter is increased, and ΓRBM > 20 cm−1
values have been observed for dt > 2 nm.For SWNT bundles, the relation ωRBM = A/dt + B applies, where B is an upshift
coming from tube–tube interaction, and A = 234 cm−1 nm and B = 10 cm−1 havebeen found for SWNT bundles (Kuzmany et al. 2001; Milnera et al. 2000). For theusual diameter range 1 < dt < 2 nm, the two sets of parameters (for isolated (Jorioet al. 2001a) and bundled (Kuzmany et al. 2001; Milnera et al. 2000) SWNTs) givesimilar dt for a given ωRBM, differing considerably only for dt < 1 nm and dt > 2 nm.However, for dt < 1 nm, the simple ωRBM = A/dt+B relation is not expected to holddue to nanotube lattice distortions leading to a chirality dependence of ωRBM (Kurtiet al. 2003). For large-diameter tubes (dt > 2 nm), the intensity of the RBM featureis weak and is hardly observable, probably due to a weaker quantum confinementand broadening effect.
In SWNT bundles, a single Raman measurement gives an idea of the special nano-tubes that are in resonance with that laser line, but does not give a complete char-acterization of the diameter distribution of the sample. However, by taking Ramanspectra using many laser lines, a good characterization of the diameter distributionin the sample can be obtained (Milnera et al. 2000). A careful analysis of figure 4,considering the Elaser line to be used, should be made to correctly understand theRBM information that can be obtained from the Raman spectra from an actualSWNT sample.
(c) The G band
The G band can also be used to characterize SWNT samples. Figure 9a shows theG band for graphite, MWNT bundles, one isolated semiconducting SWNT and oneisolated metallic SWNT. Figure 9b shows that the G band frequency also dependson the SWNT diameter.
The G band accounts for six Raman allowed modes appearing in the frequencyregion 1500–1600 cm−1. The G comes from graphite, since this band is related to the
Phil. Trans. R. Soc. Lond. A (2004)
on July 15, 2011rsta.royalsocietypublishing.orgDownloaded from

2324 A. Jorio and others
Table 1. Diameter dependence of some features observed inthe Raman spectra of isolated SWNTs
(Here ω0 denotes the mode frequency associated with 2D graphite, whose value depends on thelaser excitation energy, if the mode is associated with a double-resonance process. Frequenciesare in units of cm−1 and the tube diameter dt is in units of nm. The coefficients for the D, M,and G′ bands were obtained by using data measured with Elaser = 2.41 eV. ω = ω0 + β/dn
t .)
frequency exponent diametermode ω0 n coefficient β
RBM 0 1 248a
D ω0D 1 −16.5b
G+ 1591 0 0G− 1591 2 (−45.7; −79.5)c
M+ ω0M+ 1 −18.0d
M− ω0M− 1 −16.7d
G′ ω0G′ 1 −35.4b
aJorio et al. (2001a).bThis value was obtained using Elaser = 2.41 eV. By using the spectra obtained with 1.58 eV, aβ = −18.9 cm−1 nm value was obtained (Souza Filho et al. 2003).cThe coefficient β for the G− component is, respectively, −45.7 and −79.5 cm−1 nm2 for semi-conducting and metallic SWNTs. The 1.58, 2.41 and 2.54 eV laser lines were used to obtain theG band experimental results used in the fitting procedure (Jorio et al. 2002d).dBrar et al. (2002).
graphite tangential E2g2Raman active mode, where the two atoms in the graphene
unit cell are vibrating tangentially one against the other. The Raman allowed tan-gential mode in graphite is observed at 1582 cm−1 (see figure 9a). Unlike graphite,the tangential G mode in SWNTs gives rise to a multi-peak feature because of thesymmetry breaking of the tangential vibration when the graphene sheet is rolledto make a cylindrically shaped tube, and because of quantum confinement of thephonon wave vector along the nanotube circumference (see figure 6).
The A, E1 and E2 symmetry modes are Raman allowed, and each of them canexhibit carbon atom vibrations along the nanotube axis or along the circumferentialdirection, thus resulting in six Raman active modes (see figure 6). This feature can beused to characterize dt (although it is less accurate than the RBM), to differentiatemetallic SWNTs from semiconducting SWNTs, and then to obtain other importantinformation related to polarization analysis of Raman spectra, which is the subjectof the next subsection.
Figure 9b shows the diameter dependence of the G mode frequencies (ωG), forthe six Raman allowed G band modes from semiconducting SWNTs. The upperfrequency A, E1 and E2 modes, or G+ group, associated with atomic vibrations alongthe nanotube axis, is practically independent of tube diameter. The lower frequencyA, E1 and E2 modes, or G− group, associated with vibrations along the nanotubecircumference, decreases with decreasing dt, and this decrease becomes larger as thecurvature of the SWNT increases (Jorio et al. 2003).
For a simpler picture, the G band profile can be fit by using only two peaks, onefor the G+ feature and one for the G− feature, for both metallic and semiconducting
Phil. Trans. R. Soc. Lond. A (2004)
on July 15, 2011rsta.royalsocietypublishing.orgDownloaded from

Determination of nanotubes properties by Raman spectroscopy 2325
SWNTs (Jorio et al. 2002d). The splitting
∆ωG = ωG+ − ωG−
can then be used for diameter characterization (see table 1). If isolated SWNTsare measured, the value of ∆ωG refers to the particular tube in question, but ifSWNT bundles are measured, the ∆ωG will be roughly related to the maximum inthe Gaussian diameter distribution of the sample, but does not accurately reflect thediameter dependence of ωG− . Note from the β parameter in table 1 that the downshifton ωG− is much larger for metallic SWNTs than for semiconducting SWNTs.
The difference between the G band line shape for semiconducting and metallicSWNTs is evident in the line shape of the G− feature (see figures 1 and 9a), whichis broadened for metallic SWNTs in comparison with the Lorentzian line shape forsemiconducting tubes, and this broadening is related to the presence of free electronsin nanotubes with metallic character (Brown et al. 2001; Pimenta et al. 1998). Thisbroadened G− feature is usually fitted using a Breit–Wigner–Fano (BWF) line thataccounts for the coupling of a discrete phonon with a continuum related to theconduction electrons (Brown et al. 2001; Jiang et al. 2002). This BWF line is observedin many graphite-like materials with metallic character, such as n-doped graphiteintercalation compounds (GIC) (Dresselhaus & Dresselhaus 1981, 2002), n-dopedfullerenes, as well as metallic SWNTs.
Considering the (Eii versus dt) plot in figure 4, for a given Elaser line, one canpredict the diameter range where semiconducting-like G− band line shapes will beobserved and the diameter range for which the metallic-like G− band line shapesshould be observed (Pimenta et al. 1998). Observation of a metallic-like G− bandwhen a semiconducting line shape should be observed indicates the presence ofcharged impurities (Rao et al. 1997b). Electro-chemical doping also changes theG band characteristics (as well as frequencies) (Corio et al. 2003).
The line widths ΓG+ for the G peaks from isolated SWNTs are usually around5–15 cm−1, and the same range of line widths for ΓG− are found for semiconductingisolated SWNTs (Jorio et al. 2002a). For semiconducting SWNTs in bundles, theline widths are related to the diameter distribution, and therefore the broadeningprincipally occurs for ΓG− . For metallic SWNTs, the broadening is minor for ΓG+ ,while for ΓG− a significant broadening occurs, and it is found that the line widthfor the BWF line is strongly dependent on tube diameter. For isolated tubes withdt > 2 nm, ΓG− is similar to semiconducting SWNTs, and the G− feature mostlylooks like a normal Lorentzian, reflecting the small magnitude of the BWF effect.The BWF effect increases as the tube diameter decreases, causing the G− feature tobecome more asymmetric and broad. Values of ΓG− > 70 cm−1 have been observedfor isolated metallic SWNTs (Jorio et al. 2002a).
(d) Polarization analysis
Polarization of the incident and scattered light is not an important issue for asample of misaligned carbon nanotubes, but polarization effects are very importantfor the Raman response of a sample of aligned carbon nanotubes (either aligned bun-dles or a single straight carbon nanotube). There is a general and simple polarizationbehaviour that one should have in mind when acquiring the Raman spectra from asample of aligned carbon nanotubes. Carbon nanotubes behave as antennas, with the
Phil. Trans. R. Soc. Lond. A (2004)
on July 15, 2011rsta.royalsocietypublishing.orgDownloaded from

2326 A. Jorio and others
1500 1575 1650frequency (cm−1)
0
100
inte
nsity
80100
120
140
160
60
40
20
φ = 0º
180
1500 1550 1600 1650frequency (cm−1)
θS
1591
1571
1600
1554
1563
200''
θS + 90º''
(a) (b)
Figure 10. (a) Polarization dependence of the G band from one isolated semiconducting SWNTsitting on an Si/SiO2 substrate (Jorio et al. 2002b) with incident and scattered light polarizedparallel to each other. φ = 0◦ stands for the incident light polarized along the nanotube axis.(b) Polarization scattering geometry dependence for the G band from one isolated SWNTs inresonance with Elaser = 2.41 eV. The Lorentzian peak frequencies are in cm−1. θ′′
S denotes theinitial angle between the light polarization and the SWNT axis direction, not known a priori.From the relative intensities, and the polarization behaviour of the G band modes, θ′′
S ∼ 90◦
was assigned (Jorio et al. 2003), and the mode symmetries are E2 for the 1554 and 1600 cm−1
peaks and A for the 1571 and 1591 cm−1 peaks. The broad feature at 1563 cm−1 is assigned asa disorder-induced feature, as discussed in § 4 b (ii).
absorption/emission of light being highly suppressed for light polarized perpendic-ular to the nanotube axis. Therefore, if one wants to measure Raman spectra froma sample of aligned carbon nanotubes, the largest Raman intensity will generallybe observed for light polarized along the tube axes, and almost no signal will beobserved for cross-polarized light (Duesberg et al. 2000; Hwang et al. 2001; Jorio etal. 2002b), as shown in figure 10a.
This antenna effect is expected by symmetry selection rules. When acquiring thepolarized spectra from a single SWNT with a fixed laser energy, it is not possibleto observe Raman signals from both parallel and perpendicular polarization, sincethe resonance energies for the polarized light in these polarization directions aredifferent from each other (see § 3 a). Furthermore, the depolarization effect, whichscreens optical absorption and emission of cross-polarized light (Ajiki & Ando 1994;Marinopoulos et al. 2003) must be considered.
However, the most interesting results coming from polarization analysis are relatedto the symmetry selection rules for the different phonon/electron symmetries (Jorioet al. 2000, 2002b; Rao et al. 2000). Polarization analysis of the Raman spectra fromboth isolated SWNTs and bundles of SWNTs show that it is possible to observe the
Phil. Trans. R. Soc. Lond. A (2004)
on July 15, 2011rsta.royalsocietypublishing.orgDownloaded from

Determination of nanotubes properties by Raman spectroscopy 2327
predictions from group theory. This result is clear when observing the appearanceand disappearance of the E2 symmetry modes, as shown in figure 10b. Accordingto symmetry selection rules (see equation (3.1)), the A symmetry modes can beobserved for both (ZZ) and (XX) scattering geometries, while E2 symmetry modescan only be observed for the (XX) scattering geometry (see also the table in figure 6).The clear observation of strong E2 modes in figure 10b indicates that a resonanceRaman signal is obtained with both the absorption and emission of light for lightcrossed polarized with respect to the nanotube axis, in disagreement with the generalpolarization result expected due to the antenna effect. Observation of cross-polarizedlight is important for showing that electronic transitions between neighbouring cut-ting lines (Eµ ↔ Eµ±1) can indeed be observed. Study of these transitions across twodifferent cutting lines is expected to make it possible to assign the valence/conductionbands asymmetry around the Fermi level using optical transitions (Jorio et al. 2003).Careful experiments using a tunable laser on a single SWNT in resonance with an(Eµ ↔ Eµ±1) transition and a polarization analysis of the resulting spectra willbe necessary to extract the important physics related to the Raman spectra usingcross-polarized light.
4. Double-resonance Raman spectra
The double-resonance Raman scattering process involves the following steps: lightabsorption, scattering by a phonon (symmetry Eµ and momentum q), scatteringby another phonon (Eµ′,q′) (combination mode) or by a defect (disorder-inducedmode), and finally light emission. For the ZZ scattering geometry, selection rules forcombination modes requires µ = µ′ and q′ = −q, for angular and linear momentumconservation, respectively. In the case of disorder-induced modes, defects can mixelectronic states and there is no symmetry requirement.
Such a process is usually much less intense than first-order single-resonance Ramanscattering, because it exhibits an extra scattering process. However, when one ofthe internal scattering processes (by a phonon or by a defect) connects two realelectronic states, this process can become comparable in intensity with the first-order single-resonance Raman process, and therefore Raman peaks associated witha double-resonance process can also be observed. In the double-resonance process,resonance with either the incident or scattered light plus resonance with the internal(intermediate) scattering event occurs.
More details about the double-resonance physics related to graphite can be foundin Thomsen et al. (2004). In the case of carbon nanotubes, however, the strong con-finement of electrons and phonons into VHSs makes the usual dispersive behaviourof the double-resonance features to be discrete, with the Raman spectra beingobservable only for specific phonons connecting specific electronic states. Energyand momentum conservation requirements for the double-resonance process, togetherwith electron and phonon confinement into 1D VHSs, then make it possible to addressspecific points in the interior of the Brillouin zone. For this reason, the combinationmodes or disorder-induced features turn out to give very interesting and accurateinformation about both the vibrational and electronic structure of SWNTs. Suchinformation is not available by analysis of the first-order single-resonance features,and this is mostly due to the sensitivity of the double-resonance process to the chi-rality of SWNTs.
Phil. Trans. R. Soc. Lond. A (2004)
on July 15, 2011rsta.royalsocietypublishing.orgDownloaded from

2328 A. Jorio and others
(a) Combination modes
The observation of sharp peaks associated with combination modes is common inthe Raman spectra from molecules, but is unusual in the Raman spectra from solids,because the continuum of phonon states in bulk materials results in higher-order(combination mode) Raman scattering with very broad, poorly resolved spectralfeatures. However, phonon confinement in SWNTs generates VHSs in the phononDOS, and interesting effects associated with sharp combination mode features areobserved through the double-resonance process.
The phonon dispersion in SWNTs is rich and several different harmonics andcombination modes have been observed in SWNTs (Brown et al. 2000; Dresselhaus& Eklund 2000). They can usually be related to a combination of specific branchesfrom the phonon dispersion in graphite, such as G′ = 2D (Pimenta et al. 2000),iTO + LA and 2oTO (Brar et al. 2002), etc. (see figure 1). Combination modesare interesting for nanotube characterization, first because they give informationabout many phonon branches not active in first-order Raman scattering, and secondbecause they exhibit chirality-dependent frequencies. This chirality dependence of thepeak frequencies for the weak spectral features can be understood, considering thatthey usually come from phonons associated with interior points in the anisotropic 2DBrillouin zone. Different (n, m) nanotubes imply different folding of the 2D phonondispersion relations. For a fixed phonon wave vector magnitude |q| measured froma high symmetry point (e.g. the K point), the phonon frequencies are different fordifferent phonon propagation directions. During the folding process, this propertyresults in having phonon frequencies for nanotubes with fixed dt, depending on thechiral angle θ.
The so-called G′ band is a Raman feature observed in highly ordered pyrolyticgraphite (HOPG), and it has been very informative about SWNT vibrational andelectronic structure. This feature is the overtone of the well-known D band (see nextsection) and appears in SWNTs around 2700 cm−1, exhibiting a strong frequencydispersive behaviour as Elaser is varied, ∆ωG′/∆Elaser = 106 cm−1 eV−1 (Pimentaet al. 2000).
Unusual double peak G′ features depending on (n, m) give detailed informationabout the position of the electronic VHSs. For metallic SWNTs, the VHSs are knownto split in energy due to the trigonal warping effect, distorting the equi-energy con-tours around the K point in the graphite Brillouin zone. This splitting is observedin the G′ feature, and measurement of the splitting ∆ωG′ versus chiral angle θ givesthe chirality dependence of the energy splitting between the two VHSs in metallicSWNTs (Souza Filho et al. 2002a). Unusual double peak G′ features depending on(n, m) are also observed for a few semiconducting SWNTs exhibiting VHSs spacedby the G′ energy (Souza Filho et al. 2002b). In this case, resonance with both incidentand scattered light can be achieved, each process giving a different ωG′ . Measure-ments of ∆ωG′ for semiconducting SWNTs therefore give information at once aboutthe energy separation between two electronic VHSs (e.g. ES
44 − ES33) for one isolated
SWNT.Also interesting is the intermediate frequency mode (IFM) spectral region, appear-
ing between the RBM and the D/G bands (Fantini et al. 2004). Figure 11a plots thedependence on the excitation laser energy Elaser of the IFM frequencies ωIFM. The
Phil. Trans. R. Soc. Lond. A (2004)
on July 15, 2011rsta.royalsocietypublishing.orgDownloaded from

Determination of nanotubes properties by Raman spectroscopy 2329
600 700 800 900 1000 11001.8
2.0
2.2
2.4
2.6
2.8
2.0
2.2
2.4
2.6
2.8
(23,0)
(21,1)
(20,0)
(18,1)
(17,0)
EM11
ES33
EM22
ES44
600 700 800 900 1000 11002.05 eV
2.342.20
2.54
2.6
2.4
2.2
2.0
(a)
(b)
(c)
(d)
Ela
ser (
eV)
Eii (
eV)
Ram
an in
tens
ity
ω IFM (cm−1)
dt (nm)1.2 1.4 1.6 1.8
ω −IFM ω +
IFM
ω IFM (cm−1)
Ela
ser (
eV)
Figure 11. (a) Two-dimensional plot for the Elaser dependence for frequencies of the features inthe Raman spectra of SWNT bundles in the intermediate frequency mode (IFM) range. The lightareas indicate high Raman intensity. Arrows point to five well-defined ω−
IFM features. (b) Ramanspectra with Elaser = 2.05, 2.20, 2.34, and 2.54 eV. (c) VHS Eii transition energies (from theTB model (Dresselhaus et al. 2001) with γ0 = 2.9 eV and aC–C = 0.142 nm) as a function ofdt. The symbols ‘×’, ‘+’ and ‘◦’ stand for semiconducting type-1, type-2 and metallic SWNTs,respectively. Grey curves connect ES
ii for SWNTs with 2n + m constant. Vertical grey linesconnect ES
33 and ES44 for the (n, m) assigned SWNTs. (d) Theoretical prediction for the ω+
IFMand ω−
IFM shown in (a). Considering only the ES33 and ES
44 VHSs for the SWNTs assigned in (c),the plot in (d) is constructed by considering Elaser = Eii and ω±
IFM = ω±0 + v±
A(6/dt) (see text).
light areas in figure 11a indicate strong Raman intensities. The IFM Raman spectraobtained with Elaser = 2.05 eV (red), 2.20 eV (yellow), 2.34 eV (green) and 2.54 eV(blue) are shown in figure 11b as examples of the different IFM Raman spectra thatare observed. These features are assigned as a combination of an optical phononwith a highly dispersive acoustic-like phonon (ωO ± ωA), thus forming the ‘V’ shapestructure observed in the centre of figure 11a.
Figure 11a shows that the ωO ± ωA Raman process is effective only for specialSWNTs, named semiconducting type-1 nanotubes (for which mod(2n + m, 3) = 1)with θ → 0, because the double-resonance Raman scattering in SWNTs is extremelyselective when considering the confinement of electrons and phonons into VHSs. Onlyspecially selected (n, m) SWNTs can have two electronic states at electronic VHSs(see figure 11c) connected by special phonons with frequencies at phonon VHSs, asexplained further below.
Phil. Trans. R. Soc. Lond. A (2004)
on July 15, 2011rsta.royalsocietypublishing.orgDownloaded from

2330 A. Jorio and others
Figure 11c shows the Eii transition energies as a function of SWNT diameter forthe energy range of lasers used in the experiment and shown in figure 11a, and forthe dt range present in the sample. The laser energies are chosen to be near two close-lying electronic VHSs, namely ES
33 and ES44, that can only be connected resonantly by
E3 symmetry phonons. Figure 11c can be directly related to the experimental resultsshown in figure 11a. The Y -axis energy ranges can be related to electronic VHSsby Elaser = Eii for resonance conditions. The X-axis dt can be transformed intoωIFM by the relation ω±
IFM = ω±O + v±
Aq⊥, while q⊥ = 6/dt for E3 symmetry phononswhich produce VHSs in the phonon density of states. This transformation is appliedonly for the ES
33 and ES44 VHSs for the specific SWNTs assigned in figure 11c, and
the result is shown in figure 11d, where the fitting parameters are ω+O = 540 cm−1
and ω−O = 1195 cm−1, while vA = 2 × 10⁴ m s−1 is the sound velocity in graphite.
The similarity between figure 11d and the ‘V’-picture observed in figure 11a clearlyshows that the step-like dispersive IFMs come from these specific (n, m) SWNTs infigure 11c having θ → 0.
(b) Disorder-induced features
In the presence of a defect, double resonance can occur with only one phonon,and the defect will mix electronic states with different wave vectors, k, but withoutsymmetry or momentum conservation requirements. Therefore, any phonon withinthe SWNT Brillouin zone can be observed in a first-order Raman scattering process.As discussed for combination modes, the disorder-induced bands give informationabout many phonon branches not active in first-order Raman scattering from ahighly ordered sample, and the disorder-induced features exhibit chirality-dependentfrequencies.
(i) Disorder-induced D band
The most studied disorder-induced feature in SWNTs and other carbon-basedmaterials is the so-called D band (D from ‘disorder’), which is related to the high-energy optical phonons in the vicinity of the K point in graphite. The largest interestin studying these phonon features is for defect characterization. Until now no sys-tematic study has been carried out to correlate the presence of the D band with spe-cific defect types (such as hetero-atoms, vacancies, heptagon–pentagon pairs, kinks,or even the presence of impurities, etc.). However, relevant information has beenobtained.
From a large number of Raman spectra from isolated SWNTs grown by CVDon an Si/SiO2 substrate (over 100 signals from physically different tubes), ca. 50%exhibit observable D band signals with weak intensity (usually 100 times smaller thanthe G band). The following two characteristics differentiate the D band in carbonnanotubes from the D band in defective graphite.
Small line widths. From the observation of a large number of D bands from isolatedSWNTs, ΓD HWHM values from 40 cm−1 down to 7 cm−1 have been observed (Jorioet al. 2002a), reflecting electron and phonon confinement. Lorentzian lines were usedto fit the D band features as an approximation for interpreting their behaviour,although it is known that the disorder-induced D band appears in the Raman spectra
Phil. Trans. R. Soc. Lond. A (2004)
on July 15, 2011rsta.royalsocietypublishing.orgDownloaded from

Determination of nanotubes properties by Raman spectroscopy 2331
of graphite-like materials through a double-resonance process (Saito et al. 2002;Thomsen & Reich 2000), where inhomogeneous broadening occurs.
Complex frequency behaviour. The D band frequency ωD depends directly on thenanotube diameter dt and also on the magnitude of the wave vector for the quantizedstate kii, where the VHSs in the density of states occur (Souza Filho et al. 2003).These two effects are manifested in the diameter dependence of the D band frequency,which satisfies the
ωD = ω0D +
C
dt
functional form, but the C is negative (positive) for the spring-constant (double-resonance)-dependent process, thereby indicating that the spring constant softens(downshifts) and the double-resonance stiffens (upshifts) the D band frequencies. Inthe case of the spring constant effect, ω0
D is the frequency observed in 2D graphite(see table 1).
Besides the dt dependence of ωD, the D band was shown to exhibit a ∆ωD =24 cm−1 frequency difference between armchair and zigzag SWNTs when excitedwith Elaser = 2.41 eV (Samsonidze et al. 2003b). Furthermore, this D band featurewas observed to exhibit an interesting line shape dependence on the resonance con-dition (including for SWNT bundles (Pimenta et al. 2000; Zolyomi et al. 2003)),giving detailed information about the position of the electronic VHSs from isolatedSWNTs, as discussed for its overtone G′ band (see the previous section).
(ii) Disorder-induced G band
Besides the D band, any Raman branch can give rise to a defect-induced feature,and Raman data from SWNTs were used to probe the phonon dispersion in graphite(Saito et al. 2002). Maultzsch et al. (2002) studied the double-resonance processapplied to the G band phonon branches. Although six G band modes are predictedin first-order Raman scattering, Maultzsch et al . observed an Elaser dependence ofthe G band frequencies in their Raman spectra, and interpreted dispersive behaviouras providing experimental evidence for double-resonance scattering.
As for the D band, the observation of G band double-resonance features is relatedto defects in the sample. In a defect-free aligned SWNT, the G band first-ordersingle-resonance process, as discussed in § 3 c, is the only feature observed in theRaman spectra. However, in a highly defective and disordered SWNT sample, thedouble-resonance G band components can also be observed, exhibiting an intensitysimilar to that of first-order single-resonance features, as shown in figure 12 (Souzaet al. 2003).
Resonance Raman spectra of the G band from a fibre of an aligned SWNT bun-dle sample (Hwang et al. 2001) was acquired in the (ZZ) polarization scatteringgeometry. From this sample, G band spectra from defect-free aligned SWNTs areobserved (see spectra in figure 12a, obtained at location ‘1’ shown in the inset)(Souza et al. 2003). Two ‘A’ symmetry modes are then observed, in agreement withsymmetry selection rules for first-order single-resonance Raman scattering. Ramanspectra were also taken at the edge of the same fibre (location ‘2’ in the inset tofigure 12a), where misalignment, edge defects and impurities are abundant, and atypical spectrum observed in this case is shown in figure 12b. The spectrum at the
Phil. Trans. R. Soc. Lond. A (2004)
on July 15, 2011rsta.royalsocietypublishing.orgDownloaded from

2332 A. Jorio and others
1200 1400 1600 18000
1
2
3
0
40
80
120
0 21540
1560
1580
1600
frequency (cm−1)
2
inte
nsity
(ar
b. u
nits
)
1
(a)
(b)
1 3laser energy (eV)
freq
uenc
y (c
m−1
)
inte
nsity
(ar
b. u
nits
)
Figure 12. (a) Resonance Raman spectrum taken in the (ZZ) polarization scattering geometry(location ‘1’) of the G band from a fibre of an aligned SWNT bundle sample. The inset showstwo positions on the fibre sample (optical image). (b) G band Raman spectrum taken at theedge of the fibre (location ‘2’) (Souza et al. 2003). The inset shows the Elaser dependence of thetwo peaks indicated by arrows, one showing a strong Elaser dependence, and the other showingno Elaser dependence. The solid lines are predictions for the Elaser dependence of the G banddouble-resonance features in graphite (Saito et al. 2002).
edge shows many features (more than the six predicted for first-order Raman scat-tering), and some of them are dispersive. The different features observed in figure 12bwere assigned to either single or double-resonance processes. For example, the insetto figure 12b shows that the feature observed at ca. 1560 cm−1 (open circles) is dis-persive, while the feature observed at ca. 1570 cm−1 (filled circles) is not. These twopeaks were therefore assigned as double-resonance and single-resonance E1 symme-try phonons, respectively (Souza et al. 2003). Note that the intensity for the Ramanspectrum in the highly defective and misaligned sample is about two orders of mag-nitude lower than the spectrum in the defect-free aligned SWNT sample. However,in the defective and misaligned sample, defect-induced double-resonance features areobserved with intensities comparable to the first-order single-resonance features forthat sample.
5. Spectra from other carbon nanotube systems
The results discussed above address the most usual SWNTs that have been producedand studied (1 < dt < 3 nm). However, it is also interesting to comment about Ramanspectra from the SWNTs with dt = 0.4 nm inside zeolite templates, and Ramanspectra from MWNTs.
Intensive effort has been devoted to the smallest-diameter SWNTs, with dt =0.4 nm, grown inside zeolite templates (Wang et al. 2000). Raman spectroscopy has
Phil. Trans. R. Soc. Lond. A (2004)
on July 15, 2011rsta.royalsocietypublishing.orgDownloaded from

Determination of nanotubes properties by Raman spectroscopy 2333
been used to characterize these samples, showing interesting and very rich spectra(Sun et al. 1999). Their RBM features are consistent with the assigned diameters forthe three possible (n, m) SWNTs that could be grown within the tiny pores of thezeolite template, namely (3, 3), (4, 2) and (5, 0). The G band appears to be complex,showing a very large (ωG+ − ωG−) splitting. Furthermore, several other IFM featuresare observed, and they are assigned to the SWNT phonon density of states (Jorio etal. 2002c).
In the case of MWNTs, because of the typical large diameter of the outer tubes,most of the characteristic differences that distinguish the Raman spectra in carbonnanotubes from those for graphite are not so evident. The RBM from large-diametertubes (above 3 nm in diameter) is usually too weak to be observable. Whereas the(ωG+ − ωG−) splitting is large for small-diameter tubes (see § 3 c), this double-peakG band splitting for large-diameter MWNTs is both small in frequency and smearedout because of the diameter distribution of the constituents of an MWNT. There-fore, the G band feature predominantly exhibits a weakly asymmetric characteristic,with a peak appearing close to the graphite frequency 1582 cm−1 (see figure 9) (Raoet al. 2000). These properties make it more difficult to differentiate the Raman sig-nal of MWNTs from that of graphite and other sp2 carbons. The Raman featuresassociated with the small-diameter inner tubes can sometimes be observed when agood resonance condition is established (Benoit et al. 2002; Zhao et al. 2002), butobtaining a good resonance condition with the innermost shell is not a commonresult.
6. Using SWNTs to learn about graphite
As discussed in § 4, combination modes and disorder-induced features give informa-tion about many phonon branches that are not Raman active in first-order Ramanscattering, with these disorder-induced features exhibiting chirality-dependent fre-quencies. These properties can be used, as an inverse problem in applied mathemat-ics, to get information one could not otherwise obtain from the Raman spectra ofgraphite. The D band feature gives a clear example of this approach, as illustratedbelow.
In graphite, double-resonance energy and momentum conservation requirementsselect the magnitude of the phonon momentum |q| participating in the scatteringprocess. Therefore, a large number of phonons satisfy the double-resonance energyand momentum conservation requirements for a given Elaser (Cancado et al. 2002),and a broad double-resonance Raman feature is observed. However, the quantumconfinement of electrons in the 1D structure of SWNTs allows one to address spe-cific phonon directions in the 2D reciprocal space of graphite because of the relationq � −2k between the phonon (q) and the electron (k) wave vectors in the double-resonance process. The different (n, m) nanotubes imply different folding of the 2Dphonon dispersion relations. Thus, not only is the magnitude of the phonon momen-tum |q| selected, but also the q-direction is selected by the SWNT chiral angle θ.
The D band for SWNTs is shown to exhibit a ∆ωD = 24 cm−1 frequency dif-ference between armchair and zigzag SWNTs when excited with Elaser = 2.41 eV(Samsonidze et al. 2003b). For a fixed phonon wave vector magnitude |q| measuredfrom a high symmetry point (e.g. the K point), the phonon frequencies are differ-ent for different phonon propagation directions, and the trigonal warping effect is
Phil. Trans. R. Soc. Lond. A (2004)
on July 15, 2011rsta.royalsocietypublishing.orgDownloaded from

2334 A. Jorio and others
observed in the phonon equi-energies around the K point. Measuring the chiralitydependence of ωD is equivalent to a measurement of the trigonal warping effect ofphonons in graphite around the K point. Such a measurement would be never possi-ble in the Raman spectra of graphite, where only an average over the 2D reciprocalspace can be obtained.
7. Summary
Raman spectroscopy of nanotubes can be performed at room temperature, underambient pressure, and at the single-nanotube level in nanodevices (Jorio et al. 2002e).The large amount of information that becomes available from Raman spectroscopyat the isolated SWNT level has provided many new results for the development ofmore complete theoretical models describing nanotube physics. The unique opticalproperties observed in SWNTs are related to the 1D confinement of electronic statesresulting in VHSs, and this property is not restricted to SWNTs, but, in principle,occurs in any 1D material of sufficiently small size. The features originating frominternal resonance processes (resonant electron–phonon scattering) have also pro-vided a large amount of information about electrons and phonons within the interiorof the Brillouin zone, and this new physics can probably be extended to any semi-conducting material. Therefore, the capability of this technique, stemming from thefact that it uses light as a non-invasive probe, establishes Raman spectroscopy as animportant technique for studying nanomaterials.
The authors acknowledge M. A. Pimenta, A. G. Souza Filho, Ge. G. Samsonidze, C. Fantiniand M. Souza for helpful discussions. A.J. acknowledges financial support from CNPq-Brazil(Instituto de Nanociencias and Profix). R.S. acknowledges a Grant-in-Aid (No. 13440091) fromthe Ministry of Education, Japan. G.D. and M.S.D. acknowledge support under NSF GrantsDMR 01-16042 and INT 00-00408.
References
Ajiki, H. & Ando, T. 1994 Physica B201, 349.Alon, O. E. 2001 Phys. Rev. B63, 201403(R).Benoit, J. M., Buisson, J. P., Chauvet, O., Godon, C. & Lefrant, S. 2002 Phys. Rev. B66,
073417.Berber, S., Kwon, Y.-K. & Tomanek, D. 2000 Phys. Rev. Lett. 84, 4613.Bethune, D. S., Kiang, C. H., de Vries, M. S., Gorman, G., Savoy, R., Vazquez, J. & Beyers, R.
1993 Nature 363, 605.Brar, V. W., Samsonidze, Ge. G., Dresselhaus, G., Dresselhaus, M. S., Saito, R., Swan, A. K.,
Unlu, M. S., Goldberg, B. B., Souza Filho, A. G. & Jorio, A. 2002 Phys. Rev. B66, 155418.Brown, S. D. M., Jorio, A., Corio, P., Dresselhaus, M. S., Dresselhaus, G., Saito, R. & Kneipp,
K. 2000 Phys. Rev. B61, 7734–7742.Brown, S. D. M., Jorio, A., Corio, P., Dresselhaus, M. S., Dresselhaus, G., Saito, R. & Kneipp,
K. 2001 Phys. Rev. B63, 155414.Cancado, L. G. et al . 2002 Phys. Rev. B66, 035415.Corio, P. et al . 2003 Chem. Phys. Lett. 370, 675–682.Damnjanovic, M., Milosevic, I., Vukovic, T. & Srendanovic, R. 1999 Phys. Rev. B60, 2728.Dresselhaus, M. S. & Dresselhaus, G. 1981 Adv. Phys. 30, 139–326.Dresselhaus, M. S. & Dresselhaus, G. 2002 Adv. Phys. 50, 1–186.
Phil. Trans. R. Soc. Lond. A (2004)
on July 15, 2011rsta.royalsocietypublishing.orgDownloaded from

Determination of nanotubes properties by Raman spectroscopy 2335
Dresselhaus, M. S. & Eklund, P. C. 2000 Adv. Phys. 49, 705–814.Dresselhaus, M. S., Dresselhaus, G. & Avouris, Ph. 2001 Carbon nanotubes: synthesis, structure,
properties and applications. Springer.Dubay, O. & Kresse, G. 2003 Phys. Rev. B67, 035401.Dubay, O., Kresse, G. & Kuzmany, H. 2002 Phys. Rev. Lett. 88, 235506.Duesberg, G. S., Loa, I., Burghard, M., Syassen, K. & Roth, S. 2000 Phys. Rev. Lett. 85,
5436–5439.Fantini, C. (and 10 others) 2004 Phys. Rev. Lett. 93, 087401.Gruneis, A., Saito, R., Kimura, T., Cancado, L. G., Pimenta, M. A., Jorio, A., Souza Filho,
A. G., Dresselhaus, G. & Dresselhaus, M. S. 2002 Phys. Rev. B65, 155405.Hwang, J. et al . 2000 Phys. Rev. B62, R13301.Iijima, S. 1991 Nature 354, 56–58.Iijima, S. & Ichihashi, T. 1993 Nature 363, 603.Jiang, C., Kempa, K., Zhao, J., Schlecht, U., Kolb, U., Basche, T., Burghard, M. & Mews, A.
2002 Phys. Rev. B66, 161404.Jishi, R. A., Venkataraman, L., Dresselhaus, M. S. & Dresselhaus, G.1993 Chem. Phys. Lett.
209, 77–82.Jorio, A., Dresselhaus, G., Dresselhaus, M. S., Souza, M., Dantas, M. S. S., Pimenta, M. A.,
Rao, A. M., Saito, R., Liu, C. & Cheng, H. M. 2000 Phys. Rev. Lett. 85, 2617–2620.Jorio, A., Saito, R., Hafner, J. H., Lieber, C. M., Hunter, M., T. McClure, Dresselhaus, G. &
Dresselhaus, M. S., 2001a Phys. Rev. Lett. 86, 1118–1121.Jorio, A., Souza Filho, A. G., Dresselhaus, G., Dresselhaus, M. S., Saito, R., Hafner, J. H.,
Lieber, C. M., Matinaga, F. M., Dantas, M. S. S. & Pimenta, M. A. 2001b Phys. Rev. B63,245416.
Jorio, A. (and 12 others) 2002a Phys. Rev. B66, 115411.Jorio, A. (and 11 others) 2002b Phys. Rev. B65, R121402.Jorio, A. (and 11 others) 2002c Chem. Phys. Lett. 351, 27–34.Jorio, A. (and 10 others) 2002d Phys. Rev. B65, 155412.Jorio, A. et al . 2002e Brazil. J. Phys. 32, 921–924.Jorio, A., Samsonidze, Ge. G., Dresselhaus, G., Pimenta, M. A., Dresselhaus, M. S., Swan, A. K.,
Unlu, M. S., Goldberg, B. B. & Saito, R. 2003 Phys. Rev. Lett. 90, 107403.Journet, C., Maser, W. K., Bernier, P., Loiseau, A., Lamy de la Chapelle, M., Lefrant, S.,
Deniard, P., Lee, R.& Fischer, J. E.1997 Nature 388, 756–758.Kataura, H. (and 11 others) 1999 Synth. Metals 103, 2555.Kim, P., Shi, L., Majumdar, A. & McEuen, P. L. 2001 Phys. Rev. Lett. 87, 215502.Kurti, J. et al . 2004 Carbon 42, 971–978.Kuzmany, H., Plank, W., Hulman, M., Kramberger, Ch., Gruneis, A., Pichler, Th., Peterlik, H.,
Kataura, H. & Achiba, Y. 2001 Eur. Phys. J. B22, 307–320.Marinopoulos, A. G., Reining, L., Rubio, A. & Vast, N. 2003 Phys. Rev. Lett. 91, 046402.Martin, R. M. & Falicov, L. M. 1983 Light Scattering in Solids. I (ed. M. Cardona). Topics in
Applied Physics, vol. 8, ch. 3, pp. 70–145. Springer.Maultzsch, J., Reich, S. & Thomsen, C. 2002 Phys. Rev. B65, 233402.Milnera, M., Kurti, J., Hulman, M. & Kuzmany, H. 2000 Phys. Rev. Lett. 84, 1324–1327.Pimenta, M. A., Marucci, A., Empedocles, S., Bawendi, M., Hanlon, E. B., Rao, A. M., Eklund,
P. C., Smalley, R. E., Dresselhaus, G. & Dresselhaus, M. S. 1998 Phys. Rev. B58, R16016–R16019.
Pimenta, M. A., Hanlon, E. B., Marucci, A., Corio, P., Brown, S. D. M., Empedocles, S. A.,Bawendi, M. G., Dresselhaus, G. & Dresselhaus, M. S. 2000 Brazil. J. Phys. 30, 423–427.
Rao, A. M., Eklund, P. C., Bandow, S., Thess, A. & Smalley, R. E. 1997a Science 275, 187–191.Rao, A. M. (and 12 others) 1997b Nature 388, 257–259.
Phil. Trans. R. Soc. Lond. A (2004)
on July 15, 2011rsta.royalsocietypublishing.orgDownloaded from

2336 A. Jorio and others
Rao, A. M. et al . 2000 Phys. Rev. Lett. 84, 1820–1823.Saito, R., Dresselhaus, G. & Dresselhaus, M. S. 1998 Physical properties of single wall carbon
nanotubes. London: Imperial College Press.Saito, R., Jorio, A., Hafner, J. H., Lieber, C. M., Hunter, M., McClure, T., Dresselhaus, G. &
Dresselhaus, M. S. 2001 Phys. Rev. B64, 085312.Saito, R., Jorio, A., Souza Filho, A. G., Dresselhaus, G., Dresselhaus, M. S. & Pimenta, M. A.
2002 Phys. Rev. Lett. 88, 027401.Samsonidze, Ge. G., Saito, R., Jorio, A., Pimenta, M. A., Souza Filho, A. G., Gruneis, A.,
Dresselhaus, G. & Dresselhaus, M. S. 2003a J. Nanosci. Nanotechnol. 3(6), 431–458.Samsonidze, Ge. G., Saito, R., Jorio, A., Souza Filho, A. G., Gruneis, A., Pimenta, M. A.,
Dresselhaus, G. & Dresselhaus, M. S. 2003b Phys. Rev. Lett. 90, 027403.Small, J. P., Shi, L. & Kim, P. 2003 Solid State Commun. 127, 181–186.Souza, M. et al . 2003 Phys. Rev. B69, 241403.Souza Filho, A. G., Jorio, A., Hafner, J. H., Lieber, C. M., Saito, R., Pimenta, M. A., Dresselhaus,
G. & Dresselhaus, M. S. 2001 Phys. Rev. B63, 241404R.Souza Filho, A. G. (and 11 others) 2002a Chem. Phys. Lett. 354, 62–68.Souza Filho, A. G. (and 10 others) 2002b Phys. Rev. B65, 085417.Souza Filho, A. G., Jorio, A., Samsonidze, Ge. G., Dresselhaus, G., Pimenta, M. A., Dresselhaus,
M. S., Swan, A. K., Unlu, M. S., Goldberg, B. B. & Saito, R. 2003 Phys. Rev. B67, 035427.Souza Filho, A. G. et al . 2004 Phys. Rev. B69, 115428.Sun, H. D. et al . 1999 Solid State Commun. 109, 365–369.Thomsen, C. & Reich, S. 2000 Phys. Rev. Lett. 85, 5214.Thomsen, C., Reich, S. & Maultzsch, J. 2004 Phil. Trans. R. Soc. Lond. A362, 2337–2359.Tohji, K. (and 11 others) 1996 Nature 383, 679.Wang, N., Tang, Z. K., Li, G. D. & Che, J. S. 2000 Nature 408, 50.Zhao, Y., Yakobson, B. I. & Smalley, R. E. 2002 Phys. Rev. Lett. 88, 185501.Zolyomi, V., Kurti, J., Gruneis, A. & Kuzmany, H. 2003 Phys. Rev. Lett. 90, 157401.
Phil. Trans. R. Soc. Lond. A (2004)
on July 15, 2011rsta.royalsocietypublishing.orgDownloaded from
Related Documents