Analytical Methods Determination of lipid and protein hydroperoxides using the fluorescent probe diphenyl-1-pyrenylphosphine Ricard Bou a,b, * , Bingcan Chen a , Francesc Guardiola b , Rafael Codony b , Eric A. Decker a a University of Massachusetts, Department of Food Science, Amherst, MA, USA b University of Barcelona, Nutrition and Food Science Department, XaRTA-INSA, Barcelona, Spain article info Article history: Received 2 September 2009 Received in revised form 25 January 2010 Accepted 1 May 2010 Keywords: Protein hydroperoxide Lipid hydroperoxide Diphenyl-1-pyrenylphosphine DPPP Method validation abstract By means of two alternative methods lipid and protein hydroperoxides (HP) were determined by fluo- rometry using the diphenyl-1-pyrenylphosphine (DPPP) probe. It has been shown that the formation of the fluorescence was influenced by the type of solvent and HP whereas the presence in the media of antioxidants such tocopherol and butylated hydroxytoluene had no effect. The combination of the chloroform:methanol (2:1, v/v) solvent mixture that is widely used for lipid extraction was combined with suitable solvents to develop a method with the maximum performance in determining HP in lipid extracts. Using a variety of lipids and lipid extracts, the final method proposed agreed well with the thio- cyanate method for HP determination. In addition, the DPPP method was very sensitive, precise, accurate, free of interferences and specific for the determination of lipid soluble HP. DPPP can be also used to mea- sure HP soluble in hydroalcoholic media. This alternative procedure showed a similar performance to its lipid soluble equivalent and was able to measure hydrogen peroxide promoted peroxidation of bovine serum albumin and water soluble HP in protein extracts. With the addition of triphenylphosphine the hydroalcoholic method is specific for the determination of protein HP. Ó 2010 Elsevier Ltd. All rights reserved. 1. Introduction Organic hydroperoxides (HP) are oxidative mediators and prod- ucts of peroxidation chain reactions produced by free radicals and enzymes such as lipoxygenase. They can be originated from the oxidation of unsaturated fatty acids and other lipid classes (Gutter- idge, 1995) but also from proteins and amino acids (Gebicki, 1997; Gebicki & Gebicki, 1999). Lipid HP are odourless but their formation and breakdown in foods lead to loss of nutrients with compounds with negative bio- logical effects and off-flavours also being formed (Diplock et al., 1998; Esterbauer, Schaur, & Zollner, 1991; Nawar, 1996). There- fore, the food industry is interested in both inhibiting peroxidation and determining their concentration which gives an indication of the oxidative status, especially in a relatively non-oxidised prod- uct. In biological matrices, HP measurement, in connection with free radicals and other reactive oxygen species, has been used as indication of oxidative stress (Halliwell & Chirico, 1993; Mehrotra, Ling, Bekele, Gerbino, & Earle, 2001; Sivaram, Suresh, & Indira, 2003) which is associated with various diseases (Casetta, Govoni, & Granieri, 2005; Castro & Freeman, 2001; Esterbauer, Wag, & Puhl, 1993; Finkel, 1998) and ageing (Holbrook & Ikeyama, 2002; Stadtman & Berlett, 1997). Until recently, proteins were not held to be biologically signifi- cant targets for reactive oxygen species but research has shown that protein form HP and can be responsible of DNA cross-linking (Gebicki & Gebicki, 1999). Mildly oxidised proteins are readily de- graded and removed from the cell but when proteins are highly oxidised they aggregate and/or their solubility decreases which makes their elimination difficult (Cecarini et al., 2007; Grune, Merker, Sandig, & Davies, 2003). These highly oxidised proteins may contribute to several neurodegenerative diseases such as Alzheimer and may be involved in the ageing process (Grune et al., 2003; Stadtman, 2006; Widmer, Ziaja, & Grune, 2006). There- fore, highly oxidised proteins and protein HP can be useful markers of oxidative stress but there is a lack of simple and sensitive methods to determine these compounds. Although various methods have been proposed to measure HP, the instability and diversity of HP in complex foods or biological matrices make it difficult to conduct accurate, sensitive and simple analysis. Chromatographic (GC and HPLC) and spectroscopic (NMR and ESR) methods showed high sensitivity, selectivity and repro- ducibility (Dobarganes & Velasco, 2002; Frankel, Neff, & Weisleder, 1990; Hughes, Smith, Horning, & Mitchell, 1983; Yamamoto, 1994; Yang et al., 1991) but not all laboratories have the necessary instru- mentation so their application to routine analysis is compromised. 0308-8146/$ - see front matter Ó 2010 Elsevier Ltd. All rights reserved. doi:10.1016/j.foodchem.2010.05.003 * Corresponding author at: University of Barcelona, Nutrition and Food Science Department, XaRTA-INSA, Barcelona, Spain. E-mail address: [email protected] (R. Bou). Food Chemistry 123 (2010) 892–900 Contents lists available at ScienceDirect Food Chemistry journal homepage: www.elsevier.com/locate/foodchem

Welcome message from author
This document is posted to help you gain knowledge. Please leave a comment to let me know what you think about it! Share it to your friends and learn new things together.
Transcript
Food Chemistry 123 (2010) 892–900
Contents lists available at ScienceDirect
Food Chemistry
journal homepage: www.elsevier .com/locate / foodchem
Analytical Methods
Determination of lipid and protein hydroperoxides using the fluorescent probediphenyl-1-pyrenylphosphine
Ricard Bou a,b,*, Bingcan Chen a, Francesc Guardiola b, Rafael Codony b, Eric A. Decker a
a University of Massachusetts, Department of Food Science, Amherst, MA, USAb University of Barcelona, Nutrition and Food Science Department, XaRTA-INSA, Barcelona, Spain
a r t i c l e i n f o
Article history:Received 2 September 2009Received in revised form 25 January 2010Accepted 1 May 2010
Keywords:Protein hydroperoxideLipid hydroperoxideDiphenyl-1-pyrenylphosphineDPPPMethod validation
0308-8146/$ - see front matter � 2010 Elsevier Ltd. Adoi:10.1016/j.foodchem.2010.05.003
* Corresponding author at: University of BarcelonaDepartment, XaRTA-INSA, Barcelona, Spain.
E-mail address: [email protected] (R. Bou).
a b s t r a c t
By means of two alternative methods lipid and protein hydroperoxides (HP) were determined by fluo-rometry using the diphenyl-1-pyrenylphosphine (DPPP) probe. It has been shown that the formationof the fluorescence was influenced by the type of solvent and HP whereas the presence in the mediaof antioxidants such tocopherol and butylated hydroxytoluene had no effect. The combination of thechloroform:methanol (2:1, v/v) solvent mixture that is widely used for lipid extraction was combinedwith suitable solvents to develop a method with the maximum performance in determining HP in lipidextracts. Using a variety of lipids and lipid extracts, the final method proposed agreed well with the thio-cyanate method for HP determination. In addition, the DPPP method was very sensitive, precise, accurate,free of interferences and specific for the determination of lipid soluble HP. DPPP can be also used to mea-sure HP soluble in hydroalcoholic media. This alternative procedure showed a similar performance to itslipid soluble equivalent and was able to measure hydrogen peroxide promoted peroxidation of bovineserum albumin and water soluble HP in protein extracts. With the addition of triphenylphosphine thehydroalcoholic method is specific for the determination of protein HP.
� 2010 Elsevier Ltd. All rights reserved.
1. Introduction
Organic hydroperoxides (HP) are oxidative mediators and prod-ucts of peroxidation chain reactions produced by free radicals andenzymes such as lipoxygenase. They can be originated from theoxidation of unsaturated fatty acids and other lipid classes (Gutter-idge, 1995) but also from proteins and amino acids (Gebicki, 1997;Gebicki & Gebicki, 1999).
Lipid HP are odourless but their formation and breakdown infoods lead to loss of nutrients with compounds with negative bio-logical effects and off-flavours also being formed (Diplock et al.,1998; Esterbauer, Schaur, & Zollner, 1991; Nawar, 1996). There-fore, the food industry is interested in both inhibiting peroxidationand determining their concentration which gives an indication ofthe oxidative status, especially in a relatively non-oxidised prod-uct. In biological matrices, HP measurement, in connection withfree radicals and other reactive oxygen species, has been used asindication of oxidative stress (Halliwell & Chirico, 1993; Mehrotra,Ling, Bekele, Gerbino, & Earle, 2001; Sivaram, Suresh, & Indira,2003) which is associated with various diseases (Casetta, Govoni,& Granieri, 2005; Castro & Freeman, 2001; Esterbauer, Wag, & Puhl,
ll rights reserved.
, Nutrition and Food Science
1993; Finkel, 1998) and ageing (Holbrook & Ikeyama, 2002;Stadtman & Berlett, 1997).
Until recently, proteins were not held to be biologically signifi-cant targets for reactive oxygen species but research has shownthat protein form HP and can be responsible of DNA cross-linking(Gebicki & Gebicki, 1999). Mildly oxidised proteins are readily de-graded and removed from the cell but when proteins are highlyoxidised they aggregate and/or their solubility decreases whichmakes their elimination difficult (Cecarini et al., 2007; Grune,Merker, Sandig, & Davies, 2003). These highly oxidised proteinsmay contribute to several neurodegenerative diseases such asAlzheimer and may be involved in the ageing process (Gruneet al., 2003; Stadtman, 2006; Widmer, Ziaja, & Grune, 2006). There-fore, highly oxidised proteins and protein HP can be useful markersof oxidative stress but there is a lack of simple and sensitivemethods to determine these compounds.
Although various methods have been proposed to measure HP,the instability and diversity of HP in complex foods or biologicalmatrices make it difficult to conduct accurate, sensitive and simpleanalysis. Chromatographic (GC and HPLC) and spectroscopic (NMRand ESR) methods showed high sensitivity, selectivity and repro-ducibility (Dobarganes & Velasco, 2002; Frankel, Neff, & Weisleder,1990; Hughes, Smith, Horning, & Mitchell, 1983; Yamamoto, 1994;Yang et al., 1991) but not all laboratories have the necessary instru-mentation so their application to routine analysis is compromised.
R. Bou et al. / Food Chemistry 123 (2010) 892–900 893
More simple methods such as the widely accepted iodometric titra-tion methods have inherent problems such as sensitivity, selectiv-ity, and interference with contaminants and oxygen (Jessup,Dean, & Gebicki, 1994). The quantitative determination of HP byUV light absorption, normally at 232 nm, is based on the presenceof HP on fatty acids with double bonds in a conjugated diene config-uration. The major disadvantage of this method is that there can befatty acid HP without a conjugated diene structure (e.g. HP on oleicacid) and conjugated dienes resulting from lipid oxidation that donot contain HP (e.g. 2,4-decadienal) (Dobarganes & Velasco, 2002).
Other methods based on the formation of iron complexes afterreaction with the oxidising HP (thiocyanate and ferrous-oxidation-xylenol orange) were also proposed for their simplicity and im-proved sensitivity (Bou, Codony, Tres, Decker, & Guardiola, 2008;Dobarganes & Velasco, 2002; Nielsen, Timm-Heinrich, & Jacobsen,2003; Shantha & Decker, 1994). However, these procedures aresubjected to some possible interference caused by the presenceof chelators, sources of iron or pigments which are common infoods and biological samples (Bou, Codony, et al., 2008). Finally,the measurement of total HP includes hydrogen peroxide, lipidand protein HP. Therefore, the correlations with food quality andbiochemical pathways should take into account this fact or addressthis issue during analysis.
The fluorimetric determination of lipid hydroperoxides by meansof the fluorescent probe diphenyl-1-pyrenylphosphine (DPPP) hasbeen reported to be accurate and very sensitive in foodstuffs andbiological materials using flow injection and HPLC post-columnmethods (Akasaka & Ohrui, 2000; Akasaka, Takamura, Ohrui,Meguro, & Hashimoto, 1996; Sohn, Taki, Ushio, & Ohshima, 2005).According to these latter authors, the phosphine moiety of the DPPPreacts with various HP producing a high intensity fluorescent DPPPoxide which is normally measured at 380 nm (excitation at 352 nm).
The aim of this work was to study and exploit DPPP’s capabili-ties in terms of sensitivity, selectivity and lack of interference todetermine the total content of lipid and protein HP. As for this,we developed two simple batch methods using that fluorescentprobe for the specific determination of these two types of HP pres-ent in different food and biological samples.
2. Material and methods
2.1. Chemicals and standards
Diphenyl-1-pyrenylphosphine (DPPP) and 13(S)-hydroperoxide9,11-octadecadienoic acid (HPODE) were from Cayman ChemicalCo. (Ann Arbor, MI). Butylated hydroxytoluene (BHT), 30% hydro-gen peroxide, tert-butyl hydroperoxide (TBHP), cumene hydroper-oxide (CHP), tert-butylhydroquinone (TBHQ), 2,20-azobis(2-methylpropionamidine) dihydrochloride (AAPH), triphenylphos-phine (TPP) and bovine serum albumin (BSA) were from Sigma–Al-drich Co. (St. Louis, MO). Mixed tocopherols concentrate (Covi-ox�
T-70) was from Cognis (Monheim, Germany). Solvents (HPLCgrade) were from Fisher-Scientific (Pittsburgh, PA) and did not con-tain antioxidant or stabilising agents. The other chemicals usedwere of ACS grade and double-deionised water was used through-out. The purity of the HPODE was always checked before use bymeans of its molar extinction coefficient at 234 nm(k234 = 25.6 M�1 cm�1).
2.2. Influence of the reaction time for different HP and stability of theresulting DPPP oxide
To study the influence of the reaction time we added 200 lL ofmethanol containing different amounts of HP (ranging from 10 lMto 15 lM) and mixed with 100 lL of methanol containing 200 lM
of DPPP. Samples and blanks were incubated at 60 �C under sub-dued light conditions in a water bath for different periods andcooled at 4 �C for 10 min, 20 min, 40 min, 60 min and 120 min inthe darkness to stop the reaction. Under these conditions the fluo-rescence intensity of the formed DPPP oxide was maintained until60–120 min of storage. For convenience, samples were hereafterstored for 20 min at 4 �C in the darkness to stop the reaction. Sub-sequently, methanol was added up to 9 mL, vortexed and an ali-quot was then diluted five times and immediately read.
2.3. Influence of solvents
To study the influence of the solvents we added 200 lL of differ-ent solvents (methanol, butanol, hexane and chloroform) contain-ing HP standards (CHP, TBHP, H2O2 and HPODE) at the sameconcentration and were mixed with 100 lL of the same solventeach containing 200 lM of DPPP. Because of its solubility, H2O2
was only dissolved in methanol and butanol. Samples and blankswere incubated for different periods at 60 �C under subdued lightconditions in a water bath and then cooled at 4 �C for 20 min inthe dark. Later on, the same solvent for each HP was added up to9 mL, vortexed and an aliquot was then diluted five times and fluo-rescence was immediately determined.
In addition, 200 lL of 100% methanol, 1:2 (v/v) chloro-form:methanol, 1:1 (v/v) chloroform:methanol, 2:1 (v/v) chloro-form:methanol, or 100% chloroform containing 15 lM of CHPwas mixed with 100 lL of either methanol or 1-butanol (hereafterreferred simply as butanol) each containing 200 lM of DPPP. Sam-ples and blanks were incubated for 3 h at 60 �C under subduedlight conditions in a water bath and then cooled at 4 �C for20 min in the dark. Afterwards, more methanol or butanol,depending on the previous solvent used to add DPPP, was addedup to 9 mL, vortexed and an aliquot was then diluted five timesand fluorescence was immediately determined.
2.4. Influence of antioxidants
A chloroform:methanol (2:1, v/v; 200 lL) solvent mixture solu-tion containing 15 lM of CHP plus an antioxidant (BHT, TBHQ andtocopherol mix) either at 3 mM, 1.5 mM or 0.75 mM was mixedwith 100 lL of butanol containing 130 lM of DPPP. Samples andblanks were incubated for 3 h at 60 �C under subdued light condi-tions in a water bath and then cooled for 20 min at 4 �C in the dark.Then, up to 9 mL of butanol was added, vortexed and a 2/3 dilutionwas made and fluorescence was immediately determined.
2.5. Final procedure for lipid HP
Varying lipid samples were weighed and dissolved in the chlo-roform:methanol (2:1, v/v) solvent mixture solution containing2 mM BHT. Hereafter aliquots of these solutions are referred assample volumes. Sample volumes of either 200 lL or 100 lL canbe indistinctly used but a higher sensitivity was achieved whenvolumes of 100 lL were used. Results presented here were doneby mixing this latter sample volume which was mixed with100 lL of DPPP solution (130 lM DPPP dissolved in butanol con-taining 2 mM BHT). Those latter volumes were dispensed with po-sitive-displacement pipettes. Then samples and blanks wereincubated for 3 h at 60 �C under subdued light conditions. Subse-quently, they were cooled by placing the reacted samples at 4 �Cfor 20 min in the darkness. Then, 9 mL of butanol was added, vor-texed and a 2/3 dilution was made with butanol and fluorescencewas immediately determined.
894 R. Bou et al. / Food Chemistry 123 (2010) 892–900
2.6. Final procedure for hydrosoluble HP
Protein samples were dissolved in Tris–HCl (50 mM, pH 8) con-taining 0.1% EDTA and 0.5 M guanidine HCl. Hereafter aliquots ofthis solution are referred as sample volumes. Sample volumes(200 lL) were mixed with 150 lL of methanol containing 2 mMBHT and 100 lL of butanol containing 2 mM BHT and 130 lM ofDPPP. Butanol was dispensed with a positive-displacement pipette.Samples and blanks were incubated for 5 h at 60 �C under subduedlight conditions. However, the time course assay done for peroxi-dised bovine serum albumin (BSA), pork muscle microsomes andcooked beef meat extract samples that were incubated for differentperiods of time together with their respective blanks. Subse-quently, samples were cooled by placing them in the fridge for20 min at 4 �C in the darkness. Then, 9 mL of methanol were addedto the samples and vortexed. Samples were centrifuged for 5 minat 1750g and from an aliquot of the supernatant a 2/3 dilutionwas made with methanol and fluorescence was immediatelydetermined.
2.7. Linearity and calibration
Linearity was studied by means of calibration curves made withdifferent amounts of standards on different days. Calibrationcurves made with hydrogen peroxide, TBHP and HPODE were al-ways compared with a calibration curve made with CHP carriedout the same day under the same conditions.
2.8. Measurement procedure
After reactions with the DPPP fluorescent probe, diluted sam-ples were added in quartz cuvette cells. In our conditions, the max-imum excitation and emission wavelengths were 352 nm and378 nm, respectively, which are slightly different from those re-ported previously (Akasaka & Ohrui, 2000). For 30 s the fluores-cence of the DPPP oxide was continuously measured (everysecond) using a fluorometer (Photon Technology Intl. Inc., Birming-ham, NJ) in which the cuvette holder was equilibrated at 20 �C.During that period of time, fluorescence was proved to be stable.The reading after 30 s was taken for calculations. In addition,freshly diluted samples showed no differences with those kept inthe darkness after 1 h of cold storage. The slits of the fluorometerwere set at 1.1 nm.
2.9. Tested samples
Mayonnaise, butter, olive oil, virgin olive oil, extra virgin oliveoil, two fish oils from fish oil capsules, two sunflower oils, cornoil and soybean oil were used as samples for the determinationof lipid HP. These samples were obtained in retail markets.
The lipid fraction of mayonnaise was extracted as follows:500 mg of samples were dissolved in 10 mL of chloroform:metha-nol (2:1, v/v) containing 2 mM BHT and stirred for 30 min. Sampleswere then centrifuged 5 min at 1750g and 4 mL of the extractswere mixed with 20 mL of 0.9% NaCl aqueous solution. This mix-ture was vortexed and centrifuged 10 min at 1750g and the lowerchloroform phase was used as lipid sample extract. Butter wasclarified by heating the butter at 45 �C and then centrifuging byat 1750g for 5 min. Oil from mayonnaise, butter and the othersources (sunflower, corn, olive, fish and soybean) were diluted upto the appropriate concentration using chloroform:methanol (2:1,v/v) containing 2 mM BHT.
Peroxidised BSA, pork muscle microsomes and cooked beefmeat extract were used as samples for the determination of aque-ous soluble HP.
To obtain the peroxidised BSA, a 3% standard protein solutiondissolved in 50 mM Tris–HCl, pH 8, containing 0.1% ethylenedi-aminetetraacetic acid (EDTA) was added to the same volume of90 mM AAPH and incubated at 37 �C for 11 h in a water bath. Then,a 10 mL aliquot of the reaction mixture was stopped by taking outof the bath and adding 1 mL of 0.6 mM trolox solution. Immedi-ately after, 4 mL 37.5% trichloroacetic acid (TCA) was added andsamples were centrifuged for 20 min at 1750g. The supernatantwas discarded to obtain a protein pellet. To this pellet, 10 mL ofa solution containing Tris–HCl buffer solution containing 10%TCA, 500 lM trolox and 0.05% EDTA was added, vortexed, centri-fuged as before, and afterwards the supernatant was discarded.This latter step was repeated once more and the remaining pelletwas finally resuspended by adding Tris–HCl buffer containing0.5 M guanidine hydrochloride.
Pork muscle microsomes were obtained as described elsewhere(Bou et al., 2008) whereas organic ground beef meat bought in a lo-cal market was cooked for 35 min at 75 �C and then stored for 4 hat 4 �C to promote oxidation. Then, 1 g of muscle was mixed with5 mL of 20 mM phosphate buffer, pH 7.0. The extract was thenhomogenised with a tissue homogeniser for 30 s (2000 rpm; Tek-mar, Cincinnati, OH) and centrifuged for 5 min at 3500g (SorvallRC-6 Plus, DuPont, Wilmington, DE) to eliminate myofibrillarproteins.
The protein fraction from microsomes and cooked beef extractwas obtained according to the method proposed by Gay and Geb-icki (2003) with some modifications. To a 500 lL of each sample,500 lL 20% TCA were added and then centrifuged for 20 min at1750g. The supernatant was discarded and the remaining pelletwas resuspended by adding 1.1 mL Tris–HCl buffer containing0.5 M guanidine hydrochloride. Then, 1.1 mL of chloroform con-taining 4 mM BHT was added and mixed carefully. After phase sep-aration, 800 lL of the aqueous phase were taken and washed againwith the latter chloroform solution. Finally, 700 lL of the aqueousphase were taken as samples for protein HP determination. Whenaqueous soluble of HP were determined results were expressed inrelation to its protein content measured by means of the Lowrymethod (Lowry, Rosebrough, Farr, & Randall, 1951).
2.10. Specificity of the proposed procedures
Likewise with DPPP, TPP also reduces a variety of HP to theircorresponding alcohols while it is being converted to TPP oxide(Bou, Codony, et al., 2008). Because TPP has no effect on hydrogenperoxide, the specificity in each procedure can be checked to dis-criminate hydrogen peroxide from other HP. As for the procedurefor lipid HP, 50 lL of the sample dissolved in the chloroform:meth-anol (2:1, v/v) solvent mixture solution were mixed with 50 lL ofthe same solvent mixture while the final volume contains 2 mMBHT plus 2 mM TPP.
The specificity of the procedure for hydrosoluble HP waschecked by adding 150 lL of methanol containing 2 mM BHT plus2 mM TPP to the 200 lL of aqueous sample.
Once samples were allowed to react for 45 min at 4 �C, their,respectively, proposed procedures were followed.
2.11. Thiocyanate method
Lipid extract (200 lL) dissolved in butanol were mixed with2.8 mL of methanol:butanol (2:1, v/v). Blanks and samples werevortexed and mixed with 30 lL of a solution containing 2 Mammonium thiocyanate and 72 mM ferrous ion (prepared by add-ing equal amounts of 0.132 M BaCl2 and 0.144 M FeSO4). Sampleswere immediately vortexed, and the absorbance was determinedafter 30 min at 510 nm. Results were expressed as microequiva-
R. Bou et al. / Food Chemistry 123 (2010) 892–900 895
lents of CHP/kg of lipid extract and were calculated by means of astandard calibration curve prepared from CHP.
2.12. Tryptophan residues
BSA (1 mL, 3%) was mixed with 9 mL of 0.2 M Tris–HCl buffer,pH 6.8, containing 8 M urea, 2% SDS, and 10 mM EDTA. An aliquotwas taken to measure tryptophan residues by measuring the fluo-rescence (excitation = 280 nm, emission = 331 nm) on a Hitachi F-2000 fluorometer (Tokyo, Japan) with the cell temperature main-tained at 37 �C (Hazell & Stocker, 1993).
2.13. Statistical analysis
One-way ANOVAs were carried out to study whether differ-ences existed between combinations of solvents on fluorescenceintensity but also to study whether differences existed betweenincubation times on fluorescence intensity. In all cases, means thathad a significant effect were separated by Scheffe’s test, consider-ing P 6 0.05 as significant. Linear regression analyses were carriedout for the calibration curves. Regression analysis was also used tocheck the method performance by comparing the lipid hydroper-oxide contents measured by the thiocyanate method and those ofthe proposed method for the lipid hydroperoxides.
3. Results and discussion
3.1. Method set up and optimisation
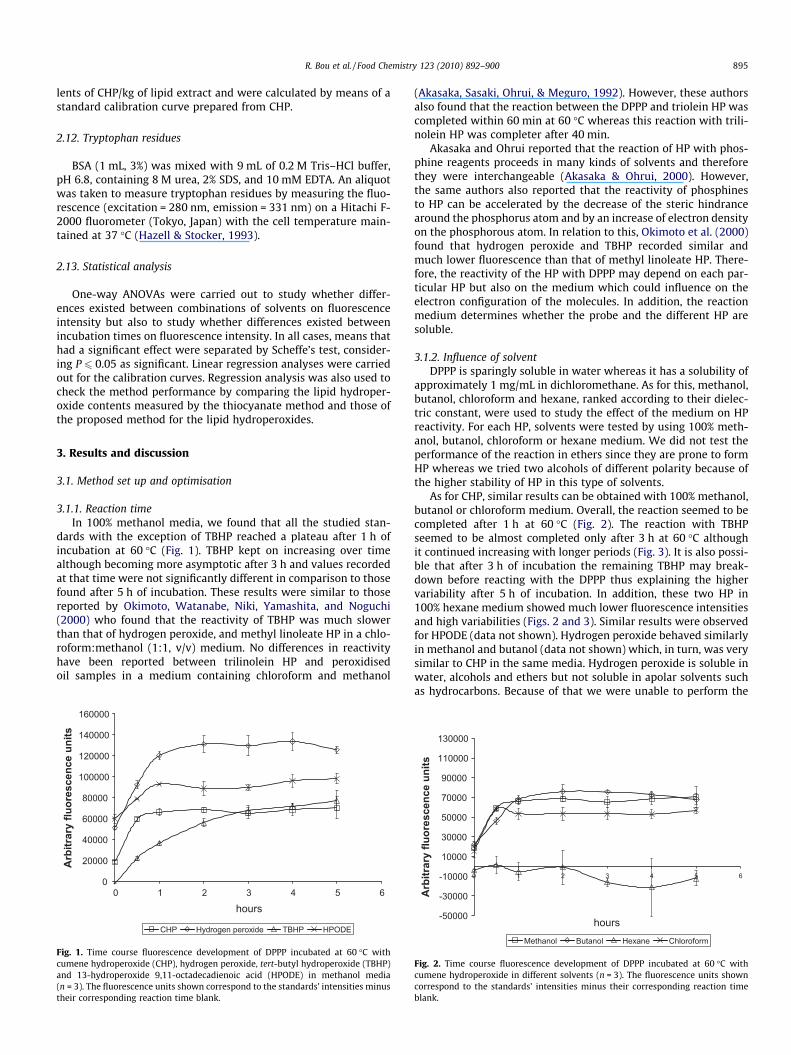
3.1.1. Reaction timeIn 100% methanol media, we found that all the studied stan-
dards with the exception of TBHP reached a plateau after 1 h ofincubation at 60 �C (Fig. 1). TBHP kept on increasing over timealthough becoming more asymptotic after 3 h and values recordedat that time were not significantly different in comparison to thosefound after 5 h of incubation. These results were similar to thosereported by Okimoto, Watanabe, Niki, Yamashita, and Noguchi(2000) who found that the reactivity of TBHP was much slowerthan that of hydrogen peroxide, and methyl linoleate HP in a chlo-roform:methanol (1:1, v/v) medium. No differences in reactivityhave been reported between trilinolein HP and peroxidisedoil samples in a medium containing chloroform and methanol
0
20000
40000
60000
80000
100000
120000
140000
160000
0 1 2 3 4 5 6
hours
Arb
itrar
y flu
ores
cenc
e un
its
CHP Hydrogen peroxide TBHP HPODE
Fig. 1. Time course fluorescence development of DPPP incubated at 60 �C withcumene hydroperoxide (CHP), hydrogen peroxide, tert-butyl hydroperoxide (TBHP)and 13-hydroperoxide 9,11-octadecadienoic acid (HPODE) in methanol media(n = 3). The fluorescence units shown correspond to the standards’ intensities minustheir corresponding reaction time blank.
(Akasaka, Sasaki, Ohrui, & Meguro, 1992). However, these authorsalso found that the reaction between the DPPP and triolein HP wascompleted within 60 min at 60 �C whereas this reaction with trili-nolein HP was completer after 40 min.
Akasaka and Ohrui reported that the reaction of HP with phos-phine reagents proceeds in many kinds of solvents and thereforethey were interchangeable (Akasaka & Ohrui, 2000). However,the same authors also reported that the reactivity of phosphinesto HP can be accelerated by the decrease of the steric hindrancearound the phosphorus atom and by an increase of electron densityon the phosphorous atom. In relation to this, Okimoto et al. (2000)found that hydrogen peroxide and TBHP recorded similar andmuch lower fluorescence than that of methyl linoleate HP. There-fore, the reactivity of the HP with DPPP may depend on each par-ticular HP but also on the medium which could influence on theelectron configuration of the molecules. In addition, the reactionmedium determines whether the probe and the different HP aresoluble.
3.1.2. Influence of solventDPPP is sparingly soluble in water whereas it has a solubility of
approximately 1 mg/mL in dichloromethane. As for this, methanol,butanol, chloroform and hexane, ranked according to their dielec-tric constant, were used to study the effect of the medium on HPreactivity. For each HP, solvents were tested by using 100% meth-anol, butanol, chloroform or hexane medium. We did not test theperformance of the reaction in ethers since they are prone to formHP whereas we tried two alcohols of different polarity because ofthe higher stability of HP in this type of solvents.
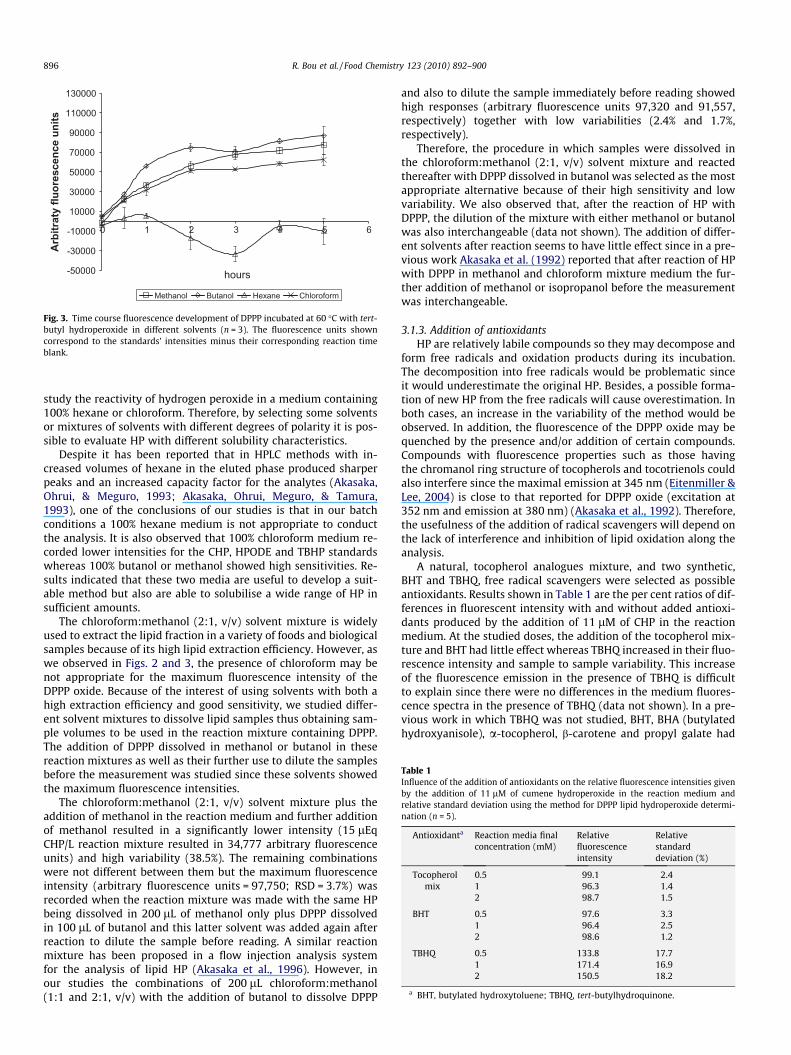
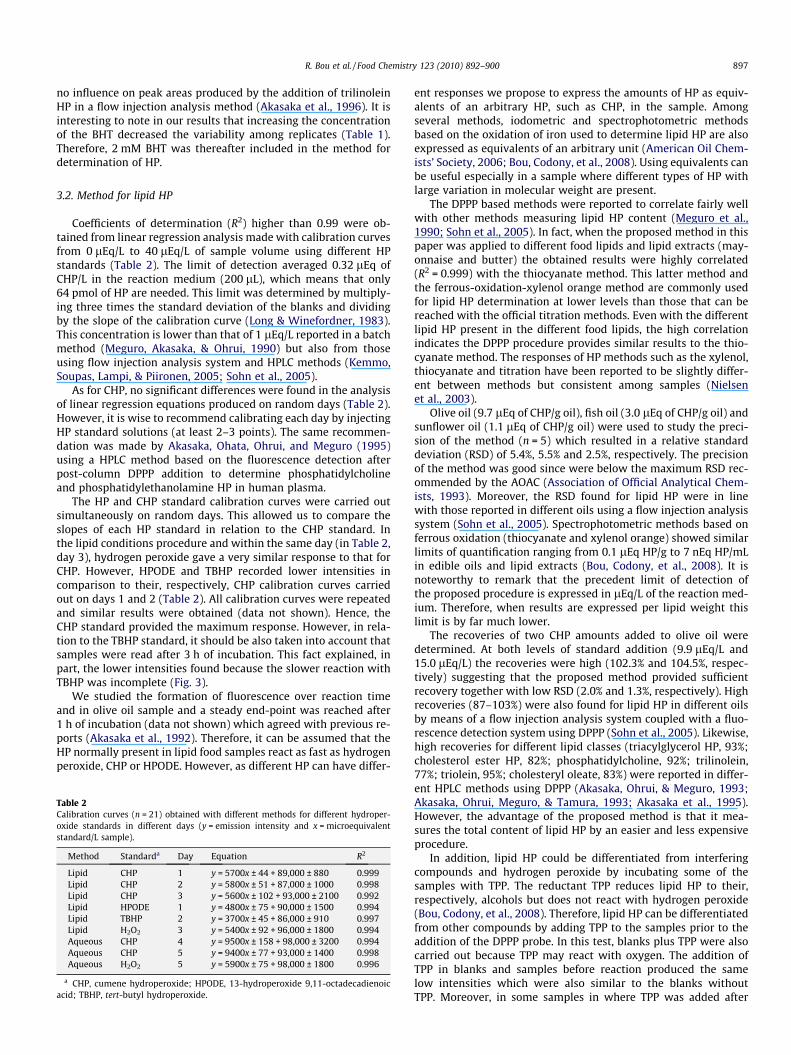
As for CHP, similar results can be obtained with 100% methanol,butanol or chloroform medium. Overall, the reaction seemed to becompleted after 1 h at 60 �C (Fig. 2). The reaction with TBHPseemed to be almost completed only after 3 h at 60 �C althoughit continued increasing with longer periods (Fig. 3). It is also possi-ble that after 3 h of incubation the remaining TBHP may break-down before reacting with the DPPP thus explaining the highervariability after 5 h of incubation. In addition, these two HP in100% hexane medium showed much lower fluorescence intensitiesand high variabilities (Figs. 2 and 3). Similar results were observedfor HPODE (data not shown). Hydrogen peroxide behaved similarlyin methanol and butanol (data not shown) which, in turn, was verysimilar to CHP in the same media. Hydrogen peroxide is soluble inwater, alcohols and ethers but not soluble in apolar solvents suchas hydrocarbons. Because of that we were unable to perform the
-50000
-30000
-10000
10000
30000
50000
70000
90000
110000
130000
0 1 2 3 4 5 6
hours
Arb
itrar
y flu
ores
cenc
e un
its
Methanol Butanol Hexane Chloroform
Fig. 2. Time course fluorescence development of DPPP incubated at 60 �C withcumene hydroperoxide in different solvents (n = 3). The fluorescence units showncorrespond to the standards’ intensities minus their corresponding reaction timeblank.
-50000
-30000
-10000
10000
30000
50000
70000
90000
110000
130000
0 1 2 3 4 5 6
hours
Arb
itrat
y flu
ores
cenc
e un
its
Methanol Butanol Hexane Chloroform
Fig. 3. Time course fluorescence development of DPPP incubated at 60 �C with tert-butyl hydroperoxide in different solvents (n = 3). The fluorescence units showncorrespond to the standards’ intensities minus their corresponding reaction timeblank.
Table 1Influence of the addition of antioxidants on the relative fluorescence intensities givenby the addition of 11 lM of cumene hydroperoxide in the reaction medium andrelative standard deviation using the method for DPPP lipid hydroperoxide determi-nation (n = 5).
Antioxidanta Reaction media finalconcentration (mM)
Relativefluorescenceintensity
Relativestandarddeviation (%)
Tocopherolmix
0.5 99.1 2.41 96.3 1.42 98.7 1.5
BHT 0.5 97.6 3.31 96.4 2.52 98.6 1.2
TBHQ 0.5 133.8 17.71 171.4 16.92 150.5 18.2
a BHT, butylated hydroxytoluene; TBHQ, tert-butylhydroquinone.
896 R. Bou et al. / Food Chemistry 123 (2010) 892–900
study the reactivity of hydrogen peroxide in a medium containing100% hexane or chloroform. Therefore, by selecting some solventsor mixtures of solvents with different degrees of polarity it is pos-sible to evaluate HP with different solubility characteristics.
Despite it has been reported that in HPLC methods with in-creased volumes of hexane in the eluted phase produced sharperpeaks and an increased capacity factor for the analytes (Akasaka,Ohrui, & Meguro, 1993; Akasaka, Ohrui, Meguro, & Tamura,1993), one of the conclusions of our studies is that in our batchconditions a 100% hexane medium is not appropriate to conductthe analysis. It is also observed that 100% chloroform medium re-corded lower intensities for the CHP, HPODE and TBHP standardswhereas 100% butanol or methanol showed high sensitivities. Re-sults indicated that these two media are useful to develop a suit-able method but also are able to solubilise a wide range of HP insufficient amounts.
The chloroform:methanol (2:1, v/v) solvent mixture is widelyused to extract the lipid fraction in a variety of foods and biologicalsamples because of its high lipid extraction efficiency. However, aswe observed in Figs. 2 and 3, the presence of chloroform may benot appropriate for the maximum fluorescence intensity of theDPPP oxide. Because of the interest of using solvents with both ahigh extraction efficiency and good sensitivity, we studied differ-ent solvent mixtures to dissolve lipid samples thus obtaining sam-ple volumes to be used in the reaction mixture containing DPPP.The addition of DPPP dissolved in methanol or butanol in thesereaction mixtures as well as their further use to dilute the samplesbefore the measurement was studied since these solvents showedthe maximum fluorescence intensities.
The chloroform:methanol (2:1, v/v) solvent mixture plus theaddition of methanol in the reaction medium and further additionof methanol resulted in a significantly lower intensity (15 lEqCHP/L reaction mixture resulted in 34,777 arbitrary fluorescenceunits) and high variability (38.5%). The remaining combinationswere not different between them but the maximum fluorescenceintensity (arbitrary fluorescence units = 97,750; RSD = 3.7%) wasrecorded when the reaction mixture was made with the same HPbeing dissolved in 200 lL of methanol only plus DPPP dissolvedin 100 lL of butanol and this latter solvent was added again afterreaction to dilute the sample before reading. A similar reactionmixture has been proposed in a flow injection analysis systemfor the analysis of lipid HP (Akasaka et al., 1996). However, inour studies the combinations of 200 lL chloroform:methanol(1:1 and 2:1, v/v) with the addition of butanol to dissolve DPPP
and also to dilute the sample immediately before reading showedhigh responses (arbitrary fluorescence units 97,320 and 91,557,respectively) together with low variabilities (2.4% and 1.7%,respectively).
Therefore, the procedure in which samples were dissolved inthe chloroform:methanol (2:1, v/v) solvent mixture and reactedthereafter with DPPP dissolved in butanol was selected as the mostappropriate alternative because of their high sensitivity and lowvariability. We also observed that, after the reaction of HP withDPPP, the dilution of the mixture with either methanol or butanolwas also interchangeable (data not shown). The addition of differ-ent solvents after reaction seems to have little effect since in a pre-vious work Akasaka et al. (1992) reported that after reaction of HPwith DPPP in methanol and chloroform mixture medium the fur-ther addition of methanol or isopropanol before the measurementwas interchangeable.
3.1.3. Addition of antioxidantsHP are relatively labile compounds so they may decompose and
form free radicals and oxidation products during its incubation.The decomposition into free radicals would be problematic sinceit would underestimate the original HP. Besides, a possible forma-tion of new HP from the free radicals will cause overestimation. Inboth cases, an increase in the variability of the method would beobserved. In addition, the fluorescence of the DPPP oxide may bequenched by the presence and/or addition of certain compounds.Compounds with fluorescence properties such as those havingthe chromanol ring structure of tocopherols and tocotrienols couldalso interfere since the maximal emission at 345 nm (Eitenmiller &Lee, 2004) is close to that reported for DPPP oxide (excitation at352 nm and emission at 380 nm) (Akasaka et al., 1992). Therefore,the usefulness of the addition of radical scavengers will depend onthe lack of interference and inhibition of lipid oxidation along theanalysis.
A natural, tocopherol analogues mixture, and two synthetic,BHT and TBHQ, free radical scavengers were selected as possibleantioxidants. Results shown in Table 1 are the per cent ratios of dif-ferences in fluorescent intensity with and without added antioxi-dants produced by the addition of 11 lM of CHP in the reactionmedium. At the studied doses, the addition of the tocopherol mix-ture and BHT had little effect whereas TBHQ increased in their fluo-rescence intensity and sample to sample variability. This increaseof the fluorescence emission in the presence of TBHQ is difficultto explain since there were no differences in the medium fluores-cence spectra in the presence of TBHQ (data not shown). In a pre-vious work in which TBHQ was not studied, BHT, BHA (butylatedhydroxyanisole), a-tocopherol, b-carotene and propyl galate had
R. Bou et al. / Food Chemistry 123 (2010) 892–900 897
no influence on peak areas produced by the addition of trilinoleinHP in a flow injection analysis method (Akasaka et al., 1996). It isinteresting to note in our results that increasing the concentrationof the BHT decreased the variability among replicates (Table 1).Therefore, 2 mM BHT was thereafter included in the method fordetermination of HP.
3.2. Method for lipid HP
Coefficients of determination (R2) higher than 0.99 were ob-tained from linear regression analysis made with calibration curvesfrom 0 lEq/L to 40 lEq/L of sample volume using different HPstandards (Table 2). The limit of detection averaged 0.32 lEq ofCHP/L in the reaction medium (200 lL), which means that only64 pmol of HP are needed. This limit was determined by multiply-ing three times the standard deviation of the blanks and dividingby the slope of the calibration curve (Long & Winefordner, 1983).This concentration is lower than that of 1 lEq/L reported in a batchmethod (Meguro, Akasaka, & Ohrui, 1990) but also from thoseusing flow injection analysis system and HPLC methods (Kemmo,Soupas, Lampi, & Piironen, 2005; Sohn et al., 2005).
As for CHP, no significant differences were found in the analysisof linear regression equations produced on random days (Table 2).However, it is wise to recommend calibrating each day by injectingHP standard solutions (at least 2–3 points). The same recommen-dation was made by Akasaka, Ohata, Ohrui, and Meguro (1995)using a HPLC method based on the fluorescence detection afterpost-column DPPP addition to determine phosphatidylcholineand phosphatidylethanolamine HP in human plasma.
The HP and CHP standard calibration curves were carried outsimultaneously on random days. This allowed us to compare theslopes of each HP standard in relation to the CHP standard. Inthe lipid conditions procedure and within the same day (in Table 2,day 3), hydrogen peroxide gave a very similar response to that forCHP. However, HPODE and TBHP recorded lower intensities incomparison to their, respectively, CHP calibration curves carriedout on days 1 and 2 (Table 2). All calibration curves were repeatedand similar results were obtained (data not shown). Hence, theCHP standard provided the maximum response. However, in rela-tion to the TBHP standard, it should be also taken into account thatsamples were read after 3 h of incubation. This fact explained, inpart, the lower intensities found because the slower reaction withTBHP was incomplete (Fig. 3).
We studied the formation of fluorescence over reaction timeand in olive oil sample and a steady end-point was reached after1 h of incubation (data not shown) which agreed with previous re-ports (Akasaka et al., 1992). Therefore, it can be assumed that theHP normally present in lipid food samples react as fast as hydrogenperoxide, CHP or HPODE. However, as different HP can have differ-
Table 2Calibration curves (n = 21) obtained with different methods for different hydroper-oxide standards in different days (y = emission intensity and x = microequivalentstandard/L sample).
Method Standarda Day Equation R2
Lipid CHP 1 y = 5700x ± 44 + 89,000 ± 880 0.999Lipid CHP 2 y = 5800x ± 51 + 87,000 ± 1000 0.998Lipid CHP 3 y = 5600x ± 102 + 93,000 ± 2100 0.992Lipid HPODE 1 y = 4800x ± 75 + 90,000 ± 1500 0.994Lipid TBHP 2 y = 3700x ± 45 + 86,000 ± 910 0.997Lipid H2O2 3 y = 5400x ± 92 + 96,000 ± 1800 0.994Aqueous CHP 4 y = 9500x ± 158 + 98,000 ± 3200 0.994Aqueous CHP 5 y = 9400x ± 77 + 93,000 ± 1400 0.998Aqueous H2O2 5 y = 5900x ± 75 + 98,000 ± 1800 0.996
a CHP, cumene hydroperoxide; HPODE, 13-hydroperoxide 9,11-octadecadienoicacid; TBHP, tert-butyl hydroperoxide.
ent responses we propose to express the amounts of HP as equiv-alents of an arbitrary HP, such as CHP, in the sample. Amongseveral methods, iodometric and spectrophotometric methodsbased on the oxidation of iron used to determine lipid HP are alsoexpressed as equivalents of an arbitrary unit (American Oil Chem-ists’ Society, 2006; Bou, Codony, et al., 2008). Using equivalents canbe useful especially in a sample where different types of HP withlarge variation in molecular weight are present.
The DPPP based methods were reported to correlate fairly wellwith other methods measuring lipid HP content (Meguro et al.,1990; Sohn et al., 2005). In fact, when the proposed method in thispaper was applied to different food lipids and lipid extracts (may-onnaise and butter) the obtained results were highly correlated(R2 = 0.999) with the thiocyanate method. This latter method andthe ferrous-oxidation-xylenol orange method are commonly usedfor lipid HP determination at lower levels than those that can bereached with the official titration methods. Even with the differentlipid HP present in the different food lipids, the high correlationindicates the DPPP procedure provides similar results to the thio-cyanate method. The responses of HP methods such as the xylenol,thiocyanate and titration have been reported to be slightly differ-ent between methods but consistent among samples (Nielsenet al., 2003).
Olive oil (9.7 lEq of CHP/g oil), fish oil (3.0 lEq of CHP/g oil) andsunflower oil (1.1 lEq of CHP/g oil) were used to study the preci-sion of the method (n = 5) which resulted in a relative standarddeviation (RSD) of 5.4%, 5.5% and 2.5%, respectively. The precisionof the method was good since were below the maximum RSD rec-ommended by the AOAC (Association of Official Analytical Chem-ists, 1993). Moreover, the RSD found for lipid HP were in linewith those reported in different oils using a flow injection analysissystem (Sohn et al., 2005). Spectrophotometric methods based onferrous oxidation (thiocyanate and xylenol orange) showed similarlimits of quantification ranging from 0.1 lEq HP/g to 7 nEq HP/mLin edible oils and lipid extracts (Bou, Codony, et al., 2008). It isnoteworthy to remark that the precedent limit of detection ofthe proposed procedure is expressed in lEq/L of the reaction med-ium. Therefore, when results are expressed per lipid weight thislimit is by far much lower.
The recoveries of two CHP amounts added to olive oil weredetermined. At both levels of standard addition (9.9 lEq/L and15.0 lEq/L) the recoveries were high (102.3% and 104.5%, respec-tively) suggesting that the proposed method provided sufficientrecovery together with low RSD (2.0% and 1.3%, respectively). Highrecoveries (87–103%) were also found for lipid HP in different oilsby means of a flow injection analysis system coupled with a fluo-rescence detection system using DPPP (Sohn et al., 2005). Likewise,high recoveries for different lipid classes (triacylglycerol HP, 93%;cholesterol ester HP, 82%; phosphatidylcholine, 92%; trilinolein,77%; triolein, 95%; cholesteryl oleate, 83%) were reported in differ-ent HPLC methods using DPPP (Akasaka, Ohrui, & Meguro, 1993;Akasaka, Ohrui, Meguro, & Tamura, 1993; Akasaka et al., 1995).However, the advantage of the proposed method is that it mea-sures the total content of lipid HP by an easier and less expensiveprocedure.
In addition, lipid HP could be differentiated from interferingcompounds and hydrogen peroxide by incubating some of thesamples with TPP. The reductant TPP reduces lipid HP to their,respectively, alcohols but does not react with hydrogen peroxide(Bou, Codony, et al., 2008). Therefore, lipid HP can be differentiatedfrom other compounds by adding TPP to the samples prior to theaddition of the DPPP probe. In this test, blanks plus TPP were alsocarried out because TPP may react with oxygen. The addition ofTPP in blanks and samples before reaction produced the samelow intensities which were also similar to the blanks withoutTPP. Moreover, in some samples in where TPP was added after
0
100000
200000
300000
400000
500000
600000
700000
800000
900000
0 1 2 3 4 5 6 7 8hours
Arb
itrar
y flu
ores
cenc
e un
its
Bovine serum albumin pork microsomes cooked beef extract
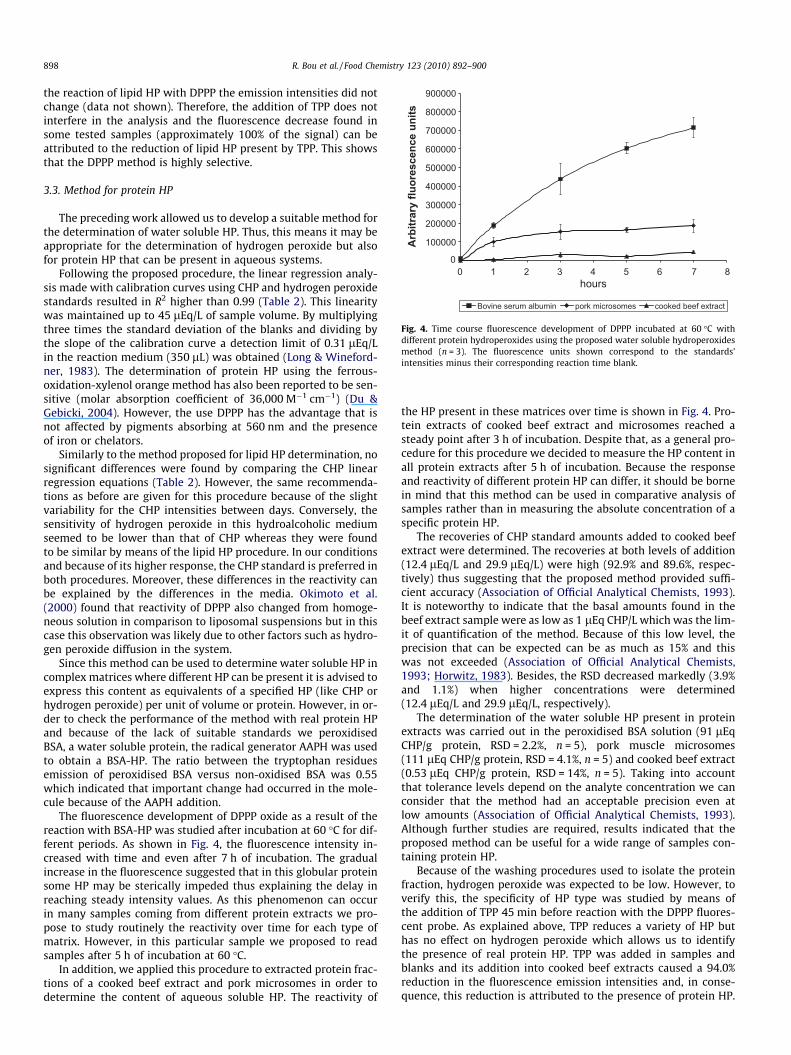
Fig. 4. Time course fluorescence development of DPPP incubated at 60 �C withdifferent protein hydroperoxides using the proposed water soluble hydroperoxidesmethod (n = 3). The fluorescence units shown correspond to the standards’intensities minus their corresponding reaction time blank.
898 R. Bou et al. / Food Chemistry 123 (2010) 892–900
the reaction of lipid HP with DPPP the emission intensities did notchange (data not shown). Therefore, the addition of TPP does notinterfere in the analysis and the fluorescence decrease found insome tested samples (approximately 100% of the signal) can beattributed to the reduction of lipid HP present by TPP. This showsthat the DPPP method is highly selective.
3.3. Method for protein HP
The preceding work allowed us to develop a suitable method forthe determination of water soluble HP. Thus, this means it may beappropriate for the determination of hydrogen peroxide but alsofor protein HP that can be present in aqueous systems.
Following the proposed procedure, the linear regression analy-sis made with calibration curves using CHP and hydrogen peroxidestandards resulted in R2 higher than 0.99 (Table 2). This linearitywas maintained up to 45 lEq/L of sample volume. By multiplyingthree times the standard deviation of the blanks and dividing bythe slope of the calibration curve a detection limit of 0.31 lEq/Lin the reaction medium (350 lL) was obtained (Long & Wineford-ner, 1983). The determination of protein HP using the ferrous-oxidation-xylenol orange method has also been reported to be sen-sitive (molar absorption coefficient of 36,000 M�1 cm�1) (Du &Gebicki, 2004). However, the use DPPP has the advantage that isnot affected by pigments absorbing at 560 nm and the presenceof iron or chelators.
Similarly to the method proposed for lipid HP determination, nosignificant differences were found by comparing the CHP linearregression equations (Table 2). However, the same recommenda-tions as before are given for this procedure because of the slightvariability for the CHP intensities between days. Conversely, thesensitivity of hydrogen peroxide in this hydroalcoholic mediumseemed to be lower than that of CHP whereas they were foundto be similar by means of the lipid HP procedure. In our conditionsand because of its higher response, the CHP standard is preferred inboth procedures. Moreover, these differences in the reactivity canbe explained by the differences in the media. Okimoto et al.(2000) found that reactivity of DPPP also changed from homoge-neous solution in comparison to liposomal suspensions but in thiscase this observation was likely due to other factors such as hydro-gen peroxide diffusion in the system.
Since this method can be used to determine water soluble HP incomplex matrices where different HP can be present it is advised toexpress this content as equivalents of a specified HP (like CHP orhydrogen peroxide) per unit of volume or protein. However, in or-der to check the performance of the method with real protein HPand because of the lack of suitable standards we peroxidisedBSA, a water soluble protein, the radical generator AAPH was usedto obtain a BSA-HP. The ratio between the tryptophan residuesemission of peroxidised BSA versus non-oxidised BSA was 0.55which indicated that important change had occurred in the mole-cule because of the AAPH addition.
The fluorescence development of DPPP oxide as a result of thereaction with BSA-HP was studied after incubation at 60 �C for dif-ferent periods. As shown in Fig. 4, the fluorescence intensity in-creased with time and even after 7 h of incubation. The gradualincrease in the fluorescence suggested that in this globular proteinsome HP may be sterically impeded thus explaining the delay inreaching steady intensity values. As this phenomenon can occurin many samples coming from different protein extracts we pro-pose to study routinely the reactivity over time for each type ofmatrix. However, in this particular sample we proposed to readsamples after 5 h of incubation at 60 �C.
In addition, we applied this procedure to extracted protein frac-tions of a cooked beef extract and pork microsomes in order todetermine the content of aqueous soluble HP. The reactivity of
the HP present in these matrices over time is shown in Fig. 4. Pro-tein extracts of cooked beef extract and microsomes reached asteady point after 3 h of incubation. Despite that, as a general pro-cedure for this procedure we decided to measure the HP content inall protein extracts after 5 h of incubation. Because the responseand reactivity of different protein HP can differ, it should be bornein mind that this method can be used in comparative analysis ofsamples rather than in measuring the absolute concentration of aspecific protein HP.
The recoveries of CHP standard amounts added to cooked beefextract were determined. The recoveries at both levels of addition(12.4 lEq/L and 29.9 lEq/L) were high (92.9% and 89.6%, respec-tively) thus suggesting that the proposed method provided suffi-cient accuracy (Association of Official Analytical Chemists, 1993).It is noteworthy to indicate that the basal amounts found in thebeef extract sample were as low as 1 lEq CHP/L which was the lim-it of quantification of the method. Because of this low level, theprecision that can be expected can be as much as 15% and thiswas not exceeded (Association of Official Analytical Chemists,1993; Horwitz, 1983). Besides, the RSD decreased markedly (3.9%and 1.1%) when higher concentrations were determined(12.4 lEq/L and 29.9 lEq/L, respectively).
The determination of the water soluble HP present in proteinextracts was carried out in the peroxidised BSA solution (91 lEqCHP/g protein, RSD = 2.2%, n = 5), pork muscle microsomes(111 lEq CHP/g protein, RSD = 4.1%, n = 5) and cooked beef extract(0.53 lEq CHP/g protein, RSD = 14%, n = 5). Taking into accountthat tolerance levels depend on the analyte concentration we canconsider that the method had an acceptable precision even atlow amounts (Association of Official Analytical Chemists, 1993).Although further studies are required, results indicated that theproposed method can be useful for a wide range of samples con-taining protein HP.
Because of the washing procedures used to isolate the proteinfraction, hydrogen peroxide was expected to be low. However, toverify this, the specificity of HP type was studied by means ofthe addition of TPP 45 min before reaction with the DPPP fluores-cent probe. As explained above, TPP reduces a variety of HP buthas no effect on hydrogen peroxide which allows us to identifythe presence of real protein HP. TPP was added in samples andblanks and its addition into cooked beef extracts caused a 94.0%reduction in the fluorescence emission intensities and, in conse-quence, this reduction is attributed to the presence of protein HP.
R. Bou et al. / Food Chemistry 123 (2010) 892–900 899
Therefore, this method was slightly affected by interferences and/or the presence of hydrogen peroxide was minimal.
4. Conclusions
The formation of the fluorescent DPPP oxide can be carried outin different solvents and hydroalcoholic media which allow thedetermination of all type of HP. However, not all the solvents of-fered the same performance and the reactivity of this fluorescentprobe is also different with different types HP. Because lipid andprotein extracts have different solubility’s and may contain differ-ent and unknown HP with large variations in molecular weight,two different methods have been developed. The same reactionproceeds in a completely different reaction medium where HPare dissolved and results have to be expressed in equivalents ofan arbitrary HP standard. Because of its higher response, stabilityand solubility CHP is preferred in both media.
The proposed method for lipid HP determination is easy toperform and showed a high correlation with the alternative thio-cyanate method. Apart from its precision and accuracy, thismethod has the advantage that is very sensitive and free ofinterferences. Indeed, the selectivity of the method for lipid HPcan be checked through the TPP addition and this was showedto be about 100%.
An alternative method to measure HP that are soluble in aque-ous systems was developed. This method first reported the DPPPprobe to determine aqueous soluble HP by means of an easy proce-dure. Moreover, the addition of TPP to protein HP showed that theselectivity of the method was very high (94%). Although further re-search is required, this method has been proved to be to be precise,accurate, free of interferences in a variety of tested samples and,very importantly, sensitive enough to measure protein HP at levelsnormally found in biological matrices.
Acknowledgements
The authors thank the Fulbright Commission in Spain and TheSecretary of State for Universities and Research of the Spanish Min-istry of Education and Science for their financial support.
References
Akasaka, K., Ohata, A., Ohrui, H., & Meguro, H. (1995). Automatic-determination ofhydroperoxides of phosphatidylcholine and phosphatidylethanolamine inhuman plasma. Journal of Chromatography B – Biomedical Applications, 665(1),37–43.
Akasaka, K., & Ohrui, H. (2000). Development of phosphine reagents for the high-performance liquid chromatographic–fluorometric determination of lipidhydroperoxides. Journal of Chromatography A, 881(1–2), 159–170.
Akasaka, K., Ohrui, H., & Meguro, H. (1993). Simultaneous determination ofhydroperoxides of phosphatidylcholine, cholesterol esters and triacylglycerolsby column-switching high-performance liquid-chromatography with apostcolumn detection system. Journal of Chromatography – BiomedicalApplications, 622(2), 153–159.
Akasaka, K., Ohrui, H., Meguro, H., & Tamura, M. (1993). Determination oftriacylglycerol and cholesterol ester hydroperoxides in human plasma byhigh-performance liquid-chromatography with fluorometric postcolumndetection. Journal of Chromatography – Biomedical Applications, 617(2), 205–211.
Akasaka, K., Sasaki, I., Ohrui, H., & Meguro, H. (1992). A simple fluorometry ofhydroperoxides in oils and foods. Bioscience Biotechnology and Biochemistry,56(4), 605–607.
Akasaka, K., Takamura, T., Ohrui, H., Meguro, H., & Hashimoto, K. (1996). Highlysensitive flow injection analysis of lipid hydroperoxides in foodstuffs. BioscienceBiotechnology and Biochemistry, 60(11), 1772–1775.
American Oil Chemists’ Society (2006). Official methods and recommended practicesof the AOCS (5th ed.). Champaign, IL: AOCS Press.
Association of Official Analytical Chemists (1993). AOAC peer verified methodsprogram, manual on policies and procedures. Arlington, VA: AOAC International.
Bou, R., Codony, R., Tres, A., Decker, E. A., & Guardiola, F. (2008). Determination ofhydroperoxides in foods and biological samples by the ferrous oxidation-xylenol orange method: A review of the factors that influence the method’sperformance. Analytical Biochemistry, 377(1), 1–15.
Bou, R., Guardiola, F., Codony, R., Faustman, C., Elias, R. J., & Decker, E. A. (2008).Effect of heating oxymyoglobin and metmyoglobin on the oxidation ofmuscle microsomes. Journal of Agricultural and Food Chemistry, 56(20),9612–9620.
Casetta, I., Govoni, V., & Granieri, E. (2005). Oxidative stress, antioxidants andneurodegenerative diseases. Current Pharmaceutical Design, 11(16), 2033–2052.
Castro, L., & Freeman, B. (2001). Reactive oxygen species in human health anddisease. Nutrition, 17(2), 161–165.
Cecarini, V., Gee, J., Fioretti, E., Amici, M., Angeletti, M., Eleuteri, A. M., et al. (2007).Protein oxidation and cellular homeostasis: Emphasis on metabolism.Biochimica et Biophysica Acta, 1773(2), 93–104.
Diplock, A. T., Charleux, J. L., CrozierWilli, G., Kok, F. J., RiceEvans, C., Roberfroid, M.,et al. (1998). Functional food science and defence against reactive oxidativespecies. The British Journal of Nutrition, 80, S77–S112.
Dobarganes, M. C., & Velasco, J. (2002). Analysis of lipid hydroperoxides. EuropeanJournal of Lipid Science and Technology, 104(7), 420–428.
Du, J., & Gebicki, J. M. (2004). Proteins are major initial cell targets of hydroxyl freeradicals. International Journal of Biochemistry and Cell Biology, 36, 2334–2343.
Eitenmiller, R., & Lee, J. (2004). Analysis of tocopherols and tocotrienols in foods. InR. Eitenmiller & J. Lee (Eds.), Vitamin E, food chemistry, composition, and analysis(pp. 323–424). New York, NY: Marcel Dekker, Inc.
Esterbauer, H., Schaur, R. J., & Zollner, H. (1991). Chemistry and biochemistry of 4-hydroxynonenal, malonaldehyde and related aldehydes. Free Radical Biology andMedicine, 11(1), 81–128.
Esterbauer, H., Wag, G., & Puhl, H. (1993). Lipid peroxidation and its role inatherosclerosis. British Medical Bulletin, 49(3), 566–576.
Finkel, T. (1998). Oxygen radicals and signaling. Current Opinion in Cell Biology,10(2), 248–253.
Frankel, E. N., Neff, W. E., & Weisleder, D. (1990). Determination of methyl linoleatehydroperoxides by C-13 nuclear-magnetic-resonance spectroscopy. Methods inEnzymology, 186, 380–387.
Gay, C. A., & Gebicki, J. A. (2003). Measurement of protein and lipid hydroperoxidesin biological systems by the ferric-xylenol orange method. AnalyticalBiochemistry, 315(1), 29–35.
Gebicki, J. M. (1997). Protein hydroperoxides as new reactive oxygen species. RedoxReport, 3(2), 99–110.
Gebicki, S., & Gebicki, J. M. (1999). Crosslinking of DNA and proteins induced byprotein hydroperoxides. Biochemical Journal, 338, 629–636.
Grune, T., Merker, K., Sandig, G., & Davies, K. J. A. (2003). Selective degradation ofoxidatively modified protein substrates by the proteasome. Biochemical andBiophysical Research Communications, 305(3), 709–718.
Gutteridge, J. M. C. (1995). Lipid peroxidation and antioxidants as biomarkers oftissue damage. Clinical Chemistry, 41(12), 1819–1828.
Halliwell, B., & Chirico, S. (1993). Lipid peroxidation: Its mechanism, measurement,and significance. The American Journal of Clinical Nutrition, 57(5), S715–S725.
Hazell, L. J., & Stocker, R. (1993). Oxidation of low-density lipoprotein withhypochlorite causes transformation of the lipoprotein into a high-uptake formfor macrophages. Biochemical Journal, 290(1), 165–172.
Holbrook, N. J., & Ikeyama, S. (2002). Age-related decline in cellular response tooxidative stress: Links to growth factor signaling pathways with commondefects. Biochemical Pharmacology, 64(5–6), 999–1005.
Horwitz, W. (1983). Today’s chemical realities. Journal of the Association of OfficialAnalytical Chemists, 66(5), 1295–1301.
Hughes, H., Smith, C. V., Horning, E. C., & Mitchell, J. R. (1983). High-performanceliquid-chromatography and gas-chromatography mass-spectrometrydetermination of specific lipid-peroxidation products in vivo. AnalyticalBiochemistry, 130(2), 431–436.
Jessup, W., Dean, R. T., & Gebicki, J. M. (1994). Iodometric determination ofhydroperoxides in lipids and proteins. Methods in Enzymology, 233, 289–303.
Kemmo, S., Soupas, L., Lampi, A. M., & Piironen, V. (2005). Formation anddecomposition of stigmasterol hydroperoxides and secondary oxidationproducts during thermo-oxidation. European Journal of Lipid Science andTechnology, 107(11), 805–814.
Long, G. L., & Winefordner, J. D. (1983). Limit of detection: A closer look at the IUPACdefinition. Analytical Chemistry, 55(7), 712–724.
Lowry, O. H., Rosebrough, N. J., Farr, A. L., & Randall, R. J. (1951). Proteinmeasurement with the Folin phenol reagent. The Journal of BiologicalChemistry, 193(1), 265–275.
Meguro, H., Akasaka, K., & Ohrui, H. (1990). Determination of hydroperoxides withfluorometric reagent diphenyl-1-pyrenylphosphine. Methods in Enzymology,186, 157–161.
Mehrotra, S., Ling, K. L. E., Bekele, Y., Gerbino, E., & Earle, K. A. (2001). Lipidhydroperoxide and markers of renal disease susceptibility in African–Caribbeanand Caucasian patients with type 2 diabetes mellitus. Diabetic Medicine, 18(2),109–115.
Nawar, W. W. (1996). Lipids. In O. R. Fennema (Ed.), Food chemistry. New York, NY:Marcel Dekker, Inc.
Nielsen, N. S., Timm-Heinrich, M., & Jacobsen, C. (2003). Comparison of wet-chemical methods for determination of lipid hydroperoxides. Journal of FoodLipids, 10(1), 35–50.
Okimoto, Y., Watanabe, A., Niki, E., Yamashita, T., & Noguchi, N. (2000). A novelfluorescent probe diphenyl-1-pyrenylphosphine to follow lipid peroxidation incell membranes. FEBS Letters, 474(2–3), 137–140.
Shantha, N. C., & Decker, E. A. (1994). Rapid, sensitive, iron-basedspectrophotometric methods for determination of peroxide values of foodlipids. Journal of AOAC International, 77(2), 421–424.

900 R. Bou et al. / Food Chemistry 123 (2010) 892–900
Sivaram, A. G., Suresh, M. V., & Indira, M. (2003). Combined effect of ascorbic acidand selenium supplementation on alcohol-induced oxidative stress in guineapigs. Comparative Biochemistry and Physiology. Part C: Toxicology andPharmacology, 134(3), 397–401.
Sohn, J. H., Taki, Y. S., Ushio, H., & Ohshima, T. (2005). Quantitative determination oftotal lipid hydroperoxides by a flow injection analysis system. Lipids, 40(2),203–209.
Stadtman, E. R. (2006). Protein oxidation and aging. Free Radical Research, 40(12),1250–1258.
Stadtman, E. R., & Berlett, B. S. (1997). Reactive oxygen-mediated protein oxidationin aging and disease. Chemical Research in Toxicology, 10(5), 485–494.
Widmer, R., Ziaja, I., & Grune, T. (2006). Protein oxidation and degradation duringaging: Role in skin aging and neurodegeneration. Free Radical Research, 40(12),1259–1268.
Yamamoto, Y. (1994). Chemiluminescence-based high-performance liquid-chromatography assay of lipid hydroperoxides. Methods in Enzymology, 233,319–324.
Yang, G. C., Qiang, W., Morehouse, K. M., Rosenthal, I., Yuoh, K., & Yurawecz, P.(1991). Determination of hydroperoxides in edible oils by electron spinresonance, thiobarbituric acid assay, and liquid chromatography–chemiluminescence techniques. Journal of Agricultural and Food Chemistry, 39,896–898.
Related Documents