Determination of language dominance with synthetic aperture magnetometry: comparison with the Wada test $ Masayuki Hirata, a,b, * Amami Kato, a Masaaki Taniguchi, a Youichi Saitoh, a Hirotomo Ninomiya, a Aya Ihara, b,c Haruhiko Kishima, a Satoru Oshino, a Takahito Baba, a Shiro Yorifuji, b and Toshiki Yoshimine a a Department of Neurosurgery, Osaka University Graduate School of Medicine, Osaka, Japan b Division of Functional Diagnostic Science, Course of Health Science, Osaka University Graduate School of Medicine, Osaka, Japan c Department of Integrative Physiology, National Institute for Physiological Sciences, Okazaki, Japan Received 30 October 2003; revised 7 May 2004; accepted 11 May 2004 Cerebral dominance for language function was investigated with synthetic aperture magnetometry (SAM). The results were compared with those of the Wada test. SAM is a spatial filtering technique that enables demonstration of the spatiotemporal distribution of oscillatory changes (synchronization and desynchronization) in magnetoencepha- lography (MEG) signals elicited by specific brain activation. MEG was conducted during a silent reading task in 20 consecutive preoperative neurosurgical patients who also underwent a Wada test. The spatial distribution of oscillatory changes related to silent reading was shown tomographically with SAM as statistical images. Language dominance was estimated by the laterality index, which scales the lateralization of the beta (13 – 25 Hz) and low gamma (25 – 50 Hz) band desynchroniza- tions in the inferior frontal gyrus (IFG) or middle frontal gyrus (MFG). Oscillatory changes were distributed multifocally and bilaterally in the occipital cortex, IFG or MFG, and temporo-parieto-occipital border regions. In 19 patients (95%), language lateralization estimated by the laterality index was congruent with the result of the Wada test. In left- handed patients, SAM analysis clearly differentiated language domi- nance (left, right, or bilateral), and the findings were confirmed by the Wada test. Lateralization of beta or low gamma band desynchroniza- tions in the IFG or MFG is a good indicator of the side of language dominance. Reliability of MEG imaging with SAM is sufficient to evaluate language dominance preoperatively in neurosurgical patients. D 2004 Elsevier Inc. All rights reserved. Keywords: Language dominance; Synthetic aperture magnetometry; Wada test Introduction Synchronous oscillations in specific frequencies such as the alpha and beta bands are well known as basic brain rhythms. The signal power of these basic brain rhythms changes upon brain activation. Event-related desynchronization (ERD) is an attenua- tion of, and event-related synchronization (ERS) is an increase of, the oscillation amplitude of a specific frequency related to specific neural activity (Pfurtscheller, 1992; Pfurtscheller and Aranibar, 1977). Recently, several magnetoencephalography (MEG) studies suggested that cerebral oscillatory changes in the gamma band reflect higher cognitive processes such as attention, perception, and language processing (Braeutigam et al., 2001; Eulitz et al., 1996; Pulvermu ¨ller et al., 1997). Pulvermu ¨ller and colleagues assumed that elements of cognitive processing are distributed over both hemispheres as transcortical cell assemblies that generate specific spatiotemporal activity patterns (Pulvermu ¨ller and Mohr, 1996; Pulvermu ¨ller et al., 1997). However, in these MEG studies, data were analyzed with relatively low spatial resolution (hemispheric or lobar level). To elucidate neurophysiological mechanisms of these higher cognitive processes, it is important to investigate the spatial localization and temporal distribution of cerebral oscillatory changes with high resolution. Pioneering studies with functional imaging modalities, i.e., positron emission tomography (PET) (Howard et al., 1992; Petersen et al., 1988), functional magnetic resonance imaging (fMRI) (Binder et al., 1996; McCarthy et al., 1993), and MEG (Martin et al., 1993; Salmelin et al., 1994) provided information about language localization. Several fMRI and PET studies successfully estimated language dominance in agreement with the Wada test (Benson et al., 1999; Binder et al., 1996; Lehe ´ricy et al., 2000), which is the gold standard for determining language dominance. MEG is noninvasive and provides direct information about activity over the whole brain by measuring the magnetic fields generated by minute neuronal intracellular electrical cur- rents. MEG has excellent spatiotemporal resolution compared with that of other imaging modalities such as fMRI and PET. Thus, it is a good tool for elucidating neurophysiological pro- cesses within the brain. Several previous MEG studies estimated language dominance by the equivalent current dipole (ECD) method (Papanicolaou et al., 1999; Szymanski et al., 2001). Compared with short-latency magnetic fields such as somatosen- 1053-8119/$ - see front matter D 2004 Elsevier Inc. All rights reserved. doi:10.1016/j.neuroimage.2004.05.009 $ Synthetic aperture magnetometry and language dominance. * Corresponding author. Department of Neurosurgery, Osaka University Graduate School of Medicine, E6 2-2 Yamadaoka Suita, Osaka, Japan. Fax: +81-6-6879-3659. E-mail address: [email protected] (M. Hirata). Available online on ScienceDirect (www.sciencedirect.com.) www.elsevier.com/locate/ynimg NeuroImage 23 (2004) 46 – 53

Welcome message from author
This document is posted to help you gain knowledge. Please leave a comment to let me know what you think about it! Share it to your friends and learn new things together.
Transcript

www.elsevier.com/locate/ynimg
NeuroImage 23 (2004) 46–53
Determination of language dominance with synthetic aperture
magnetometry: comparison with the Wada test$
Masayuki Hirata,a,b,* Amami Kato,a Masaaki Taniguchi,a Youichi Saitoh,a Hirotomo Ninomiya,a
Aya Ihara,b,c Haruhiko Kishima,a Satoru Oshino,a Takahito Baba,a
Shiro Yorifuji,b and Toshiki Yoshiminea
aDepartment of Neurosurgery, Osaka University Graduate School of Medicine, Osaka, JapanbDivision of Functional Diagnostic Science, Course of Health Science, Osaka University Graduate School of Medicine, Osaka, JapancDepartment of Integrative Physiology, National Institute for Physiological Sciences, Okazaki, Japan
Received 30 October 2003; revised 7 May 2004; accepted 11 May 2004
Cerebral dominance for language function was investigated with
synthetic aperture magnetometry (SAM). The results were compared
with those of the Wada test. SAM is a spatial filtering technique that
enables demonstration of the spatiotemporal distribution of oscillatory
changes (synchronization and desynchronization) in magnetoencepha-
lography (MEG) signals elicited by specific brain activation. MEG was
conducted during a silent reading task in 20 consecutive preoperative
neurosurgical patients who also underwent a Wada test. The spatial
distribution of oscillatory changes related to silent reading was shown
tomographically with SAM as statistical images. Language dominance
was estimated by the laterality index, which scales the lateralization of
the beta (13–25 Hz) and low gamma (25–50 Hz) band desynchroniza-
tions in the inferior frontal gyrus (IFG) or middle frontal gyrus (MFG).
Oscillatory changes were distributed multifocally and bilaterally in the
occipital cortex, IFG or MFG, and temporo-parieto-occipital border
regions. In 19 patients (95%), language lateralization estimated by the
laterality index was congruent with the result of the Wada test. In left-
handed patients, SAM analysis clearly differentiated language domi-
nance (left, right, or bilateral), and the findings were confirmed by the
Wada test. Lateralization of beta or low gamma band desynchroniza-
tions in the IFG or MFG is a good indicator of the side of language
dominance. Reliability of MEG imaging with SAM is sufficient to
evaluate language dominance preoperatively in neurosurgical patients.
D 2004 Elsevier Inc. All rights reserved.
Keywords: Language dominance; Synthetic aperture magnetometry; Wada
test
Introduction
Synchronous oscillations in specific frequencies such as the
alpha and beta bands are well known as basic brain rhythms. The
1053-8119/$ - see front matter D 2004 Elsevier Inc. All rights reserved.
doi:10.1016/j.neuroimage.2004.05.009
$ Synthetic aperture magnetometry and language dominance.
* Corresponding author. Department of Neurosurgery, Osaka University
Graduate School of Medicine, E6 2-2 Yamadaoka Suita, Osaka, Japan. Fax:
+81-6-6879-3659.
E-mail address: [email protected] (M. Hirata).
Available online on ScienceDirect (www.sciencedirect.com.)
signal power of these basic brain rhythms changes upon brain
activation. Event-related desynchronization (ERD) is an attenua-
tion of, and event-related synchronization (ERS) is an increase of,
the oscillation amplitude of a specific frequency related to specific
neural activity (Pfurtscheller, 1992; Pfurtscheller and Aranibar,
1977). Recently, several magnetoencephalography (MEG) studies
suggested that cerebral oscillatory changes in the gamma band
reflect higher cognitive processes such as attention, perception, and
language processing (Braeutigam et al., 2001; Eulitz et al., 1996;
Pulvermuller et al., 1997). Pulvermuller and colleagues assumed
that elements of cognitive processing are distributed over both
hemispheres as transcortical cell assemblies that generate specific
spatiotemporal activity patterns (Pulvermuller and Mohr, 1996;
Pulvermuller et al., 1997). However, in these MEG studies, data
were analyzed with relatively low spatial resolution (hemispheric
or lobar level). To elucidate neurophysiological mechanisms of
these higher cognitive processes, it is important to investigate the
spatial localization and temporal distribution of cerebral oscillatory
changes with high resolution.
Pioneering studies with functional imaging modalities, i.e.,
positron emission tomography (PET) (Howard et al., 1992;
Petersen et al., 1988), functional magnetic resonance imaging
(fMRI) (Binder et al., 1996; McCarthy et al., 1993), and MEG
(Martin et al., 1993; Salmelin et al., 1994) provided information
about language localization. Several fMRI and PET studies
successfully estimated language dominance in agreement with
the Wada test (Benson et al., 1999; Binder et al., 1996; Lehericy
et al., 2000), which is the gold standard for determining language
dominance. MEG is noninvasive and provides direct information
about activity over the whole brain by measuring the magnetic
fields generated by minute neuronal intracellular electrical cur-
rents. MEG has excellent spatiotemporal resolution compared
with that of other imaging modalities such as fMRI and PET.
Thus, it is a good tool for elucidating neurophysiological pro-
cesses within the brain. Several previous MEG studies estimated
language dominance by the equivalent current dipole (ECD)
method (Papanicolaou et al., 1999; Szymanski et al., 2001).
Compared with short-latency magnetic fields such as somatosen-

Table 1
Summary of cases
Case Age
(years)
Sex Location Diagnosis Wada Handedness HQ
1 60 M rt parietal glioblastoma R L �18
2 18 M lt parietal epilepsy R L �92
3 46 F lt temporal epilepsy L > R Ra 83
4 31 M rt parietal infarction L L �64
5 35 F lt frontotemporal cavernoma L R 83
6 45 F lt temporal astrocytoma L R 100
7 19 M lt temporal epilepsy L R 100
8 37 M lt insular astrocytoma L R 100
9 41 F lt temporal astrocytoma L R 100
10 24 M lt temporal epilepsy L R 100
11 22 F lt temporal epilepsy L R 100
12 58 M lt temporal cavernoma L R 100
13 25 F lt frontal astrocytoma L R 91
14 14 M lt temporal epilepsy L R 100
15 15 F frontal epilepsy L R 100
16 29 F lt temporal astrocytoma L R 100
17 24 F lt frontal epilepsy R L �17
18 25 F frontal epilepsy L R 83
19 19 F rt temporal epilepsy L R 100
20 41 F rt temporal epilepsy L R 92
Sex: F = female, M = male; location: site of lesion, lt = left, rt = right.
Wada: right (R) or left (L) language dominance as determined by the Wada
test.
Handedness: subjects judged to be (R) right or (L) determined by HQ.
HQ: handedness quotient based on the Edinburgh handedness inventory.a This subject was natively left-handed but acquired right handedness.
M. Hirata et al. / NeuroImage 23 (2004) 46–53 47
sory, auditory, and visual evoked fields, linguistic components of
magnetic fields evoked by a language task have long latency and
include activities from multiple areas. Many of the successful
language studies (Helenius et al., 1998; Levelt et al., 1998;
Salmelin et al., 1994) used a multidipole model that requires a
hypothesis about the number and location of active sources. An
epoch-making tool was required to break through the limitations
of the ECD method.
Synthetic aperture magnetometry (SAM) is a spatial filtering
technique based on the nonlinear constrained minimum-variance
beamformer and is capable of detecting current density in an
arbitrarily chosen voxel within the whole brain with high reso-
lution (Baillet et al., 2001; Robinson and Rose, 1992; Robinson
and Vrba, 1999). Thus, the spatiotemporal distributions of ERD
and ERS can be visualized precisely. We introduced this tech-
nique to investigate language processing and previously reported
the spatial localization and temporal distribution of oscillatory
changes during silent reading in healthy subjects (Hirata et al.,
2002a; Ihara et al., 2003a). In these studies, ERD in the beta and
gamma bands was seen consistently in language-related areas,
especially in the left inferior frontal gyrus (IFG) and middle
frontal gyrus (MFG), and both serial and parallel processing were
suggested to be involved in language processing (Hirata et al.,
2002a). Xiang et al. (2001) found, also with SAM, that a
language task evoked the gamma band ERD in Broca’s and
Wernicke’s areas in healthy subjects. Another MEG study with a
spatial filtering technique (Kober et al., 2001) showed the
spatiotemporal distribution of current sources during silent read-
ing and silent naming tasks. It was also suggested that both serial
and parallel processing were involved in language processing.
But in that study, the results for only a few patients were
compared with those of the Wada test. It is important to confirm
the results of these spatially filtered MEG studies with a larger
population by comparing them with the Wada test or cortical
stimulation results. However, such justification studies have not
been done. It is also of great significance to estimate language
dominance directly based on the cerebral neurophysiological
mechanisms of language processing. Thus, we investigated the
spatial distribution of cerebral oscillatory changes related to silent
reading, quantitatively evaluated language lateralization of oscil-
latory changes, and compared our results with those of the Wada
test.
Materials and methods
Data acquisition
Twenty consecutive neurosurgical patients who underwent the
Wada test for preoperative examination participated in this study
(Table 1). MEG study for patients in this institute is approved as
Advanced Medical Treatment and regulated by the Ministry of
Health, Labor and Welfare of Japan. Informed consent was
obtained from all participants. During the recording, each partic-
ipant sat with eyes open in a comfortable chair in a magnetically
shielded room. A three-character Japanese hiragana semantic word
was presented every 6 s on a liquid crystal monitor 2 m away. Each
word was presented for 3 s. One session consisted of 100 different
word presentations. Words were selected from an elementary
school dictionary so as to be understood quickly and easily by
all participants. Participants were instructed to read each word only
once and without phonation. The word stimuli subtended a
horizontal visual angle of 3j and a vertical angle of 1j. Thus, noeye movements were necessary to scan the presented word.
Data were recorded with a 64-channel whole-head MEG system
equipped with first-order SQUID gradiometers (NeuroSQUIDMod-
el 100, CTF Systems Inc., Port Coquitlam, Canada). MEG signals
were digitized at a sampling rate of 625 Hz and filtered with a 200-
Hz on-line, low pass filter. Notch filters were used at 60 and 120 Hz
to eliminate AC line noise. Data of 5000-ms durationwith a 2500-ms
prestimulus interval were collected for each of the 100 trials. At the
beginning and end of each measurement, the participant’s head
position was registered with localization coils that were placed at the
nasion and the bilateral preauricular points. For each participant,
magnetic resonance (MR) images were obtained with a 1.0 T
(Magnetom Impact, Siemens, Erlangen, Germany) or 1.5 T (Signa
GE Medical Systems, Milwaukee, WI) MR imaging systems in a
T1-weighted sequence of 130 sagittal slices (1.5-mm thickness) with
fiducial skin markers at the nasion and bilateral preauricular points.
By registration of the head position at these three points, the MEG
data could be superimposed on the individual MR images with an
anatomical accuracy of a few millimeters.
SAM analysis
The spatial distributions of ERDs and ERSs were estimated by
SAM statistical analysis (Hirata et al., 2002a,b; Ihara et al.,
2003a,b; Robinson and Vrba, 1999; Taniguchi et al., 2000).
The detailed algorithm for SAM is described elsewhere (Baillet
et al., 2001; Robinson and Vrba, 1999; Taniguchi et al., 2000).
SAM estimates the source power with high spatial resolution by
forming a linear combination of sensors that can suppress the

M. Hirata et al. / NeuroImage 23 (2004) 46–5348
signals from environmental noise without attenuating power from
the target voxel (Robinson and Vrba, 1999; Taniguchi et al.,
2000). Because the SAM method does not require averaging,
high-frequency components are not attenuated, even in the middle
or long latency periods.
The MEG data were divided into five frequency bands as
follows: theta (3–8 Hz), alpha (8–13 Hz), beta (13–25 Hz), low
gamma (25–50 Hz), and high gamma (50–100 Hz) bands. The
region of interest (ROI) was set to include the whole cerebral
cortex with a 5-mm voxel resolution. A spherical area 1.5 cm in
diameter, located at the center of the spherical head model, was
excluded from the ROI because the noise-to-signal ratio increases
in areas remote from the SQUID sensors. The current density of
each voxel was estimated by SAM. Changes in the current
density for each voxel between the active state (0 to 1000 ms
after stimulus) and the control state (1000 to 0 ms before
stimulus) were analyzed statistically with Student t values. The
distribution of t values was displayed on the individual MR
images for each frequency band (SAM statistical image). Nega-
tive and positive t values indicate ERD and ERS, respectively.
Voxels with a P value of less than 0.001 were considered
statistically significant.
Laterality index for estimating language dominance
Our preliminary study of healthy right-handed participants
detected oscillatory changes mainly in the triangular or opercular
part of the left IFG, the dorsal part of the left MFG, the posterior part
of the superior or middle temporal gyrus, the temporo-parieto-
occipital border areas, and the medial occipital area (Hirata et al.,
2002a). To confirm where oscillatory change is most lateralized in
these areas, the following six regions of interest (ROIs) with the
highest t values were investigated statistically (Fig. 1): the triangular
or opercular part of the IFG, the dorsal part of theMFG, the posterior
part of the middle or superior temporal gyrus, the angular gyrus and
the lateral occipital area, the temporo-occipital base, and the medial
occipital area.
The laterality index (LI) was defined to estimate the degree of
laterality of oscillatory changes quantitatively as follows:
LI ¼ 2ðTR � TLÞ=ðATRAþ ATLAÞ
The t values of the most prominent ERD in the specified band
within the related region and its contralateral homologous region
were selected, and, of these two selected values, the t value on the
Fig. 1. The six areas analyzed in this study: (1) the triangular or opercular
part of the inferior frontal gyrus, (2) the dorsal part of the middle frontal
gyrus, (3) the posterior part of the middle or superior temporal gyrus, (4) the
angular gyrus and the lateral occipital area, (5) the temporo-occipital base,
and (6) the medial occipital area.
right side was defined as TR and the t value on the left side as TL.
When both left and right ROIs had no significant voxels, the LI
was not calculated. If ROIs on either left or right sides had
significant voxels and the other side had no significant voxels,
the LI was calculated using the maximum t value of the significant
side and that of the insignificant side. A positive LI means that
oscillatory change is lateralized to the left, and a negative LI
indicates right lateralization. When the LI is near 0, oscillatory
change is present bilaterally. Based on the data from our prelim-
inarily study, language lateralization was empirically defined to be
left when the LI was more than 0.1, right when the LI was less than
�0.1, and bilateral when the LI was between �0.1 and 0.1. Finally,
the results were compared with those of the Wada test and
handedness.
Our preliminary studies also showed that, during silent reading,
the ERDs in the beta and low gamma bands were localized
consistently in the left IFG or MFG (Hirata et al., 2002a). Based
on this result, the criteria for estimating language dominance using
the LI was defined empirically according to the following priori-
ties. ERD in the IFG was of higher priority than ERD in the MFG.
For both ERD in the IFG and ERD in the MFG, the beta band was
of higher priority than the alpha band and of lower priority than the
low gamma band. For example, if low gamma ERD in the IFG was
not statistically significant but beta ERD in the IFG was signifi-
cant, the LI was calculated with the t value of ERD in the IFG in
the beta band. Also, if ERD in the IFG was not statistically
significant, the t value of ERD in the MFG was used to calculate
the LI. When there was no ERD fitting these criteria, dominance
could not be judged.
Handedness and the Wada test
Handedness was determined by the handedness quotient based
on the Edinburgh handedness inventory (Oldfield, 1971). The
handedness quotient ranged from �100 (extremely left-handed)
to 100 (extremely right-handed). Language dominance was de-
termined by the Wada test (Wada and Rasmussen, 1960) in all
patients. After a catheter was placed into one extracranial internal
carotid artery, amobarbital was injected slowly until complete
paralysis of the contralateral hand was observed obviously.
Approximately 100 mg of amobarbital was needed for the
hemispheric anesthesia. The patients were subjected to language
tasks (object naming, picture naming, repetition, word reading).
More than 30 min after the injection of amobarbital and after
confirmation that paralysis was no longer present, the opposite
side was tested. Test results were judged by neuropsychologists
who were blinded to the MEG results. The investigators who
analyzed the MEG data were also blinded to results of the Wada
test.
Results
Handedness and the Wada test
Sixteen patients were judged to be right-handed. Fifteen of
these patients had left language dominance as determined by the
Wada test. In 1 case (case 4), handedness was judged to be right,
but the patient turned out to be left-handed natively and had
switched to using the right hand. This patient had bilateral
language representation (left > right) according to the Wada test.
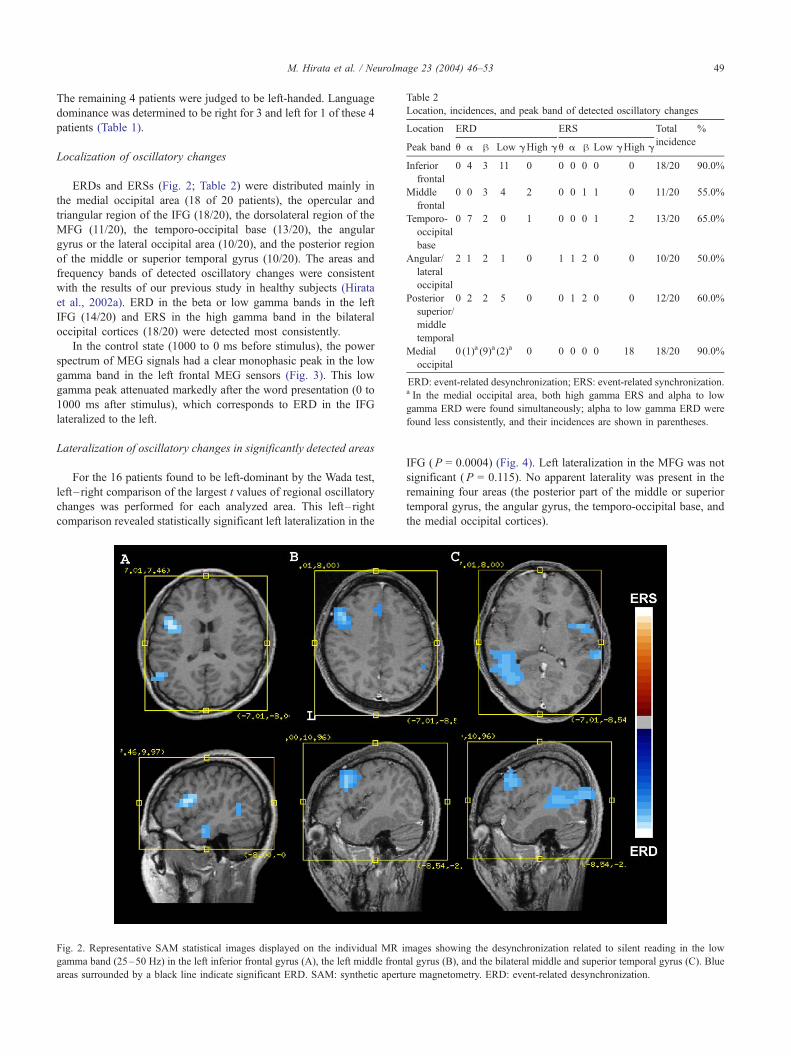
Table 2
Location, incidences, and peak band of detected oscillatory changes
Location ERD ERS Total %
Peak band u a h Low gHigh gu a h Low gHigh gincidence
Inferior
frontal
0 4 3 11 0 0 0 0 0 0 18/20 90.0%
Middle
frontal
0 0 3 4 2 0 0 1 1 0 11/20 55.0%
Temporo-
occipital
base
0 7 2 0 1 0 0 0 1 2 13/20 65.0%
Angular/
lateral
occipital
2 1 2 1 0 1 1 2 0 0 10/20 50.0%
Posterior
superior/
middle
temporal
0 2 2 5 0 0 1 2 0 0 12/20 60.0%
Medial
occipital
0 (1)a (9)a (2)a 0 0 0 0 0 18 18/20 90.0%
ERD: event-related desynchronization; ERS: event-related synchronization.a In the medial occipital area, both high gamma ERS and alpha to low
gamma ERD were found simultaneously; alpha to low gamma ERD were
found less consistently, and their incidences are shown in parentheses.
M. Hirata et al. / NeuroImage 23 (2004) 46–53 49
The remaining 4 patients were judged to be left-handed. Language
dominance was determined to be right for 3 and left for 1 of these 4
patients (Table 1).
Localization of oscillatory changes
ERDs and ERSs (Fig. 2; Table 2) were distributed mainly in
the medial occipital area (18 of 20 patients), the opercular and
triangular region of the IFG (18/20), the dorsolateral region of the
MFG (11/20), the temporo-occipital base (13/20), the angular
gyrus or the lateral occipital area (10/20), and the posterior region
of the middle or superior temporal gyrus (10/20). The areas and
frequency bands of detected oscillatory changes were consistent
with the results of our previous study in healthy subjects (Hirata
et al., 2002a). ERD in the beta or low gamma bands in the left
IFG (14/20) and ERS in the high gamma band in the bilateral
occipital cortices (18/20) were detected most consistently.
In the control state (1000 to 0 ms before stimulus), the power
spectrum of MEG signals had a clear monophasic peak in the low
gamma band in the left frontal MEG sensors (Fig. 3). This low
gamma peak attenuated markedly after the word presentation (0 to
1000 ms after stimulus), which corresponds to ERD in the IFG
lateralized to the left.
Lateralization of oscillatory changes in significantly detected areas
For the 16 patients found to be left-dominant by the Wada test,
left– right comparison of the largest t values of regional oscillatory
changes was performed for each analyzed area. This left– right
comparison revealed statistically significant left lateralization in the
Fig. 2. Representative SAM statistical images displayed on the individual MR i
gamma band (25–50 Hz) in the left inferior frontal gyrus (A), the left middle front
areas surrounded by a black line indicate significant ERD. SAM: synthetic apertu
IFG (P = 0.0004) (Fig. 4). Left lateralization in the MFG was not
significant (P = 0.115). No apparent laterality was present in the
remaining four areas (the posterior part of the middle or superior
temporal gyrus, the angular gyrus, the temporo-occipital base, and
the medial occipital cortices).
mages showing the desynchronization related to silent reading in the low
al gyrus (B), and the bilateral middle and superior temporal gyrus (C). Blue
re magnetometry. ERD: event-related desynchronization.

Fig. 3. Power spectra in the left (A) and right (B) frontal magneto-
encephalography (MEG) sensors. The low gamma desynchronization in the
inferior frontal gyrus (IFG) is strongly lateralized to the left side. In the
control state (1000 to 0 ms before the presentation of a word), power
spectra in the MEG sensors (black line) have a clear monophasic peak in the
low gamma band in the left frontal MEG sensor (A). The low gamma peak
is attenuated prominently in the active state (0 to 1000 ms after the
presentation of a word, gray line), which corresponds to desynchronization
in the left IFG related to silent reading.
M. Hirata et al. / NeuroIma50
ERD in the IFG and MFG
In all cases, ERD was found in the IFG or MFG. ERD in the
beta and low gamma bands in the IFG or MFG was detected in
16 patients (80%; 12 left-dominant patients, 4 right-dominant
patients). The remaining 4 patients, determined to be left-
dominant by the Wada test, also had left-dominant ERD in the
IFG; but the most prominent ERD was observed in the alpha
band. In 19 of these 20 patients, lateralization of ERD was
consistent with the language dominance determined by the Wada
test.
Fig. 4. Graphs showing lateralization of oscillatory changes in each analyzed area
indicates the largest t value of oscillatory changes within each area. A negative t v
indicates event-related synchronization (ERS). The error bars represent standard
Criteria for estimating language dominance
Language dominance estimated by our criteria based on the LI
in the frontal area was consistent with the results of the Wada test
in 19 of 20 patients (95%). Moderate correlation (coefficient =
0.54) was found between the LI and the handedness quotient (Fig.
5). In 1 patient (case 16), the LI was 0.08, and language
dominance was judged to be bilateral by SAM and left dominant
by the Wada test.
Language dominance in left-handed patients
In left-handed patients, including one converted patient, right
dominance (case 1, LI = �0.33; case 2, LI = �0.11; case 17, LI =
�2.00), left dominance (case 4, LI = 0.41), and bilateral domi-
nance (case 3, LI = 0.08) were discriminated clearly by ERDs in
the low gamma band in the IFG. These results were consistent with
the results of the Wada test (Fig. 6).
ge 23 (2004) 46–53
Discussion
The present study is the first reported clinical investigation of the
laterality of oscillatory changes related to silent reading. We showed
language dominance estimated by SAM to be consistent with that
determined by the Wada test. Kober et al. (2001) showed language
dominance determined with spatially filtered MEG to be consistent
with handedness, but their results were verified by the Wada test in
only two cases, and they did not investigate the oscillatory changes.
Oscillatory changes induced by silent word reading
Oscillatory changes related to language processing are still
hardly known, although we preliminarily investigated them in
in 15 patients found to be left-dominant by the Wada test. Longitudinal axis
alue indicates event-related desynchronization (ERD), and a positive t value
errors.
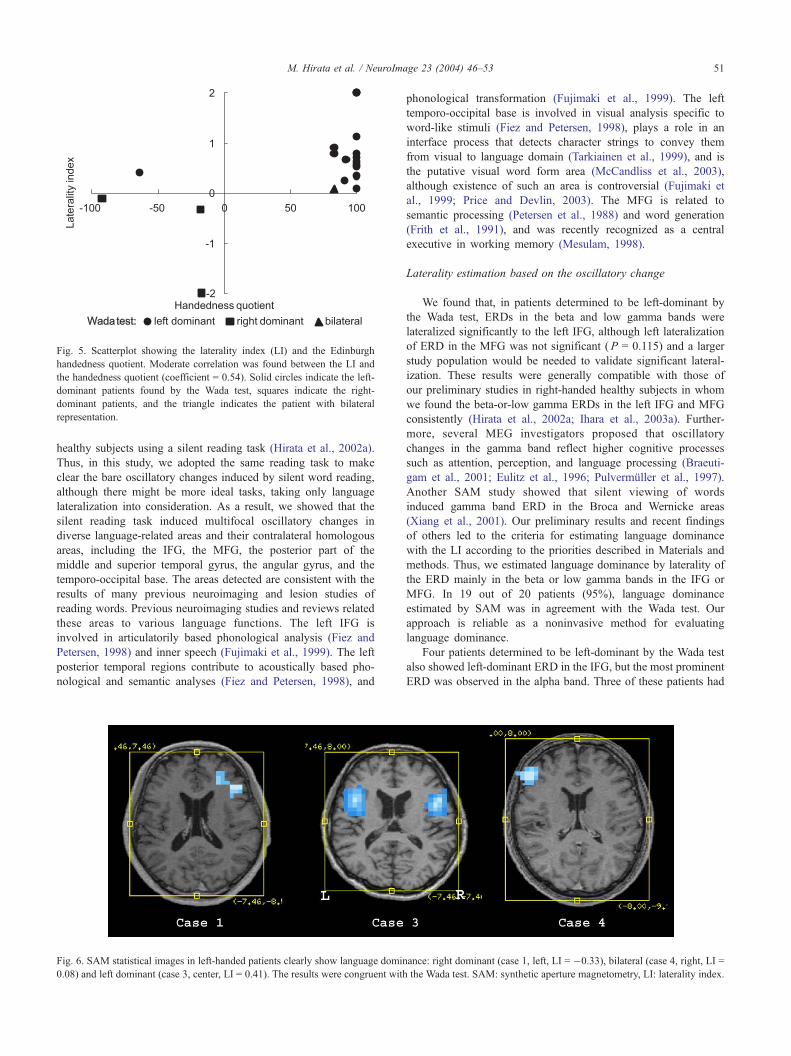
Fig. 5. Scatterplot showing the laterality index (LI) and the Edinburgh
handedness quotient. Moderate correlation was found between the LI and
the handedness quotient (coefficient = 0.54). Solid circles indicate the left-
dominant patients found by the Wada test, squares indicate the right-
dominant patients, and the triangle indicates the patient with bilateral
representation.
M. Hirata et al. / NeuroImage 23 (2004) 46–53 51
healthy subjects using a silent reading task (Hirata et al., 2002a).
Thus, in this study, we adopted the same reading task to make
clear the bare oscillatory changes induced by silent word reading,
although there might be more ideal tasks, taking only language
lateralization into consideration. As a result, we showed that the
silent reading task induced multifocal oscillatory changes in
diverse language-related areas and their contralateral homologous
areas, including the IFG, the MFG, the posterior part of the
middle and superior temporal gyrus, the angular gyrus, and the
temporo-occipital base. The areas detected are consistent with the
results of many previous neuroimaging and lesion studies of
reading words. Previous neuroimaging studies and reviews related
these areas to various language functions. The left IFG is
involved in articulatorily based phonological analysis (Fiez and
Petersen, 1998) and inner speech (Fujimaki et al., 1999). The left
posterior temporal regions contribute to acoustically based pho-
nological and semantic analyses (Fiez and Petersen, 1998), and
Fig. 6. SAM statistical images in left-handed patients clearly show language domin
0.08) and left dominant (case 3, center, LI = 0.41). The results were congruent with
phonological transformation (Fujimaki et al., 1999). The left
temporo-occipital base is involved in visual analysis specific to
word-like stimuli (Fiez and Petersen, 1998), plays a role in an
interface process that detects character strings to convey them
from visual to language domain (Tarkiainen et al., 1999), and is
the putative visual word form area (McCandliss et al., 2003),
although existence of such an area is controversial (Fujimaki et
al., 1999; Price and Devlin, 2003). The MFG is related to
semantic processing (Petersen et al., 1988) and word generation
(Frith et al., 1991), and was recently recognized as a central
executive in working memory (Mesulam, 1998).
Laterality estimation based on the oscillatory change
We found that, in patients determined to be left-dominant by
the Wada test, ERDs in the beta and low gamma bands were
lateralized significantly to the left IFG, although left lateralization
of ERD in the MFG was not significant (P = 0.115) and a larger
study population would be needed to validate significant lateral-
ization. These results were generally compatible with those of
our preliminary studies in right-handed healthy subjects in whom
we found the beta-or-low gamma ERDs in the left IFG and MFG
consistently (Hirata et al., 2002a; Ihara et al., 2003a). Further-
more, several MEG investigators proposed that oscillatory
changes in the gamma band reflect higher cognitive processes
such as attention, perception, and language processing (Braeuti-
gam et al., 2001; Eulitz et al., 1996; Pulvermuller et al., 1997).
Another SAM study showed that silent viewing of words
induced gamma band ERD in the Broca and Wernicke areas
(Xiang et al., 2001). Our preliminary results and recent findings
of others led to the criteria for estimating language dominance
with the LI according to the priorities described in Materials and
methods. Thus, we estimated language dominance by laterality of
the ERD mainly in the beta or low gamma bands in the IFG or
MFG. In 19 out of 20 patients (95%), language dominance
estimated by SAM was in agreement with the Wada test. Our
approach is reliable as a noninvasive method for evaluating
language dominance.
Four patients determined to be left-dominant by the Wada test
also showed left-dominant ERD in the IFG, but the most prominent
ERD was observed in the alpha band. Three of these patients had
ance: right dominant (case 1, left, LI = �0.33), bilateral (case 4, right, LI =
the Wada test. SAM: synthetic aperture magnetometry, LI: laterality index.

M. Hirata et al. / NeuroImage 23 (2004) 46–5352
frontal or perifrontal lesions. These lesions might have slowed the
peak band of brain oscillations at rest, resulting in the alpha ERD
in the IFG. The LI in Case 16 was 0.08, and dominance was judged
to be bilateral, whereas the Wada test indicated left dominance.
Functional imaging generally tends to show more or less bilateral
activation, and estimated language lateralization seems to be a
continuous rather than dichotomous variable (Binder et al., 1996).
However, according to the aphasic symptoms after surgical treat-
ment as well as results of the Wada test, we neurosurgeons believe
that language lateralization is generally more distinct. Appropri-
ateness of the LI threshold used to judge whether language
dominance is unilateral or bilateral, and which we set empirically
at 0.1 for left dominance and �0.1 for right dominance, needs to be
studied further.
Until now, MEG studies have used signal intensity for evalu-
ating the magnitude of activation, for example peak amplitude of
averaged signal and dipole moment, etc. Thus, the present study
used maximum t value as an index of magnitude of oscillatory
change and excellent results were obtained. Volume of significant
voxels is also one of alternatives as an index of language lateral-
ization, as it is often used in fMRI and PET studies. A fMRI study
demonstrated that both the magnitude of the signal change and the
volume of the active region are consistent in language lateralization
(Adcock et al., 2003). In the present study, we used SAM that
showed the volumetric distribution of oscillatory change. In this
meaning, it would be important to compare between volume
estimation and intensity estimation also in our method.
In addition, the maximum t value of a single voxel might have
some variance. Attention should be paid whether each maximum t
value is physiologically valid or whether the maximum t value is
due to mere noise variance.
Language dominance of left-handers
The most impressive finding in the present study is that SAM
analysis differentiated clearly the language dominance of left-
handed patients. An fMRI study reported that language domi-
nance of left handers was left in 76%, bilateral in 14%, and right
in 10% (Pujol et al., 1999). Another recent fMRI study yielded
similar results (Szaflarski et al., 2002). Loring et al. (1990)
reported that Wada test results for left-handed patients showed
exclusive left dominance in 77%, bilateral dominance in 21%
(left > right in 13%, left < right in 4%), and exclusive right
dominance in 2%. Thus, the incidence of atypical language
lateralization in left-handers is higher than the 4–6% in right-
handers (Pujol et al., 1999; Springer et al., 1999). However,
three-fourths of left-handers are left language dominant. This
means language dominance in left-handers has considerable
interindividual variation and handedness does not serve as an
indicator of language lateralization. The rather low correlation
between the LI and handedness in this study is consistent with
this conclusion. Comparison with the Wada test is indispensable
to validate noninvasive estimation of language lateralization. In
the present study, 4 of 20 patients were left-handed, and 1 patient
(case 4) converted to right-handedness but was natively left-
handed. In these left-handed patients, SAM analysis found that 3
were right dominant, 1 was bilateral, and 1 was left dominant.
Although our study population was small and the incidence of
atypical language lateralization was different from that found in
previous studies, the results of SAM analysis were congruent
with those of the Wada test for the left-handers.
In conclusion, we successfully showed with SAM the multifo-
cal regional oscillatory changes evoked by a language task and
localized these oscillatory changes with a statistical estimate.
Laterality of beta or low gamma ERD in the IFG or MFG is a
good indicator of the side of language dominance. Language
dominance estimated by the LI with these ERDs was congruent
with the results of the Wada test. SAM analysis could be useful as a
noninvasive alternative to the Wada test.
Acknowledgment
This work was supported in part by Grants-in-Aid for Scientific
Research (15300202, 15300159, 14657342) from the Japanese
Ministry of Education, Science and Culture.
References
Adcock, J.E., Wise, R.G., Oxbury, J.M., Oxbury, S.M., Matthews, P.M.,
2003. Quantitative fMRI assessment of the differences in lateralization
of language-related brain activation in patients with temporal lobe ep-
ilepsy. NeuroImage 18 (2), 423–438.
Baillet, S., Mosher, J.C., Leahy, R.M., 2001. Electromagnetic brain map-
ping. IEEE Signal Process. Mag. 18, 14–30.
Benson, R.R., FitzGerald, D.B., LeSueur, L.L., Kennedy, D.N., Kwong,
K.K., Buchbinder, B.R., Davis, T.L., Weisskoff, R.M., Talavage, T.M.,
Logan, W.J., Cosgrove, G.R., Belliveau, J.W., Rosen, B.R., 1999. Lan-
guage dominance determined by whole brain functional MRI in patients
with brain lesions. Neurology 52, 798–809.
Binder, J.R., Swanson, S.J., Hammeke, T.A., Morris, G.L., Mueller, W.M.,
Fischer, M., Benbadis, S., Frost, J.A., Rao, S.M., Haughton, V.M.,
1996. Determination of language dominance using functional MRI: a
comparison with the Wada test. Neurology 46, 978–984.
Braeutigam, S., Bailey, A.J., Swithenby, S.J., 2001. Phase-locked gamma
band responses to semantic violation stimuli. Brain Res. Cogn. Brain
Res. 10, 365–377.
Eulitz, C., Maess, B., Pantev, C., Friderci, A.D., Feige, B., Elbert, T.,
1996. Oscillatory neuromagnetic activity induced by language and
non-language stimuli. Brain Res. Cogn. Brain Res. 4, 121–132.
Fiez, J.A., Petersen, S.E., 1998. Neuroimaging studies of word reading.
Proc. Natl. Acad. Sci. U. S. A. 95 (3), 914–921.
Frith, C.D., Friston, K.J., Liddle, P.F., Frackowiak, R.S., 1991. A PET
study of word finding. Neuropsychologia 29 (12), 1137–1148.
Fujimaki, N., Miyauchi, S., Putz, B., Sasaki, Y., Takino, R., Sakai, K.,
Tamada, T., 1999. Functional magnetic resonance imaging of neural
activity related to orthographic, phonological, and lexico-semantic judg-
ments of visually presented characters and words. Hum. Brain Mapp.
8 (1), 44–59.
Helenius, P., Salmelin, R., Service, E., Connolly, J.F., 1998. Distinct time
courses of word and context comprehension in left temporal cortex.
Brain 121, 1133–1142.
Hirata, M., Kato, A., Ninomiya, H., Taniguchi, M., Kishima, T., Yoshi-
mine, T., 2002a. Spatiotemporal distributions of brain oscillation
during silent reading. In: Hirata, K., Koga, Y., Nagata, K., Yamazaki,
K. (Eds.), Recent Advances in Human Brain MappingExcerpta
Medica International Congress Series, vol. 1232. Elsevier, Amster-
dam, pp. 35–39.
Hirata, M., Kato, A., Taniguchi, M., Ninomiya, H., Cheyne, D., Robinson,
S.E., Maruno, M., Kumura, E., Ishii, R., Hirabuki, N., Nakamura, H.,
Yoshimine, T., 2002b. Frequency-dependent spatial distribution of hu-
man somatosensory evoked neuromagnetic fields. Neurosci. Lett. 318,
73–76.
Howard, D., Patterson, K., Wise, R., Brown, W.D., Friston, K., Weiller, C.,
Frackowiak, R., 1992. The cortical localization of the lexicons. Positron
emission tomography evidence. Brain 115, 1769–1782.

M. Hirata et al. / NeuroImage 23 (2004) 46–53 53
Ihara, A., Hirata, M., Sakihara, K., Izumi, H., Takahashi, Y., Kono, K.,
Imaoka, H., Osaki, Y., Kato, A., Yoshimine, T., Yorifuji, S., 2003a.
Gamma-band desynchronization in language areas reflects syntactic
process of words. Neurosci. Lett. 339, 135–138.
Ihara, A., Hirata, M., Yanagihara, K., Ninomiya, H., Imai, K., Ishii, R.,
Osaki, Y., Sakihara, K., Izumi, H., Imaoka, H., Kato, A., Yoshimine, T.,
Yorifuji, S., 2003b. Neuromagnetic gamma-band activity in the primary
and secondary somatosensory areas. NeuroReport 14 (2), 273–277.
Kober, H., Moller, M., Nimsky, C., Vieth, J., Fahlbusch, R., Ganslandt, O.,
2001. New approach to localize speech relevant brain areas and hemi-
spheric dominance using spatially filtered magnetoencephalography.
Hum. Brain Mapp. 4, 236–250.
Lehericy, S., Cohen, L., Bazin, B., Samson, S., Giacomini, E., Rougetet,
R., Hertz-Pannier, L., Le Bihan, D., Marsault, C., Baulac, M., 2000.
Functional MR evaluation of temporal and frontal language dominance
compared with the Wada test. Neurology 54, 1625–1633.
Levelt, W.J., Praamstra, P., Meyer, A.S., Helenius, P., Salmelin, R., 1998.
An MEG study of picture naming. J. Cogn. Neurosci. 10, 553–567.
Loring, D.W., Meador, K.J., Lee, G.P., Murro, A.M., Smith, J.R., Flanigin,
H.F., Gallagher, B.B., King, D.W., 1990. Cerebral language lateraliza-
tion: evidence from intracarotid amobarbital testing. Neuropsychologia
28, 831–838.
Martin, N.A., Beatty, J., Johnson, R.A., Collaer, M.L., Vinuela, F., Becker,
D.P., Nuwer, M.R., 1993. Magnetoencephalographic localization of a
language processing cortical area adjacent to a cerebral arteriovenous
malformation. Case report. J. Neurosurg. 79, 584–588.
McCandliss, B.D., Cohen, L., Dehaene, S., 2003. The visual word form
area: expertise for reading in the fusiform gyrus. Trends Cogn. Sci. 7
(7), 293–299.
McCarthy, G., Blamire, A.M., Rothman, D.L., Gruetter, R., Shulman, R.G.,
1993. Echo-planar magnetic resonance imaging studies of frontal cortex
activation during word generation in humans. Proc. Natl. Acad. Sci.
U. S. A. 90 (11), 4952–4956.
Mesulam, M.M., 1998. From sensation to cognition. Brain 121,
1013–1052.
Oldfield, R.C., 1971. The assessment and analysis of handedness: the
Edinburgh inventory. Neuropsychologia 9, 97–113.
Papanicolaou, A.C., Simos, P.G., Breier, J.I., Zouridakis, G., Willmore, L.J.,
Wheless, J.W., Constantinou, J.E.C., Maggio, W.W., Gormley, W.B.,
1999. Magnetoencephalographic mapping of language-specific cortex.
J. Neurosurg. 90, 85–93.
Petersen, S.E., Fox, P.T., Posner, M.I., Mintun, M., Raichle, M.E., 1988.
Positron emission tomographic studies of the cortical anatomy of sin-
gle-word processing. Nature 331, 585–589.
Pfurtscheller, G., 1992. Event-related synchronization (ERS): an electro-
physiological correlate of cortical areas at rest. Electroencephalogr.
Clin. Neurophysiol. 83, 62–69.
Pfurtscheller, G., Aranibar, A., 1977. Event-related cortical desynchroniza-
tion detected by power measurements of scalp EEG. Electroencepha-
logr. Clin. Neurophysiol. 2, 817–826.
Price, C.J., Devlin, J.T., 2003. The myth of the visual word form area.
NeuroImage 19 (3), 473–481.
Pujol, J., Deus, J., Losilla, J.M., Capdevila, A., 1999. Cerebral lateraliza-
tion of language in normal left-handed people studied by functional
MRI. Neurology 52 (5), 1038–1043.
Pulvermuller, F., Mohr, B., 1996. The concept of transcortical cell assem-
blies: a key to the understanding of cortical lateralization and interhemi-
spheric interaction. Neurosci. Biobehav. Rev. 20, 557–566.
Pulvermuller, F., Birbaumer, N., Lutzenberger, W., Mohr, B., 1997. High-
frequency brain activity: its possible role in attention, perception and
language processing. Prog. Neurobiol. 52, 427–445.
Robinson, S.E., Rose, D.G., 1992. Current source image estimation by
spatially filtered MEG. In: Hoke, M., Erne, S.N., Okada, Y.C., Romani,
G.L. (Eds.), Biomagnetism: Clinical Aspects. Elsevier, Amsterdam, pp.
761–765.
Robinson, S.E., Vrba, J., 1999. Functional neuro-imaging by synthetic
aperture magnetometry (SAM). In: Yoshimoto, T., Kotani, M., Karibe,
H., Nakasato, N. (Eds.), Recent Advances in Biomagnetism. Tohoku
Univ. Press, Sendai, pp. 302–305.
Salmelin, R., Hari, R., Lounasmaa, O.V., Sams, M., 1994. Dynamics of
brain activation during picture naming. Nature 368, 463–465.
Springer, J.A., Binder, J.R., Hammeke, T.A., Swanson, S.J., Frost, J.A.,
Bellgowan, P.S., Brewer, C.C., Perry, H.M., Morris, G.L., Mueller,
W.M., 1999. Language dominance in neurologically normal and epi-
lepsy subjects: a functional MRI study. Brain 122, 2033–2046.
Szaflarski, J.P., Binder, J.R., Possing, E.T., McKiernan, K.A., Ward, B.D.,
Hammeke, T.A., 2002. Language lateralization in left-handed and am-
bidextrous people: fMRI data. Neurology 59 (2), 238–244.
Szymanski, M., Perry, D.W., Gage, N.M., Rowley, H.A., Walker, J.,
Berger, M.S., Roberts, T.P.L., 2001. Magnetic source imaging of late
evoked field responses to vowels: toward an assessment of hemispheric
dominance for language. J. Neurosurg. 94, 445–453.
Taniguchi, M., Kato, A., Fujita, N., Hirata, M., Tanaka, H., Kihara, T.,
Ninomiya, H., Hirabuki, N., Nakamura, H., Robinson, S.E., Cheyne,
T., Yoshimine, T., 2000. Movement-related desynchronization of the
cerebral cortex studied with spatially filtered magnetoencephalography.
NeuroImage 12, 298–306.
Tarkiainen, A., Helenius, P., Hansen, P.C., Cornelissen, P.L., Salmelin, R.,
1999. Dynamics of letter string perception in the human occipitotem-
poral cortex. Brain 122 (Pt 11), 2119–2132.
Wada, J., Rasmussen, T., 1960. Intracarotid injection of Sodium Amytal for
the lateralization of cerebral speech dominance. Experimental and clin-
ical observations. J. Neurosurg. 17, 266–282.
Xiang, J., Wilson, D., Otsubo, H., Ishii, R., Chaung, S., 2001. Neuromag-
netic spectral distribution of implicit processing of words. NeuroReport
12, 3923–3927.
Related Documents