Research Article TheScientificWorldJOURNAL (2010) 10, 1318–1329 TSW Environment ISSN 1537-744X; DOI 10.1100/tsw.2010.127 *Corresponding author. ©2010 with author. Published by TheScientificWorld; www.thescientificworld.com 1318 Determination of Hazardous VOCs and Nicotine Released from Mainstream Smoke by the Combination of the SPME and GC- MS Methods Sudhir Kumar Pandey and Ki-Hyun Kim* Atmospheric Environment Laboratory, Department of Environment and Energy, Sejong University, Seoul, Korea E-mail: [email protected] Received February 10, 2010; Revised May 17, 2010; Accepted May 22, 2010; Published July 6, 2010 In this study, the contents of nicotine and volatile organic compounds (VOCs) in mainstream smoke (MSS) were analyzed using samples of four cigarette types consisting of two common brands (R and E) with full (F) and light (L) flavor, coded with R-F, R-L, E- F, and E-L. These cigarettes were also analyzed after removing the filter portions with the assignment of a new sample code of (N) as the third letter (e.g., R-L-N). A total of 44 VOCs (including nicotine) were quantified by the combination of the SPME and GC-MS methods. Out of the 44 VOCs, 10 were identified as hazardous air pollutants listed by the U.S. EPA, while their concentrations exceeded the reference exposure limits set by various agencies. A clear distinction was apparent in the concentration levels of VOCs between different brands or between full and light flavors. Nicotine concentrations varied greatly between different cigarettes types of the R brand, whereas such changes were insignificant in the counterpart E brand. This thus suggests that light-flavor cigarettes do not necessarily guarantee low doses of carcinogens (and tar) than regular cigarettes, as their differences can be balanced by the inhaling behavior of the smoker. KEYWORDS: cigarette, smoke, solid phase microextraction, volatile organic compounds, nicotine INTRODUCTION Tobacco smoke has been classified by the International Agency for Research on Cancer (IARC) as a known human carcinogen[1]. To the best of our knowledge, there is no threshold level of exposure to cigarette smoke to date. However, there is conclusive evidence to indicate that long-term smoking greatly increases the likelihood of developing numerous fatal conditions[2]. Nearly 4,800 chemical compounds have been identified as smoke components, including 60 known carcinogens[3]. However, as the analysis of smoke is hampered by its dynamic nature, only about 400 compounds have been subject to quantification. For this reason, there is a pressing need to analyze quantitatively all harmful components released via cigarette smoking in the form of environmental tobacco smoke (ETS).

Welcome message from author
This document is posted to help you gain knowledge. Please leave a comment to let me know what you think about it! Share it to your friends and learn new things together.
Transcript
Research Article TheScientificWorldJOURNAL (2010) 10, 1318–1329 TSW Environment ISSN 1537-744X; DOI 10.1100/tsw.2010.127
*Corresponding author. ©2010 with author. Published by TheScientificWorld; www.thescientificworld.com
1318
Determination of Hazardous VOCs and Nicotine Released from Mainstream Smoke by the Combination of the SPME and GC-MS Methods
Sudhir Kumar Pandey and Ki-Hyun Kim*
Atmospheric Environment Laboratory, Department of Environment and Energy, Sejong University, Seoul, Korea
E-mail: [email protected]
Received February 10, 2010; Revised May 17, 2010; Accepted May 22, 2010; Published July 6, 2010
In this study, the contents of nicotine and volatile organic compounds (VOCs) in mainstream smoke (MSS) were analyzed using samples of four cigarette types consisting of two common brands (R and E) with full (F) and light (L) flavor, coded with R-F, R-L, E-F, and E-L. These cigarettes were also analyzed after removing the filter portions with the assignment of a new sample code of (N) as the third letter (e.g., R-L-N). A total of 44 VOCs (including nicotine) were quantified by the combination of the SPME and GC-MS methods. Out of the 44 VOCs, 10 were identified as hazardous air pollutants listed by the U.S. EPA, while their concentrations exceeded the reference exposure limits set by various agencies. A clear distinction was apparent in the concentration levels of VOCs between different brands or between full and light flavors. Nicotine concentrations varied greatly between different cigarettes types of the R brand, whereas such changes were insignificant in the counterpart E brand. This thus suggests that light-flavor cigarettes do not necessarily guarantee low doses of carcinogens (and tar) than regular cigarettes, as their differences can be balanced by the inhaling behavior of the smoker.
KEYWORDS: cigarette, smoke, solid phase microextraction, volatile organic compounds, nicotine
INTRODUCTION
Tobacco smoke has been classified by the International Agency for Research on Cancer (IARC) as a
known human carcinogen[1]. To the best of our knowledge, there is no threshold level of exposure to
cigarette smoke to date. However, there is conclusive evidence to indicate that long-term smoking greatly
increases the likelihood of developing numerous fatal conditions[2]. Nearly 4,800 chemical compounds
have been identified as smoke components, including 60 known carcinogens[3]. However, as the analysis
of smoke is hampered by its dynamic nature, only about 400 compounds have been subject to
quantification. For this reason, there is a pressing need to analyze quantitatively all harmful components
released via cigarette smoking in the form of environmental tobacco smoke (ETS).

Pandey and Kim: Hazardous VOCs and Nicotine from Smoke TheScientificWorldJOURNAL (2010) 10, 1318–1329
1319
Most analytical methods employed in ETS analysis have been developed on the basis of gas
chromatography (GC) techniques with a special emphasis on some selective gaseous phase markers, such
as nicotine and related nitrogen compounds, polycyclic aromatic hydrocarbons (PAHs), and a few volatile
organic compounds (VOCs). The GC-flame ionization detection (FID) system has been successfully
employed for the analysis of aromatic VOCs and total VOCs (TVOCs) contained in the ETS
samples[4,5,6]. The use of the nitrogen-selective detectors (such as NPD) was also favored by some
researchers for the quantification of nicotine or nitrogen-related compounds[5,7,8]. In recent years, mass
spectrometry (MS) with GC has been helpful to determine selective markers such as nicotine, 3-ethyl
pyridine, and 2-5 dihydrofuran[8,9,10,11].
In the present work, solid phase microextraction (SPME) combined with a GC-MS system was used
to determine the dominant components existing in volatile fractions of mainstream smoke (MSS). The
SPME method was selected for this study by considering its ease of operation, cost, and solvent-free
nature. For this purpose, two different brands of cigarettes, each of which has both full- (regular) and
light-flavor cigarettes, were selected and analyzed for their major volatile components released via MSS
by focusing mainly on the toxic chemicals from the human health point of view. The classification of
light and full flavor refers to the manufacturers’ criteria based on tar and nicotine content that is relatively
low for the light-flavor type than their full-flavor counterparts. Some ancillary experiments were also
performed to observe, from different respects, the efficiency of filters in controlling the release of the
harmful components. Moreover, the filter portion of each cigarette type was also evaluated for the
possible release of any harmful volatile chemicals.
MATERIALS AND METHODS
Collection of MSS
For the purpose of our study, four types of cigarette brands available in the Korean marketplace were
selected with the original brand name (R and E) and by their tar and nicotine contents (light [L] vs. full
[F] flavor), based on the classification of the manufacturers (e.g., R-L for light-flavor type of cigarette
brand R). The tar and nicotine contents mentioned by the manufacturers were 4.50 and 0.50 mg (R-F),
1.00 and 0.10 mg (R-L), 0.50 and 0.05 mg (E-F), and 0.10 and 0.01 mg (E-L), respectively. The other
details on these cigarette samples (i.e., cigarette length, filter length, diameter, and weight) are also
presented in Table 1. These cigarette samples were also modified by detaching the filter portion with a
sharp knife. Subsequently, these modified cigarette samples were assigned with the sample codes of R-L-
N, R-F-N, E-L-N, and E-F-N. Here, the third letter N denotes ―no‖ filter. In this way, four different types
of raw cigarette samples (R-L, R-F, E-L, and E-F [with filter] and the four additional modified types (R-
L-N, R-F-N, E-L-N, and E-F-N [without filter]) were analyzed for their smoke composition (Table 1).
The cigarette sticks were burned at their lit end, and the smoke samples were collected in 10-L Tedlar
bags (product code: 232-08, SKC, USA) connected to the mouth end of the cigarette through a vacuum
sampler (ACEN, Korea), with the backup of air entering into the Tedlar bag. The flow rate of incoming
air was maintained at a constant level (approximately 100 mL min–1
) by controlling the opening valve of
the lung sampler in a clean room environment. As the samples were highly concentrated, they were
further diluted (by 100 times in ultrapure nitrogen) in a 1-L Tedlar bag to fit in the MS calibration range.
In addition to collection of MSS, the torn-apart filters from the sample codes of R-L-N, R-F-N, E-L-N,
and E-F-N were also analyzed for any possible harmful chemical release. For this purpose, 1 L of
ultrapure nitrogen was passed (at a flow rate of 100 mL min–1
to match with the MSS sampling) through
each detached filter portion and collected in Tedlar bags for final determination with the SPME-GC-MS
method in a way similar to the MSS samples (Table 1).
Pandey and Kim: Hazardous VOCs and Nicotine from Smoke TheScientificWorldJOURNAL (2010) 10, 1318–1329
1320
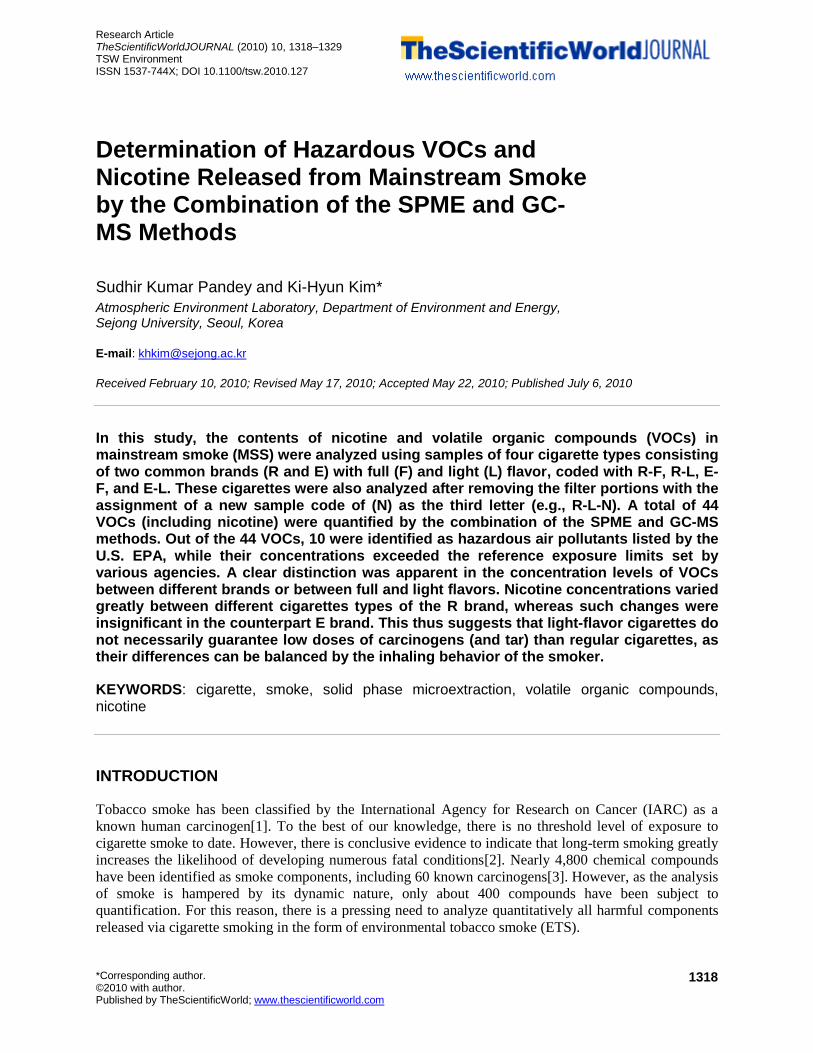
TABLE 1 Basic Information Regarding Different Cigarette Brands Analyzed for MSS Study
Order Cigarette Brand
Flavor Cigarette Length (mm)
Filter Length (mm)
Diameter (mm)
Weight (gm)
Type of Sample
a
Abbreviation
1 R Light (L) 84 28 25.1 0.82 With filter R-Lb
2 Without filter R-L-N
3 R Full (F) With filter R-Fb
4 Without filter R-F-N
5 E Light (L) 100 30 15.7 0.49 With filter E-Lb
6 Without filter E-L-N
7 E Full (F) With filter E-Fb
8 Without filter E-F-N
a MSS samples for each brand (or sample code) were collected in Tedlar bags connected through a lung sampler
after burning three individual cigarette sticks consecutively for each sample type. All MSS samples were then collected on DVB-PDMS fiber by the SPME method. These samples were thermally desorbed in a GC injector and detected by a mass spectrometer.
b In addition to eight cigarette samples, the filter portions of each cigarette were also analyzed for possible VOC
release after removing the filters from each respective brand and passing the pure N2 through the torn-apart filters. These samples were also analyzed by the same analytical methodologies as those of the MSS samples.
SPME Analysis
In order to induce the adsorption of gaseous components from MSS, SPME fiber (65 μm
divinylbenzene/polydimethylsiloxane [DVB/PDMS], 57310-U [product number], Supelco, USA) was
inserted into a 1-L Tedlar bag through its septum. Extraction of target compounds was performed at room
temperature (25°C) for an exposure duration of 10 min. The desorption of smoke components was then
accomplished by the insertion of an SPME fiber into the GC injector through a SPME injection sleeve (2-
6375, Supelco) for a duration of 5 min. The injector system was operated at 230°C with a split ratio of
1:10.
Chromatographic Separation and MS Conditions
The GC-MS system used in this study was a Shimadzu Gas Chromatograph 2010 QP plus (Shimadzu
Scientific Instrument, Japan). For the analysis of smoke samples, our GC system was operated at the
following temperature settings: (1) T (initial): 80oC (5 min), (2) T (ramping): 10
oC min
–1 rate, and (3) T
(final): 200oC (20 min). Chromatographic separation was achieved by Vocol column (60 m × 0.32 mm
i.d. and 1.8-µm film thickness: Supelco) at a column flow rate of 1.2 mL min–1
(99.999% pure He as
carrier gas). The column flow rate was maintained in the linear velocity mode. Each running cycle was
programmed to end at 37-min intervals.
As the detector was a quadrupole mass spectrometer, ion source of electron impact (EI) at 70 eV was
used for ionization with ion source temperature = 200oC, interface temperature = 200
oC, and detector
threshold = 100. The total ion count (TIC) mode was applied to acquire the maximum number of
compounds. For the TIC mode, a mass range of 35–250 m/z was selected to avoid the detection of the
common air matrix.

Pandey and Kim: Hazardous VOCs and Nicotine from Smoke TheScientificWorldJOURNAL (2010) 10, 1318–1329
1321
Quantification of VOCs
For the quantification of all the VOCs, a relationship was established for three VOCs (benzene [B],
toluene [T], and xylene [X]) between the carbon ratio and the slope ratio based on a four-point calibration
(10, 20, 40, and 200 ppb) of gaseous standard of BTX[12]. Such a relationship expressed in terms of the
regression equation was used to estimate concentrations of other VOCs detected by our GC-MS system.
To prepare the gaseous working standards (G-WS) of BTX, a primary standard (PS) gas was purchased at
20-ppm concentration (Ri Gas, Dae Jeon, Korea). For the preparation of G-WS, the PS was mixed
proportionally with N2 in a 1-L Tedlar bag. This mixing stage for G-WS was completed by a single-step
dilution of the PS to the desired concentration with the aid of a gas-tight syringe. For instance, for the
preparation of a 10-ppb concentration WS, 0.5 mL of PS gas was mixed with ultrapure nitrogen (999.5
mL) to make the final volume of 1 L. The detection limit (DL) values of VOCs were estimated in the sub-
ppb range (e.g., in the range of 0.09 ppb [or 0.50 ng] for p-menthene to 0.44 ppb [or 0.74 ng] for
acetonitrile) by considering the minimal peak area distinguishable from noise. The relative standard error
(RSE) values were below the 5% level for a triplicate analysis of a 50-ppb gaseous standard mixture of
benzene, toluene, and p-xylene.
RESULTS AND DISCUSSION
General Composition of MSS Across Different Brands
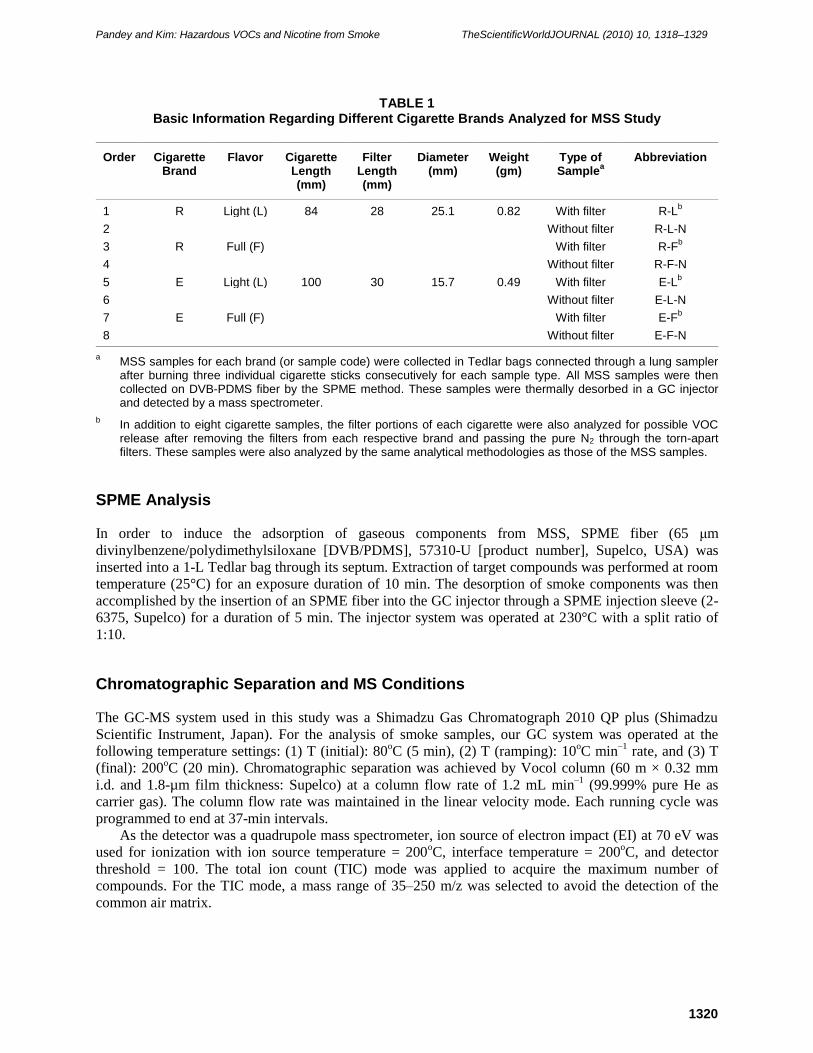
In Table 2, the results of our MSS analysis are summarized with respect to the concentration values of all
the VOCs and nicotine. Although MSS may contain an enormous number of compounds, its
quantification in this study was confined to a total of 44 compounds because of analytical feasibility
(instrumental setups in this study: e.g., fiber characteristics of SPME) (Table 2). Nicotine was present in
all the samples, as the most frequently quoted marker of ETS, regardless of brand or flavor type. Note that
the environmental protection agency (EPA) of the U.S. has designated a total of 187 compounds in the list
of hazardous air pollutants (HAPs)[13]. In order to classify the compounds present in cigarette smoke in
this respect, the HAPs quantified in this study were evaluated in terms of their magnitude in concentration
values (Table 2). As shown in Table 2, 10 compounds determined in this study belong to the HAP list. To
evaluate the harmful nature of these air toxins, their concentrations were compared against various
reference exposure limits (REL) (Fig. 1). As shown in Fig. 1, in the case of brand R (either light- [R-L] or
full-flavor type [R-F]), many HAPs determined in this study (i.e., benzene, toluene, meta- and para-
xylene, acetonitrile, methyl ethyl ketone, ethyl benzene, phenol, and styrene) exceeded the prescribed
REL. On the other hand, in the case of brand E, toluene alone surpassed such criteria. In order to learn
more about the relationship between odorant concentration and nuisance level, various agencies (such as
the EPA and the Occupational Safety and Health Administration [OSHA] of the U.S.) have specified odor
threshold values for numerous compounds. According to the odor threshold values for the above HAPs,
some compounds, like benzene, ethyl benzene, and styrene, were found to exceed their threshold values
in most of R rand sample types. However, brand E cigarettes exhibited such exceedance only in the case
of styrene.
When the concentrations of MSS components were compared between two brands as a group (i.e., R
and E) or between the four sub-brands (i.e., R-L vs. R-F, or E-L vs. E-F), their patterns were
distinguished from a number of perspectives. For instance, the concentrations of many VOCs in cigarettes
of full-flavor products (R-F or E-F) were higher by up to two times than those in light-flavor cigarettes
(R-L or E-L). On the other hand, when this comparison is extended to the four sub-brands (i.e., R-L vs. E-
L, or R-F vs. E-F), their concentrations in R brand were many times higher than their E brand
counterparts.
Pandey and Kim: Hazardous VOCs and Nicotine from Smoke TheScientificWorldJOURNAL (2010) 10, 1318–1329
1322
TABLE 2 Concentration of Nicotine and VOCs Released in the Form of MSS from Different Brands of
Cigarettes with Eight Different combinations
Order Compound
Concentration (ppb) Detection Limit (ppb) E-L E-L-N E-F E-F-N R-L R-L-N R-F R-F-N
1 Benzene #a 801 2,417 1,295 2,079 6,427 15,724 10,149 9,561 0.14
2 Toluene # 4,910 9,640 7,691 8,440 24,281 38,041 28,392 29,563 0.12
3 m,p-Xylene # 515 1872 1079 1693 2,286 3529 2423 5683 0.11
4 Acetic acid 1,127 3,143 1,776 2741 2,569 6,386 3,890 8,191 0.42
5 Cyclopropane, ethylidene*b 0.18 0.18 0.18 0.18 1,815 5,794 3,485 11,450 0.17
6 Dimethyl ketone 430 1,157 679 691 3,476 7,413 5,666 7,574 0.28
7 Acetonitrile #* 0.44 0.44 0.44 0.44 1,332 2,326 2,180 2,040 0.44
8 2,3-Butanedione 524 860 568 673 2,976 4,464 4,059 3,459 0.21
9 Methyl ethyl ketone # 308 541 347 421 2,380 4,464 3,238 3,111 0.21
10 Isovaleraldehyde 121 144 113 281 1,013 1,534 1,322 1,030 0.21
11 Methyl isopropyl ketone* 0.18 0.18 0.18 0.18 2,779 6,469 4,285 7,075 0.17
12 Hydroxyacetone* 2,159 3,414 2,374 2809 0.29 0.29 0.29 0.29 0.29
13 2,3-Pentanedione 244 488 394 407 1,826 2,004 1,900 1,950 0.17
14 2,5-Dimethylfuran 459 909 766 805 2,572 4,859 3,610 4,715 0.14
15 Propylene glycol* 2,540 7,219 7,371 9514 0.22 0.22 0.22 0.22 0.22
16 Methyl isopropenyl ketone* 367 1,034 0.18 841 5,706 5,360 3,815 46,915 0.17
17 Ethyl benzene # 1,021 3,172 1,952 2795 3,375 5,587 3,622 13,680 0.11
18 Cyclopentanone 403 905 620 732 4,791 2,944 2,425 4,571 0.17
19 2-Methyl-pyridine 555 1,051 665 858 992 851 762 3,252 0.14
20 2-Methyl pyrazine 839 1,821 1,309 435 1,967 2,876 2,112 6,406 0.15
21 Phenol # 1,560 1,458 521 1513 5,825 9,358 6,185 13,708 0.14
22 l-Limonene 2,441 8,199 4,599 6913 7,128 8,292 5,932 40,072 0.08
23 Acetoxyacetone* 0.18 0.18 0.18 715 0.18 0.18 0.18 0.18 0.18
24 2-Cyclopentenone* 1,512 3,219 0.18 2710 0.18 4,749 3,202 28,800 0.17
25 Methyl isobutyl ketone #* 0.15 484 0.15 0.15 0.15 0.15 0.15 906 0.15
26 Isoamyl cyanide* 0.15 455 244 0.15 0.15 0.15 0.15 1,728 0.15
27 Nicotine 7.20 6.96 5.34 5.03 6.90 13.2 15.7 43.7 0.09
28 Styrene # 479 1,001 748 884 1,480 2,935 2,842 5,531 0.11
29 Ethanol* 0.44 0.44 0.44 0.44 1,234 0.44 1,009 0.44 0.44
30 Isobutyraldehyde* 0.15 0.15 0.15 0.15 0.15 0.15 316 253 0.15
31 2-Pentyl alcohol* 0.18 0.18 0.18 0.18 2,185 4,814 0.18 7,050 0.18
32 3-Methyl-pyridine* 606 0.15 0.15 1130 0.15 0.15 0.15 2,396 0.15
33 2-Nonenal* 0.10 0.10 0.10 0.10 0.10 0.10 0.10 1,093 0.10
34 2,6-Dimethyl-2,6-octadiene* 0.09 0.09 0.09 0.09 0.09 0.09 0.09 2,753 0.09
35 2,3,6-Trimethyl-1,5-heptadiene* 0.09 0.09 0.09 0.09 0.09 0.09 0.09 3,652 0.09
36 1,2,3-Trimethylbenzene* 0.10 0.10 0.10 0.10 0.10 0.10 0.10 4,802 0.10
37 p-Menth-1-ene* 0.09 0.09 318 463 0.09 0.09 131 3,089 0.09
38 Acetaldeyde #* 0.44 0.44 0.44 0.44 0.44 1,091 0.44 0.44 0.44
39 Butyl cyanide* 0.15 320 0.15 0.15 0.15 0.15 793 0.15 0.15
40 Isopentadiene 206 440 288 330 0.15 0.15 0.15 0.15 0.15
41 Methyl pyruvate* 411 1,029 481 965 0.22 0.22 0.22 0.22 0.22
42 2-Methyl-2-cyclopentenone* 1,564 0.15 0.15 0.15 0.15 0.15 0.15 0.15 0.15
43 3-Hydroxy-2-butanone* 0.22 577 499 597 0.22 0.22 0.22 0.22 0.22
44 4-Methylpentanenitrile* 0.15 0.15 0.15 393 0.15 0.15 0.15 0.15 0.15
a Compounds marked with “#” are listed in the HAP list of the U.S. EPA.
b For each compound marked with “*”, the lowest concentration corresponds to its detection limit (DL) value.

Pandey and Kim: Hazardous VOCs and Nicotine from Smoke TheScientificWorldJOURNAL (2010) 10, 1318–1329
1323
0
2000
4000
6000
8000
10000
12000
R-L E-L R-F E-F
Cigarette samples
Co
nce
ntr
atio
n (
pp
b)
0
5000
10000
15000
20000
25000
30000
R-L E-L R-F E-F
Cigarette samples
Co
nce
ntr
atio
n (
pp
b)
(A) Benzene (B) Toluene
0
500
1000
1500
2000
2500
3000
R-L E-L R-F E-F
Cigarette samples
Co
nce
ntr
atio
n (
pp
b)
0
500
1000
1500
2000
2500
R-L E-L R-F E-F
Cigarette samples
Co
nce
ntr
atio
n (
pp
b)
(C) m,p-Xylene (D) Acetonitrile
0
1000
2000
3000
4000
5000
6000
R-L E-L R-F E-F
Cigarette samples
Co
nce
ntr
atio
n (
pp
b)
0
2000
4000
6000
8000
10000
12000
R-L E-L R-F E-F
Cigarette samples
Co
nce
ntr
atio
n (
pp
b)
(E) Methyl ethyl ketone (F) Ethyl benzene
FIGURE 1. Comparison of concentration levels of HAPs (listed by the U.S. EPA) detected in different MSS samples with the exposure limits
and odor threshold values prescribed by various agencies: (1) acute minimum risk levels (MRLs) by ATSDR for benzene, toluene, m-p-xylenes, acetonitrile, ethyl benzene, and styrene; (2) REL of NIOSH for acetaldehyde and phenol; and (3) reference concentration (RFc) of MEK by the
U.S. EPA. Dotted lines show the exposure limits prescribed by various agencies and straight lines show the odor threshold values given by
various agencies (i.e., benzene, toluene, methyl ethyl ketone, and styrene by the U.S. EPA and m-p-xylene by OSHA). Continued next page.
Pandey and Kim: Hazardous VOCs and Nicotine from Smoke TheScientificWorldJOURNAL (2010) 10, 1318–1329
1324
0
1000
2000
3000
4000
5000
6000
7000
R-L E-L R-F E-F
Cigarette samples
Co
nce
ntr
atio
n (
pp
b)
0
500
1000
1500
2000
2500
3000
R-L E-L R-F E-F
Cigarette samples
Co
nce
ntr
atio
n (
pp
b)
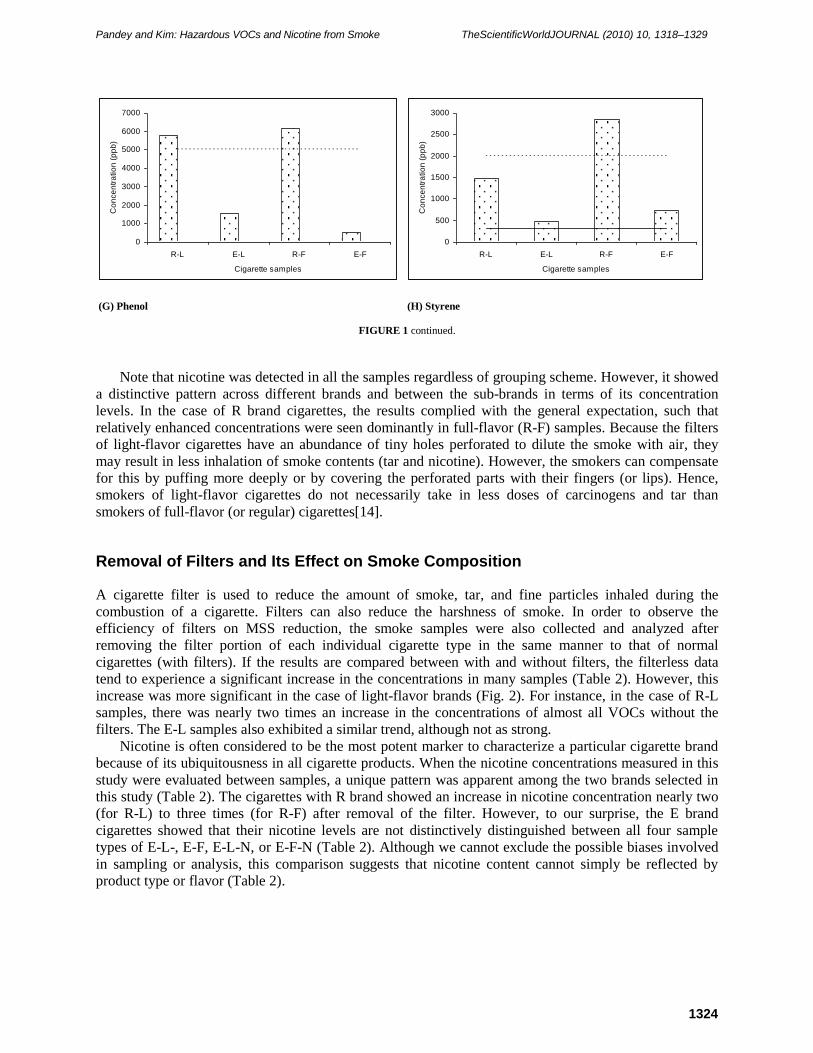
(G) Phenol (H) Styrene
FIGURE 1 continued.
Note that nicotine was detected in all the samples regardless of grouping scheme. However, it showed
a distinctive pattern across different brands and between the sub-brands in terms of its concentration
levels. In the case of R brand cigarettes, the results complied with the general expectation, such that
relatively enhanced concentrations were seen dominantly in full-flavor (R-F) samples. Because the filters
of light-flavor cigarettes have an abundance of tiny holes perforated to dilute the smoke with air, they
may result in less inhalation of smoke contents (tar and nicotine). However, the smokers can compensate
for this by puffing more deeply or by covering the perforated parts with their fingers (or lips). Hence,
smokers of light-flavor cigarettes do not necessarily take in less doses of carcinogens and tar than
smokers of full-flavor (or regular) cigarettes[14].
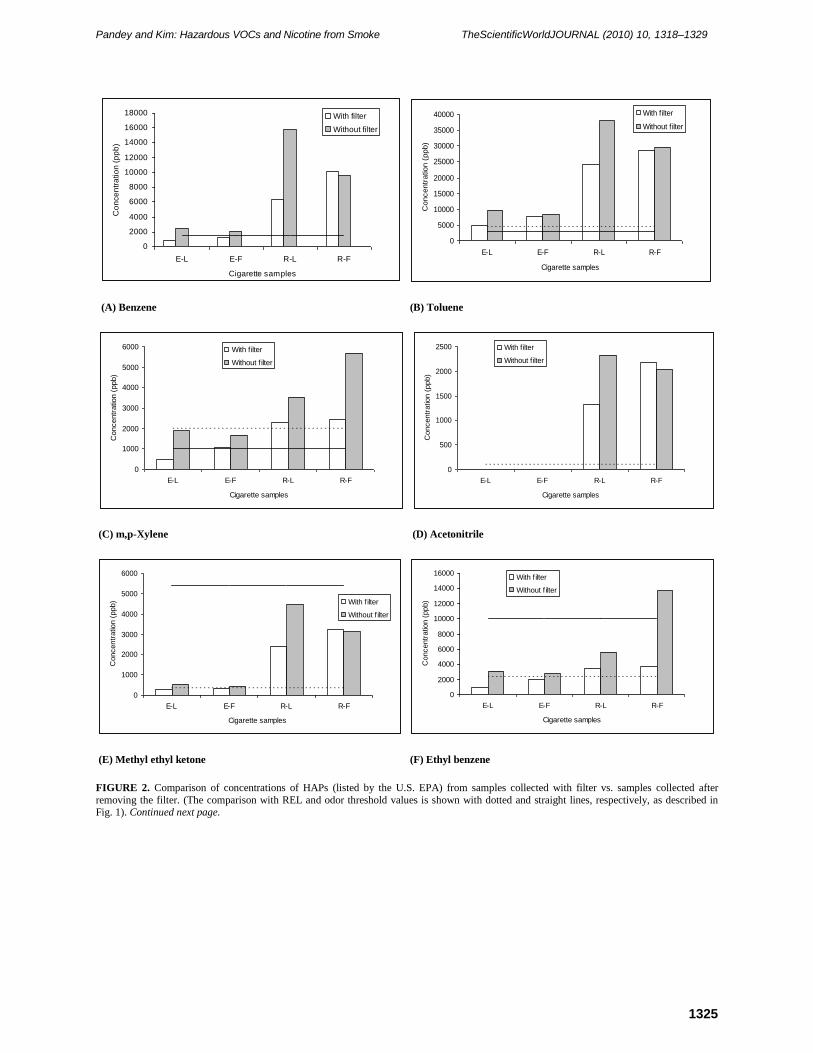
Removal of Filters and Its Effect on Smoke Composition
A cigarette filter is used to reduce the amount of smoke, tar, and fine particles inhaled during the
combustion of a cigarette. Filters can also reduce the harshness of smoke. In order to observe the
efficiency of filters on MSS reduction, the smoke samples were also collected and analyzed after
removing the filter portion of each individual cigarette type in the same manner to that of normal
cigarettes (with filters). If the results are compared between with and without filters, the filterless data
tend to experience a significant increase in the concentrations in many samples (Table 2). However, this
increase was more significant in the case of light-flavor brands (Fig. 2). For instance, in the case of R-L
samples, there was nearly two times an increase in the concentrations of almost all VOCs without the
filters. The E-L samples also exhibited a similar trend, although not as strong.
Nicotine is often considered to be the most potent marker to characterize a particular cigarette brand
because of its ubiquitousness in all cigarette products. When the nicotine concentrations measured in this
study were evaluated between samples, a unique pattern was apparent among the two brands selected in
this study (Table 2). The cigarettes with R brand showed an increase in nicotine concentration nearly two
(for R-L) to three times (for R-F) after removal of the filter. However, to our surprise, the E brand
cigarettes showed that their nicotine levels are not distinctively distinguished between all four sample
types of E-L-, E-F, E-L-N, or E-F-N (Table 2). Although we cannot exclude the possible biases involved
in sampling or analysis, this comparison suggests that nicotine content cannot simply be reflected by
product type or flavor (Table 2).
Pandey and Kim: Hazardous VOCs and Nicotine from Smoke TheScientificWorldJOURNAL (2010) 10, 1318–1329
1325
0
2000
4000
6000
8000
10000
12000
14000
16000
18000
E-L E-F R-L R-F
Cigarette samples
Co
nce
ntr
atio
n (
pp
b)
With filter
Without filter
0
5000
10000
15000
20000
25000
30000
35000
40000
E-L E-F R-L R-F
Cigarette samples
Concentr
ation (
ppb)
With f ilter
Without f ilter
(A) Benzene (B) Toluene
0
1000
2000
3000
4000
5000
6000
E-L E-F R-L R-F
Cigarette samples
Concentr
atio
n (
ppb)
With f ilter
Without f ilter
0
500
1000
1500
2000
2500
E-L E-F R-L R-F
Cigarette samples
Concentr
atio
n (
ppb)
With f ilter
Without f ilter
(C) m,p-Xylene (D) Acetonitrile
0
1000
2000
3000
4000
5000
6000
E-L E-F R-L R-F
Cigarette samples
Concentr
atio
n (
ppb) With f ilter
Without f ilter
0
2000
4000
6000
8000
10000
12000
14000
16000
E-L E-F R-L R-F
Cigarette samples
Concentr
atio
n (
ppb)
With f ilter
Without f ilter
(E) Methyl ethyl ketone (F) Ethyl benzene
FIGURE 2. Comparison of concentrations of HAPs (listed by the U.S. EPA) from samples collected with filter vs. samples collected after
removing the filter. (The comparison with REL and odor threshold values is shown with dotted and straight lines, respectively, as described in Fig. 1). Continued next page.

Pandey and Kim: Hazardous VOCs and Nicotine from Smoke TheScientificWorldJOURNAL (2010) 10, 1318–1329
1326
0
2000
4000
6000
8000
10000
12000
14000
16000
E-L E-F R-L R-F
Cigarette samples
Concentr
atio
n (
ppb)
With f ilter
Without f ilter
0
1000
2000
3000
4000
5000
6000
E-L E-F R-L R-F
Cigarette samples
Concentr
atio
n (
ppb)
With f ilter
Without f ilter
(G) Phenol (H) Styrene
FIGURE 2 continued.
The classification of light- and full-flavor samples appears to be reflected mainly by such factors as the
existence of perforations through which MSS can be diluted by inhaled air. Hence, if we compare emission
concentrations of a cigarette for a particular brand between light- vs. full-flavor type, one may expect
relatively good similarities between them to a certain extent. If the data sets obtained in this study are
examined in that respect, the concentrations of the light type were not necessarily low, contrary to our
anticipation. In fact, the concentrations of light-flavor cigarettes, if measured without filter, were
comparatively higher in certain cases than their counterparts. For instance, in the case of E brand, the
concentrations of most air toxins (benzene, toluene, xylene, methyl ethyl ketone, ethyl benzene, phenol,
methyl isobutyl ketone, styrene, and nicotine) were comparatively high for the light flavor (E-L-N) than its
counterpart (E-F-N) (Table 2). The pattern was similar in the case of R brand (R-L-N vs. R-F-N), when
some compounds (benzene, toluene, acetonitrile, methyl ethyl ketone, and acetaldehyde) are considered.
Hence, the observed patterns reconfirmed the fact that the selection of light cigarettes cannot assure the
reduction in harmfulness to smokers, as there are many variables determining MSS compositions. If the
holes of the filter are blocked partially or fully, one cannot exclude the possibility that the light-flavor
cigarettes can also emit a similar quantity of harmful chemicals as their counterparts (regular ones).
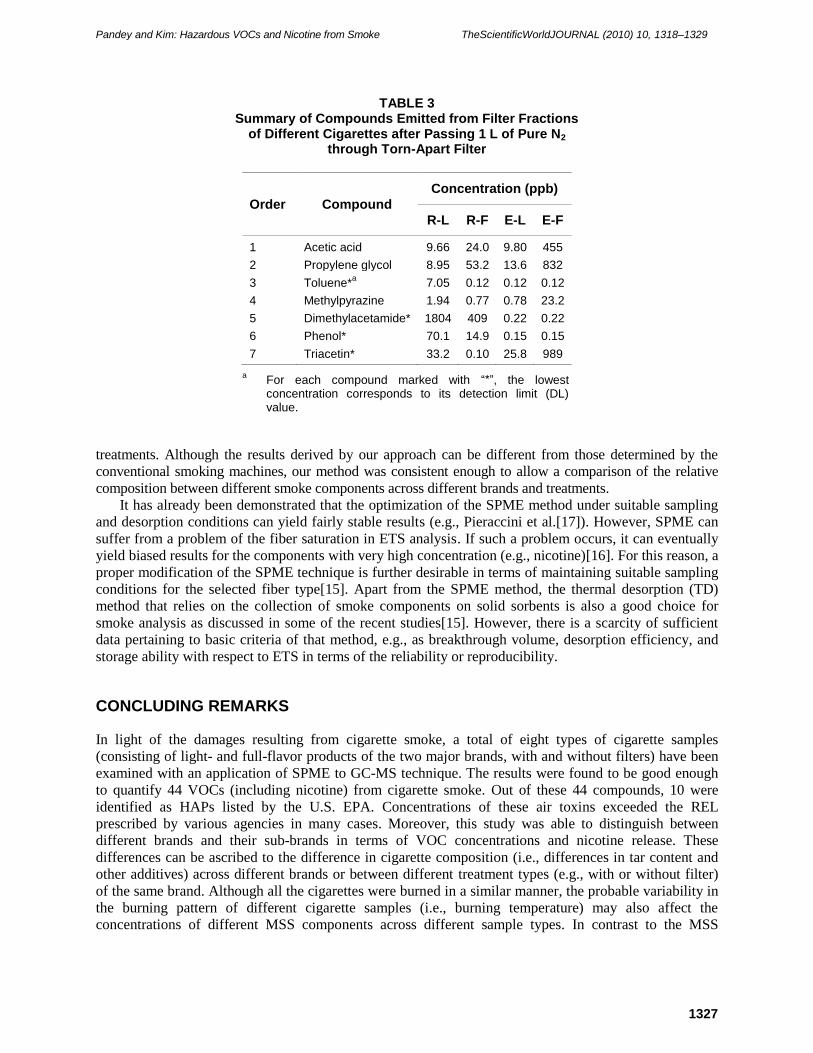
Analysis of Cigarette Filters
As we know that the filters of modern cigarettes are treated with many additives, some chemicals are also
expected to come solely from the filter of the cigarette. To check for this possibility, the filters of each brand
were separated to analyze any chemicals released as described earlier. As shown in Table 3, a total of seven
compounds (including acetic acid, propyleneglycol, toluene, methylpyrazine, dimethylacetamide, phenol,
and triacetin) were detected as the main components of the filter-only fraction across all the cigarette types;
however, none was found to be harmful either by its concentration level or chemical nature.
Remarks on the Sampling and Analytical Methods for Cigarette Smoke
Among many smoke-generation methods, one may consider both the U.S. Federal Trade Commission
(FTC) and International Organization for Standardization (ISO) 4387 as the most common choices. These
methods share the same criteria in terms of puff volume (35 cm3), puff generation frequency (at every 60
sec), and puff duration (2 sec)[15]. Nonetheless, many researchers are still looking for some alternative
techniques to quantify smoke constituents (e.g., Ye[16]). The method applied in this study is also explored
to provide a simple and easy option to compare the relative composition of smoke across different brands or
Pandey and Kim: Hazardous VOCs and Nicotine from Smoke TheScientificWorldJOURNAL (2010) 10, 1318–1329
1327
TABLE 3 Summary of Compounds Emitted from Filter Fractions
of Different Cigarettes after Passing 1 L of Pure N2 through Torn-Apart Filter
Order Compound
Concentration (ppb)
R-L R-F E-L E-F
1 Acetic acid 9.66 24.0 9.80 455
2 Propylene glycol 8.95 53.2 13.6 832
3 Toluene*a 7.05 0.12 0.12 0.12
4 Methylpyrazine 1.94 0.77 0.78 23.2
5 Dimethylacetamide* 1804 409 0.22 0.22
6 Phenol* 70.1 14.9 0.15 0.15
7 Triacetin* 33.2 0.10 25.8 989
a For each compound marked with “*”, the lowest
concentration corresponds to its detection limit (DL) value.
treatments. Although the results derived by our approach can be different from those determined by the
conventional smoking machines, our method was consistent enough to allow a comparison of the relative
composition between different smoke components across different brands and treatments.
It has already been demonstrated that the optimization of the SPME method under suitable sampling
and desorption conditions can yield fairly stable results (e.g., Pieraccini et al.[17]). However, SPME can
suffer from a problem of the fiber saturation in ETS analysis. If such a problem occurs, it can eventually
yield biased results for the components with very high concentration (e.g., nicotine)[16]. For this reason, a
proper modification of the SPME technique is further desirable in terms of maintaining suitable sampling
conditions for the selected fiber type[15]. Apart from the SPME method, the thermal desorption (TD)
method that relies on the collection of smoke components on solid sorbents is also a good choice for
smoke analysis as discussed in some of the recent studies[15]. However, there is a scarcity of sufficient
data pertaining to basic criteria of that method, e.g., as breakthrough volume, desorption efficiency, and
storage ability with respect to ETS in terms of the reliability or reproducibility.
CONCLUDING REMARKS
In light of the damages resulting from cigarette smoke, a total of eight types of cigarette samples
(consisting of light- and full-flavor products of the two major brands, with and without filters) have been
examined with an application of SPME to GC-MS technique. The results were found to be good enough
to quantify 44 VOCs (including nicotine) from cigarette smoke. Out of these 44 compounds, 10 were
identified as HAPs listed by the U.S. EPA. Concentrations of these air toxins exceeded the REL
prescribed by various agencies in many cases. Moreover, this study was able to distinguish between
different brands and their sub-brands in terms of VOC concentrations and nicotine release. These
differences can be ascribed to the difference in cigarette composition (i.e., differences in tar content and
other additives) across different brands or between different treatment types (e.g., with or without filter)
of the same brand. Although all the cigarettes were burned in a similar manner, the probable variability in
the burning pattern of different cigarette samples (i.e., burning temperature) may also affect the
concentrations of different MSS components across different sample types. In contrast to the MSS

Pandey and Kim: Hazardous VOCs and Nicotine from Smoke TheScientificWorldJOURNAL (2010) 10, 1318–1329
1328
samples, when filter portions were tested separately, no noticeable contributions were recognized with the
absence of the harmful ETS components.
In summary, the level of VOCs and nicotine in smoke released by cigarettes varied noticeably across
different brands and quality criteria (e.g., light and heavy). Based on the smoke composition of full vs.
light flavor, or with filter vs. filterless cigarettes, it was evident that the selection of a light-flavor cigarette
cannot assure less harm. This can be ascribed to many factors. For instance, the release of smoke
components between light and heavy cigarettes can be highly variable with the behavior of a smoker. The
study further suggests that there is a pressing need to evaluate the smoke compositions of cigarettes for
their harmful contents with more diverse perspectives. At present, it is not easy to mimic the actual
smoking behavior of smokers. However, efforts should be directed to attain the actual composition of
smoke that smokers exhale along with the ETS that would otherwise be inhaled involuntarily by
nonsmokers at the same time.
ACKNOWLEDGMENTS
This work was supported by the National Research Foundation of Korea (NRF) grant funded by the
Ministry of Education, Science and Technology (MEST) (No. 2009-0093848).
REFERENCES
1. International Agency for Research on Cancer (IARC) (1986) Tobacco Smoking Conclusions and Evaluations. Vol.
38.
2. Mulcahy, S. (1997) The Toxicology of Cigarette Smoke and Environmental Tobacco Smoke. Report assignment-
biochemical toxicology BC4927 Available at: http://www.csn.ul.ie/~stephen/reports/bc4927.html
3. Borgerding, M. and Klus, H. (2005) Analysis of complex mixtures—cigarette smoke. Exp. Toxicol. Pathol. 57, 43–
73.
4. Baek, S.-O., Kim, Y.-S., and Perry, R. (1997) Indoor air quality in homes, offices and restaurants in Korean urban
areas--indoor/outdoor relationships. Atmos. Environ. 31, 529–544
5. Nelson, P.R., Conrad, F.W., Kelly, S.P., Maiolo, K.C., Richardson, J.D., and Ogden, M.W. (1997) Composition of
environmental tobacco smoke (ETS) from international cigarettes and determination of ETS-RSP: particulate marker
ratios. Environ. Int. 23, 47–52.
6. Pendergrass, S.M., Krake, A.M., and Jaycox, L.B. (2000) Development of a versatile method for the detection of
nicotine in air. AIHAJ 61, 469–472.
7. Phillips, K., Howard, D.A., Bentley, M.C., and Alvan, G (1999) Assessment of environmental tobacco smoke and
respirable suspended particle exposures for nonsmokers in Basel by personal monitoring. Atmos. Environ. 33, 1889–
1904.
8. Baek, S.-O. and Jenkins, R.A. (2004) Characterization of trace organic compounds associated with aged and diluted
sidestream tobacco smoke in a controlled atmosphere—volatile organic compounds and polycyclic aromatic
hydrocarbons. Atmos. Environ. 38, 6583–6599.
9. Hengel, M.J., Hung, B.K., Engebretson, J.A., and Shibamoto, T. (2005) Analysis of nicotine in California air samples
from XAD-4 resin. Bull. Environ. Contam. Toxicol. 74, 445–455.
10. Charles, S.M., Batterman, S.A., and Jia, C. (2007) Composition and emissions of VOCs in main- and side-stream
smoke of research cigarettes. Atmos. Environ. 41, 5371–5384.
11. Vainiotalo, S., Vaaranrinta, R., Tornaeus, J., Aremo, N., Hase, T., and Peltonen, K. (2008) Passive monitoring
method for 3-ethenylpyridine: a marker for environmental tobacco smoke. Environ. Sci. Technol. 35, 1818–1822.
12. Ahn, J.W., Pandey, S.K., and Kim, K.-H. (2010) Comparison of GC-MS calibration properties of volatile organic
compounds between direct injection and solid phase microextraction. J. Chromatogr. Sci., in press.
13. United States Environmental Protection agency (U.S. EPA) (2008) List of Hazardous Air Pollutants (Air Toxic
Website) Available at: http://www.epa.gov/ttn/atw/188polls.html
14. Rigotti N.A. and Tindle H.A, (2004) The fallacy of light cigarettes. BMJ 328(7440), E278–279.
15. Pandey, S.K. and Kim, K.-H. (2010) A review of environmental tobacco smoke (ETS) and its determination in air.
Trends Anal. Chem., in press.
16. Ye, Q. (2008) Development of solid-phase microextraction followed by gas chromatography-mass spectrometry for
rapid analysis of volatile organic chemicals in mainstream cigarette smoke. J. Chromatogr. A 1213, 239–244.
Pandey and Kim: Hazardous VOCs and Nicotine from Smoke TheScientificWorldJOURNAL (2010) 10, 1318–1329
1329
17. Pieraccini, G., Furlanetto, S., Orlandini, S., Bartolucci, G., Giannini, I., Pinzauti, S., and Moneti, G. (2008)
Identification and determination of mainstream and sidestream smoke components in different brands and types of
cigarettes by means of solid-phase microextraction–gas chromatography–mass spectrometry. J. Chromatogr. A 1180,
138–150.
This article should be cited as follows:
Pandey, S.K. and Kim, K.-H. (2010) Determination of hazardous VOCs and nicotine released from mainstream smoke by the
combination of the SPME and GC-MS methods. TheScientificWorldJOURNAL: TSW Environment 10, 1318–1329. DOI
10.1100/tsw.2010.127.

Submit your manuscripts athttp://www.hindawi.com
Hindawi Publishing Corporationhttp://www.hindawi.com Volume 2014
ClimatologyJournal of
EcologyInternational Journal of
Hindawi Publishing Corporationhttp://www.hindawi.com Volume 2014
EarthquakesJournal of
Hindawi Publishing Corporationhttp://www.hindawi.com Volume 2014
Hindawi Publishing Corporationhttp://www.hindawi.com
Applied &EnvironmentalSoil Science
Volume 2014
Mining
Hindawi Publishing Corporationhttp://www.hindawi.com Volume 2014
Journal of
Hindawi Publishing Corporation http://www.hindawi.com Volume 2014
International Journal of
Geophysics
OceanographyInternational Journal of
Hindawi Publishing Corporationhttp://www.hindawi.com Volume 2014
Journal of Computational Environmental SciencesHindawi Publishing Corporationhttp://www.hindawi.com Volume 2014
Journal ofPetroleum Engineering
Hindawi Publishing Corporationhttp://www.hindawi.com Volume 2014
GeochemistryHindawi Publishing Corporationhttp://www.hindawi.com Volume 2014
Journal of
Atmospheric SciencesInternational Journal of
Hindawi Publishing Corporationhttp://www.hindawi.com Volume 2014
OceanographyHindawi Publishing Corporationhttp://www.hindawi.com Volume 2014
Advances in
Hindawi Publishing Corporationhttp://www.hindawi.com Volume 2014
MineralogyInternational Journal of
Hindawi Publishing Corporationhttp://www.hindawi.com Volume 2014
MeteorologyAdvances in
The Scientific World JournalHindawi Publishing Corporation http://www.hindawi.com Volume 2014
Paleontology JournalHindawi Publishing Corporationhttp://www.hindawi.com Volume 2014
ScientificaHindawi Publishing Corporationhttp://www.hindawi.com Volume 2014
Hindawi Publishing Corporationhttp://www.hindawi.com Volume 2014
Geological ResearchJournal of
Hindawi Publishing Corporationhttp://www.hindawi.com Volume 2014
Geology Advances in
Related Documents