Vibrational Spectroscopy 54 (2010) 10–20 Contents lists available at ScienceDirect Vibrational Spectroscopy journal homepage: www.elsevier.com/locate/vibspec Determination of aluminum rolling oil additives and contaminants using infrared spectroscopy coupled with genetic algorithm based multivariate calibration Ays ¸ egül Yalc ¸ ın a , Didem Ergün b , Özlem ˙ Inanc ¸ Uc ¸ ar b , Durmus ¸ Özdemir a,∗ a ˙ Izmir Institute of Technology, Faculty of Science, Department of Chemistry, 35430 Gülbahc ¸ e, Urla, ˙ Izmir, Turkey b Assan Alüminyum San. Ve Tic. A.S ¸ ., D-100 Karayolu Üzeri 32, Km, 34940 Tuzla, ˙ Istanbul, Turkey article info Article history: Received 7 December 2009 Received in revised form 16 May 2010 Accepted 28 May 2010 Available online 8 June 2010 Keywords: Infrared spectroscopy Gas chromatography Multivariate calibration Genetic algorithms Aluminum rolling oils abstract Genetic algorithm based multivariate calibration models were generated for infrared spectroscopic deter- mination of aluminum rolling oil additives and contaminants such as gear and hydraulic oils. Two different additives and six different suspected contaminants were investigated in the base oil lubricant. Routine analysis samples from 9 different aluminum rolling systems were collected in a period of 2 months in an aluminum rolling plant and gas chromatography (GC) is used as the reference method. Infrared absorbance spectra of the samples were then collected and the reference values obtained with GC were used together with these spectra for model building. Inverse least squares method was optimized with a genetic algorithm by selecting the most contributing regions of the infrared spectra for each component. The R 2 values between GC and multivariate spectroscopic determinations were around 0.99 indicating a good correlation between the two methods. Performance of genetic algorithm based multivariate cal- ibration models were also compared with partial least squares (PLS) method. The study showed that infrared spectroscopy coupled with multivariate calibration can be used for continuous monitoring of additives and contaminants in aluminum rolling oil. By this way, analysis time is significantly reduced and simultaneous determination of all the components can be accomplished. © 2010 Elsevier B.V. All rights reserved. 1. Introduction Common machinery oils for lubricating hydraulic systems, gear box or bearings of sheet and foil mills are composed of min- eral or synthetic oils with a number of additives such as extreme pressure additives, friction modifiers, corrosion inhibitors, oxida- tion inhibitors, viscosity modifiers, pour point depressants, foam decomposers, etc. The additives are very important in order to improve the performance of machinery oils in operation. The con- centration of the additives may vary significantly from 1–2% to 30%, depending on the requirement [1]. These oils and additives must be non-staining and complied with food codex as the aluminum foils produced in foil mills were consumed in many food packaging applications without any further cleaning other than heat treat- ment of the aluminum plates and foils in order to remove residues of rolling oils and additives. On the other hand, the lubrication and cooling oil mixture were sprayed as fine droplets to the rolling mills and unavoidably these oils were contaminated to some extent with gear and hydraulic fluids of the rolling machines since the solubility of these fluids were quite high in rolling oils. The chemical charac- teristics of the contaminants are very much different from rolling ∗ Corresponding author. Tel.: +90 232 750 7534; fax: +90 232 750 7509. E-mail address: [email protected] (D. Özdemir). oils and often have higher boiling points and this causes serious staining problems that can not be removed with heat treatment of the finished products resulting in significant profit loses for the industry. In addition, undesired mixing of gear and hydraulic flu- ids with rolling oils change the lubricating performance of the oil mixtures resulting in mechanical deformations on the rolled sheets and foils [2]. Several analytical methods were proposed in the literature for analysis of complex industrial oil blends. High performance liquid chromatography (HPLC) was used to determine contamination of cold rolling oils with hydraulic fluids and gear oils [1]. In a compar- ative study, synthetic esters that are used in aluminum hot rolling lubricants were determined using chromatographic and titrimet- ric methods and results were compared based on the acid number and hydroxyl number [3]. Bernabei et al. [4] described two gas chromatography (GC) based methods for the determination of addi- tives that are found in lubricating oils used in gas turbine engines. In another study, identification and quantitative determination of contaminants in lubricating and hydraulic fluids were reported by using gas chromatography weight-spectrometry [5]. Haveng and Rohwer [6] reported the application of capillary gas chromatogra- phy to rapid screening of rolling mill oils. However these chromatographic techniques suffer from long analysis times and if several rolling mills are to be monitored continuously these techniques are not very practical for routine 0924-2031/$ – see front matter © 2010 Elsevier B.V. All rights reserved. doi:10.1016/j.vibspec.2010.05.002

Welcome message from author
This document is posted to help you gain knowledge. Please leave a comment to let me know what you think about it! Share it to your friends and learn new things together.
Transcript
Ds
Aa
b
a
ARRAA
KIGMGA
1
beptdicdbfamocagot
0d
Vibrational Spectroscopy 54 (2010) 10–20
Contents lists available at ScienceDirect
Vibrational Spectroscopy
journa l homepage: www.e lsev ier .com/ locate /v ibspec
etermination of aluminum rolling oil additives and contaminants using infraredpectroscopy coupled with genetic algorithm based multivariate calibration
ysegül Yalcına, Didem Ergünb, Özlem Inanc Ucarb, Durmus Özdemira,∗
Izmir Institute of Technology, Faculty of Science, Department of Chemistry, 35430 Gülbahce, Urla, Izmir, TurkeyAssan Alüminyum San. Ve Tic. A.S., D-100 Karayolu Üzeri 32, Km, 34940 Tuzla, Istanbul, Turkey
r t i c l e i n f o
rticle history:eceived 7 December 2009eceived in revised form 16 May 2010ccepted 28 May 2010vailable online 8 June 2010
eywords:nfrared spectroscopy
a b s t r a c t
Genetic algorithm based multivariate calibration models were generated for infrared spectroscopic deter-mination of aluminum rolling oil additives and contaminants such as gear and hydraulic oils. Two differentadditives and six different suspected contaminants were investigated in the base oil lubricant. Routineanalysis samples from 9 different aluminum rolling systems were collected in a period of 2 monthsin an aluminum rolling plant and gas chromatography (GC) is used as the reference method. Infraredabsorbance spectra of the samples were then collected and the reference values obtained with GC wereused together with these spectra for model building. Inverse least squares method was optimized with a
as chromatographyultivariate calibrationenetic algorithmsluminum rolling oils
genetic algorithm by selecting the most contributing regions of the infrared spectra for each component.The R2 values between GC and multivariate spectroscopic determinations were around 0.99 indicatinga good correlation between the two methods. Performance of genetic algorithm based multivariate cal-ibration models were also compared with partial least squares (PLS) method. The study showed thatinfrared spectroscopy coupled with multivariate calibration can be used for continuous monitoring ofadditives and contaminants in aluminum rolling oil. By this way, analysis time is significantly reduced
inati
and simultaneous determ. Introduction
Common machinery oils for lubricating hydraulic systems, gearox or bearings of sheet and foil mills are composed of min-ral or synthetic oils with a number of additives such as extremeressure additives, friction modifiers, corrosion inhibitors, oxida-ion inhibitors, viscosity modifiers, pour point depressants, foamecomposers, etc. The additives are very important in order to
mprove the performance of machinery oils in operation. The con-entration of the additives may vary significantly from 1–2% to 30%,epending on the requirement [1]. These oils and additives muste non-staining and complied with food codex as the aluminumoils produced in foil mills were consumed in many food packagingpplications without any further cleaning other than heat treat-ent of the aluminum plates and foils in order to remove residues
f rolling oils and additives. On the other hand, the lubrication andooling oil mixture were sprayed as fine droplets to the rolling mills
nd unavoidably these oils were contaminated to some extent withear and hydraulic fluids of the rolling machines since the solubilityf these fluids were quite high in rolling oils. The chemical charac-eristics of the contaminants are very much different from rolling∗ Corresponding author. Tel.: +90 232 750 7534; fax: +90 232 750 7509.E-mail address: [email protected] (D. Özdemir).
924-2031/$ – see front matter © 2010 Elsevier B.V. All rights reserved.oi:10.1016/j.vibspec.2010.05.002
on of all the components can be accomplished.© 2010 Elsevier B.V. All rights reserved.
oils and often have higher boiling points and this causes seriousstaining problems that can not be removed with heat treatmentof the finished products resulting in significant profit loses for theindustry. In addition, undesired mixing of gear and hydraulic flu-ids with rolling oils change the lubricating performance of the oilmixtures resulting in mechanical deformations on the rolled sheetsand foils [2].
Several analytical methods were proposed in the literature foranalysis of complex industrial oil blends. High performance liquidchromatography (HPLC) was used to determine contamination ofcold rolling oils with hydraulic fluids and gear oils [1]. In a compar-ative study, synthetic esters that are used in aluminum hot rollinglubricants were determined using chromatographic and titrimet-ric methods and results were compared based on the acid numberand hydroxyl number [3]. Bernabei et al. [4] described two gaschromatography (GC) based methods for the determination of addi-tives that are found in lubricating oils used in gas turbine engines.In another study, identification and quantitative determination ofcontaminants in lubricating and hydraulic fluids were reported byusing gas chromatography weight-spectrometry [5]. Haveng and
Rohwer [6] reported the application of capillary gas chromatogra-phy to rapid screening of rolling mill oils.However these chromatographic techniques suffer from longanalysis times and if several rolling mills are to be monitoredcontinuously these techniques are not very practical for routine
l Spec
agoecmll(trwttaatschit
iatdtiinpvoiIwaaoeali
tismpittTdbwtIco
1
i
A. Yalcın et al. / Vibrationa
nalysis. Spectroscopic analysis is an alternative to chromato-raphic methods in terms of rapid analysis and relatively cheapperation costs along with on-line monitoring advantages. Forxample, Paschoal and et al. [7] had used near infrared spectroscopyoupled with a multivariate partial least squares calibration (PLS)ethod for their analysis of contaminants in lubricating oils. Gaso-
ine, ethylene glycol and water contamination in automotive engineubricating oils were determined using attenuated total reflectanceATR) mid infrared spectroscopy and PLS [8]. Fluorescence spec-roscopy was used to determine tramp oil contaminations in hotolling oil emulsions [9]. Synchronous fluorescence measurementsere made with a fluorescence tracer in order to enhance the con-
aminant signal and distinguish it from rolling oil signal. Fourierransform infrared (FTIR) spectroscopy combined with multivari-te calibration was used to monitor lubricating oil degradation andnalysis of possible contaminants in aluminum cold rolling sys-ems [10–12]. A recent study focused on different modes of FTIRpectroscopy for the determination of organic monolayers of lubri-ating oil residues on the surface of rolled aluminum sheets aftereat treatment [13]. The authors proposed a surface enhanced
nfrared spectroscopic method for the effective determination ofhin organic films on the surfaces of aluminum sheets.
Multivariate calibration methods make it possible to relatenstrument responses that consist of several predictor variables tochemical or physical property of a sample. Several classical mul-
ivariate calibration methods have been developed in last couple ofecades [14–16] for the analysis of complex chemical mixtures, andhe choice of the most suitable calibration method is very importantn order to generate calibration models with high predictive abil-ty for future samples. In some cases, conventional methods mayot offer a satisfactory solution to a given problem due to the com-lexity of the data, and it may be necessary to apply some sort ofariable selection. There have been many mathematical methodsf variable selection and genetic algorithm is one of them offer-ng a fast and effective solution for large scale problems [17–20].nverse least squares (ILS) is based on the inverse of Beer’s Law,
here concentrations of an analyte are modeled as a function ofbsorbance measurements. Genetic inverse least squares (GILS) ismodified versions of original ILS method in which a small set
f wavelengths are selected from a full spectral data matrix andvolved to an optimum solution using a genetic algorithm (GA),nd has been applied to a number of wavelength selection prob-ems. The detailed description of the GILS algorithm has been givenn number of recent studies [21–23].
In this study, the determination of additives and possible con-aminants, such as gear and hydraulic oils in aluminum rolling oilss presented with the aim of developing a fast and reliable FTIRpectroscopic method for the routine analysis of industrial alu-inum rolling systems. The conventional analysis method that is in
ractice in the particular industrial aluminum sheet and foil plants based on a capillary column GC and suffers form long analysisimes. As a result, it becomes too late to act on the contamina-ion prevention resulting in unacceptable product and loss of profit.he proposed FTIR based spectroscopic method is much faster foretermination of the concentrations of the additives and possi-le contaminants in the aluminum rolling oils. The GILS methodas used as the multivariate calibration and wavelength selec-
ion method for each component of the lubricating oil mixtures.n addition to GILS, partial least squares (PLS) is also used to buildalibration models in order to determine possible improvementsffered by genetic algorithm based approach.
.1. Genetic inverse least squares
The major drawback of the classical least squares (CLS) methods that all of the interfering species must be known and their con-
troscopy 54 (2010) 10–20 11
centrations included in the model. This need can be eliminated byusing the inverse least squares (ILS) method which uses the inverseof Beer’s Law. In the ILS method, concentration of a component ismodeled as a function of absorbance measurements. Because mod-ern spectroscopic instruments are very stable and provide excellentsignal-to-noise (S/N) ratios, it is believed that the majority of errorslie in the reference values of the calibration sample, not in the mea-surement of their spectra. In fact, in many cases the concentrationdata of calibration set is generated from another analytical tech-nique that already has inherent errors which might be higher thanthose of the spectrometer (for example, Kjeldahl protein analysisused to calibrate NIR spectra).
The ILS model for m calibration samples with n wavelengths foreach spectrum is described by:
C = AP + EC (1)
where C is the m × l matrix of the component concentrations, A isthe m × n matrix of the calibration spectra, P is the n × l matrix of theunknown calibration coefficients relating l component concentra-tions to the spectral intensities and EC is the m × l matrix of errors inthe concentrations not fit by the model. In the calibration step, ILSminimizes the squared sum of the residuals in the concentrations.The biggest advantage of ILS is that Eq. (1) can be reduced for theanalysis of single component at a time since analysis is based onan ILS model is invariant with respect to the number of chemicalcomponents included in the analysis. The reduced model is givenas:
c = Ap + ec (2)
where c is the m × 1 vector of concentrations for the componentthat is being analyzed, p is n × 1 vector of calibration coefficientsand ec is the m × 1 vector of concentration residuals not fit by themodel. During the calibration step, the least-squares estimate of pis:
p = (A′A)−1A′ · c (3)
where p are the estimated calibration coefficients. Once p is calcu-lated, the concentration of the analyte of interest can be predictedwith the equation below.
c = a′ · p (4)
where c is the scalar estimated concentration and a is the spectrumof the unknown sample. The ability to predict one component at atime without knowing the concentrations of interfering species hasmade ILS one of the most frequently used calibration methods.
The major disadvantage of Eq. (3) is that the number of wave-lengths in the calibration spectra should not be more than thenumber of calibration samples. This is a big restriction since thenumber of wavelengths in a spectrum will generally be much morethan the number of calibration samples and the selection of wave-lengths that provide the best fit for the model is not a trivial process.Several wavelength selection strategies, such as stepwise wave-length selection and all possible combination searches are availableto build a model which fits the data best.
Genetic Algorithms (GA) are global search and optimizationmethods based upon the principles of natural evolution and selec-tion as developed by Darwin. Computationally, the implementationof a typical GA is quite simple and consists of five basic steps includ-ing initialization of a gene population, evaluation of the population,selection of the parent genes for breeding and mating, crossover
and mutation, and replacing parents with their offspring. Thesesteps have taken their names from the biological foundation of thealgorithm.Genetic inverse least squares (GILS) is an implementation ofa GA for selecting wavelengths to build multivariate calibration
1 l Spec
mtsAfiwug
rtrwsBdcnItglcppuo
pgwiotgshaaptgi
S
S
#
S
S
wlpstwp
2 A. Yalcın et al. / Vibrationa
odels with reduced data set. GILS follows the same basic ini-ialize/breed/mutate/evaluate algorithm as other GA’s to select aubset of wavelengths but is unique in the way it encodes genes.
gene is a potential solution to a given problem and the exactorm may vary from application to application. Here, the term genes used to describe the collection of instrumental response at the
avelength range given in the data set. The term ‘population’ issed to describe the collection of individual genes in the currenteneration.
In the initialization step, the first generation of genes is createdandomly with a fixed population size. Although random initializa-ion helps to minimize bias and maximize the number of possibleecombinations, GILS is designed to select initial genes in a some-hat biased random fashion in order to start with genes better
uited to the problem than those that would be randomly selected.iasing is done with a correlation coefficient by plotting the pre-icted results of initial population against the actual componentoncentrations. The size of the gene pool is a user defined evenumber in order to allow breeding of each gene in the population.
t is important to note that the larger the population size, the longerhe computation time. The number of instrumental responses in aene is determined randomly between a fixed low limit and highimit. The lower limit was set to 2 in order to allow single pointrossover whereas the higher limit was set to eliminate over fittingroblems and reduce the computation time. Once the initial geneopulation is created, the next step is to evaluate and rank the genessing a fitness function, which is the inverse of the standard errorf prediction from cross validation (SEPCV).
The third step is where the basic principle of natural evolution isut to work for GILS. This step involves the selection of the parentenes from the current population for breeding using a rouletteheel selection method according to their fitness values. The goal
s to give a higher chance to those genes with high fitness so thatnly the best performing members of the population will survive inhe long run and will be able to pass their information to the nextenerations. Because of the random nature of the roulette wheelelection method, however, genes with low fitness values will alsoave some chance to be selected. Also, there will be genes thatre selected multiple times and some genes will not be selectedt all and will be thrown out of the gene pool. After the selectionrocedure is completed, the selected genes are allowed to mateop-down in pairs whereby the first gene mates with the secondene and the third one with the fourth one and so on as illustratedn the following example:
Parents
1 = (A1147, A951, #A2179, A2218) (5)
2 = (A1225, A1478, #A1343, A950, A1451, A2358, A931, A1158) (6)
The points where the genes are cut for mating are indicated by.
Offspring
3 = (A1147, A951, A1343, A950, A1451, A2358, A931, A1158) (7)
4 = (A2179, A2218, A1225, A1478) (8)
here A1147 represents the instrument response at the wave-ength given in subscript, S1 and S2 represent the first and second
arent genes and S3 and S4 are the corresponding genes for the off-pring. Here the first part of S1 is combined with the second part ofhe S2 to give the S3, likewise the second part of the S1 is combinedith the first part of the S2 to give S4. This process is called the singleoint crossover and is common in GILS. Single point crossover willtroscopy 54 (2010) 10–20
not provide different offspring if both parent genes are identical,which may happen in roulette wheel selection, when both genesare broken at the same point. Also note that mating can increaseor decrease the number of instrument responses in the offspringgenes. After crossover, the parent genes are replaced by their off-spring and the offspring are evaluated. The ranking process is basedon their fitness values following the evaluation step. Then the selec-tion for breeding/mating starts all over again. This is repeated untila predefined number of iterations are reached.
Mutation which introduces random deviations into the popu-lation was also introduced into the GILS during the mating step ata rate of 1% as is typical in GA’s. This is usually done by replacingone of the responses in an existing gene with a randomly selectednew one. Mutation allows the GILS to explore the search space andincorporate new material into the genetic population. It helps keepthe search moving and can eject GILS from a local minimum on theresponse surface. However, it is important not to set the mutationrate too high since it may keep the GA from being able to exploit theexisting population. Also, the GILS method is an iterative algorithmand therefore there is a high possibility that the method may easilyover fit the calibration data so that the predictions for independentsets might be poor. To eliminate possible over fitting problems,cross validation is used in which one spectrum is left out of the cal-ibration set and the model is constructed with m − 1 sample. Thenthis model is used to predict the concentration of left out sample.This process is continued until all samples are left out al least oncein each iteration. As long as the number of spectra in the calibrationset is not too large, cross validation is an effective method of elimi-nating over fitting. If the number of calibration spectra is very large,then the GILS method has the option of half validation approach inwhich the half of the spectra in the calibration set is used to validatethe model in each iteration.
In the end, the gene with the lowest SEPCV (highest fitness) isselected for the model building and this model is used to predictthe concentrations of component being analyzed in the prediction(test) sets. The success of the model in the prediction of the testsets is evaluated using standard error of prediction (SEP). Becauserandom processes are heavily involved in GILS as in all the GA’s, theprogram has been set to run several times for each component inthis study. The best run (i.e. the one generating the lowest SEPCVfor the calibration set) is subsequently selected for evaluation andfurther analysis. The termination of the algorithm can be done inmany ways. The easiest way is to set a predefined iteration numberfor the number of breeding/mating cycles.
GILS is relatively simple in terms of the mathematics involvedin the model building and prediction steps, but at the same timeit has the advantages of the multivariate calibration methods witha reduced data set since it uses the full spectrum to extract genes.By selecting a subset of instrument responses it is able to minimizenonlinearities that might be present in the full spectral region.
2. Experimental
2.1. Materials
Aluminum rolling oil, additives, hydraulic oils and gear oils werepurchased from different suppliers. The rolling base oil named asLinpar 13–14 which is linear paraffinic oil with 13–14 carbon chainlength was obtained from Sasol (Sasol Italy S.p.A. Milano, Italy). Theadditive Nafol 1214S is a blend of linear alcohols with 10–16 car-
bon chain length and used as antioxidant and wetting agent. It isalso supplied by Sasol, Italy. Another additive that was used in thisstudy is Cindolube SR 99 AP which is purchased from Houghton(Houghton Italia S.p.A, Genova, Italy). Cindolube SR is a perfor-mance additive lubricant used as antioxidant and wetting agent.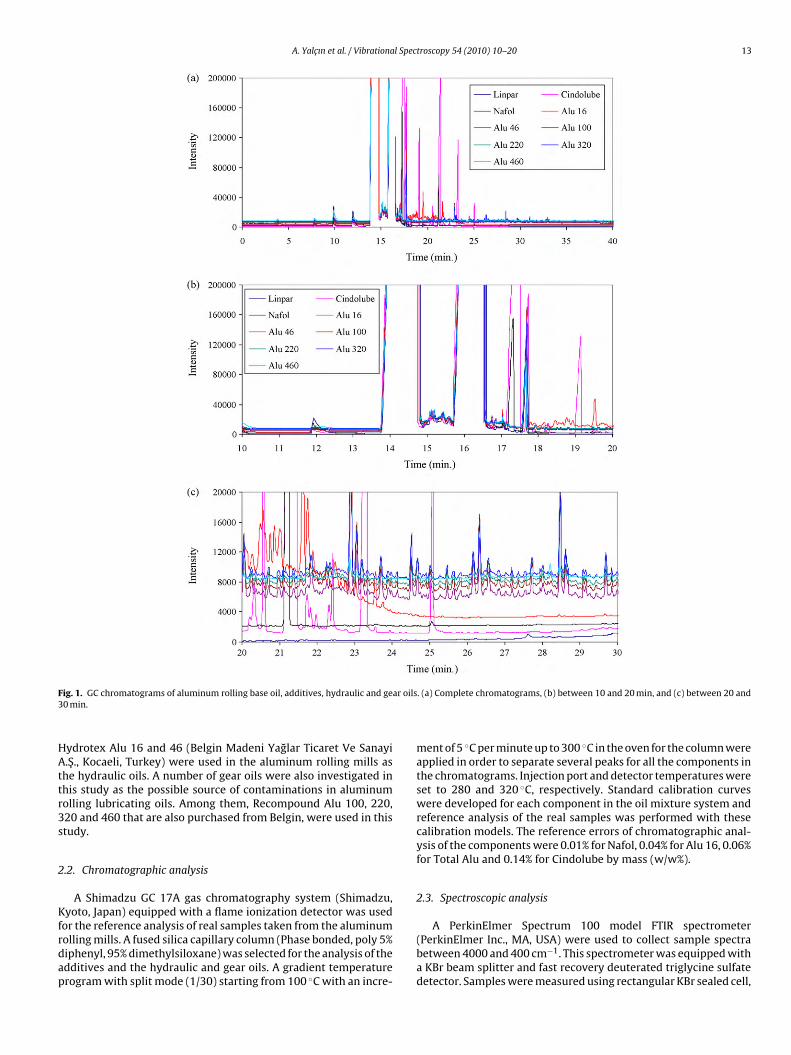
A. Yalcın et al. / Vibrational Spectroscopy 54 (2010) 10–20 13
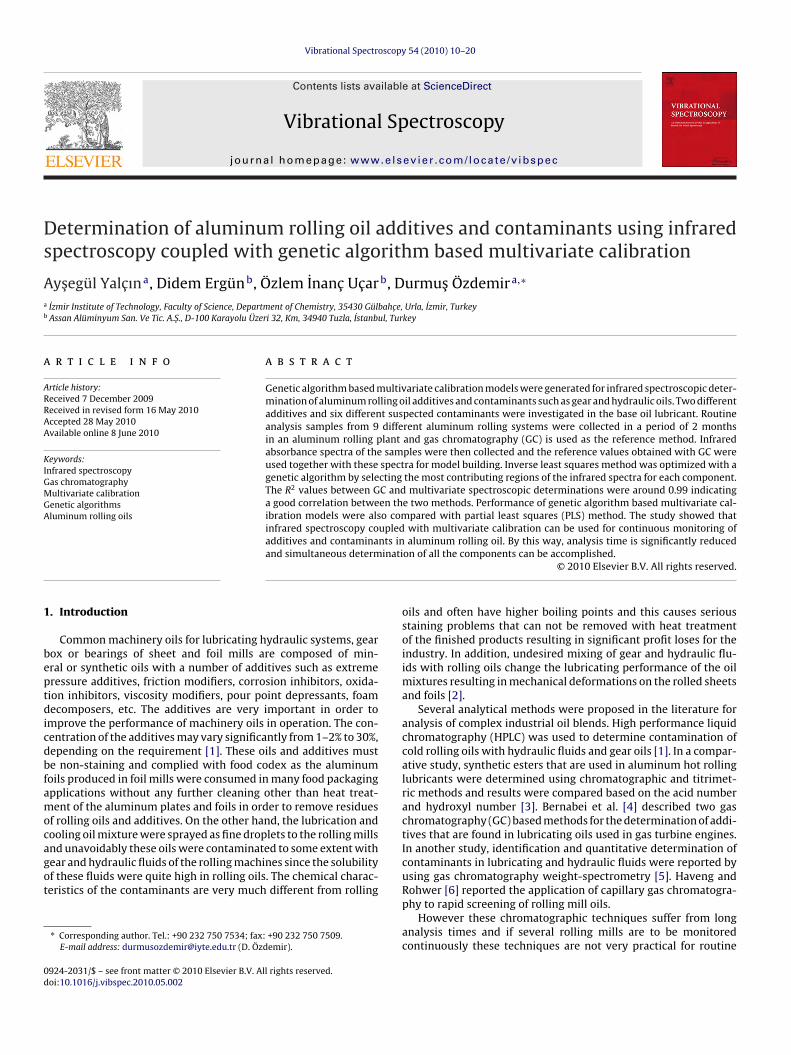
F ar oils3
HAttr3s
2
Kfrdap
ig. 1. GC chromatograms of aluminum rolling base oil, additives, hydraulic and ge0 min.
ydrotex Alu 16 and 46 (Belgin Madeni Yaglar Ticaret Ve Sanayi.S., Kocaeli, Turkey) were used in the aluminum rolling mills as
he hydraulic oils. A number of gear oils were also investigated inhis study as the possible source of contaminations in aluminumolling lubricating oils. Among them, Recompound Alu 100, 220,20 and 460 that are also purchased from Belgin, were used in thistudy.
.2. Chromatographic analysis
A Shimadzu GC 17A gas chromatography system (Shimadzu,yoto, Japan) equipped with a flame ionization detector was used
or the reference analysis of real samples taken from the aluminumolling mills. A fused silica capillary column (Phase bonded, poly 5%iphenyl, 95% dimethylsiloxane) was selected for the analysis of thedditives and the hydraulic and gear oils. A gradient temperaturerogram with split mode (1/30) starting from 100 ◦C with an incre-
. (a) Complete chromatograms, (b) between 10 and 20 min, and (c) between 20 and
ment of 5 ◦C per minute up to 300 ◦C in the oven for the column wereapplied in order to separate several peaks for all the components inthe chromatograms. Injection port and detector temperatures wereset to 280 and 320 ◦C, respectively. Standard calibration curveswere developed for each component in the oil mixture system andreference analysis of the real samples was performed with thesecalibration models. The reference errors of chromatographic anal-ysis of the components were 0.01% for Nafol, 0.04% for Alu 16, 0.06%for Total Alu and 0.14% for Cindolube by mass (w/w%).
2.3. Spectroscopic analysis
A PerkinElmer Spectrum 100 model FTIR spectrometer(PerkinElmer Inc., MA, USA) were used to collect sample spectrabetween 4000 and 400 cm−1. This spectrometer was equipped witha KBr beam splitter and fast recovery deuterated triglycine sulfatedetector. Samples were measured using rectangular KBr sealed cell,
14 A. Yalcın et al. / Vibrational Spectroscopy 54 (2010) 10–20
afol, (
wa
2
pmrfiFLit0dsao
2
mtcwW
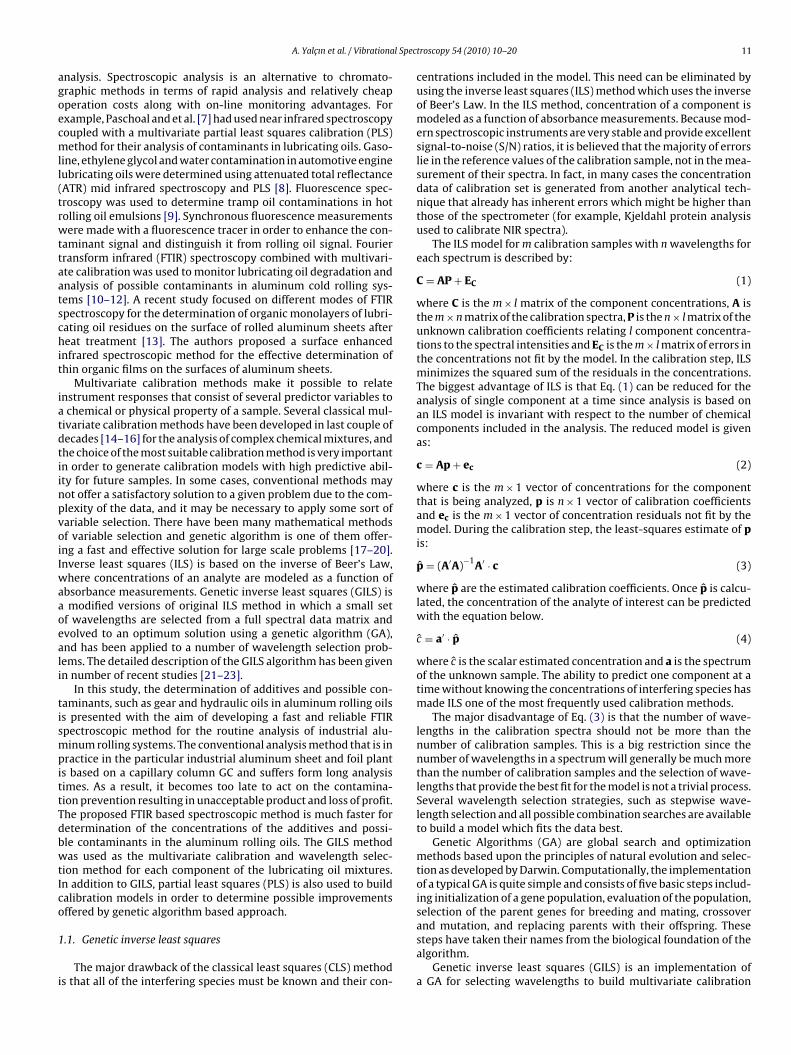
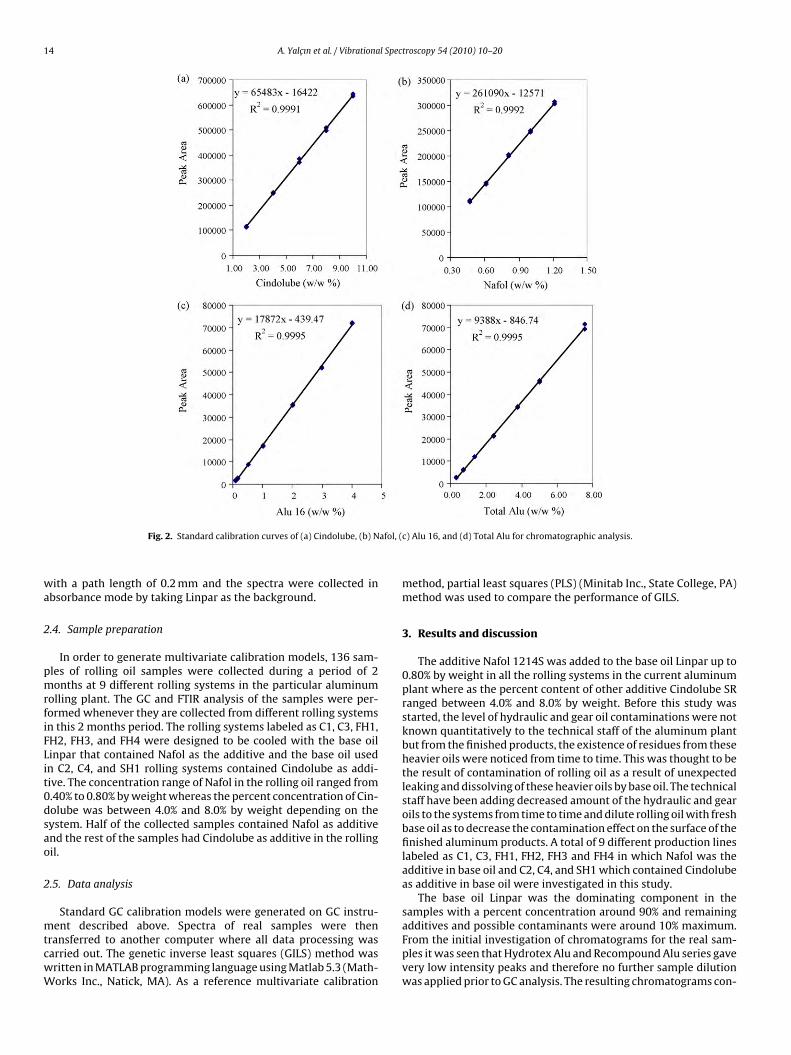
Fig. 2. Standard calibration curves of (a) Cindolube, (b) N
ith a path length of 0.2 mm and the spectra were collected inbsorbance mode by taking Linpar as the background.
.4. Sample preparation
In order to generate multivariate calibration models, 136 sam-les of rolling oil samples were collected during a period of 2onths at 9 different rolling systems in the particular aluminum
olling plant. The GC and FTIR analysis of the samples were per-ormed whenever they are collected from different rolling systemsn this 2 months period. The rolling systems labeled as C1, C3, FH1,H2, FH3, and FH4 were designed to be cooled with the base oilinpar that contained Nafol as the additive and the base oil usedn C2, C4, and SH1 rolling systems contained Cindolube as addi-ive. The concentration range of Nafol in the rolling oil ranged from.40% to 0.80% by weight whereas the percent concentration of Cin-olube was between 4.0% and 8.0% by weight depending on theystem. Half of the collected samples contained Nafol as additivend the rest of the samples had Cindolube as additive in the rollingil.
.5. Data analysis
Standard GC calibration models were generated on GC instru-
ent described above. Spectra of real samples were thenransferred to another computer where all data processing wasarried out. The genetic inverse least squares (GILS) method wasritten in MATLAB programming language using Matlab 5.3 (Math-orks Inc., Natick, MA). As a reference multivariate calibration
c) Alu 16, and (d) Total Alu for chromatographic analysis.
method, partial least squares (PLS) (Minitab Inc., State College, PA)method was used to compare the performance of GILS.
3. Results and discussion
The additive Nafol 1214S was added to the base oil Linpar up to0.80% by weight in all the rolling systems in the current aluminumplant where as the percent content of other additive Cindolube SRranged between 4.0% and 8.0% by weight. Before this study wasstarted, the level of hydraulic and gear oil contaminations were notknown quantitatively to the technical staff of the aluminum plantbut from the finished products, the existence of residues from theseheavier oils were noticed from time to time. This was thought to bethe result of contamination of rolling oil as a result of unexpectedleaking and dissolving of these heavier oils by base oil. The technicalstaff have been adding decreased amount of the hydraulic and gearoils to the systems from time to time and dilute rolling oil with freshbase oil as to decrease the contamination effect on the surface of thefinished aluminum products. A total of 9 different production lineslabeled as C1, C3, FH1, FH2, FH3 and FH4 in which Nafol was theadditive in base oil and C2, C4, and SH1 which contained Cindolubeas additive in base oil were investigated in this study.
The base oil Linpar was the dominating component in thesamples with a percent concentration around 90% and remaining
additives and possible contaminants were around 10% maximum.From the initial investigation of chromatograms for the real sam-ples it was seen that Hydrotex Alu and Recompound Alu series gavevery low intensity peaks and therefore no further sample dilutionwas applied prior to GC analysis. The resulting chromatograms con-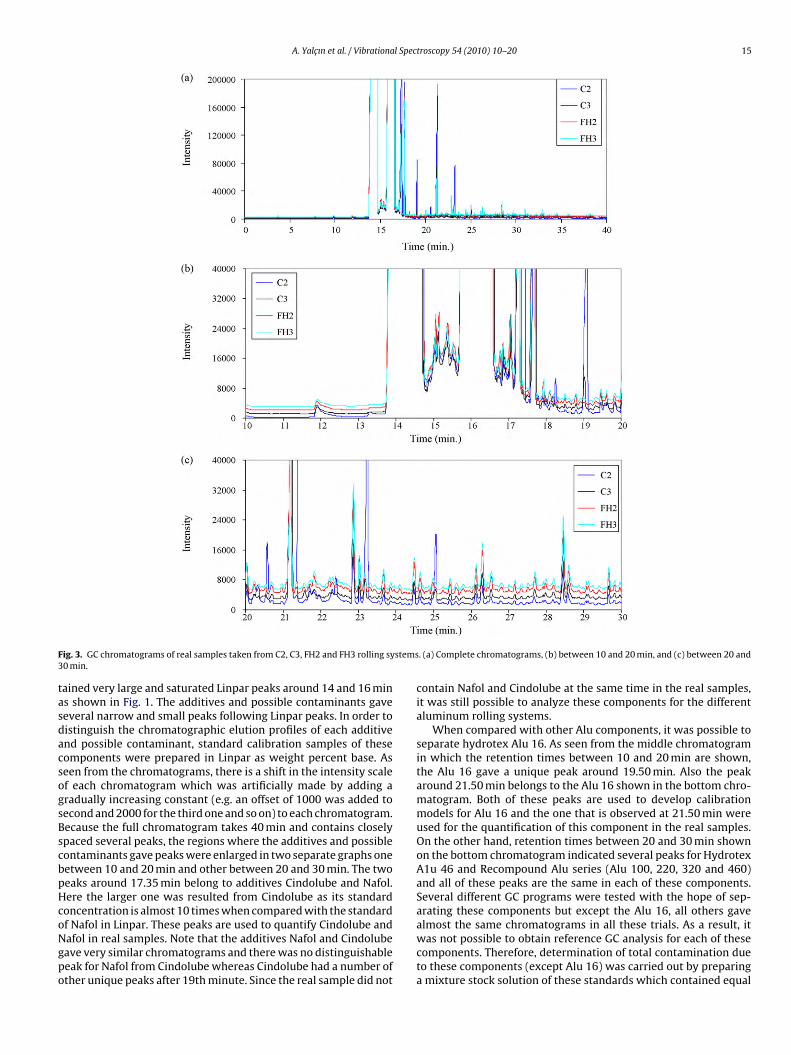
A. Yalcın et al. / Vibrational Spectroscopy 54 (2010) 10–20 15
F stems3
tasdacsogsBscbpHcoNgpo
ig. 3. GC chromatograms of real samples taken from C2, C3, FH2 and FH3 rolling sy0 min.
ained very large and saturated Linpar peaks around 14 and 16 mins shown in Fig. 1. The additives and possible contaminants gaveeveral narrow and small peaks following Linpar peaks. In order toistinguish the chromatographic elution profiles of each additivend possible contaminant, standard calibration samples of theseomponents were prepared in Linpar as weight percent base. Aseen from the chromatograms, there is a shift in the intensity scalef each chromatogram which was artificially made by adding aradually increasing constant (e.g. an offset of 1000 was added toecond and 2000 for the third one and so on) to each chromatogram.ecause the full chromatogram takes 40 min and contains closelypaced several peaks, the regions where the additives and possibleontaminants gave peaks were enlarged in two separate graphs oneetween 10 and 20 min and other between 20 and 30 min. The twoeaks around 17.35 min belong to additives Cindolube and Nafol.ere the larger one was resulted from Cindolube as its standardoncentration is almost 10 times when compared with the standard
f Nafol in Linpar. These peaks are used to quantify Cindolube andafol in real samples. Note that the additives Nafol and Cindolubeave very similar chromatograms and there was no distinguishableeak for Nafol from Cindolube whereas Cindolube had a number ofther unique peaks after 19th minute. Since the real sample did not. (a) Complete chromatograms, (b) between 10 and 20 min, and (c) between 20 and
contain Nafol and Cindolube at the same time in the real samples,it was still possible to analyze these components for the differentaluminum rolling systems.
When compared with other Alu components, it was possible toseparate hydrotex Alu 16. As seen from the middle chromatogramin which the retention times between 10 and 20 min are shown,the Alu 16 gave a unique peak around 19.50 min. Also the peakaround 21.50 min belongs to the Alu 16 shown in the bottom chro-matogram. Both of these peaks are used to develop calibrationmodels for Alu 16 and the one that is observed at 21.50 min wereused for the quantification of this component in the real samples.On the other hand, retention times between 20 and 30 min shownon the bottom chromatogram indicated several peaks for HydrotexA1u 46 and Recompound Alu series (Alu 100, 220, 320 and 460)and all of these peaks are the same in each of these components.Several different GC programs were tested with the hope of sep-arating these components but except the Alu 16, all others gave
almost the same chromatograms in all these trials. As a result, itwas not possible to obtain reference GC analysis for each of thesecomponents. Therefore, determination of total contamination dueto these components (except Alu 16) was carried out by preparinga mixture stock solution of these standards which contained equal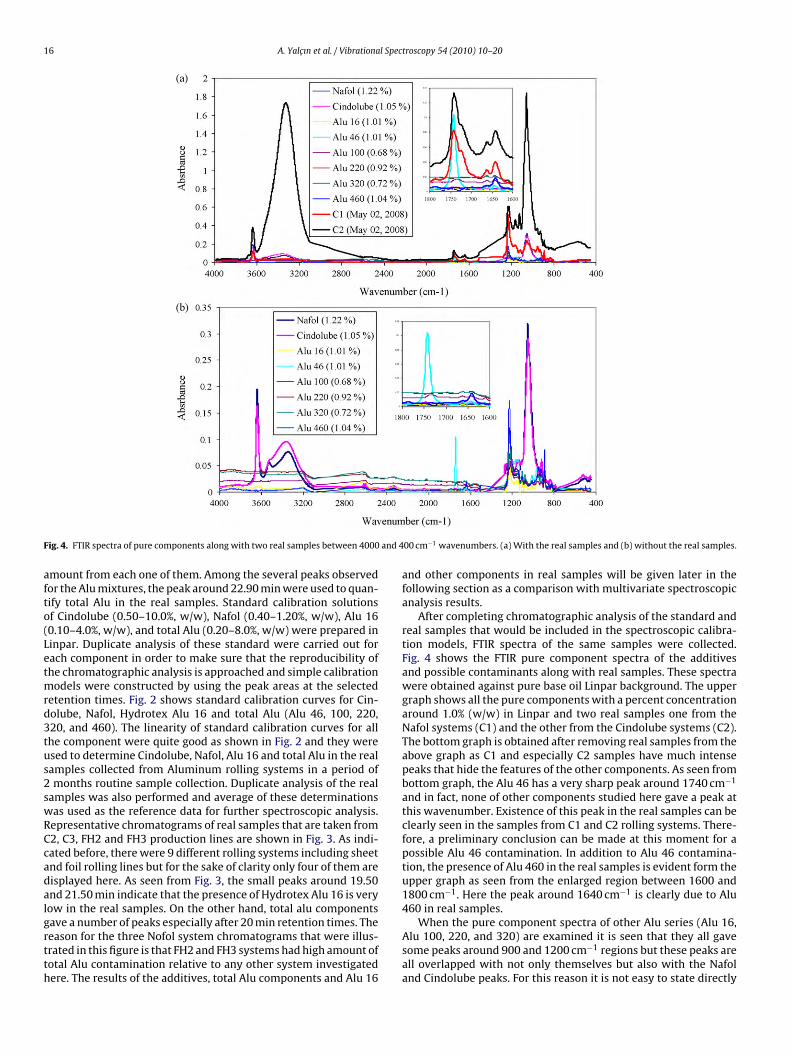
16 A. Yalcın et al. / Vibrational Spectroscopy 54 (2010) 10–20
F and 4
afto(Letmrd3tus2swRCcadalgrtth
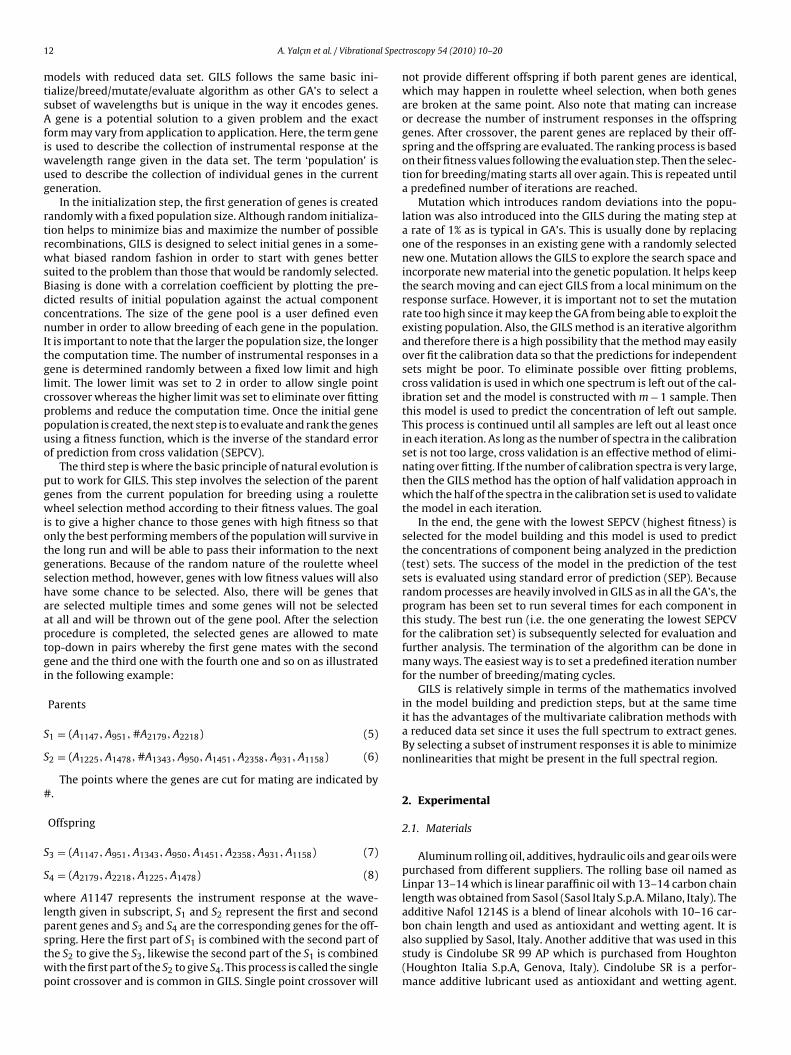
ig. 4. FTIR spectra of pure components along with two real samples between 4000
mount from each one of them. Among the several peaks observedor the Alu mixtures, the peak around 22.90 min were used to quan-ify total Alu in the real samples. Standard calibration solutionsf Cindolube (0.50–10.0%, w/w), Nafol (0.40–1.20%, w/w), Alu 160.10–4.0%, w/w), and total Alu (0.20–8.0%, w/w) were prepared ininpar. Duplicate analysis of these standard were carried out forach component in order to make sure that the reproducibility ofhe chromatographic analysis is approached and simple calibration
odels were constructed by using the peak areas at the selectedetention times. Fig. 2 shows standard calibration curves for Cin-olube, Nafol, Hydrotex Alu 16 and total Alu (Alu 46, 100, 220,20, and 460). The linearity of standard calibration curves for allhe component were quite good as shown in Fig. 2 and they weresed to determine Cindolube, Nafol, Alu 16 and total Alu in the realamples collected from Aluminum rolling systems in a period ofmonths routine sample collection. Duplicate analysis of the real
amples was also performed and average of these determinationsas used as the reference data for further spectroscopic analysis.epresentative chromatograms of real samples that are taken from2, C3, FH2 and FH3 production lines are shown in Fig. 3. As indi-ated before, there were 9 different rolling systems including sheetnd foil rolling lines but for the sake of clarity only four of them areisplayed here. As seen from Fig. 3, the small peaks around 19.50nd 21.50 min indicate that the presence of Hydrotex Alu 16 is veryow in the real samples. On the other hand, total alu components
ave a number of peaks especially after 20 min retention times. Theeason for the three Nofol system chromatograms that were illus-rated in this figure is that FH2 and FH3 systems had high amount ofotal Alu contamination relative to any other system investigatedere. The results of the additives, total Alu components and Alu 1600 cm−1 wavenumbers. (a) With the real samples and (b) without the real samples.
and other components in real samples will be given later in thefollowing section as a comparison with multivariate spectroscopicanalysis results.
After completing chromatographic analysis of the standard andreal samples that would be included in the spectroscopic calibra-tion models, FTIR spectra of the same samples were collected.Fig. 4 shows the FTIR pure component spectra of the additivesand possible contaminants along with real samples. These spectrawere obtained against pure base oil Linpar background. The uppergraph shows all the pure components with a percent concentrationaround 1.0% (w/w) in Linpar and two real samples one from theNafol systems (C1) and the other from the Cindolube systems (C2).The bottom graph is obtained after removing real samples from theabove graph as C1 and especially C2 samples have much intensepeaks that hide the features of the other components. As seen frombottom graph, the Alu 46 has a very sharp peak around 1740 cm−1
and in fact, none of other components studied here gave a peak atthis wavenumber. Existence of this peak in the real samples can beclearly seen in the samples from C1 and C2 rolling systems. There-fore, a preliminary conclusion can be made at this moment for apossible Alu 46 contamination. In addition to Alu 46 contamina-tion, the presence of Alu 460 in the real samples is evident form theupper graph as seen from the enlarged region between 1600 and1800 cm−1. Here the peak around 1640 cm−1 is clearly due to Alu460 in real samples.
When the pure component spectra of other Alu series (Alu 16,Alu 100, 220, and 320) are examined it is seen that they all gavesome peaks around 900 and 1200 cm−1 regions but these peaks areall overlapped with not only themselves but also with the Nafoland Cindolube peaks. For this reason it is not easy to state directly
A. Yalcın et al. / Vibrational Spectroscopy 54 (2010) 10–20 17
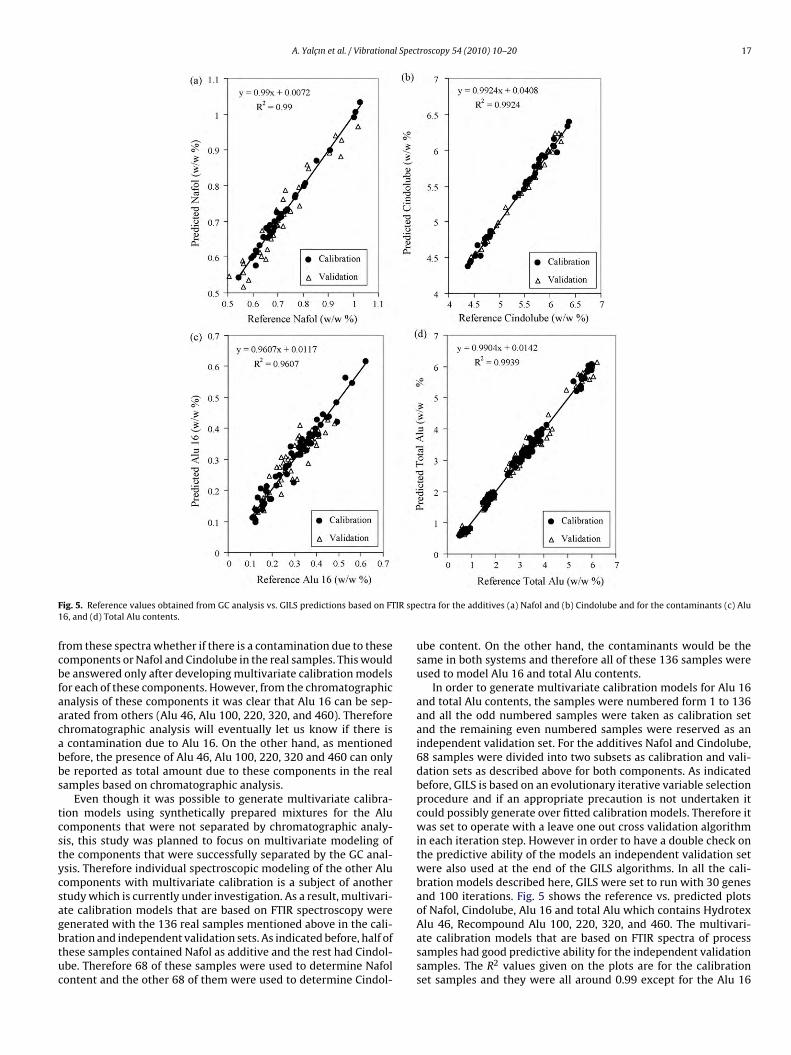
F IR spe1
fcbfaacabbs
tcstycsagbtuc
ig. 5. Reference values obtained from GC analysis vs. GILS predictions based on FT6, and (d) Total Alu contents.
rom these spectra whether if there is a contamination due to theseomponents or Nafol and Cindolube in the real samples. This woulde answered only after developing multivariate calibration modelsor each of these components. However, from the chromatographicnalysis of these components it was clear that Alu 16 can be sep-rated from others (Alu 46, Alu 100, 220, 320, and 460). Thereforehromatographic analysis will eventually let us know if there iscontamination due to Alu 16. On the other hand, as mentionedefore, the presence of Alu 46, Alu 100, 220, 320 and 460 can onlye reported as total amount due to these components in the realamples based on chromatographic analysis.
Even though it was possible to generate multivariate calibra-ion models using synthetically prepared mixtures for the Aluomponents that were not separated by chromatographic analy-is, this study was planned to focus on multivariate modeling ofhe components that were successfully separated by the GC anal-sis. Therefore individual spectroscopic modeling of the other Aluomponents with multivariate calibration is a subject of anothertudy which is currently under investigation. As a result, multivari-te calibration models that are based on FTIR spectroscopy were
enerated with the 136 real samples mentioned above in the cali-ration and independent validation sets. As indicated before, half ofhese samples contained Nafol as additive and the rest had Cindol-be. Therefore 68 of these samples were used to determine Nafolontent and the other 68 of them were used to determine Cindol-ctra for the additives (a) Nafol and (b) Cindolube and for the contaminants (c) Alu
ube content. On the other hand, the contaminants would be thesame in both systems and therefore all of these 136 samples wereused to model Alu 16 and total Alu contents.
In order to generate multivariate calibration models for Alu 16and total Alu contents, the samples were numbered form 1 to 136and all the odd numbered samples were taken as calibration setand the remaining even numbered samples were reserved as anindependent validation set. For the additives Nafol and Cindolube,68 samples were divided into two subsets as calibration and vali-dation sets as described above for both components. As indicatedbefore, GILS is based on an evolutionary iterative variable selectionprocedure and if an appropriate precaution is not undertaken itcould possibly generate over fitted calibration models. Therefore itwas set to operate with a leave one out cross validation algorithmin each iteration step. However in order to have a double check onthe predictive ability of the models an independent validation setwere also used at the end of the GILS algorithms. In all the cali-bration models described here, GILS were set to run with 30 genesand 100 iterations. Fig. 5 shows the reference vs. predicted plotsof Nafol, Cindolube, Alu 16 and total Alu which contains Hydrotex
Alu 46, Recompound Alu 100, 220, 320, and 460. The multivari-ate calibration models that are based on FTIR spectra of processsamples had good predictive ability for the independent validationsamples. The R2 values given on the plots are for the calibrationset samples and they were all around 0.99 except for the Alu 16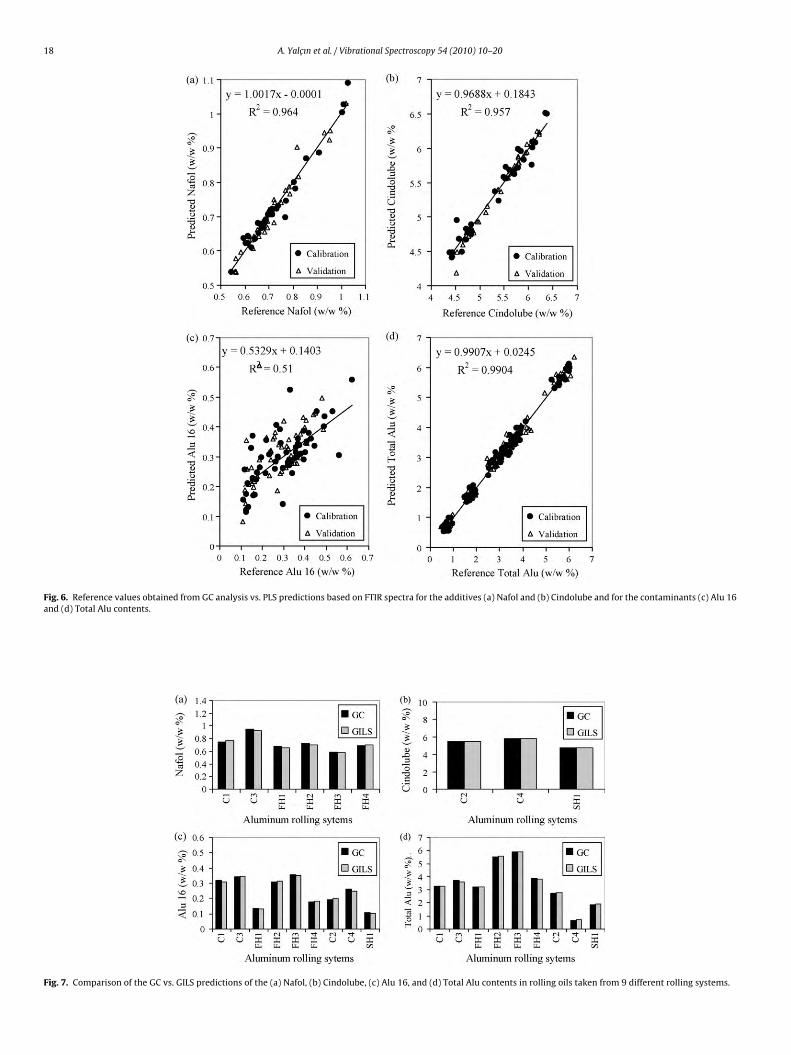
18 A. Yalcın et al. / Vibrational Spectroscopy 54 (2010) 10–20
Fa
F
ig. 6. Reference values obtained from GC analysis vs. PLS predictions based on FTIR specnd (d) Total Alu contents.
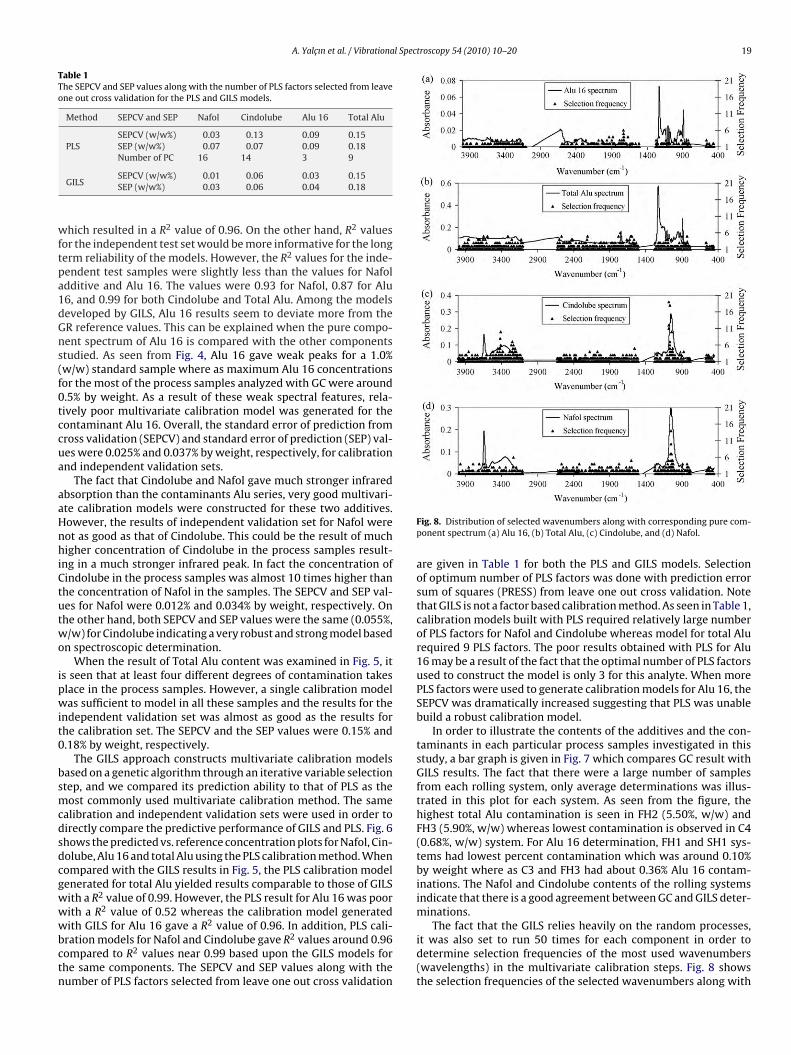
ig. 7. Comparison of the GC vs. GILS predictions of the (a) Nafol, (b) Cindolube, (c) Alu 1
tra for the additives (a) Nafol and (b) Cindolube and for the contaminants (c) Alu 16
6, and (d) Total Alu contents in rolling oils taken from 9 different rolling systems.
A. Yalcın et al. / Vibrational Spectroscopy 54 (2010) 10–20 19
Table 1The SEPCV and SEP values along with the number of PLS factors selected from leaveone out cross validation for the PLS and GILS models.
Method SEPCV and SEP Nafol Cindolube Alu 16 Total Alu
SEPCV (w/w%) 0.03 0.13 0.09 0.15PLS SEP (w/w%) 0.07 0.07 0.09 0.18
Number of PC 16 14 3 9
wftpa1dGns(f0tccua
aaHnhiCtutwo
ipwit0
bsmcdsdcgwwwbctn
The fact that the GILS relies heavily on the random processes,
GILSSEPCV (w/w%) 0.01 0.06 0.03 0.15SEP (w/w%) 0.03 0.06 0.04 0.18
hich resulted in a R2 value of 0.96. On the other hand, R2 valuesor the independent test set would be more informative for the longerm reliability of the models. However, the R2 values for the inde-endent test samples were slightly less than the values for Nafoldditive and Alu 16. The values were 0.93 for Nafol, 0.87 for Alu6, and 0.99 for both Cindolube and Total Alu. Among the modelseveloped by GILS, Alu 16 results seem to deviate more from theR reference values. This can be explained when the pure compo-ent spectrum of Alu 16 is compared with the other componentstudied. As seen from Fig. 4, Alu 16 gave weak peaks for a 1.0%w/w) standard sample where as maximum Alu 16 concentrationsor the most of the process samples analyzed with GC were around.5% by weight. As a result of these weak spectral features, rela-ively poor multivariate calibration model was generated for theontaminant Alu 16. Overall, the standard error of prediction fromross validation (SEPCV) and standard error of prediction (SEP) val-es were 0.025% and 0.037% by weight, respectively, for calibrationnd independent validation sets.
The fact that Cindolube and Nafol gave much stronger infraredbsorption than the contaminants Alu series, very good multivari-te calibration models were constructed for these two additives.owever, the results of independent validation set for Nafol wereot as good as that of Cindolube. This could be the result of muchigher concentration of Cindolube in the process samples result-
ng in a much stronger infrared peak. In fact the concentration ofindolube in the process samples was almost 10 times higher thanhe concentration of Nafol in the samples. The SEPCV and SEP val-es for Nafol were 0.012% and 0.034% by weight, respectively. Onhe other hand, both SEPCV and SEP values were the same (0.055%,/w) for Cindolube indicating a very robust and strong model based
n spectroscopic determination.When the result of Total Alu content was examined in Fig. 5, it
s seen that at least four different degrees of contamination takeslace in the process samples. However, a single calibration modelas sufficient to model in all these samples and the results for the
ndependent validation set was almost as good as the results forhe calibration set. The SEPCV and the SEP values were 0.15% and.18% by weight, respectively.
The GILS approach constructs multivariate calibration modelsased on a genetic algorithm through an iterative variable selectiontep, and we compared its prediction ability to that of PLS as theost commonly used multivariate calibration method. The same
alibration and independent validation sets were used in order toirectly compare the predictive performance of GILS and PLS. Fig. 6hows the predicted vs. reference concentration plots for Nafol, Cin-olube, Alu 16 and total Alu using the PLS calibration method. Whenompared with the GILS results in Fig. 5, the PLS calibration modelenerated for total Alu yielded results comparable to those of GILSith a R2 value of 0.99. However, the PLS result for Alu 16 was poorith a R2 value of 0.52 whereas the calibration model generatedith GILS for Alu 16 gave a R2 value of 0.96. In addition, PLS cali-
ration models for Nafol and Cindolube gave R2 values around 0.96ompared to R2 values near 0.99 based upon the GILS models forhe same components. The SEPCV and SEP values along with theumber of PLS factors selected from leave one out cross validation
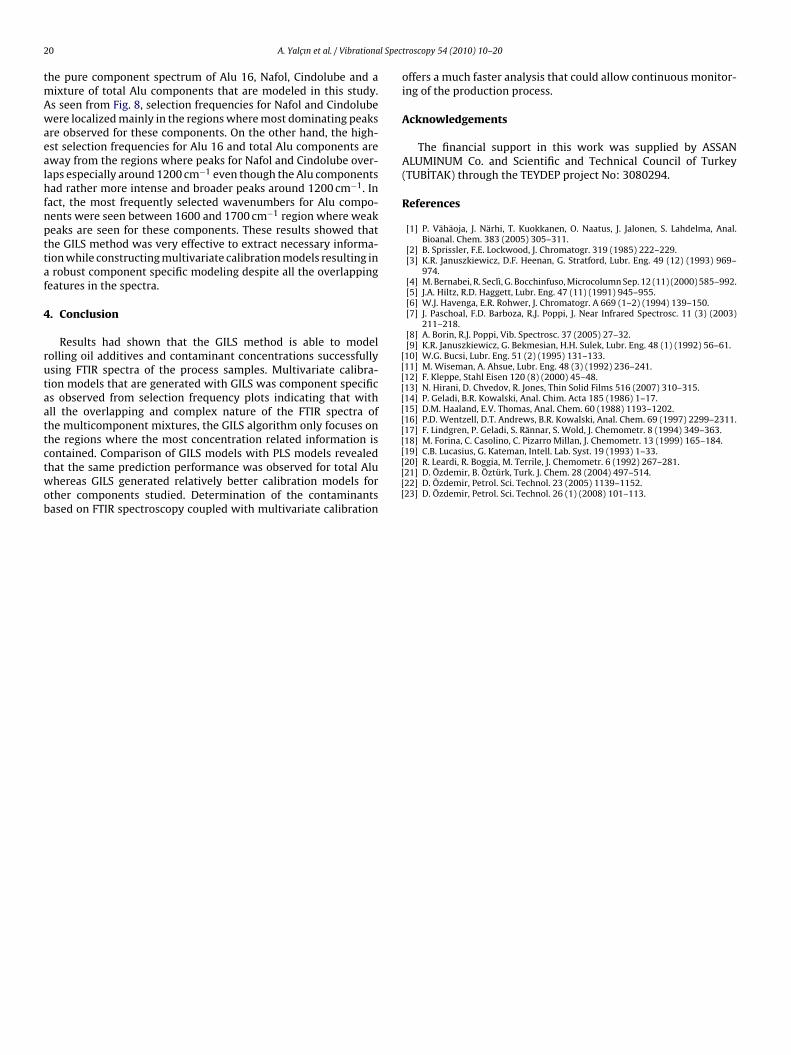
Fig. 8. Distribution of selected wavenumbers along with corresponding pure com-ponent spectrum (a) Alu 16, (b) Total Alu, (c) Cindolube, and (d) Nafol.
are given in Table 1 for both the PLS and GILS models. Selectionof optimum number of PLS factors was done with prediction errorsum of squares (PRESS) from leave one out cross validation. Notethat GILS is not a factor based calibration method. As seen in Table 1,calibration models built with PLS required relatively large numberof PLS factors for Nafol and Cindolube whereas model for total Alurequired 9 PLS factors. The poor results obtained with PLS for Alu16 may be a result of the fact that the optimal number of PLS factorsused to construct the model is only 3 for this analyte. When morePLS factors were used to generate calibration models for Alu 16, theSEPCV was dramatically increased suggesting that PLS was unablebuild a robust calibration model.
In order to illustrate the contents of the additives and the con-taminants in each particular process samples investigated in thisstudy, a bar graph is given in Fig. 7 which compares GC result withGILS results. The fact that there were a large number of samplesfrom each rolling system, only average determinations was illus-trated in this plot for each system. As seen from the figure, thehighest total Alu contamination is seen in FH2 (5.50%, w/w) andFH3 (5.90%, w/w) whereas lowest contamination is observed in C4(0.68%, w/w) system. For Alu 16 determination, FH1 and SH1 sys-tems had lowest percent contamination which was around 0.10%by weight where as C3 and FH3 had about 0.36% Alu 16 contam-inations. The Nafol and Cindolube contents of the rolling systemsindicate that there is a good agreement between GC and GILS deter-minations.
it was also set to run 50 times for each component in order todetermine selection frequencies of the most used wavenumbers(wavelengths) in the multivariate calibration steps. Fig. 8 showsthe selection frequencies of the selected wavenumbers along with
2 l Spec
tmAwaealhfnpttaf
4
rutaattctwob
[[[[[[[[[18] M. Forina, C. Casolino, C. Pizarro Millan, J. Chemometr. 13 (1999) 165–184.
0 A. Yalcın et al. / Vibrationa
he pure component spectrum of Alu 16, Nafol, Cindolube and aixture of total Alu components that are modeled in this study.s seen from Fig. 8, selection frequencies for Nafol and Cindolubeere localized mainly in the regions where most dominating peaks
re observed for these components. On the other hand, the high-st selection frequencies for Alu 16 and total Alu components areway from the regions where peaks for Nafol and Cindolube over-aps especially around 1200 cm−1 even though the Alu componentsad rather more intense and broader peaks around 1200 cm−1. In
act, the most frequently selected wavenumbers for Alu compo-ents were seen between 1600 and 1700 cm−1 region where weakeaks are seen for these components. These results showed thathe GILS method was very effective to extract necessary informa-ion while constructing multivariate calibration models resulting inrobust component specific modeling despite all the overlapping
eatures in the spectra.
. Conclusion
Results had shown that the GILS method is able to modelolling oil additives and contaminant concentrations successfullysing FTIR spectra of the process samples. Multivariate calibra-ion models that are generated with GILS was component specifics observed from selection frequency plots indicating that withll the overlapping and complex nature of the FTIR spectra ofhe multicomponent mixtures, the GILS algorithm only focuses onhe regions where the most concentration related information is
ontained. Comparison of GILS models with PLS models revealedhat the same prediction performance was observed for total Aluhereas GILS generated relatively better calibration models forther components studied. Determination of the contaminantsased on FTIR spectroscopy coupled with multivariate calibration
[[[[[
troscopy 54 (2010) 10–20
offers a much faster analysis that could allow continuous monitor-ing of the production process.
Acknowledgements
The financial support in this work was supplied by ASSANALUMINUM Co. and Scientific and Technical Council of Turkey(TUBITAK) through the TEYDEP project No: 3080294.
References
[1] P. Vähäoja, J. Närhi, T. Kuokkanen, O. Naatus, J. Jalonen, S. Lahdelma, Anal.Bioanal. Chem. 383 (2005) 305–311.
[2] B. Sprissler, F.E. Lockwood, J. Chromatogr. 319 (1985) 222–229.[3] K.R. Januszkiewicz, D.F. Heenan, G. Stratford, Lubr. Eng. 49 (12) (1993) 969–
974.[4] M. Bernabei, R. Seclì, G. Bocchinfuso, Microcolumn Sep. 12 (11) (2000) 585–992.[5] J.A. Hiltz, R.D. Haggett, Lubr. Eng. 47 (11) (1991) 945–955.[6] W.J. Havenga, E.R. Rohwer, J. Chromatogr. A 669 (1–2) (1994) 139–150.[7] J. Paschoal, F.D. Barboza, R.J. Poppi, J. Near Infrared Spectrosc. 11 (3) (2003)
211–218.[8] A. Borin, R.J. Poppi, Vib. Spectrosc. 37 (2005) 27–32.[9] K.R. Januszkiewicz, G. Bekmesian, H.H. Sulek, Lubr. Eng. 48 (1) (1992) 56–61.10] W.G. Bucsi, Lubr. Eng. 51 (2) (1995) 131–133.11] M. Wiseman, A. Ahsue, Lubr. Eng. 48 (3) (1992) 236–241.12] F. Kleppe, Stahl Eisen 120 (8) (2000) 45–48.13] N. Hirani, D. Chvedov, R. Jones, Thin Solid Films 516 (2007) 310–315.14] P. Geladi, B.R. Kowalski, Anal. Chim. Acta 185 (1986) 1–17.15] D.M. Haaland, E.V. Thomas, Anal. Chem. 60 (1988) 1193–1202.16] P.D. Wentzell, D.T. Andrews, B.R. Kowalski, Anal. Chem. 69 (1997) 2299–2311.17] F. Lindgren, P. Geladi, S. Rännar, S. Wold, J. Chemometr. 8 (1994) 349–363.
19] C.B. Lucasius, G. Kateman, Intell. Lab. Syst. 19 (1993) 1–33.20] R. Leardi, R. Boggia, M. Terrile, J. Chemometr. 6 (1992) 267–281.21] D. Özdemir, B. Öztürk, Turk. J. Chem. 28 (2004) 497–514.22] D. Özdemir, Petrol. Sci. Technol. 23 (2005) 1139–1152.23] D. Özdemir, Petrol. Sci. Technol. 26 (1) (2008) 101–113.
Related Documents