Lincoln University Digital Thesis Copyright Statement The digital copy of this thesis is protected by the Copyright Act 1994 (New Zealand). This thesis may be consulted by you, provided you comply with the provisions of the Act and the following conditions of use: you will use the copy only for the purposes of research or private study you will recognise the author's right to be identified as the author of the thesis and due acknowledgement will be made to the author where appropriate you will obtain the author's permission before publishing any material from the thesis.

Welcome message from author
This document is posted to help you gain knowledge. Please leave a comment to let me know what you think about it! Share it to your friends and learn new things together.
Transcript
Lincoln University Digital Thesis
Copyright Statement
The digital copy of this thesis is protected by the Copyright Act 1994 (New Zealand).
This thesis may be consulted by you, provided you comply with the provisions of the Act and the following conditions of use:
you will use the copy only for the purposes of research or private study you will recognise the author's right to be identified as the author of the thesis and
due acknowledgement will be made to the author where appropriate you will obtain the author's permission before publishing any material from the
thesis.
DETERMINATION AND REMOVAL OF
GLUCONIC ACID IN REDUCED ALCOHOL
WINE AND HIGH ACID GRAPE JUICE
A thesis
submitted in partial fulfilment
of the requirements for· the Degree
of
Master of Applied Science
at Lincoln University
by
Rhyan C. Wardman
Lincoln University
1995
Abstract of a thesis submitted in partial fulfilment of the
requirements for the Degree of Master of Applied Science.
DETERMINATION AND REMOVAL OF
GLUCONIC ACID IN REDUCED ALCOHOL WINE
AND HIGH ACID GRAPE JUICE
by Rbyan C. Wardman
A rapid high performance liquid chromatography (HPLC) method incorporating the use of an
Aminex HPX -87H organic acid column was developed for the separation, identification and
quantitative analysis of gluconic acid and other major acids in grape juice and wine. This
method was used to investigate the effectiveness of deacidification treatments for removing
gluconic acid from high acid grape juice and reduced alcohol wine produced by using a
glucose oxidase-catalase (GOD/CAT) juice treatment.
MOller Thurgau juice was subjected to a GOD/CAT treatment as a means of reducing the
concentration of glucose in the grape juice before fermentation to produce a reduced alcohol
wine. The enzyme is an aerobic dehydrogenase which catalyses the oxidation of glucose to
gluconic acid. The juice was found to contain -75g/L gluconic acid, and when a portion of
this was fermented to dryness and cold stabilised, the gluconic acid had reduced in
concentration to -45g/L and the reduced alcohol wine contained 8.3% alcohol (v/v). The
11
corresponding increase in acidity in both the reduced sugar juice and reduced alcohol wine
had to be neutralised to present a palatable product.
Three deacidification treatments were investigated in reduced alcohol wines and high acid
grape juice and these included: neutralisation with CaC03 (calcium carbonate), seeding with
gluconate salts and CaC03, and anion exchange with an Amberlite IRA-93 resin. Both the
neutralisation and seeding treatments produced disappointing results, with a significant but
minimal decrease in gluconic, tartaric and malic acids. Even though the solutions analysed
would have been saturated with potassium tartrate and gluconate, there was obviously a stable
equilibrium in force, and the addition of seed crystals and chilling to _2°C had no effect. The
anion exchange treatment showed considerable promise though, with reduction in all the
three major organic acids. A new technique was investigated, which involved charging the
resin with tartaric acid, and then passing the wine/juice through. The weaker gluconic acid in
solution exchanged with the stronger tartaric acid. This technique has the potential to
selectively remove gluconic acid. A hindrance to this technique is the removal of colour from
the wine/juice due to the resin matrix. The effect of resins on colour and flavour warrants
further investigation.
KEYWORDS: High performance liquid chromatography (HPLC); gluconic acid;
glucose oxidase-catalase; deacidification; reduced alcohol wine;
neutralisation; seeding; anion exchange.
Wine is a chemical symphony composed of ethyl alcohol,
several other alcohols, sugars, other carbohydrates, polyphenols,
aldehydes, ketones, enzymes, pigments, at least half a dozen vitamins,
15 to 20 minerals, more than 22 organic acids, and other
grace notes that have not yet been identified.
iii
Maynard Amerine, 1911-
TABLE OF CONTENTS
ABSTRACT
PREFACE
TABLE OF CONTENTS
LIST OF TABLES
LIST OF FIGURES
LIST OF APPENDICES
CHAPTERl INTRODUCTION
1.1 GENERAL INTRODUCTION
1.2 ACIDITY
1.2.1 Quality Attributes 1.2.2 Chemistry 1.2.3 Benefits
1.3 OBJECTIVES
CHAPTER 2 GLUCONIC ACID
CHAPTER 3
2.1 REVIEW OF LITERATURE
2.2 GLUCOSE OXIDASE-CATALASE (GOD/CAT)
3.1
3.2
2.2.1 Introduction 2.2.2 Preparation of High Acid Juice and Reduced
Alcohol Wine 2.2.3 Materials and Methods 2.2.4 Results and Discussion 2.2.5 Conclusions
IDGH PERFORMANCE LIQUID CHROMATOGRAPHY
3.1.1 3.1.2
REVIEW OF LITERATURE
Introduction Organic Acid Column
MATERIALS AND METHODS
iv
III
IV
vii
viii
ix
1
4
4 5 6
8
10
12
12
15 15 16 18
19
19 21
22
::. :.>:-~~:::::=.>
;:~~;?E~~~~
-., ,-.
I; c •. ','<',
,e
v
3.2.1 Standard Solutions 22 3.2.2 Sample Preparation 22 ~~:i~~:~~~;~: 3.2.3 High Performance Liquid Chromatography 24
3.3 RESULTS AND DISCUSSION 25
3.3.1 Calibration 29 3.3.2 Recovery Efficiency 31 3.3.3 Capacity Factors 32 3.3.4 Gluconic Acid 34
3.4 CONCLUSIONS 35
CHAPTER 4 CHEMICAL DEACIDIFICATION
4.1 REVIEW OF LITERATURE 37
4.1.1 Cold Stabilisation 37 4.1.2 Neutralisation 38
4.1.2.1 Chemistry 40 4.1.2.2 Kinetics 42
4.1.3 Seeding 44
4.2 MATERIALS AND METHODS 48
4.2.1 Standards 48 4.2.2 Preparation of High Acid Juice and Reduced
Alcohol Wine 48 4.2.3 Neutralisation 49 4.2.4 Cold Stabilisation 50 4.2.5 Seeding 50 4.2.6 Statistical Analyses 51 4.2.7 Chemical Analyses 51
4.3 RESULTS AND DISCUSSION 52 f;:;·::7·:-::-;--· "-", - .. '~ ~ -'.
4.3.1 Cold Stabilisation 52 4.3.2 Neutralisation 54 4.3.3 Seeding 56
4.4 CONCLUSIONS 61
4.4.1 Neutralisation 61 4.4.2 Seeding 62
VI
CHAPTERS ANION EXCHANGE ~,.-;< .. ;:+:;-. b~t=@~
5.1 REVIEW OF LITERATURE 63
5.1.1 General Introduction 63 5.1.2 Chemistry 64 5.1.3 Principles 67
5.2 MATERIALS AND METHODS 70
5.2.1 Analytical Methods 70 5.2.2 Preparation of High Acid Juice and Reduced
Alcohol Wine 70 5.2.3 Anion Exchange 71
5.3 RESULTS AND DISCUSSION 72
5.3.1 Resin Capacity 72 5.3.2 Charging Capacity 73 5.3.3 Deacidification 74
5.4 CONCLUSIONS 78
CHAPTER 6 OVERALL CONCLUSION
6.1 HIGH PERFORMANCE LIQUID CHROMATOGRAPHY 79
6.2 CHEMICAL DEACIDIFICATION 80
6.2.1 Neutralisation 80 6.2.2 Seeding 81 k'- ',c"',
6.3 ANION EXCHANGE 82
6.4 FURTHER RESEARCH 83
ACKNOWLEDGMENTS 84
REFERENCES 85
APPENDICES 96
vii
LIST OF TABLES
PAGE
TABLE
3.1 Recovery efficiency of acids from high acid juice and reduced alcohol wine. 32
4.1 Analysis of juice and wine produced by the glucose oxidase-catalase treatment. 49
4.2 The effect of cold stabilisation on organic acid concentration in reduced alcohol wine. 52
4.3 The effect of cold stabilisation on organic acid concentration in high acid grape juice. 53
4.4 The effect of neutralisation with calcium carbonate on organic acid concentration in high acid juice. 55
4.5 The effect of neutralisation with calcium carbonate on organic acid concentration in reduced alcohol wine. 56
4.6 The effect of sodium gluconate seeding on organic acid concentration in high acid juice. 57
4.7 The effect of sodium gluconate seeding on organic acid concentration in reduced alcohol wine. 58
4.8 The effect of calcium gluconate seeding on organic acid concentration in high acid juice. 59
4.9 The effect of calcium gluconate seeding on organic acid concentration in reduced alcohol wine. 60
5.1 pH and TA of wine and juice, before and after anion exchange treatment. 74
5.2 Anion exchange of high acid juice. 77
5.3 Anion exchange of reduced alcohol wine. 77
VIU
LIST OF FIGURES
PAGE FIGURE
1.1 Exchange of protons for potassium ions in grape berry cell. 2
~~t~ 1.2 Flow diagram of deacidification treatments. 9
2.1 Conversion of glucose to gluconic acid. 13
2.2 pH and T A of MUller Thurgau juice undergoing enzymatic treatment. 17
3.1 HPLC separation of acid standards. 26
3.2 HPLC chromatogram of a high acid juice sample. 27
3.3 HPLC chromatogram of a reduced alcohol wine sample.] 28
3.4 Calibration curve for tartaric acid. 29
3.5 Calibration curve for malic acid. 30
3.6 Calibration curve for gluconic acid. 30
3.7 Effect of solvent concentration on the capacity factor (k') of the major organic acids. 33
4.1 Limits of several deacidification methods in musts and wines. 39
4.2 Formation of double-salt crystals. 47
5.1 Structural formula for anion exchanger 66
5.2 Capacity of resin. 72 :.:.:-::::~ ~ . -,: l:' ~':'~ : ~':": .
5.3 Charging capacity of resin. 73 1"_ ..
5.4 Effect of anion exchange on organic acid concentration in reduced alcohol wme. 75
5.5 Effect of anion exchange on organic acid concentration in high acid juice. 76
IX
LIST OF APPENDICES
PAGE APPENDIX
2.1 Behaviour of organic acids in high acid juice during cold stabilisation. 96
2.2 pH and titratable acidity during cold stabilisation of high acid juice. 97
2.3 Behaviour of organic acids in reduced alcohol wine during cold stabilisation. 98
2.4 pH and titratable acidity during cold stabilisation of reduced alcohol wine. 99
3.1 Behaviour of organic acids during neutralisation of reduced alcohol wine with increasing dosages of calcium carbonate. 100
3.2 pH and titratable acidity during neutralisation of reduced alcohol wine. 101
3.3 Behaviour of organic acids during neutralisation of high acid juice with increasing dosages of calcium carbonate. 102
3.4 pH and titratable acidity during neutralisation of high acid juice. 103
3.5 Sodium gluconate seeding of high acid juice. Calcium carbonate was added proportionally to make up a IglL dosage application. 104
3.6 Calcium gluconate seeding of high acid juice. Calcium carbonate was added proportionally to make up a IglL dosage application. 105
3.7 Sodium gluconate seeding of reduced alcohol wine. Calcium carbonate was added proportionally to make up a 19IL dosage application. 106
3.8 Calcium gluconate seeding of reduced alcohol wine. Calcium carbonate was added proportionally to make up a 1 gIL dosage application. 107
3.9 pH and titratable acidity of sodium gluconate seeded reduced alcohol wine. 108
4.0 pH and titratable acidity of sodium gluconate seeded high acid juice. 109
5.1 Anion exchange treatment of model acid solution buffered to pH 3.1. 110
1
CHAPTER ONE
INTRODUCTION
1.1 GENERAL INTRODUCTION
There are two distinct climate types in which grapes are grown for winemaking. Wines from
grapes grown in warm climates such as Australia, South Africa and California are generally
"bland", "soft", higher in alcohol, and low in acidity. Cool climate regions e.g., New
Zealand, often produce wines that are fruitier, lower in alcohol, higher in acidity, and more
delicate and subtle in aroma and flavour. However this environment is marginal for attaining
adequate ripeness in grapes and they often do not reach maturity before they are harvested.
The sugar content of the grapes may be too low andlor the acidity may be too high.
The practice of adding sugar to accommodate this natural deficiency is used widely in cool
viticultural areas, even if it is not altogether desirable (Amerine and Ough, 1980). The
addition of sugar has no adverse effects on the wine quality and is easily incorporated into
winery operations. Reducing excess acidity in winemaking is a different matter. There are
several alternative methods available to the winemaker for reducing acidity. Some require
considerable skill and calculation, and some can have significant secondary effects on wine
quality.
At veraison, malic and tartaric acids have been accumulated in the berry. During the phase of
berry ripening as sugar is accumulating the malic acid concentration decreases due to dilution
as a result of water uptake and conversion of acids to salts.
2
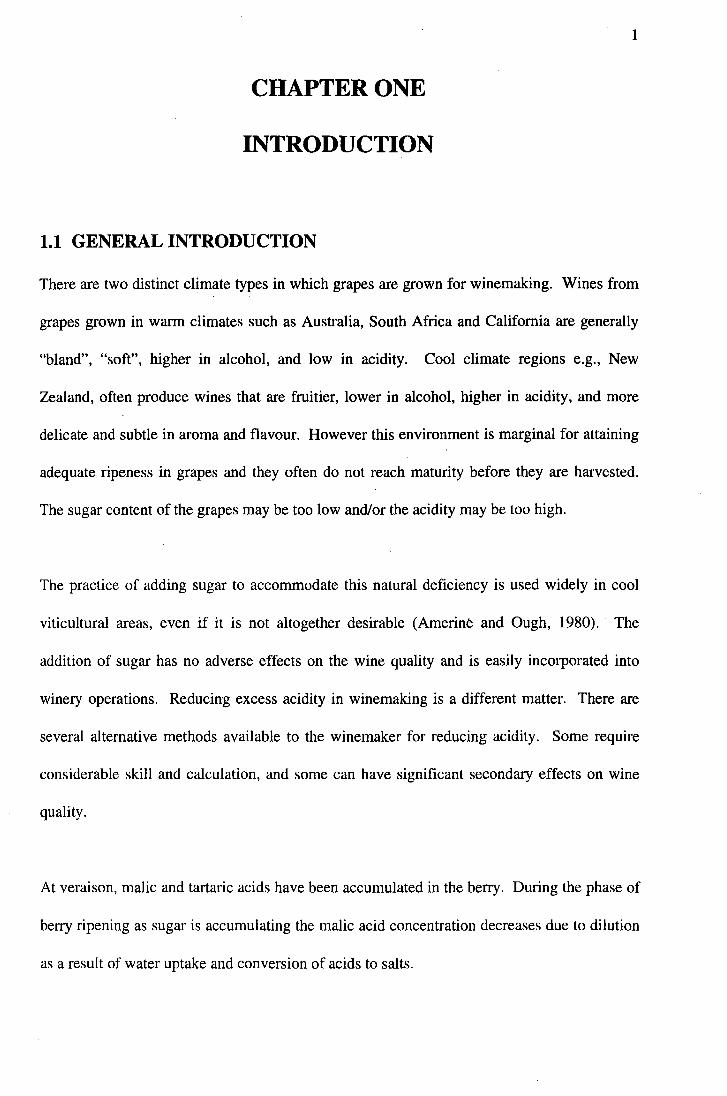
With tartaric acid, the concentration will change due to dilution but tartrate does not normally
get metabolised within· the berry. At veraison tartaric acid exists in the form of H2 T and its
usual form HT. Boulton (1984), proposed that the protons of the organic acids (tartaric acid)
in the berry cells are exchanged for potassium ions. Effectively it increases the conversion of
tartaric acid to the bitartrate ion HT or KHT. This reaction can continue where ditartrate ions
are formed T2- or K2T.
Crape /JerI}' Cell
Figure 1.1. Exchange of protons for potassium ions in grape berry cell.
Therefore at maturity we have different combinations of the forms of tartaric acid, different
amounts of malic acid and different amounts of potassium. The varying amounts of the forms
of tartrate with the undissociated malic acid that enter the juice at crushing determine the
juice pH and titratable acidity level (Iland, 1987).
The acidity measures most commonly used are the titratable acidity and pH. These are both
dependent variables that basically tells the winemaker little about the independent variables
of tartaric acid, malic acid and potassium concentrations. A simple measure of the organic
3
acid pool can be obtained by noting the quantity of base required to neutralise the must by one
pH unit. The number of hydroxide ions (moles) required to raise the pH by one unit in a litre
of must is defined as the buffer capacity. It is the numerical indication of the resistance of an
acid mixture to a change of pH. More importantly it can be used to estimate the sum of
tartaric and malic acid concentrations by solving the acidity relationships (Berg and Keefer,
1958) together with the exact buffer equations for tartaric and malic acid.
The third and major acid that will be examined in this thesis is gluconic acid. This acid is
created from the conversion of glucose to gluconic acid by the glucose oxidase-catalase
enzyme. The removal of glucose from the grapejuice means that less sugar is available to be
converted to alcohol by fermentation with saccharomyces cerevisiae yeast. With less alcohol
being produced the resulting product can be termed as reduced alcohol wine.
There are several methods of acid reduction with the aim of improving wine quality through
achieving better acid balance. These include neutralisation of wines with K2C03 and CaC03
(McKinnon et aI., 1992; Nagel, Johnson and Carter, 1975; Munyon and Nagel, 1977);
calcium double salt deacidification of musts (Steele and Kunkee, 1978; Abgueguen and
Boulton, 1993; Clark, Fugelsang and Gump, 1988); malic acid fermentation to ethanol and
CO2 with Schizosaccharomyces pombe in musts (Gallander, 1977; Magyar and Panyik,
1989); Leuconostocoenos ML-34 in wines (reds) (Munyon and Nagel, 1977), and the use of
anion exchange resins (Rankine, 1965; Bonorden, Nagel and Powers, 1986; Zubeckis,
1957).
4
1.2 ACIDITY
1.2.1 QUALITY AITRIBUTES
Grape quality may be determined by parameters such as sugar concentration, pH, titratable
acidity (TA), terpene concentration and by the intensity of varietal aroma and flavour in the
juice. The final balance of these parameters determines overall grape qUality. To produce
good wine, the sugar, acid, and tannin content of the grapes should be properly balanced
(Amerine, 1980).
However no component of the wine has such extensive and important functions as the acidity.
The most important function is the tart taste imparted by· the acids. Additionally, the acidity
has an important influence on the colour, clarity and stability of the wine. The acids in wine
have important secondary effects on quality, e.g., functioning as substrates for microbial
metabolism and increase sensory complexity of wine. However the most readily apparent
aspect of the acidity is its effect on taste. If too little acid is present in the juice, the resultant
wine will cause it to taste sour rather than pleasantly tart (Rankine, 1991).
Wine tartness is influenced by the types and amounts of the various acids present, the
buffering capacity of the wine, and the sugar and other components present. The reduction of
excess acidity to a level providing appropriate tartness does not cause problems with wine
colour or stability provided the method employed does not alter pH excessively. A
dealcoholised wine is much more tart tasting than the same wine with its alcohol (Amerine
and Ough, 1980). At low concentrations ethanol has only a slight odour, suggestion of
sweetness and it moderates the taste of acids. Therefore with the production of reduced
5
alcohol wine by the glucose oxidase-catalase (GOD/CAT) enzyme process (refer to Chapter
2), not only is there an increase in tartness through the production of gluconic acid, but also
there is an added effect through the reduction in alcohol.
1.2.2 CHEMISTRY
The acid taste is due to the hydrogen ion concentration and undissociated acid, hence there is
no direct relationship between pH and acid taste (Amerine, Roessler and Ough, 1965). When
discussing the interpretation of acidity parameters in grape juice it is necessary to consider
pH, titratable acidity (TA), and total acidity:
• pH - relates to the concentration of free hydrogen ions in the solution, i.e., [H+] in
• TA - gives the total available titratable hydrogen in solution,
• Total acidity - gives the total available amounts of organic acid anions in solution.
The pH of the grape juice or wine has been determined by the amounts of tartaric acid,
bitartrate, and malic acid. The titratable acidity has only been determined by the amount of
tartaric acid, bitartrate and malic acid because the di-potassium tartrate does not have any
titratable protons (Hand, 1987).
The acid taste of must and wine is related to both the free hydrogen ion concentration (pH)
and to the undissociated acid components (largely determined by the titratable acidity). Little
is known concerning the optimum relationship between pH and total acidity in regard to
6
sensory quality of wine. Nagel and McElvain (1977), attempted to detennine this relationship
for table wines based on sensory scores of wines where pH and total acidity data were known.
They found in white table wines with pH values in the range 3.05-3.20, 3.20-3.30, and 3.30-
3.50 that optimum range of total acidities were 0.60-0.65%, 0.60-0.85%, and 0.85%
respectively.
A net loss in titratable acidity is usually experienced when comparing the grape must to the
finished wine. Kluba and Beelman (1975) reports that the greatest loss occurs with these
varieties highest in initial titratable acidity and that tartrates decreased more than malates
during vinification, due to the precipitation of potassium bitartrate. As the alcohol content
increases during fermentation, the solubility of potassium"bitartrate decreases, and a portion is
precipitated from the wine. Since crystallisation of the excess potassium bitartrate is not
immediate, wineries commonly employ low temperatures to accelerate the precipitation.
Tartrate holding capacity of a particular wine depends upon its pH, alcohol, potassium, and
tartrate contents (Berg and Keefer, 1958), among other things.
1.2.3 BENEFITS
Low pH (high acidity) has the following important advantages in processing and increasing
quality:
• Increases the antimicrobial and antioxidant properties of S02.
• Inhibits microbial spoilage.
• encourages clarification of juices and wines.
• Generally accentuates the fruitiness and balance of wines.
7
Very little research has been done on the sensory attributes of the acid components in juice
and wine. Amerine, Roessler and Ough (1965) employed a trained panel to rank the sourness
of the different acids found in wine at the same total acidity and found
malic>tartaric>citric>lactic. No research has been done on the sensory attribut~s of gluconic
acid, although Gump and Kupina (1979), reported that gluconic acid and lactones had a sweet
acid taste. This would be an attractive attribute, as this would compliment the relatively
harsh tartaric and malic acids in the reduced alcohol wine produced from the GOD/CAT
enzyme process (refer Chapter 2).
Organic acids play an important role in determining wine quality, with each acid contributing
its own characteristic taste. Malic acid has a sour taste reminiscent of unripe apples or
gooseberries (Fowles, 1992), while gluconic acid has a relatively sweet acid taste (Gump and
Kupina, 1979). In (lddition, organic acids and their salts act as buffers, thus ensuring that the
wine maintains a relatively low pH, approximately 3.0 to 3.7; this helps to protect the wine
against bacterial attack and subsequent spoilage. These acids help to conserve wine colour
and influence esterification with a consequent change to the bouquet.
8
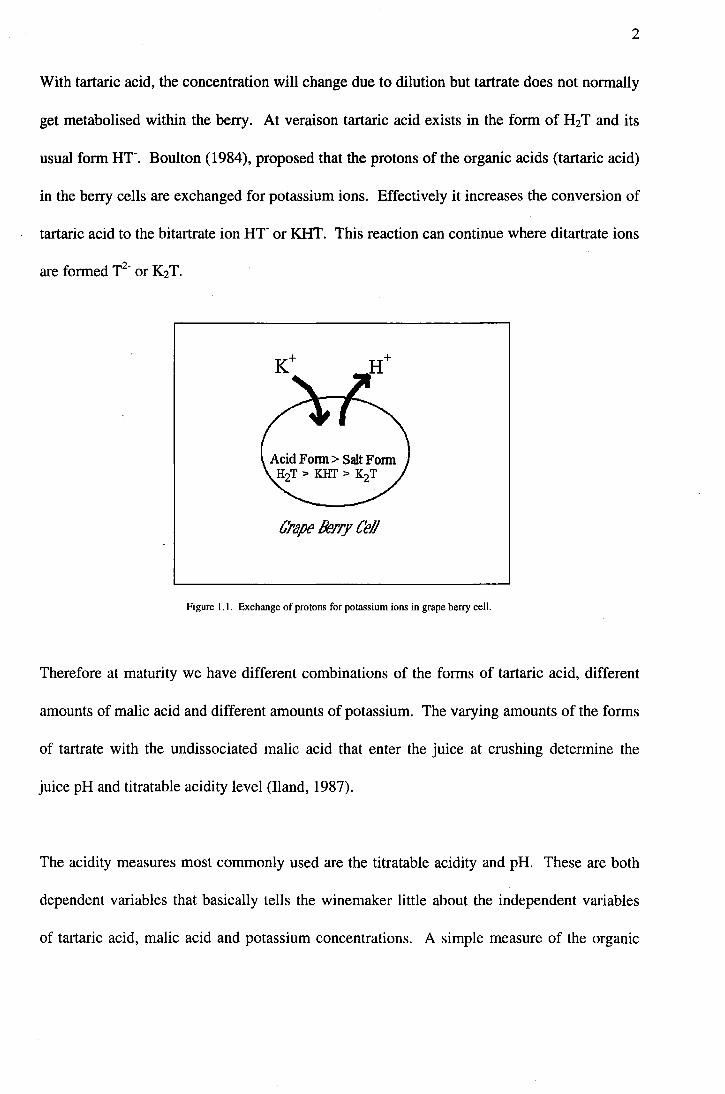
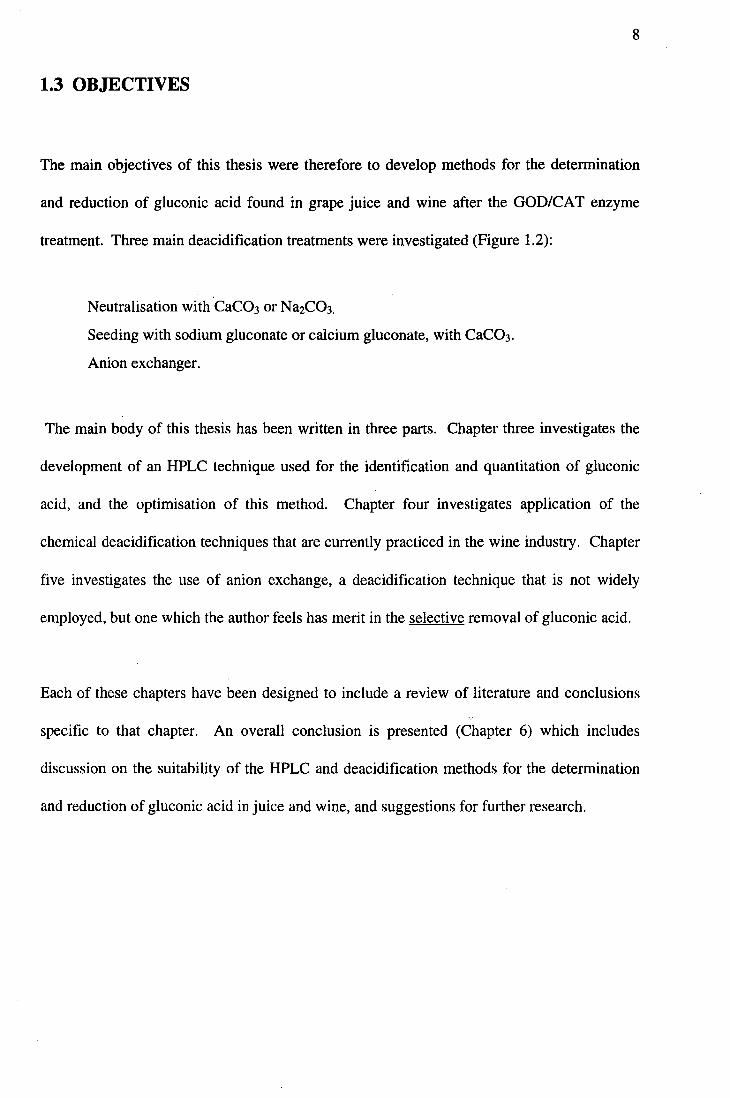
1.3 OBJECTIVES
The main objectives of this thesis were therefore to develop methods for the detennination
and reduction of gluconic acid found in grape juice and wine after the GOD/CA T enzyme
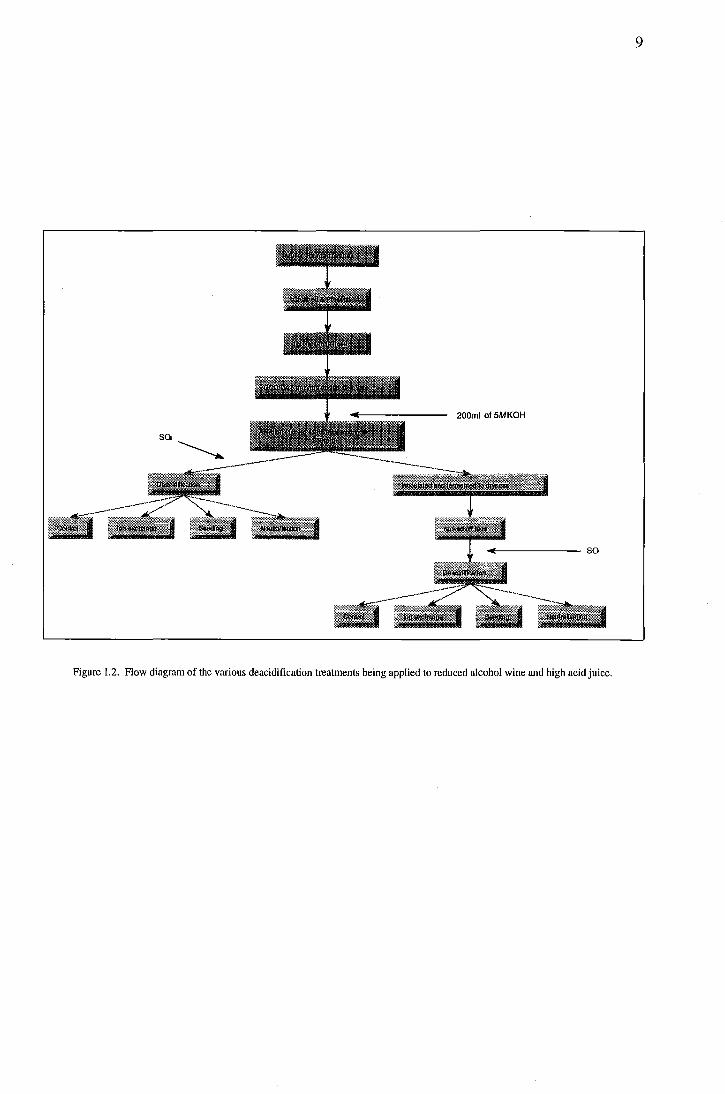
treatment. Three main deacidification treatments were investigated (Figure 1.2):
Neutralisation with CaC03 or Na2C03.
Seeding with sodium gluconate or calcium gluconate, with CaC03.
Anion exchanger.
The main body of this thesis has been written in three parts. Chapter three investigates the
development of an HPLC technique used for the identification and quantitation of gluconic
acid, and the optimisation of this method. Chapter four investigates application of the
chemical deacidification techniques that are currently practiced in the wine industry. Chapter
five investigates the use of anion exchange, a deacidification technique that is not widely
employed, but one which the author feels has merit in the selective removal of gluconic acid.
Each of these chapters have been designed to include a review of literature and conclusions
specific to that chapter. An overall conclusion is presented (Chapter 6) which includes
discussion on the suitability of the HPLC and deacidification methods for the determination
and reduction of gluconic acid in juice and wine, and suggestions for further research.
9
200ml of 5MKOH
SQ
Figure 1.2. Flow diagram of the various deacidification treatments being applied to reduced alcohol wine and high acid juice.
CHAPTER TWO
GLUCONIC ACID
2.1 REVIEW OF LITERATURE
10
During normal vinificatiol1, gluconic acid is present in trace amounts in the grape juice and
resulting wine. These amounts are so small that there is very little research done on this
organic acid in relation to wine production.
Gump and Kupina (1979), and McLoskey (1974) have both determined the presence of
gluconic acid in wines, produced by Botrytis cinerea mould. Gluconic acid is the oxidised
product (aldonic acid) of glucose. The aldehyde group of glucose is oxidised to the carboxyl
group by the action-of the enzyme, glucose oxidase.
McLoskey (1974) reported levels of gluconic acid in red and white California table wines.
The analysis was performed by an enzymatic procedure involving a coupled reaction with
gluconate kinase (reaction 1) and 6-phosphogluconate dehydrogenase (reaction 2). The assay
mechanism was based on the following reactions:
1) D-gluconate + ATP <=> gluconate-6-phosphate + ADP
2) gluconate-6-phosphate + NADP+ <=> ribulose-5-phosphate + NADPH + H+ + CO2
Another method of quantitatively determining gluconic acid in wine has been reported by
Gump and Kupina (1979). Following treatment with activated charcoal, filtration, acids were
11
absorbed on an ionite column. The acids were then eluted with fonnic acid and estimated
colourimetrically by periodic acid oxidation in a fuchsin-sulfurous acid solution.
Blake, Clarke and Richards (1984) have also analysed gluconic acid in biological fluids,
using high performance liquid chromatography (HPLC) on a column packed with Aminex A-
28 anion exchange resin, using ammonium formate as the eluent. RajakyHi (1981) reported a
method used for the determination of gluconic acid and sodium gluconate as well as other
acids formed in biochemical or catalytic oxidations of glucose. The acids were separated on a
column of cation exchange resin and eluted with dilute sulphuric acid. The effluent was
monitored by an ultraviolet detector at 21Onm.
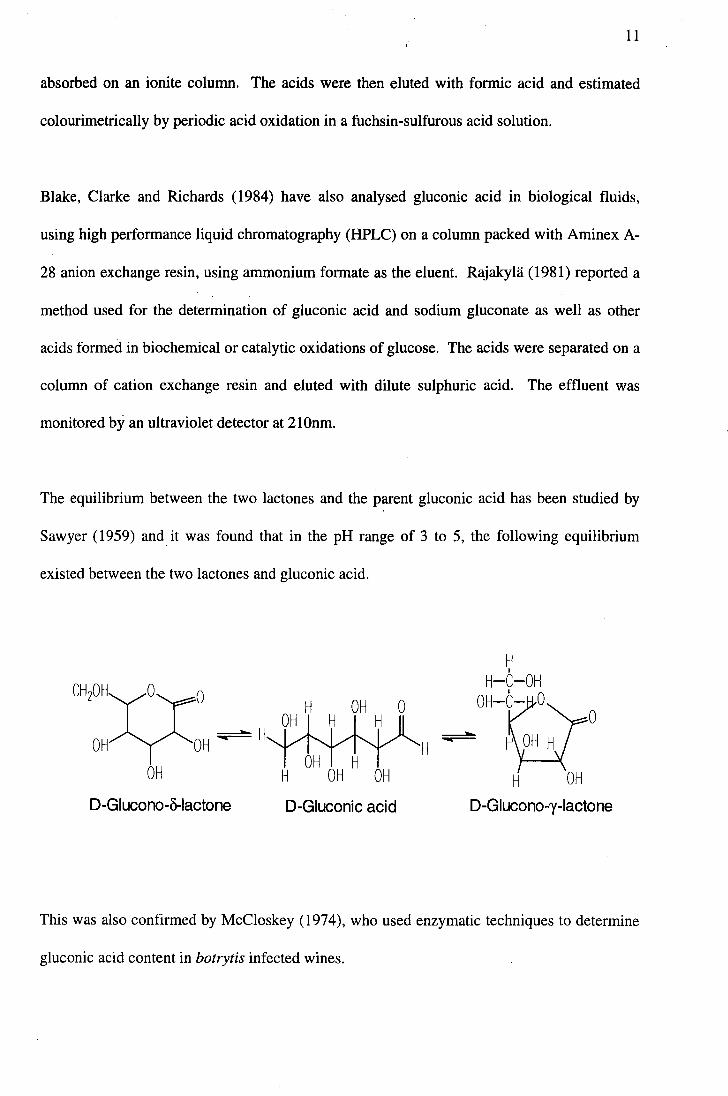
The eqUilibrium between the two lactones and the parent gluconic acid has been studied by
Sawyer (1959) and it was found that in the pH range of 3 to 5, the following equilibrium
existed between the two lactones and gluconic acid.
OH 0
OH
D-Glucono-8-lactone D-Gluconic acid
H I
H-C-OH
~OH-r-°yO H- HH_
H OH
D-Glucono-y-Iactone
This was also confirmed by McCloskey (1974), who used enzymatic techniques to determine
gluconic acid content in botrytis infected wines.
12
Other time consuming methods that have been used to detennine gluconic acid include: gas
and paper chromatography, spectrophotometric and enzymatic analysis (Blake, Clarke and
Richards, 1984). In comparison high performance liquid chromatography (HPLC) IS an
analytical technique that is ideally suited for this type of analysis.
2.2 GLUCOSE OXIDASE-CATALASE
2.2.1 INTRODUCTION
Current research in our laboratory (G.Pickering, PhD candidate) has demonstrated that
commercially available glucose oxidase/catalase enzyme system can be used to remove
glucose from fruit juice which can then be fermented to produce reduced alcohol wine. This
research is an extension of earlier work by Villettez, (1986); Ough, (1975) and Heresztyn,
(1987).
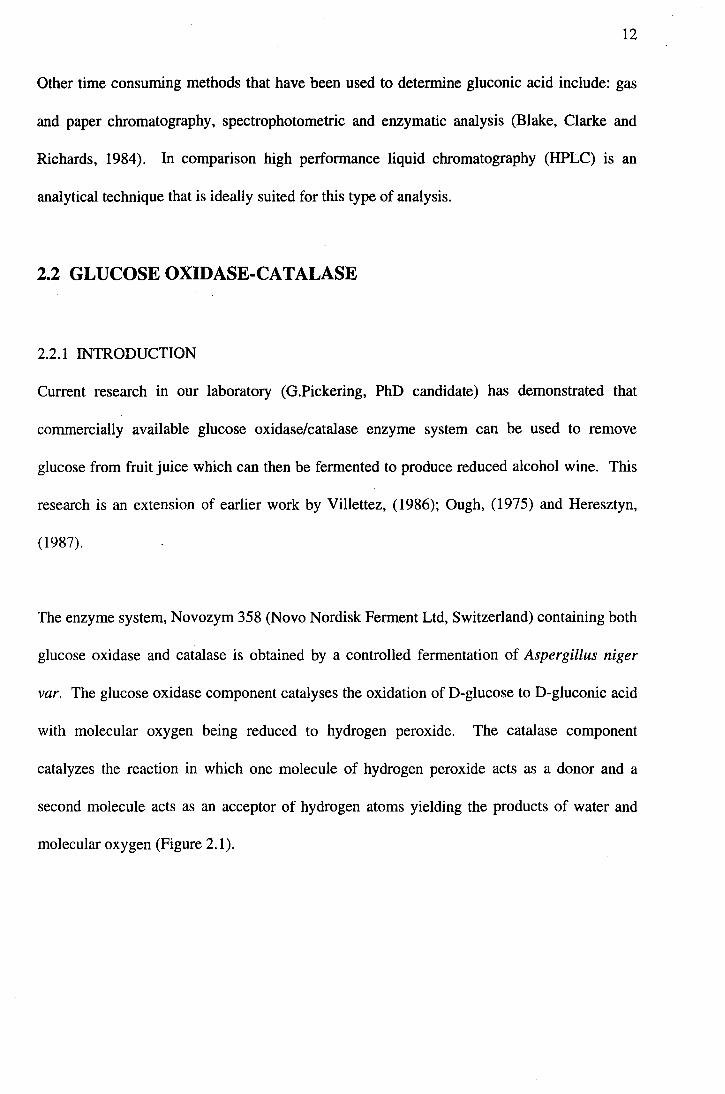
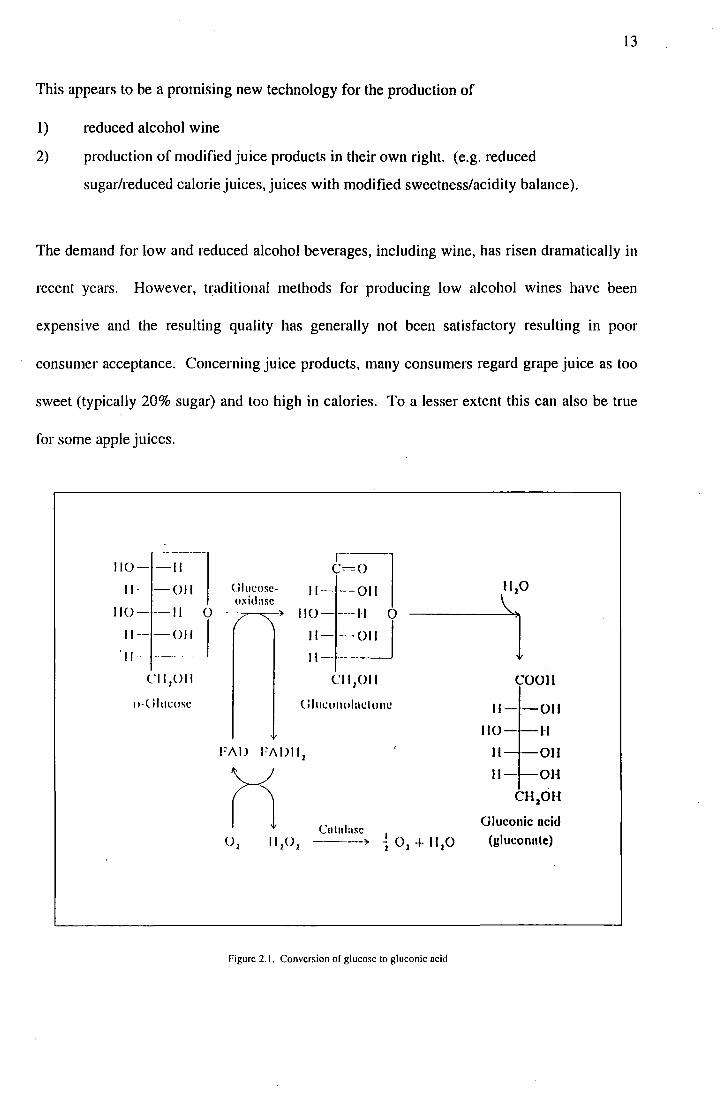
The enzyme system, Novozym 358 (Novo Nordisk Ferment Ltd, Switzerland) containing both
glucose oxidase and catalase is obtained by a controlled fermentation of Aspergillus niger
var. The glucose oxidase component catalyses the oxidation of D-glucose to D-gluconic acid
with molecular oxygen being reduced to hydrogen peroxide. The catalase component
catalyzes the reaction in which one molecule of hydrogen peroxide acts as a donor and a
second molecule acts as an acceptor of hydrogen atoms yielding the products of water and
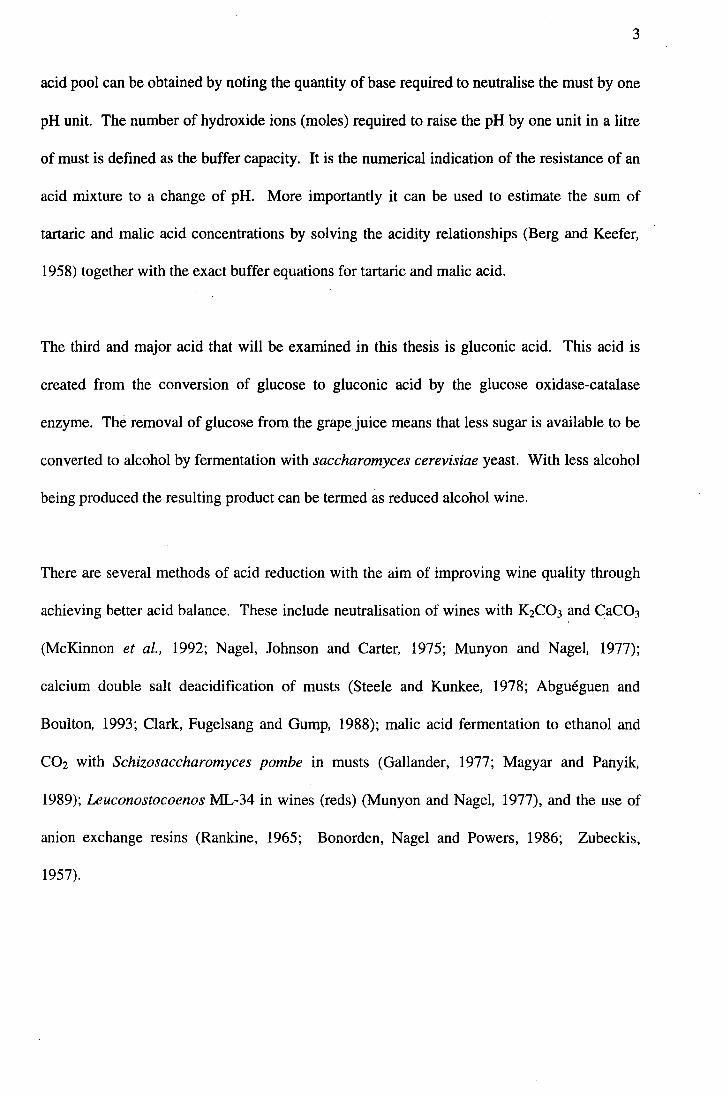
molecular oxygen (Figure 2.1).
This appears to be a promising new technology for the production of
1) reduced alcohol wine
2) production of modified juice products in their own right. (e.g. reduced
sugar/reduced calorie juices, juices with modified sweetness/acidity balance).
13
The demand for low and reduced alcohol beverages, including wine, has risen dramatically in
recent years. However, traditional methods for producing low alcohol wines have been
expensive and the resulting quality has generally not been satisfactory resulting in poor
consumer acceptance. Concerning juice products, many consumers regard grape juice as too
sweet (typically 20% sugar) and too high in calories. To a lesser extent this can also be true
for some apple juices.
110- -II
11--011 110-- -II 0
.::~=OIIJ Cl1 1011
1)-(lIIlCOSC
(Jlucose-oxidase / "\ ~
r--~ C=-=O
11--011 110 - ----II a
11- --011 I II---~
ell /)11
( l 1111':01101 nclo lie
Cnlalase ---~
Figure 2.1. Conversion or glucose to gluconic ocid
H 20
\
COOII
11--011 110--1-1
11--011 1I--0H
CH 20H
Gluconic acid (gluconllle)
14
The sugar content in grape juice contains approximately 50% glucose and 50% fructose.
Theoretically this enzymatic treatment is able to convert the glucose fraction to gluconic acid
and thus leaving only half the sugar available for fermentation to alcohol. This corresponds
to the highest potential alcohol reduction of 50%, or, approximately 6% (v/v).
From the point of view of flavour, gluconic acid has an acid-sweet taste, the wines gain in
body and are less "hard" than the wines acidified with tartaric acid (Villettaz, 1986).
Gluconic acid as well as its salts and lac tones are mild, non-corrosive, non-toxic organic
compounds. They are physiologically compatible and can therefore be used in foodstuffs
without risk (RajakyUi, 1981).
However, a potential limitation of technologies using glucose oxidase is the production of
gluconic acid itself,the net enzyme reaction being:
2 glucose + O2 -7 2 gluconic acid
which can result in acidity imbalance in the juice or fermented juice product (wine). As a
rough estimate one can say that 2g/L of gluconic acid will increase the total acidity by Ig/L
(tartaric acid) (Villettaz, 1986). Gluconic acid is not metabolised by the yeasts during the
alcohol fermentation. According to the wi nemakers , there was no noticeable reduction in
quality as a result of the aeration of the juice during enzyme treatment (Villettaz, 1986).
The glucose oxidase/catalase (GOD/CAT) system has been researched involving the removal
of oxygen of some table wines bottled with residual sugar (McLeod and Ough, 1970). Other
15
suggested applications of this enzyme system include the removal of glucose from solutions
of mixed saccharides, O2 scavenger to stabilise foods, colorimetric or UV assay of glucose in
biological fluids, and as an antigen or antibody for use in ELISA procedures.
2.2.2 PREPARATION OF HIGH ACID JUICE AND REDUCED ALCOHOL WINE
For the investigation of methods for the determination and reduction of gluconic acid in
juices and wines, it was necessary to produce a GOD/CAT treated juice and wine.
2.2.3 MATERIALS AND METHODS
The method'developed by Villetaz, (1986) and modified in our laboratory by Pickering,
(1993) was used. The enzyme used was "Novozym 358", batch OKNlO03, a' product of
Novo Nordisk Ferment Ltd, Dittingen, Switzerland. It contained glucose oxidase (EC
1.1. 3.4) and catala~e (EC 1.11.1. 6) prepared from the same original natural product. The
product is available as a standardised and stabilised liquid with an activity of 2000 GOXlml,
where 1 Glucose Oxidase unit is the amount of enzyme which, at standard conditions (25°C
and pH 5.1), catalyses the formation of 1 J.UIlole H20 2•
Bentonite fined (lglL) MUller Thurgau (1994) was obtained from Geisen Wines Ltd, New
Zealand. The composition of the juice was 18oBrix, pH 3.15, titratable acidity 6.94 gIL, and
free S02 of 40 mglL.
A New Brunswick Fermentor (New Brunswick Scientific Co. Inc., New Brunswick, New
Jersey) was used for the GOD/CAT treatment of the juice. The enzyme treatments were
I :.;;,.;, :co::' i ;'c'::>' :"
1-'
16
carried out in 4 x 10 L quantities of grape juice with continuous aeration. The pH and
titratable of the juice were measured as a function of time. Batch parameters include:
25°C water bath
8 Llmin aeration
250 rpm (agitation)
1.5 gIL GOD/CAT enzyme
The enzyme producers recommend using IgIL enzyme dosage, but 1.5 gIL was used in this
case to compensate for enzyme degradation due to storage. Pickering, Heatherbell and
Barnes (1993) found that from 0-10 hours there was conversion of glucose to gluconic acid,
but after 10 hours of aeration, no significant conversion occurred. The juice pH was adjusted
to pH 4.3 by addition of 100mI of 5M KOH. Another 100mI was added after one hour to
help regulate the pH. Aeration of the 40 L was stopped to terminate the glucose oxidase
reaction after 10 hours. 20 L of the treated juice was frozen to be used for deacidification
trials later on. The other 20 L was inoculated with 200 ppm saccharomyces cerevisiae yeast
(Fermivin SF, Gist-Brocades, France) and fermented at 12°C. Upon completion of the
primary fermentation, the wine had a pH of 3.21 and TA of 19.34 gIL. The alcohol content
on completion of fermentation was 8.3% (v/v) with the residual sugar, 5.0 gIL. Both juice
and wine stock solutions were frozen and held at -10°C until analysed.
2.2.4 RESULTS AND DISCUSSION
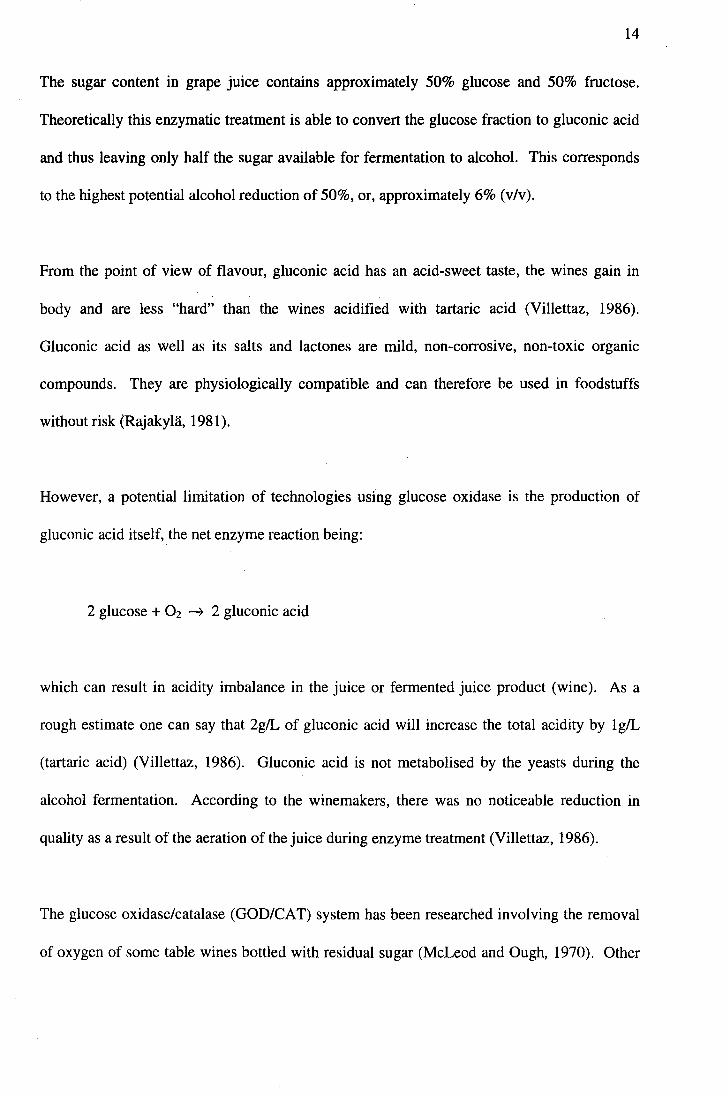
The pH and TA of the juice was measured as a function of time (Figure 2.2). The enzyme
activity decreased markedly after 8 hours of the reaction process, by which time
approximately 75gIL of gluconic acid had been produced with an equivalent loss in glucose
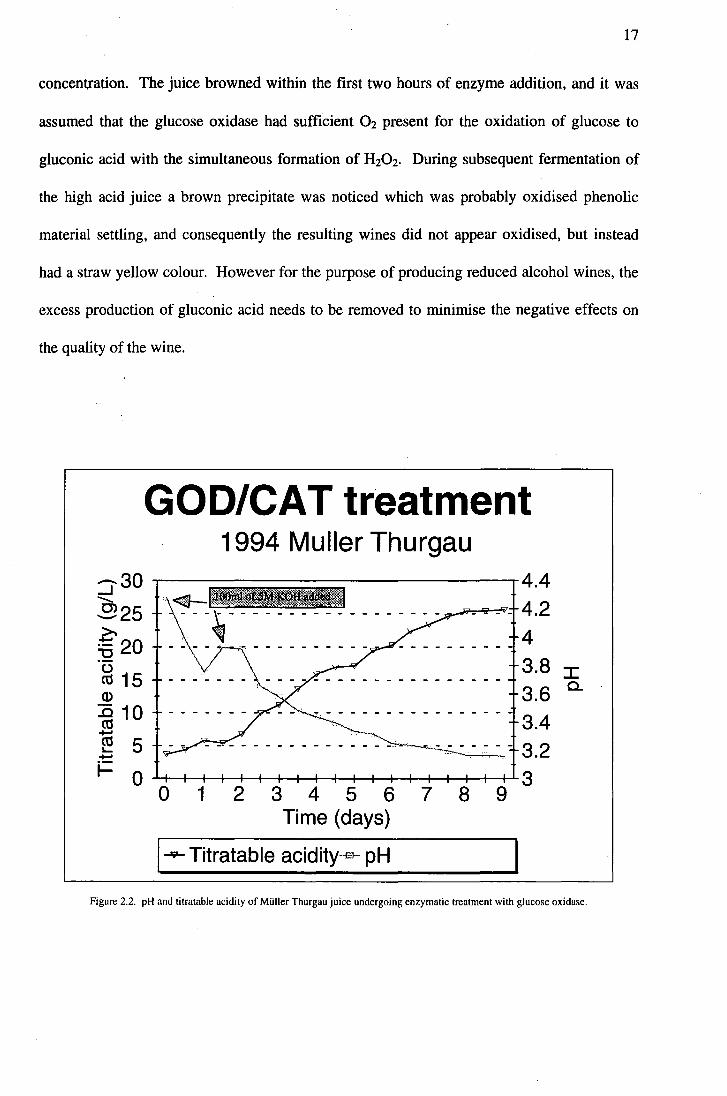
17
concentration. The juice browned within the first two hours of enzyme addition, and it was
assumed that the glucose oxidase had sufficient O2 present for the oxidation of glucose to
gluconic acid with the simultaneous formation of H20 2• During subsequent fermentation of
the high acid juice a brown precipitate was noticed which was probably oxidised phenolic
material settling, and consequently the resulting wines did not appear oxidised, but instead
had a straw yellow colour. However for the purpose of producing reduced alcohol wines, the
excess production of gluconic acid needs to be removed to minimise the negative effects on
the quality of the wine.
::J30 ......... .g25 >-~20
~ 15 Q)
.0 10 CO -~ 5 -i- 0
GOD/CAT treatment 1994 Muller Thurgau
'<Jf- .. - - -~ - - - - - - - - - - - - - - - - --
o 1 2 345 6 Time (days)
1-9- Titratable acidity-e- pH
7 8
4.4 4.2 4 3.8 3.6 3.4 3.2
9 3
:c a.
Figure 2.2. pH and titratable acidity of MUlier Thurgau juice undergoing enzymatic treatment with glucose oxidase.
:.:: ,-: <'
18
2.2.5 CONCLUSIONS
Theoretically -96.5 gIL of glucose was available in the grape juice to be converted into
gluconic acid. Of this only 74.7 gIL was actually converted, which equates to a 77%
efficiency rate. The loss of enzymatic activity can be attributed to a number of factors that
will be addressed by Pickering, Heatherbell and Barnes (1993). In particular the affect of S02
and pH need to be further researched, as these are two attributes that are present in grape juice
that can inhibit the enzymes ability to convert glucose to gluconic acid.
19
CHAPTER THREE
HIGH PERFORMANCE LIQUID CHROMATOGRAPHY
3.1 REVIEW OF LITERATURE
3.1.1 INTRODUCTION
The HPLC technique that we will use to identify and quantitate gluconic acid in high acid
grape juice and reduced alcohol wines, incorporates three of the basic mechanisms; partition,
adsorption and exclusion chromatography. HPLC has recently become a regular and
acceptable form of wine analysis and some of the bigger producers have included this
analytical method as a standard laboratory tool. The technique has the advantage of being
able to analyse for single or simultaneously for multiple wine components using only a
minimal amount of sample and analysis time.
High performance liquid chromatography (HPLC) is unquestionably the fastest growing of all
the analytical separation techniques. This is attributable to the sensitivity of the method, the
ready adaptability to accurate quantitative determinations, its suitability for separating
nonvolatile species or volatile species. There are four basic types of column chromatography
where the mobile phase is a liquid. The four include:
• partition chromatography
• adsorption chromatography
• ion-exchange chromatography
• exclusion chromatography
20
Each of these types work better in certain applications. That is, for solutes having molecular
weights > 10 000, exclusion chromatography is utilised. For lower molecular weight ionic ~2 !
species, ion-exchange chromatography is widely applied. Small polar but nonionic species
are best handled by partition chromatography. Adsorption chromatography is often chosen
for separating nonpolar species, and compound classes such as aliphatic hydrocarbons from
aliphatic alcohols (Skoog, 1985; Lindsay, 1992).
Wrolstad and Spanos (1987) utilised HPLC for the determination of red raspberry
anthocyanin pigments, nonvolatile acids, and sugars. He also applied this technique for the
analysis of sugars and nonvolatile acids in blackberries (Wrolstad et ai., 1980). Sepulveda
and Kliewer (1986) used HPLC to monitor the effect of high temperature on grapevines with
regards to the distribution of soluble solids. Takeda, Saunders and Saunders (1983) used
HPLC to measure the sugar and acid change in Muscadine grapes during postharvest storage.
The lyophilised samples were suspended in distilled water and heated to 60°C to help
dissolution, filtered through a 0.45/lm membrane and eluted with O.OIN phosphoric acid and
analysed using a UV detector at 21Onm.
Other researchers have used HPLC systems to isolate and identify organic acids and their
lactones (Hicks, Lim and Haas, 1985; Pecina et ai., 1984; Schwarzenbach, 1982; Palmer and
List, 1973; Bennett and Bradey, 1984.) The standard HPLC method of analysis for wine
acids involves using a polystyrene-divinylbenzene cation exchange resin (Aminex HPX-87H)
with an acidic eluent for separation followed by short wavelength (21Onm) UV andlor
refractive index (RI) detection. There seems to be two different approaches regarding sample
preparation. There are some researchers that use an anion exchange resin (e.g., Amberlite
21
IRA-93) to split the wine into acidic and neutral fractions. The neutral fraction contains
sugars and ethanol, while the acid fraction; the wine acitls (McCord, Trousdale and Ryu,
1984; Hunter, Visser and De Villiers, 1991; Sepulveda and Kliewer, 1986; Wrolstad et al.,
1980, and Wrolstad and Spanos, 1987.) These authors believe that this enhances the
resolution of the eluting acids and also conserves the analytical column.
However there are others that found that, except for filtration during sample preparation, they
were able to analyse samples on HPLC columns without prior separation of compounds with
different ionic character (Frayne, 1986; Schneider, Gerbi and Redoglia, 1987; Tusseau and
Benoit, 1987; Takeda, Saunders and Saunders, 1983; RajakyUi, 1981; Gump and Kupina,
1979.) Separations were excellent and several hundred samples were run without
deterioration of the column performance. Mentasti et al., (1985) and Caccamo et al., (1986)
have both publishe~ an HPLC method for the identification, separation and determination of
acids in wines and beverages. They incorporated derivatisation with phenacyl bromide and
separation was accomplished on standard octadecylsilica columns using reversed phase
chromatography.
3.1.2 ORGANIC ACID COLUMN
The usual column for sugar and acid analysis in wine products is the Aminex HPX-87H
column (Bio-Rad Laboratories, Richmond, CA). Dilute sulphuric or phosphoric acid is used
as the eluent, and filtering is the only sample preparation required. The Aminex organic acid
column can also be used for rapid and non-destructive alcohol analysis. The column
separates organic acids using initially ion exclusion and reversed phase mechanisms. When
dilute sulphuric acid is used as the eluent, organic acids elute from the column in order of
22
increasing pKa. Partitioning also contributes to the separation of compounds not absorbed by
the nonpolar column matrix (Skoog, 1985). The column separates neutral species, such as
carbohydrates and alcohols, by reversed phase partitioning. The eluent is polar while the
resin matrix is nonpolar, so the aliphatic nonpolar alcohols are adsorbed by the resin and are
eluted after charged molecules (Bio-Rad, 1988). Pecina et al., (1984) investigated the
chromatographic behaviour of 63 substances on the Aminex HPX-87H column and the
capability of this column for the separation of acids, aldehydes, ketones, alcohol and
carbohydrates.
3.2 MATERIALS AND METHODS
3.2.1 STANDARD SOLUTIONS
Two separate standard solutions were used throughout this study. The first contained
gluconic and tartaric acid in varying amounts, since these two acids elute very close together.
Concentrations ranged from 50 to 10 gIL gluconic and 10 to 2 gIL tartaric. The second
contained malic acid with a concentration range of 5 to 1 gIL. These acids were of analytical
grade (standard purity 99%) and obtained from BDH (Great Britain) and Sigma (U.S.A).
3.2.2 SAMPLE PREPARATION
Three techniques, SEP-PAK C 18, ion exchange and membrane filtration were investigated for
possible use in sample preparation.
",<. ,'.
. ....... - .. -
23
SEP-PAKC18
These cartridges are supplied by Waters (Waters Chromatography Division, Millipore Corp.,
U.S.A) for solid phase extraction. These columns are used generally for red wine and must to
remove phenolic and lipophilic compounds. The cartridges were activated with 5mL
methanol followed by 5mL deionised water prior to use.
Ion Exchange
A weakly basic anion exchange resin, Amberlite lRA-93 (Sigma Chemicals), was used. The
wet mesh designation was 16-50 and the resin was hydrated prior to use. A lOcm long, 20mL
burette was filled with approximately 5mL resin. The packed column was washed with 5 bed
volumes of deionised water. Prior to sample application . the water was drained to just above
the resin bed. A 5mL aliquot of high acid juice or reduced alcohol wine was pipetted into the
Amberlite lRA-93 resin bed and allowed to run through freely, followed by deionised water.
This eluate contained the soluble sugars, while the organic acids were retained on the column.
The organic acids were washed off with 5mL 10% (v/v) H2S04 and analysed by HPLC.
Membrane
Disposable 0.451lm membrane filters (Millipore Corp.) were used for standard and sample
preparation.
All three techniques were used separately and in combination and the chromatograms were
compared. There was no noticeable increase in resolution from the ion exchange and SEP-
PAK C I8 treatments when compared to the membrane treated samples. So it was decided to
prepare standards and samples for analysis by passing through the 0.451lm membrane filter.
."::~:-::--~:-:i ~':~:",:< .• ~", .'-'
24
This technique was recommended by Frayne, (1986); Schneider, Gerbi and Redoglia (1987);
Takeda, Saunders and Saunders (1983) with the advantage being that it cuts down the sample
preparation time from 15 minutes to 2 minutes per sample. The only concern about this
technique is the effect on the HPLC column and componentry, however if a good
conditioning and cleanup procedure is employed then the column life should not be
compromised.
3.2.3 HIGH PERFORMANCE LIQUID CHROMATOGRAPHY
The standards and samples were filtered through a 0.45~m membrane and 2~L was analysed
using a Sugar-Pak II guard insert (Millipore Corp.) and a 300mm x 7.8mm Aminex HPX-87H
organic acid analysis cation exchange column (Bio-Rad Laboratories). The column was
operated at room temperature and not at higher temperatures because of rapid deterioration of
the column packing, presumably due to breakage of cross-linkages (RajakyUi, 1981). The
mobile phase was 0.002N H2S04 using distilled water with a resistivity of 15 megohms
obtained from a Nanopure reagent water system. The solvent delivery system was a Waters
600-MS System Controller pump operating at a flow rate of 0.6mL/minute. The standards
and samples were injected using a Waters 717 plus Autosampler.
The eluting compounds were monitored by a fixed wavelength ultraviolet (UV) detector
(Waters 490E Programmable Multiwavelength Detector) at 210nm and 0.1 absorbance units
full scale (AUFS). This wavelength was chosen as it is the best wavelength for absorbance of
all acids analysed with the least interference.
25
The peaks were quantified using external standard calibration based on peak height
estimation with integration on the baseline forced at valley point using negative peak logic
using the Millenium 2010 Chromatography Manager (Waters Chromatography Division,
Millipore Corp., U.S.A). The components were identified by a comparison of their retention
times with those of the standards. There were three standard injections, the first to condition
the column, the second for calibration, and the third at the end of each daily run to check
column variability and stability.
3.3 RESULTS AND DISCUSSION
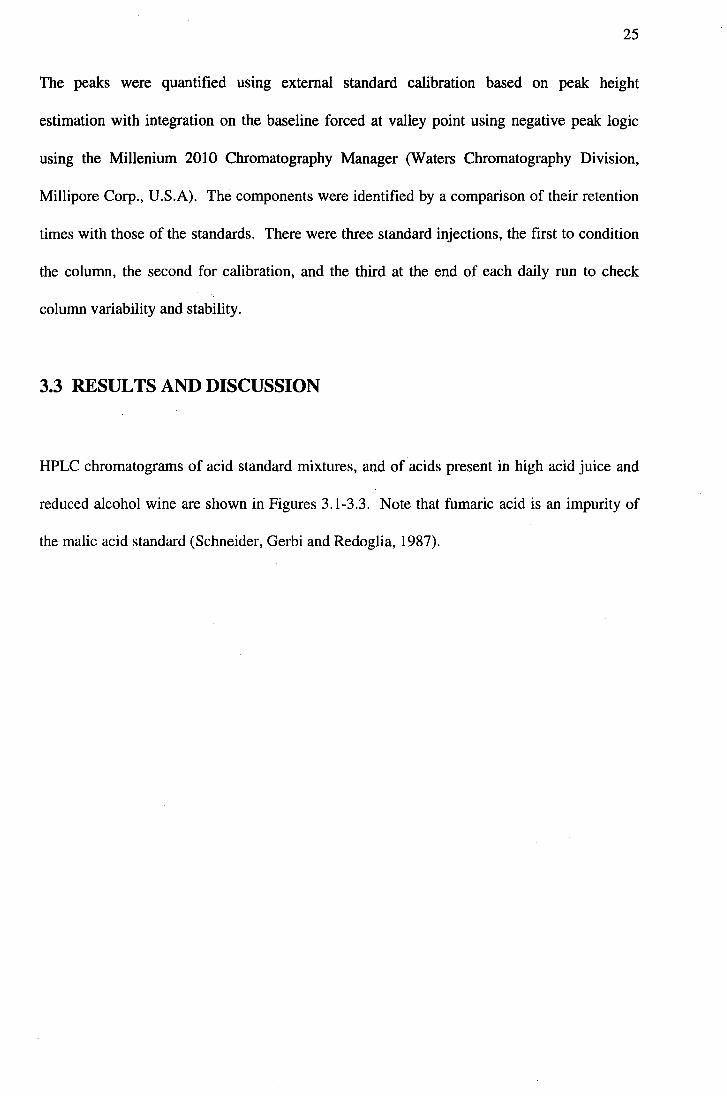
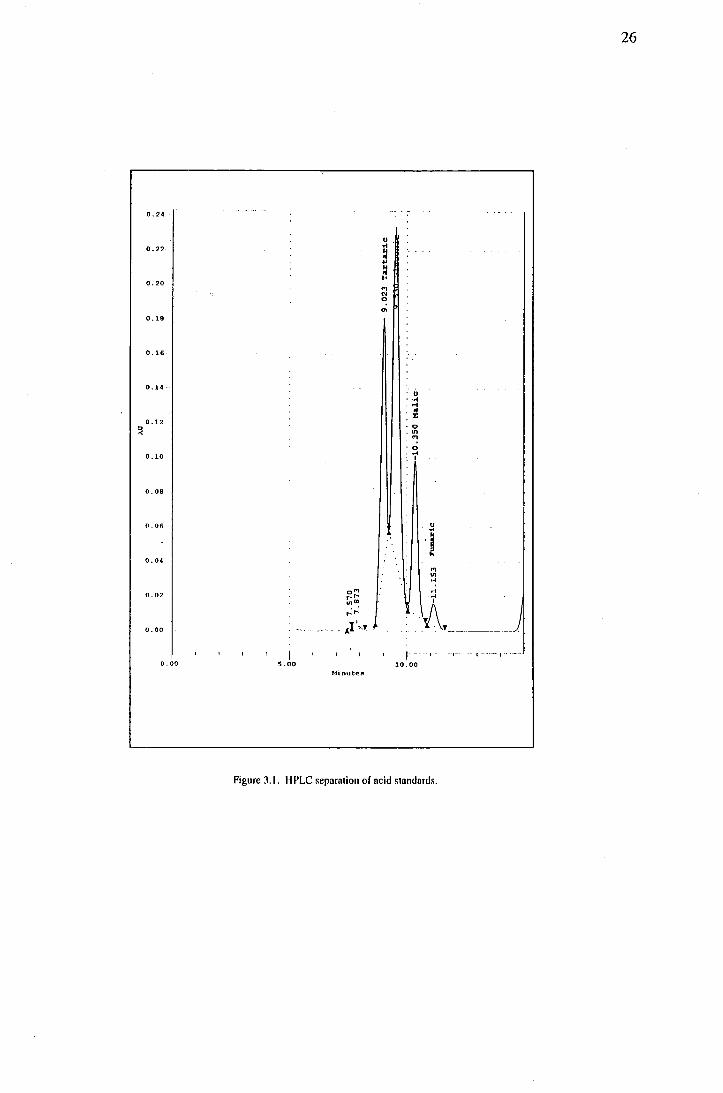
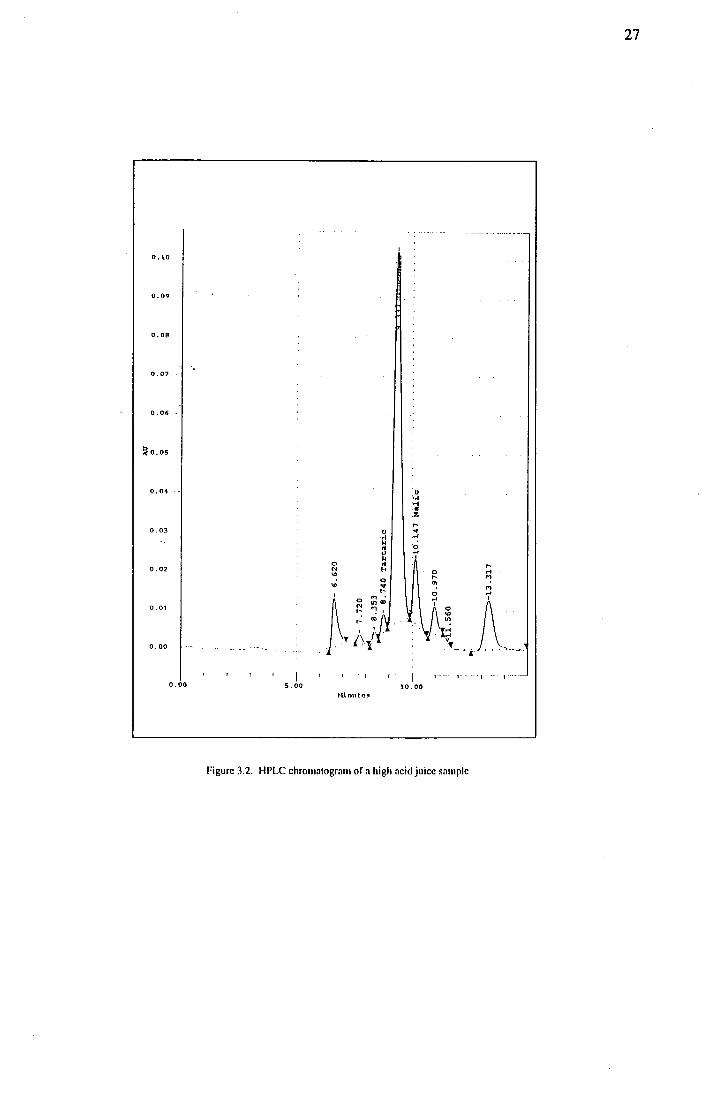
HPLC chromatograms of acid standard mixtures, and of acids present in high acid juice and
reduced alcohol wine are shown in Figures 3.1-3.3. Note that fumaric acid is an impurity of
the malic acid standard (Schneider, Gerbi and Redoglia, 1987).
0.24 .
0.22
0.20
0.19
0.1&
0.14 .
0.12 ~
0.10
O.OB
O.Ofi
0.04
0.02
0.00
O. 00 I
5.00
0'" ... '" .,,~ ,..: ... ,I'~''I'
Hinute~
U .<1
~ ., ~ f<
'" '" o
'"
u •• <1 .... :~ '0 . ." ."! '0 ....
I
'" Ul ... ... ...
.. 1\'1' ________ _ I -
10.00
Figure 3.1. H PLC separntion of acid standortls.
26
O. \0
0.09
0.07
0.06 -
~ 0.05
0.04
0.03
0.02
0.01
0.00
0.00 I
5.00
o ... '"
t-llnnt'!!1
u .. , ~ t: ~ .'
'u '.~ .... ·If .2: ,.. ... .... '0 ... .,
10.00
o ,.. '" 1'1 o ... ... I
'tJ\~ --'-OJ -- " ..• -
Figure 3.2. HPLC chromatogram or a high acid juice sample
27
---;._ "~'.-:-J_ .... --~.:.:~~ -;:.>:.;-;.~~.:.;.
-:-.-
0.14
t) .13
O.1?
0.11
0.] 0
0.09
0.00
:J 0.07 .. o. OS
0.05-
0.04-
0.03
0.02
0.01
0,00
0,00 5.00
.... .., ID 0
ID t-
H.inut@f'I
u .,. .. ~ .. ~ .. .., ID t-
OJ
..~ . .... .. ~
.l: '0 'OJ ..... '0 ..... . ,
o .., ..,
._-, --'-"---""r ----
Figure 3.3. UPLC chrolllnlogrnm or a reduced alcohol wine sample.
28
29
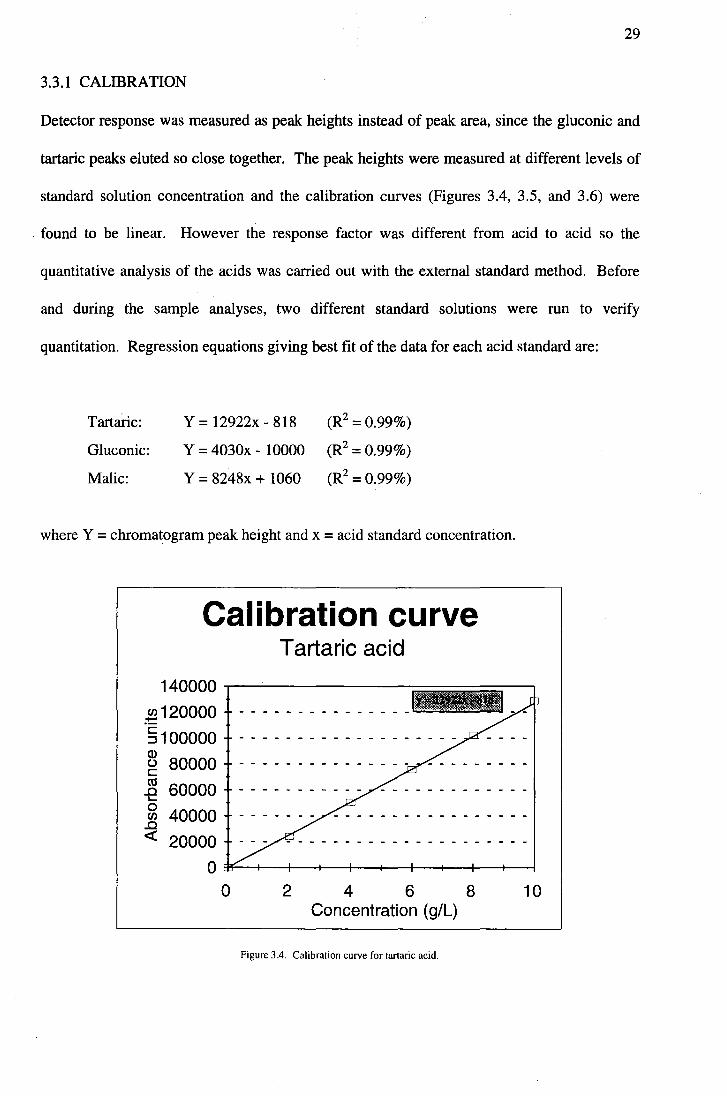
3.3.1 CALIBRATION
Detector response was measured as peak heights instead of peak area, since the gluconic and
tartaric peaks eluted so close together. The peak heights were measured at different levels of
standard solution concentration and the calibration curves (Figures 3.4, 3.5, and 3.6) were
. found to be linear. However the response factor was different from acid to acid so the
quantitative analysis of the acids was carried out with the external standard method. Before
and during the sample analyses, two different standard solutions were run to verify
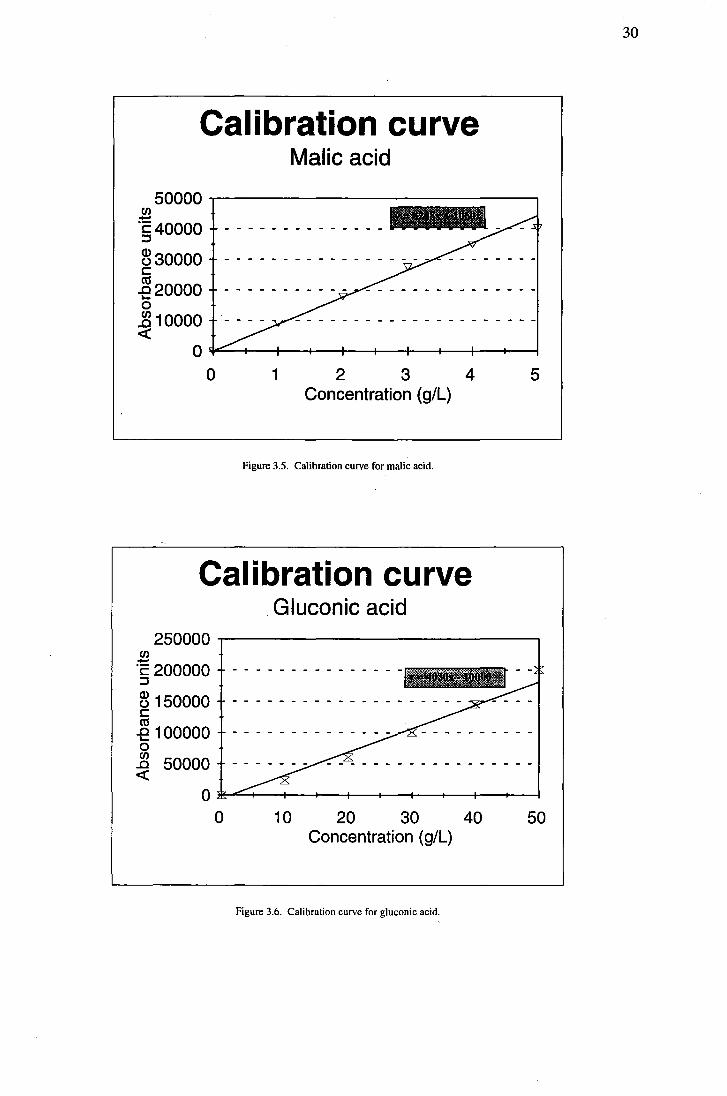
quantitation. Regression equations giving best fit of the data for each acid standard are:
Tartaric:
Gluconic:
Y = 12922x - 818 (R2 = 0.99%)
Y = 4030x - 10000 (R2 = 0.99%)
Y = 8248x + 1060 (R2 = 0.99%) Malic:
where Y = chromatogram peak height and x = acid standard concentration.
Calibration curve Tartaric acid
140000 ~---------------, ~120000
§100000 ~ 80000 c eel
..0 10.... o C/)
..0 «
60000 40000 20000
o ~-+--~~--4-~~~--~~--+-~ o 2 4 6 8 10
Concentration (giL)
Figure 3 A. Calibration curve for tartaric acid.
,
\: ".cO. I , ,
Calibration curve Malic acid
50000 ,..-------------------, ~ 'c40000 ::J
~30000 c .e20000 o ~ 10000 «
o 1 2 3 4 Concentration (gIL)
Figure 3.5. Calibration curve for malic acid.
Calibration curve . Gluconic acid
5
250000 ,..------------------, (J) -'c 200000 ::J
~ 150000 c .e 100000 o ~ 50000 «
o 10 20 30 40 50 Concentration (gIL)
Figure 3.6. Calibration curve for gluconic acid.
30
!: .. :,.:.;~.-:: .. :-.
31
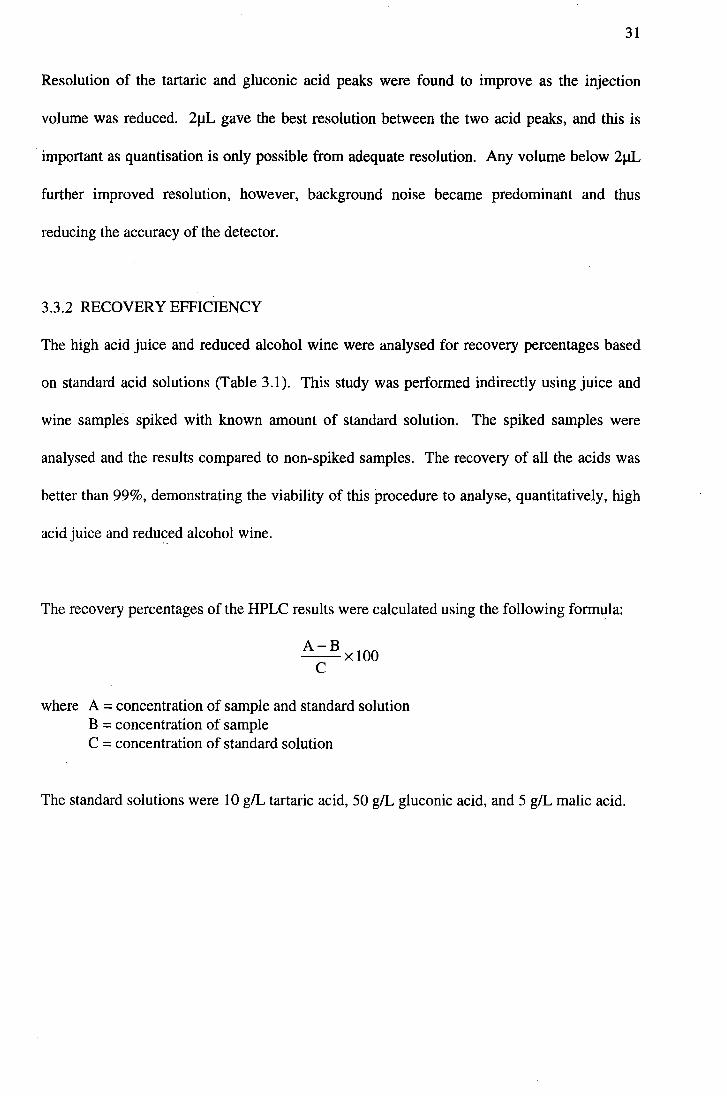
Resolution of the tartaric and gluconic acid peaks were found to improve as the injection
volume was reduced. 2J.1L gave the best resolution between the two acid peaks, and this is
important as quantisation is only possible from adequate resolution. Any volume below 2J.1L
further improved resolution, however, background noise became predominant and thus
reducing the accuracy of the detector.
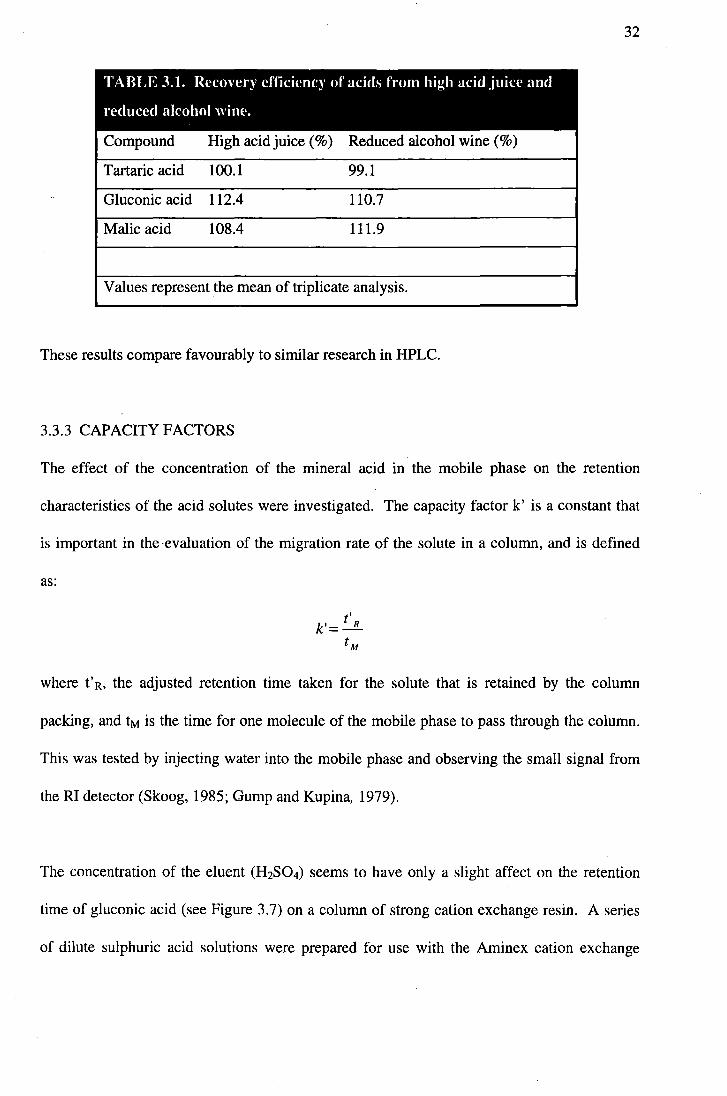
3.3.2 RECOVERY EFFICIENCY
The high acid juice and reduced alcohol wine were analysed for recovery percentages based
on standard acid solutions (Table 3.1). This study was performed indirectly using juice and
wine samples spiked with known amount of standard solution. The spiked samples were
analysed and the results compared to non-spiked samples. The recovery of all the acids was
better than 99%, demonstrating the viability of this procedure to analyse, quantitatively, high
acid juice and redu~ed alcohol wine.
The recovery percentages of the HPLC results were calculated using the following formula:
A-B x 100 C
where A = concentration of sample and standard solution B = concentration of sample C = concentration of standard solution
The standard solutions were 10 gIL tartaric acid, 50 gIL gluconic acid, and 5 gIL malic acid.
32
TABLE 3.t. Recovery efficiency of acids from high acid juice and
reduced alcohol wim',
Compound High acid juice (%) Reduced alcohol wine (%)
Tartaric acid 100.1 99.1
Gluconic acid 112.4 110.7
Malic acid 108.4 111.9
Values represent the mean of triplicate analysis.
These results compare favourably to similar research in HPLC.
3.3.3 CAPACITY FACTORS
The effect of the concentration of the mineral acid in the mobile phase on the retention
characteristics of the acid solutes were investigated. The capacity factor k' is a constant that
is important in the -evaluation of the migration rate of the solute in a column, and is defined
as:
where t'R, the adjusted retention time taken for the solute that is retained by the column
packing, and tM is the time for one molecule of the mobile phase to pass through the column.
This was tested by injecting water into the mobile phase and observing the small signal from
the RI detector (Skoog, 1985; Gump and Kupina, 1979).
The concentration of the eluent (H2S04) seems to have only a slight affect on the retention
time of gluconic acid (see Figure 3.7) on a column of strong cation exchange resin. A series
of dilute sulphuric acid solutions were prepared for use with the Aminex cation exchange
33
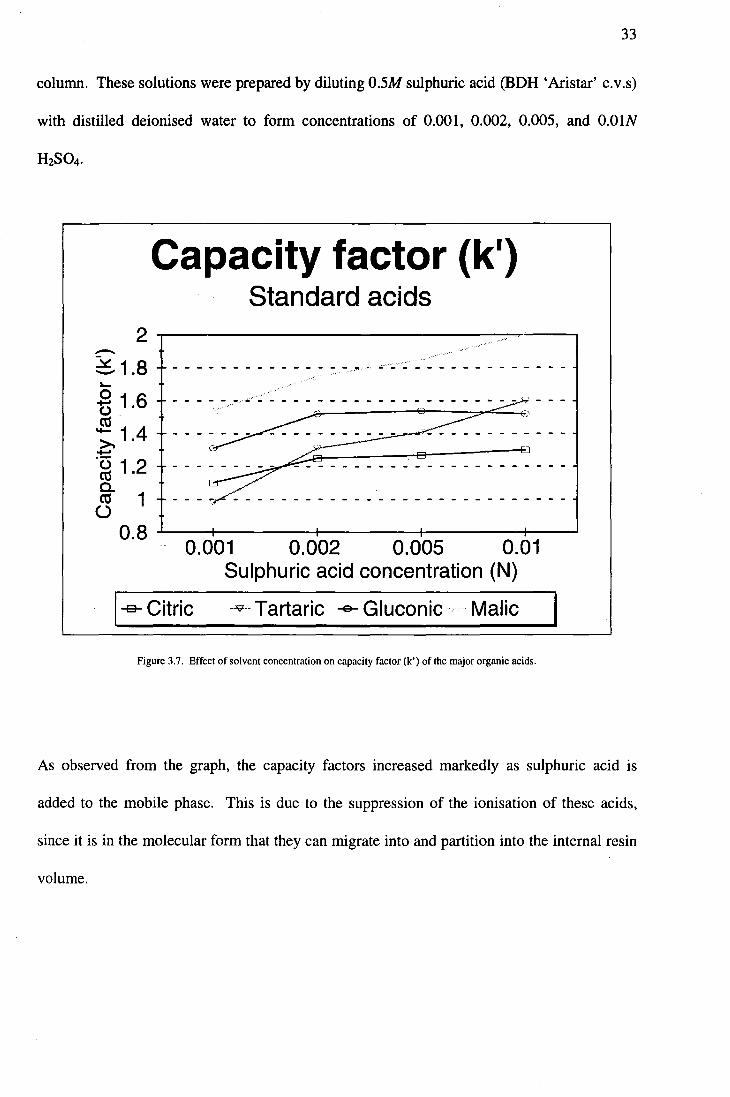
column. These solutions were prepared by diluting 0.5M sulphuric acid (BDH 'Aristar' c.v.s)
with distilled deionised water to form concentrations of 0.001, 0.002, 0.005, and O.OIN
2 --2£1.8 ~
.9 1.6 ~. ~ 1.4 +'"
.~ 1.2 g- 1 ()
0.8
Capacity factor (kl) Standard acids
- - - - - - - - - - - - - - --.~.,- .. -~,,~ - - - - - - - - - - - - - -
0.001 0.002 0.005 0.01 Sulphuric acid concentration (N)
I~Citric ->;;- Tartaric -e- Gluconic· .. Malic
Figure 3.7. Effect of solvent concentration on capacity factor (k') of the major organic acids.
As observed from the graph, the capacity factors increased markedly as sulphuric acid is
added to the mobile phase. This is due to the suppression of the ionisation of these acids,
since it is in the molecular form that they can migrate into and partition into the internal resin
volume.
, I, · .. I
34
The mixed chromatographic action of the column can be seen from Figure 3.7. If these acids
eluted in the order of their pKa values (ion exclusion mechanism), tartaric acid would elute
first followed by malic and then gluconic. This was not the case with the order of elution
being, tartaric, gluconic, then malic acid. This indicates partition chromatography is also in
action on these resin columns between the liquid held within the resin matrix and the mobile
phase external to that matrix.
A concentration of sulphuric acid in the mobile phase can be selected to provide maximum
separation of gluconic acid from the other wine acids. At a concentration of 0.002N H2S04,
gluconic acid is well resolved from tartaric and malic acid.
3.3.4 GLUCONIC ACID
As mentioned before in Chapter 2, gluconic acid exists in eqUilibrium with two lactone
forms, and depending on the pH of the solution, the equilibrium will shift between the
lactones to the free acid.
D-glucono-o-Iactone ~ D-gluconic acid ~ D-glucono-'Y-Iactone
An experiment was performed to measure the effects pH has on this equilibrium and standard
solutions of gluconic acid were buffered with varying amounts of concentrated NaOH. Three
solutions were analysed by HPLC:
gluconic acid 50g/L pH 3 no lactone peaks
gluconic acid 50g/L pH 6 one lactone peak (t.=11.20 minutes)
gluconic acid 50g/L pH 12 no lactone peaks
~:~:~~;:<;~~;:~
~~r::t~~; I
... ~' ..
35
The gluconic acid standard at pH 3 (wine pH) was left for 48 hours and then reanalysed to !_._._._. ".0.
f-- :---; - ,-~>
determine if there was any shift in equilibrium with time. No change was evident. Therefore [:~:;:;;4
it was assumed that quantification of gluconic acid in high acid juice and reduced alcohol
wine would be based on the free acid peak, since at wine pH the lactones had hydrolysed to
the free acid.
3.4 CONCLUSIONS
With the little sample preparation time required, approximately 30 minutes for preparation,
elution and quantitation, the proposed method can be considered to be a rapid procedure for
carboxylic acid determination. Tartaric, gluconic and malic acids of the high acid grape juice
and reduced alcohol wine eluted within 15 minutes.
The use of guard column cartridges and care with sample, standard, and solvent preparation
increases the analytical column life; no loss of resolution or deterioration of separation
capabilities was noticed after injection of more than 800 samples/standards. Different sample
preparation techniques were trialed, however, no increase in resolution was found from any of
them. Also there was no interference from fructose with the analysis of the organic acids.
The performance of the Bio-Rad cation exchange column operated in the ion exclusion-
partition mode was investigated. Mobile phases containing various concentrations of
sulphuric acid were used to evaluate the effect of acid strength on the capacity factors of the
standard acids. With a mobile phase of 0.002 N H2S04, gluconic acid was found to be well
resolved from the tartaric and malic acids.
36
The results of the recovery efficiency and linear regression analysis show that this HPLC
method can analyse quantitatively tartaric, gluconic and malic acid in high acid grape juice
and reduced alcohol wine produced by the GOD/CAT treatment.
37
CHAPTER FOUR
CHEMICAL DEACIDIFICATION
4.1 REVIEW OF LITERATURE
4.1.1 COLD STABILISATION
Following fermentation, unfinished wines are frequently supersaturated with respect to the
bitartrates of potassium, magnesium and calcium (Dickinson and Stoneman, 1958). If these
excess salts are not removed, they tend to form unsightly haze and precipitates after bottling.
The standard procedure for dealing with this type of instability has been prolonged chilling
followed by racking or filtration.
Grape juice and wine contain a high concentration of potassium (0.1 - 1.2g/L) and tartaric
acid (1 - 4g/L) (Rankine, 1991). Ionisation of tartaric acid produces bitartrate ions which, f-: ....
with potassium, form the solid potassium bitartrate salt KC4Hs0 6 . I .
The amount and rate of potassium bitartrate formed is controlled by the solubility product
38
(where HT denotes the bitartrate anion, C4Hs0 6) which depends on temperature, pH, and the
ethanol content of the solution (Berg and Keefer, 1958).
Cold stabilisation is a process employed in the winery to ensure that the wine is tartrate
stable. This need for stability is dictated by the market requirements of a clear product
without sediment in the bottle. This sediment is composed mainly of KHT crystals. The
solubility of KHT in wine is variable due to the complexity of wine composition; the kinetic
processes taking place in wine are slower and complex (Rodriquez-Clemente and Correa
Gorospe, 1988). To ensure the wine is tartrate stable, it is usually chilled to between -2°C to
2°C. Temperature has an effect on the rates of nucleation and growth of potassium bitartrate
crystallisation. KHT precipitation process does not always reach equilibrium in the amount
of time allocated in the cold stabilisation phase of winery operations. The reasons for this
uncertainty lies in the inhibitory effect on several wine components which adsorb on the
growth sites of the crystal faces. Precipitation has an activation energy barrier that needs to
be transcended by the system; this is a process that is enhanced with supersaturation,
temperature, and agitation. Efficient stirring, high supersaturation, and seeding of the wine
can ensure KHT precipitation in the stabilisation process (Roderiquez-Clemente and Correa
Gorospe, 1990).
4.1.2 NEUTRALISATION
Acidity adjustment and, more particularly, the reduction of acidity in grape juice and wine has
received much attention from cool climate wine producers and researchers. Among the
techniques suggested to achieve deacidification include: amelioration with sugar solutions,
biological degradation of malic acid, neutralisation of a portion of the acid with carbonate
39
salts, precipitation of the double salt of tartrate and malate with calcium carbonate, and the
use of anion exchange resins. Although experimental work has been performed on the use of
anion exchange, the technique has not found wide acceptance for commercial use (Nagel,
Johnson and Carter, 1975).
I 8
1.6 -
I . '1 .
.... 0 0'
I 2 -
<t: f- I 0
on
0.4 26
, , , Calcium
Double
Soli ~
CaC0 3 "- MaIo-lactic f\Jeutralizalian
'" // Fermentation ~ '"
"-OptlnlOt
Zone
Cation Exchange or
Tortrote
3.0 3.4 3.8
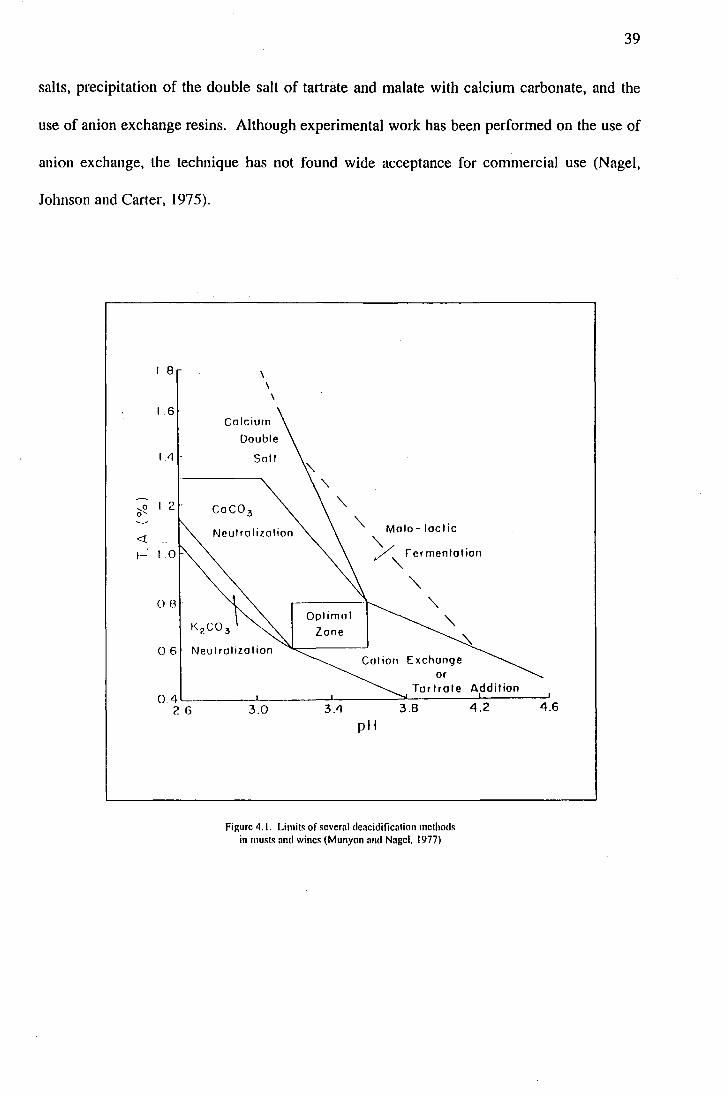
pH
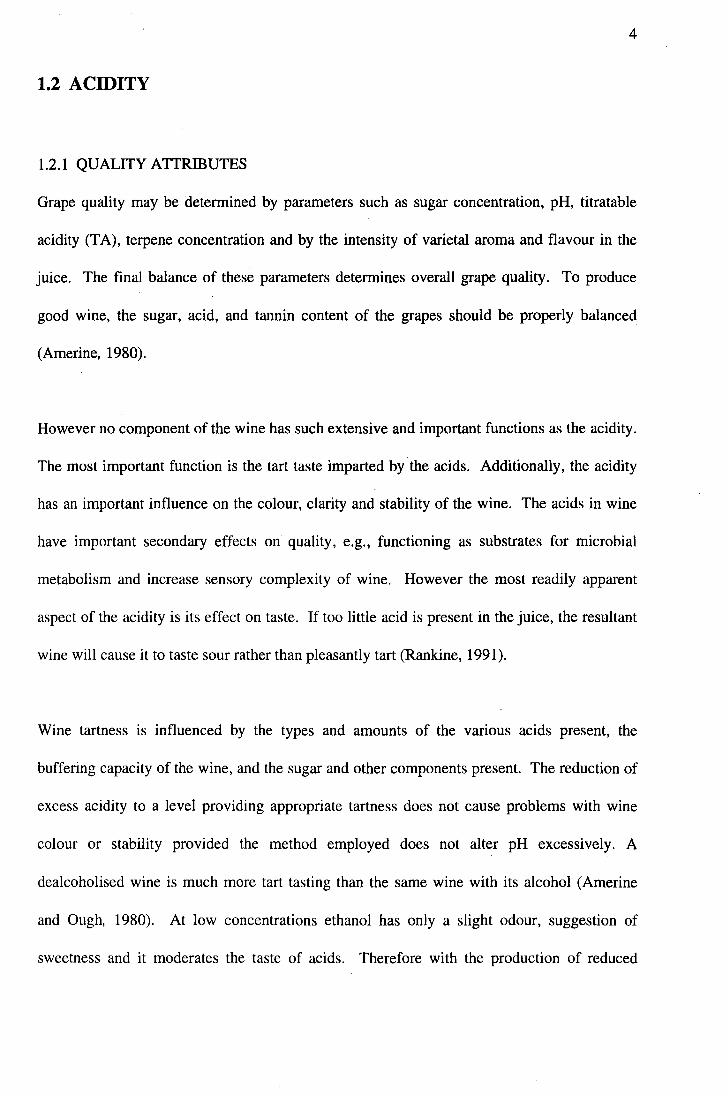
Figure 4.1. Limils of several deacidificalion melhods in musls and wines (Munyon and Nagel, 1977)
Addition
4.2 4.6
\,.:- .. , ._'.-
40
Figure 4.1 shows how the different acidity modification techniques are affected by pH. With
high acidllow pH juice and wine it can be seen that the several methods of chemical
deacidification would be most effective.
Neutralisation of grape juice and wine by CaC03 or precipitation of the calcium double salt of
tartrate and malate is the most commonly used method by the world's cool climate producers
(Rankine, 1991; Clark Fugelsang and Gump, 1988). Acidity is neutralised by one of several
mineral salts, with the main deacidification effect resulting from the precipitation of tartrate
salts.
Nagel, Johnson and Carter, (1975) observed that deacidification was more effective when
calcium carbonate was added to wine, rather than juice. They found that deacidification was
only about half as efficient when calcium carbonate was added to grape juice compared to
wines. They reasoned that the calcium added to the juice was competing for the same tartrate
ions that normally would precipitate as potassium bitartrate after the fermentation.
Neutralisation with CaC03 is most effective on cold stabilised and racked wines (Munyon
and Nagel, 1977). However, Steele and Kunkee, (1979), reported that CaC03
deacidifications were best carried out on the grape juice rather than wine (which will have
lost considerable amounts of tartrates), both in terms of resulting quality and stability.
4.1.2.1 CHEMISTRY
Calcium carbonate is the most common chemical employed for neutralisation of acids in juice
and wine. In the presence of excess tartrate (H2 T), the reaction with calcium carbonate
41
Potassium carbonate can also be used:
Most studies on calcium tartrate have attempted to develop models which would allow the
prediction of precipitation. The use of concentration product (CP) has been suggested (Berg
and Keefer, 1958; Pilone and Berg, 1964).
CP = [Ca2+][T2-]
where T2- represent~ the tartrate anion. The ionised calcium is measured using a calcium ion
selective electrode. A general analytical survey of wines indicated that an approach based
simply on CP calculations could not be used to predict the possibility of calcium tartrate
precipitation, since there was no logical relationship between the fraction of ionised calcium
and the occurrence of precipitation (Scollary, 1990).
Calcium tartrate (CaT) precipitation continues to be an instability problem in wines,
appearmg most commonly in bottled products. Possible reasons are increased calcium
content following deacidification with CaC03, use of calcium bentonites, pH conditions that
cause tartaric acid to be in the form of tartrate ions, and the reduction of inhibitory substances
at the final filtration and bottling stage (Abgueguen and Boulton, 1993 ).
42
Several studies have dealt with the solubility (Berg and Keefer, 1958; Pilone and Berg, 1964),
stability values (De Soto and Yamada, 1963), precipitation (PHone and Berg, 1964), and the
reduction of CaT in unstable wines (Clark, Fugelsang and Gump, 1988).
McKinnon et aI., (1992), have shown that the onset, rate and extent of precipitation of CaT
depends on the initial pH of the solution. The precipitation was found to be independent of
the type of container, but dependent on the presence of foreign substances. Agitation of the
solution was found to induce crystal formation at a much faster rate than for static solutions.
Static solutions which had apparently reached equilibrium were found to undergo further
precipitation 'when agitated.
Excess CaC03 neutralisation will cause precipitatiori of Ca salt(s) other than calcium tartrate,
as noted by the continued decrease in total anions, even after tartrate has been precipitated
(Munyon and Nagel, 1977).
4.1.2.2 KINETICS
According to at least one theory of crystal growth, where nucleation is not limiting, there are
two steps in the mass transfer from solution. The first is a diffusion process, whereby solute
molecules are transported from the bulk of the fluid phase to the crystal surface, followed by a
surface reaction, called surface integration, when solute molecules arrange themselves into
the crystal lattice. Should either of these steps be much slower than the other, the overall
growth rate will be limited by the slower step (Abgueguen and Boulton, 1993).
43
There are a number of different types of nucleation processes including: primary nucleation,
which occurs due to high supersaturation in the absence of crystals. Secondary nucleation is
caused by the presence of crystals of the material being crystallised. Heterogeneous
nucleation is caused by the presence of particles of material other than that being crystallised,
and contact nucleation, where new nuclei is formed from the parent crystal of the material ....;;.~:-:-!-:*
being crystallised (Dunsford and Boulton, 1981). ':':':" -.-:~ .• -... >
As temperature decreases, the precipitation rate tends to increase, due to the supersaturation
level and driving force increases, while the overall crystal growth co-efficient decreases
according to 'an Arrhenius' type of relationship. The alcohol content has little effect due to
little change of the dielectric of the medium and only slight changes in the dissociation
constants of the acid (Abgueguen and Boulton, 1993).
Abgueguen and Berg, (1993), have studied the theory of calcium tartrate precipitation using
seed crystals and have shown that the kinetics of the precipitation are controlled by crystal
growth. McKinnon et at., (1992), established a detailed mechanism of the precipitation
process. They observed' that the amount of bound calcium does not change during the
induction period. For precipitation to occur critical nuclei of calcium tartrate have to form.
Once a stable nucleus is formed the addition of further calcium tartrate molecules induces
precipitation and both the ionised calcium and total calcium concentration will decrease.
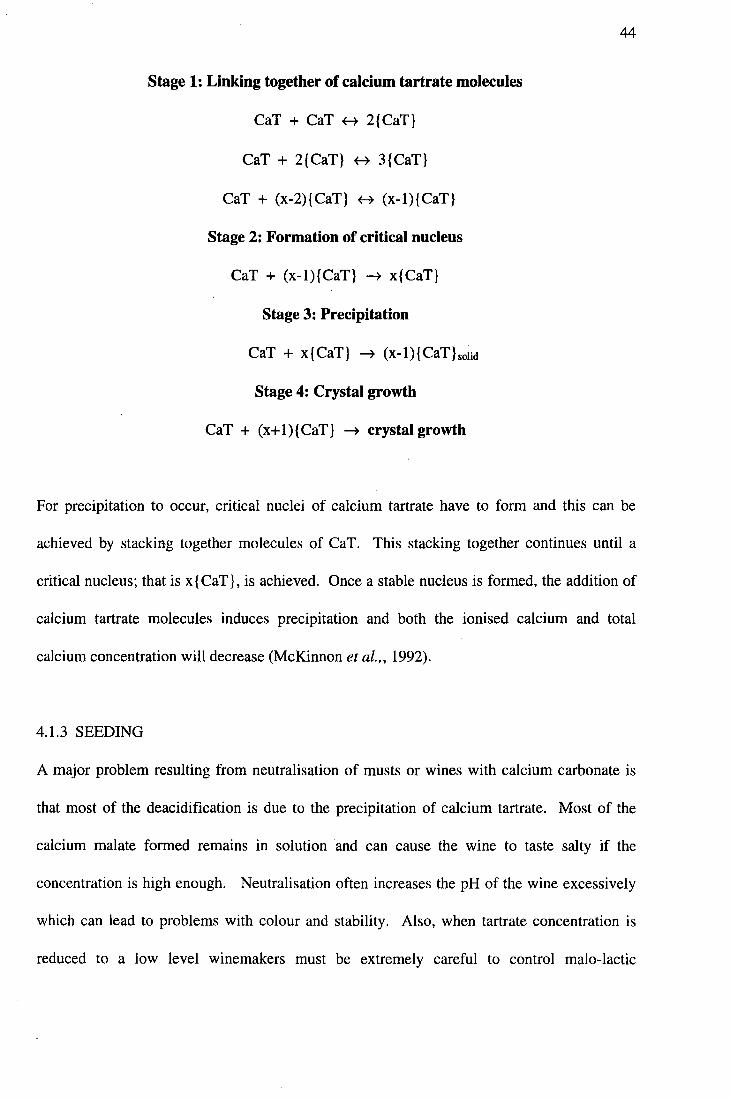
Stage 1: Linking together of calcium tartrate molecules
CaT + CaT ~ 2{CaT}
CaT + 2{CaT} ~ 3{CaT}
CaT + (x-2){CaT} ~ (x-1){CaT}
Stage 2: Formation of critical nucleus
CaT + (x-1){CaT} ~ x{CaT}
Stage 3: Precipitation
CaT + x{CaT} ~ (x-1){CaT}solid
Stage 4: Crystal growth
CaT + (x+1){CaT} ~ crystal growth
44
For precipitation to occur, critical nuclei of calcium tartrate have to form and this can be
achieved by stacking together molecules of CaT. This stacking together continues until a
critical nucleus; that is x { CaT}, is achieved. Once a stable nucleus is formed, the addition of
calcium tartrate molecules induces precipitation and both the ionised calcium and total
calcium concentration will decrease (McKinnon et al." 1992).
4.1.3 SEEDING
A major problem resulting from neutralisation of musts or wines with calcium carbonate is
that most of the deacidification is due to the precipitation of calcium tartrate. Most of the
calcium malate formed remains in solution and can cause the wine to taste salty if the
concentration is high enough. Neutralisation often increases the pH of the wine excessively
which can lead to problems with colour and stability. Also, when tartrate concentration is
reduced to a low level winemakers must be extremely careful to control malo-lactic
45
fermentation since it could reduce the acidity to dangerously low levels and result in
completely "flat" tasting wine.
As malic acid is often present in concentrations greater than that of tartaric acid. Reducing I!
b!!~ acidity to a suitable level in grape juice and wine necessitates the removal of some malic acid
as well as tartaric acid (Steele and Kunkee, 1979).
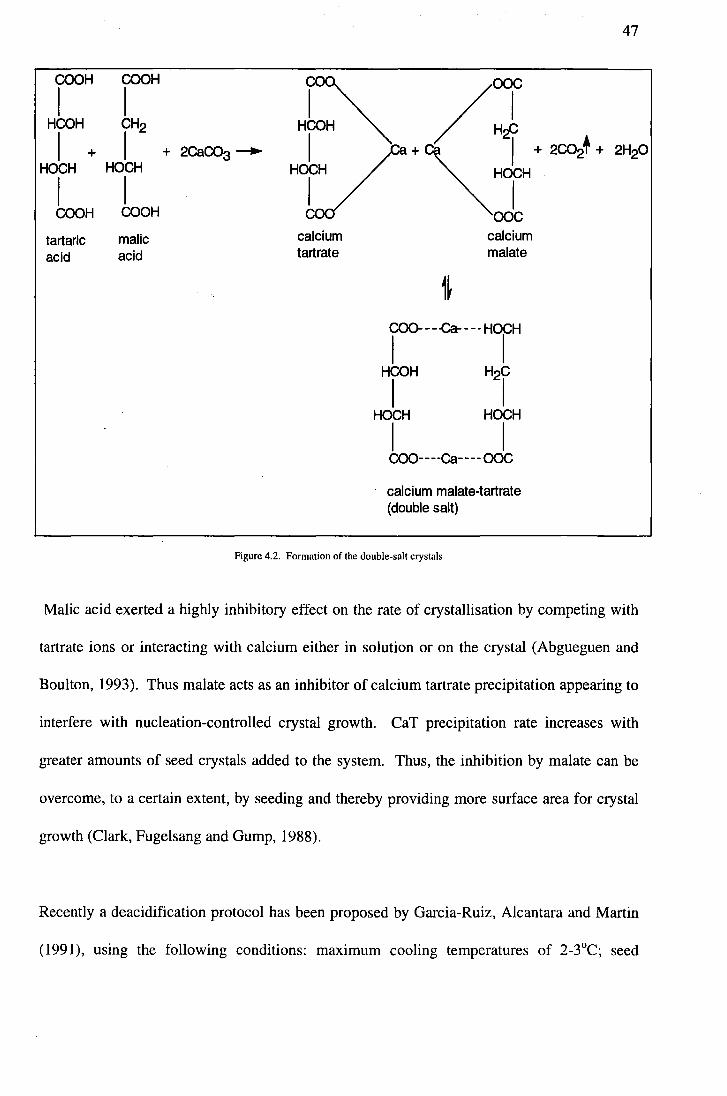
This type of deacidification is achieve~ with 'Acidex', a commercial preparation of calcium
carbonate seeded with calcium double salt crystals (C.H. Boehringer Soln, Ingelheim am
Rhein, West Germany) (see Figure 4.2).
Only a portion of the must or wine is treated with Acidex, and that portion is then blended
back with the untreated portion to strike the desired amount of deacidification. The treated
portion is made to reach pH 4.5-6.5 as quickly as possible. This maintenance of the pH level
is essential, for both the tartaric acid and the malic acid must be dissociated into their
dicarboxylate forms sufficiently to ensure a double salt formation. At pH above 4.5, the
malate and tartrate rapidly combine with calcium to form crystals of the double salt. If the pH
is not maintained above pH 4.5, the equilibrium will be shifted in favour of the single salt
(calcium tartrate).
Steele and Kunkee (1978) found that the amount of acid removed from these musts did not
show a reduction, in equal proportions, of tartaric and malic acids. Some malic acid was
removed, but tartaric acid was the predominant acid removed in all cases.
46
While chilling does increase the level of calcium tartrate supersaturation in wine, this level is
generally not high enough to induce formation of calcium tartrate crystals (Berg and Keefer,
1958; De Soto and Yamada, 1963). This can be attributed to a number of impurities present
in the grape juice or wine. PHone and Berg (1964) found that the inhibiting effect of colloidal
pigments on self-nucleation was sufficient to prevent crystal growth during the initial
refrigeration period. Tartaric acid could attach itself to the pigment molecule by means of
hydrogen bonding between the oxygens of the carboxyl groups of the acid and the hydrogens
of the phenolic hydroxyls of the pigment. Impurities can favour or impede the nucleation of a
supersaturated solution. The ability of these impurities to form complexes can favour the
formation of clusters and decrease the surface energy barrier for nucleation or growth.
However, they can also act in the opposite way - blocking both processes (Rodriguez
Clemente, Correa-Gorospe and De Castro, 1988).
Another inhibitor to calcium tartrate precipitation is the presence of malic acid, this acid
caused a marked increase in the induction time and also slowed the rate of precipitation
(McKinnon, 1993).
COOH
I HCOH
I + HOCH
I COOH
tartaric acid
COOH
I CH2
I HOCH
I COOH
malic acid
calcium tartrate
calcium malate
coo- --.ca----HOCH
I I HCOH H2C
I I HOCH HOCH
I I coo----Ca---- COC
calcium malate-tartrate (double salt)
Figure 4.2. Formation of the double-salt crystals
47
Malic acid exerted a highly inhibitory effect on the rate of crystallisation by competing with
tartrate ions or interacting with calcium either in solution or on the crystal (Abgueguen and
Boulton, 1993). Thus malate acts as an inhibitor of calcium tartrate precipitation appearing to
interfere with nucleation-controlled crystal growth. CaT precipitation rate increases with
greater amounts of seed crystals added to the system. Thus, the inhibition by malate can be
overcome, to a certain extent, by seeding and thereby providing more surface area for crystal
growth (Clark, Fugelsang and Gump, 1988).
Recently a deacidification protocol has been proposed by Garcia-Ruiz, Alcantara and Martin
(1991), using the following conditions: maximum cooling temperatures of 2-3°C; seed
;":'":O7~:-:~~ - '--,--
-.',-. -'":
48
concentration of 8g/L; particle size < 50J,lm and mechanical stirring (no ultrasounds). Except
for the seeding concentration, all the other recommendations were incorporated in the
methods used in this study.
4.2 MATERIALS AND METHODS
4.2.1 STANDARDS
Two model solutions were made for the preliminary investigation into the deacidification
techniques. The first was made to imitate the high acid grape must and contained 109/L
tartaric, 50g/L gluconic, and 5g/L malic acid with 90g/L fructose (GOD/CAT treatment
converts all the glucose to gluconic acid) and buffered to pH 3.1 with concentrated NaOH.
The second model solution was made to imitate the reduced alcohol wine and contained
109/L tartaric, 50g/L gluconic, and 5g/L malic acid with 7% (v/v) ethanol and buffered to pH
3.1 with concentrated NaOH. All chemicals were sourced from BDH Chemicals Ltd.
4.2.2 PREPARATION OF HIGH ACID JUICE AND REDUCED ALCOHOL WINE
The juice and wines were produced by the GOD/CAT enzyme treatment(as described in
Chapter 2). Mi.iller Thurgau juice was obtained from Geisen Wines of Canterbury, New
Zealand. The juice had a pH of 3.15, TA of 6.94g/L, soluble solids of 18.0° Brix and a total
S02 concentration of 45.6 ppm. The juice was then treated with 1.5g/L GOD/CAT enzyme,
aerated with oxygen at 8gIL while being stirred for 10 hours. Upon completion the juice had
a pH of 3.15 and TA of 26.46glL. Half of this juice was then inoculated with Saccharomyces
cerevisiae str. Fermivin® SF (Gist-brocades, Sec1in cedex, France) and fermented at 12°C.
Upon completion of the primary fermentation, the wine had a pH of 3.21 and TA of 19.34glL.
49
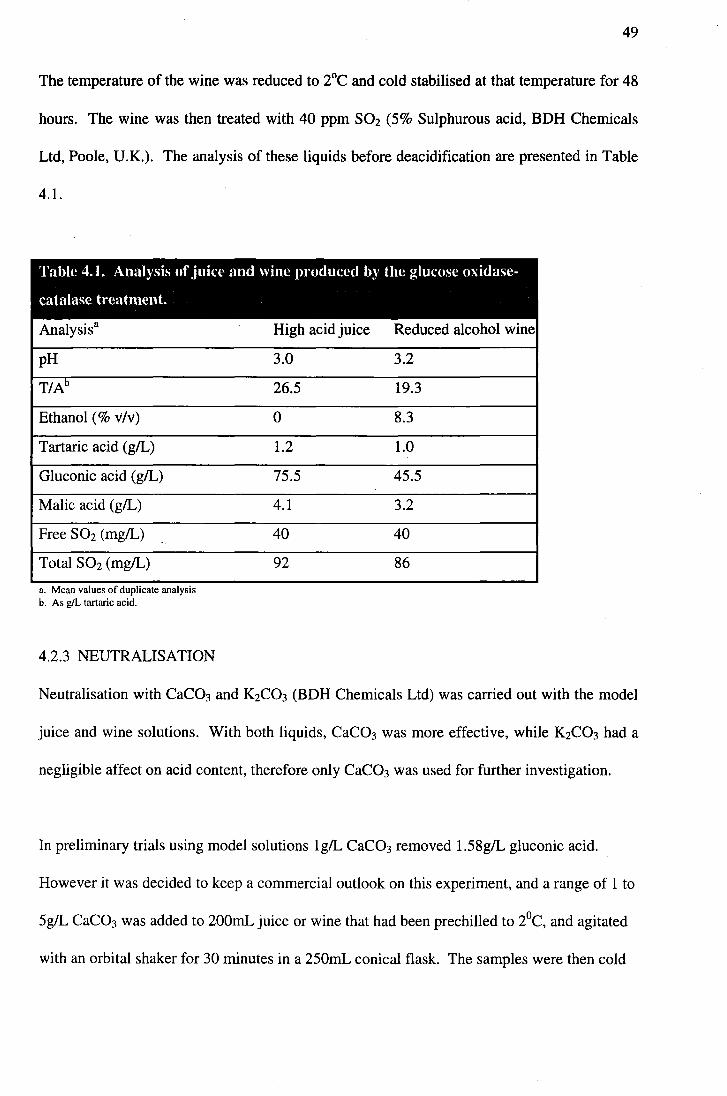
The temperature of the wine was reduced to 2°C and cold stabilised at that temperature for 48
hours. The wine was then treated with 40 ppm S02 (5% Sulphurous acid, BDH Chemicals
Ltd, Poole, U.K.). The analysis of these liquids before deacidification are presented in Table
4.1.
Table 4.1. Analysis of juice Hnd wine pruduced by the glucose oxidase.
catalase treatment.
Analysisa High acid juice Reduced alcohol wine
pH 3.0 3.2
T/Ab 26.5 19.3
Ethanol (% v/v) 0 8.3
Tartaric acid (g/L) 1.2 1.0
Gluconic acid (g/L) 75.5 45.5
Malic acid (g/L) 4.1 3.2
Free S02 (mg/L) 40 40
Total S02 (mg/L) 92 86 a. Mean values of duphcate analYSIS b. As giL tartaric acid.
4.2.3 NEUTRALISATION
Neutralisation with CaC03 and K2C03 (BDH Chemicals Ltd) was carried out with the model
juice and wine solutions. With both liquids, CaC03 was more effective, while K2C03 had a
negligible affect on acid content, therefore only CaC03 was used for further investigation.
In preliminary trials using model solutions Ig/L CaC03 removed 1.58g/L gluconic acid.
However it was decided to keep a commercial outlook on this experiment, and a range of 1 to
5g/L CaC03 was added to 200mL juice or wine that had been prechilled to 2°C, and agitated
with an orbital shaker for 30 minutes in a 250mL conical flask. The samples were then cold
~-~~::i'~~?::~; ~~
stabilised for two weeks at 2°C. After cold stabilisation, samples were filtered through a
0.45J.UIl membrane and analysed by HPLC for tartaric, gluconic and malic acid content. pH
and titratable acidity (TA, as gIL tartaric acid) were also determined.
4.2.4 COLD STABILISATION
50
All the deacidification techniques being tested in this project involve a period of cold
stabilisation of two weeks at 2°C. Therefore 200mL of untreated juice and wine was stored at
2°C and a sample of both was taken each day and analysed. The results of this served as a
baseline for the other deacidification techniques.
4.2.5 SEEDING
The deacidification agent was created in the form of the commercial preparation of calcium
carbonate seeded with calcium double-salt crystals called 'Acidex'. Two trials were
performed on the juice and wine, one consisting of varying amounts of calcium carbonate and
calcium gluconate, the other consisting of varying amounts of calcium carbonate and sodium
gluconate.
This custom made deacidification agent followed the same method as for 'Acidex' (refer
Chapter 4.1.3). Only a portion of the must or wine is treated with the agent and that portion is
then blended back with the untreated portion to achieve the desired amount of deacidification.
The treated portion, in effect, becomes a slurry, and made to reach pH 4.5-6.5 as quickly as
possible. This is needed to dissociate the gluconic acid into its carboxylate form to ensure a
salt formation (pKa of gluconic acid is 3.60).
51
Of the 200 mL juice/wine sample, l00ml was stirred into the 1 gIL seeding agent, the pH was
monitored to ensure that the solution remained above 4.5 pH. After 15 minutes stirring the
suspension was filtered and the filtrate added to the untreated lOOmL of juice/wine. The
sample was then chilled to 2°C, to ensure the best conditions for nucleation and therefore
precipitation. After two weeks of cold stabilisation the samples were analysed for gluconic,
tartaric and malic acid contents, pH and TA were also determined.
4.2.6 STATISTICAL ANALYSES
All results were analysed using a one-way analysis of variance or two-way analysis of
variance (Minitab release 9.2 General Linear Model). Statistical analyses for the
determination of significant differences between treatment means were conducted using a
Scott-Knott analysis.
4.2.7 CHEMICAL ANALYSES
The major organic acids found in the high acid grape juice and reduced alcohol wine were
determined by High Performance Liquid Chromatography (HPLC). This technique was
optimised and reviewed in Chapter Three.
The pH and titratable acidity (T A) were simultaneously determined using the 670
Titroprocessor coupled with the 665 Dosimat, an intelligent burette (Metrohm Ltd,
Switzerland).
:-:*-?:~ .:~ -:.: .... ~~.--.~.~
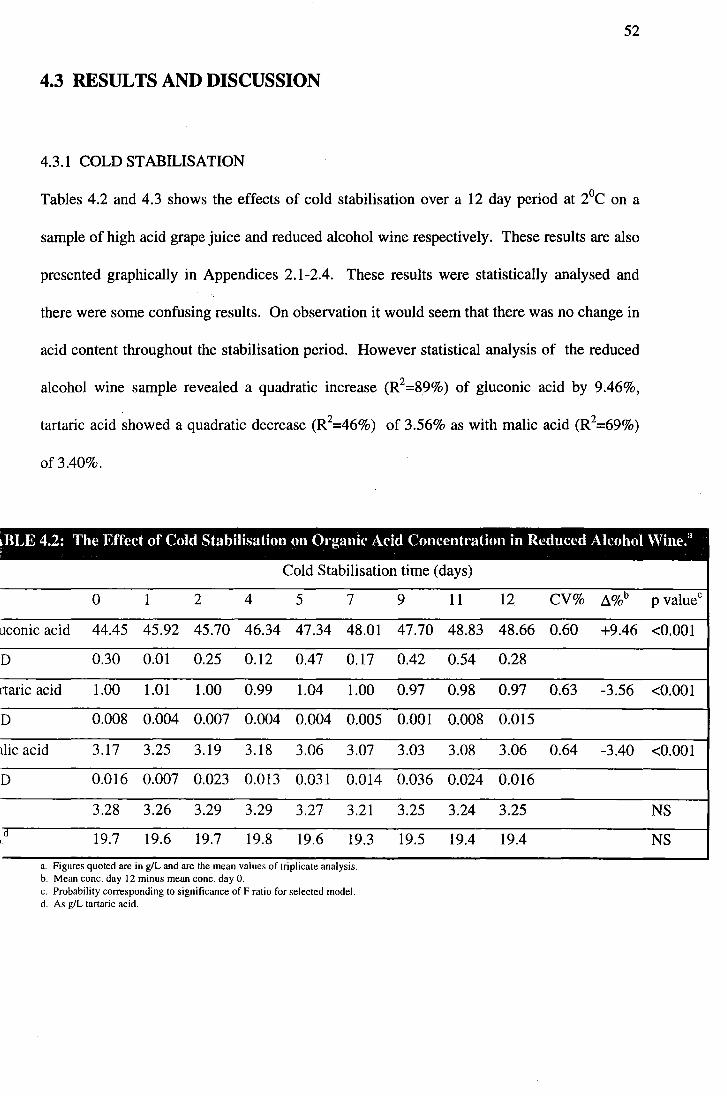
52
4.3 RESULTS AND DISCUSSION r:if~~ I
4.3.1 COLD STABILISATION
Tables 4.2 and 4.3 shows the effects of cold stabilisation over a 12 day period at 2°C on a
sample of high acid grape juice and reduced alcohol wine respectively. These results are also
presented graphically in Appendices 2.1-2.4. These results were statistically analysed and
there were some confusing results. On observation it would seem that there was no change in
acid content throughout the stabilisation period. However statistical analysis of the reduced
alcohol wine sample revealed a quadratic increase (R2=89%) of gluconic acid by 9.46%,
tartaric acid showed a quadratic decrease (R2=46%) of 3.56% as with malic acid (R2=69%)
of 3.40%.
BLE 4.2: The Effect of Cold Stabilisation on Organic Acid Concentration in Reduced Alcohol Wine.a
Cold Stabilisation time (days)
0 1 2 4 5 7 9 11 12 CV% ~%b p valuec
uconic acid 44.45 45.92 45.70 46.34 47.34 48.01 47.70 48.83 48.66 0.60 +9.46 <0.001
0 0.30 0.01 0.25 0.12 0.47 0.17 0.42 0.54 0.28
rtaric acid 1.00 1.01 1.00 0.99 1.04 1.00 0.97 0.98 0.97 0.63 -3.56 <0.001
0 0.008 0.004 0.007 0.004 0.004 0.005 0.001 0.008 0.015
die acid 3.17 3.25 3.19 3.18 3.06 3.07 3.03 3.08 3.06 0.64 -3.40 <0.001
0 0.016 0.007 0.023 0.013 0.031 0.014 0.036 0.024 0.016
3.28 3.26 3.29 3.29 3.27 3.21 3.25 3.24 3.25 NS d 19.7 19.6 19.7 19.8 19.6 19.3 19.5 19.4 19.4 NS I.
a. Figures quoted are In giL and are the mean values of tnphcate analYSIS. b. Mean conc. day 12 minus mean conc. day O. c. Probability corresponding to significance of F ratio for selected model. d. As giL tartaric acid.
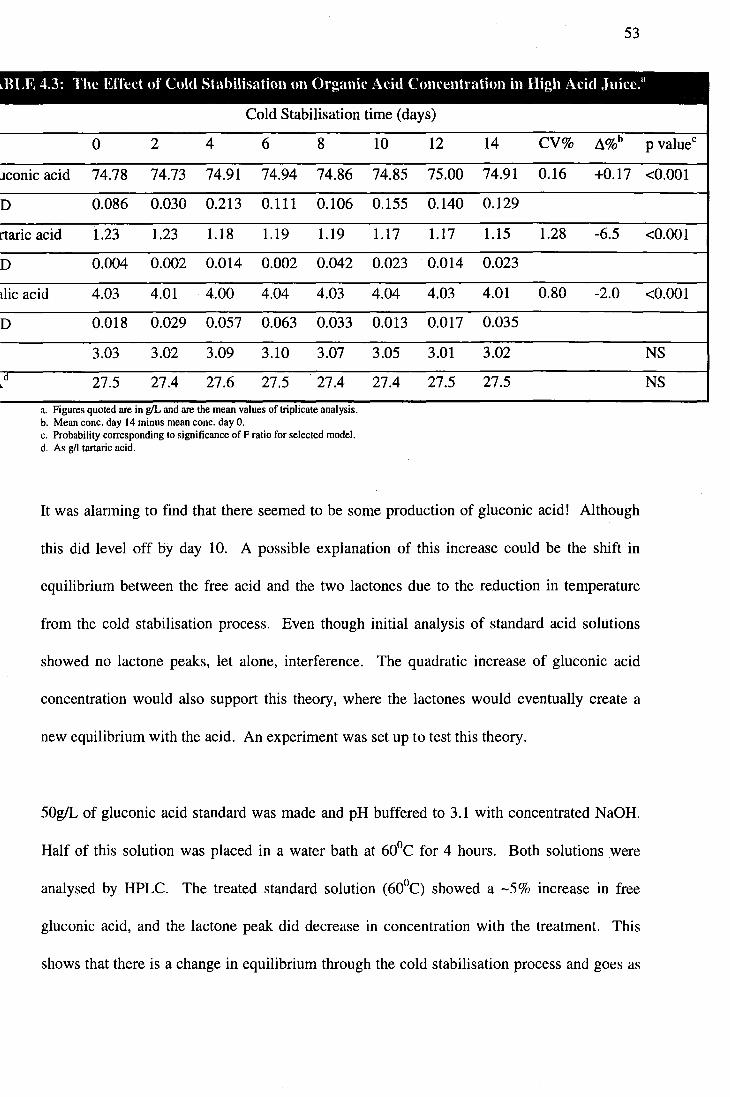
53
BLE 4.3: The Erfed of Cold Stabilisation on Organic Acid Concentration in High Acid Juice.1I
Cold Stabilisation time (days)
0 2 4 6 8 10 12 14 CV% L\%b P valuec
uconic acid 74.78 74.73 74.91 74.94 74.86 74.85 75.00 74.91 0.16 +0.17 <0.001
D 0.086 0.030 0.213 0.111 0.106 0.155 0.140 0.129
rtaric acid 1.23 1.23 1.18 1.19 1.19 1.17 1.17 1.15 1.28 -6.5 <0.001
D 0.004 0.002 0.014 0.002 0.042 0.023 0.014 0.023
:tlic acid 4.03 4.01 4.00 4.04 4.03 4.04 4.03 4.01 0.80 -2.0 <0.001
D 0.018 0.029 0.057 0.063 0.033 0.013 0.017 0.035
[ 3.03 3.02 3.09 3.10 3.07 3.05 3.01 3.02 NS d 27.5 27.4 27.6 27.5 27.4 27.4 27.5 27.5 NS ~
a. Figures quoted are In gIL and are the mean values of Inpllcate analYSIS. b. Mean conc. day 14 minus mean conc. day 0. c. Probability corresponding to significance of F ratio for selected model. d. As gil tartaric acid.
It was alarming to find that there seemed to be some production of gluconic acid! Although
this did level off by day 10. A possible explanation of this increase could be the shift in
equilibrium between the free acid and the two lactones due to the reduction in temperature I
i from the cold stabilisation process. Even though initial analysis of standard acid solutions f·,,· ... showed no lactone peaks, let alone, interference. The quadratic increase of gluconic acid I
concentration would also support this theory, where the lactones would eventually create a
new equilibrium with the acid. An experiment was set up to test this theory.
I·.::,·,::·:·:·:·:·: r . - .' -. - _ .• ~ - '-
50g/L of gluconic acid standard was made and pH buffered to 3.1 with concentrated NaOH.
Half of this solution was placed in a water bath at 60°C for 4 hours. Both solutions were
analysed by HPLC. The treated standard solution (60°C) showed a -5% increase in free
gluconic acid, and the lactone peak did decrease in concentration with the treatment. This
shows that there is a change in equilibrium through the cold stabilisation process and goes as
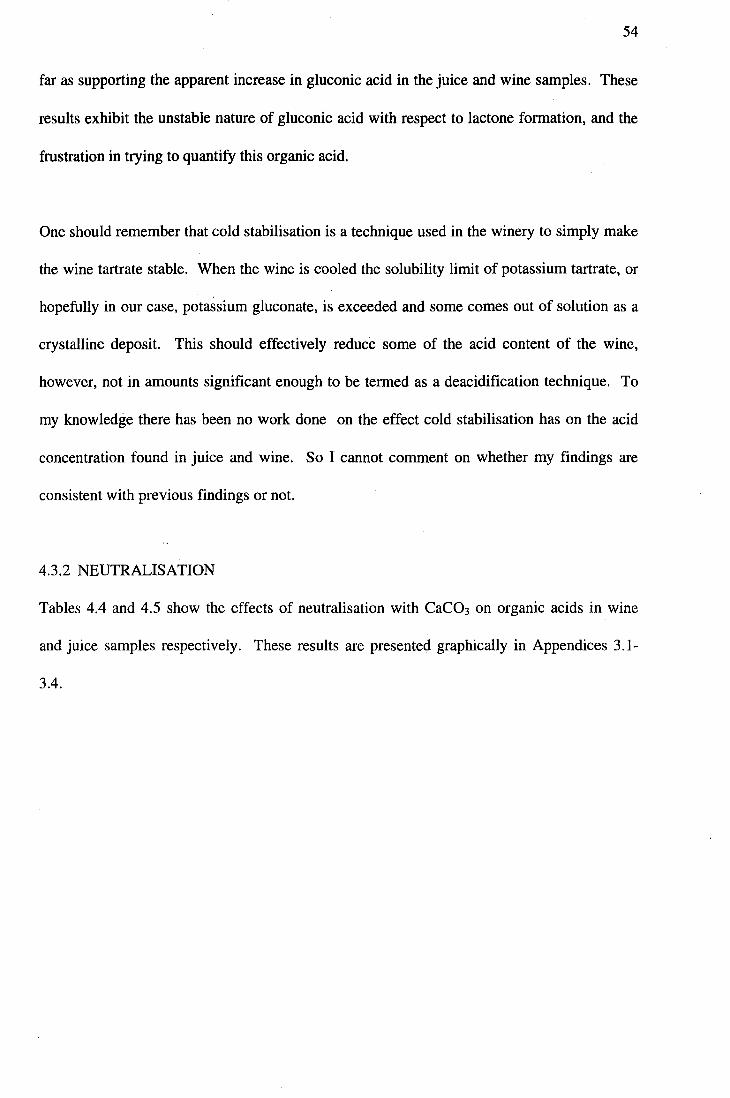
54
far as supporting the apparent increase in gluconic acid in the juice and wine samples. These
results exhibit the unstable nature of gluconic acid with respect to lactone formation, and the
frustration in trying to quantify this organic acid.
One should remember that cold stabilisation is a technique used in the winery to simply make
the wine tartrate stable. When the wine is cooled the solubility limit of potassium tartrate, or
hopefully in our case, potassium gluconate, is exceeded and some comes out of solution as a
crystalline deposit. This should effectively reduce some of the acid content of the wine,
however, not in amounts significant enough to be termed as a deacidification technique. To
my knowledge there has been no work done on the effect cold stabilisation has on the acid
concentration found in juice and wine. So I cannot comment on whether my findings are
consistent with previous findings or not.
4.3.2 NEUTRALISATION
Tables 4.4 and 4.5 show the effects of neutralisation with CaC03 on organic acids in wine
and juice samples respectively. These results are presented graphically in Appendices 3.1-
3.4.
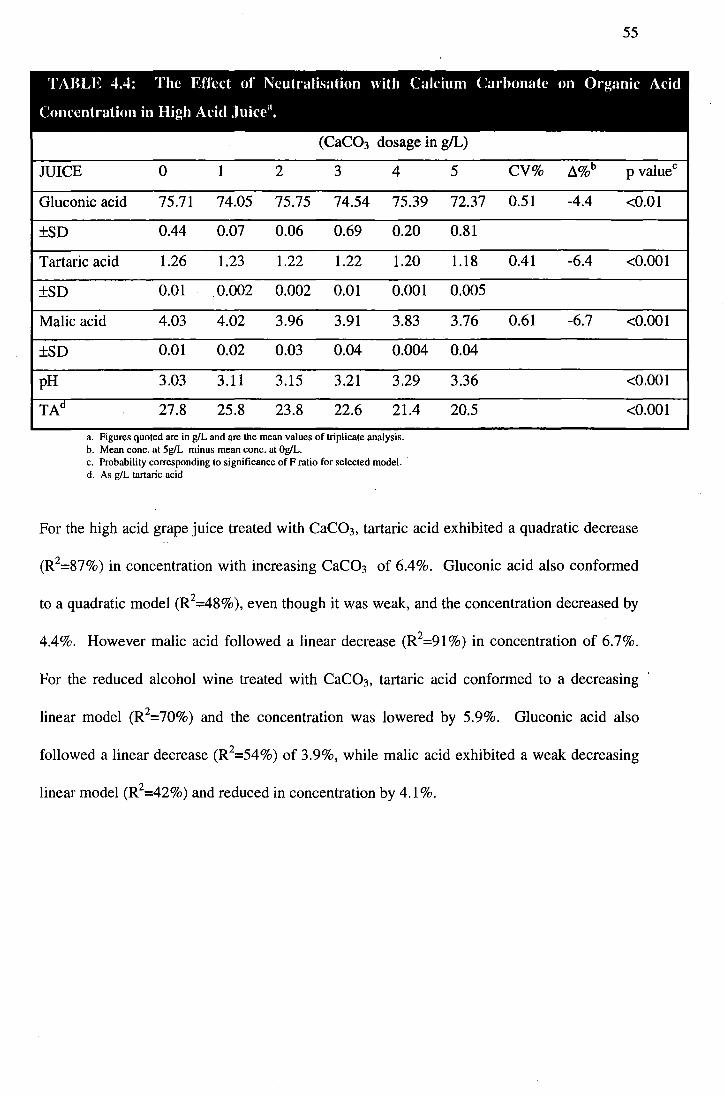
55
TABLE 4.4: The Effect uf Neutralisation with Calcium Carhonate on Organic Acid
Concentration in High Acid Juice l\
(CaC03 dosage in gIL)
JUICE 0 1 2 3 4 5 CV% .1%b P valuec
Gluconic acid 75.71 74.05 75.75 74.54 75.39 72.37 0.51 -4.4 <0.01
±SD 0.44 0.07 0.06 0.69 0.20 0.81
Tartaric acid 1.26 1.23 1.22 1.22 1.20 1.18 0.41 -6.4 <0.001
±SD 0.01 0.002 0.002 0.01 0.001 0.005
Malic acid 4.03 4.02 3.96 3.91 3.83 3.76 0.61 -6.7 <0.001
±SD 0.01 0.02 0.03 0.04 0.004 0.04
pH 3.03 3.11 3.15 3.21 3.29 3.36 <0.001
TAd 27.8 25.8 23.8 22.6 21.4 20.5 <0.001 .. a. Figures quoted are In giL and are the mean values of tnphcate analYSIS.
b. Mean conc. at 5g1L minus mean conc. at OglL. c. Probability corresponding to significance of F ratio for selected model. . d. As giL tartaric acid
For the high acid grape juice treated with CaC03, tartaric acid exhibited a quadratic decrease
(R2=87%) in concentration with increasing CaC03 of 6.4%. Gluconic acid also conformed
to a quadratic model (R2=48%), even though it was weak, and the concentration decreased by
4.4%. However malic acid followed a linear decrease (R2=91 %) in concentration of 6.7%. I" -.' ,
For the reduced alcohol wine treated with CaC03, tartaric acid conformed to a decreasing
linear model (R2=70%) and the concentration was lowered by 5.9%. Gluconic acid also
followed a linear decrease (R2=54%) of 3.9%, while malic acid exhibited a weak decreasing
linear model (R2=42%) and reduced in concentration by 4.1 %.
56
'fABLE 4.5: Thl' Effect of Neutralisation with Calcium Carhonate on Organic Acid
Concentration in Reduced Alcohol 'Vinea•
(CaC03 dosage in gIL)
WINE 0 1 2 3 4 5 CV% L\%b P valuec
Gluconic acid 44.85 44.68 43.76 44.62 42.74 43.09 1.0 -3.9 <0.01
±SD 0.72 0.65 0.05 0.38 0.60 0.28
Tartaric acid 1.01 0.99 1.00 0.99 0.94 0.95 0.92 -5.9 <0.001
±SD 0.02 0.01 0.004 0.009 0.01 0.001
Malic acid 3.18 3.13 3.06 3.11 2.95 3.05 1.5 -4.1 <0.005
±SD 0.04 0.05 0.009 0.02 0.05 0.11
pH 3.17 3.32 3.45 3.60 3.63 3.77 <0.001
TAd 20.3 18.6 16.9 15.3 14.5 13.4 <0.001 . . a. Figures quoted are In giL and are the mean values of tnphcate analysIs .
b. Mean conc. at 5gIL minus mean conc. at OgIL. c. Probability corresponding to significance of F ratio for selected model. d. As gIL tartaric acid.
4.3.3 SEEDING
Tables 4.6, 4.7, 4.8 and 4.9 show the effects of adding varying amounts of seed crystals on the
concentration of organic acids in wine and juice samples respectively. These results are
shown graphically in Appendices 3.5-3.8. For these trials two seeding crystals were used,
applied with varying amounts of CaC03 to make a total dosage application of IglL. The four
treatments for each seeding trial were as follows:
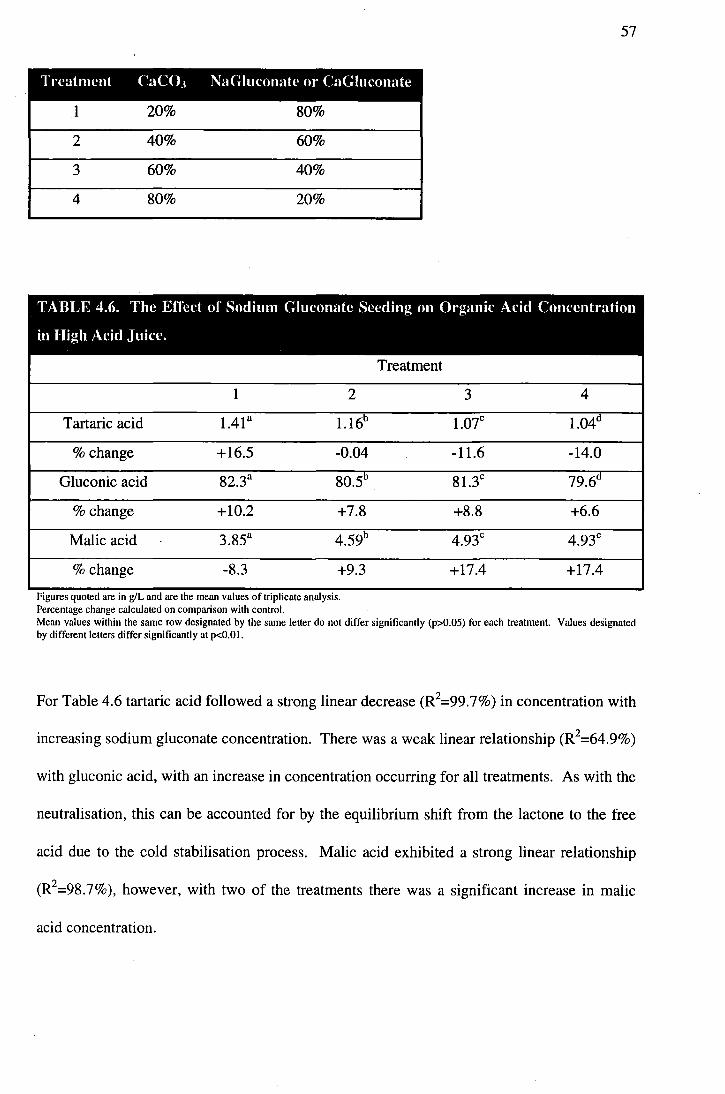
57
Treatment CaCOJ NaGlucunate or CaGluconate
1 20% 80%
2 40% 60%
3 60% 40%
4 80% 20%
TARLE 4.6. The Effect of Sodium Glucunate Seeding on Ol'g~lIlic Acid Concentration
in High Acid Juice.
1 2
Tartaric acid 1.41 a 1.16b
% change +16.5 -0.04
Gluconic acid 82.33 80.5b
% change +10.2 +7.8
Malic acid -. 3.85a 4.59b
% change -S.3 +9.3 . . FIgures quoted are In giL and are the mean values of tnphcate analysIs .
Percentage change calculated on comparison with control.
Treatment
3 4
1.07c 1.04d
-11.6 -14.0
81.3c 79.6d
+8.8 +6.6
4.93c 4.93c
+17.4 +17.4
Mean values within the same row designated by the same letter do not differ significantly (p>O.05) for each treatment. Values designated by different letters differ significantly at p<O.O I.
For Table 4.6 tartaric acid followed a strong linear decrease (R2=99.7%) in concentration with
increasing sodium gluconate concentration. There was a weak linear relationship (R2=64.9%)
with gluconic acid, with an increase in concentration occurring for all treatments. As with the
neutralisation, this can be accounted for by the equilibrium shift from the lactone to the free
acid due to the cold stabilisation process. Malic acid exhibited a strong linear relationship
(R2=9S.7%), however, with two of the treatments there was a significant increase in malic
acid concentration.
r" -. ----
:~iii~£4: :;-.-, .. -.. ,,-:: ~~~;;.;:~ ~<~::.'7::_~::::::.:.
I::'·':'·"'·:·'·':" 1---'·"'" :.;.
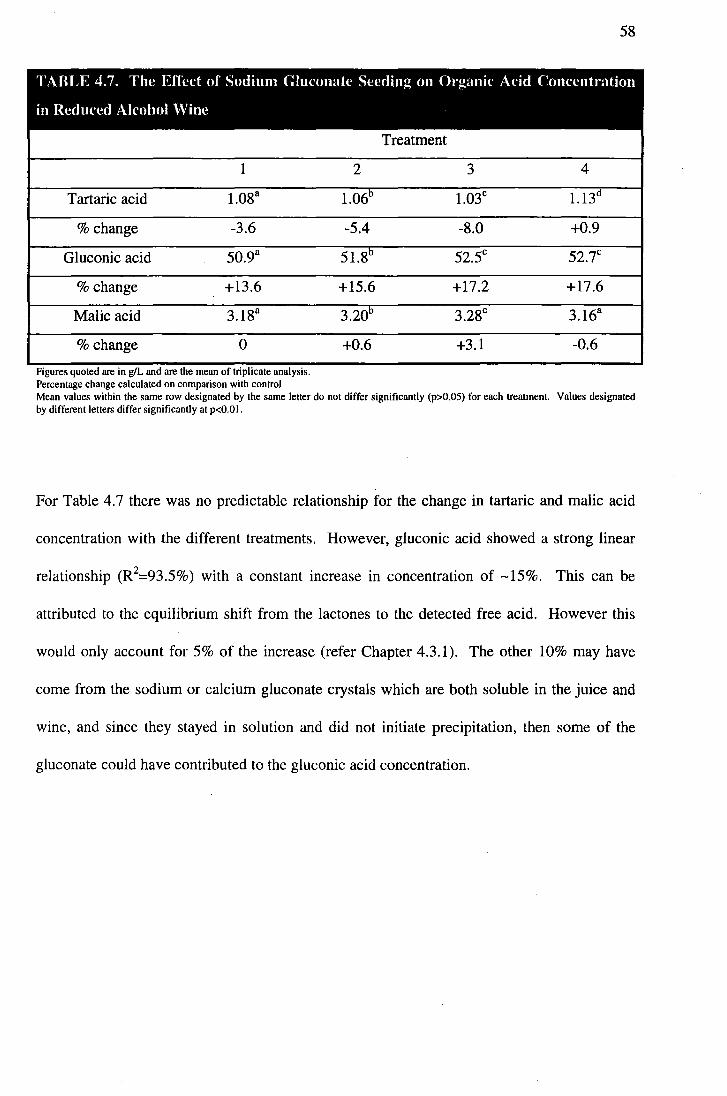
58
TABLE 4.7. The Efl'ect of Sodium Gluconate Seeding on Organic Add Concentration
in Reduced Alcohol Wine
1
Tartaric acid 1.08a
% change -3.6
Gluconic acid 50.9a
% change +13.6
Malic acid 3.18a
% change 0 . . Figures quoted are In giL and are the mean of tnpllcate analysIs .
Percentage change calculated on comparison with control
Treatment
2 3 4
1.06b 1.03c l.13d
-5.4 -8.0 +0.9
51.8b 52.5c 52.7c
+15.6 +17.2 +17.6
3.20b 3.28c 3.16a
+0.6 +3.1 -0.6
Mean values within the same row designated by the same letter do not differ significantly (p>O.05) for each treatment. Values designated by different letters differ significantly at p<O.OI.
For Table 4.7 there was no predictable relationship for the change in tartaric and malic acid
concentration with the different treatments. However, gluconic acid showed a strong linear
relationship (R2=93.5%) with a constant increase in concentration of -15%. This can be
attributed to the equilibrium shift from the lactones to the detected free acid. However this
would only account for 5% of the increase (refer Chapter 4.3.1). The other 10% may have
come from the sodium or calcium gluconate crystals which are both soluble in the juice and
wine, and since they stayed in solution and did not initiate precipitation, then some of the
gluconate could have contributed to the gluconic acid concentration.
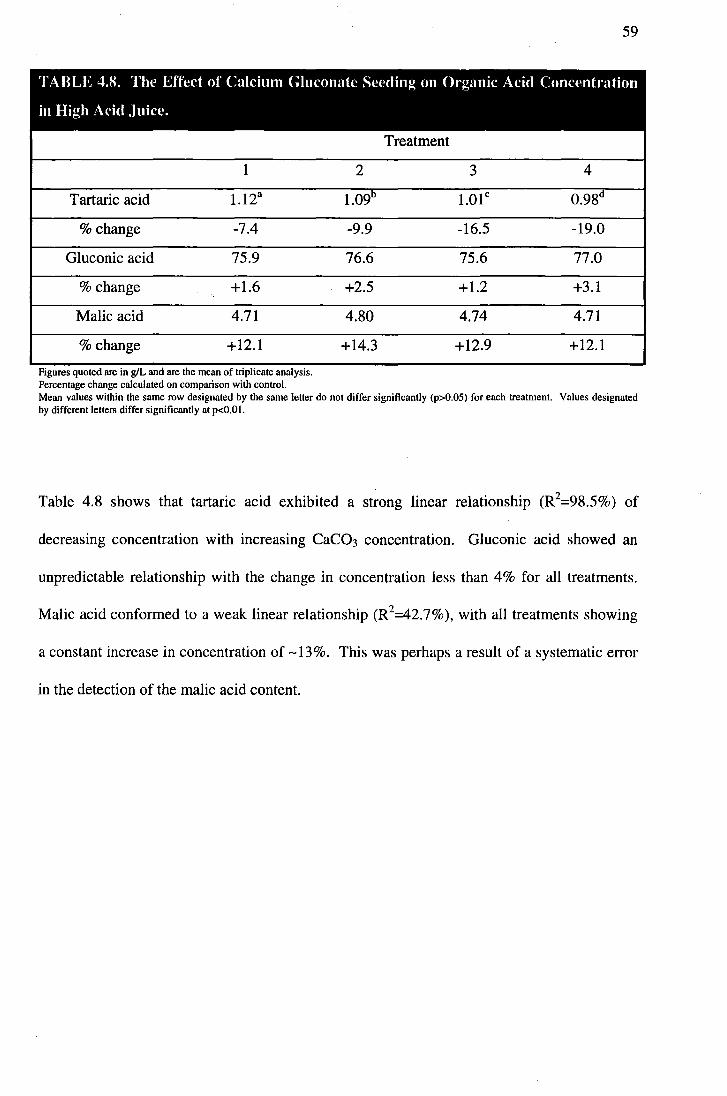
59
TABLE 4.8. The Effect of Calcium (;Iuconate Seeding on Organic Acid Concentration
in High Acid Juice.
1
Tartaric acid 1.12a
% change -7.4
Gluconic acid 75.9
% change +1.6
Malic acid 4.71
% change +12.1 .. Figures quoted are ID giL and are the mean of tnphcate analysIs.
Percentage change calculated on comparison with control.
Treatment
2 3 4
1.09b 1.01c 0.98(\
-9.9 -16.5 -19.0
76.6 75.6 77.0
+2.5 +1.2 +3.1
4.80 4.74 4.71
+14.3 +12.9 +12.1
Mean values within the same row designated by the same letter do not differ significantly (p>O.05) for each treatment. Values designated by different letters differ significantly at p<O.OI.
Table 4.8 shows that tartaric acid exhibited a strong linear relationship (R2=98.5%) of
decreasing concentration with increasing CaC03 concentration. Gluconic acid showed an
unpredictable relationship with the change in concentration less than 4% for all treatments.
Malic acid conformed to a weak linear relationship (R2=42.7%), with all treatments showing
a constant increase in concentration of -13%. This was perhaps a result of a systematic error
in the detection of the malic acid content.
~: ,~::-:.:: f--· ._"- .
;-- .. ,
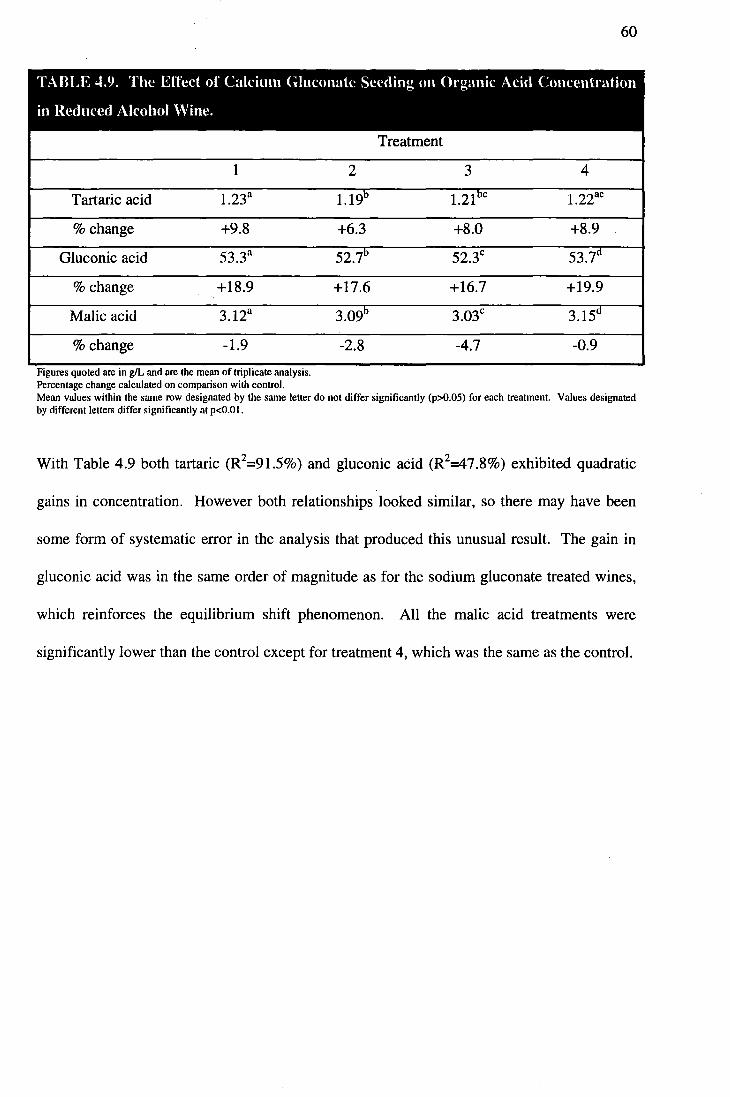
60
TABLE .... 9. The Effect of Calcium Gluconatc Seeding on Organic Acid Concentration
in RedlH:ed Alcohol Wine.
1
Tartaric acid 1.23a
% change +9.8
Gluconic acid 53.3a
% change +18.9
Malic acid 3.12a
% change -1.9
.. Figures quoted are In giL and are the mean of tnphcate analYSIS. Percentage change calculated on comparison with control.
2
1.19b
+6.3
52.7b
+17.6
3.09b
-2.8
Treatment
3 4
1.21 bc 1. 22ac
+8.0 +8.9
52.3c 53.7°
+16.7 +19.9
3.03c
3.15d
-4.7 -0.9
Mean values within the same row designated by the same leiter do not differ significantly (p>O.05) for each treatment. Values designated by differentletlers differ significantly at p<O.OI.
With Table 4.9 both tartaric (R2=91.5%) and gluconic acid (R2=47.8%) exhibited quadratic
gains in concentration. However both relationships looked similar, so there may have been
some form of systematic error in the analysis that produced this unusual result. The gain in
gluconic acid was in the same order of magnitude as for the sodium gluconate treated wines,
which reinforces the equilibrium shift phenomenon. All the malic acid treatments were
significantly lower than the control except for treatment 4, which was the same as the control.
~-:~:~~-:~.:::-~ . .::~.
~~~~
61
4.4 CONCLUSIONS \
4.4.1 NEUTRALISATION
All these results were very disappointing, as this technique was supposed to be the best for
the reduction of acidity. A possible explanation for this could be the small amount of tartaric
acid in the juice and wine to begin with. With such a small amount of acid to react with the
CaC03, the precipitation of CaT may not have been possible. It was hoped that with such a
small amount of tartaric acid, the calcium would then react with the abundant gluconic acid to
form a precipitate of calcium gluconate. This was not the case. Of course, as referred in the
introduction, one of the problems with neutralisation is that it can take time for the
precipitation to occur. So perhaps the juice and wine samples had simply not precipitated
completely by the time of analysis.
All the results were shown to be statistically significant, however in real terms the loss of
acidity was negligible. The majority of acids decreased quadratically which is in accordance
to what would be expected, as there would be a point where the loss in acid content would
level off and become constant. It was decided to keep the dosage rates within a commercial
range, so it was considered that 5gIL would be an absolute maximum in a winery. However
unpublished preliminary studies by Pickering (1993) revealed that with model acid solutions,
there was a significant decrease in all acids with dosages in the range of 30glL. So perhaps
the energy barrier for the precipitation of calcium gluconate that can only be surpassed by a
very high dosage rates?
62
4.4.2 SEEDING
All the results were shown to be statistically significant, although, in real terms the loss of
acidity was negligible. Most of the treatments showed either an increase or decrease in acid
content under a linear relationship. Theoretically one would expect quadratic relationships to
show a leveling in the effectiveness of the treatment. Of course, within the parameters used
the linear relationship could be the initial reaction to the treatment, and if the dosages were to
increase, then an overall quadratic relationship could be observed.
All treatments showed an increase in gluconic acid. Both juice treatments had an increase in
acid content" by <10%, while the wine treatments showed an increase by <20%. This
confirms that the shift in equilibrium between the lactones and the free gluconic acid is a real
affect, and one that could require further investigation. Also if the wine or juice is not
saturated with respect to gluconate, then the addition of gluconate crystals could result in an
increase in gluconic acid concentration. pH and titratable acidity of the treatments followed a
trend in relation to the amount of CaC03 added, and seemed not to have been influenced by
the seed crystals. That is, as the CaC03 content in the application increased compared to the
amount of seed crystal, T A decreased, and pH increased.
Some results showed no predictable relationships, or followed a trend that was beyond
explanation. These may have been due to a systematic error in the method of detection or
merely due to the complex and uncertain nature of the product being dealt with.
CHAPTER FIVE
ANION EXCHANGE
5.1 REVIEW OF LITERATURE
5.1.1 GENERAL INTRODUCTION
63
Ion exchange in winemaking has been practised for about thirty years and its main use has
been in preventing potassium bitartrate deposition. High pH reduces the quality of the wine
by giving a "flat" unbalanced palate, dull colour and low resistance to chemical and
microbiological spoilage. Ion exchange offers a practical means of achieving pH reduction
and lowers pH further than does the addition of tartaric acid to give the same increase in
titratable acidity. When tartaric acid is added both hydrogen ions and the weak base, the
tartrate anion, are added, whilst with ion exchange, hydrogen ions alone are increased in the
wine (Rankine, 1991).
Ion exchange has the promise of being able to stabilise wines quickly and cheaply. This can
be performed without the sacrifice in quality that is associated with conventional cellar
practices of chemical deacidification. Deacidification by ion exchange eliminates heavy
capital investment in refrigeration equipment and allows flexibility in production scheduling.
Australia and California are the main winemaking regions using ion-exchange on an industry
scale. There has been a mixed reception for this process in Germany and it is not so widely
used (Rankine, 1965). In Australia, the main use for ion exchange has been for the
64
prevention of potassium bitartrate deposition. To my knowledge, ion exchange has not been
used in the New Zealand wine industry, maybe due to the expense into the use of
refrigeration. It is in Germany, where excess acidity is a problem, that ion exchange is used
to reduce acidity. The basis of this process will be adopted in our objective to reduce
gluconic acid in high acid grape juice and reduced alcohol wine.
5.1.2 CHEMISTRY
An ion exchange resin may be defined as an insoluble matrix containing labile ions capable of
exchanging with ions in the surrounding liquid without physical change taking place in its
structure. Ion exchange resins can be divided into two broad groups, cation and anion
exchangers, and these can be further subdivided into weakly acid or basic and strongly acid or
basic according to their chemical groupings (Rankine, 1965).
Ion exchange processes are based upon exchange equilibrium between ions in solution and
ions of like sign on the surface of an insoluble, high molecular weight solid. Synthetic ion
exchange resins were first produced in the 1930's for water softening, water deionisation and
solid purification. The most common active sites for cation exchange resins are the sulphonic
acid group -S03-H+ (strong acid) and the carboxylic acid group -COOH (weak acid). Anionic
exchangers contain tertiary amine groups -N(CH3)/OH (strong base) or primary amine
groups -NH30H (weak base).
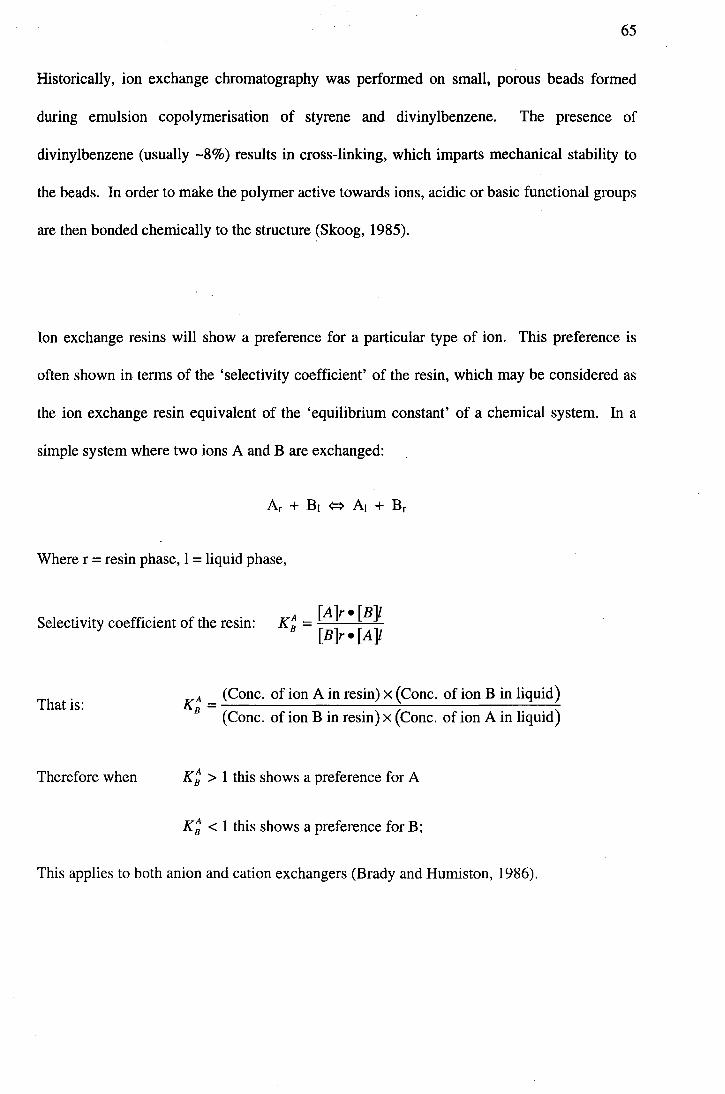
65
Historically, ion exchange chromatography was performed on small, porous beads formed
during emulsion copolymerisation of styrene and divinylbenzene. The presence of
divinylbenzene (usually -8%) results in cross-linking, which imparts mechanical stability to
the beads. In order to make the polymer active towards ions, acidic or basic functional groups
are then bonded chemically to the structure (Skoog, 1985).
Ion exchange resins will show a preference for a particular type of ion. This preference is
often shown in terms of the 'selectivity coefficient' of the resin, which may be considered as
the ion exchange resin equivalent of the 'equilibrium constant' of a chemical system. In a
simple system where two ions A and B are exchanged:
Where r = resin phase, I = liquid phase,
Selectivity coefficient of the resin: K~ = [A]r. [B]l [B]r.[A]l
That is: A (Conc. of ion A in resin) x (Conc. of ion B in liquid) K=--------~~---------"-~
B (Conc. of ion B in resin) x (Conc. of ion A in liquid)
Therefore when K; > 1 this shows a preference for A
K; < 1 this shows a preference for B;
This applies to both anion and cation exchangers (Brady and Humiston, 1986).
66
The anion exchange resins derive their properties from the amino group and substituted
amino groups in the resin structure (Figure 5.1). Weakly basic resins can only be used in
neutral or acid solutions, having negligible exchange capacity under alkaline conditions
(BDH,1977).
-CH2-:-Q-CQ~-
I CH,NR~ CH,N~I CH,NR,CI -CH-CH2
Figure 5.1. Structural formula for anion exchanger.
Weak base resins have a chemistry similar to that of ammonia, the free base form adsorbs
strong acids. The application of ion exchange resins can be divided into a number of
categories:
• Ion exchange
• Elimination
• Fractionation chromatography
• Neutralisation
replacement of one ion in solution with another.
removal of unwanted ions from solution.
ions captured on ion exchange column are selectively eluted.
addition of acid- or alkali-charged resin to solution (Amerine, 1980; Ough, 1975).
67
5.1.3 PRINCIPLES
In cool climates such as New Zealand and Germany excess acidity can be caused by
incomplete ripening of the grape or insufficient sugar concentration, and reduction of acidity
becomes necessary. This is usually carried out by adding calcium carbonate (CaC03) which
precipitates some of the tartaric acid as calcium salt. This process is usually sufficient, but in
some cases the addition of CaC03 can produce off-flavours and also subject the wine to slow
precipitation, which inhibits early bottling. Furthermore it does not reduce the concentration
of malic acid, which may contribute a considerable proportion of the acidity. Deacidification
by anion exchange is an attractive alternative due to a number of reasons:
1. Reduction in acidity can be controlled.
2. Process is simple and does not require a precipitation reaction.
3. Technique can be used online for large scale wine production.
The wine is passed through a weakly basic anion exchange resin, usually in the hydroxyl form
(Rankine, 1965). As the wine passes through the resin, the various anions are replaced with
the hydroxyl ions thus reducing acidity.
~ I !
~i~i~#;:; . :-(: • .:~:,:-.:~'!C..: •.
:;::~S?:~ .. / ..
1-: ~ :-.": - - : - <
68
Neutralisation of high acid in wines involves a weakly basic anion exchange resin. The
weakly basic groups present in the resin neutralise the natural fruit acids which are commonly
tartaric, malic and citric acids. This type of resin is easily regenerated with a solution of
sodium hydroxide. The advantages of treating wine by ion exchange as opposed to
conventional methods for stabilisation and acidity reduction lie in the unit-process nature of
columnar ion exchange procedures (Percival, McGarvey and Sonneman, 1958).
In the past, most anion/cation exchange techniques used to adjust the acidity of wine,
involved an anion exchange resin in the hydroxyl form. Bonorden, Nagel and Powers (1986)
employed an anion/cation exchange treatment for the adjustment of high pHlhigh T A wines.
The method involves charging the anion exchange with tartaric acid, placing it in the tartrate
form. The tartrate would exchange with the malate anion. This would result in both pH and
T A reduction because of the substitution of a stronger acid for a weak acid. This approach
was applied to high gluconic acid juice and wine, where hopefully the tartrate would
exchange with the gluconate anion.
There is no difficulty in the deacidification of wine in the normal way with calcium
carbonate, when there is sufficient time. However, some wineries operate for the most rapid
possible turnover of wine. It is not unusual to run short of old stock before the young wines
of the new vintage must be used. Under such circumstances the main difficulty consists in
that almost all wines have to be deacidified in a short time to make them suitable for
consumption and to prevent tartrate precipitation in the bottle.
69
The anion exchanger has certain advantages over other methods of deacidification. It can be
used repeatedly, thus reducing cost. The resin removes both malic and tartaric acid, while
only tartrate is removed by chemical means (Moser, 1956). The use of anion exchange resin
is currently less popular than cation exchangers.
There is conflicting information concerning the merits of treating wines with anion exchange
resins. Rankine (1965) stated that wine deacidification by ion exchange was not comparable
to the calcium carbonate procedure. In contrast, Moser (1956) reported that wines deacidified
by anion exchange did not alter any sensory attributes and in fact, that the ion exchanged
wines tasted 'better than the calcium carbonate treated wines. This finding is reinforced by
Dickinson and Stoneman, (1958), who used cation exchange to stabilise wine with respect to
tartrate. Most of the experts in his tasting panel were unable to select the wines subjected to
the ion exchange treatment with a frequency sufficiently great to be of statistical significance.
Commercial anion exchange resins were evaluated in Canada for their influence on wine
quality and degree of deacidification (Zubeckis, 1962). One of the resins tested included the
Amberlite IR-45 which is now superseded by the resin we used; Amberlite IRA-93. Their
characteristics are very similar, so it was promising to find that the results showed the treated
wines had improved in flavour, although colour and bouquet was found to decrease. In
another study, Zubeckis (1958) reported that the change in sensory quality of the treated
wines was hardly detectable when the deacidified wines were mixed with the original wine to
a desired acidity.
70
The GOD/CAT treatment, as mentioned before, converts glucose to gluconic acid, so the final
juice and wine product has a very high acid content. The disadvantages of too high an acidity
are noted by tartrate precipitation in the bottle and by too sour a taste (Moser, 1956). The
objective of this study was to try and selectively reduce the gluconic acid content in the
juice/wine. -;;-.-:·:-:c-"':~-·:·-
:5;-:i;:7~ '-:--~ ... -.~-:: .. :.~--;
5.2 MATERIALS AND METHODS
5.2.1 ANALYTICAL METHODS
The pH and T A were determined with a Metrohm 670 Titroprocessor coupled with the
Metrohm 665 Dosimat, an intelligent burette (Metrohm Ltd, CH-9100 Herisau, Switzerland).
Organic acid analysis was by a high performance liquid chromatography technique that was
optimised for the detection of gluconic acid (refer Chapter 3). The samples were detected
using a Waters 490E Multiwavelength Detector set at 210nm and the peak: heights were
determined with the Millennium 2010 Chromatography Manager (Millipore Corporation,
Waters Chromatography Division, Milford, MA).
5.2.2 PREPARATION OF HIGH ACID JUICE AND REDUCED ALCOHOL WINE
Mi.iller Thurgau juice was obtained from Geisen Wines of Canterbury, New Zealand. The
juice had a pH of 3.15, TA of 6.94glL, soluble solids of 18.0° Brix and a total S02 , .
. - ~ . - - - - - - . i : -: :--':~--:--'
concentration of 45.6 ppm. The juice was then treated with 1.5g/L GOD/CAT enzyme,
aerated with oxygen at 8gIL while being stirred for 10 hours. Upon completion the juice had
a pH of 3.15 and TA of 26.46glL. Half of this juice was then inoculated with Saccharomyces
cerevisiae sfr. Fermivin® SF (Gist-brocades, Sec1in cedex, France) and fermented at 12°C.
71
Upon completion of the primary fermentation, the wine had a pH of 3.21 and T A of 19.34g/L.
The temperature of the wine was reduced to 2°C and cold stabilised at that temperature for 48
hours. The wine was then treated with 40 ppm S02 (5% Sulphurous acid, BDH Chemicals
Ltd, Poole, U.K.).
5.2.3 ANION EXCHANGE
Unused Amberlite IRA-93 (Sigma Chemicals Co., St Louis, MO) was washed and fined in
distilled water. A glass column (2.5 cm i.d.) was packed with IRA-93 to a predetermined
volume of 71.4cm3, wet volume, necessary for the treatment of 500ml of juice/wine (see
Results and> Discussion). The column was washed in series with 3L of distilled water,
750ml of 10% (v/v) ethanol solution, and 1.25L of distilled water.
To prepare the colu.mn for treatment of juice/wine the following procedure was used: 250ml
of IN NaOH was passed through the column. The column was rinsed with distilled water to
a pH of 8 to 9 and placed in the tartrate form by running IN tartaric acid over the column.
The column was then rinsed with 3 bed volumes of distilled water. Since aeration of wine
and juice is possible due to the handling involved, the column and lines should be flushed
with inert gas beforehand.
One bed volume of juice/wine was passed through the column and discarded. The treated
wine/juice was refrigerated until a temperature of approximately 2°C was reached, seeded
with Ig/L potassium bitartrate, cold stabilised for a minimum of 48 hours, decanted and
stored at 2°C. The resulting solution was then backblended at various levels to produce a
more balanced wine/juice.
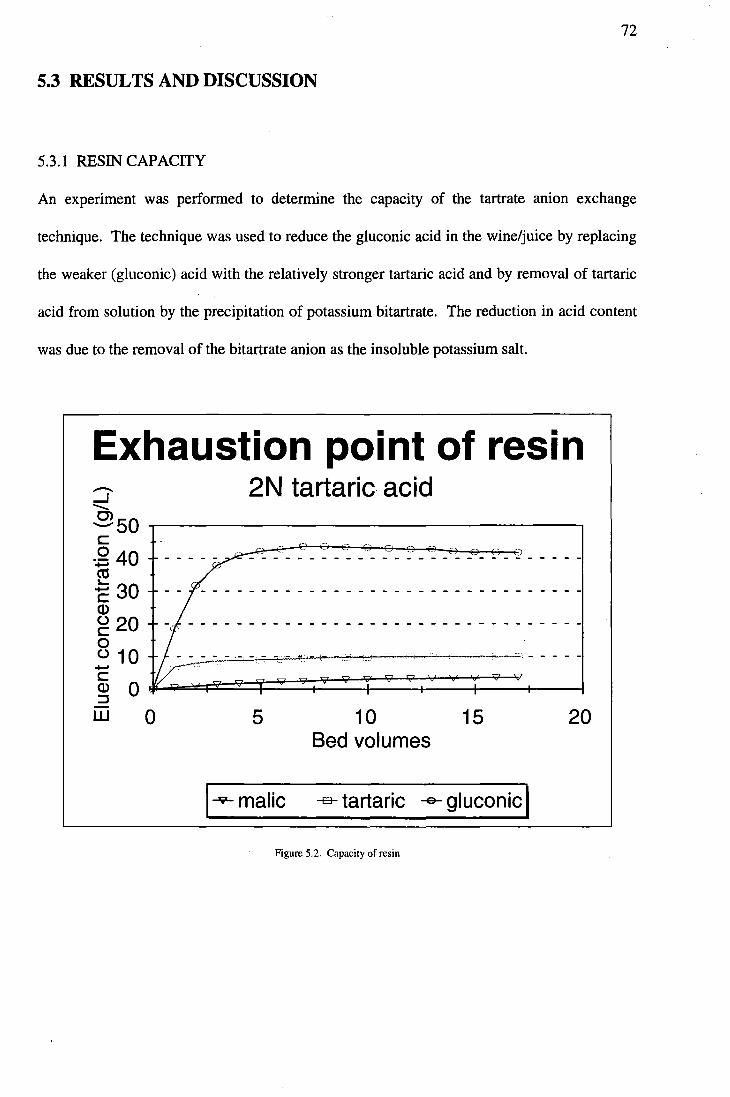
72
5.3 RESULTS AND DISCUSSION
5.3.1 RESIN CAPACITY :
An experiment was performed to determine the capacity of the tartrate anion exchange
technique. The technique was used to reduce the gluconic acid in the wine/juice by replacing
the weaker (gluconic) acid with the relatively stronger tartaric acid and by removal of tartaric
acid from solution by the precipitation of potassium bitartrate. The reduction in acid content
was due to the removal of the bitartrate anion as the insoluble potassium salt.
Exhaustion point of resin 2N tartaric acid -.....J ..........
~50 ~--------------------------------~ c ·~40
'~~ .', ., ., ,~~ ... :] - - - - - - - - - - - - - - - - - - - - - - - - - - - -al -E 30 Q)
g 20 o C,.) 10 -a5 0Jt..~::P::~~:=:~:::::::::::!=~~~=1:::::::~--J :::J
W o 5 10 15 20 Bed volumes
I.."... malic -s- tartaric -e- gluconic I Figure 5.2. Capacity of resin
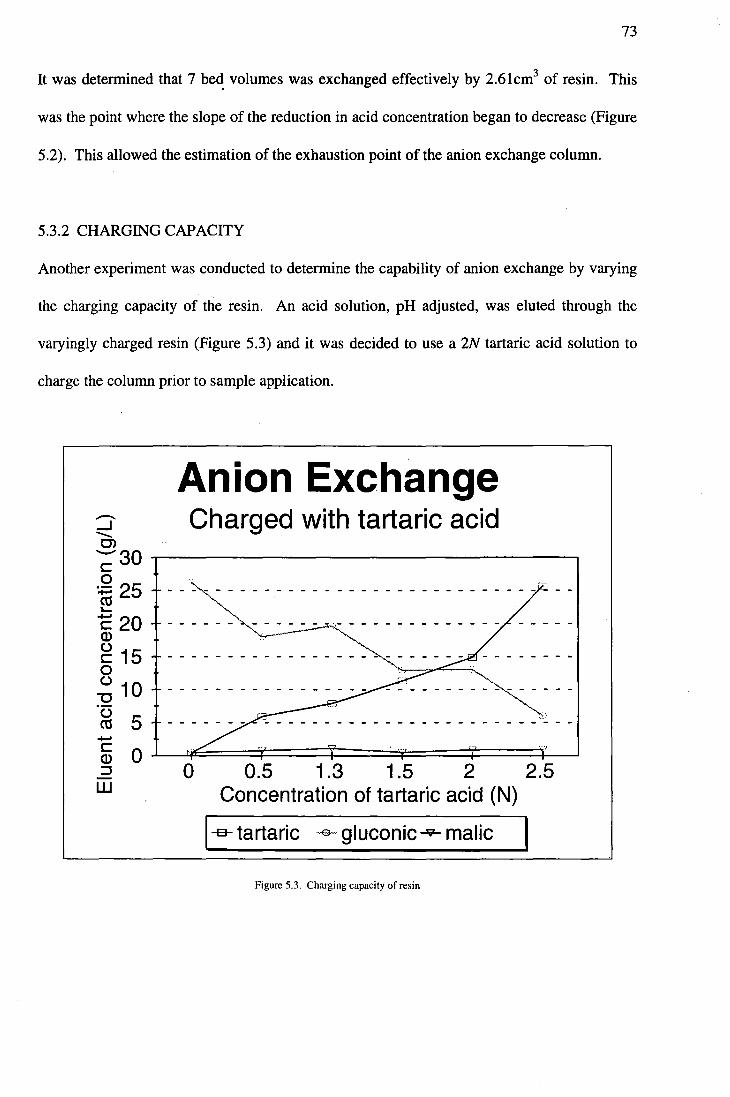
73
It was determined that 7 be~ volumes was exchanged effectively by 2.61cm3 of resin. This
was the point where the slope of the reduction in acid concentration began to decrease (Figure
5.2). This allowed the estimation of the exhaustion point of the anion exchange column.
5.3.2 CHARGING CAPACITY
Another experiment was conducted to determine the capability of anion exchange by varying
the charging capacity of the resin. An acid solution, pH adjusted, was eluted through the
varyingly charged resin (Figure 5.3) and it was decided to use a 2N tartaric acid solution to
charge the column prior to sample application.
---I -.... C)
Anion Exchange Charged with tartaric acid
-- 30 "T"'"--------------------, C o
:+= 25 CO '-'E 20 Q)
g 15 o C,.) 10
"'C 'C,.) CO ..... c Q) :::J W
5 o ' .. ,
o 0.5 1.3 1.5 2 2.5 Concentration of tartaric acid (N)
I-e- tartaric -e- gluconic --9- malic
Figure 5.3. Charging capacity of resin
~(l~ I
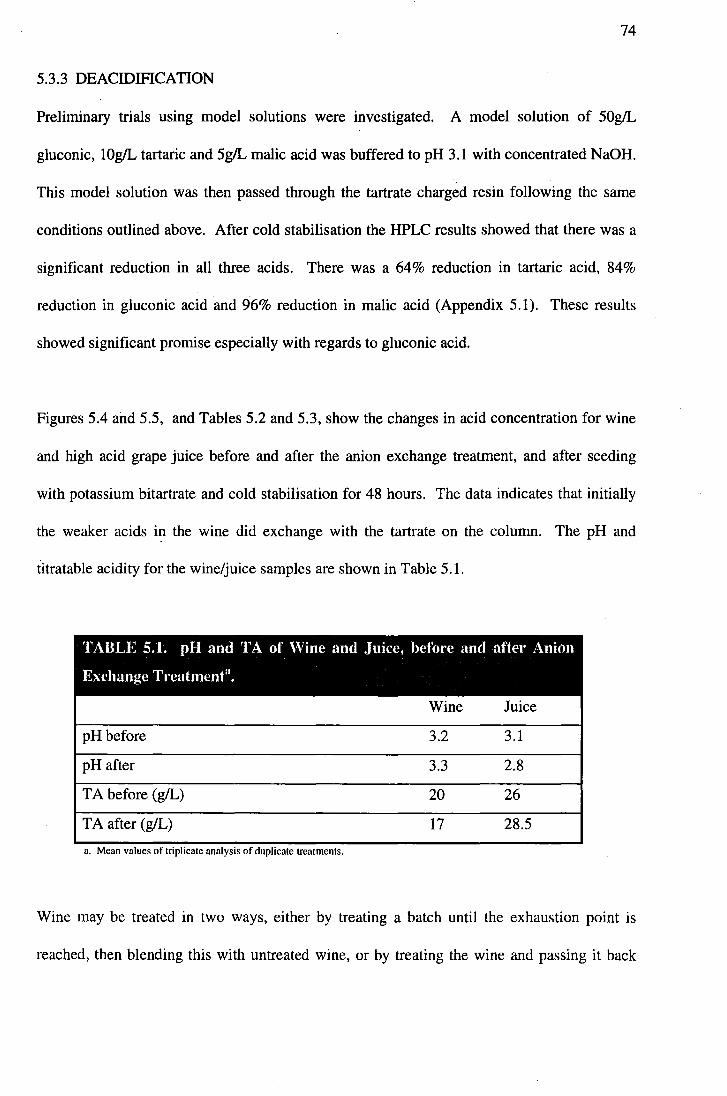
74
5.3.3 DEACIDIFICATION
Preliminary trials using model solutions were investigated. A model solution of 50gIL
gluconic, lOgIL tartaric and 5gIL malic acid was buffered to pH 3.1 with concentrated NaOH.
This model solution was then passed through the tartrate charged resin following the same
conditions outlined above. After cold stabilisation the HPLC results showed that there was a
significant reduction in all three acids. There was a 64% reduction in tartaric acid, 84%
reduction in gluconic acid and 96% reduction in malic acid (Appendix 5.1). These results
showed significant promise especially with regards to gluconic acid.
Figures 5.4 and 5.5, and Tables 5.2 and 5.3, show the changes in acid concentration for wine
and high acid grape juice before and after the anion exchange treatment, and after seeding
with potassium bitartrate and cold stabilisation for 48 hours. The data indicates that initially
the weaker acids in the wine did exchange with the tartrate on the column. The pH and
titratable acidity for the wine/juice samples are shown in Table 5.1.
TABLE 5.1. pH and TA of 'Vine and Juice, before and after Anion
Exchange Treatmene.
Wine Juice
pH before 3.2 3.1
pH after 3.3 2.8
T A before (gIL) 20 26
TA after (gIL) 17 28.5 a. Mean values of tnpllcate analysIs of duplicate treatments.
Wine may be treated in two ways, either by treating a batch until the exhaustion point is
reached, then blending this with untreated wine, or by treating the wine and passing it back
F--:~"':':'':':~';' ;~;~~~~:T;";::~:~
'.-~'~'-. -.- - . -
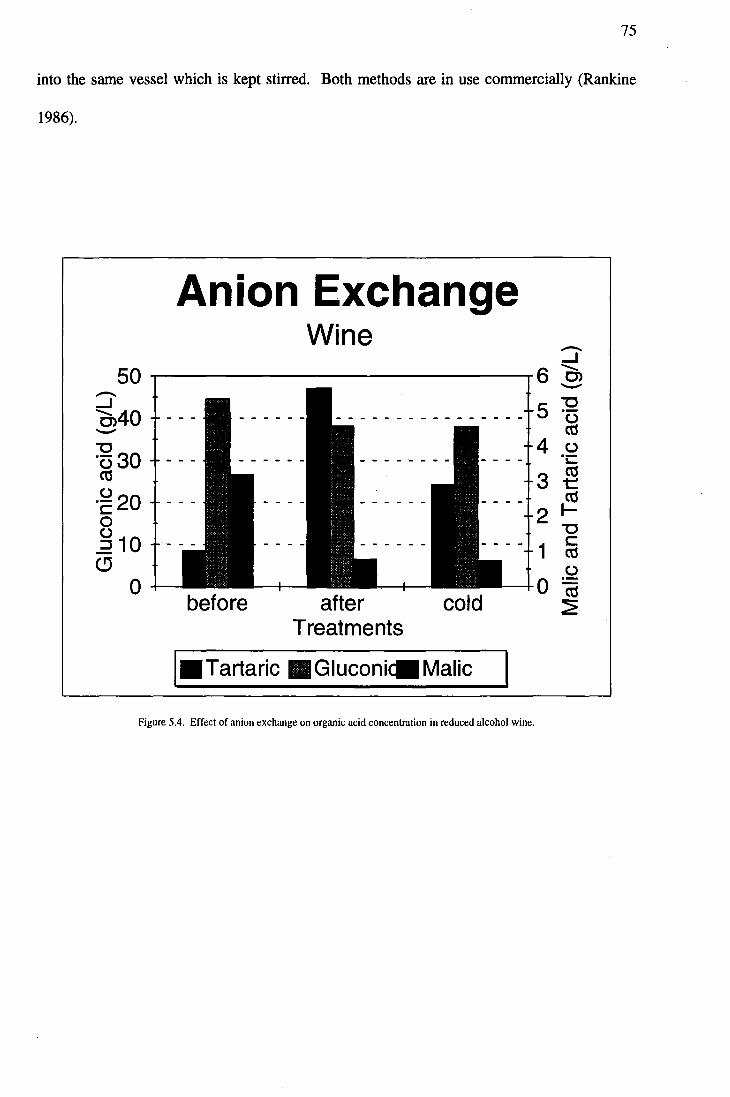
75
into the same vessel which is kept stirred. Both methods are in use commercially (Rankine
1986).
Anion Exchange Wine
50 ~--------------------------~ --.J 0,40 -"0 "030 ctS o "c 20 o
. g 10 (!)
o before after cold
Treatments
'_Tartaric .Gluconi~Malic
Figure 5.4. Effect of anion exchange on organic acid concentration in reduced alcohol wine.
--.J 6 -..
0> -5 "0
0 ctS
4 0 "C
3 ctS t:::: ctS
2 ..... "0
1 c ctS 0
0 ctS ~
~ ....
;;::..~~~
. '.;~-~'~.t-.: .. :.~ ~'.' ; ... :.'~ »~ .. ~~~~!~~
I
~'-> --.'.-
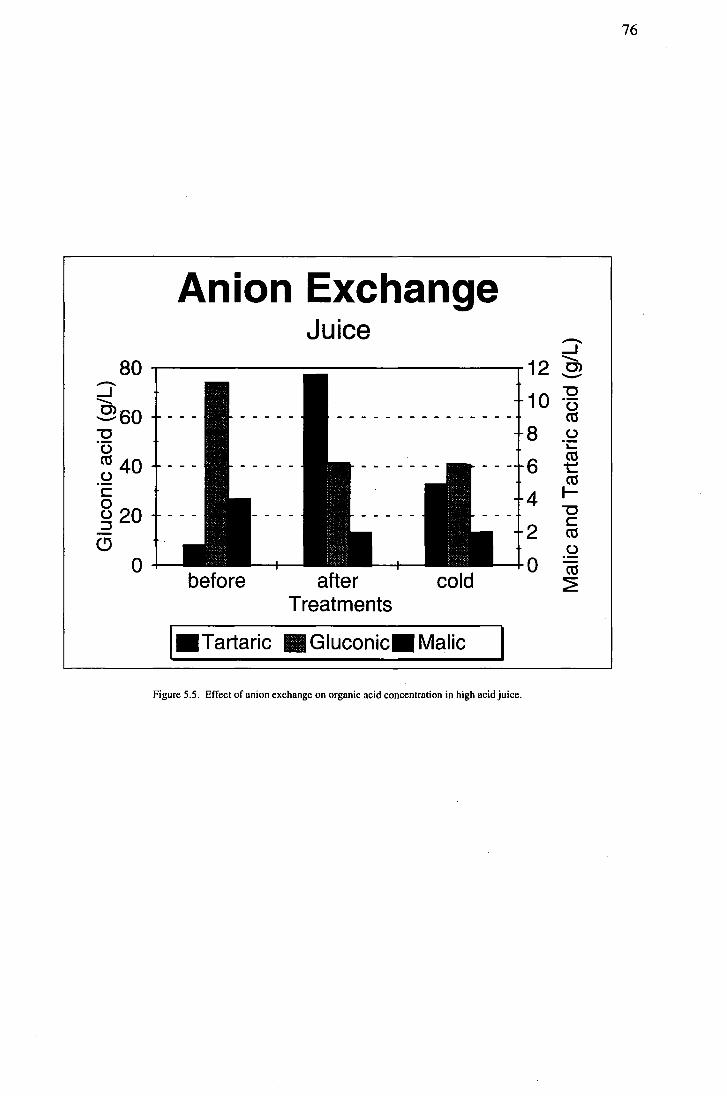
76
An ion Exchange Juice -..
....J 80 12
........ 0') --..
.....J 10 "'0 ........ 0 ~60 ctS "'0 8 0 0 "C
co 40 6 ctS t 0 ctS c:: 4 I-
820 "'0 c:: ::J 2 ctS (!) 0
0 0 ctS before after cold ~ Treatments
I.Tartaric • Gluconic. Malic
Figure 5.5. Effect of anion exchange on organic acid concentration in high acid juice.
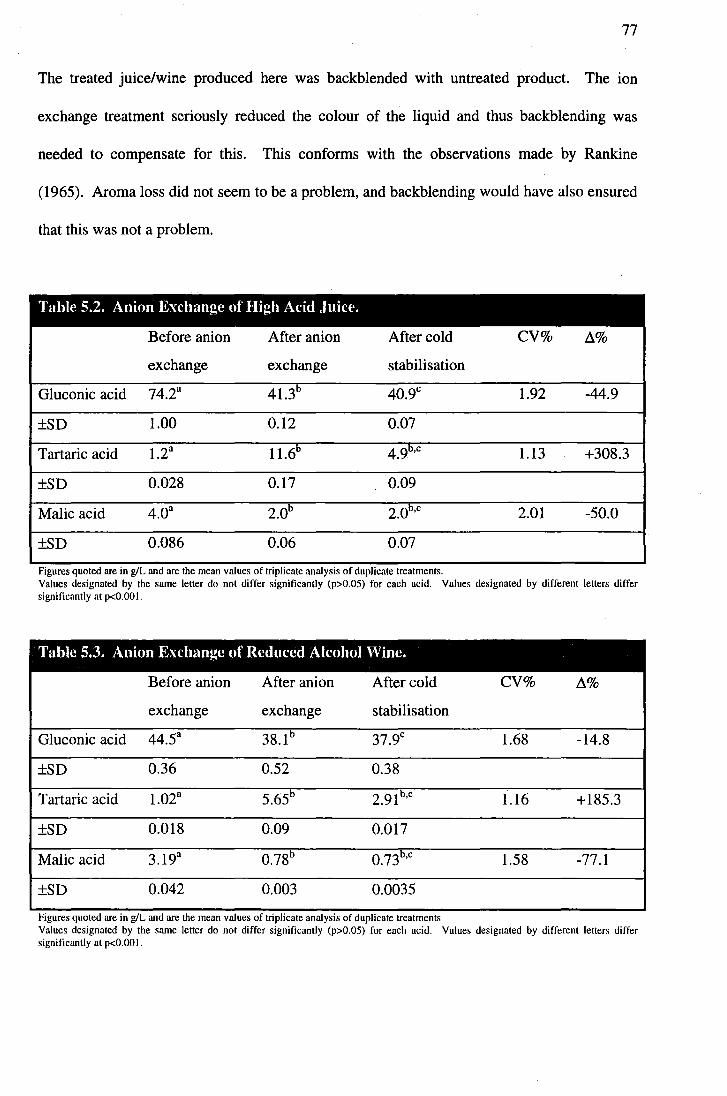
77
The treated juice/wine produced here was backblended with untreated product. The ion
exchange treatment seriously reduced the colour of the liquid and thus backblending was
needed to compensate for this. This conforms with the observations made by Rankine
(1965). Aroma loss did not seem to be a problem, and backblending would have also ensured
that this was not a problem.
Table 5.2. Anion Exchange of High Acid Juice.
Before anion After anion After cold CV% ~%
exchange exchange stabilisation
Gluconic acid 74.2a 41.3b 40.9c 1.92 -44.9
±SD 1.00 0.12 0.07
Tartaric acid 1.2a
11.6b 4.9b,c 1.13 +308.3
±SD 0.028 0.17 0.09
Malic acid 4.0a 2.0b 2.0b,c 2.01 -50.0
±SD 0.086 0.06 0.07
.. FIgures quoted are In giL and are the mean values of tnphcate analysIs of duphcate treatments. Values designated by the same letter do not differ significantly (p>O.05) for each acid. Values designated by different letters differ significantly at p<O.OOI.
Table 5.3. Anion Exchange of Reduced Alcohol Wine.
Before anion After anion After cold CV% ~%
exchange exchange stabilisation
Gluconic acid 44.5a
38.1 b 37.9c 1.68 -14.8
±SD 0.36 0.52 0.38
Tartaric acid 1.02a
5.65b 2.91 b,c 1.16 +185.3
±SD 0.018 0.09 0.017
Malic acid 3.19a
0.78b 0.73b,c 1.58 -77.1
±SD 0.042 0.003 0.0035
.. FIgures quoted are In giL and are the mean values of tnphcate analYSIS of duplicate treatments Values designated by the same letter do not differ significantly (p>O.05) for each acid. Values designated by different letters differ significantly at p<O.OO I.
78
5.4 CONCLUSIONS 1-- -~. -.' • _. _. -. ' r~~:'-':'-;-':''''
~~~~;~~t~~~
It has been demonstrated that the tartrate anion exchange technique can be used for adjusting
acidity of high acid juice and wine. Hypothetically, this procedure could reduce the total
anion concentration of a wine by a factor equivalent to the amount of the total anions .,~ -': :-;."
represented by gluconate, providing potassium does not become the limiting factor during the
precipitation of KHT. This technique could be improved by decreasing this flow rate,
however, this is probably economically unviable. Also, increasing the ratio of resin to
wine/juice may not be practical because a given volume of wine would be exposed to such a
large amount of resin it would be virtually stripped of its character , the achieved reduction in
acid of the liquid would be offset by the loss of colour and aroma. This may be amended by
backblending, but sensory evaluation of the final product would need to be conducted.
The anion exchanged grape juice decreased in gluconic acid concentration from -75g/L to
-40g/L. If this juice was to be fermented, the acid content could drop another 20-30gIL
(Table 4.1). Assuming no inhibitory effects, this concentration level of gluconic acid would
then become well within a palatable level.
The efficiency of the technique depends on the total gluconate concentration and the ratio of t-: :',.::<':.-.-: 1-'·
-<- --.""
gluconate to tartrate in the wine/juice since the ratio of gluconate to tartrate in the wine/juice
determines the extent of exchange of gluconate for tartrate on the column.
Research is needed to identify a functional resin which will not affect the sensory quality of
the wine/juice.
79
CHAPTER 6
OVERALL CONCLUSION
6.1 HIGH PERFORMANCE LIQUID CHROMATOGRAPHY :'-'- -.:~! .. ~-:;::~;~;--
The ion exclusion-partition mode of operation has been shown to be suitable for the
separation of the three organic acids of interest. Due to the amount of gluconic acid present
in the samples, it was necessary to inject as small a volume as possible, to obtain adequate
resolution of the closely eluting gluconic and tartaric acid peaks. No elaborate sample
preparation was required, although long term effects of injecting filtered wine and juice
samples directly onto the column have not been examined. Sample preparation, injection and
chromatography can be completed in 45 minutes. All the organic acids absorbed at 21Onm,
allowing the use of the sensitive variable wavelength UV detector.
The results from the recovery efficiency, linear regression analysis, reproducibility and
column stability show that this HPLC method can quantitatively analyse gluconic as well as
tartaric and malic acids in high acid grape juice and reduced alcohol wine. The results
indicate the potential this HPLC method has for the monitoring of the acidity in wine
products, and to determine whether a deacidification technique has been beneficial to the
juice or wine.
One of the difficulties in the detection of gluconic acid was the development of lactones
during the final stages of this experiment. The two glucono-Iactones do have a sweet acid
80
taste and therefore would need to be quantified with the free acid peak (refer Chapter 1). As
these lactone peaks were not present during the preliminary studies of gluconic acid, they
were not accounted for during the course of this thesis.
6.2 CHEMICAL DEACIDIFICATION
6.2.1 NEUTRALISATION
Of the two chemical agents used CaC03 was found to be more effective than Na2C03 in
model solutions. However with the treatment of high acid juice and reduced alcohol wines,
there was little change in the acid content after treatment with CaC03. With high acid juice,
tartaric acid was reduced by 6%, malic acid by 7% and gluconic acid by a mere 4%. This
trend was replicated with the reduced alcohol wine where tartaric acid was reduced by 6%,
malic acid by 4% and gluconic acid by 4%.
Neutralisation and seeding trials involved a period of cold stabilisation and this was found to
have a real effect on the gluconic acid content. With a shift in equilibrium from the lactone
form to the free gluconic acid form, and the acid content was found to increase over time by
-5.0%. Also observed was the lack of precipitation of gluconate crystals, implying that the
wine and juice samples were not saturated with respect to gluconate. The addition of crystals
would increase the gluconic acid concentration due to the solubility of calcium and sodium
gluconate in high acid juice and reduced alcohol wine.
As reported by McKinnon (1993), Abgueguen et al. (1993), and Clark et al. (1988), Malic
acid is a serious inhibitor of the seeding process and interacts with the calcium. As there was
81
significantly more malic acid than tartaric acid in the wine and juice samples, this affect may
have been very real in the treatment with CaC03 and seed crystals.
6.2.2 SEEDING
Calcium gluconate and sodium gluconate seed crystals were used with CaC03 to induce
crystallisation in high acid juice and reduced alcohol wine. Both these trials were
unsuccessful in achieving significant reduction in any of the organic acids. There are a
number of reasons why this may have been the case:
1. The seed 'crystal and CaC03 mixture was made up to a concentration of 19/L to keep
within a commercial application. However this may not have been adequate enough to
ensure formation of the critical nuclei or perhaps the stable nucleus was formed but there
was not enough calcium or sodium gluconate molecules to induce precipitation.
2. As mentioned before, malic acid has been found to have an inhibitory effect on the
precipitation of calcium tartrate. This would probably apply to calcium gluconate as the
malic acid interacts with the calcium.
The trend of the equilibrium shift from the glucono-Iactones to the free gluconic acid due to
the temperature change in the cold stabilisation process, continued for the seeding trials.
, ~;- ' .. -;::;.;~~~ f,:;·:';<;~:'c<:: ~~~<:
,,:;~.,; -.:.~;;.:.:-.==:.-;~~';'!
'"_'C"_, __ ,"
82
6.3 ANION EXCHANGE
Of all the deacidification techniques employed, anion exchange appeared to have the most
potential. With model solutions, tartaric acid was reduced by 84%, malic acid by 94%, and
gluconic acid by 98%.
With reduced alcohol wine gluconic acid was decreased by 15%, and malic acid, by 77%. In
contrast tartaric acid increased by 185% from l.02gIL to 2.91glL, which is still well within
acceptable tartaric acid content levels. The anion exchanged grape juice decreased in
gluconic acid content from -75glL to -40glL. If this juice was to be further fermented, the
acid content could drop another 20-30glL as seen in Table 4.1, and the concentration of
gluconic acid could then become well within a palatable level.
However one drawback of this deacidification method is the effect the resin matrix of the
anion exchange column has on the composition of the grape juice or wine. In this
experiment, the resin seriously affected the colour of the liquid. On a commercial scale, and
as long as the wine was not of high quality, then backblending with untreated wine could
compensate for this.
83
6.4 FURTHER RESEARCH
Research into the deacidification of gluconic acid in high acid grape juice and reduced
alcohol wines could focus more on anion exchange technology.
Another procedure used for the adjustment of acidity is the addition of sugar or sweet reserve.
This method does not alter the acidity, but creates a more harmonious relationship between
the high acid and sugar already present, therefore producing a more palatable wine. However
there are some limitations with this method; firstly there could be no dry-style wine produced
by this method. Also there is the risk of refermentation if the wine has not been membrane
filtered adequately enough to remove all the yeast cells.
In conclusion, this technology used for the production of reduced alcohol wine through the
enzymatic conversion of glucose to gluconic acid can only have market potential if the final
product is palatable and retains all the characters found in standard wine. At present this
technology produces a reduced alcohol wine of -8% alc.(v/v) while retaining aromatic and
colour components of the varietal. However, the excess acidity makes the wine unpalatable,
therefore more research is needed in the reduction or masking of this acid, for any hope of the
commercial production of this reduced alcohol wine.
84
ACKNOWLEDGMENTS
I wish to express my gratitude to my supervisor, Dr. David Heatherbell, for his guidance and
support throughout the course of this thesis.
Sincere appreciation is extended to my associate supervisor, Dr. Maurice Barnes, for his
valued suggestions, and in particular, his advice and direction with regard to ion exchange
technology.
I would like to express my sincere thanks to my colleague, Mr. Gary Pickering. His immense
patience and constant inspiration enabled me to complete this thesis.
85
REFERENCES
ABGUEGUEN,O; BOULTON,R (1993): The Crystallization Kinetics of Calcium Tartrate From Model Solutions and Wines. American Journal of Enology and Viticulture 44,65-75.
AMERINE,MA (ED.) (1980): Technology of Winema king. 4th ed. AVI Publishing Company Inc, Westport, Connecticut.
AMERINE,MA; OUGH,CS (EDS.) (1980): Methods for Analysis of Musts and Wines. John Wiley & Sons Inc., New York, 11-44.
AMERINE,MA; ROESSLER,EB; OUGH,CS (1965): Acids and the Acid Taste. I. The Effect of pH and Titratable Acidity. American Journal of Enology and Viticulture 16,29-37.
AOAC OFFICIAL METHODS OF ANALYSIS (ED.) (1990): 986.13 Quinic, Malic and Citric Acids in Cranberry Juice Cocktail and Apple Juice., .
BARNES,M (1993): Acidity Control. Wine Science II Course Notes. Lincoln University. (N)
BDH (Ed.) (1977): Ion Exchange Resins. 5th ed. BDH Chemicals Ltd, Poole, England.
BEELMAN,RB; GALLANDER,JF (1979): Wine Deacidification. In: Advances in Food Research. Vol. 25. (Ed: Chichester,CO) Academic Press, New York, 1-53.
BENNET,MJ; BRADEY,CE (1984): Simpler Liquid Chromatographic Screening for Organic Acid Disorders. Clinical Chemistry 30, 542-546.
86
BERG,HW; KEEFER,RM (1958): Analytical Detennination of Tartrate Stability in Wine. 1. Potassium Bitartrate. American Journal 0/ Enology and Viticulture 9, 180-193.
BHANDARI,VM; JUVEKAR,VA; PATWARDHAN,SR (1992): Sorption Studies on Ion Exchange Resins. 2. Sorption of Weak Acids on Weak Base Resins. Industrial Engineering Chemical Research 31, 1073-1080.
BIORAD (ED.) (1988): Guide to Aminex HPLC Columns/or Food and Beverage Analysis. BioRad Chemical Division, Richmond, California.
BISSELL,P; EWART,A; SANGTIPPA WAN,W (1989): Loading Concentrations for Tartaric and Malic Acid for Single Column HPLC Organic Acid Analysis. American Journal o/Enology and Viticulture 40,316-319.
BLAKE,JD; CLARKE,ML; RICHARDS,GN (1984): Detennination ofDGluconic, 5-Keto-D-Gluconic, 2-Keto-D-Gluconic and 2,5-Diketo-D-Gluconic Acids by High Performance Liquid Chromatography. Journal o/Chromatography 312,211-219.
BONODERN,WR; NAGEL,CW; POWERS,JR (1986): The Adjustment of High pHIHigh Titratable Acidity Wines by Ion Exchange. American Journal 0/ Enology and Viticulture 37, 143-148.
BOULTON,R (1984): Acidity Modification and Stabilization. The International Symposium on Cool Climate Viticulture and Enology, 482-495.
BRADY,JE; HUMISTON,GE (EDS.) (1986): General Chemistry: Principles and Structure. John Wiley & Sons Inc., New York.
CACCAMO,F; CARFAGNINI,G; DI CORCIA,A; SAMPERI,R (1986): Improved High Performance Liquid Chromatographic Assay for Determining Organic Acids in Wines. Journal o/Chromatography 362, 47-53.
87
CLARK,JP; FUGELSANG,KC; GUMP,BH (1988): Factors Affecting Induced Calcium Tartrate Precipitation from Wine. American Journal of Enology and Viticulture 39, 155-160.
COUTURE,R; ROUSEFF,R (1992): Debittering and Deacidifying Sour Orange (Citrus aurantium) Juice Using Neutral and Anion Exchange Resins. Journal of Food Science 57, 380-384.
DE SOTO,RT; YAMADA,H (1963): Relationship of Solubility Products to Long Range Tartrate Stability. American Journal of Enology and Viticulture 14,43-51.
DICKINSON,BN; STONEMAN,GF (1958): Stabilisation of Wines by Ion Exchange. Wines and Vines 39, 33-35.
DIRKX,JMH; VERHAAR,LA (1977): Ion Exchange Chromatography of the Main Reaction Products of the Catalytic Oxidation of D-Glucose and D- Gluconic Acid. Carbohydrate Research 59, 287-292.
DUNSFORD;P; BOULTON,R (1981): The Kinetics of Potassium Bitartrate Crystallization From Table Wines. II. Effect of Temperature and Cultivar. American Journal of Enology and Viticulture 32, 106-110.
DUNSFORD,P; BOULTON,R (1981): The Kinetics of Potassium Bitartrate Crystallization from Table Wines. I. Effect of Particle Size, Particle Surface Area and Agitation. American Journal of Enology and Viticulture 32, 100-105.
ELVERS,B (ED.) (1989): Ullmann's Encyclopedia of Industrial Chemistry. 5th ed. VCH Publishers Ltd, Cambridge, Great Britain, 449-455.
EV ANS,ME (1983): High Performance Liquid Chromatography in Oenology. Journal of Liquid Chromatography 6,153-178.
FOWLES,GWA (1992): Acids in Grapes and Wines: A Review. Journal of Wine Research 3, 25-41.
FRA YNE,RF (1986): Direct Analysis of the Major Organic Components in Grape Must and Wine Using High Performance Liquid Chromatography. American Journal of Enology and Viticulture 37, 281-287.
GALLANOER,JF (1977): Deacidification of Eastern Table Wines with Schizosaccharomyces Pombe. American Journal of Enology and Viticulture 28, 65-67.
GARCIA-RUIZ,JM; ALCANTARA,R; MARTIN,J (1991): Evaluation of
88
Wine Stability to Potassium Hydrogen Tartrate Precipitation. American Journal of Enology and Viticulture 42, 336-340.
GUMP ,BH; KUPINA,SA (1979): Analysis of Gluconic Acid in Botrytised Wines. Liquid Chromatographic Analysis of Food and Beverages 2,331-351.
HAWLEY,GG (ED.) (1981): The Condensed Chemical Dictionary. 3rd ed. Van Nostrand Reinhold Company, New York.
HENNIGER,G; MASCARO,L (1985): Enzymatic-Ultraviolet Determination of Glucose and Fructose in Wine: Collaborative Study. J. Assoc. Offic. Agric. Chemists 68, 1021-1024.
HERESZTYN (1987): Conversion of Glucose to Gluconic Acid by Glucose Oxidase Enzyme in Muscat Gordo Juice. The Australian Grapegrower and Winemaker April,25-27.
HICKS,KB; LIM,PC; HAAS,MJ (1985): Analysis ofUronic and Aldonic Acids, their Lactones, and Related Compounds by High Performance Liquid Chromatography on Cation-Exchange Resins. Journal o/Chromatography 319, 159-171.
HUNTER,JJ; VISSER,JH; DE VILLIERS,OT (1991): Preparation of Grapes and Extraction of Sugars and Organic Acids for Determination by High Performance Liquid Chromatography. American Journal of Enology and Viticulture 42, 237-244.
ILAND,PG (1987): Interpretation of Acidity Parameters in Grapes and Wine. The Australian Grapegrower and Winemaker, 81-85.
JACKSON,D; SCHUSTER,D (EDS.) (1981): The Production of Grapes and Wine in Cool Climates. Butterworths Horticultural Books, Wellington, New Zealand.
KEESEY,J (ED.) (1991): Biochemica Information (Glucose Oxidase). 1st ed. Boehringer Mannheim Biochemicals, Indianapolis.
89
KLUBA,RM; BEELMAN,RB (1975): Influence of Amelioration on the Major Acid Components of Must and Wines from Four French-Hybrid Grape Cultivars. American Journal of Enology and Viticulture 26, 18-24.
LINDSAY,S (1992): High Performance Liquid Chromatography. 2nd ed. John Wiley & Sons, New York.
MAGYAR,I; PANYIK,I (1989): Biological Deacidification of Wine with Schizosaccharomyces Pombe Entrapped in Ca-Alginate Gel. American Journal of Enology and Viticulture 40, 233-239.
MAXA,E; BRANDES,W; DANIEL,R (1991): Modified HPLC-Method for Routine Quantification of Major Orgainc Acids in Wine, Must and Fruit Juices. Mitteilungen Klosterneuburg 41,233-237.
McCLOSKEY,LP (1974): Gluconic Acid in California Wines. American Journal of Enology and Viticulture 25, 198-201.
90
McCORD,JD; TROUSDALE,E; RYU,DDY (1984): An Improved Sample Preparation Procedure for the Analysis of Major Organic Components in Grape Must and Wine by High Performance Liquid Chromatography. American Journal of Enology and Viticulture 35, 28-29.
McKINNON,AJ; SCOLLARY,GR; SOLOMON,DH; WILLIAMS,PJ (1992): Factors Affecting Calcium Tartrate Precipitation. Proceedings of the Eighth Australian Wine Industry Technical Confert;nce, 173-176.
McKINNON,T (1993): Some Aspects of Calcium Tartrate Precipitation. The Australian Grapegrower and Winemaker 352, 89-91.
McLEOD,R; OUGH,CS (1970): Some Recent Studies with Glucose Oxidase in Wine. American Journal of Enology and Viticulture 21, 54-60.
MENT ASTI,E; GENNARO,MC; SARZANINI,C; BAIOCCHI,C; SA VIGLIANO,M (1985): Derivatization, Identification and Separation of Carboxylic Acids in Wines and Beverages by High Performance Liquid Chromatography. Journal of Chromatography 322,177-189.
MOSER,J (1956): The Ion Exchanger in Modern Cellar Practice. American Journal of Enology and Viticulture 7, 157-161.
MOUTOUNET,M; ESCUDIER,JL (1991): Tartaric Stabilisation of Wines and Electrodialysis: New Prospects. The Australian Grapegrower and Winemaker, 19-21.
MUNYON,JR; NAGEL,CW (1977): Comparison of Methods of Deacidification of Musts and Wines. American Journal of Enology and Viticulture 28, 79-87.
NAGEL,CW; AMISTOSO,JL; BENDEL,RB (1982): The Effect of pH and Titratable Acidity on the Quality of Dry White Wines. American Journal of Enology and Viticulture 33, 75-79.
91
NAGEL,CW; JOHNSON,TL; CARTER,GH (1975): Investigation of Methods for Adjustingthe Acidity of Wines. American Journal of Enology and Viticulture 26, 12-13.
NAGEL,CW; McELV AIN,KR (1977): An Analysis of the Influence of pH and Titratable Acid in the Scoring of Wine. American Journal of Enology and Viticulture 28, 69-73.
OUGH,CS (1975): Further Investigations with Glucose Oxidase-Catalase Enzyme Systems For Use With Wine. American Journal of Enology and Viticulture 26, 30-36.
PALMER,JK; LIST,DM (1973): Determination of Organic Acids in Foods by Liquid Chromatography. Journal of Agricultural Food Chemistry 21,903-906.
PECINA,R; BONN,G; BURTSCHER,E; BOBLETER,O (1984): High Performance Liquid Chromatographic Elution Behaviour of Alcohols, Aldehydes, Ketones, Organic acids and Carbohydrates on a Strong Cation-Exchange Stationary Phase. Journal of Chromatography 287, 245-258.
PERCIV AL,RW; McGARVEY,FX; SONNEMAN,HO (1958): Wine Stabilization by Columnar Ion Exchange. J. Assoc. Offic. Agric. Chemists 38, 144-151.
PICKERING,G; HEATHERBELL,D; BARNES,M (1993): A New Technology for the Production of Reduced Alcohol Wine. In: NZ Society Viticulture and Oenology Proceedings of the New Zealand Grape and Wine Symposium: New Zealand Society of Viticulture and Oenology, Auckland.
PILONE,BF; BERG,HW (1964): Some Factors Affecting Tartrate Stability in Wine. American Journal of Enology and Viticulture, 195-210.
PILONE,GJ (ED.) (1993): Wine Microbiology: Wine Science II. Lincoln University, Lincoln.
RAJAKYLA,E (1981): Separation and Determination of Some Organic Acids and their Sodium Salts by High Performance Liquid Chromatography. Journal of Chromatography 218, 695-701.
92
RANKINE,B (1985): Using Ion Exchange for Prevention of Tartrate Precipitation in Wine. The Australian Grapegrower and Winemaker, November, 18-21.
RANKINE,BC(1986): Using Ion-Exchange to Alter Acidity. The Australian Grapeg rower and Winemaker, 9-11.
RANKINE,BC (ED.) (1991): Making Good Wine. Pan Macmillan Publishers, Australia.
RANKINE,BC (1965): Ion Exchange Treatment of Wine. Australian Wine, Brewing and Spirit Review, 56-62.
RODRIGUEZ-CLEMENTE,R; CORREA-GOROSPE,I (1988): Structural, Morphological and Kinetic Aspects of Potassium Hydrogen Tartrate Precipitation from Wihes and Ethanolic Solutions. American Journal of Enology and Viticulture 39,169-179.
RODRIGUEZ-CLEMENTE,R; CORREA-GOROSPE,I; DE CASTRO,JJ (1990): A New Method for the Stabilization of Wines with Respect to the Potassium Bitartrate Precipitation. American Journal of Enology and Viticulture 41, 16-20.
ROSS,L; CHAPITAL,D (1987): Simultaneous Determination of Carbohydrate and Products of Carbohydrate Metabolism in Fermentation Mixtures by HPLC. Journal of Chromatography 25, 112-117.
SCHNEIDER,A; GERBI,V; REDOGLIA,M (1987): A Rapid HPLC Method for Separation and Determination of Major Organic Acids in Grape Musts and Wines. American Journal of Enology and Viticulture 38,151-155.
SCHW ARZENBACH,R (1982): High Performance Liquid Chromatography of Carboxylic Acids. Journal of Chromatography 251, 339-358.
SCOLLARY,G (1987): Free and Bound Calcium Content in Wine: Possible monitoring of Protein Haze Formation. The Australian Grapegrower and Winemaker, 25-26.
SCOLLARY,G (1990): Some Aspects of Calcium Chemistry in Wine. The Australian Grapegrower and Winemaker, 316, 30-31.
SEIOELL,A; LINKE,WF; FRANCIS,AW; BATES,RG (EOS.) (1949): Solubilities of Inorganic and Organic Compounds. 3rd ed. Van Nostrand Co., New York, 672.
SEPULVEOA,G; KLIEWER,WM (1986): Effect of High Temperature on Grapevines (Vitis vinifera L.). II. Distribution of Soluble Solids. American Journal of Enology and Viticulture 37, 20-25.
SKOOG,OA (ED.) (1985): An Introduction to Chromatographic Separations. In: Principles of Instrumental Analysis. 3rd ed. Saunders College Publishing, Orlando, Florida, 727-751.
SOLOMONS,TW (ED.) (1988): Organic Chemistry. 4th ed. John Wiley & Sons Inc, New York.
93
SOLVAY ENZYMES (1992): A Glucose Oxidase and Catalase Enzyme System. In: Solvay Enzymes.
SPANOS,GA; WROLSTAD,RE (1987): Anthocyanin Pigment, Nonvolatile Acid, and Sugar Composition of Red Raspberry Juice. J. Assoc. Offic. Agric. Chemists 70, 1036-1046.
I . . I ., -:-~-_-.- -_-':-.'
~~:::j;:,;~~~~;
I
STEELE,JT; KUNKEE,RE (1978): Deacidification of Musts from the Western United States by the Calcium Double-Salt Precipitation Process. American Journal of Enology and Viticulture 29, 153-160.
94
STEELE,JT; KUNKEE,RE (1979): Deacidification of High Acid Californian Wines by Calcium Double-Salt Precipitation. American Journal of Enology and Viticulture 30, 227-230.
TAKEDA,F; SAUNDERS,MS; SAUNDERS,JA (1983): Physical and Chemical Changes in Muscadine Grapes During Postharvest Storage. American Journal of Enology and Viticulture 34, 180-185.
TUSSEAU,D; BENOIT,C (1987): Routine High Performance Liquid Chromatographic Determination of Carboxylic Acids in Wines and Champagne. Journal of Chromatography 395, 323-333.
VILLETTAZ,JC (1986): A New Method for the Production of Low Alcohol Wines and Better Balanced Wines. Proceedings of the Sixth Australian Wine Industry Technical Conference, 125-128.
WINDHOLZ,M; BUDAVARI,S; STROUMTSOS,LY; FERTIG,MN (EDS.) (1976): The Merck Index. 9th ed. Merck & Co. Inc., Rahway, New Jersey.
WROLSTAD,RE; CULBERSTON,JD; NAGAKI,DA; MADERO,CF (1980): Sugars and Nonvolatile Acids of Blackberries. Journal of Agricultural Food Chemistry 28, 553-558.
WROLSTAD,RE; SPANOS,GA (1987): Anthocyanin Pigment, Nonvolatile Acid, and Sugar Composition of Red Raspberry Juice. Journal of Associatation of Official Analytical Chemistry 70, 1036-1046.
ZOECKLEIN,BW; FUGELSANG,KC; GUMP,BH; NURY,FS (EDS.) (1990): Production Wine Analysis. Chapman & Hall, New York, 26-59.
ZUBECKIS,E (1958): Deacidification of Wine by Ion Exchange. Ontario Horticultural Experiment Station and Products Laboratory, 88-89.
ZUBECKIS,E (1962): Studies on Wine Treatment with Ion Exchange Resins. Ontario Horticultural Experiment Station and Products Laboratory, 117-119.
95
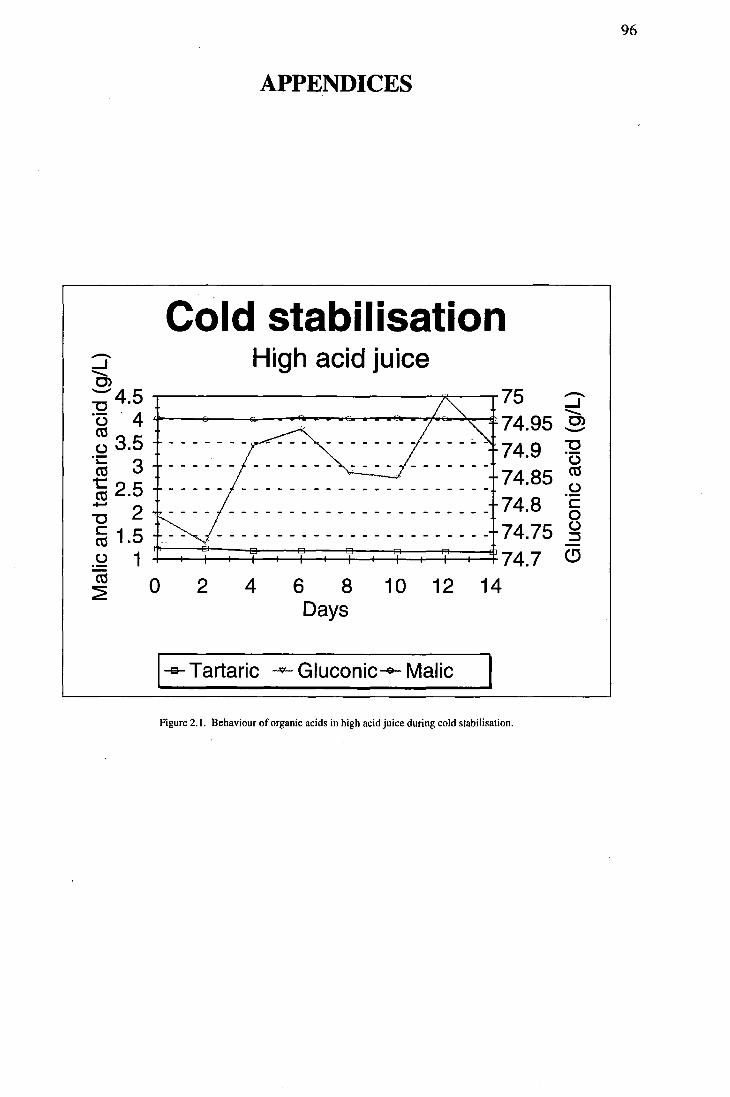
-.-J ......... 0>
APPENDICES
Cold stabilisation High acid juice
:; 4.5 ~----------""",,*"""--r75 ::J 'u . 4 . 74.95 ~ co .u 3.5 7 4.9 ~ Cts 3 '"' ~ _ _ _ _ _ _ ____________________ 74.l35 ~ Cts 2.5 .; 2 - - - - - - - - - - - - - - - - - - - - - - - - - - 74.l3 § ~ 1.5 - - - - - - - - - - -~ - - - - - - - - - - - 74.75 g u 1 74.7 (!)
~ 0 2 4 6 l3 10 12 14 Days
I-e- Tartaric ~ Gluconic-e- Malic
Figure 2.1. Behaviour of organic acids in high acid juice during cold stabilisation.
96
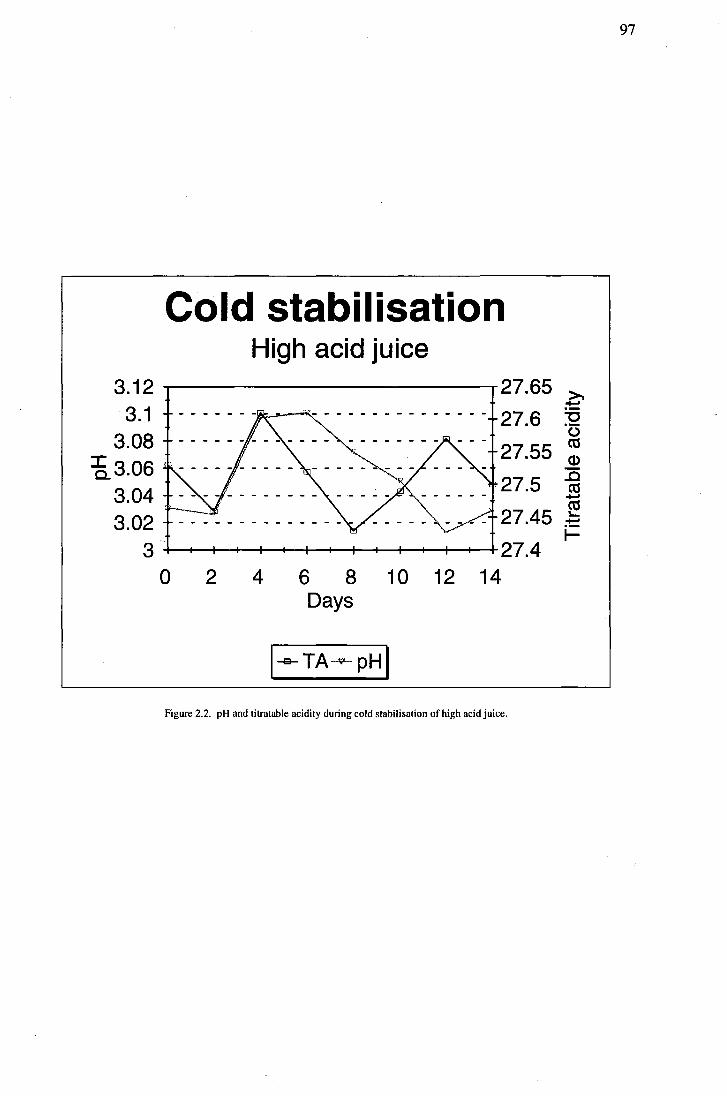
3.12 3.1
3.08 =E.3.06
3.04 3.02
3
Cold stabilisation High acid juice
.,----------------r27.65 >. .:t::::
27.6 ~ co 27.55 Q)
27.5 ~ +-' co
27.45 ~ ~
+--~---+--+--+-_+__-+--t___I__+--+-_+_-+-+ 27.4 0 2 4 6 8
Days 10 12 14
Figure 2.2. pH and titratable acidity during cold stabilisation of high acid juice.
97
I ' ',- .' r;' ',.
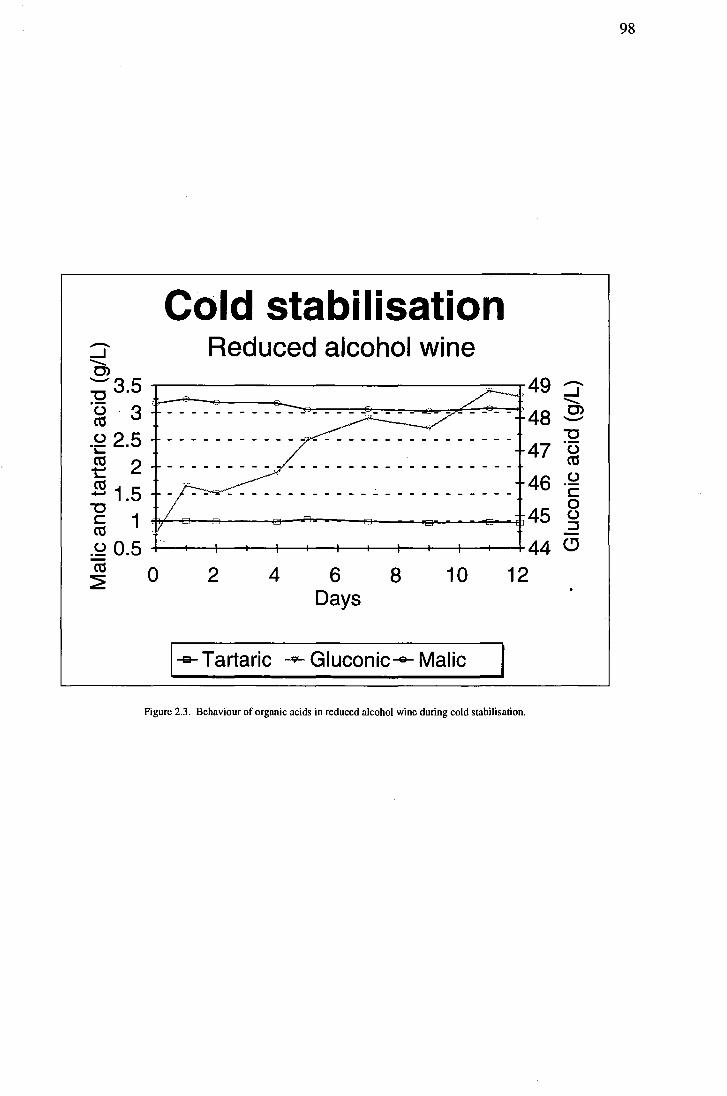
Cold stabilisation -....J Reduced alcohol wine -... C> :; 3.5 ...--------------.."",....--.49 ::J -... .~ , 3 48 .g .~ 2.5 47 ~ $ 2 --------- ------------------- ct3 10... 46 0 $1.5 c ~ 45 8 ffi 1 ~ .0 0.5 44 (!J ct3 0 ~ 2 4 6 8
Days 10
1-8- Tartaric -9- Gluconic--9- Malic
12
Figure 2,3, Behaviour of organic acids in reduced alcohol wine during cold stabilisation,
98
i,. "_ .,_
i ! .
! ,. .~. 1---

99
~i'I;% ~~j~~~%~
Cold stabilisation Reduced alcohol wine
3.3 r--====;;Ir-------~ 19.9 ~ 3.28 19.8 ~
I 3.26 19.7 ~ 0. 19.6 .c
3.24 ~...---'T". 19.5 ~ 3.22 19.4 ~
3.2·· 19.3 o 2 4 6 8 10 12
Days
Figure 2.4. pH and titratable acidity during cold stabilisation of reduced alcohol wine.
,.
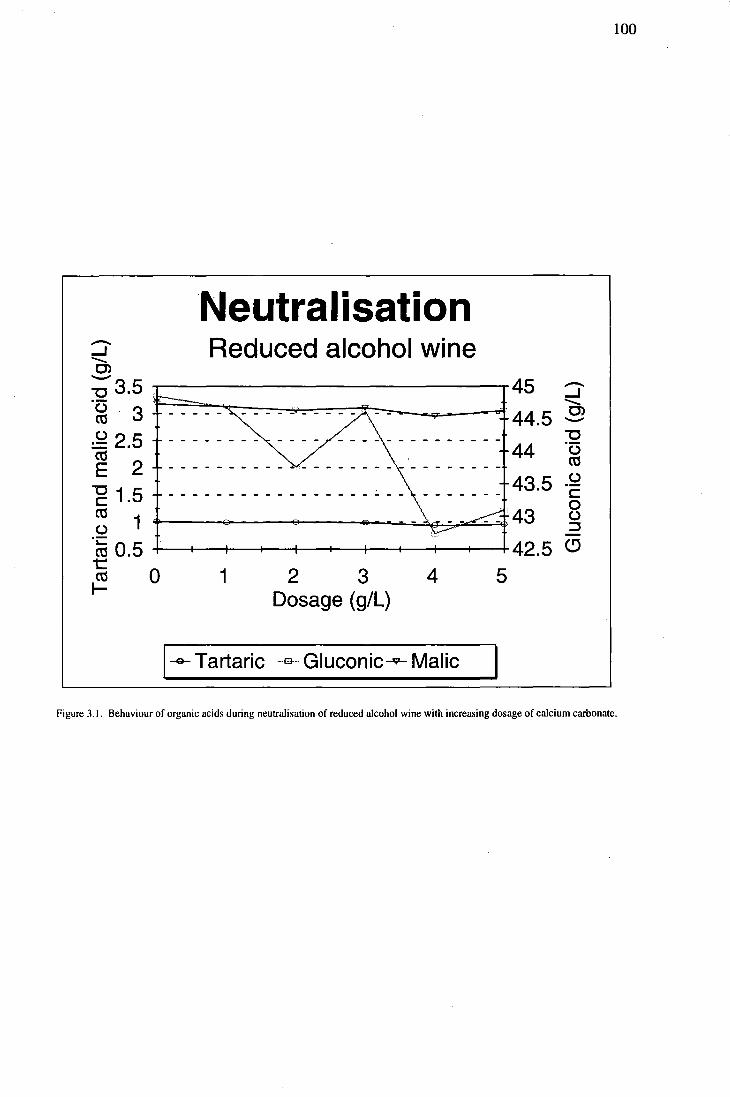
Neutral isation Reduced alcohol wine -....J -..
0') --"0 3.5 ~--------------------------~ 45 .~ . 3 - 44.5 .u 2.5 ~ 2 -g 1.5 ctS 1 u
-------
.~ 0.5 +-~-----~-----+--4-----~-----~-+-----~-----~-+ ~ 0 I-
123 Dosage (gIL)
4
I-e- Tartaric -8-- Gluconic~ Malic
5
44 43.5 43 42.5
100
-....J -.. 0') --"0 u ctS u c:: 0 u ::::l
(!J
Figure 3.1. Behaviour of organic acids during neutralisation of reduced alcohol wine with increasing dosage of calcium carbonate.
.::;;:.:.:.::.:-~,~.:
.~.-'.-.. ,-~~
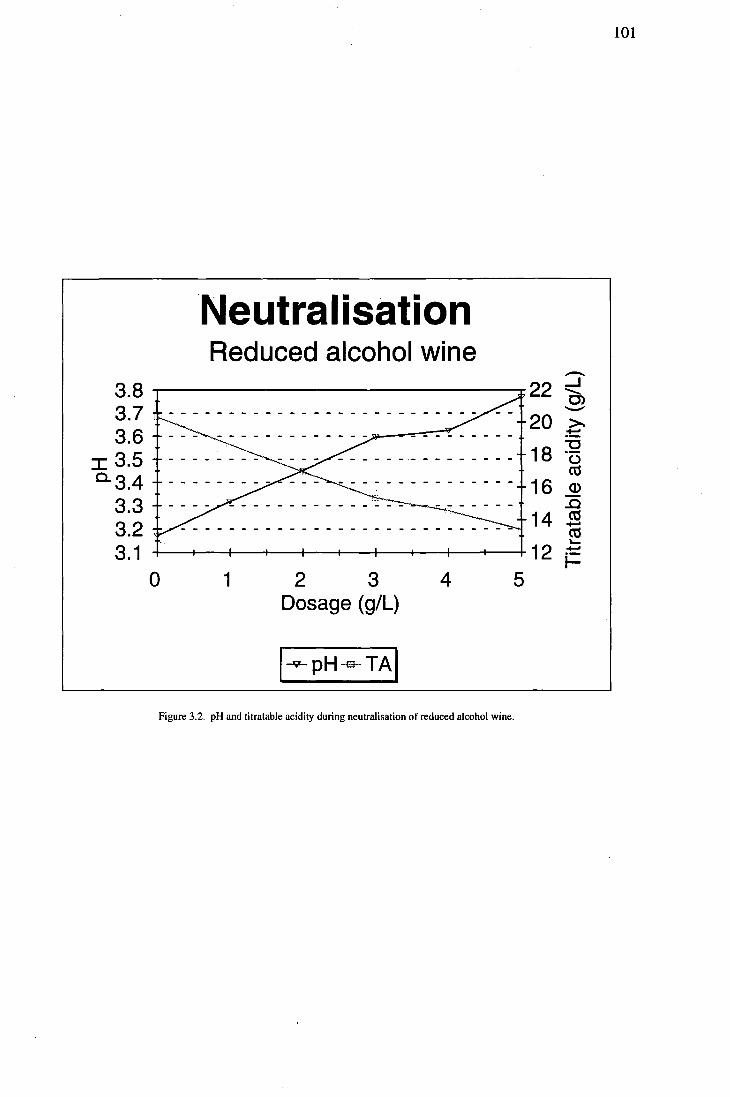
Neutral isation Reduced alcohol wine
3.8 ..,..-----------------r 3.7 ( 3.6
:r: 3.5 0.3.4
3.3 3.2 3.1
o 1
- - - - - - - - -
2 3 4 5 Dosage (giL)
Figure 3.2. pH and titratable acidity during neutralisation of reduced alcohol wine.
101
-22 ....J .......... 0> ---20 >-.~
18 "'C u co
16 Q) .0
14 co +-' co ~
12 +-'
i-
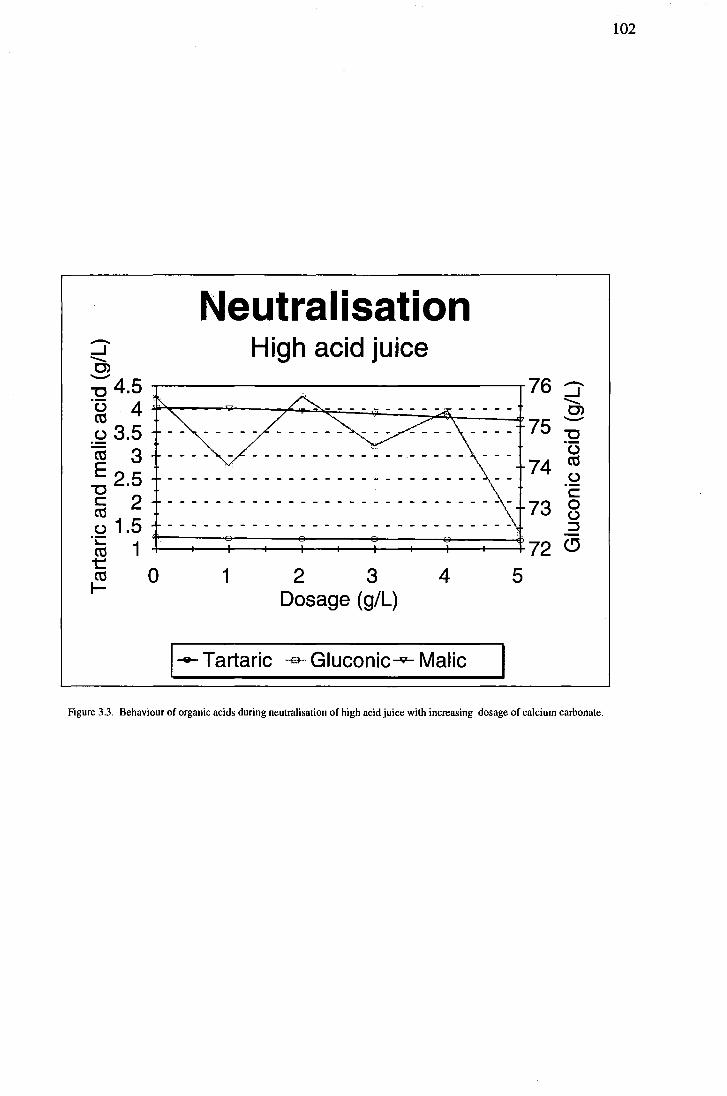
-..J ......... 0>
Neutral isation High acid juice
.......... "0 4.5 :::J ~--------------------------~76
. ~ 4 t' ~--'"---:r~~-=-=-..;;L....:..-=-:....;,.:~~:....:.-::l ~ u 3.5 - - - - 75 "0
ctj 3 - - - - - - - - - - - - -.- - - - - u .; 2.5 _ _ _ _ _ _ _ _ _ _ _ _ _ _ _ _ _ _ _ _ _ _ _ _ _ _ 74 ~ a3 2 - - - - - - - - - - - - - - - - - - - - - - - - - - - - - 73 8 u 1.5 - - - - - - - - - - - - - - - - - - - - - - - - - - - - - ::J
1 ~~~--~-+--~~~--+--+--+72 ~ o 1 2 3 4 5
Dosage (gIL)
I-e- Tartaric -a- Gluconic~ Malic
Figure 3.3. Behaviour of organic acids during neutralisation of high acid juice with increasing dosage of calcium carbonate.
102
f······,···",······
':':-'··~:-"'~;:--~p~7..:.· ..:.-E~ __ ,.:""-:--'_",,.--'
I
i"·--
~:~~§ffH~:~
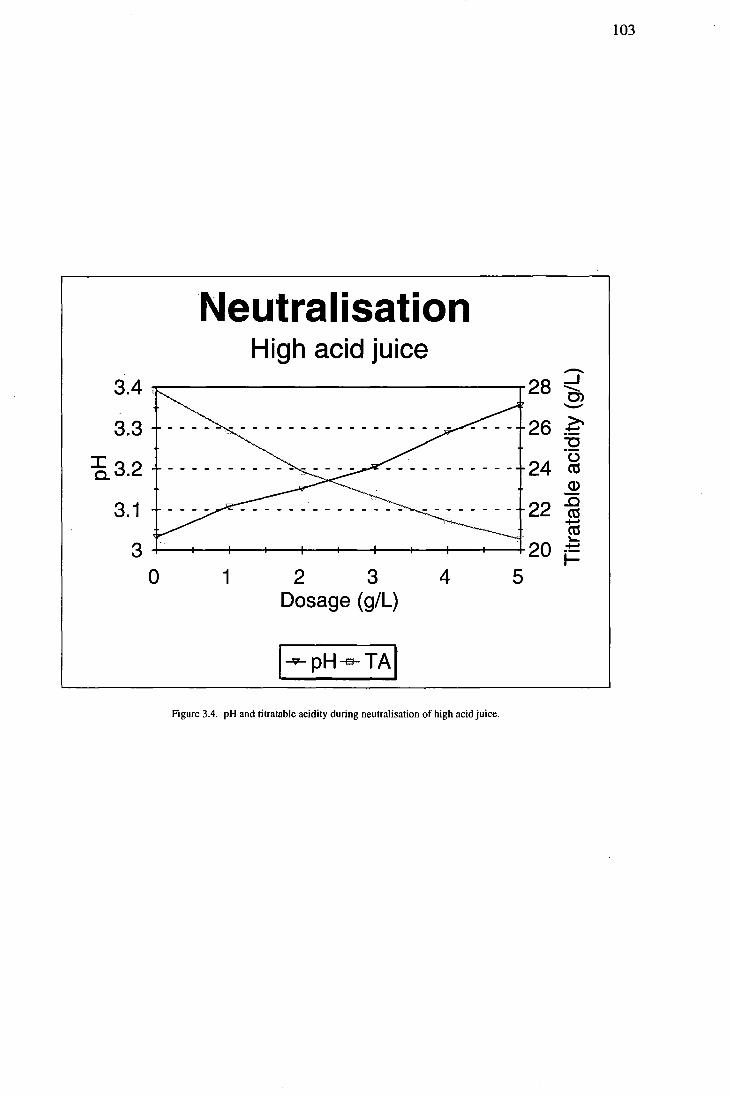
103
Neutral isation High acid juice -3.4 ' 28 ..J ..........
0> -3.3 26 ~ .~
:0 :a3.2 24 u as
Q)
3.1 22 .c as +-' as
. 20 10...
3 +-'
i-0 1 2 3 4 5
Dosage (gIL) ;-~<-'~<~~"'::'-;
I~ pH-e- TAl Figure 3.4. pH and titratable acidity during neutralisation of high acid juice.
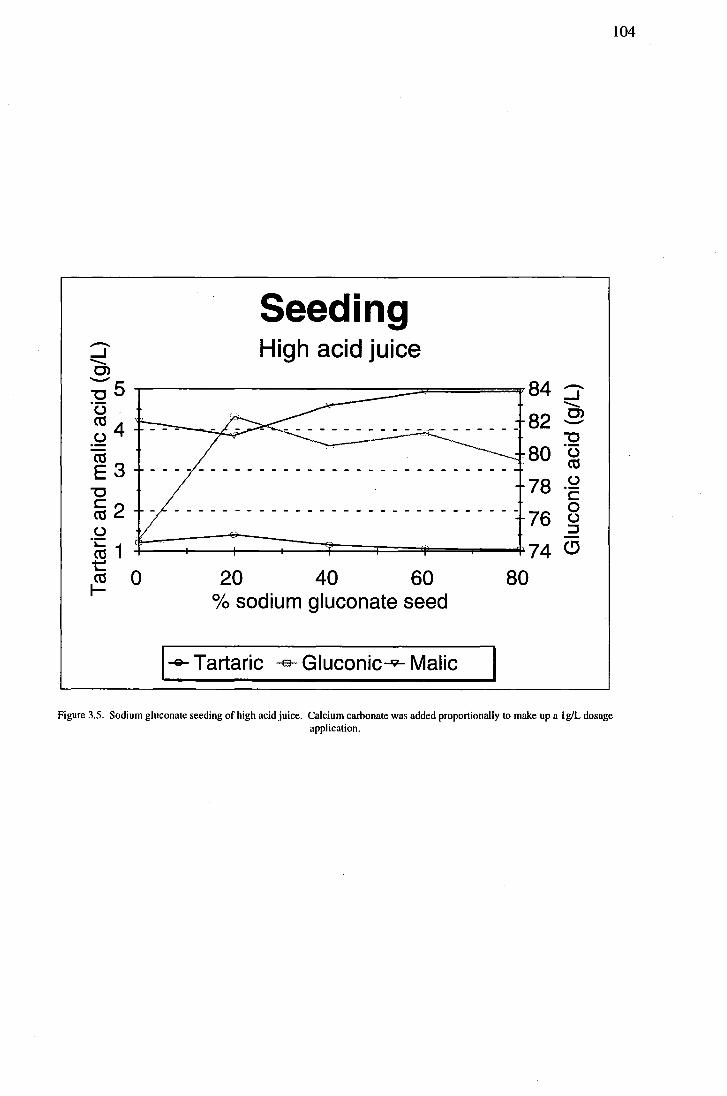
-.....J .......... C> ;-5 u ct1 4 u
~3 "0 ~2 u
·Co 1 t:::: ct1 I-
Seeding High acid juice
.-------------------~~=======v84 :J ..........
82 .9 "0
80 u ct1
78 ~ - - - - - - - - - - - - - - - - - - - - - - - - - - - - - - 76 8
::::J
t=~~:=~~~~~~~~74 ~ 0 20 40 60 80
0/0 sodium gluconate seed
I ~ Tartaric -a- Gluconic~ Malic
Figure 3.5. Sodium gluconate seeding of high acid juice. Calcium carbonate was added proportionally to make up a IglL dosage application.
104
F I
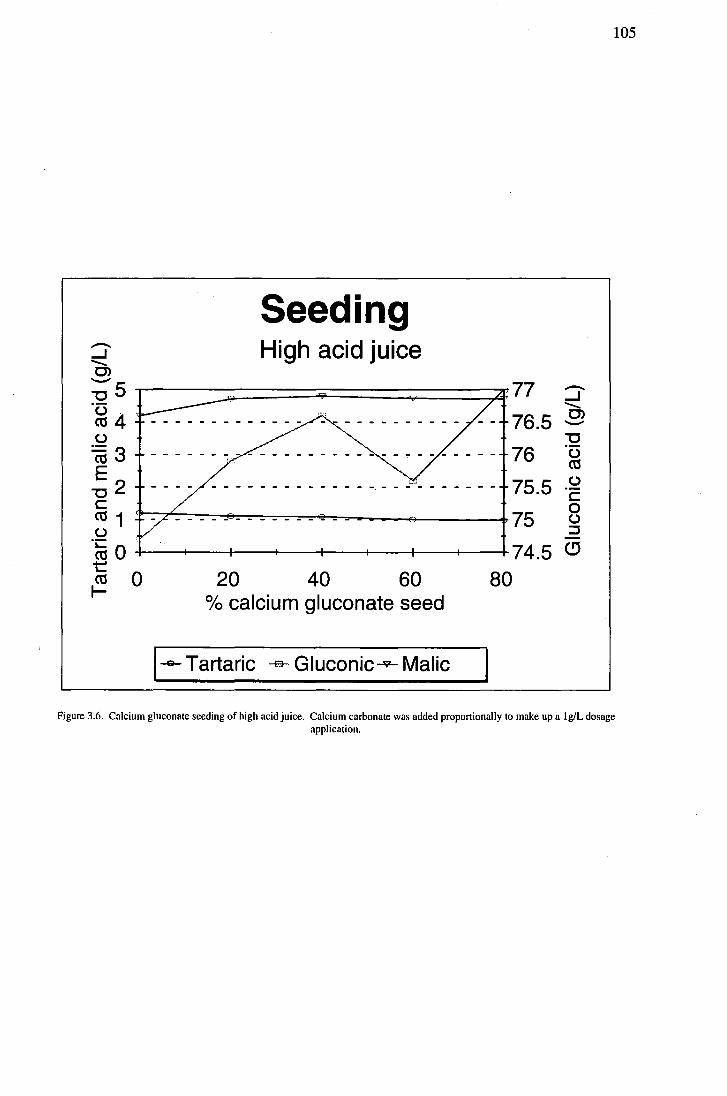
---l ......... C)
Seeding High acid juice
:; 5 1----=:::::====::::::;;;:::====:::::;;:====:::;2f;:; 77 ~ 4 - - - - - - - - - - 76.5 (.)
·~3 ~
---l ......... C) -
;2 c
75.5 ~ '-.. ; - - - - - - - - - - - - - - - - - - - - - - - -~ 1 (.)
.~ 0 +--1-----+---+---+---+-----+---+---+ 74.5 ~ 0 20 40 60 80 I- 0/0 calcium gluconate seed
I-e- Tartaric -a- Gluconic-9- Malic
o (.) ::::l
(!J
105
Figure 3.6. Calcium gluconate seeding of high acid juice. Calcium carbonate was added proportionally to make up a 19lL dosage application.
f4~~?~i:~; ,
i ;,'
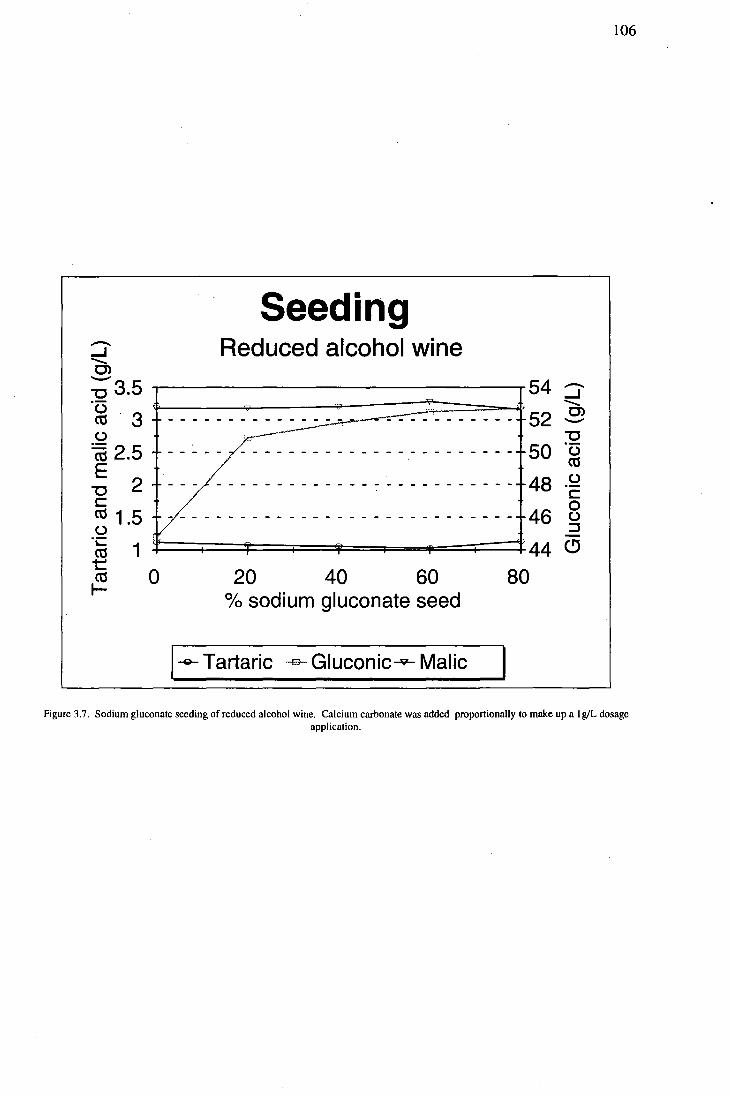
106
Seeding - Reduced alcohol wine ....J ......... 0> -- 54 "'C 3.5 -....J ~ "u ... . i .........
3 .:-::-~- - - - - - - 52 0> ttl - - - - - - - - - - - - - - .- --U "'C "ttl 2.5 - - - - - - - - - - - - - - - - - - - - - - - - - - - - 50 u E ttl
2 - - - - - - - - - - - - - - - - - - - - - - - - - - - - 48 u "'C C C 0 ttl 1 .5 - - - - - - - - - - - - - - - - - - - - - - - - - - - - - 46 u u :::::I
"C 1 44 C) ttl t::::
0 20 40 60 80 ttl ~ 0/0 sodium gluconate seed
I~ Tartaric -e- Gluconic-9- Malic I Figure 3.7. Sodium gluconate seeding of reduced alcohol wine. Calcium carbonate was added proportionally to make up a I giL dosage
application.
::- '.
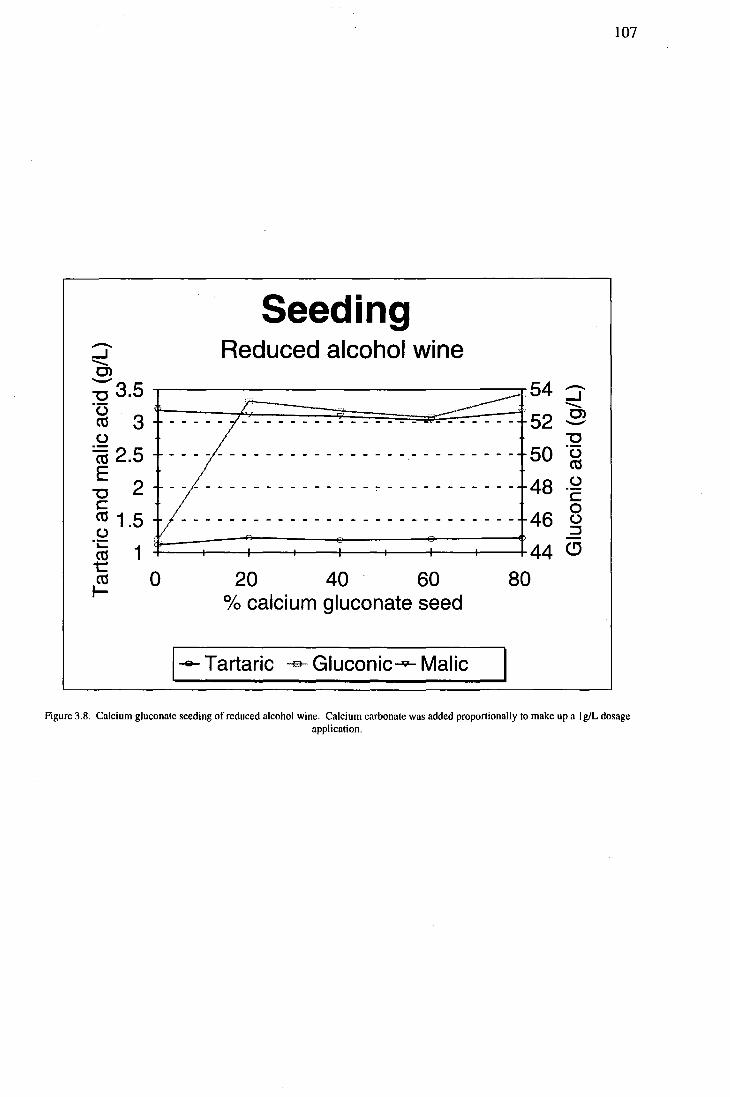
107
Seeding Reduced alcohol wine --.J -...
0> --.J --"0 3.5 ~--------------------------~.54 -... 0> --"u
3 «3 U
"«3 2.5 E
2 "0 C «3 1.5 46 u "~
1 «3 +---~~---+--~--~--+-~~-+44 t
0 «3 I-
80 20 40 60 0/0 calcium gluconate seed
I-e- Tartaric -a- Gluconic...a;<- Malic
Figure 3.8. Calcium gluconate seeding of reduced alcohol wine. Calcium carbonate was added proportionally to make up a I giL dosage application.
I::::·:·::::·::·:·:
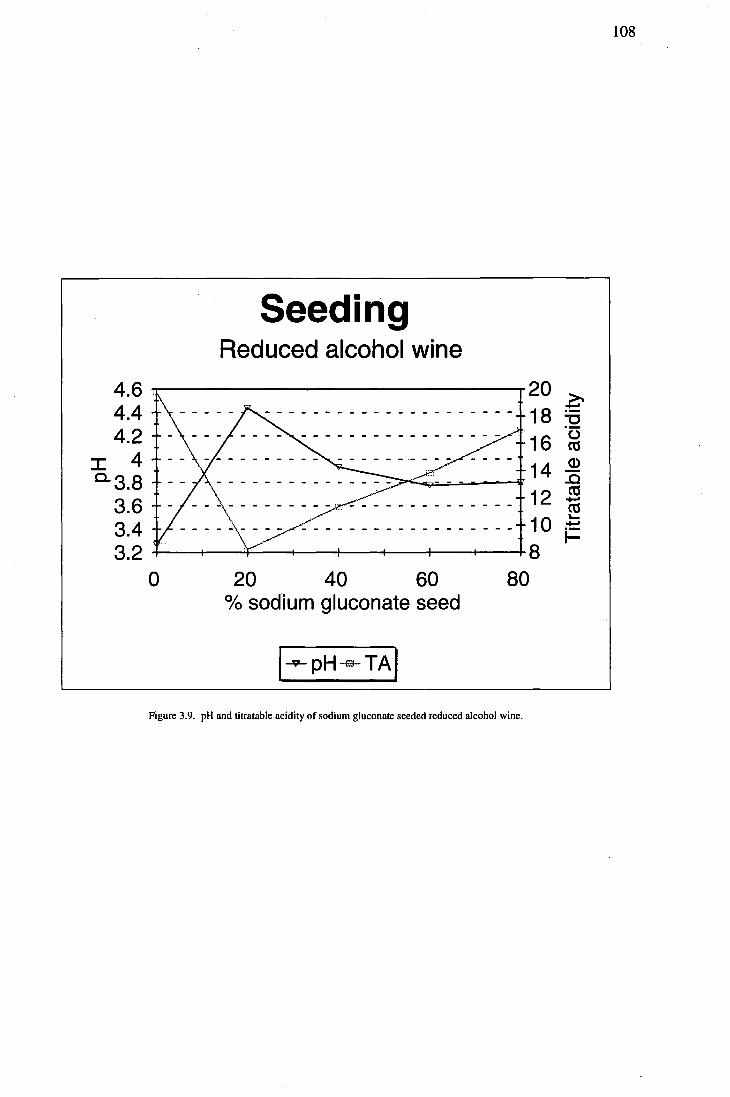
Seeding Reduced alcohol wine
4.6 ~l ----------------------------~ 4.4 4.2
I 4 0.3.8
3.6 3.4 3.2 +----I-----'f'------f----i----+----+----Ir-----t-
20 18 16 14 12 10 8
o 20 40 60 80 0/0 sodium gluconate seed
Figure 3.9. pH and titratable acidity of sodium gluconate seeded reduced alcohol wine.
108
~ ::: "C ·0 C\1 Q) ..c C\1 +-' C\1 '-+-'
J-
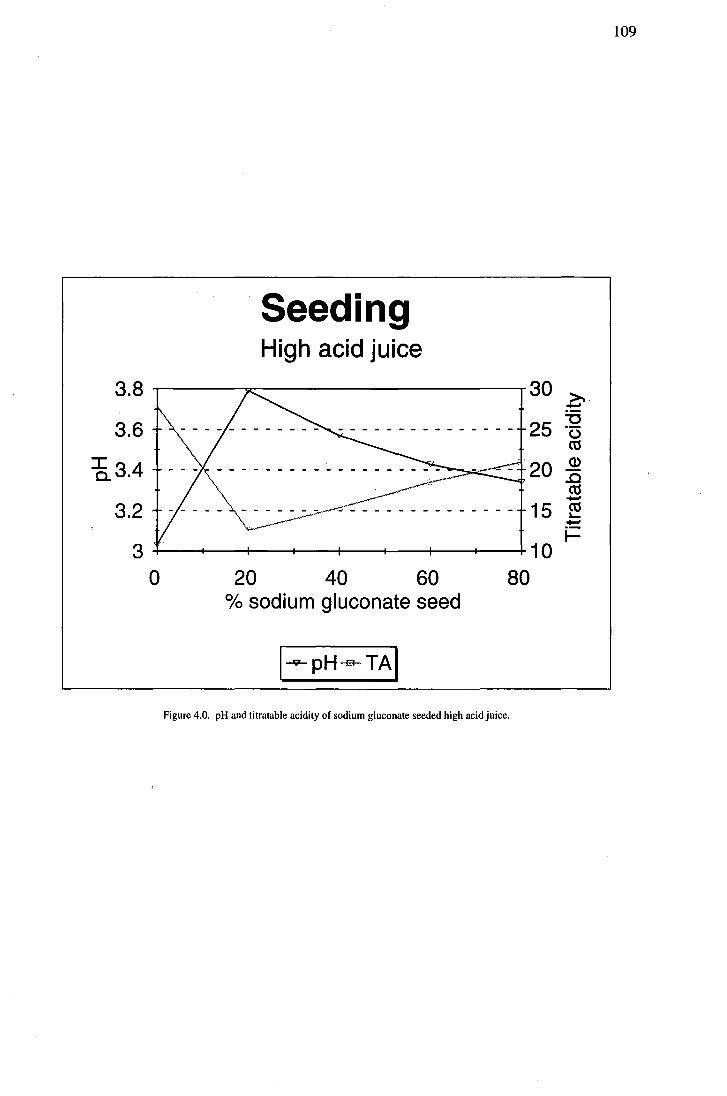
Seeding High acid juice
3.8 "T"'-""------,;z~---------____r 30
25 3.6
=5.3.4 - - - "·20
3.2 15
3 +--~~--+-~-~-+--~-+ 10 o 20 40 60 80
0/0 sodium gluconate seed
Figure 4.0. pH and titratable acidity of sodium gluconate seeded high acid juice.
109
~ :!::: "'C u co Q) .c co .-co '-.-~
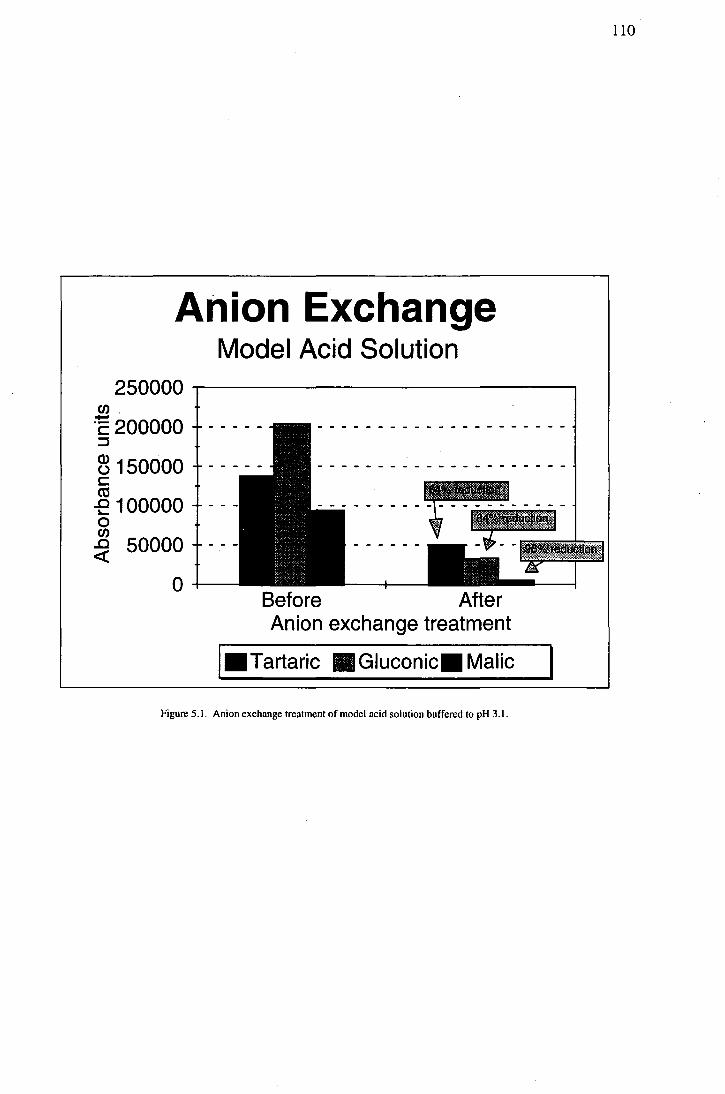
An ion Exchange Model Acid Solution
250000 .,------------------, en. +-' ·c 200000 :::J
~ 150000 c:: co -e 100000 o en ~ 50000
o +--Before After Anion exchange treatment
I_Tartaric • Gluconic. Malic
Figure 5.1. Anion exchange treatment of model acid solution buffered to pH 3.1.
110
Related Documents