Copyright © 2009, 2011 by Anita L. Tucker and Sara J. Singer Working papers are in draft form. This working paper is distributed for purposes of comment and discussion only. It may not be reproduced without permission of the copyright holder. Copies of working papers are available from the author. Determinants of Successful Frontline Process Improvement: Action versus Analysis Anita L. Tucker Sara J. Singer Working Paper 10-047

Welcome message from author
This document is posted to help you gain knowledge. Please leave a comment to let me know what you think about it! Share it to your friends and learn new things together.
Transcript

Copyright © 2009, 2011 by Anita L. Tucker and Sara J. Singer
Working papers are in draft form. This working paper is distributed for purposes of comment and discussion only. It may not be reproduced without permission of the copyright holder. Copies of working papers are available from the author.
Determinants of Successful Frontline Process Improvement: Action versus Analysis Anita L. Tucker Sara J. Singer
Working Paper
10-047

1
Determinants of Successful Frontline Process Improvement: Action versus Analysis
Anita L. Tucker
Sara J. Singer
May 9, 2011
Abstract
Senior manager participation is a key success driver for process improvement programs. To increase their
participation, we designed an intervention in which senior managers worked with frontline staff to
identify and solve safety-related problems over an 18-month period. On average, the 20 randomly
selected treatment hospitals identified 17.3 problems per work area and solved 9.1 of these. However,
their readmission rates and percentage increase in nurses’ perceptions of safety improvement were no
better than 48 control hospitals’. Thus, we investigated drivers of successful program implementation
within the set of treatment hospitals. We found that managers from hospitals with low and high perceived
improvement identified similar numbers of problems. However, high perceived improvement hospitals
took action on more problems. We found no benefit from selecting problems with the highest benefit-to-
cost ratios because there was a flat landscape for problems’ benefit-to-cost ratios. Thus, for safety
improvement in hospitals, allocating resources to search for and select high benefit/cost problems appears
to be of limited benefit versus allocating resources to take action on known problems. This approach also
aligns with how managers actually selected problems for resolution efforts: problems that were easy to
solve were more likely to be selected.
Funding provided by Agency for Healthcare Research and Quality RO1 HSO13920.
Additional funding from Fishman Davidson Center at Wharton.

2
1. Introduction
Process improvement (PI) refers to any systematic program to improve organizational routines with the
goal of enhancing performance. Although manufacturing firms have used PI for decades, service firms
have been slower to adopt these practices (Douglas and Fredenall, 2004). In this paper, we focus on PI in
hospitals because of the striking need for improvement in this service industry.
In the late 1980’s, healthcare thought-leaders advocated adopting PI techniques used by
manufacturing firms to improve quality of care and efficiency in hospitals (Berwick, 1991, Laffel and
Blumenthal, 1989, Nolan et al., 1996). Enthusiasm for PI in hospitals quickly stalled, in part because
most implementations focused on improving administrative rather than clinical processes (Blumenthal
and Kilo, 1998). However, the Institute of Medicine’s claim that medical errors caused as many as
100,000 deaths in the U.S. per year (1999) reignited interest in using PI to improve patient safety in
hospitals. Unfortunately, despite some progress, experts agree that substantial opportunities to improve
safety still exist at most hospitals (Leape et al., 2009, Pronovost et al., 2006, Wachter, 2010).
Many PI programs involve frontline employees—employees who interact directly with customers or
products the customers purchase—in the activities to improve processes. We refer to this type of PI as
“frontline process improvement” (FLPI). Research has found that successful FLPI requires senior
manager involvement (Douglas and Fredenall, 2004, Weiner et al., 1997). “Management By Wandering
Around” (MBWA) is a FLPI program that requires manager involvement (Peters and Waterman, 2004).
For MBWA, senior managers go to their organization’s frontlines to observe and talk with employees.
The purpose is to generate a list of problems and improvement ideas, which we refer to interchangeably.
MBWA can surface more problems than the organization can solve given its limited human and
financial resources (Frankel et al., 2008, Repenning and Sterman, 2002). This potential imbalance
highlights a tradeoff. On one hand, managers could focus resources on generating as many improvement
ideas as possible, even if they can’t solve all of them. Having a large number of ideas enables managers to
analyze problem frequency and severity (Leape, 2002). Using these data, managers can identify the most
important problems and prioritize these for solution efforts (Bagian et al., 2001). Furthermore, managers
may be reluctant to take action based on unfiltered employee reports, preferring to take action only when
trends emerge from a large number of ideas submitted by a cross section of employees. This orientation
toward analysis is evident in hospitals’ use of voluntary incident reporting systems (Milch et al., 2006),
which was recommended as a key component of patient safety systems in the Institute of Medicine’s
report (1999). Two oft-noted challenges with voluntary reporting are increasing employees’ willingness
to report problems so that the most important problems are accurately revealed and paying for data
collection and analysis, which can be significant (Johnson, 2003, Leape, 2002).

3
On the other hand, managers could focus resources on solving problems from the stock of known
problems (Johnson, 2003, Repenning and Sterman, 2002). This limits the number of improvement ideas
so that it better aligns with available problem solving resources (Bohn, 2000). Prior research has found
that frontline staff more willingly engage in the discretionary behaviors required for PI if they believe that
managers will act on their ideas (Gandhi et al., 2005, Morrison and Phelps, 1999). Soliciting more PI
ideas than the organization has resources to solve may lead to cynicism and a lack of participation in
future efforts (Tucker, 2007). Furthermore, research on accidents found that small problems combine to
cause major accidents, but that it is difficult to predict which problems will be involved (Reason, 1990).
Therefore, resources may be better spent solving known problems rather than identifying problems with
the goal of solving those with the highest impact (Johnson, 2003).
This paper contributes to the FLPI literature by investigating the tradeoff between (1) solicitation and
analysis of improvement ideas versus (2) taking action on existing problems. First, we test the overall
effectiveness of MBWA by comparing 20 hospitals randomly selected to participate in an MBWA
program to 48 randomly selected control hospitals that did not participate in the program. Second, we test
factors that drive differences in performance among the organizations that adopted MBWA. We studied
MBWA because it has recently gained popularity as a way to improve patient safety in hospitals and has
been effective in some, but not all organizations (Frankel, et al., 2008). Third, we investigate problem
characteristics associated with selection for solution efforts.
2. Literature Review and Hypothesis Development
In this section, we draw on the PI, innovation and patient safety literatures to develop hypotheses about
how selection of problems for solution effort impacts the success of a MBWA PI program. Our
hypotheses assess the relationships of (1) participation in the MBWA program and performance
improvement; (2) the overall managerial approach to PI and implementation success; and (3) problem
characteristics and their selection for solution efforts.
2.1. Participation in MBWA
We first consider the impact of a structured FLPI program on performance. Research has found that FLPI
can positively impact organizational outcomes, such as financial performance (Hendricks and Singhal,
2001, Powell, 1995). The theoretical explanation is that employees’ ideas are an untapped source of
knowledge that can be harnessed to improve organizational processes and culture (Arthur and Aiman-
Smith, 2001, Kim, 2005). For example, Arthur and Aiman-Smith’s (2001) study of a four-year FLPI
program found that employees’ early improvement ideas were fruitful, quick fix ideas, such as switching
to a cheaper supplier. Later, employees’ suggestions involved substantial, systematic changes in how
work was performed, such as modifying the stacking patterns of completed parts at an upstream process

4
step to eliminate wasteful restacking of the material at a downstream step. The researchers argued that the
program had the dual benefit of creating substantial improvement in work processes and moving the
organization toward a learning-oriented culture.
Despite some compelling success stories, many FLPI efforts fail (Choi and Behling, 1997). Research
on the dynamics of PI suggests that implementation failures stem from devoting too many resources to
production, which improves performance in the short term, versus to improvement, which improves
performance in the long term (Repenning and Sterman, 2002). When faced with a productivity gap,
managers typically increase short term productivity by cutting corners. However, to sustainably close the
performance gap, managers should counter intuitively decrease short term productivity by devoting
resources to improvement efforts, which yield benefits in the long term (Repenning and Sterman, 2002).
Given the high failure rate of FLPI programs, scholars have sought to identify key factors associated
with implementation success. The factors most commonly noted are senior management commitment,
training, data measurement, customer and supplier management, and employee empowerment (Choi and
Behling, 1997, Fryer et al., 2007, Stock et al., 2007, Taylor and Wright, 2003, Weiner, et al., 1997). Of
these, the most dominant factor is senior management commitment (Weiner, et al., 1997).
Management commitment may be important for FLPI because it ensures sufficient resources will be
devoted to improvement efforts and will be sustained through the “worse before better” cycle described
above (Repenning and Sterman, 2002). It also fosters employee participation by providing confidence that
positive change will result from their efforts (Morrison and Phelps, 1999). Finally, it provides strategic
oversight needed for negotiating solutions that cross organizational boundaries (Pronovost et al., 2004).
Despite consensus about the importance of senior management commitment, scant research has
investigated interventions designed to increase it. To address this gap, we studied MBWA, a systematic
program in which senior managers observe frontline employees, solicit ideas about improving quality,
safety or efficiency, and help frontline employees implement a subset of the identified improvement ideas
(Frankel, et al., 2008, Pronovost, et al., 2004). This program is designed to increase senior management
commitment to FLPI by assigning them a significant, active role. By seeing problems in context,
managers should gain a better understanding of the negative impact of these problems and therefore be
motivated to help resolve the issues (von Hippel, 1994).
We hypothesized that MBWA would improve PI performance through the performance gains that
accrue from implementing employees’ ideas for improvement. Research also suggested that it would
improve PI performance indirectly by signaling to frontline staff that the organization was serious about
improving processes. Visible manager commitment increases employees’ beliefs that leadership places a
high value on safety, which in turn influences employees to engage in safer, but more time-consuming,
discretionary behaviors (McFadden et al., 2009, Zohar and Luria, 2003). Over time, this increase in

5
beneficial, discretionary behaviors by frontline staff improves performance. We thus hypothesize that
MBWA will have a positive impact on PI performance compared with organizations that did not
participate in the MBWA program. Testing this hypothesis is a contribution because, to our knowledge,
although studies have documented the success of MBWA in some hospitals that already had senior
manager commitment (Frankel, et al., 2008), there have been no studies that test the comparative
effectiveness of MBWA in randomly selected organizations.
Hypothesis 1 (H1). Hospitals that participated in an organized MBWA program to improve patient
safety will have better PI performance than hospitals that did not participate in the program.
2.2. Problem Solving Orientation
Field-based research studies that examined FLPI programs found that an organization’s orientation to PI,
especially regarding selection of problems for solution efforts, impacts implementation success
(MacDuffie, 1997, Mukherjee et al., 1998, Stata, 1989). We draw on innovation and problem solving
theory to consider two contrasting orientations, which represent the inclination toward analysis versus
action, i.e., toward investing scarce problem-solving resources in (a) identifying problems and prioritizing
them with the goal of solving maximum-value problems versus (b) solving known problems, even if
lower-value. The organizational learning literature has discussed a similar tradeoff between exploring
new opportunities versus exploiting existing capabilities (March, 1991).
2.2.1. Analysis Orientation. Innovation tournaments attempt to discover a high-potential idea by
generating a large number of ideas, the majority of which are discarded (Girotra et al., 2010, Terwiesch
and Xu, 2008). The goal is to discover and develop a few ideas with the highest expected profitability
(Girotra, et al., 2010). Expected profitability is predicted revenue generated by the innovation divided by
the cost of developing the innovation (Terwiesch and Ulrich, 2009).
Similarly, the PI literature proposes soliciting many improvement ideas and selecting for solution
efforts the subset that accounts for the majority of the negative impact, taking into account the anticipated
costs of solving the problems. This advice assumes that there is a subset of problems with
disproportionately high benefit-to-cost ratios, which for brevity we refer to as benefit/cost. This belief,
sometimes referred to as the “Pareto Principle” (PP), states that a “few contributors to the cost [of poor
quality] are responsible for the bulk of the cost. These vital few contributors need to be identified so that
quality improvement resources can be concentrated on those areas.” (Juran & Gryna, 1988, page 22.19).
The PP holds that a vital few (around 20%) of the problems cause the majority share (around 80%) of the
negative impact (Krajewski et al., 2010). Juran claims that there are always a vital few issues if one
analyzes the data correctly, for example, by type of defect. Similarly, others have proposed that certain

6
solutions, if implemented, would reduce cumulative problem occurrence by 80% (Stata, 1989). Thus, the
PP is believed to apply to individual problems, categories of problems, and categories of solutions.
This stream of research implies that managers can maximize the return on their limited problem
solving resources by collecting a large dataset of problems, analyzing that dataset to identify the highest
impact issues, and engaging in problem solving efforts on the selected few (Girotra, et al., 2010). We
refer to the inclination toward this philosophy as “Analysis orientation”. We predict that organizations
that concentrate on solving those problems with the highest benefit/cost will be more successful at PI than
organizations that solve less impactful problems.
Hypothesis 2 (H2). Hospitals that solve a higher percentage of the set of problems with the highest
benefit- to-cost ratios will have better PI performance than hospitals that solve a lower percentage.
2.2.2. Action Orientation. The second approach that we consider is allocating resources to solving
known problems, even if they are small impact. We call an inclination toward this approach “Action
orientation”. It is characterized by fixing more problems, without regard to benefit/cost ratio and with few
resources spent determining which problems are optimal to solve.
There are three reasons why an action orientation could outperform an analysis orientation. First,
spending money prioritizing problems represents a real trade-off from devoting those resources to
resolution efforts. Industry experts for analysis-oriented systems acknowledge that these systems are
expensive to operate, and drain resources and managerial attention. For example, the US national
Aviation Safety Reporting System spends $3 million per year analyzing the 30,000 generated reports, an
average cost of $100 per report (Johnson, 2003). Given that hospitals collectively generate many more
reports—there are 850,000 reports per year generated by the UK’s National Health System (Johnson,
2003) and 20,000 per year at just one of the 6,000 US hospitals (Wachter, 2009) —spending money on
analyzing and prioritizing events can represent a significant drain on the ability of organizations to instead
devote those resources to resolving problems. Dr. Wachter from the University of California, San
Francisco, for example, estimates that his hospital spends $1.6 million per year on incident reports (2009).
Much of this cost is for analysis rather than action, so the underlying causes of the problems do not get
addressed. A survey of 2,050 US hospitals found that 98% had incident reporting systems, but only 2%
discussed incidents reported with all three of the key leadership groups—administrators, nurses, and
physicians—needed to resolve the problems (Farley et al., 2008). Thus, we conclude that an action
orientation, the tendency to spend a higher percentage of resources resolving problems than prioritizing
them, differs significantly from an analysis orientation, with important repercussions for PI performance.

7
A second benefit of an action orientation is greater employee engagement. Research on FLPI has
found that employees become discouraged if management does not take action on known problems
(MacDuffie, 1997). Thus, asking employees to identify more issues than the organization has resources to
solve can create cynicism, which negatively impacts organizational culture (Clarke, 1999). In addition,
the pressure of having more problems than can be solved can create a firefighting culture where problems
are patched rather than truly solved (Bohn, 2000). Conversely, an action orientation can create a positive
dynamic where employees surface increasingly meaningful issues and devote more time to PI, which
improves performance (Arthur and Aiman-Smith, 2001, Repenning and Sterman, 2001).
Third, research on industrial accidents, which shows that major accidents stem from small problems
that align in an unfortunate sequence rather than from one major failure (Reason, 1990), also supports an
action orientation. The difficulty of predicting which specific problems will combine in a catastrophic
way increases the challenge of assessing the benefit of removing the underlying causes of a problem,
reducing the ability to accurately prioritize problems. Therefore, organizations may gain more by
allocating resources to remove known problems, rather than to identification, analysis and prioritization
efforts because one cannot know in advance which specific problems will contribute to the next accident.
Eventually, however, the incremental value of solving additional problems diminishes. As underlying
causes of problems get removed, the performance gap between desired performance and actual
performance decreases, easing pressure to invest resources in PI (Repenning and Sterman, 2002). In these
situations, it is more beneficial to have employees focus on producing goods or services rather than on
problem solving (Fine, 1986). Therefore, we anticipate that there will be an inverted u-shaped relationship
between the number of problems solved and performance.
Hypothesis 3 (H3). There is an inverted u-shaped relationship between solving more problems and PI
performance.
2.3. Problem selection
Differences in problem solving orientation influence which problems get selected for resolution efforts.
For example, MacDuffie’s ethnographic study of problem solving in auto manufacturing plants found that
differences in managers’ problem solving orientation resulted in dramatic differences in which types of
problems were addressed (1997). Analysis-oriented managers want to maximize the benefit gained from
limited problem-solving resources and therefore select problems with the highest benefit/cost. The
validity of this orientation is reinforced by the PI and innovation literatures, which advise managers to
select the highest benefit/cost problems (Juran et al., 1999, Terwiesch and Ulrich, 2009). Thus:

8
Hypothesis 4 (H4). Problems with higher benefit-to-cost ratios will be selected for solution efforts
more than problems with lower ratios.
More consistent with action-orientation, behavioral research questions whether people follow rational
decision-making heuristics, such as selecting problems with the highest benefit/cost (Tversky and
Kahneman, 1984). Experimental research on people’s actual decision-making behaviors finds that most
people select options that maximize their short-term rather than long-term payoff (Bazerman, 1986).
Muthlingham and colleagues’ empirical study (2010) of the adoption of energy-efficiency-enhancing
ideas by manufacturing firms provides insight into how the tendency to maximize short-term payoffs
influences problem-solving decisions of managers. They found that managers implemented ideas that
were inexpensive to solve in the short term rather than ideas that were more expensive initially, but over
time, had a higher payoff. Similarly, MacDuffie’s case study of three automobile manufacturers’ PI
programs found that Ford avoided solving a design flaw in the drip rail—the metal trim around the door
opening that diverts rain water from leaking into the car—because it was expensive to make the lip of the
metal rail longer, despite the fact that water leaks was the most frequent customer-reported defect
according to J.D. Power (1997). Thus, we predict that managers will be more likely to select problems
that are cheaper to solve than those that are more expensive to solve, even if the benefit/cost is higher.
Hypothesis 5 (H5). Problems that are less expensive to solve will be selected for solution efforts
more than problems that are more expensive to solve.
Ease of solution is another problem characteristic that an action-oriented manager might use as a
selection criterion to maximize short term payoff. Muthlingham et al. (2010) found that managers selected
problems that could be resolved by subordinates, reducing the burden on managers’ time. These problems
can be considered easier to solve than more complex, boundary-crossing problems that require managerial
involvement for solution efforts to be successful (Tucker and Edmondson, 2003). Bohn recommends
performing triage on the queue of problems (2000). Although he does not provide guidance on what
criteria to use for making triage decisions, his model suggests that time required to solve a problem is an
important driver of the backlog of unsolved problems. Thus, all else equal, managers should select
problems that require less time to solve compared to other problems. Building on these findings, we
predict that easier problems will be selected for solution efforts relative to more difficult ones.
Hypothesis 6 (H6). Problems that are easier to solve will be selected for solution efforts more than
problems that are more difficult to solve.
9
3. Methodology
We test our hypotheses in a field study of U.S. hospitals that participated in a MBWA program to
improve patient safety. The program was launched in January 2005 and lasted for 18 months. We drew on
prior research to design the program (Frankel, et al., 2008, Pronovost, et al., 2004, Thomas et al., 2005).
We describe the program, selection of intervention and control hospitals, and our data and analysis.
3.1. The MBWA Program
The MBWA program consisted of repeated cycles of senior manager-staff interaction, debriefing, and
follow up. Senior managers, such as the Chief Executive, Operating, Medical, and Nursing Officers
(CEO, COO, CMO, and CNO, respectively), interacted with frontline staff to generate, select, and solve
improvement ideas. Their interactions took two forms: visits to observe work, which were called “work
system visits”; and special meetings, called “safety forums,” with larger groups of staff to discuss safety
concerns. The two activities were conducted in the same work area, such as the emergency department. In
work system visits, four senior managers would each spend 30 minutes to two hours visiting a particular
work area to observe a person doing work. The senior managers would each observe a different role, such
as a nurse, physician, patient, and respiratory therapist, to shed cross-disciplinary insight into the work
done in the area. The purpose was to build senior managers’ understanding of the frontline work context
and gather real-time, grounded information about safety problems (Frankel, et al., 2008). In addition to
work system visits, managers also facilitated a safety forum in the work area. The safety forums were
designed to enable a larger group of frontline workers from the work area to tell senior managers about
their safety concerns and points of pride (Sobo and Sadler, 2002). By supplementing work system visits
with safety forums, the program addressed research suggesting that interaction with more frontline staff
increases MBWA’s positive impact on culture (Thomas, et al., 2005).
The MBWA program continued with a “debrief meeting,” which served to organize the information
collected from the site visits and forum. The senior managers who interacted with frontline staff in the
work area attended, as did the work area managers, selected frontline workers, and hospital patient safety
officer. They compiled the improvement ideas identified through manager-staff interaction. Then they
discussed the ideas and decided next steps, ranging from doing nothing to suggesting solutions and
assigning responsibility. Managers were encouraged to communicate with staff about implementation
efforts, describing what changes, if any, were made in response to identified ideas. The patient safety
officers entered into an electronic spreadsheet, the ideas generated and actions taken and sent this
spreadsheet to our research team for analysis.
Each round of these activities constituted one cycle. Each cycle focused on a specific work area of the
hospital and took approximately three months to complete, approximately equivalent to the length of time

10
reportedly required for PI teams to solve identified problems (Evans and Dean, 2003). After completing a
cycle, the management team would move to a different work area for another cycle. Senior management
teams determined which work areas to visit based on their hospital’s needs. Cycles continued over the 18-
month implementation. On average, hospitals conducted cycles in 4 work areas, most commonly in the
operating room or post anesthesia care unit (OR/PACU), intensive care unit (ICU), emergency
department (ED), and medical/surgical ward (Ward).
3.2. Sample/ Recruitment
Our study employed a quasi-experimental design, including a pretest and posttest of treatment and control
hospitals. We first drew a random sample of 92 US acute-care hospitals, stratified by size and geographic
region. We provided no financial incentive; however, participation in our larger study on patient safety
climate fulfilled a national accreditation requirement. At enrollment all hospitals were aware that they
may be invited to participate in a program to improve patient safety, but details regarding the program
were withheld to prevent contamination of the control hospitals. To select treatment hospitals to
participate in the MBWA program, we drew a second, stratified, random sample of 24 hospitals from the
sample of 92. Twenty-four was the maximum number of treatment hospitals our funding could support
and we could oversee. The remaining 68 hospitals not selected for the MBWA program were “control
hospitals.” We use data from the control hospitals to test the effectiveness of the program. There was no
difference between treatment and control hospitals on our outcome variable perceived improvement
(described in detail below and in section 3.3.5) in 2004 (F=0.01, not significant; mean = 3.72, standard
deviation (SD) = 0.37 for control hospitals, mean = 3.74 SD = 0.27 for treatment hospitals).
Data on perceived improvement were collected through surveys before implementation of PI
activities (2004) and again after the program was completed (2006). At each hospital, we surveyed a
random 10% sample of frontline workers. We were required to survey only 10% and different frontline
workers in 2004 and 2006 because the hospitals were concerned about the burden on frontline workers.
The baseline (2004) response rate was 52%; the follow-up (2006) response rate was 39%. For the
analyses in this paper, we used data from nurses (n=1,420 in 2004 and n=1,570 in 2006) to mitigate
perceptual differences due to differences in the disciplinary composition of participating organizations
(Singer et al., 2009). Twenty of the 24 treatment hospitals completed the improvement program.1 Forty-
1 The four that did not complete the treatment dropped out because one went out of business, one was purchased by another organization, and two experienced significant senior management turnover. As a result, they were unable to complete more than one cycle of activities and did not provide data on ideas generated, selection, actions taken, and feedback provided to frontline workers, or the posttest survey. We thus excluded these hospitals from our analysis. There was no difference in perceived improvement in 2004 between the four hospitals that dropped out of the treatment and the 20 that did not (one way ANOVA, F = 0.14, p = .72).

11
eight of the original 68 control hospital completed the posttest survey in 2006. Thus, our final sample
contains a total of 68 hospitals: 20 treatment hospitals and 48 control hospitals.2
Using a data collection spreadsheet that we developed, treatment hospitals reported 1732 ideas for
improving safety across 130 work areas. Each row of the spreadsheet represented a unique idea for
improving safety. The columns included the hospital, the work area, the safety problem, recommended
actions for resolving the issue, what action was taken, and who was responsible for implementing the
action. To ensure that our analysis focused on work areas that received the full MBWA treatment rather
than an ancillary visit as part of another work area’s treatment, we omitted work areas with fewer than
five problems. Omitted work areas included laboratory and pharmacy, often visited as part of a MBWA
treatment conducted on another unit, such as the ICU. The final sample was 1643 problems from 93 areas.
3.3. Measures
3.3.1. Treatment. To test H1, we created a binary variable, Intervention Hospital, which indicated
whether the hospital participated in the MBWA PI program (1) or not (0).
3.3.2. Benefit-to-Cost Ratio. To test H2 and H4, we needed a measure for benefit/cost. We divided
the estimated benefit of solving the problem (as measured by severity of its potential harm) by the
estimated cost of solving the problem. To measure problem severity, we recruited ten experienced nurses
(median = 4.5 years) from a graduate nursing program located in our city to independently rate the
severity of the problems using a coding manual that we developed. The coding manual had a row for each
of the ten values of severity (1 = no harm, 10 = potential for death) and four columns: the numerical
value, a short label (e.g. “patient discomfort” for a level 3 severity), a detailed description of what types
of things were included in that level, and an example problem that fit that value. To measure inter-rater
reliability, we calculated the kappa statistic (Landis and Koch, 1977) by first having all ten nurses rate a
subset of 58 ideas. Kappa values can range from -1, indicating complete disagreement, to 1, indicating
perfect agreement. The combined kappa was 0.22, indicating fair agreement among raters (Landis and
Koch, 1977). We believe that this is adequate agreement for the following two reasons. In the context of
innovation, which is judging the potential value of implementing an idea, different raters can have
differing perceptions about the value of ideas and solutions and therefore a lower kappa value is not
unexpected (Terwiesch and Ulrich, 2009). Furthermore, the standard deviation across raters was only 1.4.
Given that our scale was ordinal, two ratings in adjacent categories (such as one rater assigning a 4 and a
second rater assigning a 5) were very similar, though they would be considered completely different
categories by the kappa statistic, making this statistic very conservative. After establishing agreement, at
2 There was no difference on 2004 survey measures between the 19 control hospitals that dropped out of the 2006 survey and the remaining hospitals (F=.47, p=.50; dropped control hospitals had a mean of 3.66, SD = .32 while retained control hospitals’ mean was 3.72, SD = .37).
12
least four nurses rated the severity of each problem. The mean severity was 5.0. We also had a
supplemental measure of severity that we used to validate the ratings. In the data collection spreadsheet,
we had included three columns related to prioritizing the problems. One of these asked hospitals to assess
the safety risk of each problem generated on a scale from 1 to 10, with 1 being low to no risk, 3 mild
discomfort, 5 would require intervention, and 10 could cause harm or death. Ten hospitals scored their
problems for safety risk. The correlation between the hospital-rating of safety risk and the nurses’ rating
of severity was significant, lending support for the validity of our severity measure (=.24, p<.001).
To measure solution cost, which was necessary to calculate benefit/cost and also to test H5, the
authors individually rated the cost of solving each problem using a scale from 1 (low), 2 (medium), and 3
(high). We compared scores and discussed our rationale until we reached consensus. To facilitate
agreement, we assigned dollar values to the scale: 1 = solution cost < $500, 2 = solution cost > $500 and
< $150,000, and 3 = solution cost >$150,000. For solutions that required consumable purchases, such as
soap to refill dispensers, we included the cost of a year’s supply of the consumable material.
We used the 1-3 scale and the consensus process to measure two kinds of costs: (1) anticipated cost
of solving a problem and (2) cost of the actual solution, if any, implemented by the hospital. To measure
anticipated solution cost, which was the variable we used to calculate benefit/cost, we estimated what it
would cost to solve the underlying causes of that problem, using the description of the problem. To
measure actual solution cost, we used the description of actions taken by the hospital, if any. We used
actual solution cost as control variable, described in the control variable section below. After obtaining
estimates of severity and anticipated solution cost for each problem, we calculated the benefit/cost ratio
by dividing the severity by the cost. The maximum possible benefit/cost was 10, and the lowest was 0.33.
To test H2, we calculated three different benefit/cost measures to correspond to the three methods of
analyzing data advocated by Juran (1999): individual problems, types of problems, types of solutions.
These measures were necessary to test the hypothesis that better outcomes would be associated with
solving a subset that collectively accounted for 80% of the total benefit/cost identified in a work area.
This is because the subset could be the set of highest benefit/cost (1) individual problems, (2) categories
of problems, or (3) types of solutions As a first step in doing this, using the same process for reaching
agreement that we used for solution costs, we coded each problem into one of 11 problem types:
Communication, Equipment, Facility, Infection Control, Medication Administration, Policy or Procedure,
Slow Response Time, Security, Staffing-related, Task Management such as interruptions, and Other
(citation omitted for review). We also coded each problem into the primary of eight types of solutions:
Training, Purchase or restock supplies, Change procedures, Staffing changes (e.g. hiring additional
people), Maintenance, Redesign of physical space, Communication/ documentation/ information
technology changes, and Other. The categories emerged from the data (Strauss and Corbin, 1998).

13
For the individual problem analysis, we used the following steps. (1) We rank ordered the individual
problems in a work area by benefit/cost in descending order. (2) We created a variable, cumulative sum,
that was the cumulative sum of benefit/cost ratios up to and including that problem in rank order. (3) We
created another variable, cumulative percentage, that was the cumulative sum divided by the grand total
of the benefit/cost ratios in the work area. (4) For descriptive purposes, we found what percentage of
individual problems needed to be solved to obtain 80% of the total benefit/cost ratio in the work area. If
the PP held, this percentage would be close to 20%. We report the average of this value and a histogram
in the results section. (5) Next, we created a variable whose value was a 1 for those problems in the top
80% of cumulative percentage, and a 0 otherwise. These two sets of problems are called “top 80%”
individual problems and “not top 80%” individual problems respectively. (6) Finally, for each work area,
we calculated the percentage of the cumulative benefit/cost ratio from the top 80% individual problems
that was solved and the percentage of the cumulative benefit/cost ratio from the not top 80% that was
solved. We included these two variables in the regression equation to test the impact on performance of
solving the highest benefit/cost individual problems. We used the percentage of the cumulative
benefit/cost solved rather than the percentage of problems that were solved to take into account that all
problems might not be equally important, and to place greater weight on solving problems with higher
benefit/cost. We also conducted this analysis with severity of problems and a standardized version of
benefit/cost and got similar results.
We followed a similar process for problem and solution types. For problem (solution) type, we first
found the sum of the benefit/cost values for the problems in that type and used those values to rank order
the types in descending order. We calculated the cumulative sum of the total benefit/cost up to and
including that type. We calculated for each type, the cumulative percentage, i.e., the cumulative sum
divided by the grand total. For descriptive purposes, we calculated what percentage of types needed to be
solved to obtain 80% of the total benefit/cost. We created a variable whose value was 1 for problems that
were in a “top 80% problem type” (solution type), and 0 otherwise. For each work area, we calculated the
percentage of cumulative benefit/cost from the top 80 problem types (solution types) and from the not top
80 problem types (solution types) that were solved. We used these four variables in our regressions.
3.3.3. Average number of problems solved. To test H3, we coded a problem as having solution
effort if there was evidence that action was taken to address the problem. Our coding was validated by a
second measure, “average solution effectiveness”, which we explain in more detail in section 3.3.6. The
average solution effectiveness was 5.9 for solved problems (“solution action in progress”) and 2.7 (“no
solution implemented”) for unsolved problems, lending credibility to our coding. We summed the number
of problems addressed by solution efforts in each work area to create a measure of the total number of

14
problems solved in the work area. We averaged the total number of problems solved across all work areas
for each hospital to create the hospital-level variable we used in our analyses.
3.3.4. Difficulty of Solution. To test H6, we used data from the ten hospitals that completed the
prioritization columns we had provided in the spreadsheet. One of these measured difficulty of solution,
where 1 = easy, can be done within 30 days; 2 = moderate, multiple departments’ approval required, 90
days; and 3 = difficult, multiple departments, process changes, and major budget, 6 months.
3.3.5. Outcome Measures. We had two outcome measures. The first was the percentage change in
perceived improvement from 2004 to 2006. It was derived from four survey items, listed in the Appendix.
Using a 5-point Likert response scale ranging from 1=strongly disagree to 5=strongly agree, we asked
respondents the extent to which they agreed with items such as “Overall, the level of patient safety at this
facility is improving” and “The overall quality of service at this facility is improving.” Agreement with
these items indicated that respondents thought quality and safety were improving. The scale exhibited
high reliability, with a Cronbach’s alpha of .85 for the combined 2004 and 2006 individual-level, nurses-
only data set (Nunnally, 1967) (n=2990). To create a “change in perceived improvement” score for each
hospital, we first used the 2004 data and calculated for each nurse the mean for the four items. We then
calculated the 2004 mean for each hospital by averaging the mean scores of the nurses who worked at that
hospital. We repeated this process for the 2006 data. Then, we subtracted the each hospital’s 2004 mean
score from its 2006 mean score and divided this difference by the 2004 mean score. Thus, our dependent
variable reflects the percentage change in perceptions over the implementation time period.
We calculated ICC and rwg to test whether hospital-level aggregation of perceived improvement was
appropriate, The mean interrater agreement score (rWG) for nurses’ rating of perceived improvement was
0.60, which is sufficient for aggregation (Zellmer-Bruhn, 2003). Significant intraclass correlations
(ICC[1]=.06, F=5.69, p-value < .000, and ICC[2] = .82) also supported aggregation (Bliese, 2000).
We used a perceptual measure of improvement because safety is the absence of problems, which
makes it challenging to measure objectively (Gaba 2003). In this case, employee perceptions may provide
the best information about whether processes are improving because employees are embedded in the work
processes and know if system failures are becoming less frequent. Furthermore, the hospitals in our study
were unwilling to share confidential data about safety incidents with us.
Our second outcome variable was the average of two standardized rates of patient readmissions. We
took the mean of the standardized, risk-adjusted readmission rate for patients admitted to the hospital in
2005 with a primary diagnosis of congestive heart failure (CHF) who were readmitted for any reason to
the hospital within 30 days of being discharged and the same measure for patients with a primary
diagnosis of pneumonia (PNM). These data were publically available from Medicare Hospital Compare
15
(http://www.hospitalcompare.hhs.gov/hospital). Readmission data were not available for earlier dates.
Therefore, we are unable to compute a before and after measure.
3.3.6. Control Variables. We considered a variety of hospital-level control variables one at a time,
retaining the significant variables. Due to our small sample size, we did not include non-significant
control variables in our regressions. The non-significant control variables were: number of hospital beds;
US census region; urban or non-urban location; and 2004 commercial credit class. Credit class was
derived from the 2004 Dun and Bradstreet Commercial Credit Scoring Report. Other hospital
characteristics came from the 2004 American Hospital Association Annual Survey of Hospitals.
For H1, the only significant control variable was hospital tax status (not for profit; 1=not for profit tax
status, 0 = otherwise). For H2 and H3 regressions with the outcome variable of perceived improvement,
the significant control variables were average effectiveness of solution efforts (Ave Solution
Effectiveness, explained below) and percentage of problems for which a senior manager such as the CEO,
COO, CNO, or CMO was assigned responsibility for solution efforts (% Sr Mgr Assigned). With the
readmissions outcome variable, the significant controls were the ratio of full-time equivalent nursing
hours to patient days (RN hrs), and if the hospital was a major teaching hospital (teaching; 1=yes, 0 = no).
For H2 and H3, to control for the alternative hypothesis that our results were driven by the quality of
solutions implemented, we asked the ten independent nurses to rate solution effectiveness for the
hospitals’ solution for each idea. The scale ranged from 1 to 10, with 1 being “no information given” and
10 being “systemic fix” that would prevent recurrence. The average solution effectiveness was 5
(“problem is being investigated”), with an average SD of 1.2 and kappa of 0.23.
For H3, to control for the possibility that the positive results stemmed not from solving more
problems, but from spending more money, we controlled for hospital spending on solution efforts. To
create this variable, we used our estimate of the actual solution costs and converted it to a dollar figure by
multiplying the 1’s by $250, the 2’s by $5,000, and the 3’s by $150,000. We removed duplicate
solutions, such as implementation of a new computer system, where one solution was listed for multiple
problems. For each work area, we summed the dollar values to get total dollars spent on solutions.
Finally, for each hospital we found the median cumulative dollar value of actual solutions in a work area.
However, this control variable was not significant in any of the equations, nor did its inclusion change our
results, and therefore for parsimony we omit it from our final analyses.
For H4 and H5, our large sample size enabled us to include the following control variables: a set of
dummy variables for the work areas where the problem was identified (e.g. ICU, ED), a set of dummy
variables for the type of activity during which the problem was identified (e.g. site visit, safety forum, or
both), a set of dummy variables for the 11 types of problem (e.g. medication-related) and the order in
which the work area was visited in the MBWA program (e.g. 1= first work area to get the MBWA

16
intervention at the hospital, 2 = the second, etc.). The only significant relationships were as follows:
problems identified from a safety forum or both the safety forum and the work system visit were more
likely to be selected for solution efforts; problem types “task management” and “other” were less likely to
be selected for solution efforts; and problems from work areas that were visited later in the sequence were
less likely to be selected for solution efforts. For H6, our sample size was smaller with only 364 problems
from ten hospitals. Thus, we created two new control variables that more parsimoniously reflected the
significant control variables from H4 & H5: a binary variable for whether the problem was identified
through a safety forum or both a safety forum and site visit (1 = yes, 0 = no); and a binary variable for
whether the problem was in the problem category of task management or other (1 = yes, 0 = no). We also
included the control variable for sequence.
3.4. Testing our Hypotheses
We used Stata 11.1™ to test our hypotheses. To test H1, we compared hospital level performance
between intervention and control hospitals. H2 and H3 tested the impact of treatment hospitals’ problem
solving orientation on performance using hospital-level variables from the spreadsheet of safety
problems. For H1-H3, we used linear regression analysis with robust standard errors (Rabe-Hesketh and
Everitt, 2004). We tested H4-H6 using the individual problem-level data set. We used multilevel mixed-
effects logistic regression (xtmelogit), with problems nested in work areas and work areas nested in
hospitals (Rabe-Hesketh and Skrondal, 2005, StataCorp, 2007). Because difficulty of solution was
provided by only ten hospitals, this regression has a smaller sample size than the first model.
3.5. Qualitative Data Collection and Analysis
We visited each treatment hospital to observe prescribed MBWA activities, such as a work system visit or
a safety forum. In addition, we discussed and observed specific examples of changes implemented in
response to problems identified through the program to verify accuracy of the data that the hospitals
submitted to us. There were no discrepancies. We also interviewed frontline staff, department managers
and the CEO. Interview questions addressed the nature of PI in the hospital in general and as it related to
the implementing MBWA. For example, we asked senior managers how they viewed their role in patient
safety. Interviews were recorded and transcribed. After each visit, investigators wrote a journal of the
day’s activities based on notes taken throughout the day. The journal and interviews were combined into a
transcript, which provided qualitative data on the nature of the hospital’s PI process.
We coded the transcripts using the procedure described in Miles and Huberman (1994, p. 58-62). We
initially used a list of codes based on our interview questions. We read the transcripts multiple times,
revising the codes as we deepened our understanding of similarities and contrasts among the hospitals’
implementation of the program. Three main themes emerged: (1) how the hospital managers prioritized
problems for solution efforts; (2) the strength of the MBWA implementation; (3) and the strength of the

17
CEO’s role in patient safety. One author went through the transcripts to select all relevant quotes for each
hospital for each of the three themes. For theme 1, she developed categories describing different types of
prioritization. For themes 2 and 3, she developed a coding scheme from 1=weak, 2=moderate, 3=strong
and provided descriptors. Both authors independently rated each hospital’s set of quotes while blinded
from the hospital’s performance results using the relevant coding scheme. Each hospital received an
overall rating for each theme. We compared ratings and discussed each theme at each hospital to come to
consensus. We use the qualitative results to better understand differences in performance.
4. Results
We begin with descriptive statistics from the implementation of the MBWA program. We also discuss the
distribution of problems, types of problems, and solutions. These are followed by the regression results.
4.1. Descriptive Statistics about Identified Problems and Solutions
Treatment hospitals conducted activities in an average of 4.7 work areas. The most frequent problem
types were related to equipment (18%), facility (17%), communication (16%) and staffing (16%). The
most frequent solutions were policy/procedure changes (17%), training (16%), and purchasing supplies
(14%). Tables 5 and 6 show a sample of problems and their solutions. Hospitals identified an average of
17.3 problems per work area and took action on 9. The average benefit/cost was 4.1 for all problems.
Regarding the distribution of benefit/cost, most work areas in our dataset did not identify a set of
problems that fit the PP, but instead had a more flat distribution. On average, a work area had to solve an
average of 11.4 problems, or 65% of identified problems to capture 81% of the cumulative benefit/cost.
Similarly, grouping the data by types of problems, a work area would need to solve 57% of the problem
types identified to get 81% of the cumulative impact. Finally, grouping by solution type, work areas
would need to implement an average of 55% of the solution types to get 81% of the cumulative
benefit/cost. Figure 1a shows the histogram of the benefit/costs of individual problems from a typical
work area, Hospital 47, work area 42. This work area was close to the dataset’s average: % of problems
needed to be solved to get 80% benefit (ave: 65%, #42 = 66%), number of problems identified (ave: 17,
#42=15), and solved (ave: 9, #42=5). Solid bars signify the problem was solved, and solid borders signify
the problem was in the top 80%. Figures 1 b-d are histograms showing the average percentages of (b)
individual problems; (c) problem types; and (d) solution types needed to be solved to capture 80% of the
cumulative impact in the work area, none of which suggested that 20% was part of a normal distribution.
Insert Figure 1 about here

18
Descriptive statistics for hospital-level variables are shown in Table 1. The mean percentage change in
perceived improvement scores was 2% for treatment hospitals (SD=10%, Min=-16%, Max 32%) and 1%
for control hospitals (S=11%, Min=-25%, Max 41%). On average, the percentage of the total benefit/cost
solved from the top 80% category was 58% for individual problems (SD=31%), 57% for problem types
(SD=29%), and 57% for solution types (SD=30%). For the not top80% categories, on average hospitals
solved 55% of the total benefit/cost for all three measures (SD = 26% for individual problems, 35% for
problem type, and 29% for solution types).
Insert Table 1 about here
Four hospitals solved 75% or more of the cumulative benefit/cost in the top 80% of individual
problems; we labeled these hospitals analysis-oriented. Among the four, % change in perceived
improvement was above average for two (Hosp 65, 100) and below average for two (Hosp 55, 105). Five
hospitals solved 9 or more problems per work area on average; we labeled them action-oriented. Two
were above average on % change in perceived improvement (Hosp 32, 119), one was below average
(Hosp122) and two were average (Hosp 47, 116). Four hospitals were both analysis and action-oriented.
Two were above average on % change in perceived improvement (Hosp 39, 88), one was below average
(Hosp 9) and one was average (Hosp 121). Seven used neither. Three were below average on % change in
perceived improvement (Hosp 72, 131, 144), three were average (Hosp 82, 106, 129), and one was above
average (Hosp 34). Average % change in perceived improvement was directionally aligned with our
hypotheses, but the large standard deviation within each cell made the differences non-significant
(neither: mean=-2%, SD=9.5%; analysis-oriented mean=0.7%, SD=7.1%; action-oriented: mean=1.4%,
SD=5.6%; both mean=11%, SD=16%, ANOVA F = 1.51, Prob>F = 0.25).
4.2. Effect of Implementation of MBWA on Performance (H1-H3)
Table 2 (outcome variable: percentage change in perceived improvement) and Table 3 (outcome variable:
readmission rate) show results from our tests of H1-H3. Model 1 in the two tables shows the results from
testing H1, which was not supported. The higher percentage change in perceived improvement and lower
readmissions for hospitals that participated in the MBWA program compared to hospitals that did not
participate in the program were not significant. Model 2 in Tables 2 and 3 shows the results from testing
H2, whether solving a higher percentage of the cumulative benefit/cost from the set of individual
problems that account for the top 80% of the cumulative benefit/cost was associated with better
performance. H2 was not supported for either percentage change in perceived improvement or
readmission. On the contrary, solving a higher percentage of the not top 80% was marginally associated
with better performance (=.191, p<.10 for perceived improvement; = -1.53, p<.10 for readmission).

19
Model 3 in the tables shows the regression results from testing the impact of solving a higher percentage
of the benefit/cost in the top 80% types of problems. Again, H2 is not supported as solving a higher
percentage of the benefit/cost from the top 80% is marginally associated with higher readmission rates
(=1.482, p<.10 for readmission). Conversely, solving a higher percentage of the not top80% problem
types is marginally associated with better performance (=.098, p<.10 for perceived improvement; =-
1.37, p<.05 for readmission). Finally, Model 4 tested the impact of the % of the cumulative benefit/cost
solved from the top80% solution types. H2 remained unsupported (not top 80% =-1.93, p<0.05 for
readmission, top 80% not significant). In summary, H2 was not supported, regardless of whether the
problems are analyzed at the individual level, by type of problem, or type of solution. Hospitals that
solved a higher percentage of the value from the highest benefit/ cost individual problems, or problem
types, or solution types performed worse than other hospitals.
Model 5 in Tables 2 and 3 shows the results from testing H3. There is support for an inverted u-shaped
relationship between number of problems solved and percentage change in perceived improvement
(=.019, p<.01 for average number of problems solved in a work area, =-.001, p<.01 for the square of
ave. number solved). There was no support for a relationship between number solved and readmission.
Model 6 tests H2 and H3 in the same regression. As shown in Table 2 for percentage change in
perceived improvement, H2 is not supported, while H3 is (=.022, p<.05 for ave. number solved; =-
.001, p<.05 for the square of ave. number solved). The results for readmission are similar to those for
perceived improvement, but the relationship between average number solved and readmission appears to
be linear rather than an inverted u (=2.456, p<.05 for % of top80% solved; =-.256, p<.10 for ave.
number solved; squared term NS).
To estimate the number of problems at which the benefit of solving problems begins to decrease, we
created a graph with percentage change in perceived improvement on the y-axis and the number of
problems solved on the x-axis. We estimated percentage change in perceived improvement by using the
average values for the other variables in the equation multiplied by their regression coefficients and
indexing the number of problems solved by 1 and multiplying by its coefficient for the regular term. We
also added in the square of the number of problems multiplied by its coefficient. We followed a similar
procedure for readmissions. As the graphs in Figure 2 show, work areas benefited from solving up to 17
problems, after which percentage change in perceived improvement declined. The relationship between
readmissions and number of problems solved was more linear. To summarize, our results show that
hospitals that solved a higher number of problems, up to 17, had better performance on percentage change
in perceived improvement and readmissions, independent of whether the problems they selected for
solution were the highest impact problems. Solving a higher percentage of the benefit/cost in the top 80 is
associated with worse performance because it is associated with higher rates of readmissions.

20
The percent of problems for which senior managers were assigned responsibility was associated with
perceived improvement (=.313, p<.001 in Model 6). There was no association between this variable and
readmission. Therefore, we excluded it from our models with the outcome variable of readmission.
Insert Table 2 about here
Insert Table 3 about here
Insert Figure 2 about here
4.3. Effect of Problem Characteristics on Selection for Solution Effort (H4-H6)
Models 1 and 2 in Table 4 show the results for H4 to H6. Model 1 tests H4 and H5 using a sample of
1176 problems from 74 work areas in 18 hospitals. The smaller number of hospitals compared with H2
and H3 was due to missing data from some hospitals about the sequence in which the work areas were
visited, which we included as a control variable in these models. The overall regression equation was
significant (Wald Chi2 (22) =46.94, prob>chi2 =.002). H4 was supported in Model 1.Problems with a (1
unit) higher benefit/cost ratio were 16% more likely to be selected for solution efforts (Odds Ratio
(OR)=1.16, p>|z|=.03, 95% CI=1.01 to 1.33). H5 was not supported, as the coefficient for solution cost
was significant, but in the opposite direction. Problems with moderate to expensive anticipated costs were
twice as likely to be selected for solution efforts as inexpensive problems (for moderate cost problems:
OR=2.18, p>|z|=.005, 95%CI=1.27 to 3.76; for expensive problems: OR=2.06, p>|z|=.07, 95%CI = 0.93
to 4.54). Model 2 shows the result of the test for H6, as well as a second test of H4 and H5 that accounts
for ease of solution. H6 was supported (Wald chi2(7)=15.25, prob>chi2=.03). Problems that were 1 unit
more difficult to solve were 45% less likely to be selected for solution efforts (OR=.55, p>|z|=.004,
95%CI=.36 to .83). Note that in this model, the variables for H4 (benefit/cost) and H5 (anticipated cost of
solution) variables are not significant, reducing support for H4 and the negative finding for H5. Managers
are more likely to select easy problems, regardless of cost or expected benefit/cost.
Insert Table 4 about here
4.4. Qualitative Data Analysis
We analyzed the qualitative data to better understand what accounted for success in implementing
MBWA. Although we analyzed data from all 20 hospitals, to draw clearer distinctions we present only the

21
seven top (Table 5) and bottom (Table 6) performing hospitals with respect to percentage change in
perceived improvement. To better display the patterns in the data, we group the better perceived (Table 5)
and worse perceived (Table 6) hospitals together using the multiple-case, conceptually-ordered, matrix
display described by Miles and Huberman (1994). On average, the better perceived hospitals increased
their perceived improvement scores by 13%, while the worse perceived hospitals deteriorated by 7%.
Strength of MBWA implementation (1=weak to 3=strong) significantly differentiated the two groups
(better: ave=2.6, SD=.45; worse: ave=1.4, SD=.48, t test=-4.9, p<.001). Interestingly, variables such as
the number of work areas visited and the number of problems identified did not differ significantly
between the two groups (p values of the two t-tests were both >0.10). Thus, it was not that the worse
perceived hospitals did fewer of the MBWA program components. Instead, the qualitative data suggest
that the managers of the better perceived hospitals valued the learning that was generated by the work
system visits and acknowledged the issues raised by the frontline staff. For example, at Strathfield
Hospital, the most improved hospital in our sample, the COO commented on what she learned by doing
the work system visits. She recalled a site visit to the ER where she observed how difficult it was for the
nurses to prepare medications in the extremely small medication room. She said, “It’s a little thing, but
when you actually see them doing the process, you say, ‘What a minute, that is difficult for them.’”
In contrast, the managers from the worse perceived hospitals were cynical about learning anything
from observing frontline work and were reluctant to act on frontline staff concerns that had not been
through a validation process, such as gathering data from multiple sources, or proving its existence. At
Gerlos Hospital, which was among the worse hospitals, while reviewing the list of problems identified in
the maternity ward, the CFO expressed his skepticism about the validity of the issues raised by frontline
staff. All of the patients’ phone calls were routed through the nursing station, resulting in nurses spending
considerable time routing personal phone calls to patients’ rooms. He stated, “They [the frontline staff]
need to prove first that it [interruptions from having to answer patients’ personal phone calls] is a real
problem.” His skepticism of frontline staff’s concerns illustrated the lack of action taking at Gerlos.
The strength of MBWA implementation strongly correlated with CEOs’ views of their role in patient
safety (=.68, p<.01). On a scale of 1=worst to 3=best, the better perceived hospitals had a higher rating
for CEO role in patient safety than the worse hospitals (better: ave=2.1, SD=.18; worse: ave=1.7, SD=.1, t
test=-2.08, p=.03). In both groups, the CEOs regarded patient safety and their role in the safety effort as
important. Differences between the two groups were subtle. CEOs from the better perceived hospitals
viewed themselves as active members of the team responsible for improving patient safety. In contrast, at
the worse hospitals there was a passive attitude toward improvement efforts. Instead of being actively
engaged in ensuring that the hospital was improving, these CEOs viewed the change process as being in
the hands of other people, either the physicians, the board, or external agencies. For example, at Hamilton

22
General, one of the worse perceived hospitals, the CEO stated, “If I am not a leader speaking out about
patient safety, then the institution is not going to see that as a goal. I have to believe in patient safety and
preach it to the best of my ability.” This quote illustrates passion about his role in speaking about safety,
but not in being an active team member responsible for making changes. There is evidence that his
speaking about safety did not translate into action taking by the organization. The senior managers
delegated responsibility for work system visits to the mid-level managers, and the mid-level managers did
not want to do more visits than their peers. The PI coordinator explained, “It was hard to get a lot of
enthusiasm. As we went through, our volunteers dwindled. If they had done it once, they didn’t want to
go again until everyone else had gone at least once.” The result was that Hamilton General conducted
many work system visits, but only by forcing direct subordinates to do the visits. Without anyone taking
responsibility, the hospital’s performance worsened. A second example of senior manager failure to take
primary responsibility for patient safety comes from St. Francis, another poorly perceived hospital. The
CEO stated, “I let the medical staff handle their business and at the appropriate time I may weigh in and
say, ‘You guys really want to allow this?’” As a final example, the Vice President of Darby Hospital
viewed his hospital’s patient safety performance as being hindered by a weak team of middle managers,
and saw his role in improving patient safety as firing the poor performers. In contrast, at the better
perceived hospitals, the CEO viewed himself or herself as leading the effort, or as an active team member
along with other managers. This is illustrated by the CEO of Springville Hospital, who stated, “I provide
leadership by being involved, informing people, and being responsive when there are safety issues.”
Finally, qualitative coding of prioritization of problems for solution efforts yielded interesting
differences between the two groups. Better performing hospitals tried to fix as many problems as they
could. For example, a nurse at Randolph Regional described the hospital’s process for acting on employee
suggestions, “Any team member who sees something that could prohibit patient safety can submit the
idea, and it gets sent out for review to the applicable departments. It gets voted on and implemented if
they think it is a good idea.” Similarly, at Brookhaven, their safety officer described the senior managers’
views toward the PI program, “Once they [the senior managers] got this list of things that needed to be
addressed, they wanted to address them all. They didn't want to focus on one or two. They just wanted to
do everything. They felt that the staff expected that.”
Hospitals used different strategies to have the capability of addressing many problems. One approach
was to use interim solutions if the best solution required a long-lead time. For example, one of the
problems identified at Hanover Hospital was the configuration of the emergency department waiting
room blocked visibility of patients from the nurses, which was both a patient safety and employee safety
concern. This problem was going to be addressed in the longer term by the planned renovation of the
emergency department, but in the meantime, the hospital added security personnel to the waiting area.

23
Another approach was breaking large, expensive projects into more manageable pieces. Pondview
Hospital, for example, renovated one of its long-term care rooms every few months, which cost $5,000
for a new bed, chair, and tray table, because they could not afford to renovate all of the long-term care
rooms at one time. However, they slowly made progress on the renovation.
Conversely, at many of the hospitals that deteriorated on perceived improvement, an emphasis on
prioritizing problems limited solution efforts. First, at some of these hospitals, prioritization created a
high hurdle for problems to be acknowledged or if they were acknowledged, to be selected for solution
efforts. For example, at Hamilton General, they focused on solving a few items and explained away the
other problems as “unsolvable”. Their PI program liaison said, “Do you want to pick a few items to really
follow up on?” As they discussed the list of problems, she discarded many of them as insolvable. “I think
the main thing is the nursing shortage and not our staffing ratio. We are trying to get in more nurses, but it
is a nationwide shortage, so there is really no solution at present.” Second, the process of prioritizing
problems took significant time and energy away from solution efforts, or was a process step that stalled
forward progress. Thus, for the seven worse perceived hospitals, the process of prioritization became a
stumbling block for action. For example, during our visit to Tall Pines Community Hospital, they
commented that they planned on having a meeting in two weeks to discuss priorities, assign
accountability and follow up with staff to let them know what is planned. To our knowledge, the
problems were never resolved. Similarly, at St. Frances Medical Center their safety officer stated, “We
identified what the priorities were, based on feedback from the departments, supervisors and some of the
staff. I sent that information back to the department so they would know certain things had a timeline that
we had assigned. I don’t know if there has been follow-through since then or not.”
Insert Table 5 about here
Insert Table 6 about here
5. Discussion and Implications
In this paper, we investigated critical success factors for one type of FLPI, MBWA, which has recently
begun being deployed by hospitals. Using data from 68 US hospitals, we found that participating in the
MBWA program did not improve average performance according to nurses’ perceptions any more than
not participating. There also was no difference between the two groups on rates of readmission for
congestive heart failure and pneumonia. Our inability to show results highlights two challenges of using
randomized control trial design for studying PI. First, control organizations can work on improving
performance too. For example, during the study period the Institute for Healthcare Improvement launched

24
a major safety campaign in which many hospitals participated (Berwick et al., 2006). Second, as our
qualitative data suggest, managers’ mental models impact the effectiveness of the treatment.
We also explored critical determinants of successful implementation within the set of 20 MBWA
hospitals. We examined the tradeoff between an orientation toward analysis versus action, i.e., to improve
patient safety by identifying a large number of problems with the goal of solving only the highest
leverage problems versus by solving as many problems as possible. We found that taking action on more
problems identified in the unit was associated with lower readmissions. It was also associated with
increased perceived improvement, up to 17 solved problems per unit, after which the benefit from solving
more problems decreased. We controlled for the amount of money spent on solving problems. It was not
significant, ruling out the alternate explanation that spending more money accounted for better outcomes.
Solving a higher percentage of the high benefit/cost problems was not associated with increased perceived
improvement or with lower readmissions. This may be because there was not a smaller set of individual
problems, type of problem, or solution type that would give a disproportionately high return if solved.
Instead, hospitals needed to resolve around 65% of the problems to get an 80% benefit. Thus, spending
resources to discover and solve high impact problems through programs like MBWA or incident reports,
may not yield anticipated gains. Furthermore, an action orientation was better aligned with how managers
actually selected problems for solution efforts. Our data showed that managers were more likely to select
problems that were easy to solve, rather than selecting problems with a high benefit/cost.
Our qualitative analysis sheds insight into senior managers’ inclination for action. We find that
hospitals with higher perceived improvement scores had senior managers who viewed the MBWA
program as a way to learn valuable information about potential safety issues in their hospital and viewed
themselves as active participants in efforts to improve patient safety. This contrasts with the worse
perceived hospitals where senior leaders’ skepticism about frontline employees’ concerns and a “prove to
me that the problem is worth solving” attitude reduced managers’ willingness to take action, ultimately
hindering success. Thus, our research finds that increasing senior managers’ involvement with FLPI will
not translate into improvement unless they are inclined to take action on identified issues.
5.1. Implications for Theory on Problem Solving
Prior research has found an association between manager involvement and implementation success for
FLPI programs such as 6-sigma (Coronado and Antony, 2002), Scanlon plans (Miles, 1965, White, 1979),
lean (Worley and Doolen, 2006), and TQM (Antony et al., 2002). However, these studies were typically
case studies of a few firms’ successful implementations or a survey used to correlate implementation
success measures with managers’ self-reported involvement with PI. Although these studies establish a
relationship between senior management involvement and implementation success, they provide limited
insight into how to foster manager involvement or why it is associated with success.

25
In our study, we manipulated manager involvement by requiring senior managers to engage in FLPI
by visiting their frontlines to identify and resolve problems. The FLPI literature suggests that seeing
problems in context provides useful information (von Hippel, 1994) that might motivate managers to take
action to resolve problems. We find that managerial involvement was productive for some, but not all
organizations. A possible explanation for our mixed results comes from Miles (1965). He postulated that
managers held one of two beliefs about why employee participation was valuable. One belief was that
employee participation was valuable because interacting with senior managers increased the morale of
frontline staff, but that the actual ideas they generated were unhelpful. The second belief, which was
associated with better performance, was that employee participation was valuable because the ideas raised
by frontline employees were useful. Our qualitative data similarly suggested that managers’ beliefs
moderated the impact of their involvement. Less effective managers seemed to believe that their presence
on the frontlines appeased staff, but produced little meaningful information for improvement purposes.
More effective managers seemed to believe that their interactions with frontline staff yielded valuable
improvement information, and they took action on it. Thus, our study suggests that managers’ beliefs
about the validity of frontline employees’ concerns is an important moderator variable for manager
involvement with FLPI. This implies that rather than designing interventions to increase manager
involvement, it may be critical to first design interventions that surface and modify managers’ beliefs.
Another contribution of our paper is providing evidence that, at least for the hospitals in our study,
improvement ideas raised by frontline staff are roughly of equal importance. Our data suggest that the
landscape of problem benefit/cost is relatively flat. In a flat landscape, local search is beneficial and
expanded search efforts are an unnecessary use of resources (Sommer and Loch, 2004). The implication
is that little is gained from the current focus on increasing reporting of safety incidents (Evans et al.,
2007) because the expanded search is unlikely to yield significantly higher benefit/cost problems. Instead,
hospitals would be better served by deploying limited resources on solving existing problems and
increasing problem-solving capacity. This empirical finding supports mathematical models of PI (Bohn,
2000, Repenning and Sterman, 2002), which show negative dynamics when organizations identify more
problems than they have capacity to solve. It also supports the finding that underlying capabilities explain
differences in organizational improvement (Adler et al., 2003). We leave it to future research to develop
theory on the dynamics of building problem-solving capacity. For example, we suspect that solving
problems increases problem-solving capacity by spreading skills and knowledge through the organization.
If so, rather than viewing problem-solving capacity as a resource that decreases with use, a better analogy
might be a muscle that strengthens with use.
5.2. Implications for Practice

26
Many hospitals’ strategy for improving patient safety is to increase employees’ willingness to report near
misses and errors (Evans, et al., 2007). The underlying beliefs are that (1) increasing the number of
reports enables organizations to conduct trend analysis that will illuminate important problems; and (2)
the majority of the identified issues are of relatively low importance and (3) lower importance problems
can be ignored at little to no cost to the organization. Our results show instead that there is little benefit to
identifying more problems than an organization has the capacity to solve because doing so doesn’t
translate into discovering a higher impact set of issues, and not responding to employees’ suggestions
incurs the cost of inadvertently creating cynical employees who are reluctant to participate in future FLPI
efforts. Some managers in our study expressed the belief that employees would be satisfied with increased
manager visibility on the frontlines of the organization. Our study suggests that employees are not fooled
by managers’ symbolic participation in PI programs. Hospitals should first increase problem solving
capacity, which will enable them to take action on an increased number of reports.
Organizations can increase problem solving capacity through at least three routes. First, organizations
can hire additional staff who are already skilled at PI (Bohn, 2000). Second, existing employees can be
trained on PI techniques. This has the added benefit of developing a common approach and language for
PI (Repenning and Sterman, 2001). Third, using a common approach to resolve problems will create
additional capacity by spreading the techniques to those who interface with these efforts (Repenning and
Sterman, 2001). To be successful, PI needs to be part of the regular work of the organization (Victor et
al., 2000). It is also important to educate managers and employees to expect the “worse before better”
dynamic that occurs when resources get diverted from production to improvement (Repenning and
Sterman, 2001). However, over time performance should improve and capacity increase as employees
become more skilled at PI and contribute more meaningful ideas (Arthur and Aiman-Smith, 2001).
5.3. Conclusions
Understanding the impact of problem solving orientation on performance is important for improving
managers’ ability to improve outcomes. Managers’ beliefs are critical to successful engagement with
frontline staff to improve organizational processes. Managers who value employees’ recommendations
for improvement and take action to resolve the issues have better results than managers who are skeptical
of the value of employees’ suggestions and wait for big impact problems before taking action.
Appendix. Survey Items for the Perceived Improvement
1. Overall, the level of patient safety at this facility is improving.
2. The quality of services I help provide is currently the best it has ever been.
3. The overall quality of service at this facility is improving.
4. We are getting fewer complaints about our work.

27
References
P.S. Adler, Riley, P., Kwon, S.-W., Signer, J., Lee, B., Satrasala, R. 2003. Performance improvement capability: Keys to accelerating performance improvement in hospitals. California Management Review. 45(2) 12-33.
J. Antony, Leung, K., Knowles, G., Gosh, S. 2002. Critical success factors of TQM implementaton in Hong Kong industries. International Journal of Quality and Reliability Management. 19(5) 551-566.
J.B. Arthur, Aiman-Smith, L. 2001. Gainsharing and Organizational Learning: An Analysis of Employee Suggestions over Time. The Academy of Management Journal. 44(4) 737-754.
J.P. Bagian, Lee, C., Gosbee, J., DeRosier, J., Stalhandske, E., Eldridge, N., Williams, R., Burkhardt, M. 2001. Developing and deploying a patient safety program in a large health care delivery system: you can't fix what you don't know about. Joint Commission Journal on Quality and Patient Safety. 27(10) 522-532.
M. Bazerman. 1986. Judgment in Managerial Decision Making. John Wiley & Sons, New York. D.M. Berwick. 1991. Controlling Variation in Health Care: A consultation from Walther Shewhart.
Medical Care. 29(12) 1212-1225. D.M. Berwick, Calkins, D.R., McCannon, C.J., Hackbarth, A.D. 2006. The 100,000 lives campaign:
Setting a goal and a deadline for improving health care quality. Journal of the American Medical Association. 295(3) 324-327.
P.D. Bliese. 2000. Within-group agreement, non-independence, and reliability: Implications for data aggregation and analysis. Jossey-Bass, City.
D. Blumenthal, Kilo, C.M. 1998. A report card on continuous quality improvement. The Milbank Quarterly. 76(4) 625-648.
R. Bohn. 2000. Stop Fighting Fires. Harvard Business Review. 78(4) 82-91. T.Y. Choi, Behling, O.C. 1997. Top managers and TQM success: One more look after all these years. The
Academy of Management Executive. 11(1) 37-47. S. Clarke. 1999. Perceptions of organizational safety: Implications for the development of safety culture.
Journal of Organizational Behavior. 20(2) 185-198. R.B. Coronado, Antony, J. 2002. Critical success factors for the successful implementation of six sigma
projects in organizations. The TQM Magazine. 14(2) 92-99. T.J. Douglas, Fredenall, L.D. 2004. Evaluating the Deming management model of total quality in
services. Decision Sciences. 35(3) 393-422. J.R. Evans, Dean, J.W. 2003. Total Quality: Management, Organization, and Strategy. Thompson. S. Evans, Smith, B., Esterman, A., Runciman, W., Maddern, G., Stead, K., Selim, P., O'Shaughnessy, J.,
Muecke, S., Jones, S. 2007. Evaluation of an intervention aimed at improving voluntary incident reporting in hospitals Quality and Safety in Health Care. 16(3) 169-175.
D.O. Farley, Haviland, A., Champagne, S., Jain, A.K., Battles, J.B., Munier, W.B., Loeb, J.M. 2008. Adverse-event reporting practices by US hospitals: Results of a national survey. Quality and Safety in Health Care. 17(6) 416-423.
C.H. Fine. 1986. Quality improvement and learning in productive systems. Management Science. 32(10) 1301-1315.
A. Frankel, Pratt Grillo, S., Pittman, M., Thomas, E.J., Horowitz, L., Page, M., Sexton, B. 2008. Revealing and resolving patient safety defects: The impact of leadership WalkRounds on frontline caregiver assessments of patient safety. Health Services Research. 43(6) 2050-2066.
K.J. Fryer, Antony, J., Douglas, A. 2007. Critical success factors of continuous improvement in the public sector: A literature review and some key findings. The TQM Magazine. 19(5) 497-517.
28
T.K. Gandhi, Graydon-Baker, E., Huber, C.N., Whittemore, A.D., Gustafson, M. 2005. Closing the loop: Follow-up and feedback in a patient safety program. Joint Commission Journal on Quality and Patient Safety. 31(11) 614-621.
K. Girotra, Terwiesch, C., Ulrich, K.T. 2010. Idea generation and the quality of the best idea. Management Science. 56(4) 591-605.
K.B. Hendricks, Singhal, V.R. 2001. Firm characteristics, total quality management, and financial performance. Journal of Operations Management. 19(3) 269-285.
Institute of Medicine. 1999. To Err Is Human: Building a Safer Health System. Committee on Quality of Health Care in America, Washington, DC National Academy Press.
C.W. Johnson. 2003. How will we get the data and what will we do with it then? Issues in the reporting of adverse healthcare events. Quality and Safety in Health Care. 12(Suppl II) ii64-ii67.
J.M. Juran, Godfrey, A.B., Hoogstoel, R.E., Schilling, E.G. 1999. Juran's Quality Handbook. McGraw Hill, New York.
D.-O. Kim. 2005. The Benefits and Costs of Employee Suggestions under Gainsharing. Industrial and Labor Relations Review. 58(4) 631-652.
L.J. Krajewski, Ritzman, L.P., Malhotra, M.K. 2010. Operations Management: Processes and Supply Chains. Prentice Hall, Upper Saddle River, NJ.
G. Laffel, Blumenthal, D. 1989. The case for using industrial quality management science in health care organizations. JAMA(262) 2869.
J.R. Landis, Koch, G.G. 1977. The measurement of observer agreement for categorical data. Biometrics. 33(1) 159-174.
L.L. Leape. 2002. Reporting of adverse events. New England Journal of Medicine. 347(20) 1633-1638. L.L. Leape, Berwick, D.M., Clancy, C.M., Conway, J., Gluck, P., Guest, J., Lawrence, D., Morath, J.M.,
O'Leary, D., O'Neill, P.H., Isaac, T. 2009. Transforming healthcare: a safety imperative. Quality and Safety in Health Care. 18 424-428.
J.P. MacDuffie. 1997. The Road to Root Cause: Shop-Floor Problem-Solving at Three Auto Assembly Plants. Management Science. 43(4) 479-502.
J.G. March. 1991. Exploration and Exploitation in Organizational Learning. Organization Science. 2(1) 71-87.
K.L. McFadden, Henagan, S.C., Gowen III, C.R. 2009. The patient safety chain: Transformational leadership's effect on patient safety culture, initiatives, and outcomes. Journal of Operations Management.
C.E. Milch, Salem, D.N., Pauker, S.G., Lundquist, T.G., Kumar, S., Chen, J. 2006. Voluntary electronic reporting of medical errors and adverse events. Journal of General Internal Medicine. 21(2) 165-170.
M.B. Miles, Huberman, A.M. 1994. Qualitative data analysis: an expanded sourcebook. Sage, Thousand Oaks, CA.
R.E. Miles. 1965. Human relations or human resources. Harvard Business Review. 43(4) 148-157. E.W. Morrison, Phelps, C.C. 1999. Taking charge at work: Extrarole efforts to initiate workplace change.
Academy of Management Journal. 42(4) 403-419. A. Mukherjee, Lapre, M., van Wassenhove, L.N. 1998. Knowledge driven quality improvement.
Management Science. 44(11) S35-S49. T. Nolan, Schall, M.W., Berwick, D.M., Roessner, J. 1996. Breakthrough series guide: Reducing delays
and waiting times throughout the healthcare system. Institute for Healthcare Improvement, Boston, MA.
J. Nunnally. 1967. Psychometric Theory. McGraw-Hill, New York. T.J. Peters, Waterman, R.H., Jr. 2004. In Search of Excellence: Lessons from America's Best-Run
Companies. HarperCollins Publishers. T.C. Powell. 1995. Total quality management as competitive advantage: A review and empirical study.
Strategic Management Journal. 16(1) 15-37.

29
P.J. Pronovost, Miller, M.R., Wachter, R.M. 2006. Tracking progress in patient safety: An elusive target. Journal of the American Medical Association. 296(6) 696-699.
P.J. Pronovost, Weast, B., Bishop, K., Paine, L., Griffith, R., Rosenstein, B.L., Kidwell, R.P., Haller, K.B., Davis, R. 2004. Senior executive: Adopt-a-work unit: A model for safety improvement. Joint Commission Journal of Quality Improvement. 30(2) 59-68.
S. Rabe-Hesketh, Everitt, B. 2004. A Handbook of Statistical Analysis using Stata. Chapman & Hall/ CRC Press, Boca Raton, FL.
S. Rabe-Hesketh, Skrondal, A. 2005. Multilevel and Longitudinal Modeling using Stata. StataPress, College Station, Texas.
J. Reason. 1990. Human Error. Cambridge University Press, New York, NY. N.P. Repenning, Sterman, J.D. 2001. Nobody ever gets the credit for fixing problems that never
happened: Creating and sustaining process improvement. California Management Review. 43(4) 64.
N.P. Repenning, Sterman, J.D. 2002. Capability traps and self-confirming attribution errors in the dynamics of process improvement. Administrative Science Quarterly. 47(2) 265-295.
S. Singer, Gaba, D., Falwell, A., Lin, S., Hayes, J.E., Baker, L.C. 2009. Patient Safety Climate in 92 US Hospitals: Differences by Work Area and Discipline. Medical Care. 47(1) 23-31.
E.J. Sobo, Sadler, B.L. 2002. Improving organizational communication and cohesion in a health care setting through employee-leadership exchange. Human Organization. 61(3) 277-287.
S.C. Sommer, Loch, C.H. 2004. Selectionism and Learning in Projects with Complexity and Unforeseeable Uncertainty. Management Science. 50(10) 1334-1347.
R. Stata. 1989. Organizational learning - the key to management innovation. Sloan Management Review. 30(2) 63-74.
StataCorp. 2007. xtmelogit. Stata Press, City. G.N. Stock, McFadden, K.L., Gowen Iii, C.R. 2007. Organizational culture, critical success factors, and
the reduction of hospital errors. International Journal of Production Economics. 106(2) 368-392. A. Strauss, Corbin, J. 1998. Basics of Qualitative Research. Techniques and Procedures for Developing
Grounded Theory. Sage Publications, Thousand Oaks, CA. W.A. Taylor, Wright, G.H. 2003. A longitudinal study of TQM implementation: Factors influencing
success and failure. Omega. 31 97-111. C. Terwiesch, Ulrich, K.R. 2009. Innovation Tournaments: Creating and Selecting Exceptional
Opportunities. Harvard Business School Press, Boston, MA. C. Terwiesch, Xu, Y. 2008. Innovation contests, open innovation, and multiagent problem solving.
Management Science. 54(9) 1529-1543. E.J. Thomas, Sexton, J.B., Neilands, T.B., Frankel, A., Helmreich, R.L. 2005. The effect of executive
walk rounds on nurse safety climate attitudes: A randomized trial of clinical units. BMC Health Services Research. 5(28).
A.L. Tucker. 2007. An Empirical Study of System Improvement by Frontline Employees in Hospital Units. Manufacturing and Service Operations Management. 9(4) 492-505.
A.L. Tucker, Edmondson, A.C. 2003. Why hospitals don't learn from failures: Organizational and psychological dynamics that inhibit system change. California Management Review. 45(2) 1-18.
A. Tversky, Kahneman, D. 1984. Rational Choice and the Framing of Decisions. Journal of Business. 59(4) S251-S278.
B. Victor, Boynton, A., Stephens-Jahng, T. 2000. The effective design of work under total quality management. Organization Science. 11(1) 102-117.
E. von Hippel. 1994. "Sticky information" and the locus of problem solving: Implications for innovation. Management Science. 40(4) 429-440.
R.M. Wachter. 2009. Hospital incident reporting systems: Time to slay the beast San Francisco, CA. R.M. Wachter. 2010. Patient safety at ten: Unmistakable progress, troubling gaps. Health Affairs. 29(1)
163-173.
30
B.J. Weiner, Shortell, S.M., Alexander, J. 1997. Promoting clinical involvement in hospital quality improvement efforts: The effects of top management, board, and physician leadership. Health Services Research. 32(4) 491-510.
J.K. White. 1979. The Scanlon plan: Causes and correlates of success. Academy of Management Journal. 22(2) 292-312.
J.M. Worley, Doolen, T.L. 2006. The role of communication and management support in a lean manufacturing implementation. Management Decision. 44(2) 228-245.
M.E. Zellmer-Bruhn. 2003. Interruptive events and team knowledge acquisition. Management Science. 49(4) 514-528.
D. Zohar, Luria, G. 2003. The use of supervisory practices as leverage to improve safety behaviour: a cross-level intervention model. Journal of Safety Research. 34(5) 567-577.

31
Figure 1. (1a) Example Pareto Chart: Distribution of benefit/cost of individual problems on a typical unit and (1b-d) histograms of the percentages
that a unit needed to solve to capture 80% of the cumulative benefit/cost (n=93 work areas)
1a. Example of a Pareto Chart for Individual Problems for One Work Area 1b. Histogram for Individual Problems
1c. Histogram for Types of Problems 1d. Histogram for Types of Solutions
0
0.2
0.4
0.6
0.8
1
1.2
0
2
4
6
8
10
1 2 3 4 5 6 7 8 9 10 11 12 13 14 15
% of Cumulative Benefit/Cost
Benefit/Cost
Rank Order of Problems
Hosp 47, Unit 42 Benefit/Cost Ratio for Individual Problems
Lightly shaded = problem was not solvedSolid = Problem was solveddashed line = Not in Top 80%
Need to solve 67% of the problems to get 81% cumulative benefit
05
10
15
20
25
Fre
que
ncy
.4 .5 .6 .7 .8%of indiv problems needed to be solved to get 80% of cum exp profitability
01
02
03
0F
req
uenc
y
.2 .4 .6 .8 1%of problem categories needed to be solved to get 80% of cum exp profitability
05
10
15
20
25
Fre
que
ncy
.2 .4 .6 .8%of solution categories needed to be solved to get 80% of cum exp profitability

32
Figure 2. Graphs of the relationship between number of problems solved in a work area and performance
Table 1. Means, Standard Deviations, Minimum, Maximum, and Pairwise Correlations for Hospital-Level Variables (n=20)
Mean SD Min Max 1 2 3 4 5 6 7 8 9 10
1. Perceived Improvement 2% 10% -16% 32% 2. Readmission (Ave Std PNM and CHF) 0.17 0.87 -1.26 1.79 0.04 3. % Top80 Ind Probs 58% 31% 0% 92% 0.27 0.04 4. % Not Top80 Ind Probs 55% 26% 14% 89% 0.33 -0.14 0.79* 5. % Top80 Prob Types 57% 29% 4% 89% 0.25 0.03 1.0* 0.81* 6. % Not Top80 Prob Types 55% 35% 0% 96% 0.39 -0.03 0.80* 0.90* 0.77* 7. % Top80 Sol Types 57% 30% 0% 92% 0.29 0.06 1.0* 0.82* 0.99* 0.82* 8. % Not Top80 Sol Types 55% 29% 0% 90% 0.29 -0.21 0.86* 0.92* 0.86* 0.85* 0.85* 9. Ave Num Solved in WA 8.95 6.39 0.50 28.50 0.18 0.13 0.49* 0.54* 0.50* 0.51* 0.54* 0.36 10. % Sr Mgr Assigned 17% 31% 0% 100% 0.21 0.37 -0.23 -0.28 -0.25 -0.13 -0.24 -0.22 -0.32 11. Ave Solution Effectiveness 5.85 1.40 1.00 7.75 0.03 0.27 0.46* 0.35 0.45* 0.42 0.43 0.52* 0.15 0.30
-0.1-0.08-0.06-0.04-0.02
00.020.040.060.080.1
1 3 5 7 9 11 13 15 17 19 21 23 25 27 29% Change
Number of Problems Solved in a Work Area
% Change in Perceived Improvement
-1.5
-1
-0.5
0
0.5
1
1.5
2
1 3 5 7 9 11 13 15 17 19 21 23 25 27 29
Average Standardized Readmission
Rates
Number of Problems Solved in the WA
Standardized Readmission Rates for CHF and PNM
* Holding other variables constant at their avearage values and multiplying by their regression equation coefficients

33
Table 2. Regression Analysis Results Outcome Variable: Percentage Change in Perceived Improvement Model 1 Model 2 Model 3 Model 4 Model 5 Model 6 H1 H2 H2 H2 H3 H2 & H3 Intervention Hospital (1=yes, 0=no) 0.020 (0.029) % of total Cum. Benefit/ Cost solved from the Top 80% Individual Problems
-0.047 (0.116)
-0.151 (0.116)
% of total Cum. Benefit/ Cost solved from the NOT Top 80% Individual Problems
0.191^ (0.099)
0.174 (0.098)
% of total Cum. Benefit/cost solved from the top 80% Problem Types
0.007 (0.098)
% of total Cum. Benefit/cost solved from the NOTtop 80% Problem Types
0.098^ (0.051)
% of total Cum. Benefit/cost solved from the top 80% Solution Types
-0.001 (0.115)
% of total Cum. Benefit/cost solved from the NOTtop 80% Solution Types
0.128 (0.126)
Ave number of problems solved in a work area
0.019** (0.006)
0.022* (0.009)
Ave number of problems solved in a work area squared
-0.001** (0.000)
-0.001* (0.000)
% of Problems in a work area that a C-Suite level person was responsible for solving
0.299** (0.074)
0.261* (0.113)
0.283** (0.095)
0.291* (0.111)
0.313***(0.071)
Ave solution effectiveness -0.012 -0.014 -0.017 -0.018* -0.017^ (0.012) (0.012) (0.013) (0.008) (0.008) Not-For-Profit (1=yes, 0 = no) 0.054*
(0.022)
Constant -0.033^ -0.020 0.018 0.023 -0.011 -0.040 (0.020) (0.047) (0.050) (0.055) (0.053) (0.040) Observations 68 20 20 20 20 20 Adjusted R-squared 0.01 0.40 0.35 0.34 0.43 0.44 F test F(2,65) =
2.94^ F (4,15) =
6.97** F (4,15) =
2.89^ F(4, 15) =
3.26* F(4,15)= 5.57**
F(6,13)= 8.69***
Robust standard errors in parentheses *** p<0.001, ** p<0.01, * p<0.05, ^ p<0.10

34
Table 3. Regression Analysis Results with Outcome Variable: Average Standardized Readmission Rates for Congestive Heart Failure and Pneumonia 2005 Model 1 Model 2 Model 3 Model 4 Model 5 Model 6 H1 H2 H2 H2 H3 H2 & H3 Intervention Hospital (1=yes, 0=no)
0.188 (0.219)
% of total Cum. Benefit/ Cost solved from the Top 80% Individual Problems
1.129 (0.821)
2.456* (0.814)
% of total Cum. Benefit/ Cost solved from the NOT Top 80% Individual Problems
-1.530^ (0.745)
-1.096 (0.804)
% of total Cum. Benefit/cost solved from the top 80% Problem Types
1.482^ (0.724)
% of total Cum. Benefit/cost solved from the NOTtop 80% Problem Types
-1.368* (0.565)
% of total Cum. Benefit/cost solved from the top 80% Solution Types
1.693 (1.177)
% of total Cum. Benefit/cost solved from the NOTtop 80% Solution Types
-1.930* (0.858)
Ave number of problems solved in a work area
-0.064 (0.076)
-0.256^ (0.136)
Ave number of problems solved in a work area squared
0.001 (0.002)
0.006 (0.003)
RN Hours/ Patient -.021 -0.094* -0.135** -0.083^ -0.117* -0.129* (.020) (0.037) (0.041) (0.041) (0.047) (0.044) Major Teaching Hospital (1=yes, 0=no)
0.673* (0.263)
1.097* (0.405)
1.230* (0.420)
0.857^ (0.402)
1.514* (0.692)
1.975** (0.620)
Constant 0.063 1.230 1.421^ 1.059 1.702^ 2.023* (0.243) (0.787) (0.753) (0.830) (0.848) (0.812) Observations 66 19 19 19 19 19 Adjusted R-squared 0.07 0.24 0.28 0.28 0.23 0.36 F test F(3,62)=
2.48^ F(4,14)=
4.42* F(4,14)=
4.27* F(4,14)=
3.21* F(4,14)=
3.06^ F(6,12)=
3.62* Robust standard errors in parentheses *** p<0.001, ** p<0.01, * p<0.05, ^ p<0.10

35
Table 4. Odds Ratios from Mixed-Effects Logistic Regression: Predicting Which Problems Get Selected for Improvement Efforts by Benefit/cost, Cost of Solution, and Difficulty of Solution Model 1 Model 2 Variable Odds Ratio Odds Ratio Problem identified during a Safety Forum 1.910* (0.512) Problem identified during Work Visit & Safety Forum 5.002* (3.248) Problem Identified during Both 1.322 (.678) Problem Type: Task Mgmt 0.203** (0.110) Problem Type: Other 0.161** (0.096) Problem Type: Task Mgmt or Other .163* (.133) Sequence Order in Which Work Area was Visited 0.759^ .866 (0.116) (0.169) Benefit/Cost 1.159* 1.042 (0.079) (.134) Moderate Cost of Solving 2.182** 1.562 (0.606) (.705) Expensive Cost of Solving 2.060^ 2.211 (0.831) (1.382) Difficulty of Implementation .548** (.115) Non significant control variables for work area, problem type, and number of problems identified
Omitted from table Not included in model
Observations 1176 364 Number of groups (Hospitals) 18 10 Number of Work Areas 74 36 Standard errors in parentheses *** p<0.001, ** p<0.01, * p<0.05, ^ p<0.10

36
Table 5. Qualitative Details about Hospitals that Improved on Perceived Improvement (n=7)
1* 2 3 4 5 6 7 8 9 10 11 12
88 Strathfield 32% 25 Fix all 2.5
"I followed the nurse in the ER and found some very interesting things. Starting with the medication room is too
small for doing work. To look at the patient's chart, she had to put it on the medication dispensing machine. It is
not convenient. It's a little thing, but when you actually see them doing the process, you say, 'Wait a minute, that is
difficult for them.'" (COO) 14% 65% 5 10.6 9.2
34 Randolph Regional 16% 281
Fix all cost effective ideas 2
We went to the OR/ PACU safety forum and there were at least 48 people there. The VP of the hospital, VP of
Nursing, Unit manager and CMO were there. 28% 76% 4 21.3 4.5
39 Hanover
University 15% 370 Fix all that they can;
Interim solutions 3
"A quality committee of the board also got very involved with the intervention and made sure capital was available to respond to the concerns raised." (CEO) 0 11% 14 14.9 11.1
100 Pondview 9% 94
Fix what they can, chip away at some of the expensive
projects 3
CEO met with staff in all departments. He commented, "I talk about what we can do to improve the hospital, what can we do to make their job easier. Anything I need to
know about what is going on. That has been the best thing that I have done as far as patient safety. We sit down and
talk about things and learn a lot." 21% 82% 5 12.4 7.4
119 Brook- haven 8% 238 Fix all 2.5
They conducted system visits and two safety forums, which were facilitated by the CEO. They held meetings for each
shift and got about 15 people to attend each meeting. 58% 44% 2 15.0 12.5
32 Springville 5% 638 Fix all that they can:
Interim solutions 3 When we did our town meeting in the ICU, we had a full
house, like 20 people. (Quality Manager) 25% 64% 7 23.1 16.6
65 Farmside 5% 104 Prioritize, but fix as
many as they can 2
"Our people came to two forums and were very open. We had good discussion. It is not easy for us to schedule, but
we do it about 4 to 6 weeks out." (Risk Manager) 88% 19% 4 9.5 8.0 *Column headings 1 Hospital identification number; 2 Pseudonym for hospital; 3 Percent change in nurse perception of improvement; 4 Number of Beds in the hospital; 5 Qualitative coding of prioritization process; 6 Qualitative coding of strength of implementation of the PI program (1= weak, 2 = moderate, 3 = strong); 7 Illustrative quote of strength of implementation of the PI program; 8 Average percent of problems in a work area identified from safety forums; 9 Average percent of problems in a work area identified from work system visits; 10 Number of work areas that received the PI program activities (and identified >= 5 problems); 11 Average number of problems identified in a work area; 12 Average number of solved problems in a work area
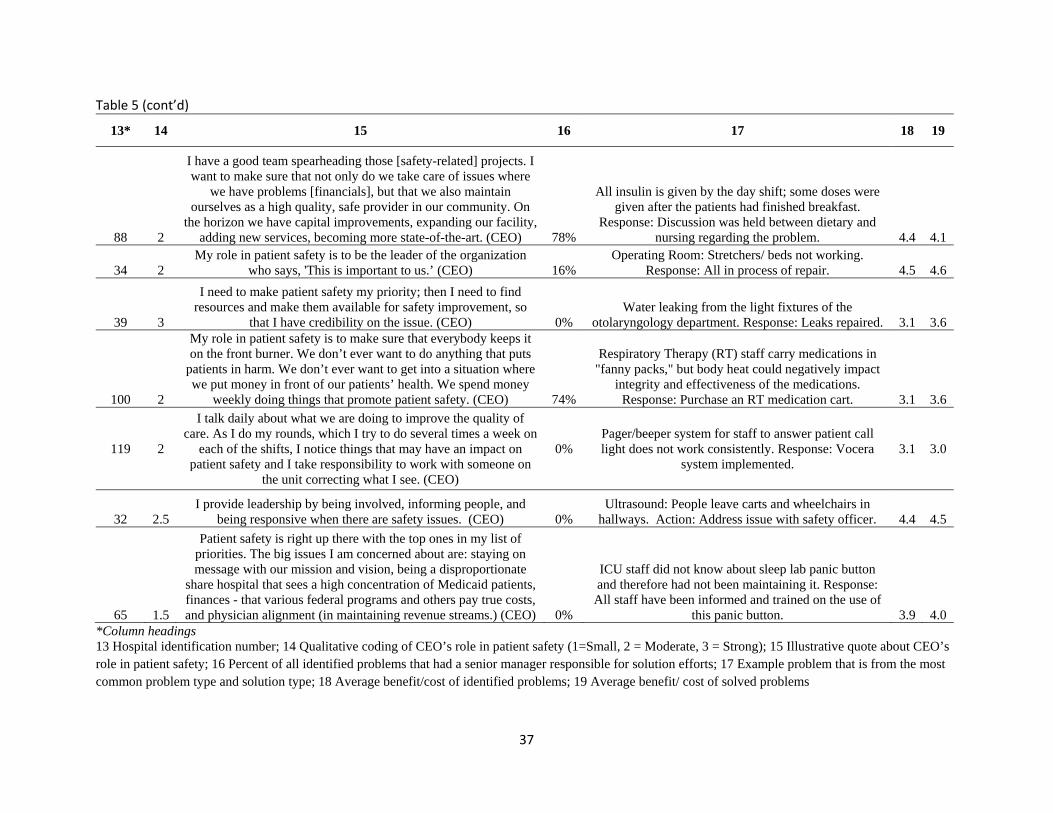
37
Table 5 (cont’d)
13* 14 15 16 17 18 19
88 2
I have a good team spearheading those [safety-related] projects. I want to make sure that not only do we take care of issues where
we have problems [financials], but that we also maintain ourselves as a high quality, safe provider in our community. On
the horizon we have capital improvements, expanding our facility, adding new services, becoming more state-of-the-art. (CEO) 78%
All insulin is given by the day shift; some doses were given after the patients had finished breakfast.
Response: Discussion was held between dietary and nursing regarding the problem. 4.4 4.1
34 2 My role in patient safety is to be the leader of the organization
who says, 'This is important to us.’ (CEO) 16% Operating Room: Stretchers/ beds not working.
Response: All in process of repair. 4.5 4.6
39 3
I need to make patient safety my priority; then I need to find resources and make them available for safety improvement, so
that I have credibility on the issue. (CEO) 0% Water leaking from the light fixtures of the
otolaryngology department. Response: Leaks repaired. 3.1 3.6
100 2
My role in patient safety is to make sure that everybody keeps it on the front burner. We don’t ever want to do anything that puts
patients in harm. We don’t ever want to get into a situation where we put money in front of our patients’ health. We spend money
weekly doing things that promote patient safety. (CEO) 74%
Respiratory Therapy (RT) staff carry medications in "fanny packs," but body heat could negatively impact
integrity and effectiveness of the medications. Response: Purchase an RT medication cart. 3.1 3.6
119 2
I talk daily about what we are doing to improve the quality of care. As I do my rounds, which I try to do several times a week on
each of the shifts, I notice things that may have an impact on patient safety and I take responsibility to work with someone on
the unit correcting what I see. (CEO)
0% Pager/beeper system for staff to answer patient call light does not work consistently. Response: Vocera
system implemented. 3.1 3.0
32 2.5 I provide leadership by being involved, informing people, and
being responsive when there are safety issues. (CEO) 0% Ultrasound: People leave carts and wheelchairs in
hallways. Action: Address issue with safety officer. 4.4 4.5
65 1.5
Patient safety is right up there with the top ones in my list of priorities. The big issues I am concerned about are: staying on message with our mission and vision, being a disproportionate
share hospital that sees a high concentration of Medicaid patients, finances - that various federal programs and others pay true costs, and physician alignment (in maintaining revenue streams.) (CEO) 0%
ICU staff did not know about sleep lab panic button and therefore had not been maintaining it. Response:
All staff have been informed and trained on the use of this panic button. 3.9 4.0
*Column headings 13 Hospital identification number; 14 Qualitative coding of CEO’s role in patient safety (1=Small, 2 = Moderate, 3 = Strong); 15 Illustrative quote about CEO’s role in patient safety; 16 Percent of all identified problems that had a senior manager responsible for solution efforts; 17 Example problem that is from the most common problem type and solution type; 18 Average benefit/cost of identified problems; 19 Average benefit/ cost of solved problems

38
Table 6. Qualitative Details about Hospitals that Deteriorated on Perceived Improvement (n=7)
1* 2 3 4 5 6 7 8 9 10 11 12
144 Darby -3% 388 Only do easy fixes 1 At safety forum on Medical floor, 1 nurse attended,
the same one observed on the work system visit. 0% 100% 4 6.3 4.0
55 Gerlos -4% 77
High hurdle to be prioritized for
solution efforts 1
"Today I told them you were coming and they said, 'She's coming about all those things we didn't do
anything about?'" (ED Director). “They [staff] need to prove first that it is a real problem.” (CFO) 0% 100% 1 12.0 7.0
9 Woodley -4% 230 Prioritization, unclear criteria 2 They did system visits, but not any safety forums. 0% 75% 4 14.5 12.3
105 Tall Pines
Community -6% 98
High burden of proof before issue acknowledged as a
problem 2
The safety forum in the ED was well attended with 15 people. They conducted 2-hour long site visits, with
all 4 executives attending. "We got a ton of information from the system visits and forums in both
areas." (Risk Management Director) 33% 67% 6 7.7 5.8
122 Hamilton General -7% 99
Prioritization based on presumed
feasibility, many intractable issues 1
"It was hard from the beginning to get enthusiasm. Our volunteers dwindled. If they had done it once, they didn't want to go again until everyone else had
gone at least once." PI Coordinator. 13% 89% 4 22.3 12.3
72 St. Francis -9% 112 Prioritization stalls
action 1.5 "Attendance [in the town meetings] has been good.
But follow up has been lacking." (CFO) 25% 63% 5 34.2 2.8
131 Hillside Regional -16% 308
Little prioritization or action 1
The visit we observed was the COO and Quality Improvement Director interviewing a physician. 5% 45% 2 8.0 0.5
*Column headings 1 Hospital identification number; 2 Pseudonym for hospital; 3 Percent change in nurse perception of improvement; 4 Number of Beds in the hospital; 5 Qualitative coding of prioritization process; 6 Qualitative coding of strength of implementation of the PI program (1= weak, 2 = moderate, 3 = strong); 7 Illustrative data of strength of implementation; 8 Average percent of problems in a work area identified from safety forums; 9 Average percent of problems in a work area identified from work system visits; 10 Number of work areas that received the PI program activities (and identified >= 5 problems); 11 Average number of problems identified in a work area; 12 Average number of solved problems in a work area

39
Table 6 (cont’d)
13* 14 15 16 17 18 19
144 2 We are defining our A, B, and C players on our management team. We made some difficult, but necessary changes. (VP)
9% ICU monitors malfunctioning. Response: Purchase new
monitors. 4.0 4.2
55 1.5 What most strongly conveys the importance of patient safety to
healthcare professionals is that I do a lot of rounding. (CEO) 0%
ED staff do not close doors to rooms, creating a privacy issue. Response: Remind staff to close doors.
4.6 5.2
9 2
I am not out there making patient safety, but I set the corporate culture. I have a senior leadership team that has total
responsibility for the facility. The tone is set from the top, we have outstanding support from our board. (CEO)
2% ED Patient was referred to as "2" rather than by name when
speaking with x-ray. Action: Continue to educate staff. 4.5 4.7
105 1.5 I would say we [the health system] have a strong New Year's resolution to focus harder. The jury is still out on whether we
are really genuinely committed. (Senior Vice President) 0%
Patients being transported to cardiac care unit are not always accompanied by RN or attached to a cardiac monitor.
Response: Patient Care Service departments will be notified of the need to re-educate staff.
4.1 4.2
122 1.5 If I am not a leader speaking out about patient safety, then the
institution is not going to see that as a goal. I have to believe in patient safety and preach it to the best of my ability. (CEO)
0% Poor interdepartmental communication on transfers.
Response: Created an interdisciplinary team to revise patient flow procedures.
4.2 4.3
72 2 I let medical staff handle their business and at the appropriate time I may weigh in and say, "You guys really want to allow
this?" (CEO) 4%
Consistency of having patient arm bands on each ED patient. Response: Continue to work with Registration team; RNs
will also make it part of their assessment of patient. 4.4 4.4
131 1.5 We have an interim CEO. One of the things we keep hearing from all of our staff is, "I've been here for 6 years now, and I
am on my 5th administrator." (Safety Officer) 5%
Psych Evaluation room in the Emergency Department. Response: Construction to Emergency Department to
remodel space for Psych Evaluation Patients. 3.3 1.8
*Column headings 13 Hospital identification number; 14 Qualitative coding of CEO’s role in patient safety (1=Small, 2 = Moderate, 3 = Strong); 15 Illustrative quote about CEO’s role in patient safety; 16 Percent of all identified problems that had a senior manager responsible for solution efforts; 17 Example problem that is from the most common problem type and solution type; 18 Average benefit/cost of identified problems; 19 Average benefit/ cost of solved problem
Related Documents