ORIGINAL PAPER Determinants of successful arthropod eradication programs Patrick C. Tobin • John M. Kean • David Maxwell Suckling • Deborah G. McCullough • Daniel A. Herms • Lloyd D. Stringer Received: 17 December 2012 / Accepted: 25 July 2013 / Published online: 27 August 2013 Ó Springer Science+Business Media Dordrecht (outside the USA) 2013 Abstract Despite substantial increases in public awareness and biosecurity systems, introductions of non-native arthropods remain an unwelcomed conse- quence of escalating rates of international trade and travel. Detection of an established but unwanted non- native organism can elicit a range of responses, including implementation of an eradication program. Previous studies have reviewed the concept of erad- ication, but these efforts were largely descriptive and focused on selected case studies. We developed a Global Eradication and Response DAtabase (‘‘GER- DA’’) to facilitate an analysis of arthropod eradication programs and determine the factors that influence eradication success and failure. We compiled data from 672 arthropod eradication programs targeting 130 non-native arthropod species implemented in 91 countries between 1890 and 2010. Important compo- nents of successful eradication programs included the size of the infested area, relative detectability of the target species, method of detection, and the primary feeding guild of the target species. The outcome of eradication efforts was not determined by program costs, which were largely driven by the size of the infestation. The availability of taxon-specific control tools appeared to increase the probability of eradica- tion success. We believe GERDA, as an online database, provides an objective repository of infor- mation that will play an invaluable role when future eradication efforts are considered. Keywords Detection Á Eradication Á Invasive species management Á Non-native pests Introduction Despite increased attention and enhanced regulatory efforts, non-native organisms continue to become P. C. Tobin (&) Forest Service, U.S. Department of Agriculture, Northern Research Station, Morgantown, WV 26505, USA e-mail: [email protected] J. M. Kean AgResearch Limited, Ruakura Research Centre, East Street, Private Bag 3115, Hamilton 3240, New Zealand D. M. Suckling Á L. D. Stringer The New Zealand Institute for Plant & Food Research Limited, Private Bag 4704, Christchurch 8140, New Zealand D. M. Suckling Á L. D. Stringer Plant Biosecurity Cooperative Research Centre, Canberra, ACT, Australia D. G. McCullough Departments of Entomology and Forestry, Michigan State University, 243 Natural Science Building, East Lansing, MI 48824, USA D. A. Herms Department of Entomology, Ohio Agricultural Research and Development Center, The Ohio State University, 1680 Madison Ave., Wooster, OH 44691, USA 123 Biol Invasions (2014) 16:401–414 DOI 10.1007/s10530-013-0529-5

Welcome message from author
This document is posted to help you gain knowledge. Please leave a comment to let me know what you think about it! Share it to your friends and learn new things together.
Transcript
ORIGINAL PAPER
Determinants of successful arthropod eradication programs
Patrick C. Tobin • John M. Kean • David Maxwell Suckling •
Deborah G. McCullough • Daniel A. Herms • Lloyd D. Stringer
Received: 17 December 2012 / Accepted: 25 July 2013 / Published online: 27 August 2013
� Springer Science+Business Media Dordrecht (outside the USA) 2013
Abstract Despite substantial increases in public
awareness and biosecurity systems, introductions of
non-native arthropods remain an unwelcomed conse-
quence of escalating rates of international trade and
travel. Detection of an established but unwanted non-
native organism can elicit a range of responses,
including implementation of an eradication program.
Previous studies have reviewed the concept of erad-
ication, but these efforts were largely descriptive and
focused on selected case studies. We developed a
Global Eradication and Response DAtabase (‘‘GER-
DA’’) to facilitate an analysis of arthropod eradication
programs and determine the factors that influence
eradication success and failure. We compiled data
from 672 arthropod eradication programs targeting
130 non-native arthropod species implemented in 91
countries between 1890 and 2010. Important compo-
nents of successful eradication programs included the
size of the infested area, relative detectability of the
target species, method of detection, and the primary
feeding guild of the target species. The outcome of
eradication efforts was not determined by program
costs, which were largely driven by the size of the
infestation. The availability of taxon-specific control
tools appeared to increase the probability of eradica-
tion success. We believe GERDA, as an online
database, provides an objective repository of infor-
mation that will play an invaluable role when future
eradication efforts are considered.
Keywords Detection � Eradication � Invasive
species management � Non-native pests
Introduction
Despite increased attention and enhanced regulatory
efforts, non-native organisms continue to become
P. C. Tobin (&)
Forest Service, U.S. Department of Agriculture, Northern
Research Station, Morgantown, WV 26505, USA
e-mail: [email protected]
J. M. Kean
AgResearch Limited, Ruakura Research Centre, East
Street, Private Bag 3115, Hamilton 3240, New Zealand
D. M. Suckling � L. D. Stringer
The New Zealand Institute for Plant & Food Research
Limited, Private Bag 4704, Christchurch 8140,
New Zealand
D. M. Suckling � L. D. Stringer
Plant Biosecurity Cooperative Research Centre, Canberra,
ACT, Australia
D. G. McCullough
Departments of Entomology and Forestry, Michigan State
University, 243 Natural Science Building, East Lansing,
MI 48824, USA
D. A. Herms
Department of Entomology, Ohio Agricultural Research
and Development Center, The Ohio State University,
1680 Madison Ave., Wooster, OH 44691, USA
123
Biol Invasions (2014) 16:401–414
DOI 10.1007/s10530-013-0529-5
established in new regions, primarily as a result of the
increasing volume and shifting patterns of interna-
tional travel and trade (Aukema et al. 2010; Hulme
et al. 2008; Levine and D’Antonio 2003; Reichard and
White 2001). Many countries maintain border biose-
curity systems designed to detect and intercept species
arriving through trade and travel routes before these
organisms can become established. However, the
sheer volume of global trade and travel, and the
diversity of invaders, makes it inevitable that some
species will evade detection at ports-of-entry, and a
portion of those species will become established
(Brockerhoff et al. 2006; Liebhold et al. 2012;
National Research Council 2002; Work et al. 2005).
When a non-native species is detected, consequent
management options range from taking no action to
implementing an eradication effort. The concept of
eradication is beguiling; it suggests a final and
permanent solution to the threat of an invader. In
practice, however, the deliberate extirpation of a target
species can be challenging, both biologically and
economically (Myers et al. 2000; Popham and Hall
1958). Moreover, because propagule pressure tends to
be positively associated with establishment success
(Drake and Lodge 2006; Lockwood et al. 2005;
Simberloff 2009), successful eradication of a target
species could be ephemeral if propagule pressure is
not mitigated.
Past work has highlighted a number of conditions
thought to be critical for an eradication program to be
successful (e.g., Brockerhoff et al. 2010; Dahlsten and
Garcia 1989; Hoffmann et al. 2011; Knipling 1966;
Myers et al. 2000; Pluess et al. 2012a; Pluess et al.
2012b; Simberloff 2003; Simberloff et al. 2005).
Attributes include the ability to detect, identify and
monitor an invader, understanding the potential risks
and impacts posed by the invader, and having the tools
to respond rapidly and effectively. Policy related
attributes include the authority to intervene or take
action on public and privately-owned lands, procure-
ment of necessary funds, and the commitment and
political will exhibited by affected stakeholders and
the public in support of the eradication effort. As a
result of these collectively complex and daunting
requirements, and the notoriety of a few spectacularly
failed attempts, the scientific and regulatory commu-
nity has often viewed eradication with pessimism
(e.g., Dahlsten 1986; Dahlsten and Garcia 1989;
Myers et al. 1998; Whitten and Mahon 2005).
Despite an often negative perception of the viability
of eradication efforts, the long-term benefits of
successful eradication typically outweigh the costs of
the program (Brockerhoff et al. 2010). A dispassionate
analysis of the factors that have influenced the success
of eradication programs could have tremendous
practical utility and serve to inform and improve the
decision-making process. In this paper, we sought to
assess the importance and quantify the roles of various
factors that affect eradication success of non-native
arthropods by using a global database comprised of
successful and failed eradication programs.
Previous reviews of attempts to eradicate non-
native pest species have been largely descriptive and
consist of either narratives of selected programs or
generalized examples (e.g., Dahlsten and Garcia 1989;
Graham and Hourrigan 1977; Myers et al. 1998;
Myers et al. 2000; Popham and Hall 1958). In a recent
quantitative study, Pluess et al. (2012a) used General-
ized Linear Mixed Models to analyze a database of
136 eradication campaigns against a variety of terres-
trial invertebrates, plants, and plant pathogens. They
reported that local campaigns were more likely to
succeed than regional or national programs. Other
factors, including the level of biological information
available about the target species, insularity, and
reaction time did not significantly influence the rate of
eradication success. In a subsequent classification tree
analysis based upon 173 eradication campaigns,
reaction time was identified as an important determi-
nant of eradication success, along with habitat type
and target taxon (Pluess et al. 2012b). The authors also
highlighted the dearth of information on program costs
and other socioeconomic factors in their data, which
are generally considered to play major roles in the
outcome of eradication campaigns.
To expand our understanding of the determinants of
successful eradication programs, we acquired data
from 672 eradication programs against arthropods that
were undertaken around the world between 1890 and
2010. These data were compiled into a web-based
Global Eradication and Response DAtabase (‘‘GER-
DA,’’ Kean et al. 2013) that we developed and hereby
present. Although GERDA also currently contains
data on eradication programs targeting other taxa (e.g.,
nematodes, fungi, molluscs), we focused our analysis
specifically on arthropods to avoid comparing taxa
that differ vastly in their respective biology and
invasion ecology. In addition to the current analysis
402 P. C. Tobin et al.
123
presented in this paper, a long term goal of GERDA is
to provide a repository to facilitate the ongoing
collection and transfer of knowledge among biosecu-
rity practitioners and the scientific community.
Materials and methods
Compilation of data
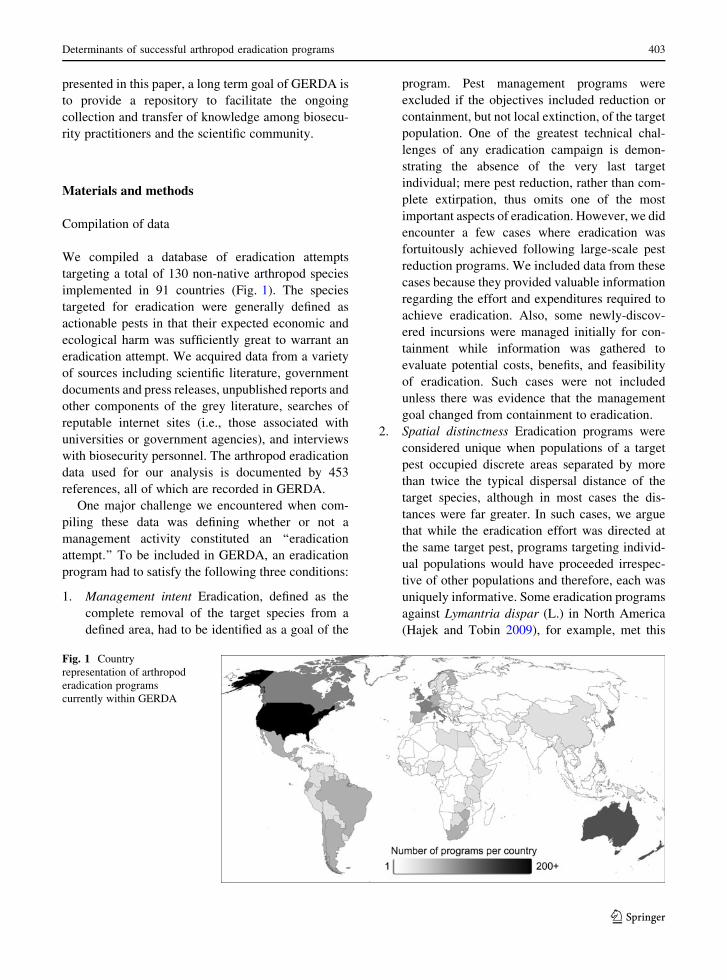
We compiled a database of eradication attempts
targeting a total of 130 non-native arthropod species
implemented in 91 countries (Fig. 1). The species
targeted for eradication were generally defined as
actionable pests in that their expected economic and
ecological harm was sufficiently great to warrant an
eradication attempt. We acquired data from a variety
of sources including scientific literature, government
documents and press releases, unpublished reports and
other components of the grey literature, searches of
reputable internet sites (i.e., those associated with
universities or government agencies), and interviews
with biosecurity personnel. The arthropod eradication
data used for our analysis is documented by 453
references, all of which are recorded in GERDA.
One major challenge we encountered when com-
piling these data was defining whether or not a
management activity constituted an ‘‘eradication
attempt.’’ To be included in GERDA, an eradication
program had to satisfy the following three conditions:
1. Management intent Eradication, defined as the
complete removal of the target species from a
defined area, had to be identified as a goal of the
program. Pest management programs were
excluded if the objectives included reduction or
containment, but not local extinction, of the target
population. One of the greatest technical chal-
lenges of any eradication campaign is demon-
strating the absence of the very last target
individual; mere pest reduction, rather than com-
plete extirpation, thus omits one of the most
important aspects of eradication. However, we did
encounter a few cases where eradication was
fortuitously achieved following large-scale pest
reduction programs. We included data from these
cases because they provided valuable information
regarding the effort and expenditures required to
achieve eradication. Also, some newly-discov-
ered incursions were managed initially for con-
tainment while information was gathered to
evaluate potential costs, benefits, and feasibility
of eradication. Such cases were not included
unless there was evidence that the management
goal changed from containment to eradication.
2. Spatial distinctness Eradication programs were
considered unique when populations of a target
pest occupied discrete areas separated by more
than twice the typical dispersal distance of the
target species, although in most cases the dis-
tances were far greater. In such cases, we argue
that while the eradication effort was directed at
the same target pest, programs targeting individ-
ual populations would have proceeded irrespec-
tive of other populations and therefore, each was
uniquely informative. Some eradication programs
against Lymantria dispar (L.) in North America
(Hajek and Tobin 2009), for example, met this
Fig. 1 Country
representation of arthropod
eradication programs
currently within GERDA
Determinants of successful arthropod eradication programs 403
123
criterion. Conversely, an eradication program
against Teia anartoides (Walker) in New Zealand
(1999–2006) that targeted three population epi-
centers was considered as one program because
each epicenter was close enough to be within the
dispersal capability of male moths (Suckling et al.
2007). It was not always possible to deduce from
the available data whether one large eradication
program constituted several independent local
programs; in these cases, we considered the
program as a single effort. It was also sometimes
difficult to determine if eradication programs
against the same taxon in adjoining geopolitical
areas (e.g., across US or Australian states) repre-
sented distinct and unique programs. In these
cases, programs were included separately when
separate management agencies were responsible
for the program, or considered as one program
when the management action was conducted
under the auspices of a common agency.
3. Temporal distinctness The International Stan-
dards for Phytosanitary Measures Number 9
(Food and Agricultural Organization of the
United Nations 2006) specifies that ‘‘the mini-
mum period of time of pest freedom to verify
eradication will vary according to the biology of
the pest, but should take into consideration factors
such as sensitivity of detection technology, ease
of detection, life cycle of the pest, climatic effects,
and efficacy of treatment.’’ Under current inter-
national standard practices, declaration of eradi-
cation of most pests can be made provided that
suitable surveillance activity has resulted in no
subsequent detections for at least 2–3 times the
normal generational time of the target taxon. We
followed this convention whenever there was
doubt about whether a subsequent detection in a
previously treated area constituted a new invasion
or an unsuccessful eradication.
GERDA data fields
A summary of data fields included in GERDA is
presented in Table 1. Most fields were not challenging
to populate since they were based on various taxo-
nomic details and basic life history of the target taxon,
geographic location of the eradication program and its
climate, and details of the agency responsible for the
program. Data that were more difficult to obtain, at
times resulting in missing data fields, included the
method of initial detection and specific treatments or
tactics used for eradication. The most challenging data
to acquire were the program costs. Even when
expenditures were reported, they often only included
direct costs of the treatment and not the total program
cost (i.e., personnel, pre-treatment environmental
assessments, public outreach and meetings). Of the
672 arthropod eradication programs used in this
analysis, adequate cost data were available for 141
programs.
Standardization of costs
All cost data were converted to the 2005 United States
dollar (USD) to allow for a direct comparison of
eradication programs worldwide. To do this, historical
annual average exchange rates were first used to
convert local currencies to the USD (Officer 2011);
USD amounts were then standardized to the year 2005.
Various inflation rates can be applied for this
standardization, some of which will inflate early years
more than others (Williamson 2011). We used the
GDP deflator, which ‘‘represents the mean price of all
the goods and services produced in the economy’’
(Williamson 2011). Since eradication programs
involve a combination of fixed and variable costs for
labor and materials, the GDP deflator likely provides a
more accurate index of cost than other methods, which
generally rely on either the price of household
consumables or the cost of unskilled labor.
Data analysis
Many of the quantitative and categorical variables
from Table 1 were used in our analyses, and we
merged some data fields or categories within a given
data field. This reduced the frequency of missing data
and minimized redundancy when categories within the
field were conceptually equivalent. For example,
when considering the size of the eradication program,
we used the maximum extent of the regulated area, the
maximum area treated, or the larger of the two values
when both fields were populated. Due to the large
number of target species that typically have a univol-
tine lifecycle, we considered species to be either
‘‘univoltine’’ or ‘‘not univoltine.’’ The variables and
their respective categories used in this analysis are
404 P. C. Tobin et al.
123
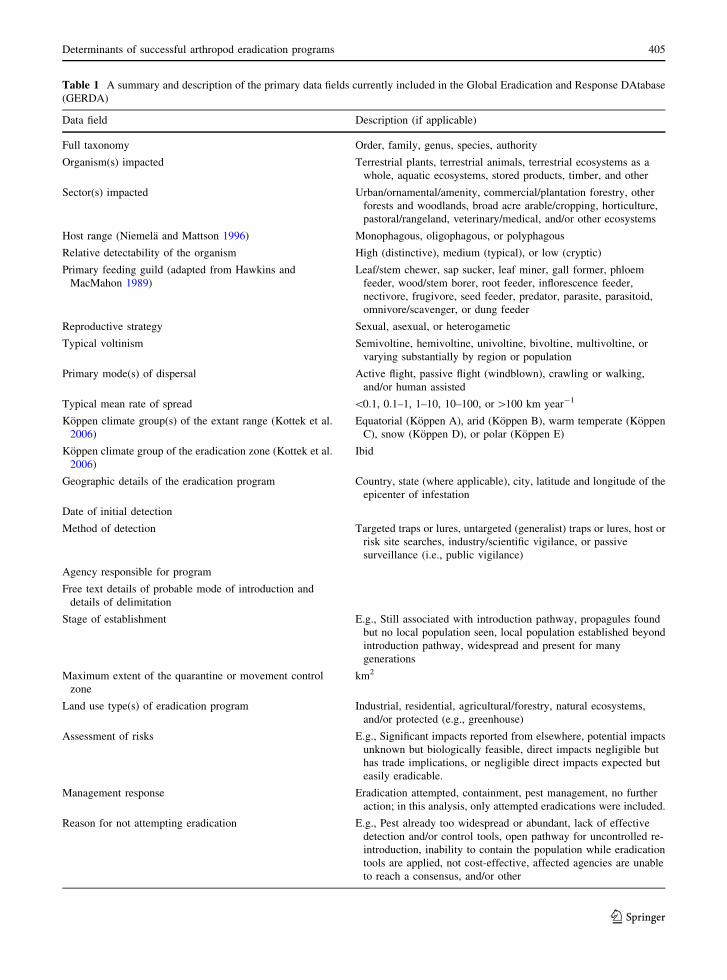
Table 1 A summary and description of the primary data fields currently included in the Global Eradication and Response DAtabase
(GERDA)
Data field Description (if applicable)
Full taxonomy Order, family, genus, species, authority
Organism(s) impacted Terrestrial plants, terrestrial animals, terrestrial ecosystems as a
whole, aquatic ecosystems, stored products, timber, and other
Sector(s) impacted Urban/ornamental/amenity, commercial/plantation forestry, other
forests and woodlands, broad acre arable/cropping, horticulture,
pastoral/rangeland, veterinary/medical, and/or other ecosystems
Host range (Niemela and Mattson 1996) Monophagous, oligophagous, or polyphagous
Relative detectability of the organism High (distinctive), medium (typical), or low (cryptic)
Primary feeding guild (adapted from Hawkins and
MacMahon 1989)
Leaf/stem chewer, sap sucker, leaf miner, gall former, phloem
feeder, wood/stem borer, root feeder, inflorescence feeder,
nectivore, frugivore, seed feeder, predator, parasite, parasitoid,
omnivore/scavenger, or dung feeder
Reproductive strategy Sexual, asexual, or heterogametic
Typical voltinism Semivoltine, hemivoltine, univoltine, bivoltine, multivoltine, or
varying substantially by region or population
Primary mode(s) of dispersal Active flight, passive flight (windblown), crawling or walking,
and/or human assisted
Typical mean rate of spread \0.1, 0.1–1, 1–10, 10–100, or [100 km year-1
Koppen climate group(s) of the extant range (Kottek et al.
2006)
Equatorial (Koppen A), arid (Koppen B), warm temperate (Koppen
C), snow (Koppen D), or polar (Koppen E)
Koppen climate group of the eradication zone (Kottek et al.
2006)
Ibid
Geographic details of the eradication program Country, state (where applicable), city, latitude and longitude of the
epicenter of infestation
Date of initial detection
Method of detection Targeted traps or lures, untargeted (generalist) traps or lures, host or
risk site searches, industry/scientific vigilance, or passive
surveillance (i.e., public vigilance)
Agency responsible for program
Free text details of probable mode of introduction and
details of delimitation
Stage of establishment E.g., Still associated with introduction pathway, propagules found
but no local population seen, local population established beyond
introduction pathway, widespread and present for many
generations
Maximum extent of the quarantine or movement control
zone
km2
Land use type(s) of eradication program Industrial, residential, agricultural/forestry, natural ecosystems,
and/or protected (e.g., greenhouse)
Assessment of risks E.g., Significant impacts reported from elsewhere, potential impacts
unknown but biologically feasible, direct impacts negligible but
has trade implications, or negligible direct impacts expected but
easily eradicable.
Management response Eradication attempted, containment, pest management, no further
action; in this analysis, only attempted eradications were included.
Reason for not attempting eradication E.g., Pest already too widespread or abundant, lack of effective
detection and/or control tools, open pathway for uncontrolled re-
introduction, inability to contain the population while eradication
tools are applied, not cost-effective, affected agencies are unable
to reach a consensus, and/or other
Determinants of successful arthropod eradication programs 405
123
summarized in Table 2. Some variables were trans-
formed using log10 to satisfy assumptions of normality
(Table 2).
We first used logistic regression, using both
forward and backward selection methods indepen-
dently, to develop a subset of variables to explore
further. The binary response variable was eradication
success or failure (Table 2). Eradication programs in
which the outcome was ‘‘in progress’’ or ‘‘unknown’’
were omitted in the logistic regression analysis (167
programs). Once we compiled a subset of variables
through the stepwise technique, we used the likelihood
ratio, G2, to assess variable significance. Odds ratios,
when appropriate, were formed after partitioning G2
into non-significant components (Agresti 1996).
Separately, we used multiple correspondence anal-
ysis to assess the use of control tools by the taxonomic
order of the target species to determine if certain
orders were more frequently targeted with a specific
control tool or set of tools. In this analysis, we focused
on only five of the 13 orders currently included in
GERDA (Coleoptera, Diptera, Hemiptera, Hymenop-
tera, and Lepidoptera), which collectively represented
617 eradication programs. Of the omitted orders, four
contained only 1 or 2 eradication programs, while for
the remaining four orders we lacked sufficient control
tool information. We also used logistic regression to
determine if eradication success differed among these
five orders. Finally, we used least squares regression to
analyze the relationship between the infested area
(km2) and the cost of the program (millions USD),
after normalizing both variables using the log10
transformation. All analyses were conducted in SAS
(1999).
Results
Summary information for all data currently in GER-
DA, including the data presented in this paper, are
Table 1 continued
Data field Description (if applicable)
Start and end dates of eradication program
Free text of monitoring details
Control tool(s) used and number of applications Pesticide, biopesticide, mass trapping, lure and kill, mating
disruption, sterile insect technique, host removal/destruction,
removal by hand, quarantine/movement control, release of natural
enemies, and/or other
Control tool application method E.g., Aerial application, ground application, baits, stem injection,
soil drench, other
Start and end dates of control tool application
Name of the pesticide, biopesticide, or active ingredient
including dose
Area treated km2
Total normalized cost Entered as local currency and year, and automatically normalized to
2005 USD. See materials and methods for more information.
Free text details of how costs were shared among agencies
(if applicable)
Free text of any additional information not covered above
Outcome Eradication confirmed by adequate monitoring, eradication likely
but not confirmed by adequate monitoring (but no additional
reports of detection), eradication declared but subsequent evidence
suggests it actually failed, or failure to eradicate
Free text for evidence of outcome
Free text describing potential reasons for failure
(if applicable)
E.g., budgetary limits, decline in political or social will, unable to
detect or delimit infestations adequately, unable to access or treat
all infestations, failure in control tools, available biological
information was insufficient or inadequate
406 P. C. Tobin et al.
123

available online (Kean et al. 2013); thus, we briefly
summarize some of the characteristics of the database
for arthropods. Of the 672 arthropod eradication
programs considered in this analysis, 395, 110, and
167 were considered to be successful, a failure, or
either in progress or unknown, respectively. The 167
programs either in progress or unknown were com-
prised of 68 species, of which 35 species were
represented by one program, and 61 species were
represented by \5 programs. The remaining 505
programs that were considered to be successful or a
failure were comprised of 111 species.
Considering all 672 arthropod eradication pro-
grams, the most numerically-prevalent orders of target
pests were Diptera (259 cases), Coleoptera (133
cases), Lepidoptera (133 cases), Hymenoptera (61
cases), and Hemiptera (31 cases). The most numeri-
cally prevalent target species were L. dispar dispar
(L.) (73 cases), Ceratitis capitata (Wiedemann) (56
cases), Bactrocera dorsalis Hendel (40 cases), Aedes
aegypti (L.) (33 cases), and Agrilus planipennis
Fairmaire (25 cases). There were 112 target species
for which the number of eradication programs was
\10 and 51 species were targeted by only a single
eradication program. A time series of the number of
eradication programs by the year of commencement is
presented in Fig. 2.
The stepwise regression procedure initially identi-
fied the following variables as potentially significant
predictors of eradication success: infestation size,
method of detection, relative detectability of the
Table 2 Variables from GERDA and their categories used in the logistic regression analysis
Data field Categories used in the analysis
Climate suitability (1) Favorable if the Koppen climate group of the native and non-
native habitats overlapped; otherwise (2) unfavorable
Duration (transformed using log10) Number of years between start and end dates
Host range (1) Monophagous, (2) oligophagous, and (3) polyphagous
Infestation size, km2 (transformed using log10) Maximum extent of the quarantine or movement control zone OR
Area treated OR the larger of the two
Method of detection (1) Host/risk site searches and industry/scientific vigilance, (2)
targeted traps or lures, (3) untargeted traps or lures and passive
surveillance
Mode of spread (1) Active or (2) passive
Number of control tool(s) used by category (1) Pesticide, (2) biopesticide, (3) mass trapping and lure and kill, (4)
host removal and removal by hand, (5) mating disruption, (6) sterile
insect technique, (7) quarantine and movement control, and (8)
release of natural enemies
Primary feeding guild (1) Leaf/stem chewer and leaf miner, (2) root feeder, (3) sap sucker,
(4) phloem feeder and wood/stem borer, (5) frugivore, (6) parasite
and predator, and (7) omnivore/scavenger
Relative detectability of the organism (1) High or (2) low
Typical mean rate of spread Categorical: (1) \1, (2) 1–10, (3) 10–100, or (4) [100 km year-1
Typical voltinism (1) Univoltine or (2) not univoltine
Outcome (response variable) (1) Eradication confirmed or likely eradicated and (2) failure to
eradicate
Fig. 2 Cumulative number of initiated eradication programs,
and when programs were declared to be either successful or a
failure (excluding programs in progress or if the outcome was
not known), 1890–2010. The insert graph represents the total
number of initiated programs on a non-transformed scale
Determinants of successful arthropod eradication programs 407
123

organism, voltinism, program duration, host range,
and primary feeding guild. In a subsequent full model
with this subset of variables, duration and voltinism
were not significant (P [ 0.3). All other variables
were significant (P \ 0.01), and the Hosmer and
Lemeshow lack-of-fit test was not significant
(P = 0.94), suggesting that the full model would not
be improved by the inclusion of additional variables.
Because two species, L. dispar dispar and C. capitata,
accounted for 10.9 and 8.3 % of the arthropod
eradication programs, respectively, we also conducted
our analysis with these two species excluded. In
addition to both being the two most numerically
dominant species, they also provided contrasting case
examples, such as in the commodities affected (forest
vs. agricultural), voltinism (univoltine vs. multivol-
tine), and feeding guild (folivore vs. frugivore).
Following the stepwise regression procedure, the
same variables were observed to be significant in this
reduced dataset with the exception of one variable: the
method of detection was not significant in this reduced
dataset (P = 0.39).
An interesting aspect of these analyses was that the
climate suitability variable was not significant due to
the fact that eradication programs were rarely con-
ducted in the absence of climate suitability. For
example, in 95.1 % of the programs (N = 245
programs) in which we could confidently assign a
Koppen climate group (Kottek et al. 2006) to both the
native habitat of the target species and the habitat
where the eradication program was conducted, the
climate group overlapped. Furthermore, in only two
cases was the level of climate mismatch by more than
one climate group (i.e., Koppen C, warm temperate, to
Koppen D, snow). The lack of climate suitability could
result in a failure to establish following arrival and
preclude the need to initiate eradication. Exceptions to
this pattern could include pest species that can exploit
climate-controlled environments, such as green-
houses, homes, and other structures.
The area of the eradication program, or infestation
size, was both a significant predictor of the probability
of eradication success (P \ 0.01, N = 255, Fig. 3a)
and program costs (P \ 0.01, N = 141, Fig. 3b).
Regarding eradication success, the odds of a successful
eradication program were 1.3 times less likely (95 %
CI 1.1–1.5) for every log10 increase in area. In terms of
cost, we observed a positive relationship between area
and cost [log10(costs, millions USD) = -0.254 ?
0.416(log10(area, km2)); R2 = 0.52]. We also illustrate
separately eradication attempts against non-native
forest insects for which our cost data were particularly
robust (Fig. 3b). We did not observe a significant effect
of outcome (i.e., success or failure, P = 0.87), or a
significant interaction effect between area and out-
come (P = 0.87) on costs. Moreover, we also did not
detect a significant effect of target group (forest insects
whose programs were dominated by those against L.
dispar, versus other arthropods whose programs were
dominated by those against C. capitata and B. dorsalis,
P = 0.53), or a significant interaction effect between
target group and area on costs (P = 0.86). Thus, the
primary driver of program costs appears to be the area
of the infestation and not the target group or the
eventual program outcome.
The probability of eradication success was signif-
icantly affected by both the relative detectability of the
target species (P \ 0.01, Fig. 4a) and, when consid-
ering all species, the method of detection (P \ 0.01,
Fig. 4b). Because more than 95 % of target species in
GERDA were classified as having either a high or low
detectability, we excluded species that were classified
Log10 area, km2
1
0.75
0.5
0.25
0P{E
rad
icat
ion
su
cces
s}
(A)
(B)
Lo
g10
cost
, mill
ion
US
D
0.001 0.1 10 1,000 100,000
Fail
1,000
100
10
1
0.1
0.01
0.001
Success
s
(A)
(B)
Fig. 3 Relationship between area of the infestation and the
probability of eradication success (a), and the program costs (b).
In a, the size of the circle reflects the number of cases, while the
solid and dashed lines are the predicted probabilities and 95 %
confidence intervals from logistic regression, respectively. In b,
the solid line is the least squares regression fit to all arthropod
data
408 P. C. Tobin et al.
123

as having a medium detectability. Generally, species
were classified as having high detectability if a
sensitive monitoring tool exists, such as traps baited
with species-specific pheromones. Eradication pro-
grams were 8.1 times (95 % CI 3.9–16.6) more likely
to be successful if the target species was classified as
having a high, rather than a low, detectability. With
regard to the method of detection, programs that used
active methods, such as targeted traps using species-
specific semiochemical attractants, were 4.6 times
(95 % CI 1.4–15.4) more likely to result in eradication
success than programs relying on passive detection
methods (e.g., non-specific traps or public vigilance),
and 26.8 times (95 % CI 9.6–74.6) more likely to
result in eradication success than programs relying on
host and habitat searches (Fig. 4b). Interestingly,
programs that relied on passive detection methods
were 5.9 times (95 % CI 2.0–17.4) more likely to be
successful than those that relied on host or habitat
searches. When L. dispar dispar and C. capitata were
excluded, we did not detect a significant difference in
the method of detection.
Host range of the target species significantly
affected the probability of eradication success
(P \ 0.01, Fig. 5a). Polyphagous species were 6.2
times (95 % CI 3.6–10.6) more likely to be eradicated
than the combined group of oligophagous and
monophagous species, both of which were not signif-
icantly different (P = 0.06). This observation could
be reflected by the number of programs that have
targeted the polyphagous species L. dispar, C. capi-
tata, and B. dorsalis, which collectively accounted for
169 programs. These species also represent high
impact plant pests that are often aggressively targeted
for eradication when detected, which could explain the
higher success rate of eradication programs against
polyphagous species.
The primary feeding guild also significantly
affected the probability of eradication success
(P \ 0.01, Fig. 5b). Folivores and frugivores formed
Detectability Method of detection
Nu
mb
er o
f p
rog
ram
s (A) (B)125
100
75
50
25
0
a
bb c
aSuccesses
Failures
Successes
Failures
Fig. 4 Number of eradication programs that were successes or
failures based upon the relative detectability of the target species
(a) or the method of detection (b) (cf. Tables 1, 2). Different
lowercase letters in a, b denote significant differences in
eradication success (P \ 0.05)
Host Range
300
200
100
0
Nu
mb
er o
f p
rog
ram
s
b
a
b
100
75
50
25
0
(A) (B)
Primary Feeding Guild
a ab
b b b
c
Successes
Failures
Successes
Failures
Fig. 5 Number of eradication programs that were successes or failures based upon the host range (a) and primary feeding guild (b) of
the target species. Different lowercase letters in a, b denote significant differences in eradication success (P \ 0.05)
Determinants of successful arthropod eradication programs 409
123

a non-significant group (P = 0.09) and had the highest
rate of eradication success, followed by parasites, root
feeders, sap suckers, and omnivores, which formed a
separate non-significant group (P = 0.97). Wood and
subcortical phloem feeders had the lowest rate of
eradication success and were 14.6 (95 % CI 7.1–30.1)
and 6.2 (95 % CI 3.1–12.1) times less likely to be
successfully eradicated than the combined group of
folivores and frugivores, and the combined group of
parasites, root feeders, sap suckers, and omnivores,
respectively (Fig. 5b).
A multiple correspondence analysis revealed that in
arthropod eradication programs the use of specific
control tools differed significantly among orders
(P \ 0.01). When partitioning v2 & 89 % of the
variation was explained by two dimensions (Fig. 6).
The most pronounced associations between insect
orders and the control tools used for eradication were
the use of mass trapping or lure and kill, and the sterile
insect technique against Dipteran pests, and mating
disruption and biopesticides against Lepidopteran
pests (Fig. 6). Host removal and destruction were
most often associated with programs against Coleop-
tera and Hemiptera (Fig. 6). The probability of
successful eradication also differed significantly
among orders (P \ 0.01). For eradication programs
targeting Lepidoptera (N = 115 programs) and Dip-
tera (N = 189), for which there were specific avail-
able control tools, 86.1 and 86.8 %, respectively, were
considered successful. In contrast, 71.4, 68.2, and
59.1 % of programs targeting Hymenoptera (N = 49
programs), Hemiptera (N = 22), and Coleoptera
(N = 88), respectively, were considered to be suc-
cessful. We recognize that reporting bias in favor of
successful programs almost certainly exists, which
could alter the proportion of programs deemed
successful. However, given the extensive sample size
and the fact that many control tools are linked to the
biology of the targeted organisms, we contend that the
varying levels of success observed for different orders
is likely a robust pattern.
Discussion
The increase in eradication attempts beginning in the
late 1980s (Fig. 2) could partially reflect an increased
number of arrivals of non-native species (Levine and
D’Antonio 2003; Liebhold et al. 2006; McCullough
et al. 2006; Work et al. 2005). It could also reflect
increased awareness of the inimical effects of some
non-native species and technological advances lead-
ing to new or improved control tactics and strategies.
Only a minority of introduced species cause sub-
stantial economic, social and ecological harm (Auk-
ema et al. 2010; Mack et al. 2000), and eradication is
rarely warranted unless the impacts of the non-native
species are expected to be severe. We acknowledge
sampling bias could exist in the temporal pattern of
data compiled in GERDA given that more recent data
trap
sit
DIPT
LEPIDmdbiopest
pest
HYMEN
HEMIPCOLEOPremoval
Dimension 1 (46.9%)
Dim
ensi
on
2 (
42.3
%) biocon
quar
Nu
mb
er o
f p
rog
ram
s
Control tactic
(A) (B)
Fig. 6 a Multiple correspondence analysis of control tools used
by order of target pests, showing variation primarily across two
dimensions. The percentages indicate the percent variation
explained by each respective dimension. b Corresponding plot
of the number of programs, by order, that have used the
indicated control tools. Orders are shown in uppercase (DIPT,
Diptera; LEPID, Lepidoptera; HYMEN, Hymenoptera; HEMIP,
Hemiptera; and COLEOP, Coleoptera) and control tools are
shown in lowercase (sit, sterile insect technique; trap, mass
trapping or lure and kill; biopest, biopesticide; md, mating
disruption; pest, pesticide; removal, host or habitat removal;
biocon, release of natural enemies; and quar, quarantine and
movement control)
410 P. C. Tobin et al.
123
are easier to locate and compile, and that successful
programs could be reported more often due to the
reluctance to publicize failures. We contend, however,
that the extensive database, which encompasses 672
arthropod eradication programs, is robust enough for
this initial analysis of the primary drivers of eradica-
tion success and failure.
For a small proportion of potentially high impact,
non-native pests, eradication could be cost-effective
and the preferred management option for govern-
ments, providing that certain conditions are met. Our
analysis, which encompassed many examples of
eradication efforts targeting arthropod pests with
diverse life history strategies, has revealed some
consistent patterns. For example, the probability of
eradication success declines as the area that is infested
increases (Fig. 3a), a pattern that is both intuitive and
reflected by prior observations (Liebhold and Tobin
2006; Pluess et al. 2012b; Rejmanek and Pitcairn
2002). Conversely, the cost of the eradication effort
increases over the area that is infested (Fig. 3b), which
likewise is intuitive. Quantification of the general
relationships between the area of an infestation and the
predicted probability of eradication success and pro-
gram costs should be useful in future planning efforts
when eradication is considered as a management
response.
High relative detectability of the target species is a
primary component of successful eradication pro-
grams (Fig. 4a). With regard to L. dispar eradication
efforts, for example, there was a dramatic increase in
eradication programs in North America following the
identification and synthesis of the L. dispar sex
pheromone (Bierl et al. 1970), which is now routinely
used in L. dispar monitoring programs (Tobin et al.
2012). It is extraordinarily challenging to manage any
species when the ability to detect the target species is
limited, especially in an eradication program. Further-
more, the failure to detect small incipient populations
caused by the lack of a sensitive survey tool could
result in the infestation being larger when finally
detected, and therefore, less likely to be successfully
eradicated in an economically feasible manner (Fig. 3,
Epanchin-Niell et al. 2012).
It was not unsurprising that the relative detectability
of target pests was an important factor in eradication
success. Programs that can rely on active methods of
detection, such as species-specific lures and trapping
devices, are most likely to be successful (Fig. 4b),
reinforcing the importance of detection systems to
improve invasive species management (Government
Accountability Office 2006; Jarrad et al. 2011; Sim-
berloff et al. 2005). Probability of success was also
greater when passive means of detection, such as
through private citizens reporting pest presence, were
used rather than pre-emptively searching sites consid-
ered to be at high risk of species arrival (e.g., nurseries,
industrial sites, sawmills), which was least likely to be
associated with eradication success (Fig. 4b). This
finding could reflect an overall increase in public
awareness of non-native pests and the effectiveness of
public relationship campaigns coordinated by univer-
sities, biosecurity and resource management agencies.
The lack of significance of the method of detection
when L. dispar dispar and C. capitata are excluded
from the analyses could reflect the historical target
trapping for these two pests. The availability of
relatively inexpensive detection traps, and control
tools, for both these high risk pests enables countries to
maintain trapping networks and respond to detection
with an eradication program. This likely explains the
numerical dominance of L. dispar dispar and C.
capitata. When these two species were excluded from
the analyses, detection method was no longer signif-
icant, which could reflect insufficient variation in the
method of detection represented by the remaining
programs.
The detectability of target pests undoubtedly plays
an important role at the end of an eradication program
because it largely determines whether the apparent
absence of a target pest represents eradication success.
The reappearance of a species thought to be extinct,
referred to as the ‘‘Lazarus effect’’ (Flessa and
Jablonski 1983; Morrison et al. 2007), and has been
implicated, for example, in the recurrence of C.
capitata detections in California (Carey 1996; but see
Liebhold et al. 2006). The inability to detect the last
few remaining individuals of a population targeted for
eradication, even in the face of aggressive detection
efforts has important consequences in the analysis and
interpretation of data from eradication programs. We
attempted to minimize misclassifications of eradica-
tion success, such as those due to the Lazarus effect, by
using a criterion of apparent absence of at least 2–3
times the normal generational time of the target taxon.
Any remaining misclassifications would largely lie
with the most numerically dominant taxa within
GERDA; however, our results were largely unaffected
Determinants of successful arthropod eradication programs 411
123
when the two most dominant species, L. dispar dispar
and C. capitata, were excluded, suggesting that
potential Lazarus effects have not greatly affected
our conclusions.
The importance of detectability could also be
reflected in the primary feeding guild of the target
species (Fig. 5). Damage caused by externally feeding
arthropod folivores or frugivores is likely to be noticed,
whereas more clandestine species that feed within their
host plant are likely to escape detection for some time,
at least during the early stages of the invasion process.
Subcortical wood and phloem feeders have been a
particularly challenging group to eradicate, reflecting
their cryptic life history, often low detectability, and
the lack of control options available for use over large
areas. Research to develop better detection technology
and control options for these organisms should be a
priority, particularly given the sharp increase in new
detections of non-native subcortical borers over the
past 20–30 years (Langor et al. 2009; Aukema et al.
2010). The use of ‘‘citizen scientists’’ has also gener-
ated much interest with regard to a diversity of
ecological research topics (see the recent special issue
introduced by Henderson 2012). For example, in New
Zealand, approximately half of all new plant pest
detections are reported by the general public (Froud
et al. 2008), and it is believed that every known
Anoplophora glabripennis (Motschulsky) infestation
in the USA was discovered by private citizens. The
engagement of citizen scientists to aid in surveys for
invasive pests is a promising management tool that
deserves more attention (e.g., Beetle Busters 2012;
Crall et al. 2010; Ingwell and Preisser 2011).
The ability to use taxon-specific tools in an
eradication program also appears to be an important
determinant of eradication success. Analysis of the
current GERDA database reveals that Diptera and
Lepidoptera had the highest rate of eradication success
and both were strongly associated with more specific
control tools, such as mass trapping, lure and kill, and
the sterile insect technique (Diptera), or mating
disruption and biopesticides formulated with the use
of taxon-specific entomopathogens (Lepidoptera). In
contrast, more general methods, such as host and
habitat removal, tended to be associated with orders
that have recorded less eradication success. Host-
specific tactics could also benefit from wider societal
acceptance if they are associated with fewer undesir-
able effects on the environment and to non-target
organisms. The use of multiple tactics, especially
those that are species-specific, that can act synergis-
tically to decrease the target population could also lead
to greater eradication success (Blackwood et al. 2012;
Suckling et al. 2012).
We highlighted factors that are critical determi-
nants of successful arthropod eradication programs,
which should assist in the development of improved
management responses to non-native species. Also,
because we envision GERDA (Kean et al. 2013) as an
online repository for eradication program data, the
addition of new data could facilitate future analyses
that provide greater insight into factors affecting the
outcome of eradication programs. Indeed, since this
manuscript was initially submitted, an additional 57
eradication programs and 25 non-native arthropod
species that were not previously included have now
been entered into GERDA. The inclusion of cost data
for eradication programs, failed programs, and control
tools used in the effort would greatly facilitate future
analyses. Identifying constraints and determinants of
success can provide a basis for prioritizing and
enhancing future eradication attempts. Moreover, we
anticipate that GERDA will help to inform biosecurity
practitioners and the larger scientific community by
providing rapid access to the experiences of others in
the decision making process.
Acknowledgments This work was conducted as part of a
working group, ‘‘Applying population ecology to strategies for
eradicating invasive forest insects,’’ supported by the National
Center for Ecological Analysis and Synthesis (http://www.
nceas.ucsb.edu/), a Center funded by NSF (Grant No. EF-
0553768), the University of California, Santa Barbara, the State
of California and the USDA Forest Service, Eastern Forest
Environmental Threat Assessment Center, Asheville, North
Carolina. We are very grateful to the numerous colleagues and
biosecurity practitioners who assisted in the compilation of data
on their respective eradication programs. We thank Laura
Blackburn (USDA Forest Service) for technical assistance. We
also acknowledge support from New Zealand’s Better Border
Biosecurity research program (b3nz.org) and an Australian
Government’s Cooperative Research Centre (www.pbcrc.com.
au). We are grateful to three anonymous reviewers for con-
structive comments.
References
Agresti A (1996) An introduction to catagorical data analysis.
John Wiley and Sons, Inc., New York, NY
Aukema JE, McCullough DG, Von Holle B et al (2010) His-
torical accumulation of nonindigenous forest pests in the
continental US. Bioscience 60:886–897
412 P. C. Tobin et al.
123
Beetle Busters (2012). USDA animal and plant health inspection
service. http://beetlebusters.info/. Accessed 23 October
2012
Bierl BA, Beroza M, Collier CW (1970) Potent sex attractant of
the gypsy moth: its isolation, identification and synthesis.
Science 170:87–89
Blackwood JC, Berec L, Yamanaka T et al (2012) Bioeconomic
synergism between tactics for insect eradication in the
presence of Allee effects. Proc R Soc Biol Sci Ser B
279:2807–2815
Brockerhoff EG, Bain J, Kimberley M et al (2006) Interception
frequency of exotic bark and ambrosia beetles (Coleoptera:
Scolytinae) and relationship with establishment in New
Zealand and worldwide. Can J For Res 36:289–298
Brockerhoff EB, Liebhold AM, Richardson B et al (2010)
Eradication of invasive forest insects: concept, methods,
costs and benefits. N Z J Sci 40(Suppl.):S117–S135
Carey JR (1996) The incipient Mediterranean fruit fly popula-
tion in California: implications for invasion biology.
Ecology 77:1690–1697
Crall AW, Newman GJ, Jarnevich CS et al (2010) Improving
and integrating data on invasive species collected by citi-
zen scientists. Biol Invasions 12:3419–3428
Dahlsten DL (1986) Control of invaders. In: Mooney HA, Drake
JA (eds) Ecology of biological invasions of North America
and Hawaii. Springer-Verlag, New York, pp 275–302
Dahlsten DL, Garcia R (1989) Eradication of exotic pests:
analysis with case histories. Yale University Press, New
Haven
Drake JA, Lodge DM (2006) Allee effects, propagule pressure
and the probability of establishment: risk analysis for
biological invasions. Biol Invasions 8:365–375
Epanchin-Niell RS, Haight RG, Berec L et al (2012) Optimal
surveillance and eradication of invasive species in heter-
ogeneous landscapes. Ecol Lett 15:803–812
Flessa KW, Jablonski D (1983) Extinction is here to stay.
Paleobiology 9:315–321
Food and Agricultural Organization of the United Nations
(2006) International standards for phytosanitary measures
no. 1 to 24. Secretariat of the international plant protection
convention. Food and Agricultural Organization, Rome,
p 291
Froud KJ, Oliver TM, Bingham PC et al (2008) Passive sur-
veillance of new exotic pests and diseases in New Zealand.
In: Froud KJ, Popay IA, Zydenbos SM (eds) Surveillance
for biosecurity: pre-border to pest management. New
Zealand Plant Protection Society, Christchurch, pp 97–110
Government Accountability Office (2006) Invasive forest pests.
Lessons learned from three recent infestations may aid in
managing future efforts. Government Accountability
Office, Report to the Chairman, Committee on Resources,
House of Representatives, GAO-06-353
Graham OH, Hourrigan JL (1977) Eradication programs for the
arthropod parasites of livestock. J Med Entomol
13:629–658
Hajek AE, Tobin PC (2009) North American eradications of
Asian and European gypsy moth. In: Hajek AE, Glare TR,
O’Callaghan M (eds) Use of microbes for control and
eradication of invasive arthropods. Springer, New York,
pp 71–89
Hawkins CP, MacMahon JA (1989) Guilds: the multiple
meanings of a concept. Annu Rev Entomol 34:423–451
Henderson S (2012) Citizen science comes of age. Front Ecol
Environ 10:283
Hoffmann B, Davis P, Gott K et al (2011) Improving ant erad-
ications: details of more successes, a global synthesis and
recommendations. Aliens 31:16–23
Hulme PE, Bacher S, Kenis M et al (2008) Grasping at the routes
of biological invasions: a framework for integrating path-
ways into policy. J Appl Ecol 45:403–414
Ingwell LL, Preisser EL (2011) Using citizen science programs
to identify host resistance in pest-invaded forests. Conserv
Biol 25:182–188
Jarrad F, Barrett S, Murray J et al (2011) Ecological aspects of
biosecurity surveillance design for the detection of multi-
ple invasive animal species. Biol Invasions 13:803–818
Kean J, Tobin P, Lee D et al (2013) Global eradication and
response database. http://b3.net.nz/gerda. Accessed 18
June 2013
Knipling EF (1966) Some basic principles of insect population
suppression and management. Bull Entomol Soc Am
12:7–15
Kottek M, Grieser J, Beck C et al (2006) World Map of the
Koppen-Geiger climate classification updated. Meteorol Z
15:259–263
Langor D, DeHaas L, Foottit R (2009) Diversity of non-native
terrestrial arthropods on woody plants in Canada. Biol
Invasions 11:5–19
Levine JM, D’Antonio CM (2003) Forecasting biological
invasions with increasing international trade. Conserv Biol
17:322–326
Liebhold AM, Tobin PC (2006) Growth of newly established
alien populations: comparison of North American gypsy
moth colonies with invasion theory. Popul Ecol
48:253–262
Liebhold AM, Work TT, McCullough DG et al (2006) Airline
baggage as a pathway for alien insect species invading the
United States. Am Entomol 53:48–54
Liebhold AM, Brockerhoff EG, Garrett LJ et al (2012) Live
plant imports: the major pathway for forest insect and
pathogen invasions of the United States. Front Ecol Envi-
ron 10:135–143
Lockwood JL, Cassey P, Blackburn T (2005) The role of
propagule pressure in explaining species invasions. Trends
Ecol Evol 20:223–228
Mack RN, Simberloff D, Lonsdale WM et al (2000) Biotic
invasions: causes, epidemiology, global consequences, and
control. Ecol Appl 10:689–710
McCullough DG, Work TT, Cavey JF et al (2006) Interceptions
of nonindigenous plant pests at US ports of entry and
border crossings over a 17-year period. Biol Invasions
8:611–630
Morrison SA, Macdonald N, Walker K et al (2007) Facing thedilemma at eradication’s end: uncertainty of absence and
the Lazarus effect. Front Ecol Environ 5:271–276
Myers JH, Savoie A, van Randen E (1998) Eradication and pest
management. Annu Rev Entomol 43:471–491
Myers JH, Simberloff DS, Kuris AM et al (2000) Eradication
revisited: dealing with exotic species. Trends Ecol Evol
15:316–320
Determinants of successful arthropod eradication programs 413
123
National Research Council (2002) Predicting invasions of
nonindigenous plants and plant pests. National Academy
Press, Washington, DC
Niemela P, Mattson WJ (1996) Invasion of North American
forests by European phytophagous insects. Bioscience
46:741–753
Officer LH (2011) Exchange rates between the United States
dollar and forty-one currencies. MeasuringWorth. http://
www.measuringworth.com/exchangeglobal. Accessed 23
October 2012
Pluess T, Cannon R, Jarosık V et al (2012a) When are eradi-
cation campaigns successful? A test of common assump-
tions. Biol Invasions 14:1365–1378
Pluess T, Jarosık V, Pysek P et al (2012b) Which factors affect
the success or failure of eradication campaigns against
alien species? PLoS ONE 7:e48157
Popham WL, Hall DG (1958) Insect eradication programs.
Annu Rev Entomol 3:335–354
Reichard SH, White P (2001) Horticulture as a pathway of
invasive plant introductions in the United States. Biosci-
ence 51:103–113
Rejmanek M, Pitcairn MJ (2002) When is eradication of exotic
pest plants a realistic goal? In: Veitch CR, Clout MN (eds)
Turning the tide: the eradication of invasive species. IUCN,
Gland, pp 94–98
SAS Institute, Inc. (1999) SAS/STAT� user’s guide, Version 8.
SAS Institute, Inc., Cary, NC
Simberloff D (2003) How much information on population
biology is needed to manage introduced species. Conserv
Biol 17:83–92
Simberloff D (2009) The role of propagule pressure in biolog-
ical invasions. Annu Rev Ecol Evol Syst 40:81–102
Simberloff D, Parker IM, Windle PN (2005) Introduced species
policy, management, and future research needs. Front Ecol
Environ 3:12–20
Suckling DM, Barrington AM, Chhagan A et al (2007) Eradi-
cation of the Australian painted apple moth Teia anartoides
in New Zealand: trapping, inherited sterility, and male
competitiveness. In: Vreysen MJB, Robinson AS, Hend-
richs J (eds) Area-wide control of insect pests: from
research to field implementation. Springer, Dordrecht,
pp 603–615
Suckling DM, Tobin PC, McCullough DG et al (2012) Com-
bining tactics to exploit Allee effects for eradication of
alien insect populations. J Econ Entomol 105:1–13
Tobin PC, Bai BB, Eggen DA et al (2012) The ecology, geo-
politics, and economics of managing Lymantria dispar in
the United States. Int J Pest Manag 53:195–210
Whitten M, Mahon R (2005) Misconceptions and constraints.
In: Dyck VA, Hendrichs J, Robinson AS (eds) Sterile insect
technique, principles and practice in area-wide integrated
pest management. Springer, Dordrecht, pp 601–626
Williamson SH (2011) Seven ways to compute the relative value
of a U.S. dollar amount, 1774 to present. MeasuringWorth.
http://www.measuringworth.com/uscompare. Accessed 23
October 2012
Work TT, McCullough DG, Cavey JF et al (2005) Arrival rate of
nonindigenous insect species into the United States through
foreign trade. Biol Invasions 7:323–332
414 P. C. Tobin et al.
123
Related Documents