RESEARCH ARTICLE Determinants of Spatial Behavior of a Tropical Forest Seed Predator: The Roles of Optimal Foraging, Dietary Diversification, and Home Range Defense SUZANNE PALMINTERI 1 *, GEORGE V. N. POWELL 2 , AND CARLOS A. PERES 3 1 RESOLVE, Inc., N. W., Washington, DC 2 World Wildlife Fund, N. W., Washington, DC 3 Centre for Ecology, Evolution, and Conservation, School of Environmental Sciences, University of East Anglia, Norwich, Norfolk, United Kingdom Specialized seed predators in tropical forests may avoid seasonal food scarcity and interspecific feeding competition but may need to diversify their daily diet to limit ingestion of any given toxin. Seed predators may, therefore, adopt foraging strategies that favor dietary diversity and resource monitoring, rather than efficient energy intake, as suggested by optimal foraging theory. We tested whether fine-scale space use by a small-group-living seed predator—the bald-faced saki monkey (Pithecia irrorata)—reflected optimization of short-term foraging efficiency, maximization of daily dietary diversity, and/or responses to the threat of territorial encroachment by neighboring groups. Food patches across home ranges of five adjacent saki groups were widely spread, but areas with higher densities of stems or food species were not allocated greater feeding time. Foraging patterns— specifically, relatively long daily travel paths that bypassed available fruiting trees and relatively short feeding bouts in undepleted food patches—suggest a strategy that maximizes dietary diversification, rather than “optimal” foraging. Travel distance was unrelated to the proportion of seeds in the diet. Moreover, while taxonomically diverse, the daily diets of our study groups were no more species- rich than randomly derived diets based on co-occurring available food species. Sakis preferentially used overlapping areas of their HRs, within which adjacent groups shared many food trees, yet the density of food plants or food species in these areas was no greater than in other HR areas. The high likelihood of depletion by neighboring groups of otherwise enduring food sources may encourage monitoring of peripheral food patches in overlap areas, even if at the expense of immediate energy intake, suggesting that between-group competition is a key driver of fine-scale home range use in sakis. Am. J. Primatol. © 2015 Wiley Periodicals, Inc. Key words: Pitheciines; day path; ranging behavior; foraging; territoriality INTRODUCTION Seasonality of fruit availability is considered to be a primary factor influencing the use of space by tropical forest frugivores, including most primates [e.g., Peres, 1994; Terborgh, 1983; van Schaik et al., 1993]. Species that can exploit seeds or other nutritious, energy-rich foods are argued to be relatively immune to seasonal ripe fruit scarcity faced by most generalized frugivores [Norconk 2011; Norconk and Veres 2011], as immature seeds tend to be highly abundant in both space and time [Boubli, 1999; Norconk and Veres, 2011; Palminteri et al., 2012a]. However, seeds generally contain elevated concentrations of toxins and digestion inhibitors [e.g., fiber, tannins, phenolics, alkaloids; Janzen, 1971; Glander, 1982; Norconk and Conklin-Brittain, 2004], which may require seed predators to diversify their dietary portfolios to avoid overingestion of any given toxin [Bowler and Bodmer, 2011; Glander, 1982; Norconk and Veres, 2011]. Thus, seed special- ists are expected to use their home ranges (HRs) differently than generalized pulp consumers [Nor- conk and Veres, 2011] and diversify their daily diets, Contract grant sponsor: The Gordon and Betty Moore Founda- tion ; contract grant sponsor: CAPES; contract grant number: PVE 004/2012; contract grant sponsor: World Wildlife Fund Correspondence to: Suzanne Palminteri, RESOLVE, Inc., 1255 23rd St., NW, Suite 275, Washington, DC 20037. E-mail: [email protected] Received 10 August 2014; revised 1 March 2015; revision accepted 3 March 2015 DOI: 10.1002/ajp.22407 Published online XX Month Year in Wiley Online Library (wileyonlinelibrary.com). American Journal of Primatology © 2015 Wiley Periodicals, Inc.

Welcome message from author
This document is posted to help you gain knowledge. Please leave a comment to let me know what you think about it! Share it to your friends and learn new things together.
Transcript
RESEARCH ARTICLE
Determinants of Spatial Behavior of a Tropical Forest Seed Predator:The Roles of Optimal Foraging, Dietary Diversification,and Home Range Defense
SUZANNE PALMINTERI1*, GEORGE V. N. POWELL2, AND CARLOS A. PERES3
1RESOLVE, Inc., N. W., Washington, DC2World Wildlife Fund, N. W., Washington, DC3Centre for Ecology, Evolution, and Conservation, School of Environmental Sciences, University of East Anglia, Norwich,Norfolk, United Kingdom
Specialized seed predators in tropical forests may avoid seasonal food scarcity and interspecific feedingcompetition but may need to diversify their daily diet to limit ingestion of any given toxin. Seedpredators may, therefore, adopt foraging strategies that favor dietary diversity and resourcemonitoring, rather than efficient energy intake, as suggested by optimal foraging theory. We testedwhether fine-scale space use by a small-group-living seed predator—the bald-faced saki monkey(Pithecia irrorata)—reflected optimization of short-term foraging efficiency, maximization of dailydietary diversity, and/or responses to the threat of territorial encroachment by neighboring groups.Food patches across home ranges of five adjacent saki groups were widely spread, but areas with higherdensities of stems or food species were not allocated greater feeding time. Foraging patterns—specifically, relatively long daily travel paths that bypassed available fruiting trees and relatively shortfeeding bouts in undepleted food patches—suggest a strategy that maximizes dietary diversification,rather than “optimal” foraging. Travel distance was unrelated to the proportion of seeds in the diet.Moreover, while taxonomically diverse, the daily diets of our study groups were no more species-rich than randomly derived diets based on co-occurring available food species. Sakis preferentially usedoverlapping areas of their HRs, within which adjacent groups sharedmany food trees, yet the density offood plants or food species in these areas was no greater than in other HR areas. The high likelihood ofdepletion by neighboring groups of otherwise enduring food sources may encourage monitoring ofperipheral food patches in overlap areas, even if at the expense of immediate energy intake, suggestingthat between-group competition is a key driver of fine-scale home range use in sakis. Am. J. Primatol.© 2015 Wiley Periodicals, Inc.
Key words: Pitheciines; day path; ranging behavior; foraging; territoriality
INTRODUCTIONSeasonality of fruit availability is considered to
be a primary factor influencing the use of space bytropical forest frugivores, including most primates[e.g., Peres, 1994; Terborgh, 1983; van Schaik et al.,1993]. Species that can exploit seeds or othernutritious, energy-rich foods are argued to berelatively immune to seasonal ripe fruit scarcityfaced by most generalized frugivores [Norconk 2011;Norconk and Veres 2011], as immature seeds tend tobe highly abundant in both space and time [Boubli,1999; Norconk and Veres, 2011; Palminteri et al.,2012a]. However, seeds generally contain elevatedconcentrations of toxins and digestion inhibitors[e.g., fiber, tannins, phenolics, alkaloids; Janzen,1971; Glander, 1982; Norconk and Conklin-Brittain,2004], which may require seed predators to diversifytheir dietary portfolios to avoid overingestion of any
given toxin [Bowler and Bodmer, 2011; Glander,1982; Norconk and Veres, 2011]. Thus, seed special-ists are expected to use their home ranges (HRs)differently than generalized pulp consumers [Nor-conk and Veres, 2011] and diversify their daily diets,
Contract grant sponsor: The Gordon and Betty Moore Founda-tion ; contract grant sponsor: CAPES; contract grant number:PVE 004/2012; contract grant sponsor: World Wildlife Fund
�Correspondence to: Suzanne Palminteri, RESOLVE, Inc., 125523rd St., NW, Suite 275, Washington, DC 20037.E-mail: [email protected]
Received 10 August 2014; revised 1 March 2015; revisionaccepted 3 March 2015
DOI: 10.1002/ajp.22407Published online XX Month Year in Wiley Online Library(wileyonlinelibrary.com).
American Journal of Primatology
© 2015 Wiley Periodicals, Inc.
rather than maximize short-term energy gain[Cunningham and Janson, 2007; Shaffer, 2013], assuggested by optimal foraging theory [Pyke et al.,1977].
As pre-dispersal seed predators, the three larger-bodied Pitheciine genera (Cacajao,Chiropotes, Pith-ecia) have evolved both dental and digestive special-izations for consuming mechanically and chemicallyprotected seeds of immature fruits [Kinzey andNorconk, 1993; Ledogar et al., 2013; Norconk andVeres, 2011]. These specializations may enable themto compete successfully against ripe-fruit specialists[e.g., Boubli, 1999; Marshall and Wrangham, 2007;Norconk, 1996; Peres, 1993] and subsequentlyincrease the relative importance of intraspecificcompetition, which may result in ranging patternsthat favor patrolling and foraging more heavily inareas of HR overlap. Previous work documentingPithecia feeding patterns and HR use supportspredictions of a less seasonal food supply and fewinterspecific competitors [Norconk and Veres, 2011;Peres, 1993; Palminteri et al., 2012a]. For example,groups of bald-faced sakis (Pithecia irrorata) insoutheastern Peru did not change their broad diet,feeding patterns, or their daily travel paths, evenduring periods of independently quantified ripe fruitscarcity [Palminteri et al., 2012a]. Sakismaintained ataxonomically diverse fruit-based diet throughout theyear and group movement patterns that variedindependently of seasonal fruit availability[Palminteri et al., 2012a]. While bald-faced sakisappeared to face minimal interspecific food competi-tion [Palminteri et al., 2012a, 2013], intraspecificcompetition from neighboring groups was potentiallysignificant [cf. Cunninghamand Janson, 2007]. Zonesof home range overlapwere extensive [Palminteri andPeres, 2012], and sakis responded agonistically toneighboring groups [Palminteri et al., 2012a].
Hereweexamine thefine-scaleuse of spacebyfiveadjacent groups of bald-faced sakis, to assess which ofthree foraging hypotheses best explains observedpatterns of HR use of space: (1) maximization ofenergy intake per time spent foraging; (2) dietarydilution of anti-herbivory toxins; or (3) territorialdefense against neighboring groups. Specifically, ifdaily movements and use of space aim to maximizeenergy intake per unit time and foraging effort [e.g.,Charnov, 1976; Schoener, 1971], sakis are expected topreferentially useHR areas withmore abundant foodresources, move between the nearest available foodpatches, and exhibit long residence times at unde-pleted food patches [Pyke et al., 1977; Shaffer, 2013].In contrast, if sakimovements aim to increase dietarydiversity to avoid overingesting specific toxins, theymaybeexpected toexhibit ahighdaily richness of foodspecies, while bypassing adjacent conspecific foodsources, and travel farther on days when seedconsumption is higher [Freeland and Janzen 1974;Shaffer, 2013].Wewould also expect a strong positive
relationship between the number of trees visited andthe number of species consumed on any given day. Ifbetween-group resource defense is a primary deter-minant of foraging patterns, daily movements mayinclude longer daily travel paths that traverse theHRand vary independently of seed intake and a tendencyto spendmore time in HR overlap areas, regardless offood availability, which may indicate territorialdefense.
Primate foraging behavior is complex, and thesehypotheses may not be mutually exclusive or mayapply differently depending on group size or homerange quality and location. In areas where conspe-cifics are the primary source of competition for atemporally abundant resource, movement patternsthat can effectively monitor both food resources andneighboring groups near overlap areas can beexpected to be a key component of a foraging strategy[e.g., Lucas and Waser, 1989; Paton and Carpenter,1984].
METHODSStudy Area
This study took place in a 335-ha conservationarea between the Madre de Dios and Los Amigosrivers in the Madre de Dios department of Peru. Thesite consisted primarily of intact moist forest, 270mabove sea level, within the 145,000 ha Los AmigosConservation Concession area (Fig. 1). Mean annualrainfall was 2,430mm, with a dry period betweenApril and September [http://atrium.andesamazon.org, BRIT 2009]. The study area consisted of species-rich, closed-canopy terra firme andmature floodplainforests with discrete open-canopy enclaves of bambooand palm swamps [see detailed description inPalminteri and Peres, 2012]. Research permissionwas granted by Peru’s Natural Resource Agency(INRENA); protocols complied with Peru’s legalrequirements and adhered to the American Societyof Primatologists’ principles for the ethical treatmentof nonhuman primates.
Data CollectionSaki feeding and space use
We followed five adjacent groups of habituatedbald-faced sakis between January 2005 and Decem-ber 2007, for 3–5 consecutive days during 6–28months per group, obtaining ca. 3,100hr of observa-tion. Four of the groups were monitored in allcalendar months and during all 3 years of study.Groups consisted of 2–8 individuals (mean¼4.7) thatmaintained HRs of 16–60ha [Palminteri and Peres,2012]. We recorded each group’s location with aGarmin 12XL GPS every 15min (hereafter referredto as scans) and its modal activity pattern (resting,feeding, traveling, social behavior) every 5min using
Am. J. Primatol.
2 / Palminteri et al.
instantaneous group scan sampling [Altmann, 1974].We define feeding scans as 5-min scans allocated tofeeding and foraging on plant material. For allfeeding bouts observed, we recorded the location,plant species, and food item consumed (seed, meso-carp, whole fruit), and the maturity of fruits or seedsconsumed [see Palminteri et al., 2012a].
Food resourcesWe tagged and identified to species or morpho-
species all plants consumed by sakis. Given the smallsize of saki groups, each individual food plant (tree orliana) was considered a unique feeding site (hereaf-ter, food patch). Food patch locations were mapped,either with a GPS or calculated in ArcMap 10.0[ESRI, Redlands, CA] using the distance and anglefrom known coordinates within a 30-km network ofgeoreferenced trails spanning the study area.
To independently estimate the abundance ofpotential saki food resources across the study area,wesampled192vegetationplots of0.01ha (10 �10m2,total 1.92ha) by digitally overlaying a 25�25m2 grid
on the study area and randomly selecting 60–65 gridcells assigned to each of three levels of saki home rangeuse intensity, based on ranging data from 2 years ofsystematic group monitoring. In each plot, we identi-fied and measured the diameter of all trees >10 cmDBHwithmore than half of their stemwithin the plot.Lianas were not identified. Measured trees wereidentified to species, and voucher specimens werereviewed by botanists from the Botanical ResearchInstitute of Texas.
Data AnalysisSaki feeding and space use
We defined home ranges as the 95% fixed kernelHR polygons estimated for each of the five studygroups [methods explained in Palminteri and Peres,2012]. We defined saki use intensity across the studyarea by overlaying a 30 � 30m2 grid upon the studyarea and assigning all group locations obtainedduring scans (N¼9,119) and feeding scans(N¼9,273) to the appropriate grid cell (hereafter,
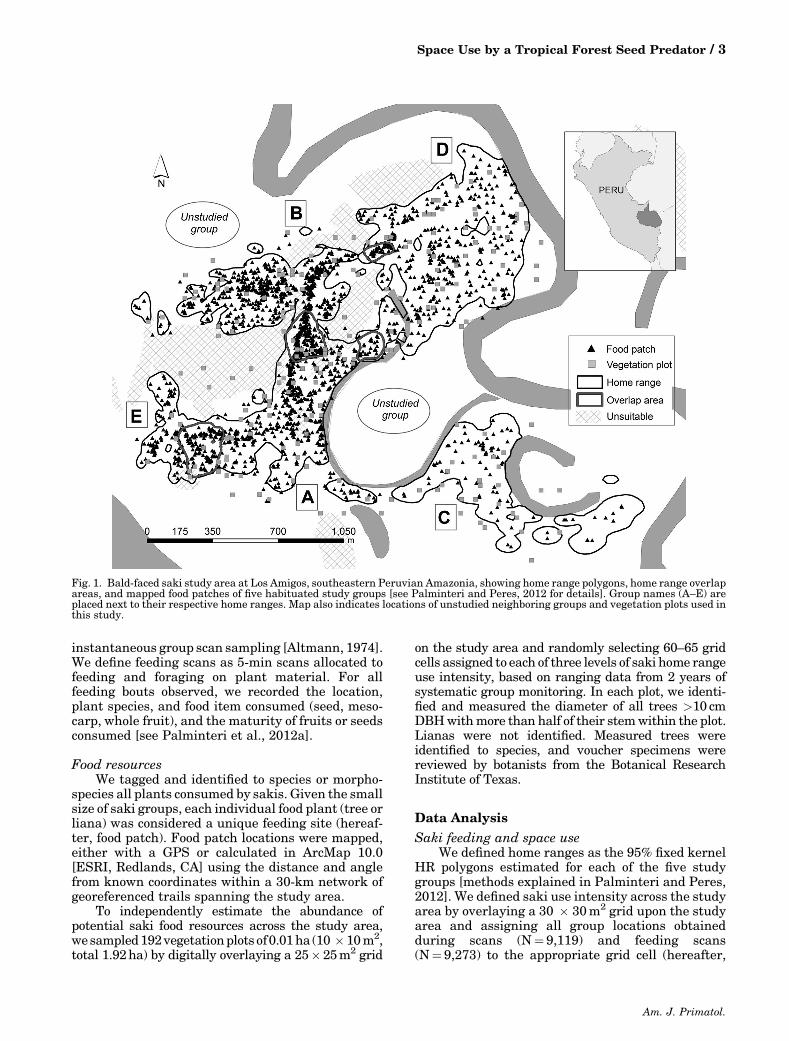
Fig. 1. Bald-faced saki study area at Los Amigos, southeastern Peruvian Amazonia, showing home range polygons, home range overlapareas, and mapped food patches of five habituated study groups [see Palminteri and Peres, 2012 for details]. Group names (A–E) areplaced next to their respective home ranges. Map also indicates locations of unstudied neighboring groups and vegetation plots used inthis study.
Am. J. Primatol.
Space Use by a Tropical Forest Seed Predator / 3
quadrat). The sum of scans recorded within eachquadrat for each groupwas expressed as a proportionof the total number of scans (time) recorded for thatgroup. Used quadrats were those in which sakis wererecorded during at least one 15-min scan [Palminteriet al., 2012b]. Feeding quadrats were those in whichwe recorded at least one feeding scan. For eachquadrat, we calculated the number of food patchesand the food species richness they represented.
We calculated HR overlap using pairwise inter-sections of the HR polygons of neighboring groupsmonitored in this study. We tested whether sakigroups spent more time (defined as the proportion ofscans) than expected by chance in their zones of HRoverlap (hereafter, overlap areas) using a Pearson x2
goodness-of-fit test. We calculated expected timebased on the proportion of each HR within overlapareas with all neighboring groups.
To estimate whether the daily diet of each sakigroup was more diverse than expected, we comparedthe observed number of species consumed per daywith an estimate of the food species richness expectedif the group fed randomly from all food speciesavailable at that time. To avoid possible effects ofvariation in observation time and food availability,we selected 12 observation periods for which at least3 consecutive full-day follows [defined below and inPalminteri et al., 2012a] were obtained, and wedefined available food species as those consumed bythe group during the relevant 3-day period. Althoughthis definition may underestimate the full number offood species available to sakis, it ensured that thesame species were available throughout the sampleperiod. Using the number of food patches visited oneach sample day, we generated a null expectation ofthe number of food species consumed using 100replications, with replacement, of a daily dietselected randomly from all simultaneously availablefood species. We then compared the observed andexpected numbers of species consumed per day usinga paired t-test.
To explore patterns of movement among foodpatches, we extracted the locations of food plantsused on 15 sample “full“ days, covering 3 calendarmonthswith themost complete data (March, August,September) and three study groups. We mappedtravel routes and counted the number of food patchesvisited on each sample day, as well as the numberthat were used by the group during that month (3–5full days per group per month) but not on the targetsample day.
Food resourcesWe assessed the spatial distribution of food
plants through a series of nearest neighbor analyses,using each group’s 95% fixed kernel home range asthe scale of analysis for that group. This GIS functionuses a t-distribution to test whether the ratiobetween the observed and expected mean distances
to the nearest neighboring patch (NN) for each foodpatch differs significantly from one. The expectedmean distance is based on a random distribution ofdistances; the distributions of NN distances for foodpatches of each saki group can then be defined asclustered (NN ratio <1), random (NN ratio �1), oruniform (NN ratio >1).
For each vegetation plot, we calculated theabundance (no. of stems/ha) and basal area (m2/ha)of food trees for all genera consumed by sakis(hereafter, potential food trees). We used indepen-dent t-tests to compare the numbers of stems,species, and basal area of all potential food treesfound within plots located in quadrats used by sakisto the numbers found in plots in quadrats that werenever used. We then repeated this comparisonbetween plots in quadrats within HR overlap areasand those in areas used exclusively by a single group.
We compared food availability to use of space forthe 192 quadrats containing vegetation plots in twoways. First, we ran Pearson correlations betweenuse, feeding, and movement parameters in eachquadrat and the total number of potential food trees,food tree species, and food tree basal area in theassociated plot. For these and other correlationanalyses, we used Spearman rank correlation wherevariables did not meet assumptions of normality.
Second, to evaluate whether the availability andspatial distribution of food within an overlap areapredicted use of a given quadrat, we used lme4 [Bateset al., 2014] within R [R Core Team, 2014] to performa linearmixed effects analysis (with group identity asa random effect). Use was defined as the averagemonthly proportion of the total number of scansrecorded for each group in a given quadrat [Palmin-teri et al., 2012b]. Food availability was defined asthe average monthly basal area in the vegetationplots of fruiting trees of food genera consumed bysakis. Monthly fruiting status was derived from thepresence of fruit on trees in a concurrent phenologystudy [Palminteri et al., 2012a] and in the diet ofsakis during that calendar month. Visual inspectionof residual plots did not reveal any obvious deviationsfrom homoscedasticity or normality, and the twopredictors were not correlated. We obtained P-values for food availability and overlap locationusing likelihood ratio tests of the full model with thefixed effect in question against themodel without theeffect in question [Winter 2013].
Movements through the home rangeWe converted saki group 15-min scan locations
into travel paths and calculated the straight-line distance between consecutive scans to estimategroup daily travel path length for all full days ofobservation [days consisting of at least 8hr ofobservations terminating at a sleeping site, Palmin-teri et al., 2012a]. The ratio of straight-line distancebetween consecutive sleeping trees to the
Am. J. Primatol.
4 / Palminteri et al.
corresponding day path length provided an estimateof daily travel path linearity [McKey and Waterman,1982], in which lower values represented moresinuous travel paths. We used correlations to testthe relationships between the group size, speed,length, and linearity of saki day paths and thefollowing daily foraging variables: proportion oftime spent feeding, proportion of feeding timeallocated to seeds and fruit pulp, and numbers offood plants and food species visited.Wealso comparedtravel velocity within and outside overlap quadratsusing all 15-min scans on all days using a Mann–Whitney U test.
Data were analyzed using JMP1 and R [R CoreTeam, 2014] statistical softwares; tests are two-tailed and based on an a¼0.05 significance level. Weused Bonferroni corrections to adjust for multipletests of a single hypothesis. GIS analysis wasperformed in ArcMAP 10.0.
RESULTSFood Resources
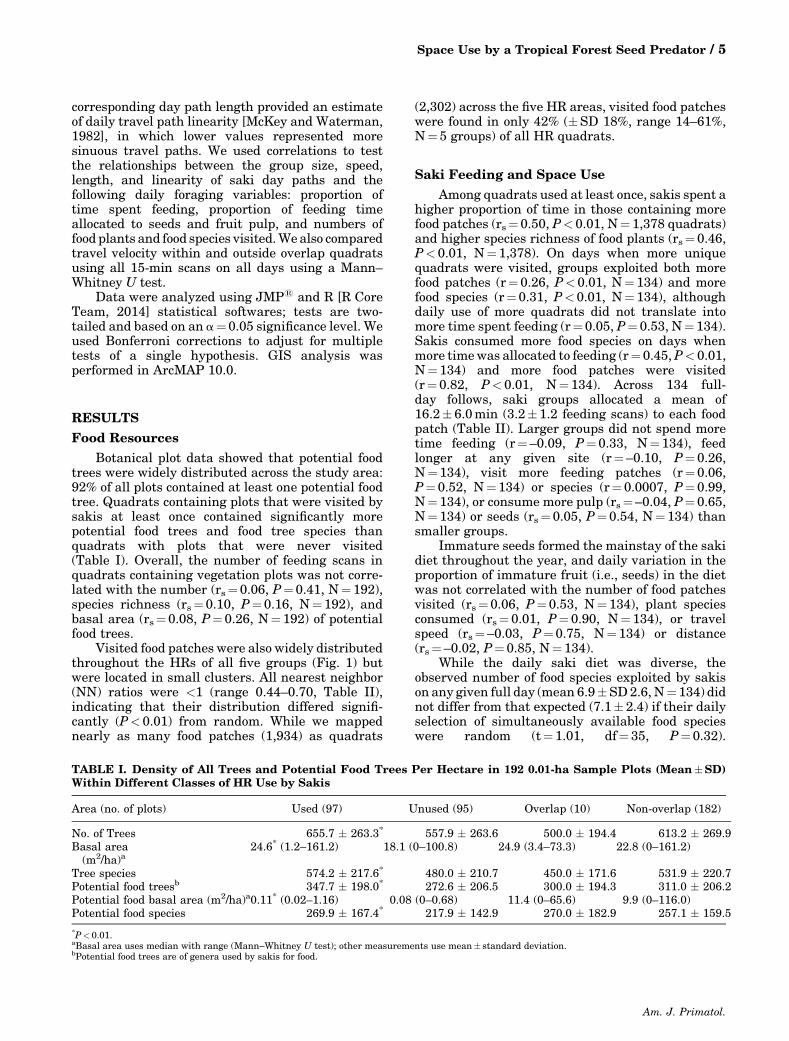
Botanical plot data showed that potential foodtrees were widely distributed across the study area:92% of all plots contained at least one potential foodtree. Quadrats containing plots that were visited bysakis at least once contained significantly morepotential food trees and food tree species thanquadrats with plots that were never visited(Table I). Overall, the number of feeding scans inquadrats containing vegetation plots was not corre-lated with the number (rs¼ 0.06, P¼ 0.41, N¼192),species richness (rs¼0.10, P¼0.16, N¼192), andbasal area (rs¼ 0.08, P¼0.26, N¼192) of potentialfood trees.
Visited food patches were also widely distributedthroughout the HRs of all five groups (Fig. 1) butwere located in small clusters. All nearest neighbor(NN) ratios were <1 (range 0.44–0.70, Table II),indicating that their distribution differed signifi-cantly (P< 0.01) from random. While we mappednearly as many food patches (1,934) as quadrats
(2,302) across the five HR areas, visited food patcheswere found in only 42% (�SD 18%, range 14–61%,N¼5 groups) of all HR quadrats.
Saki Feeding and Space UseAmong quadrats used at least once, sakis spent a
higher proportion of time in those containing morefood patches (rs¼0.50, P< 0.01, N¼ 1,378 quadrats)and higher species richness of food plants (rs¼ 0.46,P< 0.01, N¼1,378). On days when more uniquequadrats were visited, groups exploited both morefood patches (r¼ 0.26, P<0.01, N¼ 134) and morefood species (r¼0.31, P<0.01, N¼134), althoughdaily use of more quadrats did not translate intomore time spent feeding (r¼0.05, P¼ 0.53, N¼134).Sakis consumed more food species on days whenmore timewas allocated to feeding (r¼0.45,P< 0.01,N¼134) and more food patches were visited(r¼ 0.82, P< 0.01, N¼134). Across 134 full-day follows, saki groups allocated a mean of16.2� 6.0min (3.2�1.2 feeding scans) to each foodpatch (Table II). Larger groups did not spend moretime feeding (r¼–0.09, P¼0.33, N¼134), feedlonger at any given site (r¼ –0.10, P¼ 0.26,N¼134), visit more feeding patches (r¼ 0.06,P¼ 0.52, N¼134) or species (r¼ 0.0007, P¼ 0.99,N¼134), or consume more pulp (rs¼–0.04, P¼ 0.65,N¼134) or seeds (rs¼0.05, P¼ 0.54, N¼134) thansmaller groups.
Immature seeds formed the mainstay of the sakidiet throughout the year, and daily variation in theproportion of immature fruit (i.e., seeds) in the dietwas not correlated with the number of food patchesvisited (rs¼0.06, P¼0.53, N¼ 134), plant speciesconsumed (rs¼ 0.01, P¼ 0.90, N¼134), or travelspeed (rs¼–0.03, P¼0.75, N¼134) or distance(rs¼–0.02, P¼ 0.85, N¼134).
While the daily saki diet was diverse, theobserved number of food species exploited by sakison any given full day (mean 6.9�SD2.6, N¼134) didnot differ from that expected (7.1� 2.4) if their dailyselection of simultaneously available food specieswere random (t¼1.01, df¼ 35, P¼0.32).
TABLE I. Density of All Trees and Potential Food Trees Per Hectare in 192 0.01-ha Sample Plots (Mean�SD)Within Different Classes of HR Use by Sakis
Area (no. of plots) Used (97) Unused (95) Overlap (10) Non-overlap (182)
No. of Trees 655.7 � 263.3* 557.9 � 263.6 500.0 � 194.4 613.2 � 269.9Basal area(m2/ha)a
24.6* (1.2–161.2) 18.1 (0–100.8) 24.9 (3.4–73.3) 22.8 (0–161.2)
Tree species 574.2 � 217.6* 480.0 � 210.7 450.0 � 171.6 531.9 � 220.7Potential food treesb 347.7 � 198.0* 272.6 � 206.5 300.0 � 194.3 311.0 � 206.2Potential food basal area (m2/ha)a0.11* (0.02–1.16) 0.08 (0–0.68) 11.4 (0–65.6) 9.9 (0–116.0)Potential food species 269.9 � 167.4* 217.9 � 142.9 270.0 � 182.9 257.1 � 159.5
*P< 0.01.aBasal area uses median with range (Mann–Whitney U test); other measurements use mean� standard deviation.bPotential food trees are of genera used by sakis for food.
Am. J. Primatol.
Space Use by a Tropical Forest Seed Predator / 5
Nevertheless, sakis did not consistently visit thenearest available food patch. Before entering anysubsequent food patch, sakis bypassed a median ofone nearer food patch (range 0–15, N¼ 15 sampledays) that a focal or a neighboring group hadconsumed within a few days either before or after.Consequently, over a given day, groups bypassed amedian of 17 food patches (range 8–34) that wereknown to have been used at other times that week,indicating they likely contained fruit throughout theobservation period.
Use of Overlap AreasThe HRs of the habituated saki groups over-
lapped wherever they shared a common boundarybut remained unconnected where natural barriers—oxbow lakes or unsuitable vegetation types—separated two neighboring groups. The degree ofHR overlap varied from 0 to 33% (Table III), and82% of quadrats located within the combinedoverlap areas of all groups were used at leastonce. While the HR of Group C did not overlap withany other, 85% of its boundary had no adjacentgroup. The proportion of time spent in overlap areaswas greater than expected by chance for the otherfour focal groups, given the relative size of overlapareas, and groups moved more slowly within
overlap areas (median 74.5m/h, range 0–1045m/h) than in the exclusive areas of their respectiveHRs (median 91.3m/h, range 0–1339m/h,U¼8044244, Z¼3.78, P<0.01).
Sakis fed upon more trees in HR overlapquadrats (median¼1, range 0–13) than in quad-rats in exclusive HR areas (median¼0, range 0–14, U¼306171, Z¼ 11.0, P< 0.01). However, thevegetation plot data indicated that potential foodtrees were no more abundant in overlap than inexclusive HR areas. Plots in overlap quadrats(N¼10) did not differ from those in exclusivequadrats (N¼182) in the total number, speciesrichness, and basal area of both all trees andpotential food trees (range of t-statistic¼0.2–1.8;Mann–Whitney U test used for basal area, P>0.10in all cases, Table I), suggesting that greater foodavailability was not necessarily a primary reasonsakis visited overlap areas.
Overlap was a stronger predictor of quadrat usethan our food availability estimate. A model withoverlap as a single predictor was stronger than themodel combining overlap and food availability(Table IV). Position within an overlap area positivelyaffected use (x2(1)¼28.49, P<0.01), increasing it byabout 0.83%� 0.15% (SE), while food availabilityshowed no significant impact on quadrat use (esti-mate –0.12%� 0.32% (SE), x2(1)¼ 0.14, P¼ 0.71).
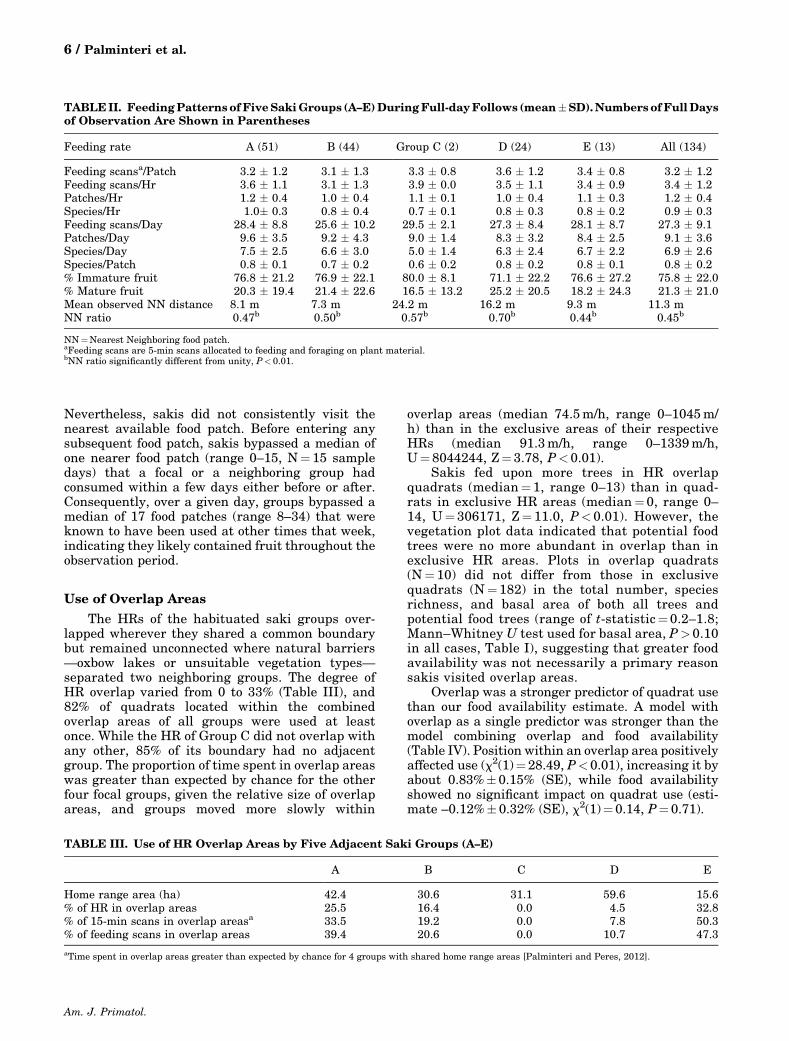
TABLEII. FeedingPatterns ofFiveSakiGroups (A–E)DuringFull-dayFollows (mean�SD).Numbers ofFullDaysof Observation Are Shown in Parentheses
Feeding rate A (51) B (44) Group C (2) D (24) E (13) All (134)
Feeding scansa/Patch 3.2 � 1.2 3.1 � 1.3 3.3 � 0.8 3.6 � 1.2 3.4 � 0.8 3.2 � 1.2Feeding scans/Hr 3.6 � 1.1 3.1 � 1.3 3.9 � 0.0 3.5 � 1.1 3.4 � 0.9 3.4 � 1.2Patches/Hr 1.2 � 0.4 1.0 � 0.4 1.1 � 0.1 1.0 � 0.4 1.1 � 0.3 1.2 � 0.4Species/Hr 1.0� 0.3 0.8 � 0.4 0.7 � 0.1 0.8 � 0.3 0.8 � 0.2 0.9 � 0.3Feeding scans/Day 28.4 � 8.8 25.6 � 10.2 29.5 � 2.1 27.3 � 8.4 28.1 � 8.7 27.3 � 9.1Patches/Day 9.6 � 3.5 9.2 � 4.3 9.0 � 1.4 8.3 � 3.2 8.4 � 2.5 9.1 � 3.6Species/Day 7.5 � 2.5 6.6 � 3.0 5.0 � 1.4 6.3 � 2.4 6.7 � 2.2 6.9 � 2.6Species/Patch 0.8 � 0.1 0.7 � 0.2 0.6 � 0.2 0.8 � 0.2 0.8 � 0.1 0.8 � 0.2% Immature fruit 76.8 � 21.2 76.9 � 22.1 80.0 � 8.1 71.1 � 22.2 76.6 � 27.2 75.8 � 22.0% Mature fruit 20.3 � 19.4 21.4 � 22.6 16.5 � 13.2 25.2 � 20.5 18.2 � 24.3 21.3 � 21.0Mean observed NN distance 8.1 m 7.3 m 24.2 m 16.2 m 9.3 m 11.3 mNN ratio 0.47b 0.50b 0.57b 0.70b 0.44b 0.45b
NN¼Nearest Neighboring food patch.aFeeding scans are 5-min scans allocated to feeding and foraging on plant material.bNN ratio significantly different from unity, P< 0.01.
TABLE III. Use of HR Overlap Areas by Five Adjacent Saki Groups (A–E)
A B C D E
Home range area (ha) 42.4 30.6 31.1 59.6 15.6% of HR in overlap areas 25.5 16.4 0.0 4.5 32.8% of 15-min scans in overlap areasa 33.5 19.2 0.0 7.8 50.3% of feeding scans in overlap areas 39.4 20.6 0.0 10.7 47.3
aTime spent in overlap areas greater than expected by chance for 4 groups with shared home range areas [Palminteri and Peres, 2012].
Am. J. Primatol.
6 / Palminteri et al.
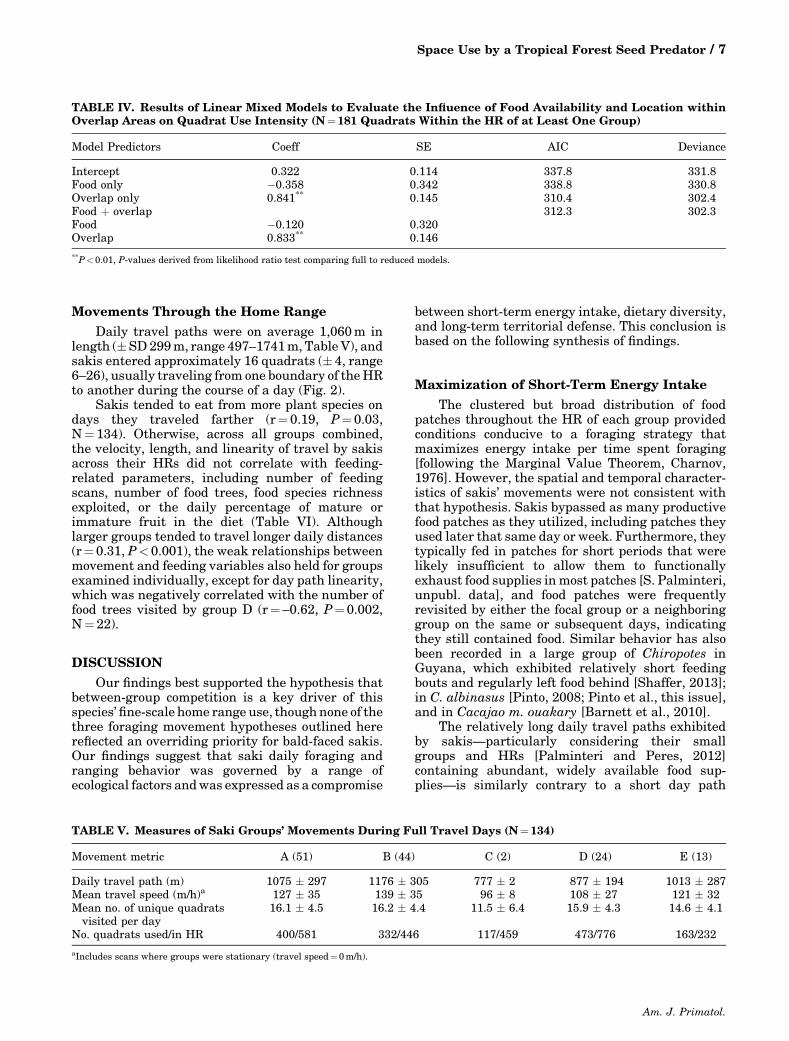
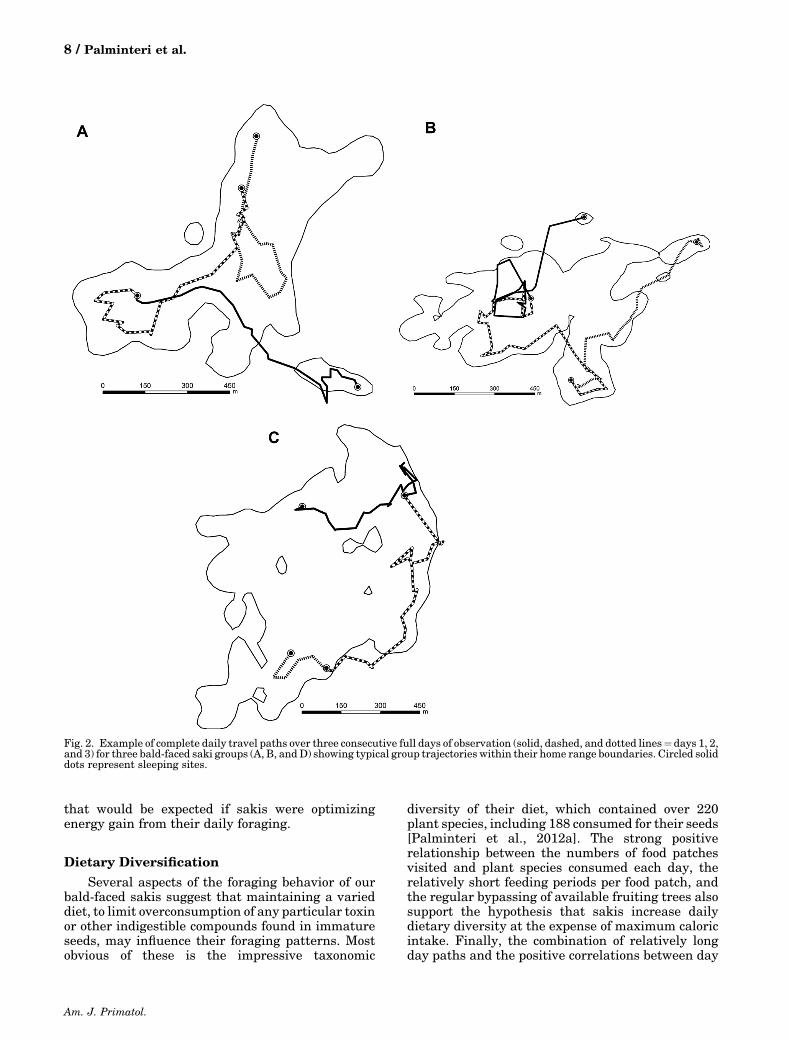
Movements Through the Home RangeDaily travel paths were on average 1,060m in
length (�SD299m, range 497–1741m, Table V), andsakis entered approximately 16 quadrats (� 4, range6–26), usually traveling from one boundary of theHRto another during the course of a day (Fig. 2).
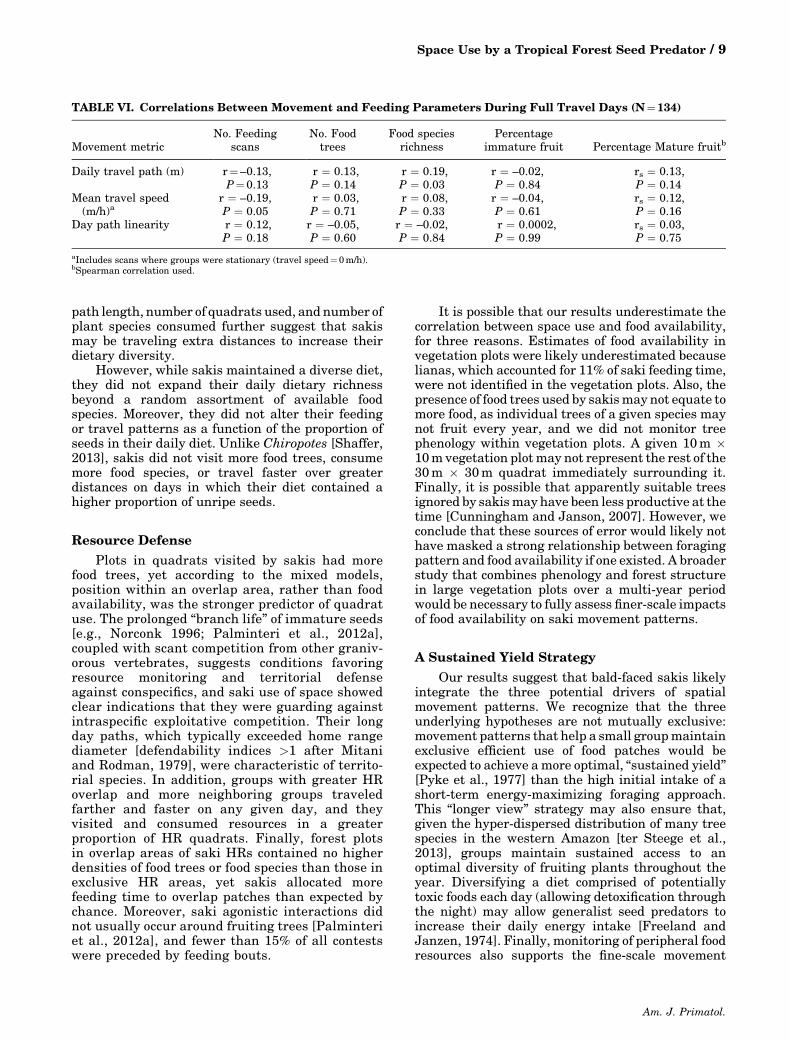
Sakis tended to eat from more plant species ondays they traveled farther (r¼0.19, P¼0.03,N¼134). Otherwise, across all groups combined,the velocity, length, and linearity of travel by sakisacross their HRs did not correlate with feeding-related parameters, including number of feedingscans, number of food trees, food species richnessexploited, or the daily percentage of mature orimmature fruit in the diet (Table VI). Althoughlarger groups tended to travel longer daily distances(r¼ 0.31, P<0.001), the weak relationships betweenmovement and feeding variables also held for groupsexamined individually, except for day path linearity,which was negatively correlated with the number offood trees visited by group D (r¼–0.62, P¼0.002,N¼22).
DISCUSSIONOur findings best supported the hypothesis that
between-group competition is a key driver of thisspecies’fine-scale home range use, thoughnone of thethree foraging movement hypotheses outlined herereflected an overriding priority for bald-faced sakis.Our findings suggest that saki daily foraging andranging behavior was governed by a range ofecological factors andwas expressed as a compromise
between short-term energy intake, dietary diversity,and long-term territorial defense. This conclusion isbased on the following synthesis of findings.
Maximization of Short-Term Energy IntakeThe clustered but broad distribution of food
patches throughout the HR of each group providedconditions conducive to a foraging strategy thatmaximizes energy intake per time spent foraging[following the Marginal Value Theorem, Charnov,1976]. However, the spatial and temporal character-istics of sakis’ movements were not consistent withthat hypothesis. Sakis bypassed as many productivefood patches as they utilized, including patches theyused later that same day or week. Furthermore, theytypically fed in patches for short periods that werelikely insufficient to allow them to functionallyexhaust food supplies inmost patches [S. Palminteri,unpubl. data], and food patches were frequentlyrevisited by either the focal group or a neighboringgroup on the same or subsequent days, indicatingthey still contained food. Similar behavior has alsobeen recorded in a large group of Chiropotes inGuyana, which exhibited relatively short feedingbouts and regularly left food behind [Shaffer, 2013];in C. albinasus [Pinto, 2008; Pinto et al., this issue],and in Cacajao m. ouakary [Barnett et al., 2010].
The relatively long daily travel paths exhibitedby sakis—particularly considering their smallgroups and HRs [Palminteri and Peres, 2012]containing abundant, widely available food sup-plies—is similarly contrary to a short day path
TABLE IV. Results of Linear Mixed Models to Evaluate the Influence of Food Availability and Location withinOverlap Areas on Quadrat Use Intensity (N¼181 Quadrats Within the HR of at Least One Group)
Model Predictors Coeff SE AIC Deviance
Intercept 0.322 0.114 337.8 331.8Food only �0.358 0.342 338.8 330.8Overlap only 0.841** 0.145 310.4 302.4Food þ overlap 312.3 302.3Food �0.120 0.320Overlap 0.833** 0.146
**P<0.01, P-values derived from likelihood ratio test comparing full to reduced models.
TABLE V. Measures of Saki Groups’ Movements During Full Travel Days (N¼134)
Movement metric A (51) B (44) C (2) D (24) E (13)
Daily travel path (m) 1075 � 297 1176 � 305 777 � 2 877 � 194 1013 � 287Mean travel speed (m/h)a 127 � 35 139 � 35 96 � 8 108 � 27 121 � 32Mean no. of unique quadratsvisited per day
16.1 � 4.5 16.2 � 4.4 11.5 � 6.4 15.9 � 4.3 14.6 � 4.1
No. quadrats used/in HR 400/581 332/446 117/459 473/776 163/232
aIncludes scans where groups were stationary (travel speed¼ 0m/h).
Am. J. Primatol.
Space Use by a Tropical Forest Seed Predator / 7
that would be expected if sakis were optimizingenergy gain from their daily foraging.
Dietary DiversificationSeveral aspects of the foraging behavior of our
bald-faced sakis suggest that maintaining a varieddiet, to limit overconsumption of any particular toxinor other indigestible compounds found in immatureseeds, may influence their foraging patterns. Mostobvious of these is the impressive taxonomic
diversity of their diet, which contained over 220plant species, including 188 consumed for their seeds[Palminteri et al., 2012a]. The strong positiverelationship between the numbers of food patchesvisited and plant species consumed each day, therelatively short feeding periods per food patch, andthe regular bypassing of available fruiting trees alsosupport the hypothesis that sakis increase dailydietary diversity at the expense of maximum caloricintake. Finally, the combination of relatively longday paths and the positive correlations between day
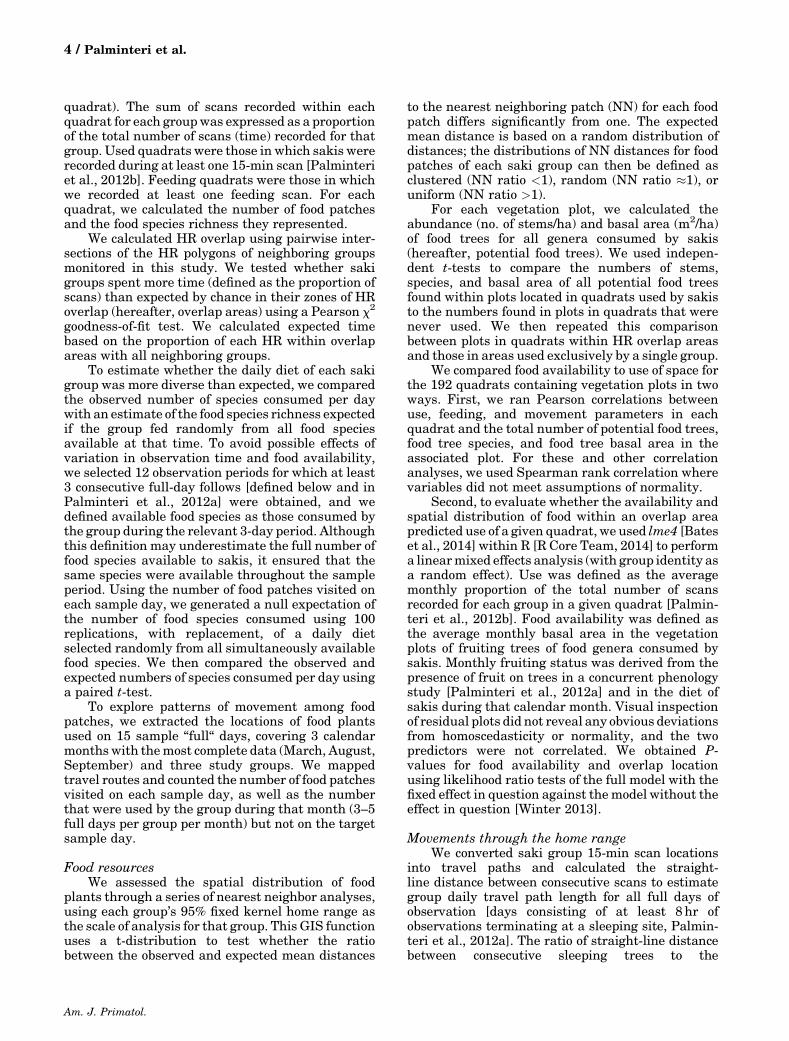
Fig. 2. Example of complete daily travel paths over three consecutive full days of observation (solid, dashed, and dotted lines¼days 1, 2,and 3) for three bald-faced saki groups (A, B, andD) showing typical group trajectories within their home range boundaries. Circled soliddots represent sleeping sites.
Am. J. Primatol.
8 / Palminteri et al.
path length, number of quadrats used, and number ofplant species consumed further suggest that sakismay be traveling extra distances to increase theirdietary diversity.
However, while sakis maintained a diverse diet,they did not expand their daily dietary richnessbeyond a random assortment of available foodspecies. Moreover, they did not alter their feedingor travel patterns as a function of the proportion ofseeds in their daily diet. Unlike Chiropotes [Shaffer,2013], sakis did not visit more food trees, consumemore food species, or travel faster over greaterdistances on days in which their diet contained ahigher proportion of unripe seeds.
Resource DefensePlots in quadrats visited by sakis had more
food trees, yet according to the mixed models,position within an overlap area, rather than foodavailability, was the stronger predictor of quadratuse. The prolonged “branch life” of immature seeds[e.g., Norconk 1996; Palminteri et al., 2012a],coupled with scant competition from other graniv-orous vertebrates, suggests conditions favoringresource monitoring and territorial defenseagainst conspecifics, and saki use of space showedclear indications that they were guarding againstintraspecific exploitative competition. Their longday paths, which typically exceeded home rangediameter [defendability indices >1 after Mitaniand Rodman, 1979], were characteristic of territo-rial species. In addition, groups with greater HRoverlap and more neighboring groups traveledfarther and faster on any given day, and theyvisited and consumed resources in a greaterproportion of HR quadrats. Finally, forest plotsin overlap areas of saki HRs contained no higherdensities of food trees or food species than those inexclusive HR areas, yet sakis allocated morefeeding time to overlap patches than expected bychance. Moreover, saki agonistic interactions didnot usually occur around fruiting trees [Palminteriet al., 2012a], and fewer than 15% of all contestswere preceded by feeding bouts.
It is possible that our results underestimate thecorrelation between space use and food availability,for three reasons. Estimates of food availability invegetation plots were likely underestimated becauselianas, which accounted for 11% of saki feeding time,were not identified in the vegetation plots. Also, thepresence of food trees used by sakismay not equate tomore food, as individual trees of a given species maynot fruit every year, and we did not monitor treephenology within vegetation plots. A given 10m �10mvegetation plotmay not represent the rest of the30m � 30m quadrat immediately surrounding it.Finally, it is possible that apparently suitable treesignored by sakismayhave been less productive at thetime [Cunningham and Janson, 2007]. However, weconclude that these sources of error would likely nothave masked a strong relationship between foragingpattern and food availability if one existed. A broaderstudy that combines phenology and forest structurein large vegetation plots over a multi-year periodwould be necessary to fully assess finer-scale impactsof food availability on saki movement patterns.
A Sustained Yield StrategyOur results suggest that bald-faced sakis likely
integrate the three potential drivers of spatialmovement patterns. We recognize that the threeunderlying hypotheses are not mutually exclusive:movement patterns that help a small groupmaintainexclusive efficient use of food patches would beexpected to achieve amore optimal, “sustained yield”[Pyke et al., 1977] than the high initial intake of ashort-term energy-maximizing foraging approach.This “longer view” strategy may also ensure that,given the hyper-dispersed distribution of many treespecies in the western Amazon [ter Steege et al.,2013], groups maintain sustained access to anoptimal diversity of fruiting plants throughout theyear. Diversifying a diet comprised of potentiallytoxic foods each day (allowing detoxification throughthe night) may allow generalist seed predators toincrease their daily energy intake [Freeland andJanzen, 1974]. Finally, monitoring of peripheral foodresources also supports the fine-scale movement
TABLE VI. Correlations Between Movement and Feeding Parameters During Full Travel Days (N¼134)
Movement metricNo. Feeding
scansNo. Foodtrees
Food speciesrichness
Percentageimmature fruit Percentage Mature fruitb
Daily travel path (m) r¼–0.13,P¼ 0.13
r ¼ 0.13,P ¼ 0.14
r ¼ 0.19,P ¼ 0.03
r ¼ –0.02,P ¼ 0.84
rs ¼ 0.13,P ¼ 0.14
Mean travel speed(m/h)a
r ¼ –0.19,P ¼ 0.05
r ¼ 0.03,P ¼ 0.71
r ¼ 0.08,P ¼ 0.33
r ¼ –0.04,P ¼ 0.61
rs ¼ 0.12,P ¼ 0.16
Day path linearity r ¼ 0.12,P ¼ 0.18
r ¼ –0.05,P ¼ 0.60
r ¼ –0.02,P ¼ 0.84
r ¼ 0.0002,P ¼ 0.99
rs ¼ 0.03,P ¼ 0.75
aIncludes scans where groups were stationary (travel speed¼ 0m/h).bSpearman correlation used.
Am. J. Primatol.
Space Use by a Tropical Forest Seed Predator / 9
patterns predicted by the resource defense hypothe-sis, a reasonable strategy when seeds of immaturefruits are abundant but require a diversified dailyintake and can be depleted by neighboring conspe-cifics. This form of “doughnut-shaped” activity field[sensu Waser and Wiley, 1979] to maximize long-term resource defense, even at the expense of short-term energy gains, is typical of highly territorialbirds [e.g., Paton and Carpenter, 1984: Selasphorusrufus] and primates [e.g., Peres, 1989: Leontopithe-cus rosalia]. While this hypothesis was best sup-ported by our findings, none of the foragingmovement hypotheses reflects an overriding priorityfor sakis. The ecological flexibility shown by sakisand their advantageous position as one of the fewarboreal vertebrate seed predators in a highlydiverse forest may allow them to prioritize bothlong-term foraging and other fitness gains, includinganti-predation strategies.
ACKNOWLEDGMENTSWe thank the Peruvian Natural Resource Agen-
cy (INRENA, now Direcci�on General Forestal yFauna Silvestre, Ministerio de Agricultura) forpermission to conduct this study and Asociaci�onpara la Conservaci�on de la Cuenca Amaz�onica(ACCA) for permission to work at Los Amigos.Funding was provided by The Gordon and BettyMoore Foundation; CAP is partly funded by aCAPESgrant (PVE 004/2012). WorldWildlife Fund providedlogistical support throughout the project. We thankJohn Janovec and the BRIT team for botanicalidentifications and Edgard Collado, Rufo Busta-mante, Sandra Thor�en, Zunilda Hoestnig, VictorDavila, and other volunteers for field assistance. Wethank Arnaud Lyet for help with statistical analyses.Adrian Barnett, Paul Garber, and two anonymousreviewers provided helpful editorial comments on themanuscript. We are grateful to Adrian Barnett andSarah Boyle for the invitation to participate in thisspecial issue.
REFERENCESAltmann J. 1974. Observational study of behavior: sampling
methods. Behaviour 49:227–267.Barnett AA. 2010.Diet, habitat use and conservation ecology of
the golden-backed uacari, Cacajao melanocephalus ouak-ary, In: Ja�uNational Park, AmazonianBrazil [dissertation].London (England): Roehampton University 469 p.
Bates D, Maechler M, Bolker B, Walker S. 2014. lme4: Linearmixed-effects models using Eigen and S4. R package version1.1-8, URL: http://CRAN.R-project.org/package=lme4
Boubli JP. 1999. Feeding ecology of black-headed uacaris(Cacajao melanocephalus melanocephalus) in Pico daNeblina National Park, Brazil. International Journal ofPrimatology 20:719–749.
Bowler M, Bodmer RE. 2011. Diet and food choice in Peruvianred uakaris (Cacajao calvus ucayalii): selective or
opportunistic seed predation? International Journal ofPrimatology 32:1109–1122.
Charnov EL. 1976. Optimal foraging: the marginal valuetheorem. Theoretical Population Biology 9:129–136.
Cunningham E, Janson C. 2007. Integrating informationabout location and value of resources by white-faced sakimonkeys (Pithecia pithecia). Animal Cognition 10:293–304.
Freeland WJ, Janzen DH. 1974. Strategies in herbivory bymammals: the role of plant secondary compounds. TheAmerican Naturalist 108:269–289.
Glander KE. 1982. The impact of plant secondary compoundson primate feeding behavior. Yearbook of Physical Anthro-pology 25:1–18.
JanzenDH. 1971. Seed predation by animals. Annual review ofecology and systematics 2:465–492.
Kinzey WG, Norconk MA. 1993. Physical and chemicalproperties of fruit and seeds eaten by Pithecia andChiropotes in Surinam and Venezuela. InternationalJournal of Primatology 14:207–227.
Ledogar JA, Winchester JM, St. Clair EM, Boyer DM. 2013.Diet and dental topography in pitheciine seed predators.American Journal of Physical Anthropology 150:107–121.
Lucas JR, Waser PM. 1989. Defense through exploitation: aSkinner Box for tropical rain forests. Trends in Ecology andEvolution 4:62–63.
Marshall AJ, Wrangham RW. 2007. Evolutionary consequen-ces of fallback foods. International Journal of Primatology28:1219–1235.
McKey D, Waterman PG. 1982. Ranging behaviour of a groupof black colobus (Colobus satanas) in the Douala-Edea Reserve, Cameroon. Folia Primatologica 39:264–304.
Mitani JC, Rodman PS. 1979. Territoriality: the relation ofranging pattern and home range size to defendability, withan analysis of territoriality among primate species. Behav-ioral Ecology and Sociobiology 5:241–251.
Norconk MA. 1996. Seasonal variation in the diets of white-faced and bearded sakis (Pithecia pithecia and Chiropotessatanas) in Guri Lake, Venezuela. In: Norconk M, editor.Adaptive radiations of Neotropical primates. New York:Plenum Press. p 403–423.
Norconk MA. 2011. Saki, uakaris, and titi monkeys: Behavior-al diversity in a radiation of primate seed predators. In:Campbell CJ, Fuentes A, MacKinnon KC, Panger M,Bearder SK, editors. Primates in perspective. 2nd ed. NewYork: Oxford University Press. p 123–138.
Norconk MA, Conklin-Brittain NL. 2004. Variation onfrugivory: the diet of Venezuelan white-faced sakis. Inter-national Journal of Primatology 25:1–26.
Norconk MA, Veres M. 2011. Physical properties of fruit andseeds ingested by primate seed predators with emphasis onsakis and bearded sakis. The Anatomical Record 294:2092–2111.
Palminteri S, Peres CA. 2012. Habitat selection and use ofspace by bald-faced sakis (Pithecia irrorata) in southwesternAmazonia: lessons from a multi-year, multi-group study.International Journal of Primatology 33:401–417.
Palminteri S, Powell GV, Peres CA. 2012a. Advantages ofgranivory in seasonal environments: feeding ecology of anarboreal seed predator in Amazonian forests. Oikos121:1896–1904.
Palminteri S, Powell GV, Asner GP, Peres CA. 2012b. LiDARmeasurements of canopy structure predict spatial distribu-tion of a tropical mature forest primate. Remote Sensing ofEnvironment 127:98–105.
Palminteri S, Powell GV, Adamek K, Tupayachi R. 2013.Competition between pitheciines and largeAramacaws, twospecialist seed-eaters. In: Veiga LM, Barnett AA, FerrariSF, Norconk MA, editors. Evolutionary biology and conser-vation of titis, sakis and uacaris. Cambridge: CambridgeUniversity Press. p 114–126.
Am. J. Primatol.
10 / Palminteri et al.
Paton DC, Carpenter FL. 1984. Peripheral foraging byterritorial rufous hummingbirds: defense by exploitation.Ecology 65:1808–1819.
Peres CA. 1989. Costs and beneAT of territorial defense inwildgolden lion tamarins, Leontopithecus rosalia. BehavioralEcology and Sociobiology 25:227–233.
Peres CA. 1993. Notes on the ecology of buffy saki monkeys(Pithecia albicans, Gray 1860)—a canopy seed predator.American Journal of Primatology 31:129–140.
Peres CA. 1994. Primate responses to phenological changes inan Amazonian terra firme forest. Biotropica 26:98–112.
Pyke GH, Pulliam HR, Charnov EL. 1977. Optimal foraging: aselective review of theory and tests. TheQuarterly Review ofBiology 52:137–152.
R Core Team. 2014. R: a language and environment forstatistical computing. Vienna, Austria: R Foundation forStatistical Computing. http://www.R-project.org/
Schoener TW. 1971. Theory of feeding strategies. AnnualReview of Ecology and Systematics 2:369–404.
Shaffer CA. 2013. Ecological correlates of ranging behavior inbearded sakis (Chiropotes sagulatus) in a continuous forest inGuyana. International Journal of Primatology 34:515–532.
ter Steege H, Pitman NC, Sabatier D, et al. 2013. Hyper-dominance in the Amazonian tree flora. Science 342. DOI:10.1126/science.1243092
Terborgh J. 1983. Five New World primates: a study incomparative ecology. Princeton Univ. Press.
van Schaik CP, Terborgh JW, Wright SJ. 1993. The phenologyof tropical forests: adaptive significance and consequencesfor primary consumers. Annual Review of Ecology andSystematics 24:353–377.
Waser PM, Wiley RH. 1979. Mechanisms and evolution ofspacing in animals. In: Mailer P, Vandenbergh JG, editors.Handbook of behavioral neurobiology Vol. 3. New York:Plenum Publishers. p 159–223.
Winter B. 2013. Linearmodels and linearmixed effects modelsin R with linguistic applications. arXiv:1308.5499. http://arxiv.org/pdf/1308.5499.pdf
Am. J. Primatol.
Space Use by a Tropical Forest Seed Predator / 11
Related Documents