DETERMINANTS OF RECORD BREAKS IN SWIMMING A THESIS Presented to The Faculty of the Department of Economics and Business The Colorado College In Partial Fulfillment of the Requirements for the Degree Bachelor of Arts By Elizabeth Claire Preston May 2011

Welcome message from author
This document is posted to help you gain knowledge. Please leave a comment to let me know what you think about it! Share it to your friends and learn new things together.
Transcript
DETERMINANTS OF RECORD BREAKS IN SWIMMING
A THESIS
Presented to
The Faculty of the Department of Economics and Business
The Colorado College
In Partial Fulfillment of the Requirements for the Degree
Bachelor of Arts
By
Elizabeth Claire Preston
May 2011
Determinants of Record Breaks in Swimming
Elizabeth Claire Preston
May 2011
Economics
Abstract
This study examines record breaks in swimming in order to determine the factors of
athletic success. We use a regression analysis to observe the impact of several variables
on the frequency of record breaks ranging from 1969-2009. The study specifically
focuses on how innovations affect records when introduced to the competitive swimming
world. Proving a strong relationship between technology and record breaks, analysis of
the data shows the introduction of one average new technology results in .345 new
broken records. It also finds the following factors to have a positive significance on the
total number of record breaks: star athletes, a nation’s accessibility to sea, and cold
nations.
KEYWORDS: (Record, Technology, Swimming)

TABLE OF CONTENTS
ABSTRACT ii
1 INTRODUCTION
1
1.1 Background.................................................................................................... 5
1.2 Relevance....................................................................................................... 8
2 LITERATURE REVIEW 12
3 THEORY 22
4 DATA AND METHODOLOGY 31
4.1 Data................................................................................................................ 31
4.2 Technology Factor.......................................................................................... 37
4.3 Variable Correlations..................................................................................... 42
4.4 Methodology.................................................................................................. 43
5 RESULTS AND ANALYSIS
45
5.1 Results............................................................................................................ 45
5.2 Factors Influencing Lifespan of a Record ..................................................... 47
5.3 Factors Influencing Total Record Breaks and Star Athletes.......................... 53
5.4 Additional Consideration............................................................................... 57
5.5 Implications of Results................................................................................... 60
4.2 Further Research............................................................................................ 61
6 CONCLUSION
63
7 SOURCES CONSULTED 66
LIST OF TABLES
3.1 COUNTRY EXPENDITURE ON SWIMMING PER CAPITA IN 2008…. 26
4.1 SUMMARY STATISTICS FOR INDIVIDUAL RECORD BREAK DATA
SET……………………………………………………………………
34
4.2 RECORDS BROKEN EACH YEAR COMPARED WITH TECHNOLOGY
4.3 SUMMARY STATISTICS FOR TOTAL RECORD BREAK DATA SET…
4.4 SUMMARY STATISTICS FOR COUNTRY DATA SET…………
4.5 CHRONOLOGY DESCRIPTION OF SWIMSUIT INNOVATIONS
RANGING FROM 1969-2009………………………………………………
4.6 DESCRIPTION OF VARIABLES………………………………………
4.7 MULTICOLLINEARITY OF VARIABLES ON A COUNTRY BASIS…
4.8 MULTICOLLINEARITY OF VARIABLES ON AN INDIVIDUAL BASIS
5.1 TECHNOLOGY IMPACT ON RECORD BREAKS ON AN ANNUAL
BASIS……………………………………………………………………
5.2 IMPACT ON THE DAY LAPSE OF RECORD BREAKS…………………
5.3 FACTORS INFLUENCING TOTAL RECORD BREAKS FOR EACH
COUNTRY……………………………………………………………………
5.4 FACTORS INFLUENCING STAR ATHLETES FOR EACH
COUNTRY……………………………………………………………………
35
36
37
40
41
42
43
46
48
53
56
LIST OF FIGURES
2.1 PRODUCTION FUNCTION OF AN ATHLETES SPEED
PERFORMANCE GIVEN THE NECESSARY INPUTS OVER TIME……..
18
5.1 TECHNOLOGY IMPACT ON AVERAGE LIFESPAN OF A RECORD…… 51
5.2 STAR ATHLETES IMPACT ON RECORD BREAKS FOR EACH
COUNTRY………...……………………………………………………..........
55
1
CHAPTER I
INTRODUCTION
In the recent Beijing 2008 Olympic Games, swimmers broke twenty-five world
records and sixty-six Olympic records, with only a single previous Olympic record
surviving.1 Some races in the Games even resulted with the first five finishers all
beating the old record, stirring much speculation about the introduction of new swimsuit
technologies.2 More recently, the results in the 2010 Vancouver Olympics indicate a
clear advantage rich countries have in winning medals as the powerhouse nations like
the United States and Germany captured the lead in medal standings with ease. As sport
success continues to cater to the more advanced countries, technology should not only
prove to be a positive factor in past athletic achievement, but its value should also
increase in the future as our society becomes more dependent on technology.3
Many studies have analyzed athletic performance in its most competitive form,
most concluding that the development of superior physical performance is in part a
result of technological innovation. Although many factors contribute to success in sport,
technology appears to be most controversial because it questions the legitimacy of
performance times due to its apparent unfair advantage. It may be the reason why the
1 Ross Tucker. “Swimmers Credibility Crisis: How FINAS‟s Blind Eye is Affecting the Purity of
the Sport.” The Science of Sport (2008): Date Accessed: October, 2010 on
http://www.sportsscientists.com/2008/11/swimsuit-controversy.html.
2 IBID
3 “The Olympic Games.” Date accessed: October 2010 on www.olympic.org
2
richest countries like United States, Germany and China earned the highest medal
counts in recent Vancouver Olympics. Entire industries devote their business to the
development of sport, as national governments and international corporations annually
invest billions in order to sustain public interest in recreation and health.4 How much
difference does technology make? This study is novel as it specifically focuses on how
world and American records are broken by analyzing the causes for improvement in
swimming performance times.
Modern sport celebrates the most exceptional of performances, as summarized
in the Olympic motto, citius, altius, fortius. In obtaining maximum output, society
requires an increase of “scientific intrusion” into the sporting body in order to deliver
the “elusive „edge‟” in competition.5 Sport technology ranges from body techniques,
traditional sport equipment, substances or methods used outside of the competitive
setting, and performance enhancing machines.6
Success in athletics, shown through record breaks at an international level,
resembles a public good. The Coe Report7 argues three reasons why this may be the
case and why governments care about success among their athletes. First, the loud
celebration that comes with breaking records creates pride in one‟s own national
identity. Second, a record break builds positive energy within the swimmer‟s country,
4 Tara Magdalinski. Sport, Technology and the Body: The Nature of Performance.
London, New York. Routledge. (2009): 1-157
5 IBID
6 S. Loland, “Technology in Sport: Three Ideal-Typical Views and Their Implications.”
European Journal of Sport Science 2, no. 1 (2001).
7 I. A. Moosa, L. Smith, “Economic Development Indicators as Determinants of Medal Winning
at the Sydney Olympics: An Extreme Bound Analysis” Australian Economic Papers 43, no.3 (2004):
288–301.
3
helping boost the nation‟s image to the rest of the world, while also potentially
contributing to the sales of their own products and consumption. Finally, success helps
increase athletic participation not only in sport, but also recreation, strengthening the
overall health of society.8
Studies covering performance in swimming have focused specifically on
controlled trials9 or specific case studies.
10 This study differs as it examines each
occurrence of a record break in swimming ranging specifically from 1969-2009.
Analyzing swimming permits more data and analysis, as swimmers perform in many
more events then other professional athletes, providing more opportunities for stars to
set world records. For example, seventeen separate events are available for each male
swimmer in the 2011 ConocoPhillips National Championships, allowing superior
athletes like Michael Phelps to qualify and compete for any event available. 11
For
example, Phelps alone set eleven new records during the 2008 Beijing games. In the
200m butterfly, he set new Olympic records in both the heat and semifinal, and then a
world record in the final.12
Swimmers perform horizontally, which not only promotes
better circulation of oxygen and nutrients throughout the blood, but also avoids hard
impact on muscles, tendons, and ligaments. This type of competition allows for quicker
8 IBID
9 E. Tiozzo, G. Leko and L. Ruzic, “Swimming Bodysuit in All-Out and Constant-Pace
Trials.” Biology of Sport 26, no. 2 (2009): 149-156
10
David B. Pyne, Cassie B. Trewin and William G. Hopkins, “Progression and Variability of
Competitive Performance of Olympic Swimmers.” Journal of Sports Science 22, no.7 (2004): 613-620
11
USA Swimming. National Events. Order of Events. (2010). Date accessed: February, 2010 on
http://www.usaswimming.org/DesktopDefault.aspx?TabId=1476&Alias=Rainbow&Lang=en
12 Brenkus, John. The Perfection Point. New York. HarperCollins Publishers. 2010: 66
4
recovery relative to track and field, allowing competitors to be involved in more events.
In the twelve-month swim year starting September 1st, 2009, there were 6,334
sanctioned, approved and observed meets with 7,237,454 performance times loaded. 13
This amount of data gives researchers much to analyze and competitors many
opportunities to break a record.
Representing an indicator of optimization, record breaks signify the rate of
change in athletic performance, which can potentially correspond to the rate of change
in our global economy. Some economists use record theory to explain the issuance of
patents.14
Economists evaluate sports by using marks of improvement in economic
activities such as manufacturing and software advancements, analyzing technological
change through the frequency of record breaks to better understand discrete decisions
like workers mobility within jobs or success within firms. Record breaks can be more
relevant in answering these questions than actual performance.15
Some people may object to the idea that change in a sport can parallel change in
more central economic activities, because athletics are restricted to human abilities.
However, just as swimming is an individual effort and physical skill, so is writing
software or designing machines. No evidence supports these activities as being different
from one another, thus society is improving in both areas in similar directions. Due to
the many regulations athletes must follow in order to compete, one would expect the
13
Sharon Loving, Swimming Technology Research. Marketing Director. Tallahassee, FL.
(2010): Date Accessed: October, 2010 on swimmingtechnology.com
14
Munasinghe, Lalith, Brendan O‟Flaherty and Stephan Danninger. “Globalization and the Rate
of Technological Progress: What Track and Field Records Show.” Journal of Political Economy 109, no.
5 (2001): 1134
15
IBID

5
rate of technical progress to be slower in athletics. On the other hand, technical
advancements in sports are much clearer than any other economic activity in terms of
their single reason for function: obtaining a better time.16
Background
In order to better understand the evolution of swimming achievement, we must
examine which factors have had the biggest impact on athletic success in the past.
Advanced technology has long been a factor in the development of swimming.
Beginning in the early twentieth century, exercise science emerged in order to observe
the human body and hope to augment performance by expanding biological parameters
and physiological abilities.17
Adolph Kiefer, a 1936 U.S. Olympic swimming champion,
contributed some of the first key innovations to the sport. 18
Founder of aquatics
company Adolph Keifer & Associates, Kiefer helped with the progress of goggles and
non-turbulent lane lines, inventing the first nylon racing suit in 1948. The evolution of
competitive swimsuits in particular proves notable; initially made from wool, they
progressed to Mosquito netting in 1920s, board shorts in the 1940s, racing briefs in the
1950s, lycra in the 1970s, and then finally full bodysuits in 1998.19
A huge technical
jump occurred with the introduction of the first bodysuit: Adidas JetConcept. Adidas
adopted technology used by commercial aircrafts, which helps reduce pool drag and
16
IBID
17
Magdalinski, 5
18
Margaret Schauer, “How Much is Too Much? Evaluating the Impact of Swimming
Innovations” USMS Swimmer (2006): Date Accessed: October, 2010 on www.usmsswimmer.com.
19
IBID
6
influence how water flows around the swimmer‟s body. Designers also incorporated
small riblets into the suit in order to channel water, causing a shift in turbulence and
decreasing the amount of water carried by the swimmer.20
Since the introduction of full
body suits, the media has both marveled and criticized the suits‟ extraordinary light
weight, the welded seams, and even the fabric which attempts to mimic the skin of a
shark or the shape of a jet, luring many competitors into believing they can breaks more
records than ever before. However, the real secret of the new suits lies in their ability to
compress the swimmers body into a more streamlined shape while also prohibiting any
fat or muscle from protruding into the water.21
Matt Zimmer, director of TYR Sport
Inc., believes there is no question as to whether or not these body suits make swimmers
faster: “the proof is in the decreasing times.”22
Furthermore, once Speedo introduced
Fastskin technology, thirteen out of fifteen world records were broken that same year at
the Sydney 2000 Olympics. Swimmers donning the new suit won eighty-three percent
of all medals.23
When Inge de Bruin broke ten records in 2000, the Netherlands
swimmers accredited her huge improvements to modern training regimes and the “lift
provided by a new bodysuit.”24
20
Adidas. (2011): Date Accessed: October, 2010 on www.adidas.com
21
Brenkus, 65
22
Schauer: Date Accessed: October, 2010 on www.usmsswimmer.com.
23
Speedo. Explore the World of Speedo. (2011): Date Accessed: October, 2010 on
http://www.speedousa.com/shop/index.jsp?categoryId=3642946
24
Christopher Clarey. “Syndey 2000: Swimming; Beginning Tomorrow, All Eyes Will Be
Focused on One Pool.” Sydney. The New York Times. Sports. Date accessed: January, 2011 on
http://select.nytimes.com/gst/abstract.html?res=F20D1FF7385C0C768DDDA00894D8404482
7
By declaring the LZR suit legal for competition, FINA opened a Pandora‟s Box
in the swimming world. Suit manufacturers switched completely to polyurethane fabric
and discovered ways of trapping air bubbles in the suit for better buoyancy. Critics
accuse the body suits of “technologic doping” by the unfair increase in buoyancy, which
is a direct violation of the performance enhancing rules set by the international
swimming federation known as FINA.25
In reaction to this swimsuit craze and the
aftermath of the World Championships in Rome, FINA acknowledged that further
measures needed to be taken because the huge surplus in record breaks, thus they
banned full body suits and the polyurethane material. 26
Controversy stirred as a main
concern still lingered; would all the records broken by swimmers wearing the full body
suits still stand or be noted with an asterisk (dubious merit)? FINA then sent out a list of
approved suits, the LZR racer being one of them, to solve this issue.27
Technology and marketing not only helps athletes achieve higher goals, but also
attracts new interest into the sport. However, the question remains how much does
technology affect performance and when will it be considered unfair to the game?
When does scientific intrusion become inappropriate? Are all faster times due to the
increase and higher quality of technology? How do economists even measure sport
technology? In this study, I will not answer the ethical questions, but will focus on the
quantitative measurable one. I expect to see technology have a significantly positive
25
Gina Kolata and Jere Longman, “As Swimming Records Fall, Technology Muddies the
Water” The New York Times (2008): A1
26
IBID
27
Brenkus, 65
8
impact on better trials times resulting in a higher rate of record breaks in swimming
events from 1969-2009.
Relevance
Reviewing the rate of record breaks since 1969, apparent jumps in frequency
occur whenever a technical change is introduced. Overall, the rate of record breaks has
increased significantly over time especially in swimming events.28
Based on data
provided by usaswimming.com, the average number of records broken each year
amount to nearly thirty-one. When the first full bodysuits launched in 2000,29
forty
record breaks occurred in the following year. The records continued to grow and when
most every swimmer conformed to the high quality body suits in 2008,30
swimming
times resulted in eighty-four record breaks that year and seventy-five the following
year. During the World Championship games in Rome, a total of forty-three world
records were broken in the span of eight days while most swimmers at the games were
donning the new high-tech bodysuits made by TYR, Jaked, Arena, and Speedo.31
In the
1500 LCM freestyle, American Kate Ziegler smashed the oldest held record held by
Jane Evans by nearly ten seconds in June, 2007.32
Coincidentally, Speedo‟s new
Fastskin Pro had just been released, which Ziegler donned during her groundbreaking
28
“USA Swimming.” In Depth Event History. (2010): Date accessed: October 2010 on
http://www.usaswimming.org/DesktopDefault.aspx?TabId=1476&Alias=Rainbow&Lang=en
29
Schauer: Date accessed: October 2010 on www.usmsswimmer.com.
30
Kolata: A1
31
“Roma 2009.” (2009) Date accessed: February, 2011 on www.fina.org
32
Saslow, Eli. “New Suit Makes Splash in Debut.” Washington Post Staff Writer. The
Washington Post. (2007): Date accessed: October 2010 on www.washingtonpost.com

9
race.33
Technology appears to be having a huge effect on the performance in swimming,
but the question still remains on the degree to which technology is accountable for the
record breaks.
Although the occurrence of record breaks keeps fans interested and the game
exciting, the multitude of records broken after the introduction of the full bodysuit is
beginning to devalue and question such an accomplishment. In February 2008, the
world record for the 100m swim was 47.84 seconds, and in the previous thirty-six years
the record dropped .09 seconds a year on average.34
When swimmers first donned the
Speedo LZR racer in the Beijing Olympics six months later, the record was broken five
times and the average dropped by .13 seconds every month.35
Nearly four dozen world
records were broken in a six-month span after major swimming companies introduced
these high-tech suits.36
Usually multiple swimmers would break the record in many
events, but only the winner‟s time was counted. After the games, only two records
remained unbroken, both set four years earlier at the Sydney Games: Ian Thorpe‟s 400m
freestyle and Inge de Brujin‟s 100m butterfly.37
All records broken in the Beijing
Olympic Games were by swimmers wearing the new LZR racer suit.38
The NASA
approved suit not only costs $550, but it also takes nearly an hour to get into with the
33
IBID
34
Brenkus, 64
35
IBID
36
Kolata, A1
37
Brenkus, 66-69
38
IBID
10
help of assistants. With the new Jaked suit introduced post-Olympic games, more
records are predicted to fall.39
In addition to swimsuits, newer pools are designed to help absorb wave motion.
The standard competitive pool has a typical minimum depth of two meters. A deeper
pool will reduce the impact of reverberated waves created by the swimmer.40
For
example, the Water Cube pool, which held the 2008 Beijing Olympics, is three meters
deep relative to the standard two meter deep pool in order to alleviate resistance.
Furthermore, Olympic pools are now ten lanes wide for eight swimmers in order to
have the outside lanes serve as buffers to keep waves from reverberating. Officials now
employ plastic buoys as lane dividers in order to redirect water downward instead of
outward. Starting blocks are now nonskid in order to activate a faster take-off and
videos are available in order to monitor stroke counts, distance per stroke, split times,
and biomechanics of takeoffs. The ears of swimmers are even pricked post-race to test
for the difference in lactic acid levels.41
Technology appears to be the most progressive
change affecting swimming and controversy closely follows.
Critics argue about how technical innovations create an inappropriate advantage
for swimmers. The aid of new technology unfairly contrasts today‟s swimmers with
those of the past. Comparing current record times with times made in the 1960s appears
significant, but if you subtract the high-tech swimsuits, the non-turbulent lane lines, the
backwash absorbing gutter system, the deep water depth, flip turns, and goggles, it
39
IBID
40
IBID
41
Kolata, A1
11
would be interesting to see if these times are comparable. Sokolovas also wishes “he
could compare results from the ‟70s, ‟80s and ‟90s to the current results to know exactly
how they are improving because of the suits, technology and training.”42
In order to
provide this solution, this study will show exactly how much impact technology has on
record times, and if we can compare all swimmer abilities regardless of the decade in
which they competed. It also must be understood this paper does not seek to belittle the
natural talent of athletes, but just to understand the process of how excellence is
achieved.
The following chapter will review past studies relevant to athletic performance
in order to determine which factors are most important in influencing record breaks.
Chapter III discusses how this study applies past theory to the current issue, outlining
each significant variable and how we choose to define them in the final models. Chapter
IV then explains how the data was abstracted and what methodology is most
appropriate in handling the frequency of record breaks. Chapter V then presents the
results in several tables, discusses the possible implications, areas of analytical concern,
and any other additional consideration necessary to fully grasp the outcome. The paper
then closes with a final concluding section, summarizing each chapter and the
significance of the study.
42
Kolata, A1
12
CHAPTER II
LITERATURE REVIEW
Several factors must be considered when determining the success of a specific
athlete. In order to recognize which factors are most important for record breaks, we
analyze past sport studies. Past research has shown that the demographic and economic
characteristics of a country have significant explanatory powers for their athletes‟
abilities to prosper in athletic competition. Ever since Ball introduced the economic
model to determine athletic success in 1972,1 follow-up studies emerged, further
investigating relevant influences. In order to lay the foundation for this analysis, these
past studies found the following factors to be most influential in sport success: GDP,
income per capita, population, participation, geography, and technological
advancements.
Most studies recognize GDP and income per capita as the best predictors of
athletic performance because they measure the resources available to athletes regarding
health benefits, training, sponsorships, and infrastructure. Assuming athletic talent is
equally distributed across the world, Bernard and Busse show that success within a
nation defined by Olympic medal counts depends greatly on total GDP because income
per capita and population affect success at a similar level. For example, in the Atlanta
1Donald W Ball, “Olympic Games Competition: Structural Correlates of National Success”
International Journal of Comparative Sociology 12 (1972): 186-200
13
Games, the world‟s poorest 1.5 billion people won only three percent of the medals.2
Similarly, other studies handle GDP and income per capita on separate levels, though
still discover a positive relationship with medal counts. Moosa and Smith believe that
using total GDP is most valuable in determining sport success because it is the correct
measure of volume and a better variable when the objective is to measure the
effectiveness of medal winning. Total GDP is also quantitatively more related to total
medal winning than GDP per capita. Studies also use total GDP and population as
separate variables to see how each affect the dependent variable.3 For example, Johnson
and Ali prove how high income nations have a more pronounced affect in the winter,
while population has a higher affect in the summer.4 How a study defines athletic
success indicates which variable is better to use within the model: total GDP or GDP
per capita. If the output is total medal winning then total GDP is more appropriate, and
if the model tests medal winning per capita, then GDP per capita should be used. GDP
per capita is more appealing as it measures the country‟s ability to pay the costs needed
to send athletes to the Games, thus may be associated with a higher quality of training
success.5
Population of a nation and participation in events also contribute to athletic
success. A larger population size increases success as the nation has a greater talent
pool to choose from. Many researchers use population to predict the number of medal
2 I.A. Moosa and L. Smith, “Economic Development Indicators as Determinants of Medal
Winning at the Sydney Olympics: An Extreme Bound Analysis” Australian Economic Papers 43, no. 3
(2004): 288–301
3 IBID
4 D. K. N. Johnson and A. Ali. “A Tale of Two Seasons: Participation and Medal Counts at
the Summer and Winter Olympic Games.” Social Science Quarterly 85, no. 4 (2004): 974-993
5 Moosa, 293
14
counts for a particular nation. Specifically, Bernard and Busse prove the number of
medal worthy athletes should be proportional to the country‟s share of the world
population.6 Johnson and Ali, who also use population when estimating the total medal
counts, points out the variable‟s significance by showing how countries in 1956 that
won at least one medal averaged six times the population than those that did not win
medals. That figure only drops to five times the population in 1996.7 Conversely,
Rathke and Woitek only found population to be significant with medal counts for richer
countries.8
Furthermore, athlete participation increases the chance of winning more
Olympic medals as more opportunities are available. Kuper and Sterken focus on
significant factors contributing to participation like the host nation, the nation‟s distance
from the games, emancipation, income per capita and legal systems. Similarly, Johnson
and Ali estimate how income per capita affects participation as it costs $260 in GDP per
capita to send an athlete to the games,9 thus richer countries will have more success in
sport as they are able to involve more athletes in competition. Moosa and Smith verify
the impact athlete participation has on winning medals in the Olympic Games.10
Athletic success also depends on the geography of the athlete‟s nation. Johnson
and Ali distinguish nations by measuring the average amount of frost experienced in a
6A.B. Bernard and M.R. Busse, “Who Wins the Olympics: Economic Resources and Medal
Totals” Review of Economics and Statistics 86 (2004): 413–417
7 Johnson and Ali (2004): 974-993
8 Alexander Rathke and Ulrich Woiteck. Economics and Olympics: An Efficiency Analysis
(Working Paper No. 313.) University of Zurich (2007): 12
9 Johnson and Ali (2004): 974-993
10
Moosa, 288–301
15
winter month, in which he finds that colder climates do better than warmer ones.11
Kuper and Sterken also observe geography, though they measure this factor using
latitude and conclude that geographical data does explain athlete participation, affecting
overall success. Altering this definition, Pfau assigns a dummy variable based on the
past achievements of five regions: Soviet, Scandanavia, Germanic, Alpine, and North
America. Pfau discovers stronger performances from Germanic and North American
regions.12
Many different definitions are used in order to measure a countries location,
but most studies show how a country‟s geography has an effect on success in athletics.
Finally, the host nation factor greatly affects the outcome of athlete performance
as most studies agree it may increase familiarity with infrastructure, influence biased
referee calls, offer different events, follow home regulations and time-zone, while also
increasing participation and morale with reduced travel costs and more audience
support.13
Johnson and Ali show how the host nation affects not only medal counts, but
also participation within the games.14
Pfau even proves how Italy collected seven
additional medals due to their host city advantage in the 2006 Olympics.15
Neighboring
nations also have higher medal counts than their peers, but only during the summer
games.16
While every relevant study includes the host nation variable due to its
11
Johnson and Ali (2004), 974-993
12
Wade D. Pfau, “Predicting the Medal Wins By Country at the 2006 Winter Olympic
Games: An Econometrics Approach.” The Korean Economic Review 22, no. 2 (2006): 233-247
13Bernard, 413–417
14
Johnson and Ali (2004), 974-993
15
Pfau, 233-247
16
IBID
16
significance, the values differ in each study as the varying explanatory variables react
differently with each other in every model.
Many other variables need to be taken into consideration when analyzing the
reasons for success. The difference in political systems or gender appear to have a small
effect on athlete participation as Johnson demonstrates,17
while other studies believe the
soviet socialist countries increase the chance of success.18
Both Kuper and Johnson/Ali
find that socialist countries send more athletes into athletic competition resulting in
better success with medal counts at the Olympic Games.19
Pfau also examines past
share of medals in order to take into account the momentum of a country and existing
infrastructure.20
This variable can be thought of as a veteran factor where countries and
athletes who have performed well in the past expect some inertia in winning future
medals. Other factors include the importance and availability of an event to society.21
A
country offering more opportunities for citizens to compete in sport will perform better
at a higher level due to experience. Furthermore, society will be more engaged in events
popular within the country, thus the country should expect to perform better within
those particular events.
17
Johnson and Ali (2004), 974-993
18
Rathke: 12 and Johnson and Ali (2004), 974-993
19
Gerard Kuper and Elmer Sterken, The Olympic Winter Games: Participation and
Performance (Working paper). Department of Economics. University of Groningen (2001): 11
20
Pfau, 233-247
21
Rathke, 12
17
Government expenditure on athletics also appears to influence sport success.22
Moosa and Smith feel that if a country invests more money on health and education, as
opposed to defense (military expenditure), then more money should also be expected to
support athletic expenses.23
Furthermore, boycotted Games,24
the presence of doping, 25
world wars, accurate timing,26
consumption of cigarettes, unemployment and gender
equality27
have all been shown to have an impact on success in athletics.
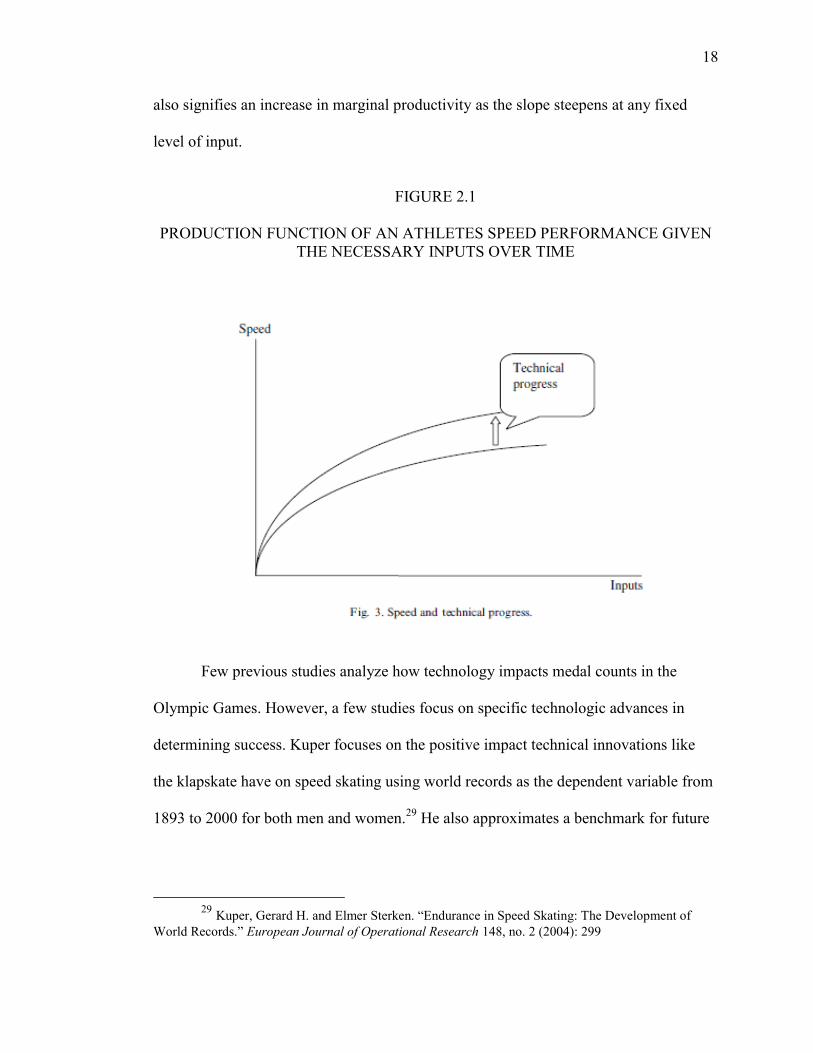
Kuper and Sterken provide a figure (FIGURE 2.1) in order to better understand
how an athlete maximizes his/her performance.28
Over time, athletic success should
occur with the average speed consistently increasing in the upward sloping curve,
representing the natural trend of athlete development. The function also illustrates
diminishing returns to any given input, thus over a period of time, the rate of speed will
begin to decelerate as it reaches its maximum point. The only factor that can shift the
function higher is a major technical innovation, thus technology should be valued
highly because it raises the production function to a new higher level. The vertical jump
22 Moosa, 300
23
Moosa, 288–301
24
Kuper, 5
25
W. Maennig, “On the Economics of Doping and Corruption in International Sports”
Journal of Sports Economics 3, no.1 (2002): 61-89
26
Munasinghe, Lalith, Brendan O‟Flaherty and Stephan Danninger. “Globalization and the Rate
of Technological Progress: What Track and Field Records Show.” Journal of Political Economy 109, no.
5 (2001): 1143
27
Moosa, 298
28
Gerard Kuper and Elmer Sterken. “Endurance in Speed Skating: The Development
of World Records.” European Journal of Operational Research 148, no. 2 (2004): 293-301
18
also signifies an increase in marginal productivity as the slope steepens at any fixed
level of input.
FIGURE 2.1
PRODUCTION FUNCTION OF AN ATHLETES SPEED PERFORMANCE GIVEN
THE NECESSARY INPUTS OVER TIME
Few previous studies analyze how technology impacts medal counts in the
Olympic Games. However, a few studies focus on specific technologic advances in
determining success. Kuper focuses on the positive impact technical innovations like
the klapskate have on speed skating using world records as the dependent variable from
1893 to 2000 for both men and women.29
He also approximates a benchmark for future
29
Kuper, Gerard H. and Elmer Sterken. “Endurance in Speed Skating: The Development of
World Records.” European Journal of Operational Research 148, no. 2 (2004): 299
19
world records given the current level of technology based on the klapskate‟s impact on
the long-run limit value.30
Similarly, Munasinghe tests the influence of technology and globalization on
both international records set by anyone and local records set by members of a fixed
population (United States and New Jersey Highschool). 31
This study defines technology
as better equipment, more accurate timing, elimination of smoking, improved running
surfaces, nutrition, medical care, and training techniques. Including men‟s records from
1896, Munasinghe shows how technology maintains the frequency of record breaks in
track and field by identifying technical changes with the “number of draws,” and then
applying a computational assumption with logarithmically proportional models.32
However, no evidence indicates this process as speeding up or slowing down.
Comparably, Haake also assesses the effect of technology in sport; however, he
measures success with records through a performance improvement index in only four
Olympic events.33
Haake examines specific occasions when a new technology was
introduced to the game and found its specific effects on performance using a parametric
study. Demonstrating that all events owe some improvement of performance to
technology, Haake uses data spanning 1845-2004 to find that cycling is most sensitive
to the influences of technology. The index shows how cycling times have improved by
221% over 111 years, 45% of which are accountable to technological improvements.
30
IBID
31
Munasinghe, 1132
32
Munasinghe, 1137
33
S.J. Haake, “The Impact of Technology on Sporting Performance in Olympic Sports” Journal
of Sports Sciences 27, no. 13 (2009): 1421
20
Specifically, he focuses on the introduction of the new carbon fiber frame in the 1980s
and how it increases bike speed by 5km/h, 24% of the improvement due to its
enhancement in aerodynamics.34
The performance improvement index proves to be
useful in evaluating the effect of an external intervention in sports measured using time
or distance.
A case study conducted by Pyne estimates progression and variability in swim
times in order to show which factors affect performance.35
This study examined 676
official race times comprised of twenty-six US and twenty-five Australian Olympic
swimmers in the twelve- month period leading to the 2000 Olympic Games.
Progression was defined as the percent change in mean performance, while variability
was measured as the coefficient of variation in performance of an individual swimmer.
Within their sample, results show how additional enhancement has improved the
performance times of athletes by approximately 0.4%.36
A more recent study conducted by Tiozzo, et al. proved how new body suits
worn by competitive swimmers improved performance in controlled trials.37
They
specifically focused on Speedo‟s Fastskin suit in the 50m crawl race. The research
analyzed fifteen male national and international level swimmers who swam two trials,
one in a regular suit and one in the body suit. The test resulted in an overall faster race
34
Haake, 1421-1431
35
David B. Pyne, Cassie B. Trewin and William G. Hopkins, “Progression and Variability of
Competitive Performance of Olympic Swimmers.” Journal of Sports Science 22, no.7 (2004): 613-620
36
IBID, 618
37
E. Tiozzo, G. Leko, and L. Ruzic, “Swimming Bodysuit in All-Out and Constant-Pace
Trials.” Biology of Sport, 26, no. 2 (2009): 149-156

21
time for the body suit, specifically in the turn time, split time, streamlining and turn
kicking. This study concluded that body suits enhance performance by 1.6% (.41s).
They also measured the differences in fatigue with each swimsuit. While swimming in
the Fastskin, the racers‟ blood lactate concentrations and heart rate were significantly
lower even though the number of strokes was the same in both suits.38
In conclusion, past research shows which variables should be incorporated in the
final models in order to best predict athletic success. We also validate the focus on
technology by providing studies that have already discovered the degree to which
technology makes a difference in sport success. Due to the limited approaches and
scenarios existing, this study hopes to add another perspective to the current research by
redefining technology and achievement through record breaks.
38
IBID
22
CHAPTER III
THEORY
The purpose of this research is to study which factors affect record breaks in
swimming. In other studies, technological innovations have proven to be a major reason
why athletes continue to break records consistently and at a higher frequency. However,
this study differs from the previous literature as it observes all record breaks from 1969-
2009, while controlling for economic factors. With so many different types of technical
alterations, it is nearly impossible to account for every change that has shaped
swimming into its current form. Thus, I specifically narrow the definition by including
all changes in swimsuits and fabrics as they have created heated controversy in recent
swimming news. Other major technologic changes to the sport have been included by
discretion; however, equipment serves as the major characterization of technology.
By analyzing the performance times of past record breaks, the study examines
the progression of optimal times. Along with technology, this paper will also be adding
significant economic factors into the models in order to better explain the frequency of
record breaks. Gross Domestic Product and population of the swimmer‟s home nation
prove to be big contributors in sport performance. From the literature review, older
studies prove these variables significance when examining factors for athletic success
specifically with medal wins in the Olympic Games. GDP of a nation for that year will
allow the model to take into account the wealth of the swimmer‟s national country.
23
Population will show how many people have the opportunity to break a swimming
record within that nation. However, they may not play as significant a part in the
occurrence and quality of record breaks because the observations include mainly the
wealthiest countries. In fact, only twenty-five countries have provided record-breaking
athletes since 1969 with most breaks earned by USA (288), Germany (154), and
Australia (103).1
Studies also show how location affects athletic performance. An athlete proves
to do better if they compete within their home country. A similar, but less significant
influence holds true for an athlete competing in a country neighboring his/her home
nation. I consider these factors by assigning dummy variables to an athlete competing in
his/her home or a neighboring nation. A record will more likely be broken close to the
athlete‟s home because of reasons discussed previously: national support, travel costs
and availability.
Experience in record breaking also has a huge influence on whether a swimmer
breaks another record. If a swimmer has proven his/her ability to break a record in the
past then that athlete has the highest chance of breaking another record because they
have already proven to be the fastest at that time. Thus, I have assigned another set of
dummy variables to the record breakers who were already the past current record holder
or if they were the holder for the past four years of that particular event. This factor
serves as a proxy for the veteran variable as it suggests past record breakers are more
likely to break another record due to momentum and proven capability.
1 “USA Swimming.” In Depth Event History. (2010): Date accessed: October 2010 on
http://www.usaswimming.org/DesktopDefault.aspx?TabId=1476&Alias=Rainbow&Lang=en
24
Specific swimmers tend to break many records, thus accounting sport success to
natural born athletes. Swimmers such as Mark Spitz (USA), Kornelia Ender (GER), and
Michael Phelps (USA), are partly responsible for the high record breaks in 1972, 1976
and 2009, respectively. In order to account for these athletes, I have created a star
athlete dummy variable by denoting a “1” to every athlete that has broken at least three
records in any event or year. Furthermore, since star athletes are responsible for many
record breaks, we also explore this variable as a dependent variable to examine which
economic factors help exceptional athletes compete at their fullest potential.
Geography is suggested as another factor contributing to record breaks. I define
geography as the latitude of a countries capital in order to find the vertical distance
between the swimmers home nation and the equator. Colder nations tend to outperform
competitors in both summer and winter events, thus the higher the latitude, the more
likely an athlete should break a record. Again, due to the exclusion of all other
competing nations, the results for latitude may not be as accurate if most of the
countries included are already considered cold nations. Also, athletes will most likely
not reside in the exact latitude specified especially depending on the size of the country.
For example, USA‟s latitude is pinpointed at 41.61°N, but if the athlete lives and trains
in San Diego, California, then the corresponding latitude should be 32.49°N, nearly ten
degrees lower then that athletes assigned latitude.
There are many factors this study should consider, yet we lack sufficient data to
include. However, we will proceed to outline and discuss the potential impact of the
following variables: the number of official meets offered each year, popularity,
government expenditure on sports, sponsorships, doping regulations, technique changes,
25
sports nutrition and the quality of technological innovation. As mentioned before, the
opportunities available for swimmers to break a World or American record are
abundant; however, our data does not cover how opportunities have changed since
1969. Availability of a certain sport within a specific town, nation or even the world can
certainly contribute to the number of records broken each year.
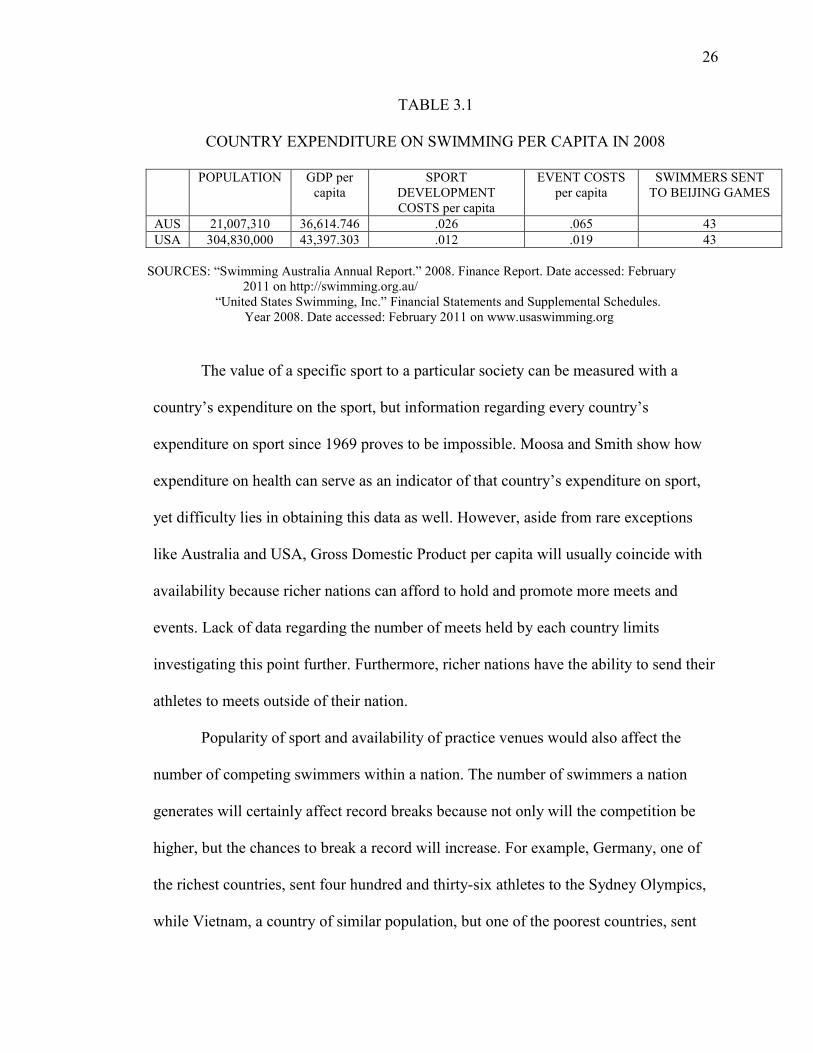
Even if a country is rich, how much of their expenditure and focus is spent on
swimming? In other words, the importance of a sport reflects how well a country will
do because they will offer more opportunities to participate and compete. If one
swimmer has only one chance a year to break a record relative to another swimmer who
has twenty chances to break a record, odds of breaking a record favor the swimmer with
more opportunities based on pure probability. For example, swimming is popular in
Australia due partially to its close relationship with the ocean and long-standing
tradition. Even though USA is a richer nation, the Australian government spends more
money per capita on swimming activities as shown in TABLE 3.1, rewarding the nation
with many record-breaking swimmers. USA has a higher population and GDP, yet both
countries sent the same amount of swimmers to the 2008 Beijing Olympic Games.
Furthermore, a higher government expenditure on sports can lead to better training and
coaching, both essential elements to the development of an athlete.
26
TABLE 3.1
COUNTRY EXPENDITURE ON SWIMMING PER CAPITA IN 2008
POPULATION GDP per
capita
SPORT
DEVELOPMENT
COSTS per capita
EVENT COSTS
per capita
SWIMMERS SENT
TO BEIJING GAMES
AUS 21,007,310 36,614.746 .026 .065 43
USA 304,830,000 43,397.303 .012 .019 43
SOURCES: “Swimming Australia Annual Report.” 2008. Finance Report. Date accessed: February
2011 on http://swimming.org.au/
“United States Swimming, Inc.” Financial Statements and Supplemental Schedules.
Year 2008. Date accessed: February 2011 on www.usaswimming.org
The value of a specific sport to a particular society can be measured with a
country‟s expenditure on the sport, but information regarding every country‟s
expenditure on sport since 1969 proves to be impossible. Moosa and Smith show how
expenditure on health can serve as an indicator of that country‟s expenditure on sport,
yet difficulty lies in obtaining this data as well. However, aside from rare exceptions
like Australia and USA, Gross Domestic Product per capita will usually coincide with
availability because richer nations can afford to hold and promote more meets and
events. Lack of data regarding the number of meets held by each country limits
investigating this point further. Furthermore, richer nations have the ability to send their
athletes to meets outside of their nation.
Popularity of sport and availability of practice venues would also affect the
number of competing swimmers within a nation. The number of swimmers a nation
generates will certainly affect record breaks because not only will the competition be
higher, but the chances to break a record will increase. For example, Germany, one of
the richest countries, sent four hundred and thirty-six athletes to the Sydney Olympics,
while Vietnam, a country of similar population, but one of the poorest countries, sent
27
seven athletes.2 No athlete from Vietnam has ever broken a swimming record.
However, accounting for every open meet and competing swimmer each nation
produces each year since 1969 proves to be impossible due to the absence of
information. Thus, we must assume GDP per capita will capture some of these
influences in the model.
The emergence and growth of sponsorships could also have an effect on annual
record break counts. As sponsorships reward more competitive swimmers with an
increase in funds, more record breaks should occur due to the newly created
opportunities and higher quality of equipment and coaching. However, little information
exists on the number of sponsored swimmers each year especially for every country.
The presence of doping in swimming events appears to be the hardest variable to
measure. An athlete taking performance enhancing drugs would certainly affect record
breaks. Again, it would be impossible to observe which athletes violate or abide by the
drug policy.3 We could potentially examine how each country‟s doping regulations
differ in severity, but this information would not only be difficult to quantify, but also
inaccessible for each country and year. Thus, we must acknowledge this variable as a
plausible factor, but it cannot be applied to the model without avoiding large
assumptions about the athlete.
Changes in technique are also abundant in swimming. Shaving off milliseconds
from a swimmer‟s lap time could make the difference in breaking a record or not.
2 I. A. Moosa and L. Smith, “Economic Development Indicators as Determinants of Medal
Winning at the Sydney Olympics: An Extreme Bound Analysis” Australian Economic Papers 43, no. 3
(2004): 288–301
3 Maennig, W. “On the Economics of Doping and Corruption in International Sports.”
Journal of Sports Economics 3, no. 1 (2002): 61-89
28
Unless we interview each competing swimmer since 1969, all technique changes would
be impossible to account for as no public knowledge exists about the technique used by
every swimmer. In fact, most technique changes occur secretly in order to have an edge
over the competition. For example, an engineering professor of Rensselaer Polytechnic
Institute, Tim Wei, has been conducting confidential experiments on how water flows
and reacts to a swimmer‟s body.4 By sending his results to top swimming authorities,
coaches are able to better instruct swimmers for maximum performance by eliminating
superfluous milliseconds from their lap times. This type of innovation creates more
potential to break records; however, technique change cannot be accounted for in the
model due to its subtlety and differences among all swimmers.
Nutrition and weightlifting also serve as major components in enhancing an
athlete‟s performance. With the growing knowledge of sports nutrition, athletes are able
to energize their bodies properly for high competition.5 Furthermore, weight training
varies for different sports, thus as our knowledge base grows towards appropriate lifting
for specific sports, more swimmers will build certain muscles for optimal performance
in the pool. For example, most of the twenty-seven swimming records Germany broke
in 1976 were achieved by German women like Kornelia Ender. When searching for the
reason in Germany‟s swimming success, The Tuscaloosa News reported the apparent
difference in American and German swim programs, claiming most “American women
do not lift weights, while the German and Russian women can almost always be picked
4 Michael Hill. “Swimmers „See‟ the Water with Help of Professor.” (2008): Date accessed:
October 2010 on http://swimming.teamusa.org/news/2008
5 Charles B. O‟Neil and Peter G. Akintunde. Optimizing Athletes’ Performance Excellence and
Wellness through Nutrition and Exercise. (Working Paper). University of Calabar (2010)
29
out of a swimming lineup because their shoulders resembles those of pro football
players.”6
Finally, this study focuses on technology as the main variable in improving
athletic performance. As discussed in Chapter II, the production function in TABLE 2.1
measures an athlete‟s potential in success with technology as the only factor to
completely raise the output level. Record breaks can be regarded as the output resulting
from a production function in which the explanatory variables serve as the inputs
creating the base function of an athlete‟s potential. Diminishing returns also
appropriately apply to the growth of record breaks as we would expect the difficulty in
breaking records to increase as every additional record was broken, thus the frequency
would slowly decline. In order to sustain the occurrences of record breaks, technology
needs to improve in order avoid diminishing returns. In order to define innovations, this
study obtains information on every introduction of a new swimsuit, fabric, or other
major innovation since 1969. The value of each technological innovation should have a
huge effect on the incidence and quality of record breaks, but this study fails to answer
how the quality of technology changes due to the difficulties in quantifying the
influential values of each innovation.
The technology variable has many limitations and assumptions. First, it is
impossible to include every single technology innovation made for the sport of
swimming due to its abundance, confidentiality and time. Thus, the innovations used
are based on pure discretion, which may bias results. Also, the study must assume every
6 “Name That Tune.” The Tuscaloosa News. (1976): Date Accessed: February, 2011 on
http://news.google.com/newspapers?id=rUYgAAAAIBAJ&sjid=650EAAAAIBAJ&pg=6816,74269&dq
=history+of+germany+competitive+swimming&hl=en

30
technology introduced is available to every competing athlete, however this may not be
the case as poorer countries or unsponsored athletes may not be able to afford expensive
swimsuits. Finally, the data assumes each technology introduced has an equal effect on
a swimmer‟s potential performance. We further explain exactly how technology is
defined, found, and implemented in the next section.
31
CHAPTER IV
DATA AND METHODOLOGY
Many factors contribute to the frequency and magnitude of record breaks in
athletics. By reviewing the existing literature, this chapter will summarize the data
collected for each variable utilized later in the models and mention all possible
limitations. The data will be described using summary statistics and confirmed through
pair-wise correlations between all variables. We will then discuss the methodology used
in this study based on the different dependent variables tested.
Data
The data focuses on world swimming record breaks ranging from 1969-2009.
Three different data sets are included in the analysis: one includes the number of total
record breaks, both American and world; another incorporates each countries annual
record break; while the last contains every individual record break. The total record
break data set includes only 41 observations, using the annual number of records broken
each year since 1969. Due to limited observations, the other data sets hope to strengthen
the results by supplying more observations. The individual record break data set
includes 666 observations, examining every athlete who broke a World record, and the
country data set contains 1025 observations by including the twenty-five countries that
have ever contributed to a world record in swimming. This data set includes each

32
involved country every year over the forty-one year span, thus resulting in 1025
observations.
The data set describing every individual record break is provided by
usaswimming.org1 and confirmed by Christer Magnusson.
2 These two sources provide
the specific athlete‟s name, nationality, event, gender, performance time, location and
date of the break. In order to obtain GDP per capita for each athlete, ers.usda.gov
provides the measures of both population3 and Gross Domestic Product.
4 The data year
range was limited from 1969 to 2009 because ers.usda.gov only stretched their
international observations to 1969 and usaswimming.org only provided record breaks
up to 2009. Furthermore, the data combines all German athletes, East and West,
because the GDP/population source only provides measures for Germany. The study
acknowledges that merging East and West Germany may skew results due to the post-
reunification phase; however, public sources limit the data to this option. TABLE 4.1
provides the summary of statistics for the individual record break data set. Specific
latitudes of countries were taken from Daniel Johnson‟s personal data set online used
1 “USA Swimming,” In Depth Event History. (2010): Date accessed: October 2010 on
http://www.usaswimming.org/DesktopDefault.aspx?TabId=1476&Alias=Rainbow&Lang=en
2 Christer Magnusson, Records. (2010): Date accessed: October 2010 on
http://www.scmsom.se/records/statistics/World%20Record%20Progression.htm
3 Matthew Shane, Historical Population and Growth Rates in Population for Baseline
Countries/Regions. Economic Research Service. (2010): Date accessed: October 2010 on
http://www.ers.usda.gov/Data/Macroeconomics/
4 Matthew Shane, Real Historical Gross Domestic Product (GDP) and Growth Rates of
GDP. Economic Research Service (2010): Date accessed: October 2010 on
http://www.ers.usda.gov/Data/Macroeconomics/
33
for his Olympic study,5 while also being aided by the World Latitudes and Longitudes
online.6 All additional variables except technology were manipulated using the
information given from the sources mentioned.
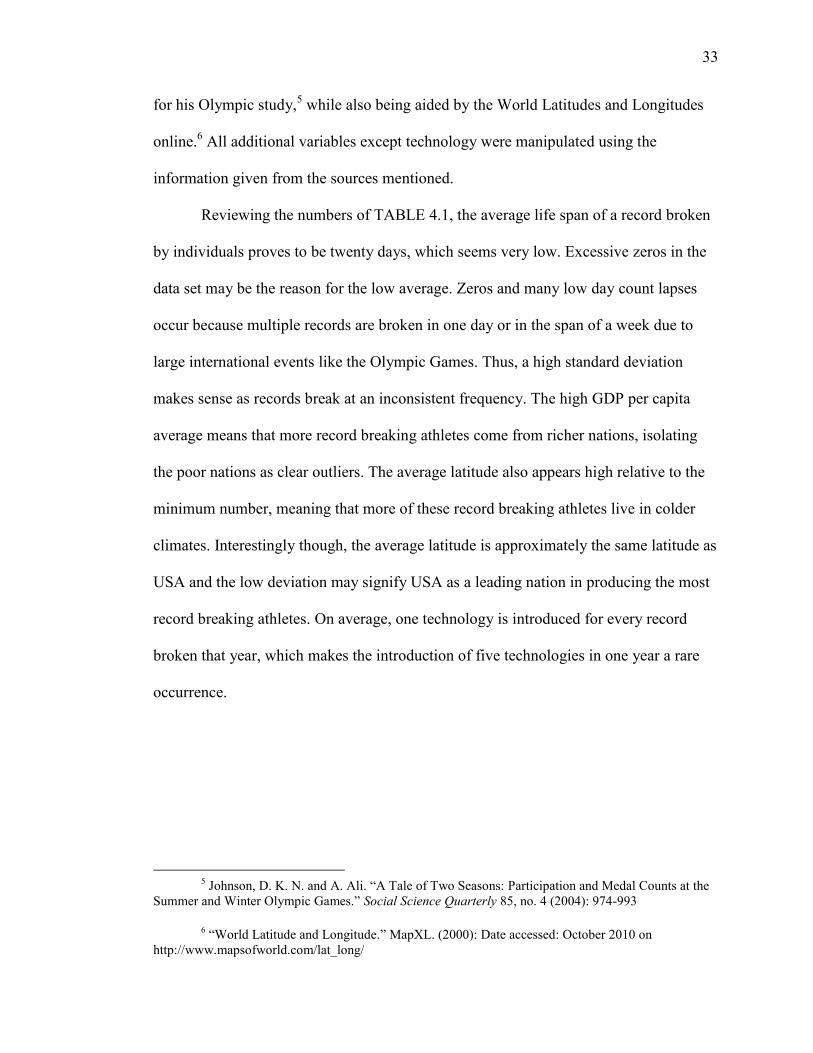
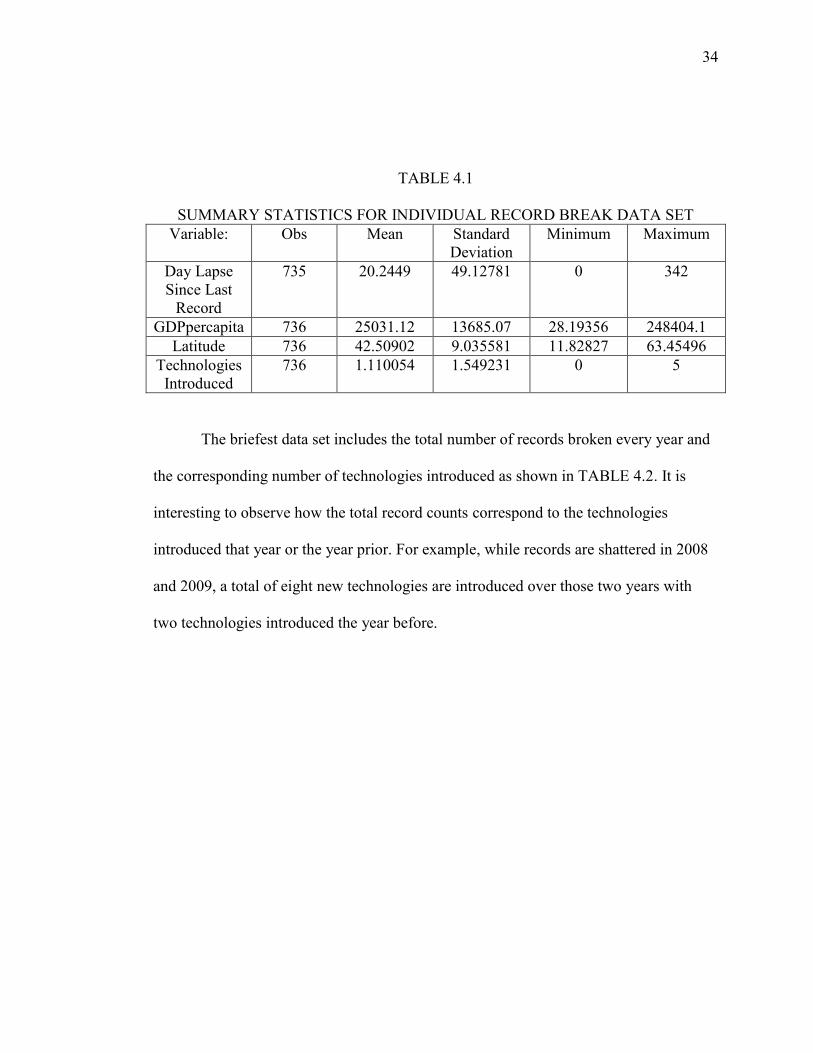
Reviewing the numbers of TABLE 4.1, the average life span of a record broken
by individuals proves to be twenty days, which seems very low. Excessive zeros in the
data set may be the reason for the low average. Zeros and many low day count lapses
occur because multiple records are broken in one day or in the span of a week due to
large international events like the Olympic Games. Thus, a high standard deviation
makes sense as records break at an inconsistent frequency. The high GDP per capita
average means that more record breaking athletes come from richer nations, isolating
the poor nations as clear outliers. The average latitude also appears high relative to the
minimum number, meaning that more of these record breaking athletes live in colder
climates. Interestingly though, the average latitude is approximately the same latitude as
USA and the low deviation may signify USA as a leading nation in producing the most
record breaking athletes. On average, one technology is introduced for every record
broken that year, which makes the introduction of five technologies in one year a rare
occurrence.
5 Johnson, D. K. N. and A. Ali. “A Tale of Two Seasons: Participation and Medal Counts at the
Summer and Winter Olympic Games.” Social Science Quarterly 85, no. 4 (2004): 974-993
6 “World Latitude and Longitude.” MapXL. (2000): Date accessed: October 2010 on
http://www.mapsofworld.com/lat_long/
34
TABLE 4.1
SUMMARY STATISTICS FOR INDIVIDUAL RECORD BREAK DATA SET
Variable: Obs Mean Standard
Deviation
Minimum Maximum
Day Lapse
Since Last
Record
735 20.2449 49.12781 0 342
GDPpercapita 736 25031.12 13685.07 28.19356 248404.1
Latitude 736 42.50902 9.035581 11.82827 63.45496
Technologies
Introduced
736 1.110054 1.549231 0 5
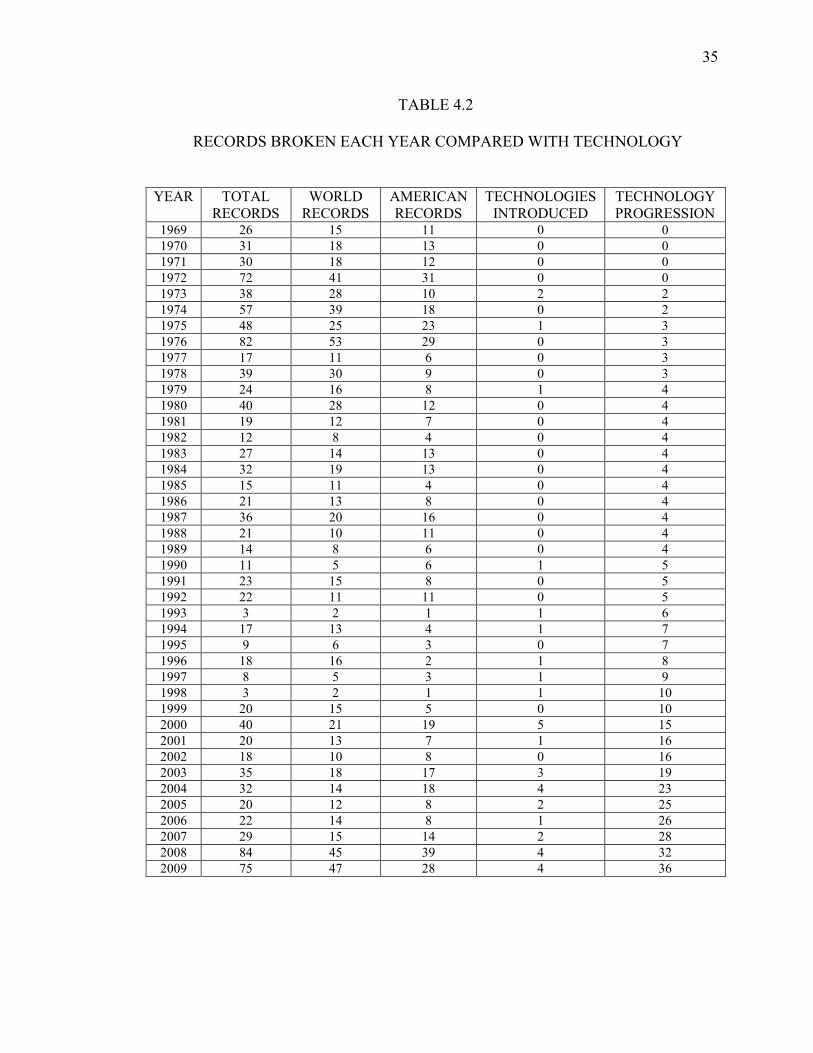
The briefest data set includes the total number of records broken every year and
the corresponding number of technologies introduced as shown in TABLE 4.2. It is
interesting to observe how the total record counts correspond to the technologies
introduced that year or the year prior. For example, while records are shattered in 2008
and 2009, a total of eight new technologies are introduced over those two years with
two technologies introduced the year before.
35
TABLE 4.2
RECORDS BROKEN EACH YEAR COMPARED WITH TECHNOLOGY
YEAR TOTAL
RECORDS
WORLD
RECORDS
AMERICAN
RECORDS
TECHNOLOGIES
INTRODUCED
TECHNOLOGY
PROGRESSION 1969 26 15 11 0 0
1970 31 18 13 0 0
1971 30 18 12 0 0
1972 72 41 31 0 0
1973 38 28 10 2 2
1974 57 39 18 0 2
1975 48 25 23 1 3
1976 82 53 29 0 3
1977 17 11 6 0 3
1978 39 30 9 0 3
1979 24 16 8 1 4
1980 40 28 12 0 4
1981 19 12 7 0 4
1982 12 8 4 0 4
1983 27 14 13 0 4
1984 32 19 13 0 4
1985 15 11 4 0 4
1986 21 13 8 0 4
1987 36 20 16 0 4
1988 21 10 11 0 4
1989 14 8 6 0 4
1990 11 5 6 1 5
1991 23 15 8 0 5
1992 22 11 11 0 5
1993 3 2 1 1 6
1994 17 13 4 1 7
1995 9 6 3 0 7
1996 18 16 2 1 8
1997 8 5 3 1 9
1998 3 2 1 1 10
1999 20 15 5 0 10
2000 40 21 19 5 15
2001 20 13 7 1 16
2002 18 10 8 0 16
2003 35 18 17 3 19
2004 32 14 18 4 23
2005 20 12 8 2 25
2006 22 14 8 1 26
2007 29 15 14 2 28
2008 84 45 39 4 32
2009 75 47 28 4 36
36
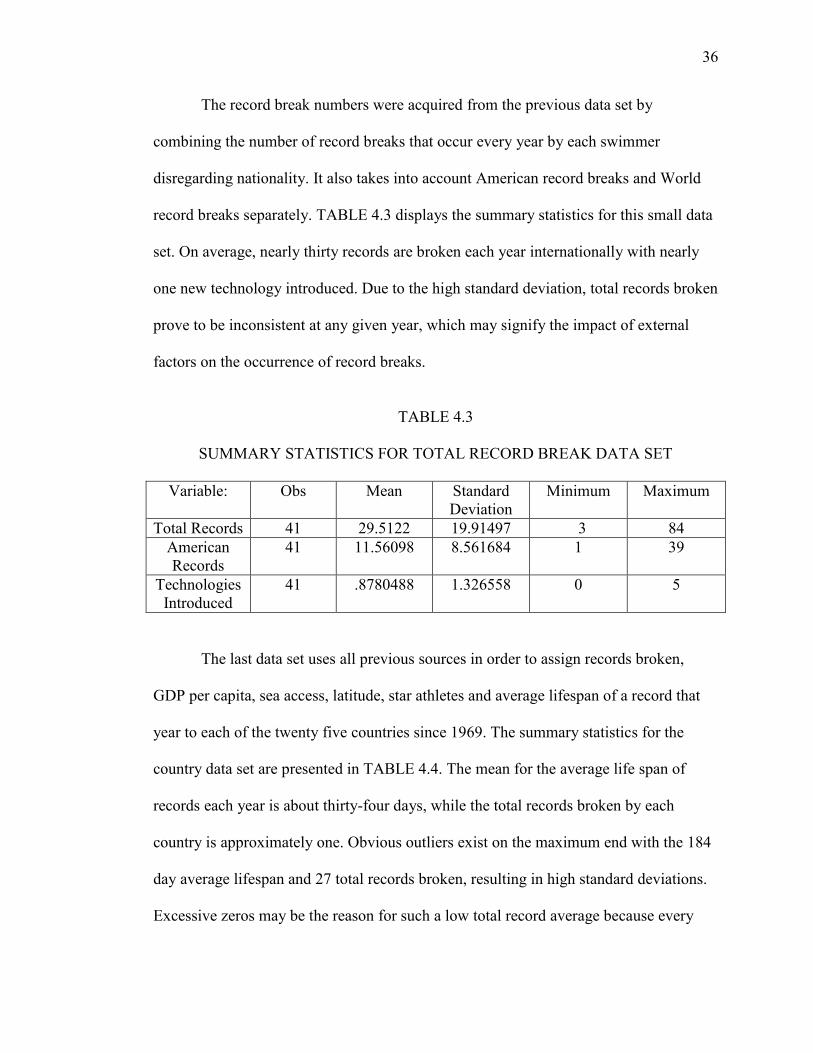
The record break numbers were acquired from the previous data set by
combining the number of record breaks that occur every year by each swimmer
disregarding nationality. It also takes into account American record breaks and World
record breaks separately. TABLE 4.3 displays the summary statistics for this small data
set. On average, nearly thirty records are broken each year internationally with nearly
one new technology introduced. Due to the high standard deviation, total records broken
prove to be inconsistent at any given year, which may signify the impact of external
factors on the occurrence of record breaks.
TABLE 4.3
SUMMARY STATISTICS FOR TOTAL RECORD BREAK DATA SET
Variable: Obs Mean Standard
Deviation
Minimum Maximum
Total Records 41 29.5122 19.91497 3 84
American
Records
41 11.56098 8.561684 1 39
Technologies
Introduced
41 .8780488 1.326558 0 5
The last data set uses all previous sources in order to assign records broken,
GDP per capita, sea access, latitude, star athletes and average lifespan of a record that
year to each of the twenty five countries since 1969. The summary statistics for the
country data set are presented in TABLE 4.4. The mean for the average life span of
records each year is about thirty-four days, while the total records broken by each
country is approximately one. Obvious outliers exist on the maximum end with the 184
day average lifespan and 27 total records broken, resulting in high standard deviations.
Excessive zeros may be the reason for such a low total record average because every
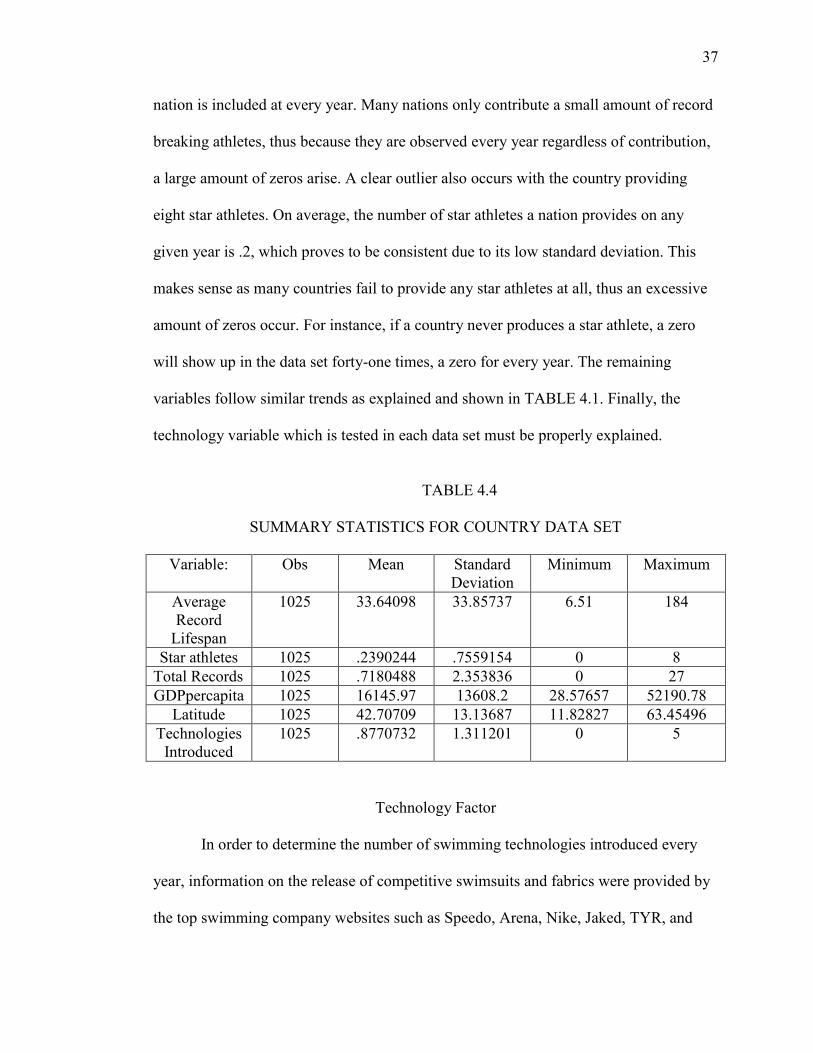
37
nation is included at every year. Many nations only contribute a small amount of record
breaking athletes, thus because they are observed every year regardless of contribution,
a large amount of zeros arise. A clear outlier also occurs with the country providing
eight star athletes. On average, the number of star athletes a nation provides on any
given year is .2, which proves to be consistent due to its low standard deviation. This
makes sense as many countries fail to provide any star athletes at all, thus an excessive
amount of zeros occur. For instance, if a country never produces a star athlete, a zero
will show up in the data set forty-one times, a zero for every year. The remaining
variables follow similar trends as explained and shown in TABLE 4.1. Finally, the
technology variable which is tested in each data set must be properly explained.
TABLE 4.4
SUMMARY STATISTICS FOR COUNTRY DATA SET
Variable: Obs Mean Standard
Deviation
Minimum Maximum
Average
Record
Lifespan
1025 33.64098 33.85737 6.51 184
Star athletes 1025 .2390244 .7559154 0 8
Total Records 1025 .7180488 2.353836 0 27
GDPpercapita 1025 16145.97 13608.2 28.57657 52190.78
Latitude 1025 42.70709 13.13687 11.82827 63.45496
Technologies
Introduced
1025 .8770732 1.311201 0 5
Technology Factor
In order to determine the number of swimming technologies introduced every
year, information on the release of competitive swimsuits and fabrics were provided by
the top swimming company websites such as Speedo, Arena, Nike, Jaked, TYR, and
38
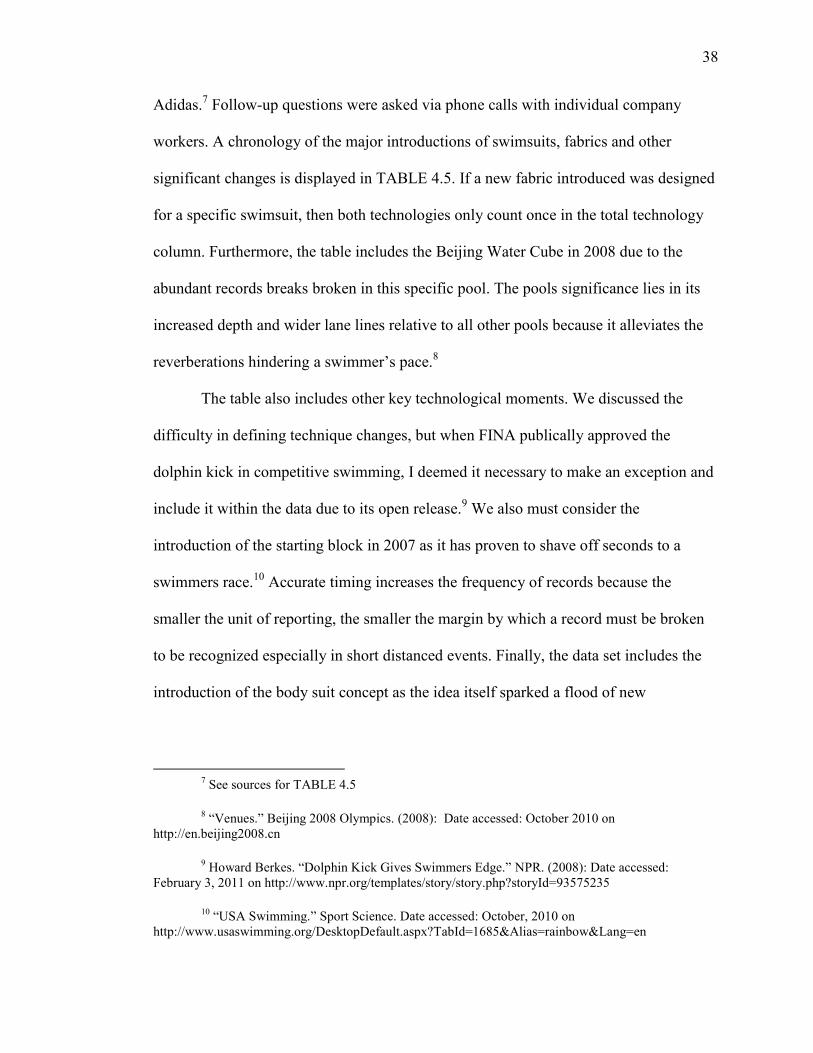
Adidas.7 Follow-up questions were asked via phone calls with individual company
workers. A chronology of the major introductions of swimsuits, fabrics and other
significant changes is displayed in TABLE 4.5. If a new fabric introduced was designed
for a specific swimsuit, then both technologies only count once in the total technology
column. Furthermore, the table includes the Beijing Water Cube in 2008 due to the
abundant records breaks broken in this specific pool. The pools significance lies in its
increased depth and wider lane lines relative to all other pools because it alleviates the
reverberations hindering a swimmer‟s pace.8
The table also includes other key technological moments. We discussed the
difficulty in defining technique changes, but when FINA publically approved the
dolphin kick in competitive swimming, I deemed it necessary to make an exception and
include it within the data due to its open release.9 We also must consider the
introduction of the starting block in 2007 as it has proven to shave off seconds to a
swimmers race.10
Accurate timing increases the frequency of records because the
smaller the unit of reporting, the smaller the margin by which a record must be broken
to be recognized especially in short distanced events. Finally, the data set includes the
introduction of the body suit concept as the idea itself sparked a flood of new
7 See sources for TABLE 4.5
8 “Venues.” Beijing 2008 Olympics. (2008): Date accessed: October 2010 on
http://en.beijing2008.cn
9 Howard Berkes. “Dolphin Kick Gives Swimmers Edge.” NPR. (2008): Date accessed:
February 3, 2011 on http://www.npr.org/templates/story/story.php?storyId=93575235
10
“USA Swimming.” Sport Science. Date accessed: October, 2010 on
http://www.usaswimming.org/DesktopDefault.aspx?TabId=1685&Alias=rainbow&Lang=en

39
innovations.11
After presenting how each factor is taken into account, definitions of all
variables in the data sets exist in TABLE 4.5.
11
Bernd Feldmann. “The Jet Concept.” Date accessed: October, 2010 on
http://www.swim.ee/index.html
40
TABLE 4.5**
CHRONOLOGY DESCRIPTION OF SWIMSUIT INNOVATIONS RANGING
FROM 1969-2009
YEAR* SWIMSUIT
INTRODUCED
NEW
FABRICS
OTHER TOTAL
TECHNOLOGY 1972 - Speedo
discovers
nylon/elastine
- 1
1973 Arena Skinfit - 1
1975 - Speedo
discover lycra
material
- 1
1979 Arena Flyback - - 1
1990 Arena Aqua Racer - - 1
1993 - Speedo S2000 1
1994 Speedo Endurance Speedo Four-
Way Stretch
- 1
1996 - Aquablade - 1
1997 Arena Xflat - - 1
1998 - - Adidas
introduces body
suit concept
1
2000 Speedo Fastskin, Diana
Submarine, Nike Lift, TYR
Aquapel, Arena Powerskin
- - 5
2001 - Speedo FS - 1
2003 Adidas Jet Concept, TYR
Aquashift, Nike Swift
- - 3
2004 XD Skin, Arena Powerskin
Xtreme, Speedo FastskinII,
Arena Powerskin X-treme
Speedo FSII - 4
2005 TYR Fusion - Fina allows
dolphin kick
2
2006 Speedo Fastskin Pro - - 1
2007 - Speedo
FSPRO
**FINA allows
creation of
starting block by
Omega
2
2008 TYR Tracer Light, TYR
Tracer Rise, Speedo LZR
Racer
Speedo LZR
Racer Pulse
Polyurethane
*Beijing Water
Cube increases
pool depth by 3
meters
4
2009 Arena Powerskin X-Glide,
Jaked 01, Adidas HydroFoil,
Arena Powerskin R-Evolution
- - 4
*Excluded all years without an introduction of a new swimming technology
**Sources to follow on next page

41
SOURCES: -“Jaked.” Press. (2010): Date accessed: October, 2010 on http://www.jaked.it. (Translated
Version)
-“Speedo History.” (2011): Date accessed: October, 2010 on
http://www.speedo.com/speedo_brand/insidespeedo/history/index.html,
-“TYR.” News/Events. (2010) Date accessed :October, 2010 on http://www.tyr.com/news/ -“Arena History.” 2010. Date accessed October, 2010 on
http://arenainternational.com/en/company/over-30-years-of-success
-Missing technology and confirmation were abstracted from personal phone calls to the
companies
TABLE 4.6
DESCRIPTION OF VARIABLES
Variable Name Description
Techintro The amount of swim suits, fabrics and other major innovations
introduced that year
GDPpercapita The GDP of the athletes nation divided by the nations population
Latitude The latitude of the athlete‟s home nation
Daylapse The number of days since the last swimming record was broken
Avgreclife The average day lapse between record breaks in that specific year
Percenttimelapse The difference between the new record performance time and the
former record performance time divided by the new record time.
Totalrecords The amount of total records broken that month
Americanrecords The amount of American records broken that month
GDP The GDP of the athletes countries in 2005 base million dollars
Population The total population of the athletes country
Techpro The progression of swimsuits, fabrics and other major
innovations since 1969
Starathletes The number of athletes competing for the country that year who
have broken 3 or more records
Year Time series of the data from 1969-2009
Dummy Variables
Seaaccess Given a “1” if the athlete home nation had access to the sea
Star3 Given a “1” if the athlete broke 3 or more records
Legend9 Given a “1” if the athlete broke 9 or more records
Neighbornation Given a “1” if the athlete broke the record in a neighboring nation
Hostnation Given a “1” if the athlete broke the record in his home nation
Currentrecholder Given a “1” if the athlete broke his/her own event record
Fourrecholder Given a “1” if the athlete broke this events record within the past
four swimmers

42
Variable Correlations
In order to properly account for each variable, pair-wise correlations must be
conducted in order to examine the relationship between each factor. If two variables are
perfectly linearly related (1.000), the model fails to differentiate any distinct effects
because they comprise the exact same information. Thus, correlations should be no
greater than the absolute value of 0.5 because the variables significance will be
inaccurate. Two variables with multi-collinearity will either deprive or inflate each
other of their true significance, resulting in artificially high or low t and f-statistics.
Table 4.7 shows the correlation of variables on a country basis, while TABLE 4.8
displays variables on an individual basis.
TABLE 4.7
MULTICOLLINEARITY OF VARIABLES ON A COUNTRY BASIS
Techintro Latitude GDPpercapita Starathletes Seaaccess
Techintro 1.0000 - - - -
Latitude 0.0009 1.0000 - - -
GDPpercapita 0.1574 0.3591* 1.0000 - -
Starathletes 0.0476 0.0009 0.1995 1.0000 -
Seaaccess -0.0004 0.0515 0.1592 0.1018 1.0000
43
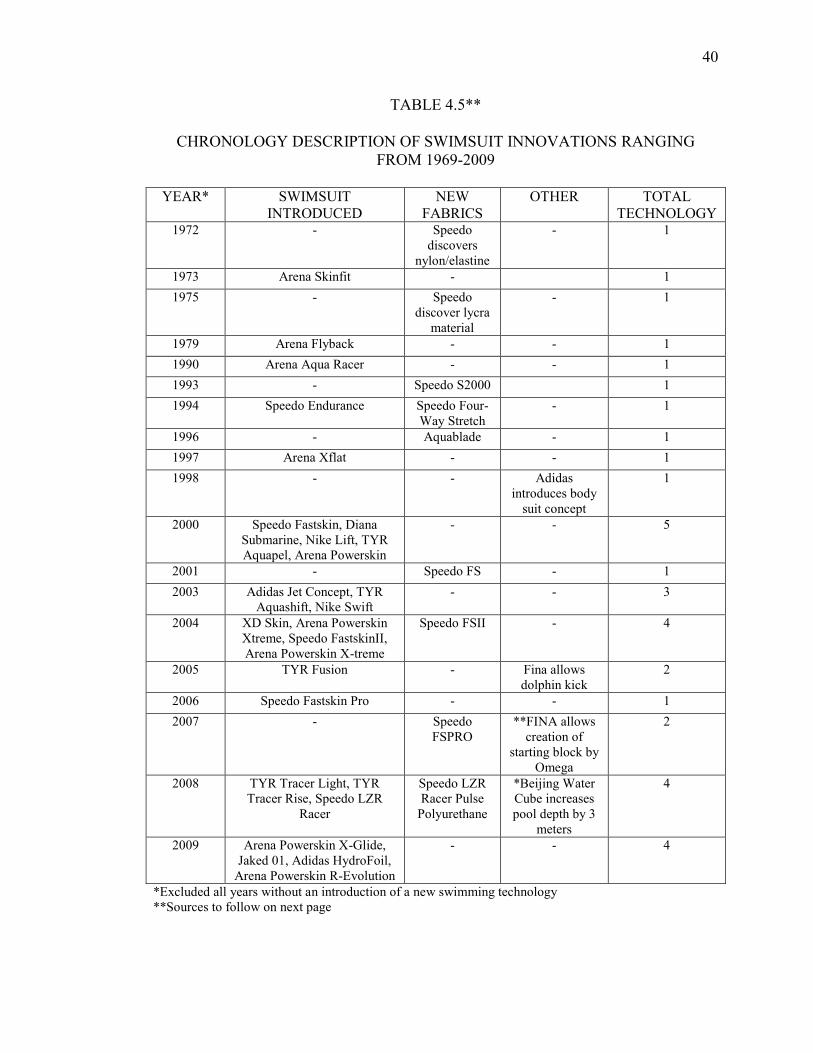
TABLE 4.8
MULTICOLLINEARITY OF VARIABLES ON AN INDIVIDUAL BASIS
Techintro Latitude GDPpercapita Star3 Seaaccess Hostnation
Techintro 1.0000 - - - - -
Latitude -0.1634 1.0000 - - - -
GDPpercapita 0.3596* -0.0175 1.0000 - - -
Star3 -0.0309 -0.0022 0.0720 1.0000 - -
Seaaccess 0.0279 -0.0149 0.2340 0.0673 1.0000 -
Hostnation -0.0688 -0.0541 0.0316 0.0152 0.1625 1.0000
A moderately significant correlation exists between latitude and GDP per capita
in TABLE 4.7. However, when the model was tested without latitude, barely any
change occurred with GDP per capita, thus we can dismiss an issue of multi-
collinearity. Similarly, a correlation exists between techintro and GDPpercapita in
TABLE 4.8. Again, when testing the model without the technology variable the GDP
per capita value changed insignificantly.
Methodology
This section discusses the method used in order to observe the previously
presented data through different regression equations using a command-based program
called Stata. In order to test what influences the number of record breaks, a negative
binomial regression will be used because the model takes on any non-negative integer
value. Negative binomials are more often used for dispersed abnormal data because it
allows for more variability within the model. When testing the day lapse for the last
record break, we will use the poisson because the dependent variable also measures an
occurrence, does not follow a normal distribution, but the dependent variable is not as
44
dispersed at the day lapse variable.12
We avoid heteroskedasticity issues in all the
models by applying the robust error to each regression. This method automatically
changes the standard errors in order to guarantee constant variance. We also will test for
autocorrelation using the Durbin-Watson statistic. If any of the regressions contain
autocorrelation, the error variables are not independent of each other, which violate an
assumption regarding the data, thus questioning the legitimacy of the model. We do not
test for normality in any of the data sets because it does not curve around a central mean
due to the elimination of negative integers. We would only test for normality if our
dependent variable measures the change in world record counts. Even though the study
did examine how explanatory variables affect the change in record breaks, the T-
statistics resulted in insignificant values, thus we dismissed this definition as a valid
dependent variable. Thus, we use the total number of record breaks as our dependent
variable, resulting in a highly skewed data set where testing for normality would be
useless.
12 “Introduction to SAS.” UCLA: Academic Technology Services, Statistical Consulting
Group. Date Accessed: February, 2011 on http://www.ats.ucla.edu/stat/sas/notes2/

45
CHAPTER V
RESULTS AND ANALYSIS
This chapter provides the final results of the regression equations tested while
also providing an in-depth analysis of each equation. By reviewing the results of the
regression models, we attempt to better understand what exactly influences the
frequency and quality of breaks. A primary equation is presented first in order to
discover if technology has any significant effect on the occurrence of records breaks.
Two supplementary models will then follow hoping to further explain the primary
equation with additional data.
Results
In order to answer whether or not technology has an effect on record breaks, we
first run a simple negative binomial regression with total record breaks as the dependent
variable and number of swim technologies as the sole independent variable. Due to
problems with autocorrelation, we must include a second independent variable: the time
in years. Furthermore, we test the same independent variables, but with a different
dependent variable: number of American records broken. We also add a time variable
for this equation in order to fix autocorrelation issues. The final equations are displayed
below:
Nbreg totalrecords= f(techinto, year), robust
Nbreg Americanrecord= f(techintro, year), robust

46
By using year a second independent variable, we eliminate autocorrelation, but
also unfortunately create an issue with multi-collinearity. When the variables year and
techintro are highly correlated with each other (0.6088), the true coefficient values are
deflated. However, the purpose of this primary equation is just to show if technology
has any significance on record breaks, not how much. Thus, it makes more sense to
include year and avoid autocorrelation in order to examine the t-values accurately. The
results to these equations are displayed in TABLE 5.1.
TABLE 5.1
TECHNOLOGY IMPACT ON RECORD BREAKS ON AN ANNUAL BASIS
TOTAL RECORD
BREAKS
AMERICAN RECORD
BREAKS
TECHINTRO .345 (4.52)*** .396 (4.83)***
YEAR -.033 (-4.73)*** -.033 (-4.03)***
CONSTANT 68.124 (4.95)*** 67.266 (3.29)***
Wald Chi2(2) (28.76)*** (25.13)***
OBSERVATIONS 41 41
DURBIN WATSON 1.83 1.64
By reviewing TABLE 5.1., we obtain the Wald Chi2(2) values of 28.76 for total
records and 25.12 for American records with two degrees of freedom. Associated with
the chi-squared values are the p-values, both at 0.0000. The Wald Chi2(2) values assess
the “fit of the model” and are analogous to an F-statistic in a linear regression model. It
shows the significance of the explanatory variables jointly. The p-values are both less
than the generally used criterion of 0.05, thus we reject the null hypothesis, indicating
that the coefficients are not simultaneously equal to zero. From these results, we can
conclude that both techintro and year are statistically significant in determining record
47
break counts. However, due to issues with multi-collinearity, we cannot confirm how
much of record breaks are influenced by the introduction of swimming innovations.
The critical values for the Durbin-Watson statistic depend on the degrees of freedom
and number of observations. Given both these equations have two degrees of freedom
and forty one observations, the critical values lie at 1.391(dL) and 1.600 (dU) at the 5%
significance level.1 The Durbin-Watson test abides by the following rules:
d>dU= statistical evidence proves the error terms are not positively autocorrelated
d>dL= statistical evidence proves the error terms are positively autocorrelated
dL <d< dU=the test is inconclusive
With both Durbin-Watson statistics above the dU measure, we can conclude no
autocorrelation exists.
This model also draws data not only on an annual basis, but also on a monthly
basis in order to include more observations (492). However, the explanatory variables
do not correspond with the dependent variables because monthly record breaks cannot
be compared to the technology variable due to its limitation in defining introductions of
innovation only on an annual basis. When tested on a monthly basis however,
technology does prove to have an impact on record breaks, but the coefficient cannot be
compared with the models tested in TABLE 5.1 due to the divergence in variables.
Factors Influencing Lifespan of a Record
In order to better understand the frequency of record breaks in further detail, we
incorporate additional explanatory factors, which have proven in the past to have an
influence on athletic performance. In our next equations, we test the dependent variable,
day lapse of records, using poisson regression because we are measuring the count
1 Durbin-Watson Table. (2011): Date accessed: February, 2011 on
http://www.nd.edu/~wevans1/econ30331/Durbin_Watson_tables.pdf
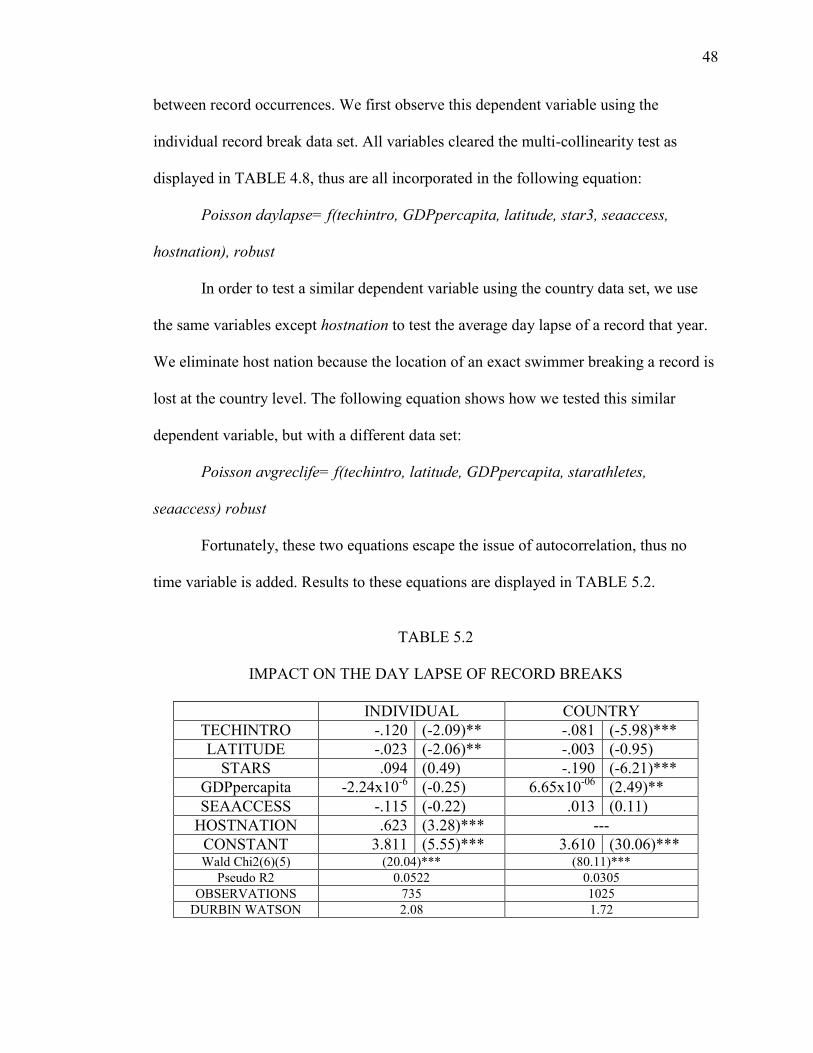
48
between record occurrences. We first observe this dependent variable using the
individual record break data set. All variables cleared the multi-collinearity test as
displayed in TABLE 4.8, thus are all incorporated in the following equation:
Poisson daylapse= f(techintro, GDPpercapita, latitude, star3, seaaccess,
hostnation), robust
In order to test a similar dependent variable using the country data set, we use
the same variables except hostnation to test the average day lapse of a record that year.
We eliminate host nation because the location of an exact swimmer breaking a record is
lost at the country level. The following equation shows how we tested this similar
dependent variable, but with a different data set:
Poisson avgreclife= f(techintro, latitude, GDPpercapita, starathletes,
seaaccess) robust
Fortunately, these two equations escape the issue of autocorrelation, thus no
time variable is added. Results to these equations are displayed in TABLE 5.2.
TABLE 5.2
IMPACT ON THE DAY LAPSE OF RECORD BREAKS
INDIVIDUAL COUNTRY
TECHINTRO -.120 (-2.09)** -.081 (-5.98)***
LATITUDE -.023 (-2.06)** -.003 (-0.95)
STARS .094 (0.49) -.190 (-6.21)***
GDPpercapita -2.24x10⁻⁶
(-0.25) 6.65x10-06
(2.49)**
SEAACCESS -.115 (-0.22) .013 (0.11)
HOSTNATION .623 (3.28)*** ---
CONSTANT 3.811 (5.55)*** 3.610 (30.06)*** Wald Chi2(6)(5) (20.04)*** (80.11)***
Pseudo R2 0.0522 0.0305
OBSERVATIONS 735 1025
DURBIN WATSON 2.08 1.72
49
Based on the Wald-Chi2 values, the variables tested in the country data set are
more significant jointly in determining the lifespan of a record, but the combined
variables in the individual data set still proves to be significant. The p-values are both
less than 0.05, thus we can reject the null hypothesis, indicating that the coefficients are
not simultaneously equal to zero. The pseudo R-squared does explain the proportion of
the total variability of the outcome that is accounted for by the model like the typical
OLS R-squared; however, pseudo R-squareds cannot be interpreted independently or
compared across datasets. They can only be used in evaluating multiple models
predicting the same outcome on the same data set. A pseudo R-squared only has
meaning when compared to another pseudo R-squared with the same data and
predicting the same outcome. In this particular condition, the higher pseudo R-squared
indicates which model better predicts the outcome. Thus, the Pseudo- R-squareds are
irrelevant when analyzing these results.2
Given the individual data equation has six degrees of freedom and 735
observations, the critical values for the autocorrelation lie at 1.707 (dL) and 1.831 (dU)
at the 5% significance level. However, the Durbin-Watson statistic scored a 2.08, thus
no issues with autocorrelation exist. The country data equation scored a lower value of
1.72. Given its five degrees of freedom and higher number of observations, the critical
values lie at 1.623(dL) and 1.725 (dU) at the 1% significance level. Thus, we fail to
completely reject autocorrelation, but issues regarding this test are highly improbable.
By confirming the validity of the overall model, we can now scrutinize the z-
values and their corresponding coefficients. Both models prove how the introduction of
2 “Introduction to SAS.” UCLA: Academic Technology Services, Statistical Consulting Group.
Date Accessed: February, 2011 on http://www.ats.ucla.edu/stat/sas/notes2/
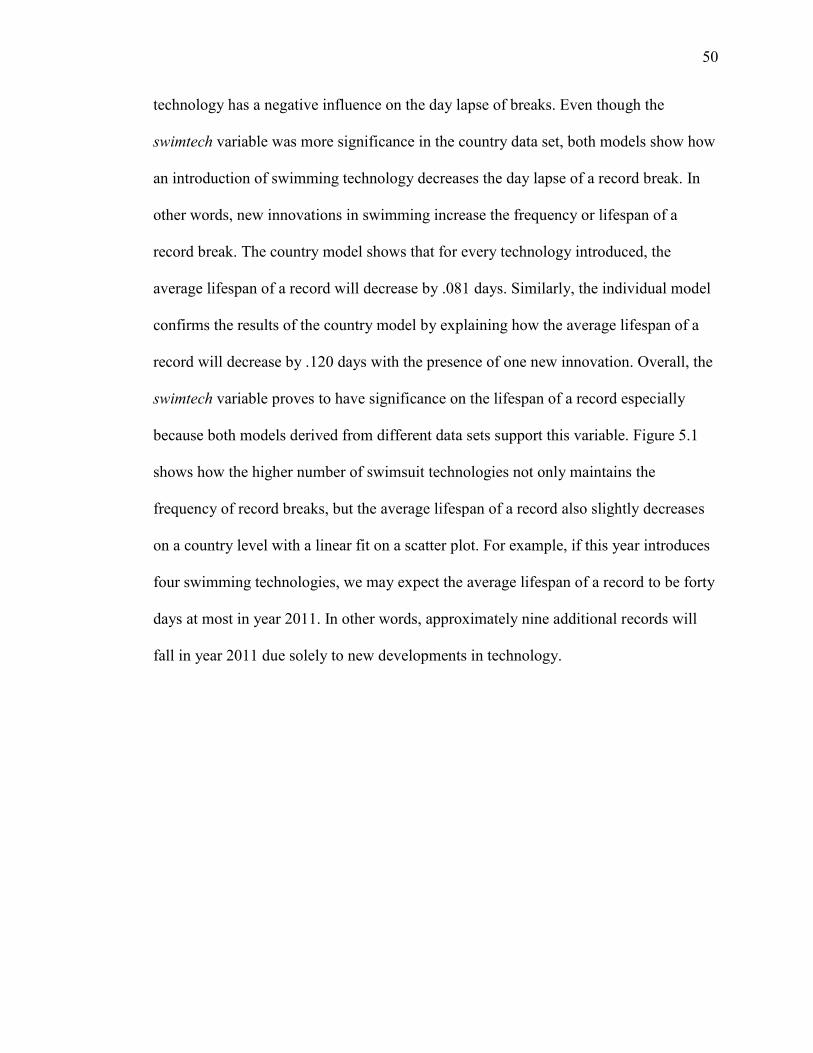
50
technology has a negative influence on the day lapse of breaks. Even though the
swimtech variable was more significance in the country data set, both models show how
an introduction of swimming technology decreases the day lapse of a record break. In
other words, new innovations in swimming increase the frequency or lifespan of a
record break. The country model shows that for every technology introduced, the
average lifespan of a record will decrease by .081 days. Similarly, the individual model
confirms the results of the country model by explaining how the average lifespan of a
record will decrease by .120 days with the presence of one new innovation. Overall, the
swimtech variable proves to have significance on the lifespan of a record especially
because both models derived from different data sets support this variable. Figure 5.1
shows how the higher number of swimsuit technologies not only maintains the
frequency of record breaks, but the average lifespan of a record also slightly decreases
on a country level with a linear fit on a scatter plot. For example, if this year introduces
four swimming technologies, we may expect the average lifespan of a record to be forty
days at most in year 2011. In other words, approximately nine additional records will
fall in year 2011 due solely to new developments in technology.

51
FIGURE 5.1
TECHNOLOGY IMPACT ON AVERAGE LIFESPAN OF A RECORD
For the remainder of the variables, the equations disagree on which factors have
an influence on the frequency of record breaks. However, this divergence in the models
do not make the significant factors any less valuable to the success in record breaks
because the models are abstracting information from two completely different data sets.
Within the individual model, latitude and hostnation appear to have an impact on the
occurrence of record breaks. As the latitude increases with each athlete, the day lapse
between each break decreases by .023 days. This outcome proves that athletes from
colder nations increase the frequency of record breaks. Unexpectedly though, if the
athlete breaks the record from his own home nation, the day lapse from the last break
will increase by .623 days. This number seems surprising as one would think athletes
would be breaking more records within their home nation because of reasons explained
in the literature review. The seaaccess and GDPpercapita variables, although negative,
05
01
001
502
00
0 1 2 3 4 5
Number of Swimsuit Technologies
AverageLifespanofrecord Fitted values
Average Lifespan of
a Record
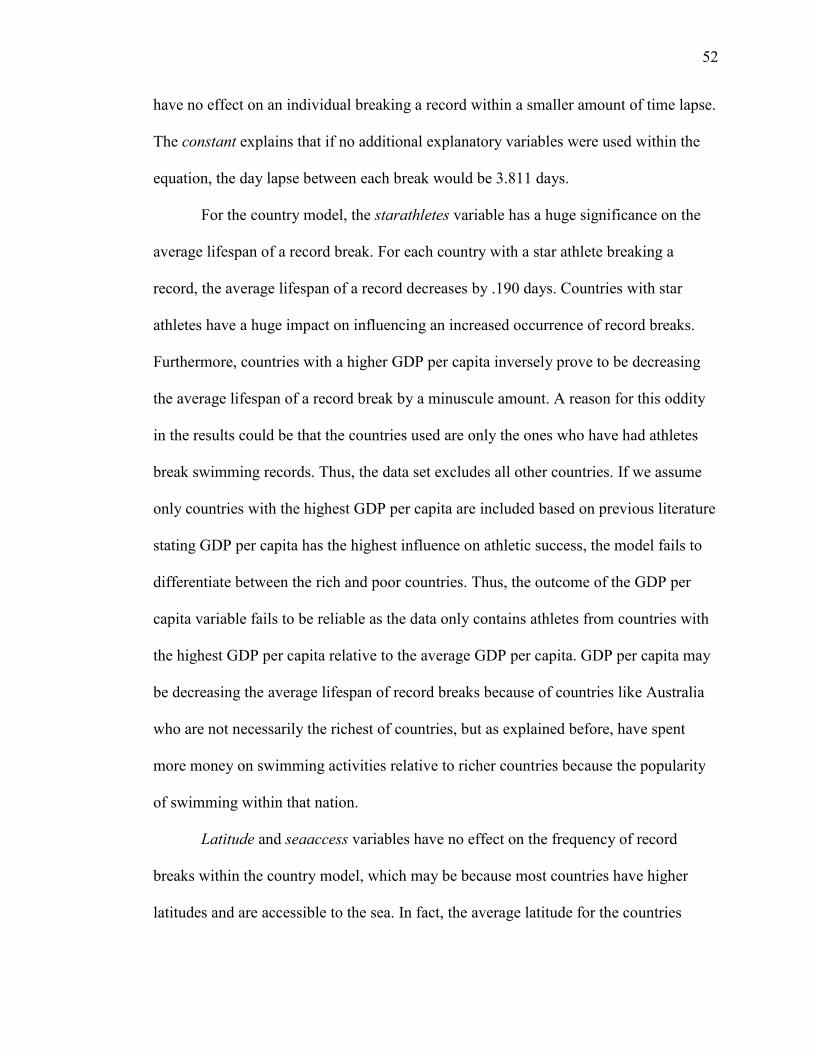
52
have no effect on an individual breaking a record within a smaller amount of time lapse.
The constant explains that if no additional explanatory variables were used within the
equation, the day lapse between each break would be 3.811 days.
For the country model, the starathletes variable has a huge significance on the
average lifespan of a record break. For each country with a star athlete breaking a
record, the average lifespan of a record decreases by .190 days. Countries with star
athletes have a huge impact on influencing an increased occurrence of record breaks.
Furthermore, countries with a higher GDP per capita inversely prove to be decreasing
the average lifespan of a record break by a minuscule amount. A reason for this oddity
in the results could be that the countries used are only the ones who have had athletes
break swimming records. Thus, the data set excludes all other countries. If we assume
only countries with the highest GDP per capita are included based on previous literature
stating GDP per capita has the highest influence on athletic success, the model fails to
differentiate between the rich and poor countries. Thus, the outcome of the GDP per
capita variable fails to be reliable as the data only contains athletes from countries with
the highest GDP per capita relative to the average GDP per capita. GDP per capita may
be decreasing the average lifespan of record breaks because of countries like Australia
who are not necessarily the richest of countries, but as explained before, have spent
more money on swimming activities relative to richer countries because the popularity
of swimming within that nation.
Latitude and seaaccess variables have no effect on the frequency of record
breaks within the country model, which may be because most countries have higher
latitudes and are accessible to the sea. In fact, the average latitude for the countries
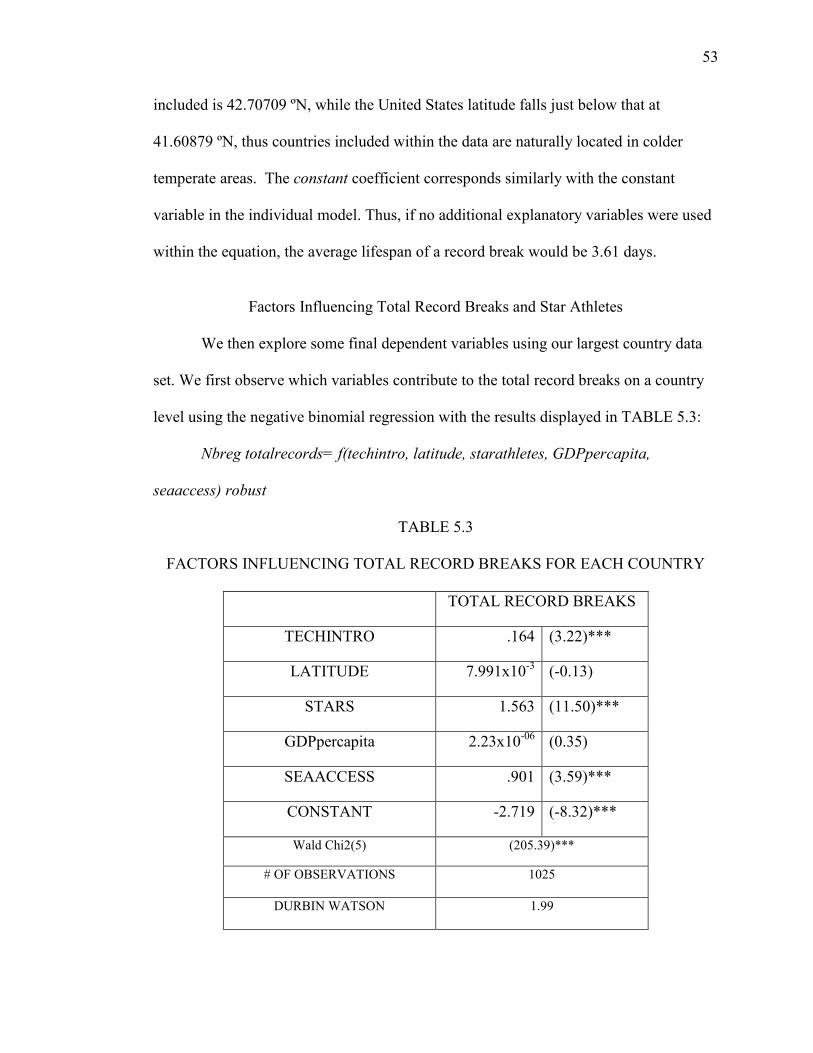
53
included is 42.70709 ºN, while the United States latitude falls just below that at
41.60879 ºN, thus countries included within the data are naturally located in colder
temperate areas. The constant coefficient corresponds similarly with the constant
variable in the individual model. Thus, if no additional explanatory variables were used
within the equation, the average lifespan of a record break would be 3.61 days.
Factors Influencing Total Record Breaks and Star Athletes
We then explore some final dependent variables using our largest country data
set. We first observe which variables contribute to the total record breaks on a country
level using the negative binomial regression with the results displayed in TABLE 5.3:
Nbreg totalrecords= f(techintro, latitude, starathletes, GDPpercapita,
seaaccess) robust
TABLE 5.3
FACTORS INFLUENCING TOTAL RECORD BREAKS FOR EACH COUNTRY
TOTAL RECORD BREAKS
TECHINTRO .164 (3.22)***
LATITUDE 7.991x10⁻³
(-0.13)
STARS 1.563 (11.50)***
GDPpercapita 2.23x10-06
(0.35)
SEAACCESS .901 (3.59)***
CONSTANT -2.719 (-8.32)***
Wald Chi2(5) (205.39)***
# OF OBSERVATIONS 1025
DURBIN WATSON 1.99

54
With a high Wald Chi2(5) and a low p-value, this model proves valid in
determining the factors influencing total record break. Furthermore, with five degrees of
freedom and 1025 observations, the critical values for the Durbin-Watson statistic lie at
1.718 (dL) and 1.820 (dU) at the 5% significance level. Since the actual value (1.99)
exceeds the upper limit, we can dismiss any bias due to autocorrelation.
The techintro variable appears to have a significant influence on total record
breaks in the world. For every introduction of technological innovation, the total record
breaks broken by each country increases by .164. The number of star athletes generated
from each country also shows to have a huge impact on an individual countries total
record break count as shown in FIGURE 5.2. For every one star athlete a country
generates every year, the total record break count for that country increases by 1.563.
This variable seems reasonable as data shows the same athlete breaking records
multiple times like USA stars Mark Spitz and Shane Gould in 1972 or Kornelia Ender
(GER) in 1976 and even Michael Phelps (USA) in the most recent years. FIGURE 5.2
shows how much star athletes have an impact on the number of World records at the
country level. For example, the existence of eight star athletes competing in 2011 would
result in nearly nineteen additional record breaks for that year.
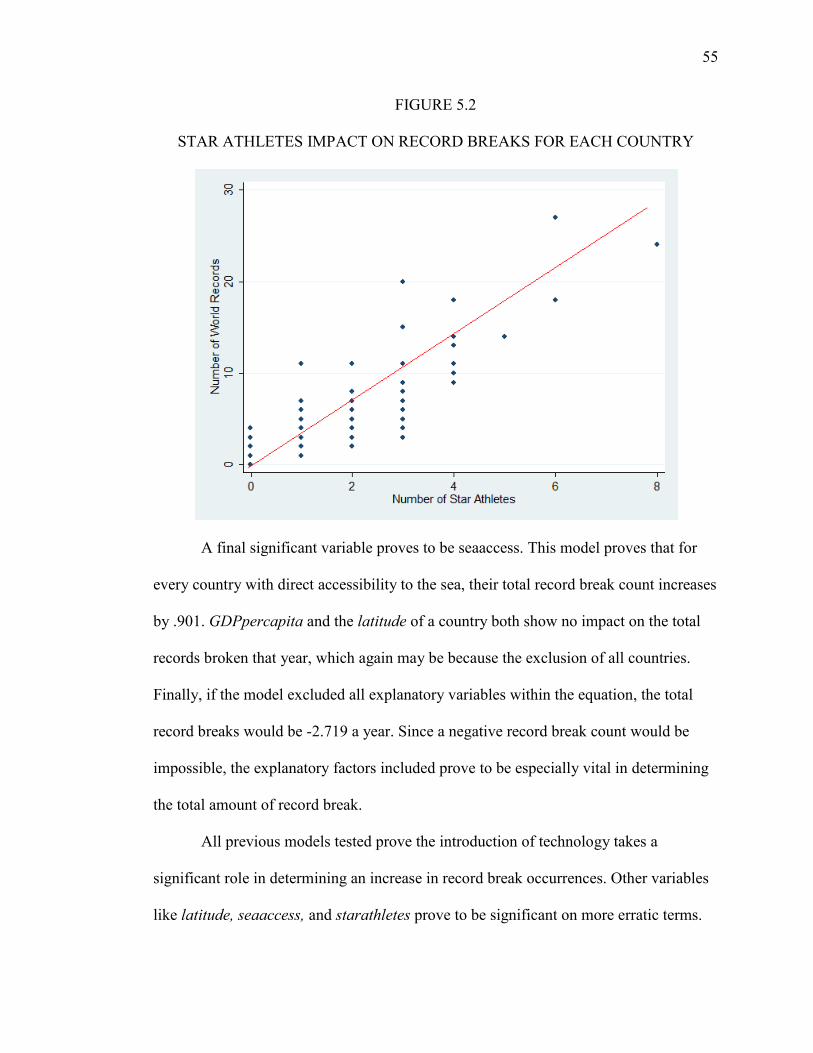
55
FIGURE 5.2
STAR ATHLETES IMPACT ON RECORD BREAKS FOR EACH COUNTRY
A final significant variable proves to be seaaccess. This model proves that for
every country with direct accessibility to the sea, their total record break count increases
by .901. GDPpercapita and the latitude of a country both show no impact on the total
records broken that year, which again may be because the exclusion of all countries.
Finally, if the model excluded all explanatory variables within the equation, the total
record breaks would be -2.719 a year. Since a negative record break count would be
impossible, the explanatory factors included prove to be especially vital in determining
the total amount of record break.
All previous models tested prove the introduction of technology takes a
significant role in determining an increase in record break occurrences. Other variables
like latitude, seaaccess, and starathletes prove to be significant on more erratic terms.
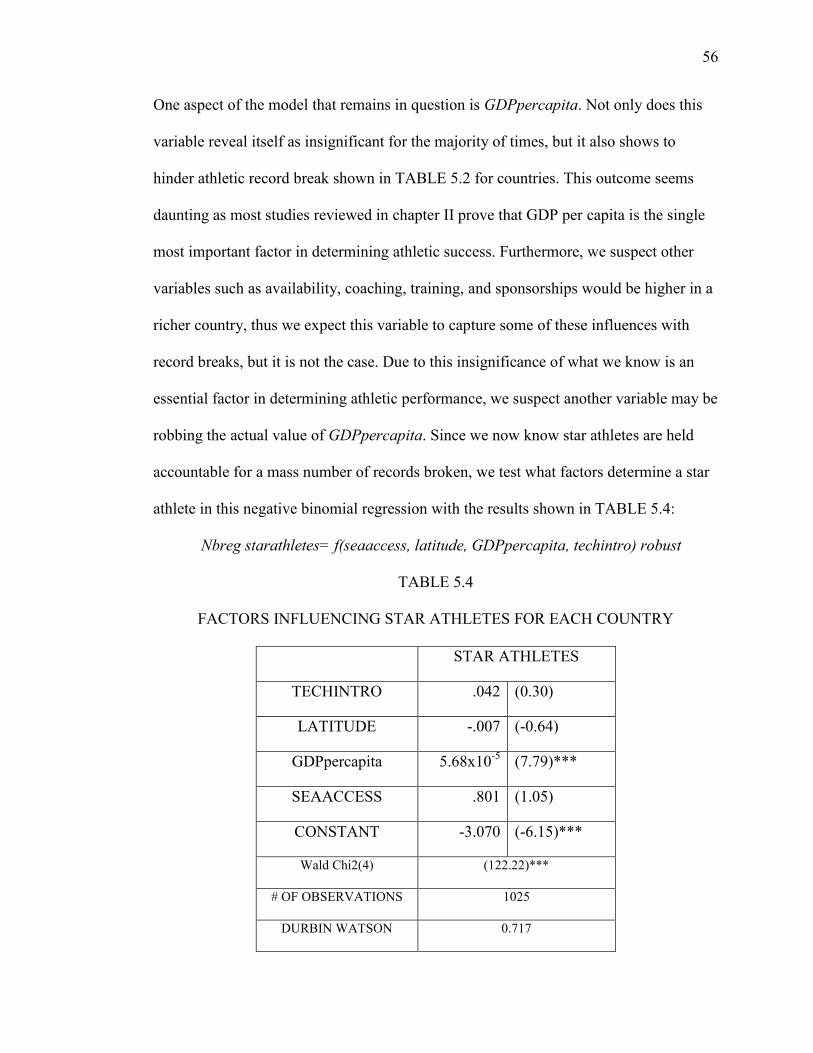
56
One aspect of the model that remains in question is GDPpercapita. Not only does this
variable reveal itself as insignificant for the majority of times, but it also shows to
hinder athletic record break shown in TABLE 5.2 for countries. This outcome seems
daunting as most studies reviewed in chapter II prove that GDP per capita is the single
most important factor in determining athletic success. Furthermore, we suspect other
variables such as availability, coaching, training, and sponsorships would be higher in a
richer country, thus we expect this variable to capture some of these influences with
record breaks, but it is not the case. Due to this insignificance of what we know is an
essential factor in determining athletic performance, we suspect another variable may be
robbing the actual value of GDPpercapita. Since we now know star athletes are held
accountable for a mass number of records broken, we test what factors determine a star
athlete in this negative binomial regression with the results shown in TABLE 5.4:
Nbreg starathletes= f(seaaccess, latitude, GDPpercapita, techintro) robust
TABLE 5.4
FACTORS INFLUENCING STAR ATHLETES FOR EACH COUNTRY
STAR ATHLETES
TECHINTRO .042 (0.30)
LATITUDE -.007 (-0.64)
GDPpercapita 5.68x10⁻⁵
(7.79)***
SEAACCESS .801 (1.05)
CONSTANT -3.070 (-6.15)***
Wald Chi2(4) (122.22)***
# OF OBSERVATIONS 1025
DURBIN WATSON 0.717

57
As assumed, this model shows evidence that GDPpercapita of a country has a
strong influence in generating star athletes, but due to issues with autocorrelation, the
coefficient cannot be validated. We attempted to fix autocorrelation in several ways by
adding a time series or changing the dependent variable to the change in star athletes
over time, but these modifications failed to adjust the Durbin-Watson statistic.
Regardless, these results indicate that the starathletes variable does capture most of the
GDPpercapita influence, thus GDP per capita does indirectly have an effect on the
incidence of record breaks.
Additional Consideration
After reviewing the results of all models, additional reflection needs to be
discussed in order to thoroughly interpret the data. Although the introduction of
technology proves to be significant with record breaks in swimming, the effect is shown
to be minimal. However, we defined technology in broad terms and made many
assumptions about its use within the swimming world as discussed in chapter IV. Thus,
the fact that the models even show any value for innovation shows that if defined more
accurately within the data set, technology could have an even bigger impact.
We also tested many other independent and dependent variables, but since they
resulted in less significant values to the ones presented, the study eliminated them from
the final models. GDP and population were tested separately at first, but due to issues
with multi-collinearity, we combined the two variables to obtain GDP per capita.
However, when they were tested separately, GDP proved to be more significant in

58
determining swimming record breaks than population. Thus, including population may
be another cause for the non-impact of GDP per capita within the models.
Other variables were tested as dummies: currentrecholder and fourrecholder. To
review, a “1” was given to a certain athlete if they broke their own record within that
event or if they broke that events record within the last four athletes to break that
event‟s record time. Both variables were correlated, but when used independently, they
did prove to be significant in determining record breaks. However, the models replaced
these variables with the star3 and legend9 variables because athletes can break records
in multiple events. Michael Phelps may break nine records in one day, but all in
different events. Thus, the previous variables would not be able to account for his
natural experience and athleticism. The star3 variable takes this sweep into account by
adding all of his records ever broken. The model also drops the legend9 variable due to
its correlation with star3. We chose to present the star3 variable due to its higher
influence on total record breaks.
In order to take into account technology as a constant development for
swimming performance, we attempted to test the progression of swimming innovations
as seen in TABLE 4.2. As time passes, new technologies introduced constantly build off
the most recent innovation in order to keep improving. For example, the Speedo LZR
racer may have not been invented if Adidas did not introduce the idea of bodysuits in
1998.3 In order to account for the consistent growth of technology, we added the
Techpro variable, which considers every past innovation since 1969 into the total
technology count of the current year. By obtaining this variable, the study hoped to
apply current technology to swimmers performance times in the earlier years in order to
3 See TABLE 4.5

59
fairly compare current swimmers with past swimmers of equal technology opportunity.
However, this progression of technology showed to be barely significant in determining
record breaks. We even attempted to better match this explanatory variable with the
progression of record breaks, but the value was still insignificant, thus the variable was
dropped from the model.
The seaaccess variable was added last in an attempt to proxy for the popularity
of swimming within the nation. This variable surprisingly demonstrated significance in
TABLE 5.3 when influencing the total record breaks. However, this variable could have
been more significant if the country data set included more countries because most of
the twenty-five countries bordered a sea. In fact, only five countries are completely
land-locked: Hungary, Poland, Serbia, Switzerland, and Zimbabwe. In order to improve
this variable, we could have measured the percentage of the countries border that
included a coastline. However, due to time and absence of public information, we are
unable to take this into account in the models.
We also attempted to examine another dependent variable: percenttimelapse.4
This aspect of record breaks captures how sizeable each record break was. For example,
a record broken by .0001 seconds differs in significance than a record broken by 4.000
seconds. The specific event also needs to be considered when analyzing the quality of a
record break. Breaking the 100LCM freestyle by .0001 second may be the same
proportionally as breaking the 1500LCM by 4.000 seconds. Thus, when measuring the
value of a particular record break, we calculated the percentage of the time difference in
order to account for the specific event. We then tested all the explanatory variables on
percenttimelapse in a tobit model in order to set a lower and upper bound at 0 and 1.
4 See TABLE 4.6
60
However, no relationship existed between the dependent variable and techintro, perhaps
because this explanatory variable measures the existence of an innovation rather than
the “worth.”
Implications of Results
This study shows how an increase in record breaks can partly be explained by an
introduction of new swimming technology, sea access, star athletes, and latitude.
Naturally, these models only represent a small portion of what truly affects record
breaks, as many other factors must be considered, but are nearly impossible to account
for as discussed in Chapter III
As swimming technology continues to grow, swimming records should keep
falling. The pressure of introducing new innovations and shaping better athletes should
increase for major swim companies and wealthy countries as the future of swimming
depends on it. However, John Brenkus believes a specific “perfection point” exists, thus
at some point these variables will have no significance on the number of record breaks
because the dependent variable will have hit its maximum point. A limit must exist for
performance times because no swimmer can complete a lap in zero seconds. As record
times near our maximum potential, will the proven effect of a new technological
innovation slowly diminish in value?
It will be interesting to see how FINA continues to regulate innovations within
competition. They have already begun releasing annual lists of approved swimsuits to
solve the bodysuit controversy.5 FINA struggles to balance its two obligations of
providing the highest performance possible for the world to enjoy, while also preserving
5 “FINA Approved Swimsuits.” (2011): Date accessed: February, 2011 on www.fina.org
61
the purity of the sport for the sake of its main intentions. Technology plays a major part
in the future of swimming especially in a world so dependent and fixated with technical
development. When does innovation cross the line of appropriateness in sport? Should
Oscar Pistorius be allowed to compete in the 2012 London Olympic with two prosthetic
limbs?6
Further Research
This study leaves many other possibilities for further research. The technology
factor will continue to grow as more athletes depend on its availability in order to break
records. Further improvements may include including more countries or athletes in
order to add depth and show the true significance of what factors influence a record
break. Since the data only comprises the frontier of swimming since 1969, we only ask
what stimulates record breaks, while we could strengthen the argument by asking how
other countries and athletes fail to ever break records.
An improved and more advanced definition for technology could also improve
the results of this study. Not only does our technology variable take on many
assumptions and limitations, but it fails to show how much of an athlete‟s success is
credited towards technology. Thus, factoring in the quality of an innovation is crucial in
determining the eminence of a particular record break. Thus, I suggest applying Haake‟s
proven performance index in order to measure a technologies impact on the quality of a
record break for future research.
6 Majendie, Matt. “For Oscar „Blade Runner‟ Pistorius, Fast is a State of Being.” (2011).
The National. Date Accessed: March, 2011 on http://www.thenational.ae/lifestyle/motoring/for-oscar-
blade-runner-pistorius-fast-is-a-state-of-being
62
Analyzing a different sport with the same methodology may also be interesting
for comparison. For example, Haake used four sports in his study in order to show how
his approach with technology differed for each event.7 Analyzing cycling under the
same methodology with technology may be interesting in order to reaffirm or enhance
the results.
Finally, the study hoped to be able to compare swimmers across time in order to
justify the times of swimmers who competed without equal technical enhancements in
1969. However, we only test the introduction of technologies, not the progression, thus
we cannot apply the technology factor to performance times. For later studies, some sort
of technologic progression index must be used in order to analysis performance times
across time and compare athletes‟ natural abilities regardless of external factors.
7 S.J Haake. “The Impact of Technology on Sporting Performance in Olympic Sports.” Journal
of Sports Sciences 27, no. 13 (2009): 1421-1431
63
CHAPTER VI
CONCLUSION
Record breaks represent the ultimate success in athletics as they continue to
shatter barriers deemed impossible by society. Record breaks create a dynamic
interaction among fans, athletes, and media in order to maintain the thrill of a sport.
Thus, this thesis has examined the factors influencing record breaks as they influence
the future for most athletic events. Several variables were tested in order to discover
what affects the frequency of breaks. This study hoped to discover the relationship
between technology and record breaks. The high controversy of body suits and
dominating power of technology in the new century has made this research a point of
interest to those familiar with the athletic world.
Chapter I provides an introduction of the swimming world and why record
breaks occur most frequently compared to other record-breaking sports. The
background section of this chapter offers a history of the sport and how technology has
affected its progression throughout time. Finally, this chapter not only explains why this
subject is relevant to current times, but also why the study is essential to review for
future consideration.
Chapter II reviews past literature written regarding what affects success in
athletics. Analysis of past literature is crucial in understanding what research has
already been conducted and how we can possibly build off what is already discovered.
64
This section also shows how this study adds to the current range of literature. After
evaluating the relevant studies, I was able to gather a number of variables that have
proved to be significant in athletic success and utilize them differently within the
models.
Chapter III reviews the theory of this study and how it differs from previous
studies. This section discusses what variables will be used and which variables should,
but due to lack of information, cannot be used in the models. This chapter serves to
distinguish this study as an original piece, weaving both personal ideas and concepts
established by past authors.
Chapter IV then explains the data and methodology used in order to gain insight
regarding the studies focus. This section provides reasons for the disclosed data
selection and the sources used in order to obtain the data discussed. The chapter then
transitions to clarify why certain regressions and econometric tests are used in order to
ensure the validity of the models.
Chapter V presents the results and an analysis of the models tested using the
data in the previous chapter. All models used the negative binomial or poisson
regressions depending on the dependent variable. The results of this chapter show that
the introduction of technology does increase the number of record breaks in all models.
Furthermore, sea access, star athletes, and latitude prove to have an impact on the
number of record breaks. Evidence shows how GDP per capita creates star athletes, thus
this variable indirectly causes an increase to record breaks. These findings support the
main purpose of the study which was to determine the influences on record breaks.
65
Analysis of data has discovered a strong relationship between technology and
record breaks by measuring the size and strength. Generally, the introduction of one
new technology would result in .345 new broken records. An innovation also proves to
decrease the life span of a record by .12 days for individual swimmers and .081 days for
a country. Furthermore, for every one star athlete competing, 1.5 new records will be
broken.
This study has attempted to explain why athletes continue to break records.
Research has found that the introduction of technology has a direct impact on the
number of records broken that year. It was also found that star athletes, countries
accessible to sea, and individuals belonging to colder nations have the potential to
increase the number of record breaks. For the most part, results hint that the future of
swimming could be dominated by the effects of technology, especially since the study
loosely defines this variable. Swimming should expect either a slowdown in record
breaks if FINA bans all future technology or a consistent trend if society continues to
introduce new innovations to the sport.
66
SOURCES CONSULTED
“Arena.” Our History. (2009): Date accessed: October, 2010 on
http://arenaswimming.co.za/about/our-history/
Ball, Donald W. “Olympic Games Competition: Structural Correlates of National
Success.” International Journal of Comparative Sociology 12 (1972): 186-200.
Battese, G. E. and Coelli, T. J. “A Model for Technical Inefficiency
Effects in a Stochastic Frontier Production Function for Panel Data.” Empirical
Economics 20 (1995): 325–332.
Barzel, Toram. “The Rate of Technical Progress: The „Indianapolis 500.‟” Journal of
Econonmics Theory 4 (1972): 72-81
Bernard, Andrew B. and Meghan R. Busse “Who Wins the Olympics: Economic
Resources and Medal Totals.” Review of Economics and Statistics 86 (2004):
413–417.
Brenkus, John. The Perfection Point. New York. HarperCollins Publishers. 2010: 54-
75
Chandler, K. N. “The Distribution and Frequency of Record Values.” Journal of Royal
Statistical Sociology Series B, 14, no. 2 (1952): 220-28.
Clarey, Christopher. “Sydney 2000: Swimming; Beginning Tomorrow, All Eyes Will
Be Focused on One Pool.” Sydney. The New York Times. (2000): Date
accessed: January, 2011 on
http://select.nytimes.com/gst/abstract.html?res=F20D1FF7385C0C768DDDA00
894D8404482
Connors, Martin, Diane Dupuis and Brad Morgan. The Olympic Factbook. Detroit.
Visible Ink Press. 1992.
Grimes, Ray A., William J. Kelly and Paul H. Rubin. “A Socioeconomic Model
of National Olympic Performance.” Social Science Quarterly 55 (1974): 777–
782
Grubb, H.J. Models for Comparing Athletic Performances (Working paper).
Department of Applied Statistics. The University of Reading (1997)

67
Haake, S.J. “The Impact of Technology on Sporting Performance in Olympic Sports.”
Journal of Sports Sciences 27, no. 13 (2009): 1421-1431
Hill, Michael. “Swimmers „See‟ the Water with Help of Professor.” (2008): Date
accessed: October, 2010 on http://swimming.teamusa.org/news/2008
“Introduction to SAS.” UCLA: Academic Technology Services, Statistical Consulting
Group. Date Accessed: February, 2011 on
http://www.ats.ucla.edu/stat/sas/notes2/
Johnson, Daniel K. N. and Ayfer Ali. “A Tale of Two Seasons: Participation and Medal
Counts at the Summer and Winter Olympic Games.” Social Science Quarterly
85, no. 4 (2004): 974-993
Johnson, Daniel K. N and Ayer Ali, Coming to Play or Coming to Win: Participation
and Success at the Olympic Games (Wellesley College Working Paper) (2000):
2000-10
Johnson, Daniel. “Vancouver 2010 Medal Predictions.” (2009). Date Accessed:
October, 2010. http://theolympianblog.com/2010/02/vancouver-2010-medal-
predictions-daniel-johnson.html
Kolata, Gina and Jere Longman “As Swimming Records Fall, Technology
Muddies the Water.” The New York Times. (2008): A1.
http://www.nytimes.com/2008/08/12/sports/olympics/12records.html
Kortum, Samuel. “Research, Patenting, and Technological Change.”
Econometrica 75 (1997): 1389-1419
Kuper, Gerard H. and Elmer Sterken. The Olympic Winter Games: Participation and
Performance (Working paper). Department of Economics. University of
Groningen. (2001)
Kuper, Gerard H. and Elmer Sterken. “Endurance in Speed Skating: The Development
of World Records.” European Journal of Operational Research 148, no. 2
(2004): 293-301
Kuper, Gerard H. and Elmer Sterken. Modeling The Development of World Records in
Running (Working Paper). Department of Economics. University of Groningen.
(2006)
Levine, Ned. “Why Do Countries Win Olympic Medals? Some Structural Correlates
of Olympic Games Success: 1972.” Sociology and Social Research 58 (1974):
353-360.
68
Loland, S. “Technology in Sport: Three Ideal-Typical Views and Their
Implications.” European Journal of Sport Science 2, no. 1 (2001)
Loving, Sharon. Swimming Technology Research. Marketing Director. Tallahassee, FL.
(2010): Date accessed: October, 2010 on www.swimmingtechnology.com
Magdalinski, Tara. Sport, Technology and the Body: The Nature of Performance.
London, New York. Routledge. 2009.
Maennig, W. “On the Economics of Doping and Corruption in International Sports.”
Journal of Sports Economics 3, no. 1 (2002): 61-89
Magnusson, Christer. “Records.” (2010): Date accessed: October, 2010 on
http://www.scmsom.se/records/statistics/World%20Record%20Progression.htm
Majendie, Matt. “For Oscar „Blade Runner‟ Pistorius, Fast is a State of Being.” (2011).
The National. Date Accessed: March, 2011 on
http://www.thenational.ae/lifestyle/motoring/for-oscar-blade-runner-pistorius-
fast-is-a-state-of-being
Moosa, I. A. and L. Smith. “Economic Development Indicators as Determinants
of Medal Winning at the Sydney Olympics: An Extreme Bound
Analysis.” Australian Economic Papers 43, no. 3 (2004): 288–301.
Munasinghe, Lalith, Brendan O‟Flaherty and Stephan Danninger. “Globalization and
the Rate of Technological Progress: What Track and Field Records Show.”
Journal of Political Economy 109, no. 5 (2001): 1132-1149
“Name That Tune.” The Tuscaloosa News. (1976): Date Accessed: February, 2011 on
http://news.google.com/newspapers?id=rUYgAAAAIBAJ&sjid=650EAAAAIB
AJ&pg=6816,74269&dq=history+of+germany+competitive+swimming&hl=en
O‟Neil, Charles B. and Peter G. Akintunde. Optimizing Athletes’ Performance
Excellence and Wellness through Nutrition and Exercise. (Working Paper).
University of Calabar (2010)
Pfau, Wade D. “Predicting the Medal Wins By Country at the 2006 Winter Olympic
Games: An Econometrics Approach.” The Korean Economic Review
22, no. 2 (2006): 233-247
Pyne, David B., Cassie B. Trewin and William G. Hopkins. “Progression and
Variability of Competitive Performance of Olympic Swimmers.” Journal of
Sports Science 22, no.7 (2004): 613-620
Rathke, Alexander and Ulrich Woiteck. Economics and Olympics: An Efficiency
Analysis (Working Paper No. 313.) University of Zurich (2007)
69
Roan, Shari. “Have Olympic Athletes Done all They Can?” The Los Angeles Times
col. 1 (2010): Date Accessed: September, 2010 on www.latimes.com
“Roma 2009.” (2009): Date accessed: February, 2011 on fina.org
Saslow, Eli. “New Suit Makes Splash in Debut.” Washington Post Staff Writer. The
Washington Post. (2007): Date Accessed: October, 2010 on
www.washingtonpost.com
Schauer, Margaret. “How Much is Too Much? Evaluating the Impact of Swimming
Innovations” USMS Swimmer (2006): Date Accessed: October, 2010 on
http://www.usmsswimmer.com/200611/innovations.pdf
Shane, Mathew. Historical Population and Growth Rates in Population for Baseline
Countries/Regions. Economic Research Service. (2010): Date Accessed:
October, 2010 on http://www.ers.usda.gov/Data/Macroeconomics/
Shane, Mathew. Real Historical Gross Domestic Product (GDP) and Growth Rates of
GDP. Economic Research Service. (2010): Date Accessed: October, 2010 on
http://www.ers.usda.gov/Data/Macroeconomics/
“Speedo USA.” Speedo History. (2010): Date accessed: October, 2010 on
http://explore.speedousa.com
“Swimming Australia Annual Report.” Finance Report. (2008): Date accessed:
February, 2011 on at http://swimming.org.au/
Tiozzo, E., G. Leko and L. Ruzic. “Swimming Bodysuit in All-Out and Constant-Pace
Trials.” Biology of Sport 26, no. 2 (2009): 149-156
Tucker, Ross “Swimmers Credibility Crisis: How FINAS‟s Blind Eye is Affecting the
Purity of the Sport.” The Science of Sport (2008): Date Accessed: October, 2010
on http://www.sportsscientists.com/2008/11/swimsuit-controversy.html
“TYR Sport Inc.” (2010): Date accessed: October, 2010 on www.tyr.com
“United States Swimming, Inc.” Financial Statements and Supplemental Schedules.
(2008): Date accessed: February 2011 on www.usaswimming.org
“USA Swimming.” In Depth Event History. (2010): Date accessed: October, 2010 on
http://www.usaswimming.org/DesktopDefault.aspx?TabId=1476&Alias=Rainbo
w&Lang=en
Quarrell, Anne. “Adidas presents new bodysuit: the JETCONCEPT.” Adidas
America. (2003): Date accessed: October, 2010 on
http://www.eurekalert.org/pub_releases/2003-07/aa-apn071803.php

70
“World Latitude and Longitude. MapXL.” (2000): Date accessed: October, 2010 on
http://www.mapsofworld.com/lat_long/
Related Documents